West Lawn, PA Map & Demographics
West Lawn Map
West Lawn Overview
$31,778
PER CAPITA INCOME
$94,348
AVG FAMILY INCOME
$65,750
AVG HOUSEHOLD INCOME
1.1%
WAGE / INCOME GAP [ % ]
98.9¢/ $1
WAGE / INCOME GAP [ $ ]
0.32
INEQUALITY / GINI INDEX
1,481
TOTAL POPULATION
789
MALE POPULATION
692
FEMALE POPULATION
114.02
MALES / 100 FEMALES
87.71
FEMALES / 100 MALES
34.9
MEDIAN AGE
3.1
AVG FAMILY SIZE
2.6
AVG HOUSEHOLD SIZE
869
LABOR FORCE [ PEOPLE ]
72.5%
PERCENT IN LABOR FORCE
7.9%
UNEMPLOYMENT RATE
West Lawn Area Codes
Income in West Lawn
Income Overview in West Lawn
Per Capita Income in West Lawn is $31,778, while median incomes of families and households are $94,348 and $65,750 respectively.
| Characteristic | Number | Measure |
| Per Capita Income | 1,481 | $31,778 |
| Median Family Income | 328 | $94,348 |
| Mean Family Income | 328 | $91,195 |
| Median Household Income | 573 | $65,750 |
| Mean Household Income | 573 | $77,001 |
| Income Deficit | 328 | $0 |
| Wage / Income Gap (%) | 1,481 | 1.08% |
| Wage / Income Gap ($) | 1,481 | 98.92¢ per $1 |
| Gini / Inequality Index | 1,481 | 0.32 |
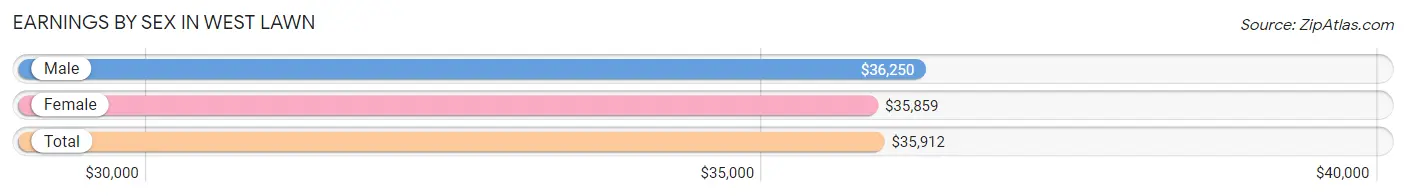
Earnings by Sex in West Lawn
Average Earnings in West Lawn are $35,912, $36,250 for men and $35,859 for women, a difference of 1.1%.
| Sex | Number | Average Earnings |
| Male | 512 (52.0%) | $36,250 |
| Female | 472 (48.0%) | $35,859 |
| Total | 984 (100.0%) | $35,912 |
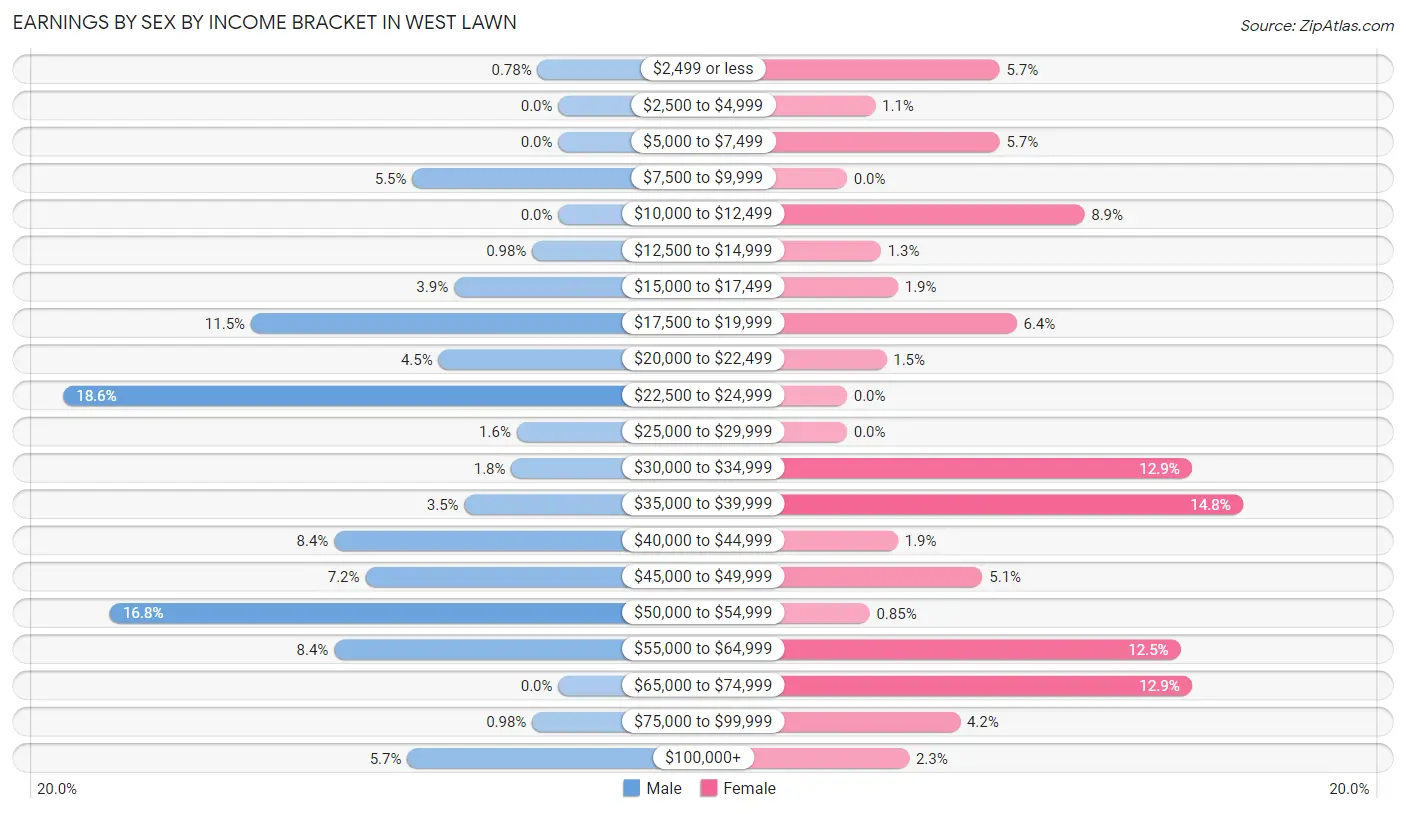
Earnings by Sex by Income Bracket in West Lawn
The most common earnings brackets in West Lawn are $22,500 to $24,999 for men (95 | 18.5%) and $35,000 to $39,999 for women (70 | 14.8%).
| Income | Male | Female |
| $2,499 or less | 4 (0.8%) | 27 (5.7%) |
| $2,500 to $4,999 | 0 (0.0%) | 5 (1.1%) |
| $5,000 to $7,499 | 0 (0.0%) | 27 (5.7%) |
| $7,500 to $9,999 | 28 (5.5%) | 0 (0.0%) |
| $10,000 to $12,499 | 0 (0.0%) | 42 (8.9%) |
| $12,500 to $14,999 | 5 (1.0%) | 6 (1.3%) |
| $15,000 to $17,499 | 20 (3.9%) | 9 (1.9%) |
| $17,500 to $19,999 | 59 (11.5%) | 30 (6.4%) |
| $20,000 to $22,499 | 23 (4.5%) | 7 (1.5%) |
| $22,500 to $24,999 | 95 (18.5%) | 0 (0.0%) |
| $25,000 to $29,999 | 8 (1.6%) | 0 (0.0%) |
| $30,000 to $34,999 | 9 (1.8%) | 61 (12.9%) |
| $35,000 to $39,999 | 18 (3.5%) | 70 (14.8%) |
| $40,000 to $44,999 | 43 (8.4%) | 9 (1.9%) |
| $45,000 to $49,999 | 37 (7.2%) | 24 (5.1%) |
| $50,000 to $54,999 | 86 (16.8%) | 4 (0.9%) |
| $55,000 to $64,999 | 43 (8.4%) | 59 (12.5%) |
| $65,000 to $74,999 | 0 (0.0%) | 61 (12.9%) |
| $75,000 to $99,999 | 5 (1.0%) | 20 (4.2%) |
| $100,000+ | 29 (5.7%) | 11 (2.3%) |
| Total | 512 (100.0%) | 472 (100.0%) |
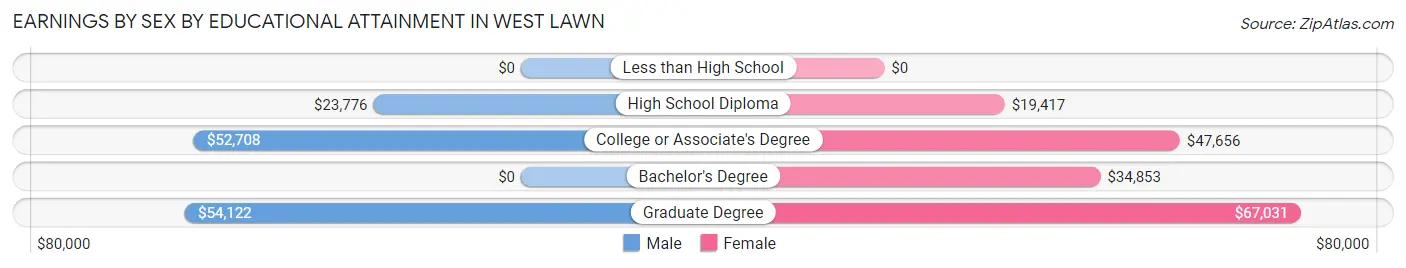
Earnings by Sex by Educational Attainment in West Lawn
Average earnings in West Lawn are $43,256 for men and $36,484 for women, a difference of 15.7%. Men with an educational attainment of graduate degree enjoy the highest average annual earnings of $54,122, while those with high school diploma education earn the least with $23,776. Women with an educational attainment of graduate degree earn the most with the average annual earnings of $67,031, while those with high school diploma education have the smallest earnings of $19,417.
| Educational Attainment | Male Income | Female Income |
| Less than High School | - | - |
| High School Diploma | $23,776 | $19,417 |
| College or Associate's Degree | $52,708 | $47,656 |
| Bachelor's Degree | - | - |
| Graduate Degree | $54,122 | $67,031 |
| Total | $43,256 | $36,484 |
Family Income in West Lawn
Family Income Brackets in West Lawn
According to the West Lawn family income data, there are 114 families falling into the $100,000 to $149,999 income range, which is the most common income bracket and makes up 34.8% of all families.
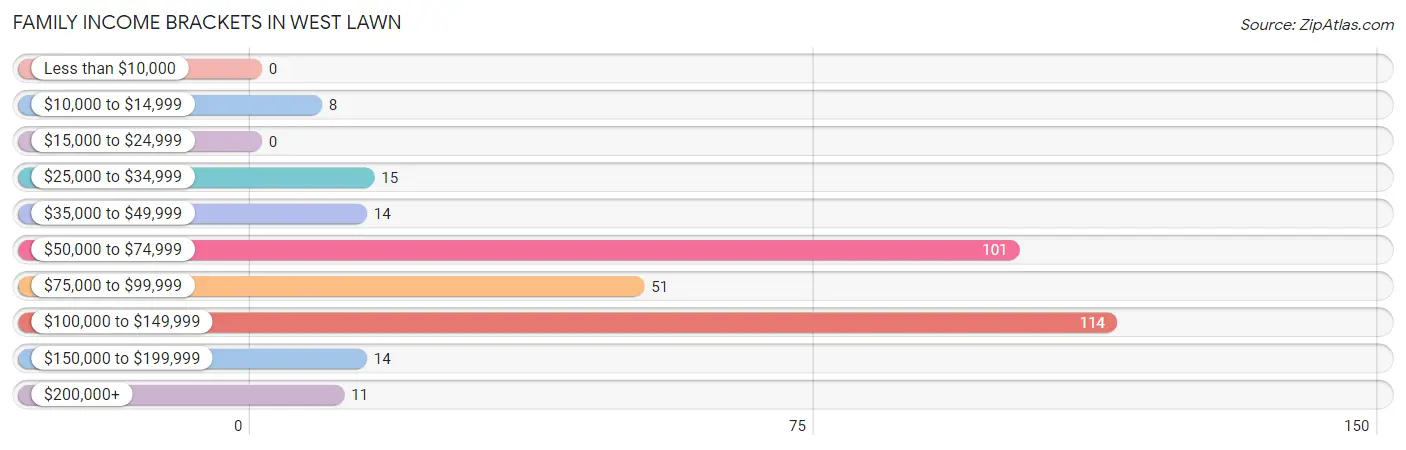
| Income Bracket | # Families | % Families |
| Less than $10,000 | 0 | 0.0% |
| $10,000 to $14,999 | 8 | 2.4% |
| $15,000 to $24,999 | 0 | 0.0% |
| $25,000 to $34,999 | 15 | 4.6% |
| $35,000 to $49,999 | 14 | 4.3% |
| $50,000 to $74,999 | 101 | 30.8% |
| $75,000 to $99,999 | 51 | 15.5% |
| $100,000 to $149,999 | 114 | 34.8% |
| $150,000 to $199,999 | 14 | 4.3% |
| $200,000+ | 11 | 3.4% |
Family Income by Famaliy Size in West Lawn
2-person families (187 | 57.0%) account for the highest median family income in West Lawn with $94,076 per family, while 2-person families (187 | 57.0%) have the highest median income of $47,038 per family member.
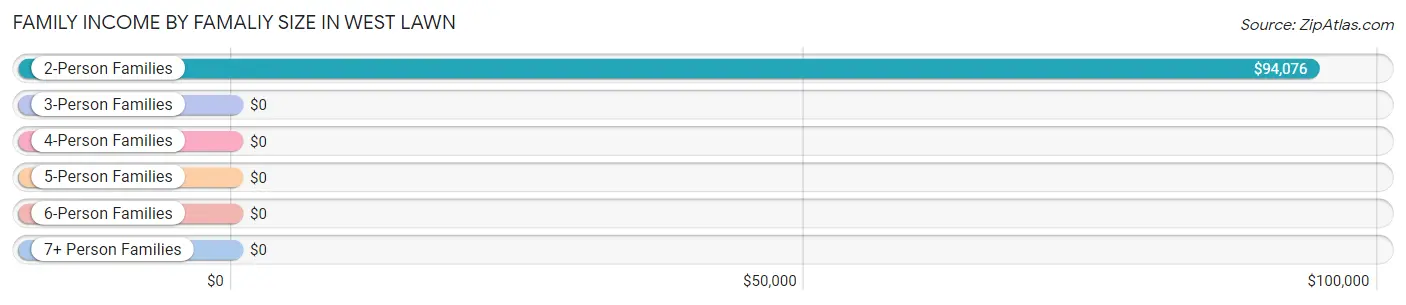
| Income Bracket | # Families | Median Income |
| 2-Person Families | 187 (57.0%) | $94,076 |
| 3-Person Families | 62 (18.9%) | $0 |
| 4-Person Families | 6 (1.8%) | $0 |
| 5-Person Families | 41 (12.5%) | $0 |
| 6-Person Families | 28 (8.5%) | $0 |
| 7+ Person Families | 4 (1.2%) | $0 |
| Total | 328 (100.0%) | $94,348 |
Family Income by Number of Earners in West Lawn
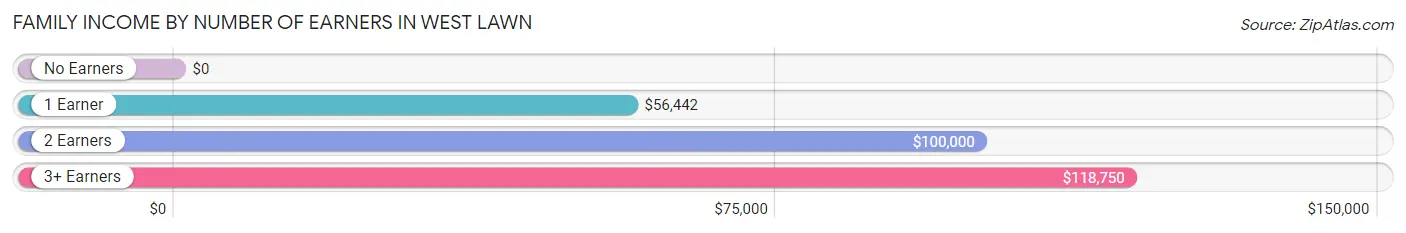
| Number of Earners | # Families | Median Income |
| No Earners | 33 (10.1%) | $0 |
| 1 Earner | 69 (21.0%) | $56,442 |
| 2 Earners | 180 (54.9%) | $100,000 |
| 3+ Earners | 46 (14.0%) | $118,750 |
| Total | 328 (100.0%) | $94,348 |
Household Income in West Lawn
Household Income Brackets in West Lawn
With 142 households falling in the category, the $100,000 to $149,999 income range is the most frequent in West Lawn, accounting for 24.8% of all households. In contrast, only 8 households (1.4%) fall into the $15,000 to $24,999 income bracket, making it the least populous group.
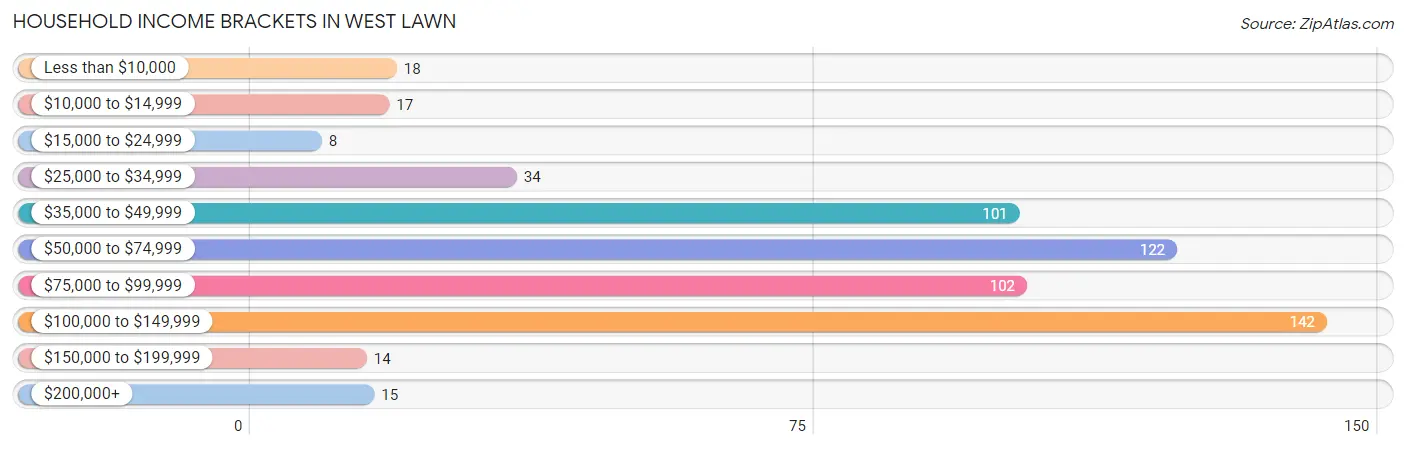
| Income Bracket | # Households | % Households |
| Less than $10,000 | 18 | 3.1% |
| $10,000 to $14,999 | 17 | 3.0% |
| $15,000 to $24,999 | 8 | 1.4% |
| $25,000 to $34,999 | 34 | 5.9% |
| $35,000 to $49,999 | 101 | 17.6% |
| $50,000 to $74,999 | 122 | 21.3% |
| $75,000 to $99,999 | 102 | 17.8% |
| $100,000 to $149,999 | 142 | 24.8% |
| $150,000 to $199,999 | 14 | 2.4% |
| $200,000+ | 15 | 2.6% |
Household Income by Householder Age in West Lawn
The median household income in West Lawn is $65,750, with the highest median household income of $94,551 found in the 25 to 44 years age bracket for the primary householder. A total of 216 households (37.7%) fall into this category. Meanwhile, the 15 to 24 years age bracket for the primary householder has the lowest median household income of $0, with 17 households (3.0%) in this group.
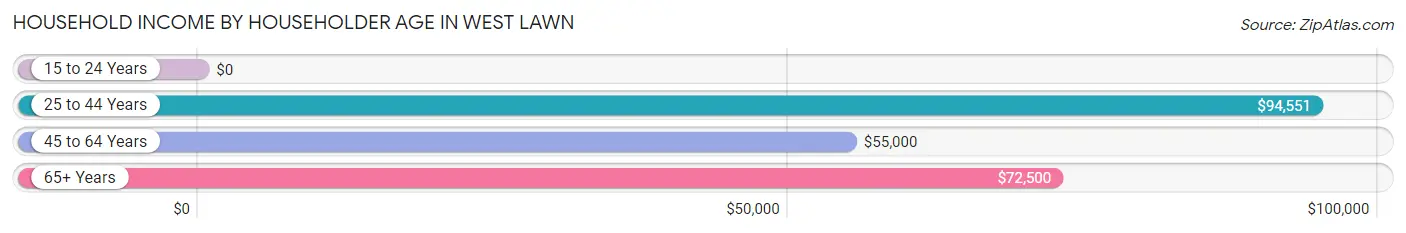
| Income Bracket | # Households | Median Income |
| 15 to 24 Years | 17 (3.0%) | $0 |
| 25 to 44 Years | 216 (37.7%) | $94,551 |
| 45 to 64 Years | 234 (40.8%) | $55,000 |
| 65+ Years | 106 (18.5%) | $72,500 |
| Total | 573 (100.0%) | $65,750 |
Poverty in West Lawn
Income Below Poverty by Sex and Age in West Lawn
With 5.3% poverty level for males and 7.1% for females among the residents of West Lawn, 75 year old and over males and 16 and 17 year old females are the most vulnerable to poverty, with 17 males (37.8%) and 22 females (68.8%) in their respective age groups living below the poverty level.
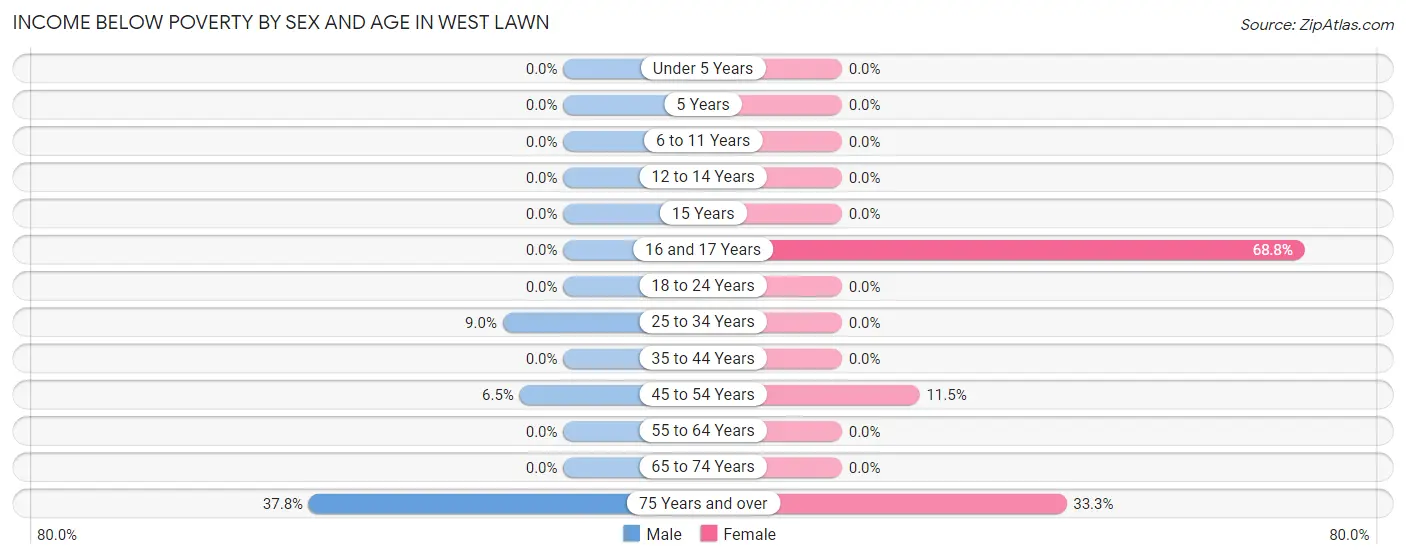
| Age Bracket | Male | Female |
| Under 5 Years | 0 (0.0%) | 0 (0.0%) |
| 5 Years | 0 (0.0%) | 0 (0.0%) |
| 6 to 11 Years | 0 (0.0%) | 0 (0.0%) |
| 12 to 14 Years | 0 (0.0%) | 0 (0.0%) |
| 15 Years | 0 (0.0%) | 0 (0.0%) |
| 16 and 17 Years | 0 (0.0%) | 22 (68.8%) |
| 18 to 24 Years | 0 (0.0%) | 0 (0.0%) |
| 25 to 34 Years | 18 (9.0%) | 0 (0.0%) |
| 35 to 44 Years | 0 (0.0%) | 0 (0.0%) |
| 45 to 54 Years | 7 (6.5%) | 18 (11.5%) |
| 55 to 64 Years | 0 (0.0%) | 0 (0.0%) |
| 65 to 74 Years | 0 (0.0%) | 0 (0.0%) |
| 75 Years and over | 17 (37.8%) | 9 (33.3%) |
| Total | 42 (5.3%) | 49 (7.1%) |
Income Above Poverty by Sex and Age in West Lawn
According to the poverty statistics in West Lawn, males aged under 5 years and females aged under 5 years are the age groups that are most secure financially, with 100.0% of males and 100.0% of females in these age groups living above the poverty line.
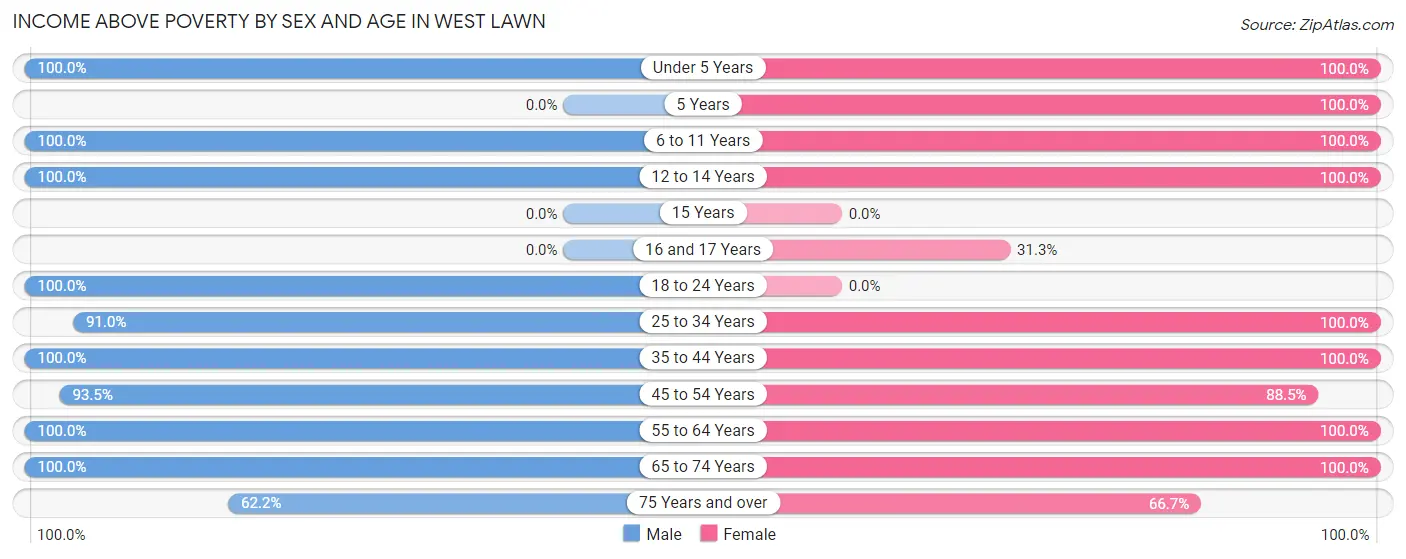
| Age Bracket | Male | Female |
| Under 5 Years | 57 (100.0%) | 17 (100.0%) |
| 5 Years | 0 (0.0%) | 5 (100.0%) |
| 6 to 11 Years | 58 (100.0%) | 81 (100.0%) |
| 12 to 14 Years | 12 (100.0%) | 53 (100.0%) |
| 15 Years | 0 (0.0%) | 0 (0.0%) |
| 16 and 17 Years | 0 (0.0%) | 10 (31.2%) |
| 18 to 24 Years | 86 (100.0%) | 0 (0.0%) |
| 25 to 34 Years | 182 (91.0%) | 153 (100.0%) |
| 35 to 44 Years | 90 (100.0%) | 59 (100.0%) |
| 45 to 54 Years | 101 (93.5%) | 138 (88.5%) |
| 55 to 64 Years | 97 (100.0%) | 68 (100.0%) |
| 65 to 74 Years | 36 (100.0%) | 41 (100.0%) |
| 75 Years and over | 28 (62.2%) | 18 (66.7%) |
| Total | 747 (94.7%) | 643 (92.9%) |
Income Below Poverty Among Married-Couple Families in West Lawn
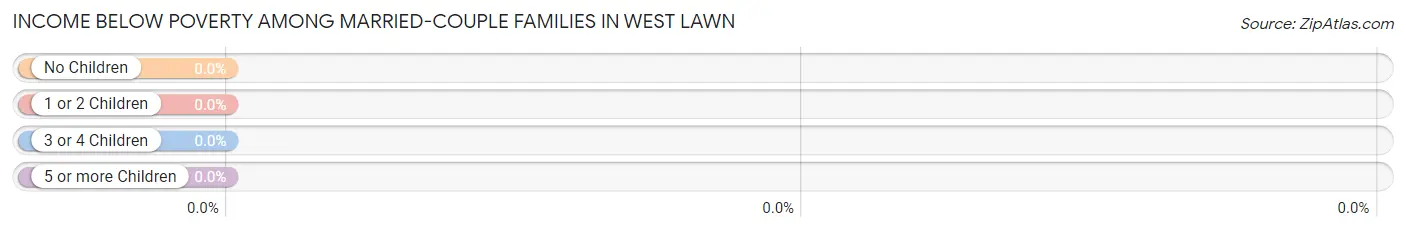
| Children | Above Poverty | Below Poverty |
| No Children | 128 (100.0%) | 0 (0.0%) |
| 1 or 2 Children | 80 (100.0%) | 0 (0.0%) |
| 3 or 4 Children | 23 (100.0%) | 0 (0.0%) |
| 5 or more Children | 0 (0.0%) | 0 (0.0%) |
| Total | 231 (100.0%) | 0 (0.0%) |
Income Below Poverty Among Single-Parent Households in West Lawn
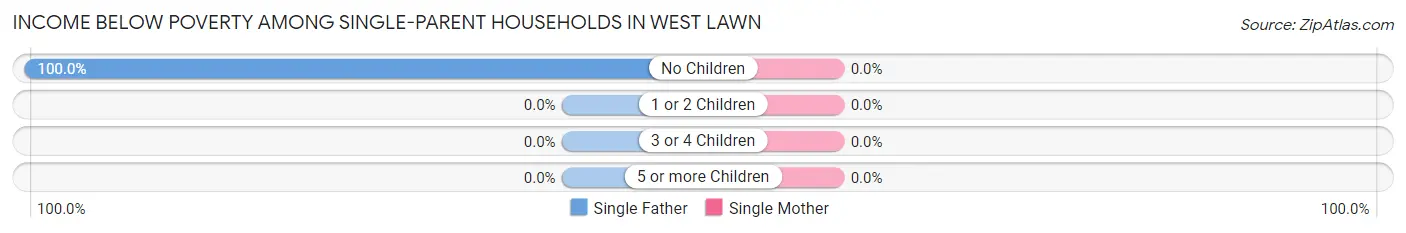
| Children | Single Father | Single Mother |
| No Children | 8 (100.0%) | 0 (0.0%) |
| 1 or 2 Children | 0 (0.0%) | 0 (0.0%) |
| 3 or 4 Children | 0 (0.0%) | 0 (0.0%) |
| 5 or more Children | 0 (0.0%) | 0 (0.0%) |
| Total | 8 (100.0%) | 0 (0.0%) |
Income Below Poverty Among Married-Couple vs Single-Parent Households in West Lawn
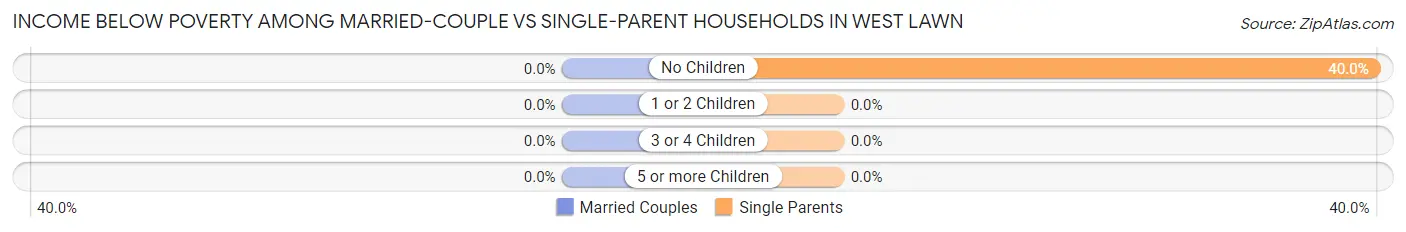
| Children | Married-Couple Families | Single-Parent Households |
| No Children | 0 (0.0%) | 8 (40.0%) |
| 1 or 2 Children | 0 (0.0%) | 0 (0.0%) |
| 3 or 4 Children | 0 (0.0%) | 0 (0.0%) |
| 5 or more Children | 0 (0.0%) | 0 (0.0%) |
| Total | 0 (0.0%) | 8 (8.3%) |
Race in West Lawn
The most populous races in West Lawn are White / Caucasian (785 | 53.0%), Two or more Races (317 | 21.4%), and Hispanic or Latino (305 | 20.6%).
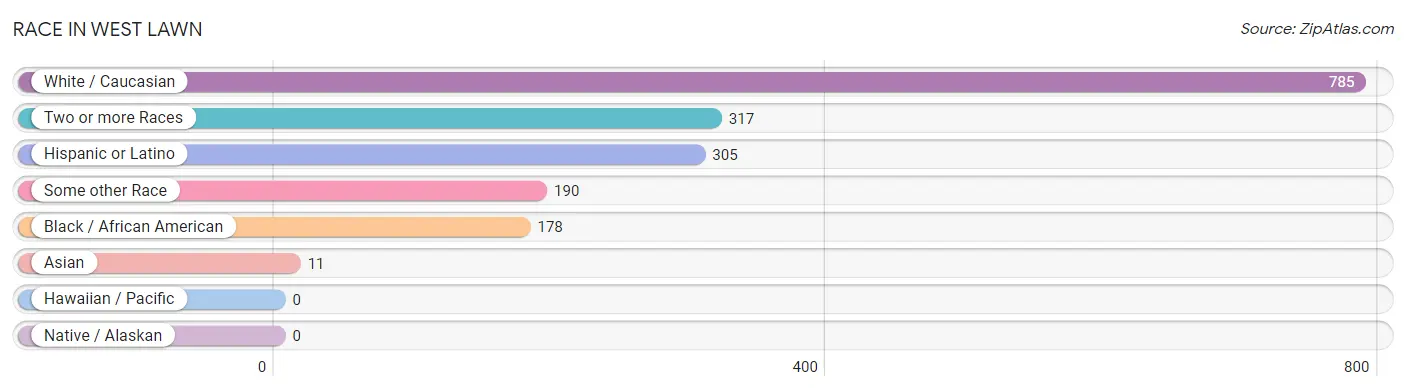
| Race | # Population | % Population |
| Asian | 11 | 0.7% |
| Black / African American | 178 | 12.0% |
| Hawaiian / Pacific | 0 | 0.0% |
| Hispanic or Latino | 305 | 20.6% |
| Native / Alaskan | 0 | 0.0% |
| White / Caucasian | 785 | 53.0% |
| Two or more Races | 317 | 21.4% |
| Some other Race | 190 | 12.8% |
| Total | 1,481 | 100.0% |
Ancestry in West Lawn
The most populous ancestries reported in West Lawn are German (358 | 24.2%), Puerto Rican (163 | 11.0%), Mexican (142 | 9.6%), Italian (136 | 9.2%), and African (124 | 8.4%), together accounting for 62.3% of all West Lawn residents.
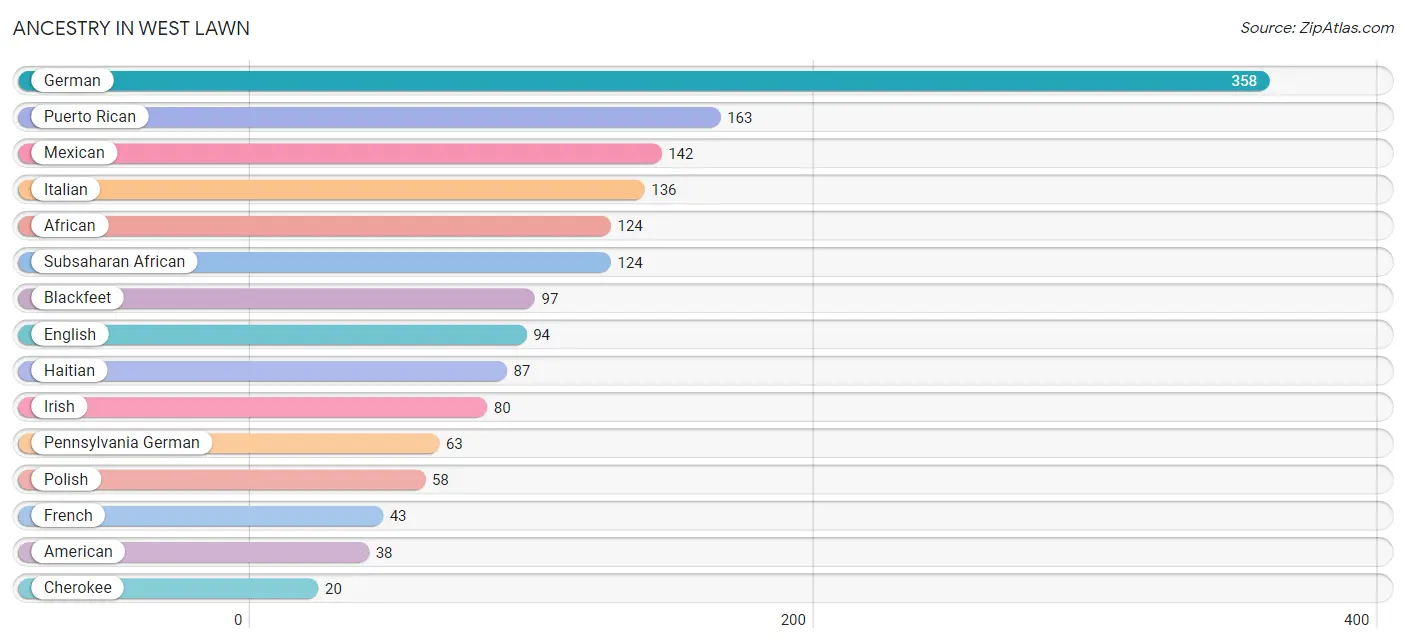
| Ancestry | # Population | % Population |
| African | 124 | 8.4% |
| American | 38 | 2.6% |
| Blackfeet | 97 | 6.6% |
| Cherokee | 20 | 1.3% |
| Dutch | 20 | 1.3% |
| English | 94 | 6.4% |
| French | 43 | 2.9% |
| German | 358 | 24.2% |
| Haitian | 87 | 5.9% |
| Indian (Asian) | 11 | 0.7% |
| Irish | 80 | 5.4% |
| Italian | 136 | 9.2% |
| Mexican | 142 | 9.6% |
| Pennsylvania German | 63 | 4.3% |
| Polish | 58 | 3.9% |
| Puerto Rican | 163 | 11.0% |
| Scottish | 19 | 1.3% |
| Subsaharan African | 124 | 8.4% |
| Swiss | 9 | 0.6% |
| Yugoslavian | 8 | 0.5% | View All 20 Rows |
Immigrants in West Lawn
The most numerous immigrant groups reported in West Lawn came from Africa (73 | 4.9%), Sierra Leone (73 | 4.9%), Western Africa (73 | 4.9%), Central America (20 | 1.3%), and Latin America (20 | 1.3%), together accounting for 17.5% of all West Lawn residents.
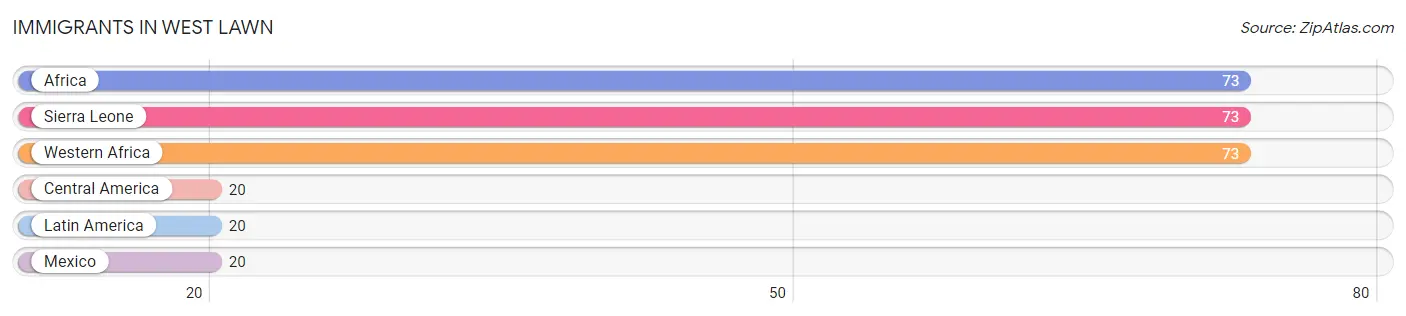
| Immigration Origin | # Population | % Population |
| Africa | 73 | 4.9% |
| Central America | 20 | 1.3% |
| Latin America | 20 | 1.3% |
| Mexico | 20 | 1.3% |
| Sierra Leone | 73 | 4.9% |
| Western Africa | 73 | 4.9% | View All 6 Rows |
Sex and Age in West Lawn
Sex and Age in West Lawn
The most populous age groups in West Lawn are 25 to 29 Years (122 | 15.5%) for men and 30 to 34 Years (149 | 21.5%) for women.
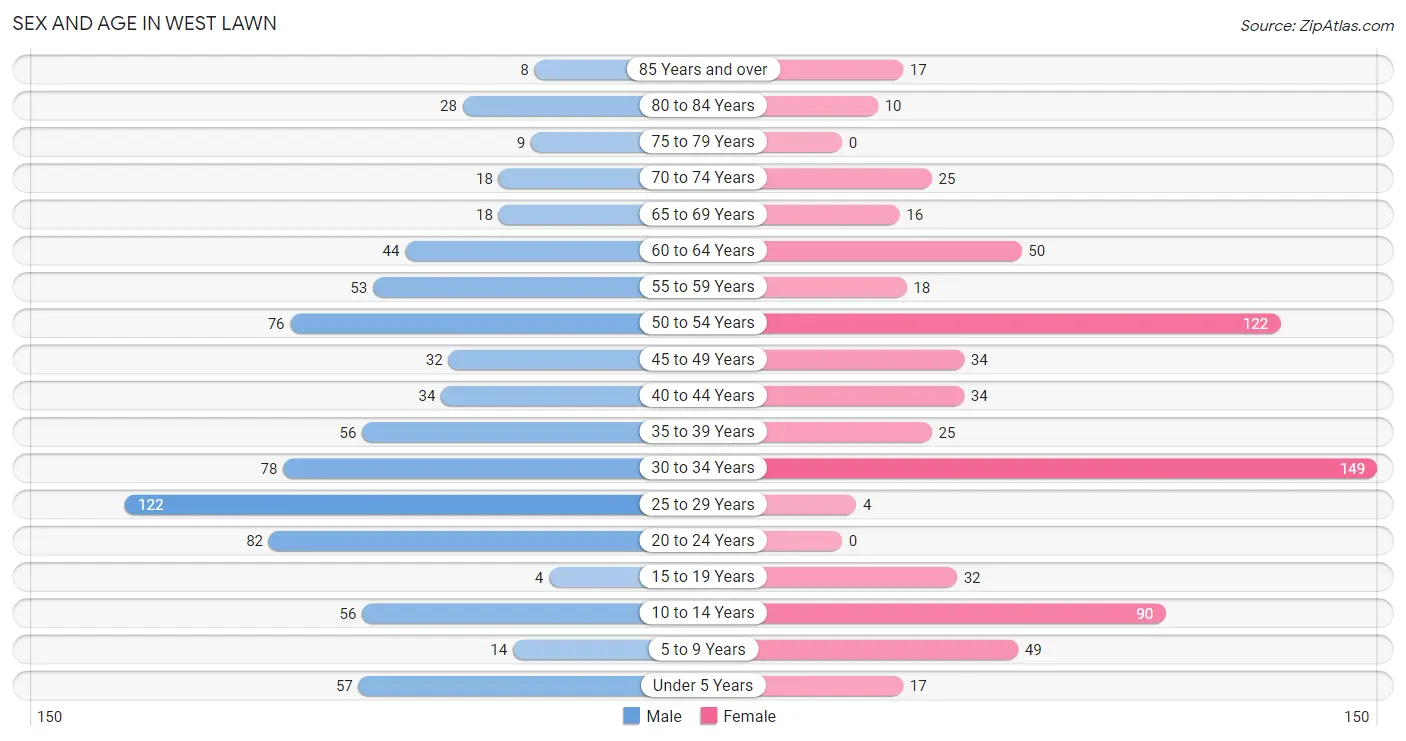
| Age Bracket | Male | Female |
| Under 5 Years | 57 (7.2%) | 17 (2.5%) |
| 5 to 9 Years | 14 (1.8%) | 49 (7.1%) |
| 10 to 14 Years | 56 (7.1%) | 90 (13.0%) |
| 15 to 19 Years | 4 (0.5%) | 32 (4.6%) |
| 20 to 24 Years | 82 (10.4%) | 0 (0.0%) |
| 25 to 29 Years | 122 (15.5%) | 4 (0.6%) |
| 30 to 34 Years | 78 (9.9%) | 149 (21.5%) |
| 35 to 39 Years | 56 (7.1%) | 25 (3.6%) |
| 40 to 44 Years | 34 (4.3%) | 34 (4.9%) |
| 45 to 49 Years | 32 (4.1%) | 34 (4.9%) |
| 50 to 54 Years | 76 (9.6%) | 122 (17.6%) |
| 55 to 59 Years | 53 (6.7%) | 18 (2.6%) |
| 60 to 64 Years | 44 (5.6%) | 50 (7.2%) |
| 65 to 69 Years | 18 (2.3%) | 16 (2.3%) |
| 70 to 74 Years | 18 (2.3%) | 25 (3.6%) |
| 75 to 79 Years | 9 (1.1%) | 0 (0.0%) |
| 80 to 84 Years | 28 (3.5%) | 10 (1.5%) |
| 85 Years and over | 8 (1.0%) | 17 (2.5%) |
| Total | 789 (100.0%) | 692 (100.0%) |
Families and Households in West Lawn
Median Family Size in West Lawn
The median family size in West Lawn is 3.10 persons per family, with married-couple families (231 | 70.4%) accounting for the largest median family size of 3.15 persons per family. On the other hand, single male/father families (8 | 2.4%) represent the smallest median family size with 2.13 persons per family.
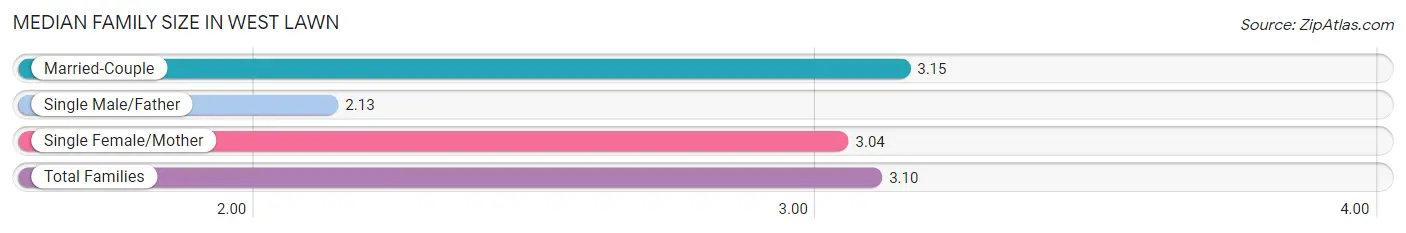
| Family Type | # Families | Family Size |
| Married-Couple | 231 (70.4%) | 3.15 |
| Single Male/Father | 8 (2.4%) | 2.13 |
| Single Female/Mother | 89 (27.1%) | 3.04 |
| Total Families | 328 (100.0%) | 3.10 |
Median Household Size in West Lawn
The median household size in West Lawn is 2.58 persons per household, with single female/mother households (89 | 15.5%) accounting for the largest median household size of 3.83 persons per household. non-family households (245 | 42.8%) represent the smallest median household size with 1.57 persons per household.
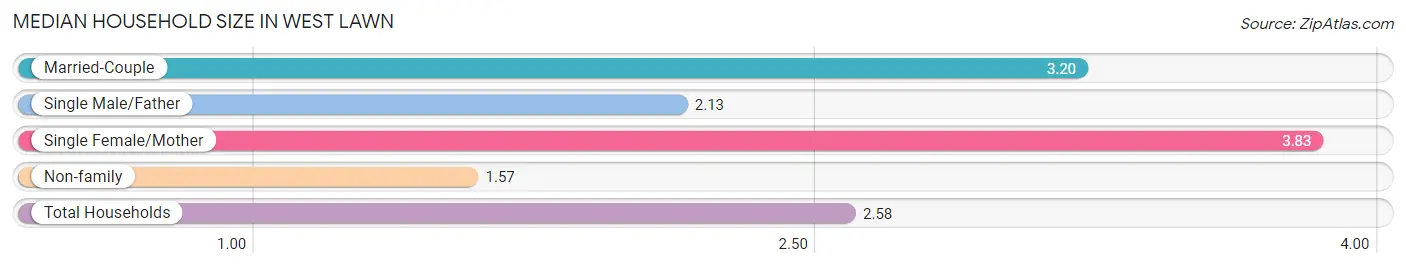
| Household Type | # Households | Household Size |
| Married-Couple | 231 (40.3%) | 3.20 |
| Single Male/Father | 8 (1.4%) | 2.13 |
| Single Female/Mother | 89 (15.5%) | 3.83 |
| Non-family | 245 (42.8%) | 1.57 |
| Total Households | 573 (100.0%) | 2.58 |
Household Size by Marriage Status in West Lawn
Out of a total of 573 households in West Lawn, 328 (57.2%) are family households, while 245 (42.8%) are nonfamily households. The most numerous type of family households are 2-person households, comprising 140, and the most common type of nonfamily households are 1-person households, comprising 189.
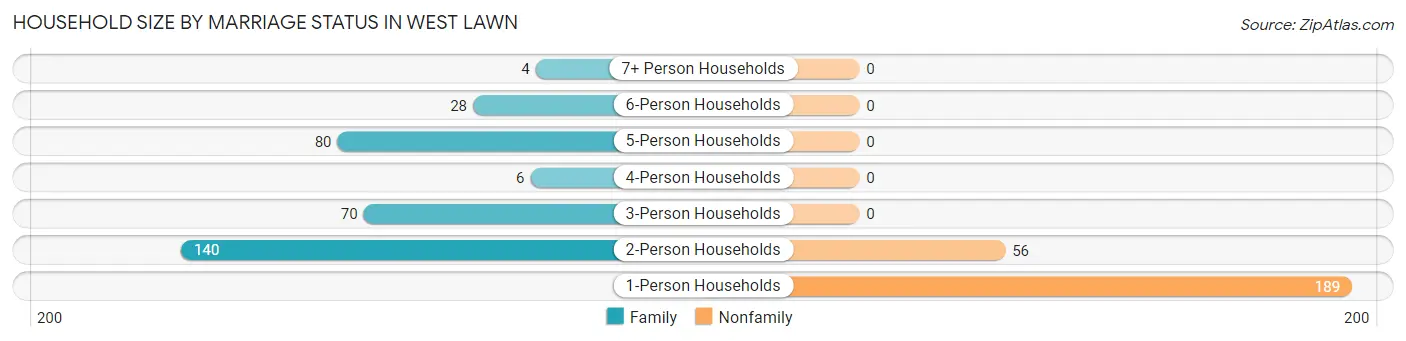
| Household Size | Family Households | Nonfamily Households |
| 1-Person Households | - | 189 (33.0%) |
| 2-Person Households | 140 (24.4%) | 56 (9.8%) |
| 3-Person Households | 70 (12.2%) | 0 (0.0%) |
| 4-Person Households | 6 (1.1%) | 0 (0.0%) |
| 5-Person Households | 80 (14.0%) | 0 (0.0%) |
| 6-Person Households | 28 (4.9%) | 0 (0.0%) |
| 7+ Person Households | 4 (0.7%) | 0 (0.0%) |
| Total | 328 (57.2%) | 245 (42.8%) |
Female Fertility in West Lawn
Fertility by Age in West Lawn
Average fertility rate in West Lawn is 131.0 births per 1,000 women. Women in the age bracket of 20 to 34 years have the highest fertility rate with 288.0 births per 1,000 women. Women in the age bracket of 20 to 34 years acount for 100.0% of all women with births.
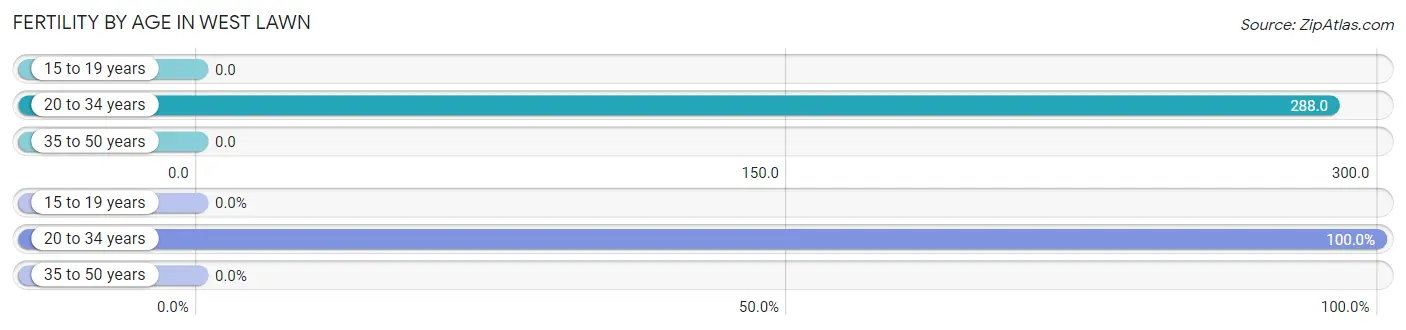
| Age Bracket | Women with Births | Births / 1,000 Women |
| 15 to 19 years | 0 (0.0%) | 0.0 |
| 20 to 34 years | 44 (100.0%) | 288.0 |
| 35 to 50 years | 0 (0.0%) | 0.0 |
| Total | 44 (100.0%) | 131.0 |
Fertility by Age by Marriage Status in West Lawn
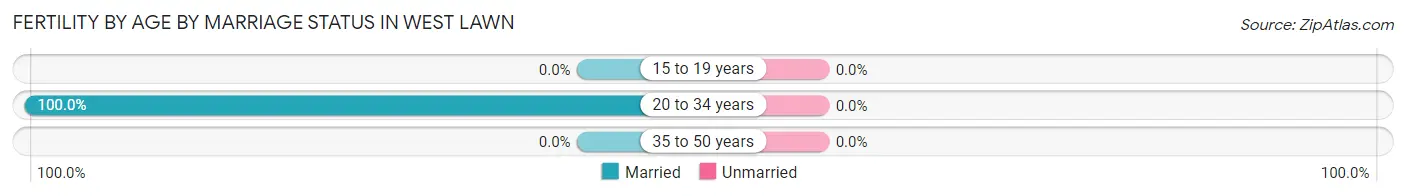
| Age Bracket | Married | Unmarried |
| 15 to 19 years | 0 (0.0%) | 0 (0.0%) |
| 20 to 34 years | 44 (100.0%) | 0 (0.0%) |
| 35 to 50 years | 0 (0.0%) | 0 (0.0%) |
| Total | 44 (100.0%) | 0 (0.0%) |
Fertility by Education in West Lawn
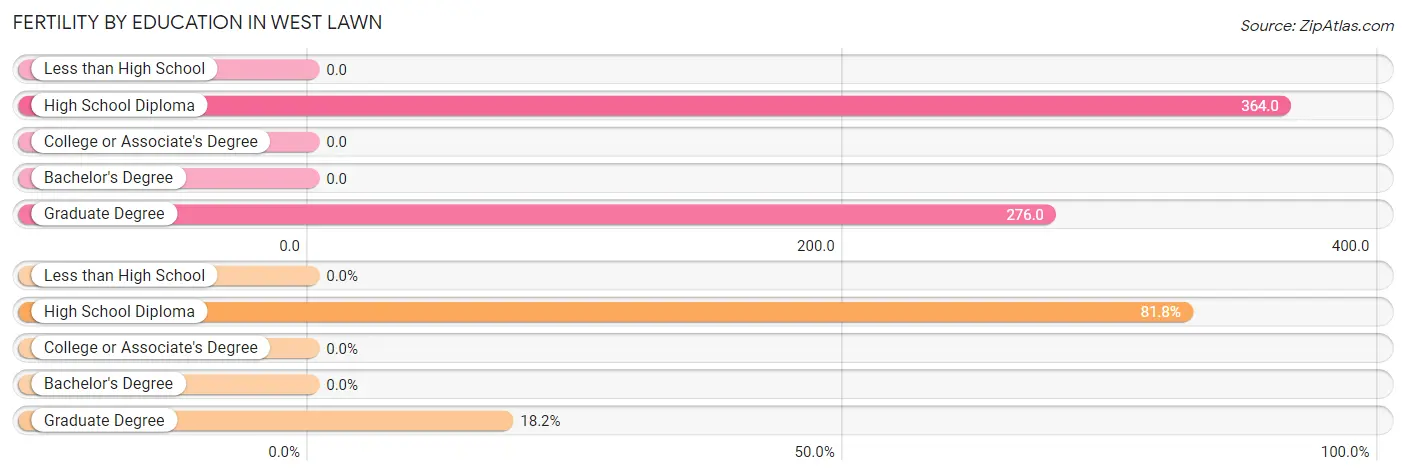
| Educational Attainment | Women with Births | Births / 1,000 Women |
| Less than High School | 0 (0.0%) | 0.0 |
| High School Diploma | 36 (81.8%) | 364.0 |
| College or Associate's Degree | 0 (0.0%) | 0.0 |
| Bachelor's Degree | 0 (0.0%) | 0.0 |
| Graduate Degree | 8 (18.2%) | 276.0 |
| Total | 44 (100.0%) | 131.0 |
Fertility by Education by Marriage Status in West Lawn
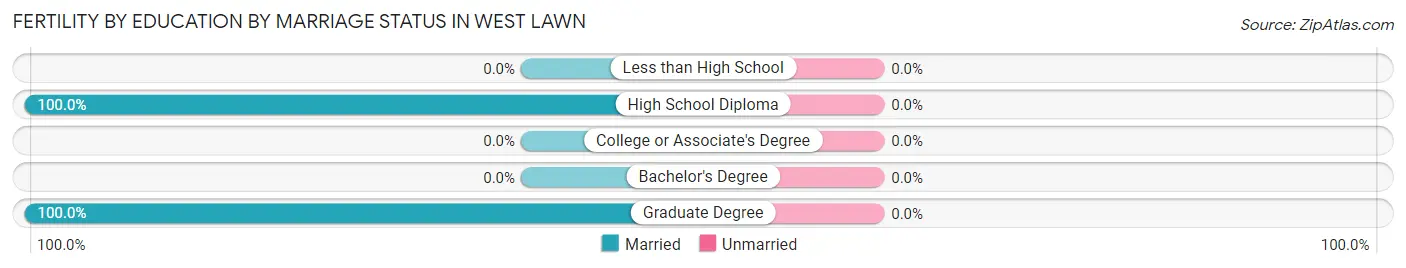
| Educational Attainment | Married | Unmarried |
| Less than High School | 0 (0.0%) | 0 (0.0%) |
| High School Diploma | 36 (100.0%) | 0 (0.0%) |
| College or Associate's Degree | 0 (0.0%) | 0 (0.0%) |
| Bachelor's Degree | 0 (0.0%) | 0 (0.0%) |
| Graduate Degree | 8 (100.0%) | 0 (0.0%) |
| Total | 44 (100.0%) | 0 (0.0%) |
Employment Characteristics in West Lawn
Employment by Class of Employer in West Lawn
Among the 741 employed individuals in West Lawn, private company employees (407 | 54.9%), not-for-profit organizations (200 | 27.0%), and local government employees (73 | 9.9%) make up the most common classes of employment.
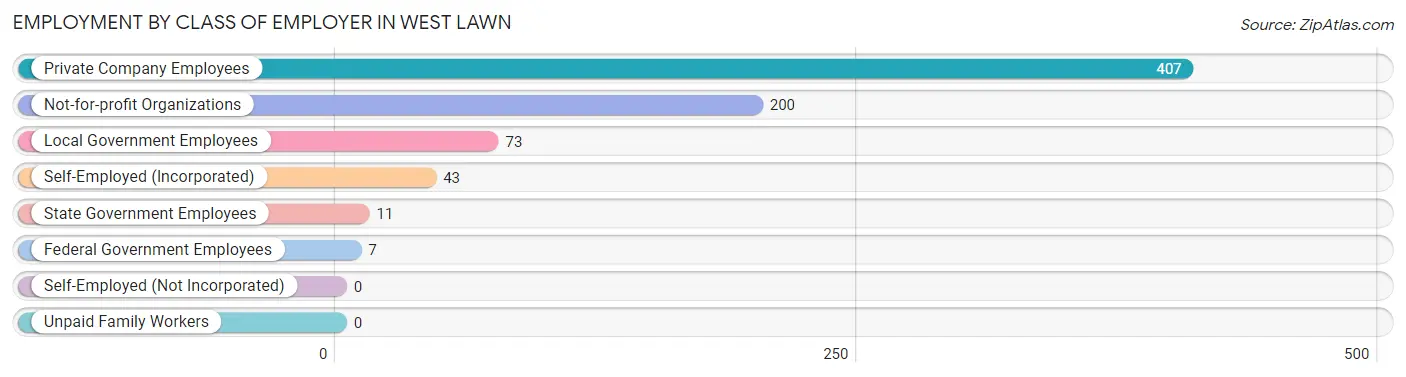
| Employer Class | # Employees | % Employees |
| Private Company Employees | 407 | 54.9% |
| Self-Employed (Incorporated) | 43 | 5.8% |
| Self-Employed (Not Incorporated) | 0 | 0.0% |
| Not-for-profit Organizations | 200 | 27.0% |
| Local Government Employees | 73 | 9.9% |
| State Government Employees | 11 | 1.5% |
| Federal Government Employees | 7 | 0.9% |
| Unpaid Family Workers | 0 | 0.0% |
| Total | 741 | 100.0% |
Employment Status by Age in West Lawn
According to the labor force statistics for West Lawn, out of the total population over 16 years of age (1,198), 72.5% or 869 individuals are in the labor force, with 7.9% or 69 of them unemployed. The age group with the highest labor force participation rate is 60 to 64 years, with 100.0% or 94 individuals in the labor force. Within the labor force, the 16 to 19 years age range has the highest percentage of unemployed individuals, with 81.5% or 22 of them being unemployed.
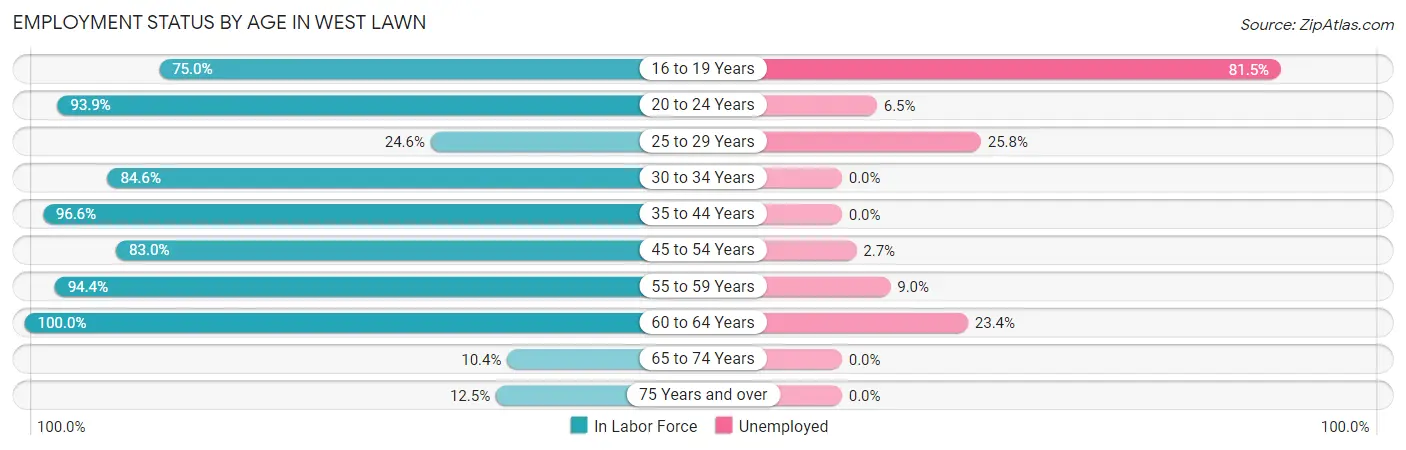
| Age Bracket | In Labor Force | Unemployed |
| 16 to 19 Years | 27 (75.0%) | 22 (81.5%) |
| 20 to 24 Years | 77 (93.9%) | 5 (6.5%) |
| 25 to 29 Years | 31 (24.6%) | 8 (25.8%) |
| 30 to 34 Years | 192 (84.6%) | 0 (0.0%) |
| 35 to 44 Years | 144 (96.6%) | 0 (0.0%) |
| 45 to 54 Years | 219 (83.0%) | 6 (2.7%) |
| 55 to 59 Years | 67 (94.4%) | 6 (9.0%) |
| 60 to 64 Years | 94 (100.0%) | 22 (23.4%) |
| 65 to 74 Years | 8 (10.4%) | 0 (0.0%) |
| 75 Years and over | 9 (12.5%) | 0 (0.0%) |
| Total | 869 (72.5%) | 69 (7.9%) |
Employment Status by Educational Attainment in West Lawn
According to labor force statistics for West Lawn, 80.2% of individuals (747) out of the total population between 25 and 64 years of age (931) are in the labor force, with 5.6% or 42 of them being unemployed. The group with the highest labor force participation rate are those with the educational attainment of less than high school, with 100.0% or 18 individuals in the labor force. Within the labor force, individuals with high school diploma education have the highest percentage of unemployment, with 7.6% or 22 of them being unemployed.
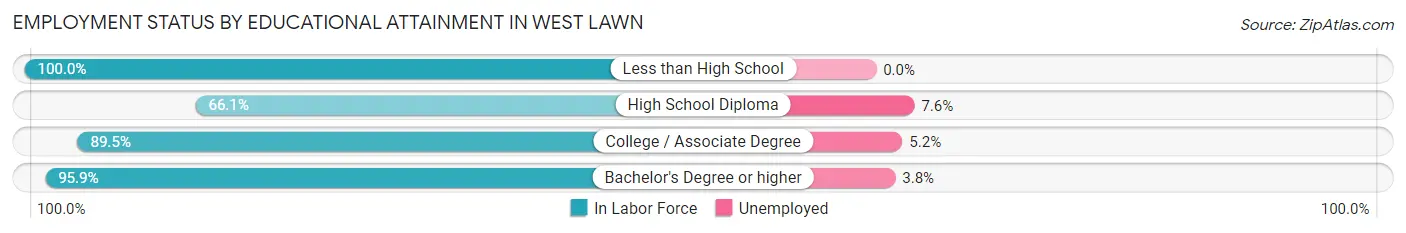
| Educational Attainment | In Labor Force | Unemployed |
| Less than High School | 18 (100.0%) | 0 (0.0%) |
| High School Diploma | 289 (66.1%) | 33 (7.6%) |
| College / Associate Degree | 231 (89.5%) | 13 (5.2%) |
| Bachelor's Degree or higher | 209 (95.9%) | 8 (3.8%) |
| Total | 747 (80.2%) | 52 (5.6%) |
Employment Occupations by Sex in West Lawn
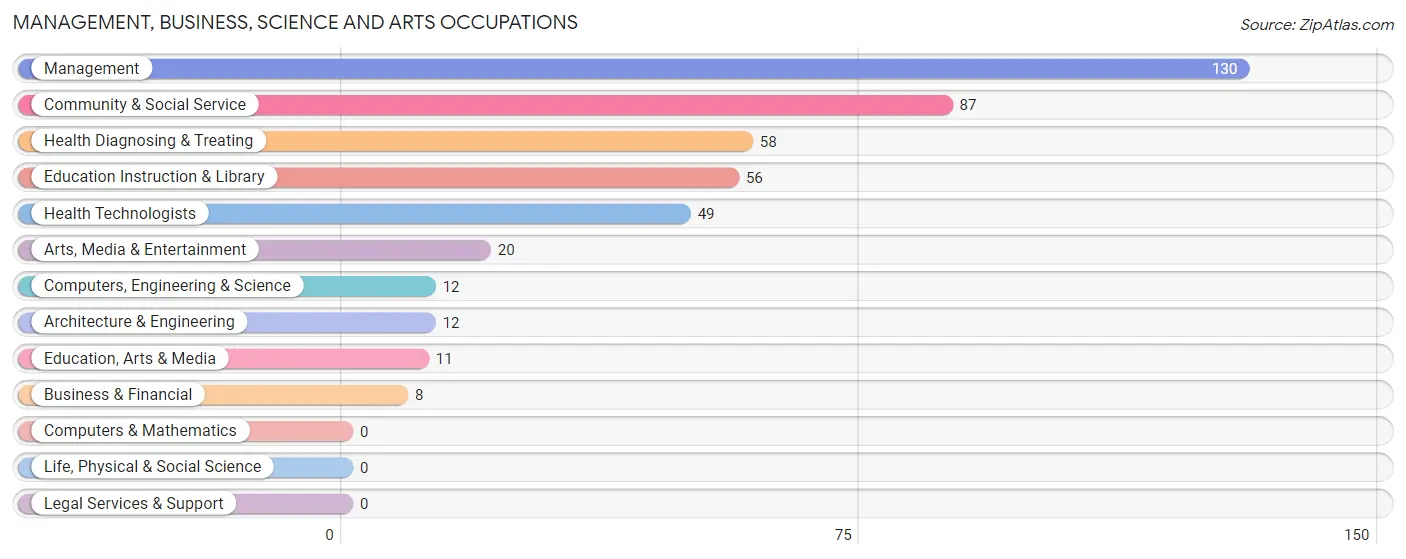
Management, Business, Science and Arts Occupations
The most common Management, Business, Science and Arts occupations in West Lawn are Management (130 | 16.3%), Community & Social Service (87 | 10.9%), Health Diagnosing & Treating (58 | 7.3%), Education Instruction & Library (56 | 7.0%), and Health Technologists (49 | 6.1%).
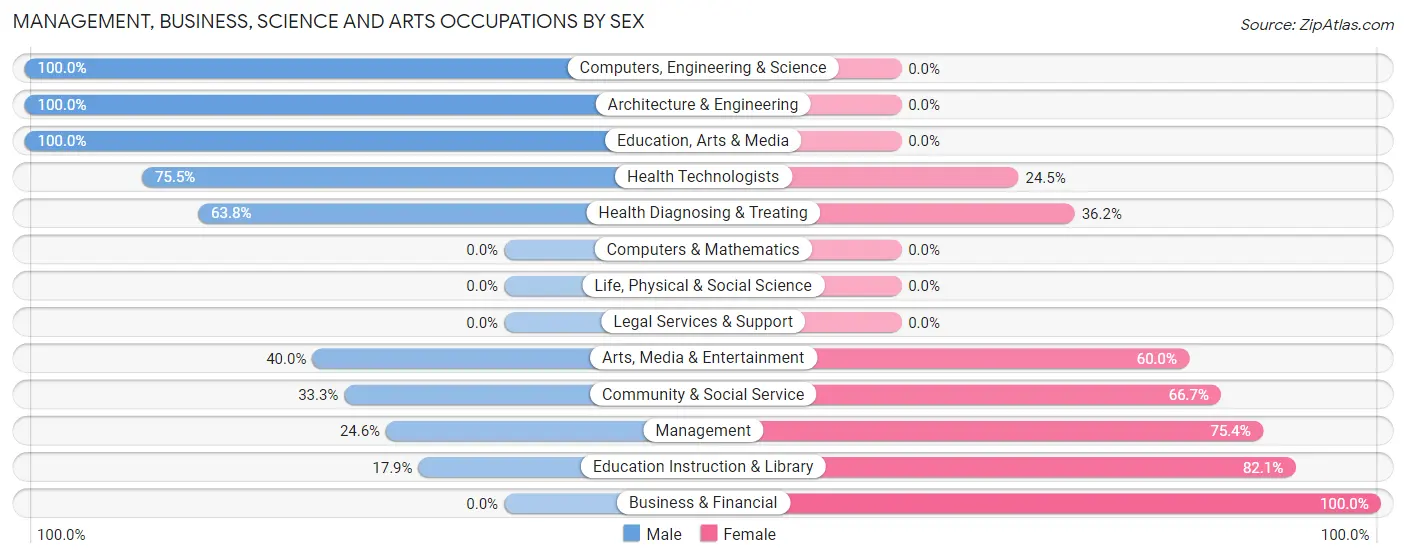
Management, Business, Science and Arts Occupations by Sex
Within the Management, Business, Science and Arts occupations in West Lawn, the most male-oriented occupations are Computers, Engineering & Science (100.0%), Architecture & Engineering (100.0%), and Education, Arts & Media (100.0%), while the most female-oriented occupations are Business & Financial (100.0%), Education Instruction & Library (82.1%), and Management (75.4%).
| Occupation | Male | Female |
| Management | 32 (24.6%) | 98 (75.4%) |
| Business & Financial | 0 (0.0%) | 8 (100.0%) |
| Computers, Engineering & Science | 12 (100.0%) | 0 (0.0%) |
| Computers & Mathematics | 0 (0.0%) | 0 (0.0%) |
| Architecture & Engineering | 12 (100.0%) | 0 (0.0%) |
| Life, Physical & Social Science | 0 (0.0%) | 0 (0.0%) |
| Community & Social Service | 29 (33.3%) | 58 (66.7%) |
| Education, Arts & Media | 11 (100.0%) | 0 (0.0%) |
| Legal Services & Support | 0 (0.0%) | 0 (0.0%) |
| Education Instruction & Library | 10 (17.9%) | 46 (82.1%) |
| Arts, Media & Entertainment | 8 (40.0%) | 12 (60.0%) |
| Health Diagnosing & Treating | 37 (63.8%) | 21 (36.2%) |
| Health Technologists | 37 (75.5%) | 12 (24.5%) |
| Total (Category) | 110 (37.3%) | 185 (62.7%) |
| Total (Overall) | 390 (48.8%) | 409 (51.2%) |
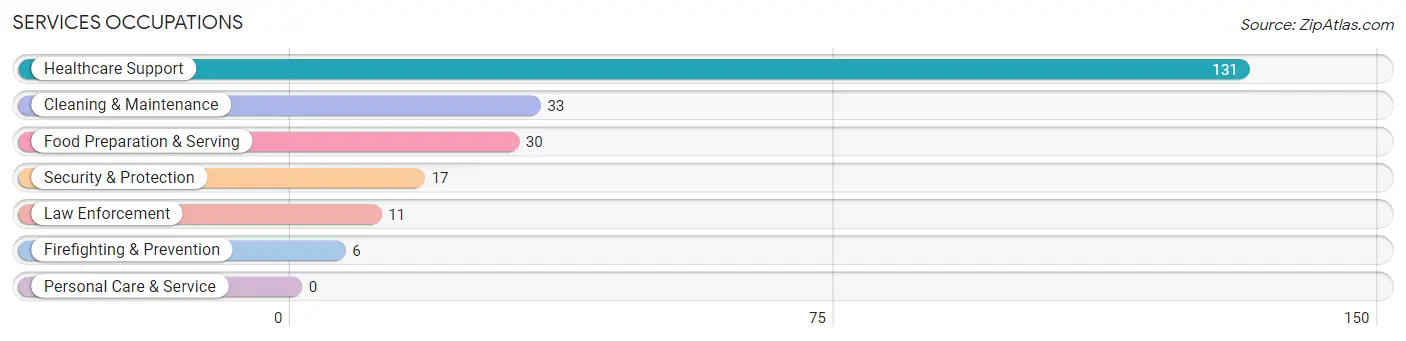
Services Occupations
The most common Services occupations in West Lawn are Healthcare Support (131 | 16.4%), Cleaning & Maintenance (33 | 4.1%), Food Preparation & Serving (30 | 3.7%), Security & Protection (17 | 2.1%), and Law Enforcement (11 | 1.4%).
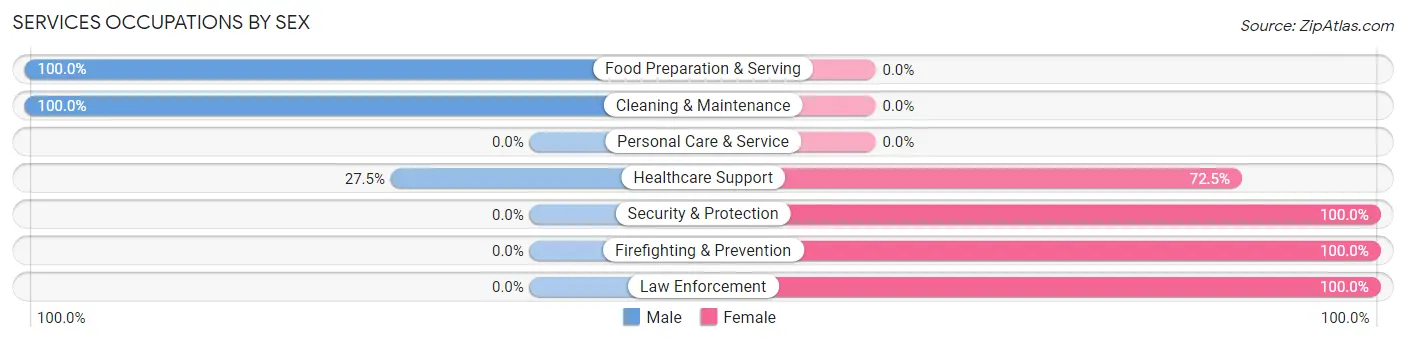
Services Occupations by Sex
Within the Services occupations in West Lawn, the most male-oriented occupations are Food Preparation & Serving (100.0%), Cleaning & Maintenance (100.0%), and Healthcare Support (27.5%), while the most female-oriented occupations are Security & Protection (100.0%), Firefighting & Prevention (100.0%), and Law Enforcement (100.0%).
| Occupation | Male | Female |
| Healthcare Support | 36 (27.5%) | 95 (72.5%) |
| Security & Protection | 0 (0.0%) | 17 (100.0%) |
| Firefighting & Prevention | 0 (0.0%) | 6 (100.0%) |
| Law Enforcement | 0 (0.0%) | 11 (100.0%) |
| Food Preparation & Serving | 30 (100.0%) | 0 (0.0%) |
| Cleaning & Maintenance | 33 (100.0%) | 0 (0.0%) |
| Personal Care & Service | 0 (0.0%) | 0 (0.0%) |
| Total (Category) | 99 (46.9%) | 112 (53.1%) |
| Total (Overall) | 390 (48.8%) | 409 (51.2%) |
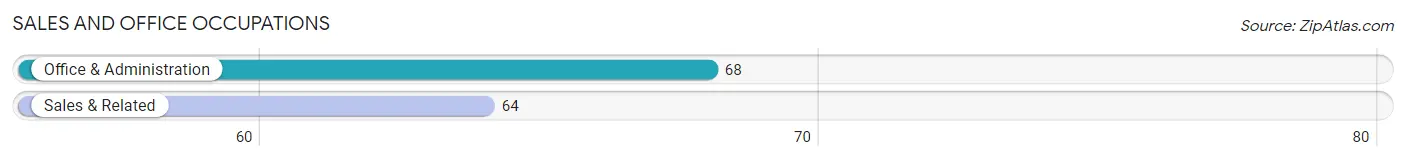
Sales and Office Occupations
The most common Sales and Office occupations in West Lawn are Office & Administration (68 | 8.5%), and Sales & Related (64 | 8.0%).
Sales and Office Occupations by Sex
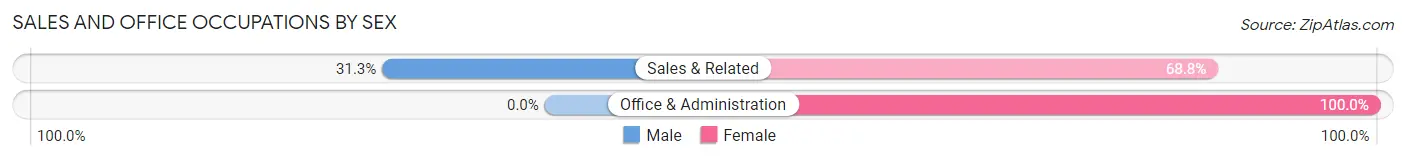
| Occupation | Male | Female |
| Sales & Related | 20 (31.2%) | 44 (68.8%) |
| Office & Administration | 0 (0.0%) | 68 (100.0%) |
| Total (Category) | 20 (15.1%) | 112 (84.9%) |
| Total (Overall) | 390 (48.8%) | 409 (51.2%) |
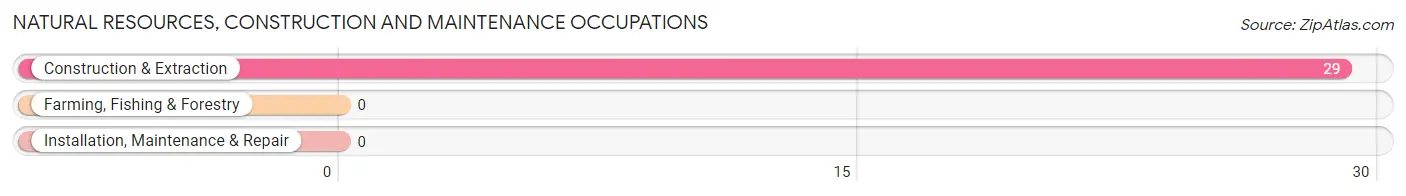
Natural Resources, Construction and Maintenance Occupations
The most common Natural Resources, Construction and Maintenance occupations in West Lawn are , and Construction & Extraction (29 | 3.6%).
Natural Resources, Construction and Maintenance Occupations by Sex
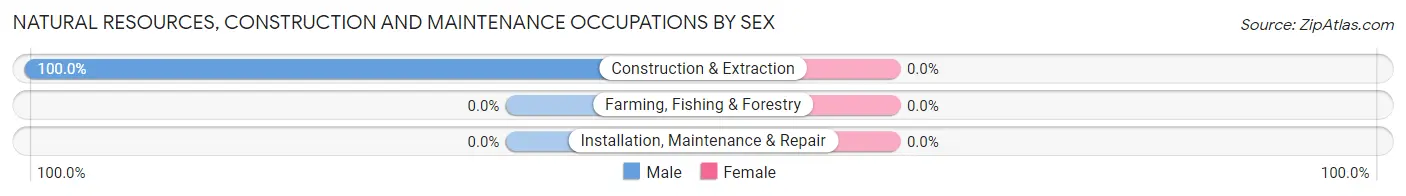
| Occupation | Male | Female |
| Farming, Fishing & Forestry | 0 (0.0%) | 0 (0.0%) |
| Construction & Extraction | 29 (100.0%) | 0 (0.0%) |
| Installation, Maintenance & Repair | 0 (0.0%) | 0 (0.0%) |
| Total (Category) | 29 (100.0%) | 0 (0.0%) |
| Total (Overall) | 390 (48.8%) | 409 (51.2%) |
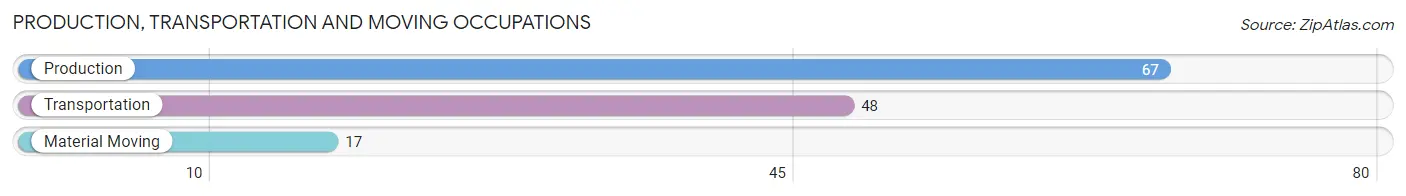
Production, Transportation and Moving Occupations
The most common Production, Transportation and Moving occupations in West Lawn are Production (67 | 8.4%), Transportation (48 | 6.0%), and Material Moving (17 | 2.1%).
Production, Transportation and Moving Occupations by Sex
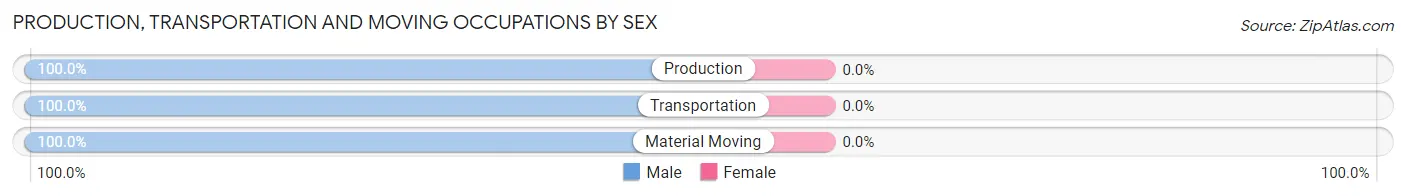
| Occupation | Male | Female |
| Production | 67 (100.0%) | 0 (0.0%) |
| Transportation | 48 (100.0%) | 0 (0.0%) |
| Material Moving | 17 (100.0%) | 0 (0.0%) |
| Total (Category) | 132 (100.0%) | 0 (0.0%) |
| Total (Overall) | 390 (48.8%) | 409 (51.2%) |
Employment Industries by Sex in West Lawn
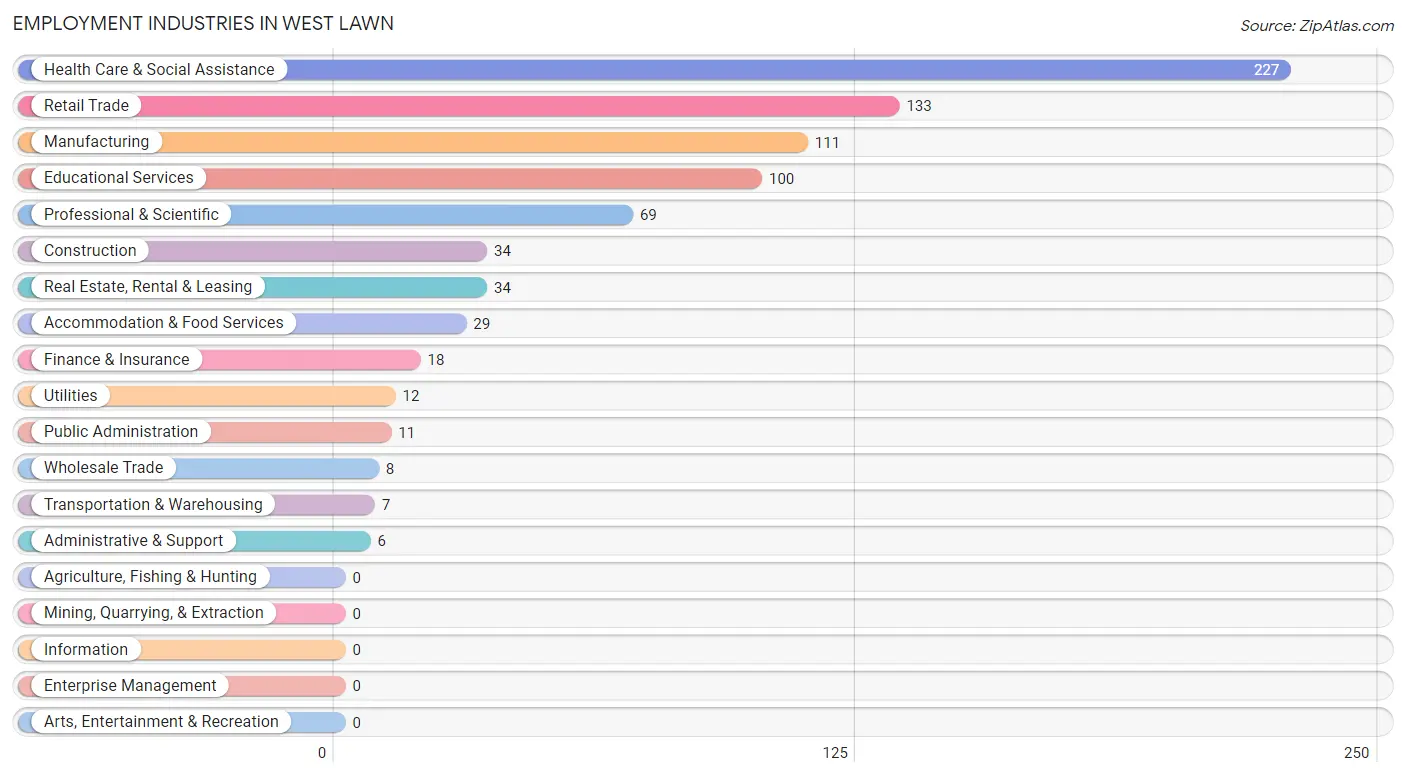
Employment Industries in West Lawn
The major employment industries in West Lawn include Health Care & Social Assistance (227 | 28.4%), Retail Trade (133 | 16.7%), Manufacturing (111 | 13.9%), Educational Services (100 | 12.5%), and Professional & Scientific (69 | 8.6%).
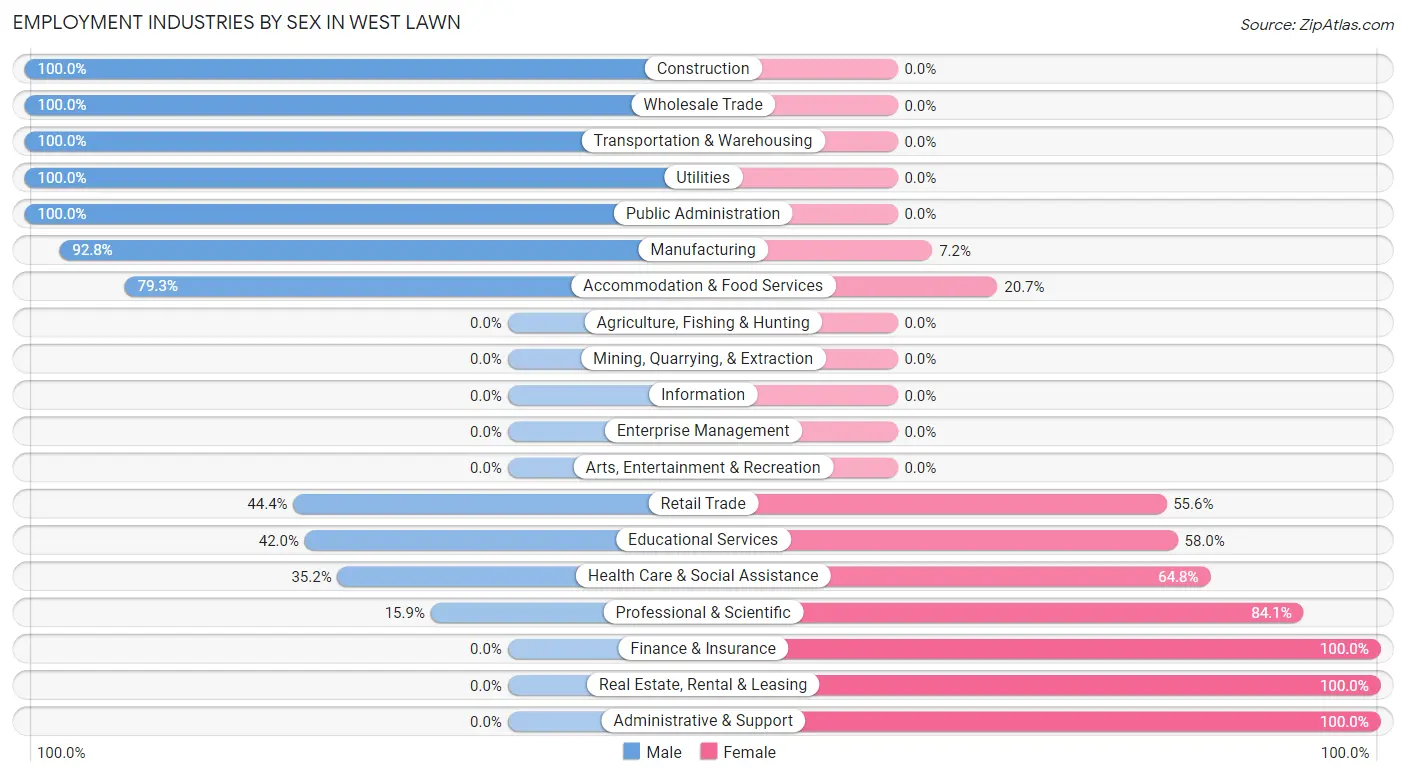
Employment Industries by Sex in West Lawn
The West Lawn industries that see more men than women are Construction (100.0%), Wholesale Trade (100.0%), and Transportation & Warehousing (100.0%), whereas the industries that tend to have a higher number of women are Finance & Insurance (100.0%), Real Estate, Rental & Leasing (100.0%), and Administrative & Support (100.0%).
| Industry | Male | Female |
| Agriculture, Fishing & Hunting | 0 (0.0%) | 0 (0.0%) |
| Mining, Quarrying, & Extraction | 0 (0.0%) | 0 (0.0%) |
| Construction | 34 (100.0%) | 0 (0.0%) |
| Manufacturing | 103 (92.8%) | 8 (7.2%) |
| Wholesale Trade | 8 (100.0%) | 0 (0.0%) |
| Retail Trade | 59 (44.4%) | 74 (55.6%) |
| Transportation & Warehousing | 7 (100.0%) | 0 (0.0%) |
| Utilities | 12 (100.0%) | 0 (0.0%) |
| Information | 0 (0.0%) | 0 (0.0%) |
| Finance & Insurance | 0 (0.0%) | 18 (100.0%) |
| Real Estate, Rental & Leasing | 0 (0.0%) | 34 (100.0%) |
| Professional & Scientific | 11 (15.9%) | 58 (84.1%) |
| Enterprise Management | 0 (0.0%) | 0 (0.0%) |
| Administrative & Support | 0 (0.0%) | 6 (100.0%) |
| Educational Services | 42 (42.0%) | 58 (58.0%) |
| Health Care & Social Assistance | 80 (35.2%) | 147 (64.8%) |
| Arts, Entertainment & Recreation | 0 (0.0%) | 0 (0.0%) |
| Accommodation & Food Services | 23 (79.3%) | 6 (20.7%) |
| Public Administration | 11 (100.0%) | 0 (0.0%) |
| Total | 390 (48.8%) | 409 (51.2%) |
Education in West Lawn
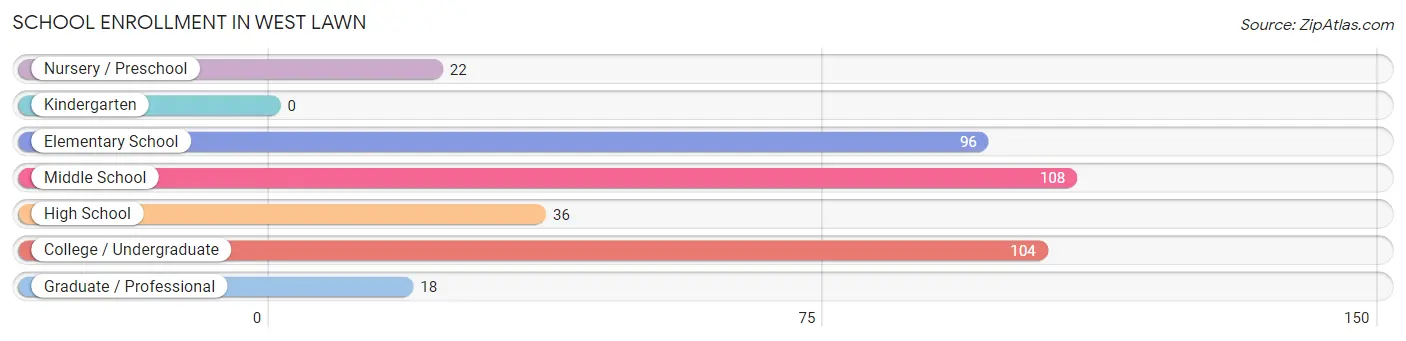
School Enrollment in West Lawn
The most common levels of schooling among the 384 students in West Lawn are middle school (108 | 28.1%), college / undergraduate (104 | 27.1%), and elementary school (96 | 25.0%).
| School Level | # Students | % Students |
| Nursery / Preschool | 22 | 5.7% |
| Kindergarten | 0 | 0.0% |
| Elementary School | 96 | 25.0% |
| Middle School | 108 | 28.1% |
| High School | 36 | 9.4% |
| College / Undergraduate | 104 | 27.1% |
| Graduate / Professional | 18 | 4.7% |
| Total | 384 | 100.0% |
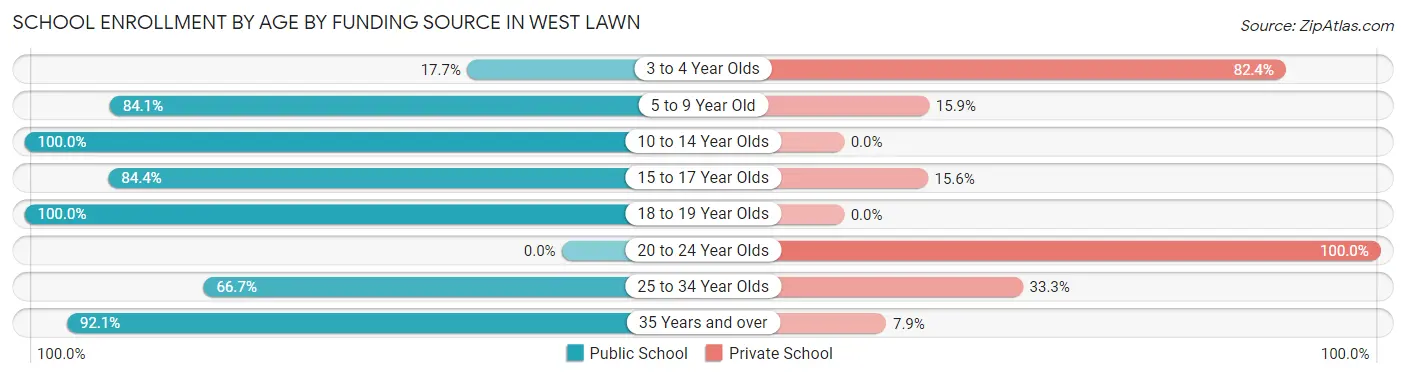
School Enrollment by Age by Funding Source in West Lawn
Out of a total of 384 students who are enrolled in schools in West Lawn, 65 (16.9%) attend a private institution, while the remaining 319 (83.1%) are enrolled in public schools. The age group of 20 to 24 year olds has the highest likelihood of being enrolled in private schools, with 22 (100.0% in the age bracket) enrolled. Conversely, the age group of 10 to 14 year olds has the lowest likelihood of being enrolled in a private school, with 146 (100.0% in the age bracket) attending a public institution.
| Age Bracket | Public School | Private School |
| 3 to 4 Year Olds | 3 (17.6%) | 14 (82.4%) |
| 5 to 9 Year Old | 53 (84.1%) | 10 (15.9%) |
| 10 to 14 Year Olds | 146 (100.0%) | 0 (0.0%) |
| 15 to 17 Year Olds | 27 (84.4%) | 5 (15.6%) |
| 18 to 19 Year Olds | 4 (100.0%) | 0 (0.0%) |
| 20 to 24 Year Olds | 0 (0.0%) | 22 (100.0%) |
| 25 to 34 Year Olds | 16 (66.7%) | 8 (33.3%) |
| 35 Years and over | 70 (92.1%) | 6 (7.9%) |
| Total | 319 (83.1%) | 65 (16.9%) |
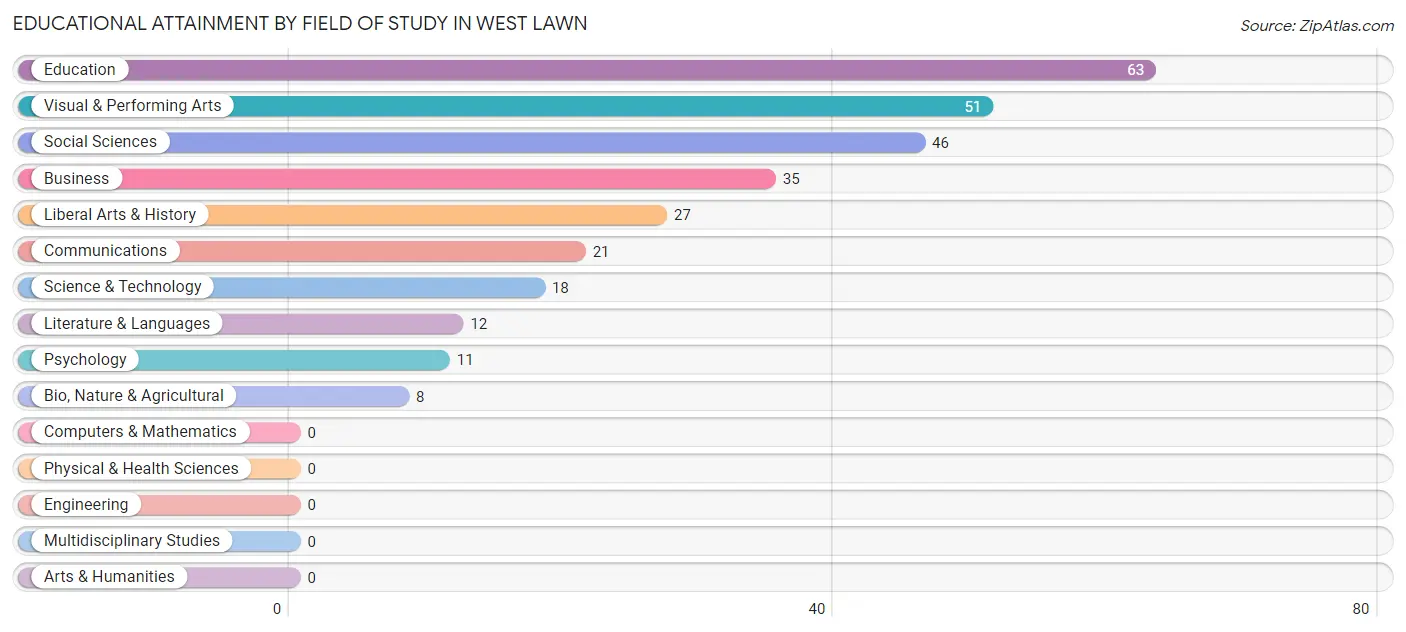
Educational Attainment by Field of Study in West Lawn
Education (63 | 21.6%), visual & performing arts (51 | 17.5%), social sciences (46 | 15.8%), business (35 | 12.0%), and liberal arts & history (27 | 9.2%) are the most common fields of study among 292 individuals in West Lawn who have obtained a bachelor's degree or higher.
| Field of Study | # Graduates | % Graduates |
| Computers & Mathematics | 0 | 0.0% |
| Bio, Nature & Agricultural | 8 | 2.7% |
| Physical & Health Sciences | 0 | 0.0% |
| Psychology | 11 | 3.8% |
| Social Sciences | 46 | 15.8% |
| Engineering | 0 | 0.0% |
| Multidisciplinary Studies | 0 | 0.0% |
| Science & Technology | 18 | 6.2% |
| Business | 35 | 12.0% |
| Education | 63 | 21.6% |
| Literature & Languages | 12 | 4.1% |
| Liberal Arts & History | 27 | 9.2% |
| Visual & Performing Arts | 51 | 17.5% |
| Communications | 21 | 7.2% |
| Arts & Humanities | 0 | 0.0% |
| Total | 292 | 100.0% |
Transportation & Commute in West Lawn
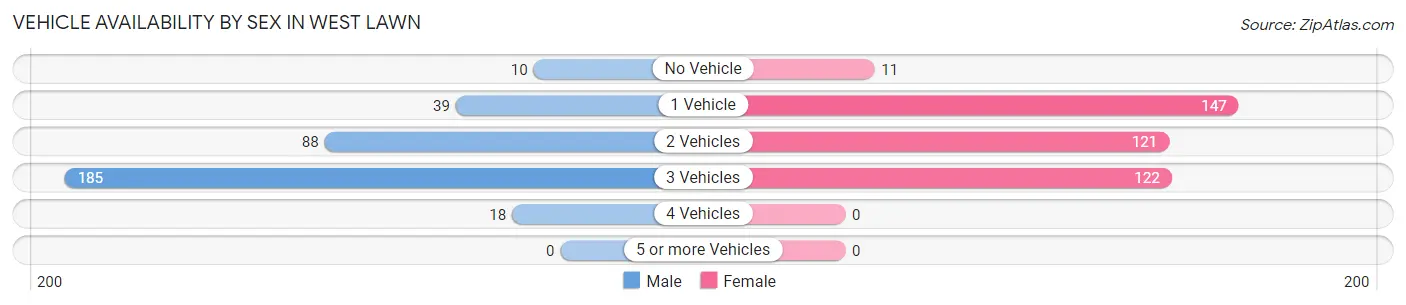
Vehicle Availability by Sex in West Lawn
The most prevalent vehicle ownership categories in West Lawn are males with 3 vehicles (185, accounting for 54.4%) and females with 3 vehicles (122, making up 46.1%).
| Vehicles Available | Male | Female |
| No Vehicle | 10 (2.9%) | 11 (2.7%) |
| 1 Vehicle | 39 (11.5%) | 147 (36.7%) |
| 2 Vehicles | 88 (25.9%) | 121 (30.2%) |
| 3 Vehicles | 185 (54.4%) | 122 (30.4%) |
| 4 Vehicles | 18 (5.3%) | 0 (0.0%) |
| 5 or more Vehicles | 0 (0.0%) | 0 (0.0%) |
| Total | 340 (100.0%) | 401 (100.0%) |
Commute Time in West Lawn
The most frequently occuring commute durations in West Lawn are 10 to 14 minutes (197 commuters, 30.8%), 15 to 19 minutes (140 commuters, 21.9%), and 5 to 9 minutes (132 commuters, 20.6%).
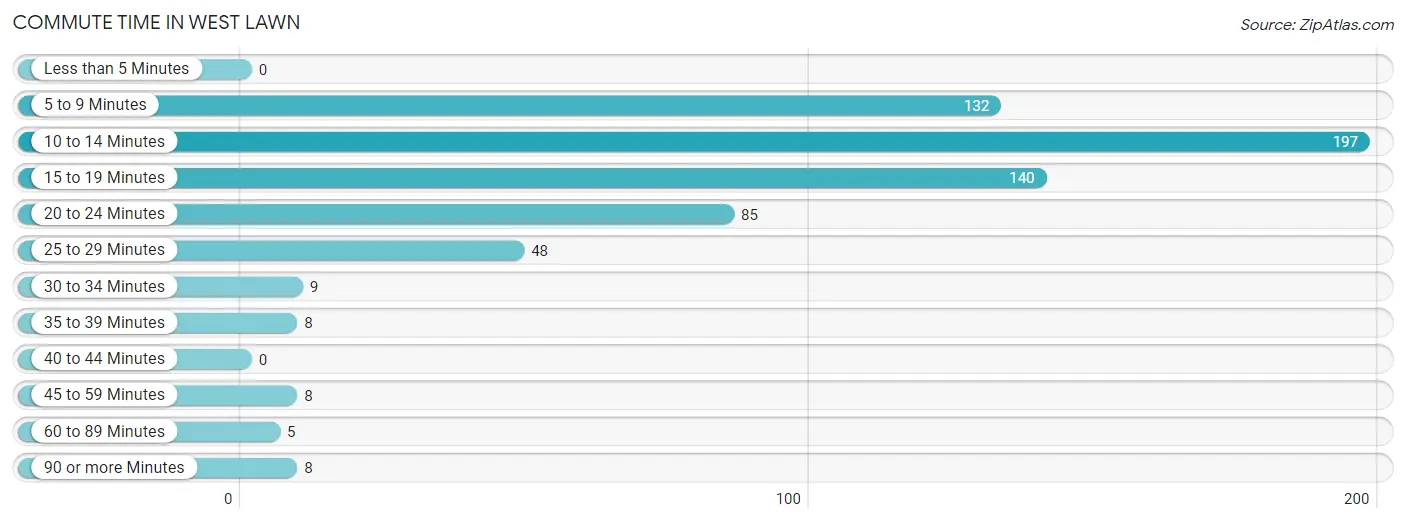
| Commute Time | # Commuters | % Commuters |
| Less than 5 Minutes | 0 | 0.0% |
| 5 to 9 Minutes | 132 | 20.6% |
| 10 to 14 Minutes | 197 | 30.8% |
| 15 to 19 Minutes | 140 | 21.9% |
| 20 to 24 Minutes | 85 | 13.3% |
| 25 to 29 Minutes | 48 | 7.5% |
| 30 to 34 Minutes | 9 | 1.4% |
| 35 to 39 Minutes | 8 | 1.3% |
| 40 to 44 Minutes | 0 | 0.0% |
| 45 to 59 Minutes | 8 | 1.3% |
| 60 to 89 Minutes | 5 | 0.8% |
| 90 or more Minutes | 8 | 1.3% |
Commute Time by Sex in West Lawn
The most common commute times in West Lawn are 15 to 19 minutes (123 commuters, 37.3%) for males and 10 to 14 minutes (145 commuters, 46.8%) for females.
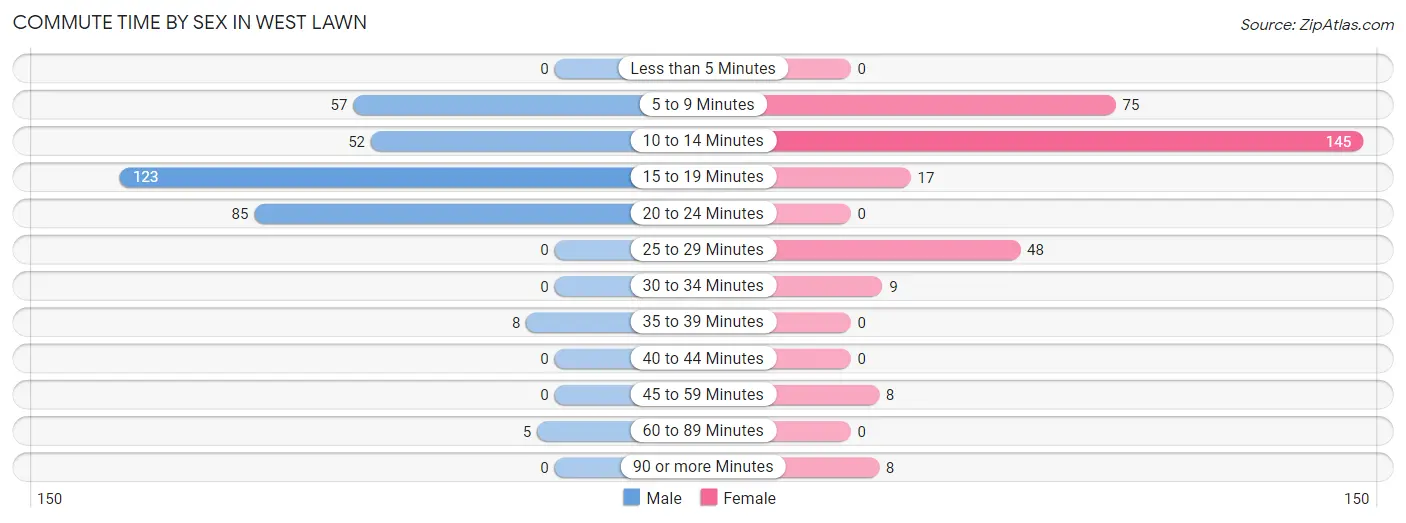
| Commute Time | Male | Female |
| Less than 5 Minutes | 0 (0.0%) | 0 (0.0%) |
| 5 to 9 Minutes | 57 (17.3%) | 75 (24.2%) |
| 10 to 14 Minutes | 52 (15.8%) | 145 (46.8%) |
| 15 to 19 Minutes | 123 (37.3%) | 17 (5.5%) |
| 20 to 24 Minutes | 85 (25.8%) | 0 (0.0%) |
| 25 to 29 Minutes | 0 (0.0%) | 48 (15.5%) |
| 30 to 34 Minutes | 0 (0.0%) | 9 (2.9%) |
| 35 to 39 Minutes | 8 (2.4%) | 0 (0.0%) |
| 40 to 44 Minutes | 0 (0.0%) | 0 (0.0%) |
| 45 to 59 Minutes | 0 (0.0%) | 8 (2.6%) |
| 60 to 89 Minutes | 5 (1.5%) | 0 (0.0%) |
| 90 or more Minutes | 0 (0.0%) | 8 (2.6%) |
Time of Departure to Work by Sex in West Lawn
The most frequent times of departure to work in West Lawn are 7:00 AM to 7:29 AM (79, 23.9%) for males and 4:00 PM to 11:59 PM (59, 19.0%) for females.
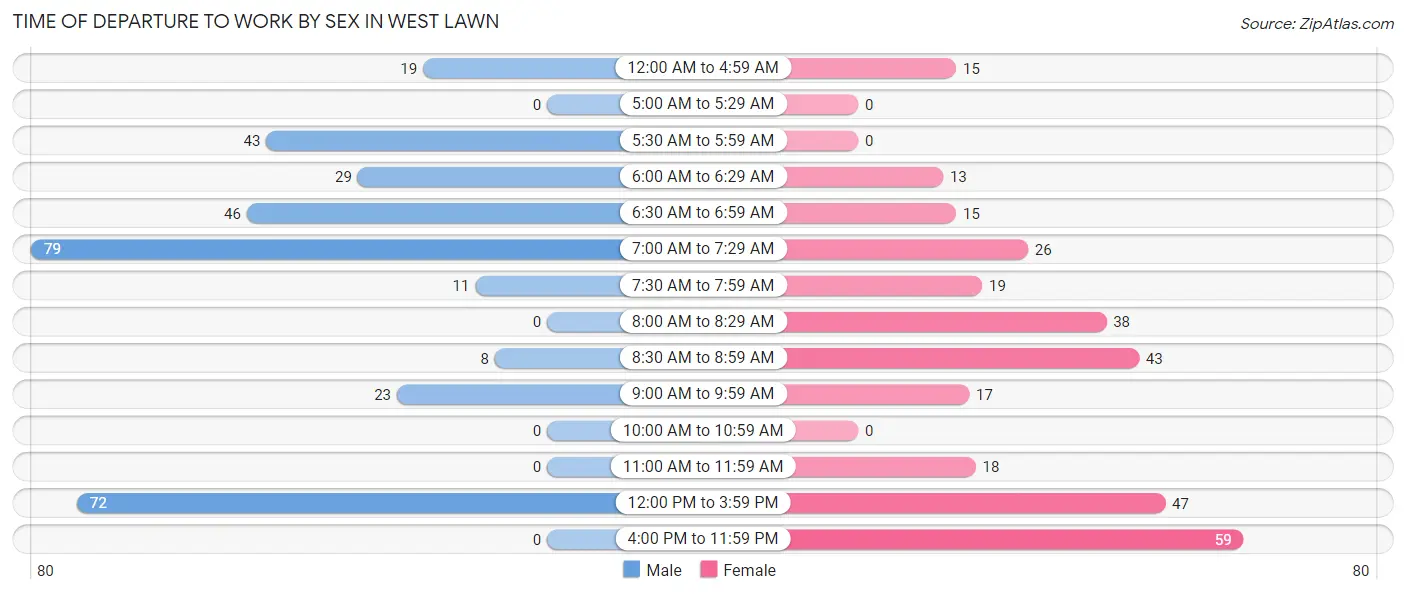
| Time of Departure | Male | Female |
| 12:00 AM to 4:59 AM | 19 (5.8%) | 15 (4.8%) |
| 5:00 AM to 5:29 AM | 0 (0.0%) | 0 (0.0%) |
| 5:30 AM to 5:59 AM | 43 (13.0%) | 0 (0.0%) |
| 6:00 AM to 6:29 AM | 29 (8.8%) | 13 (4.2%) |
| 6:30 AM to 6:59 AM | 46 (13.9%) | 15 (4.8%) |
| 7:00 AM to 7:29 AM | 79 (23.9%) | 26 (8.4%) |
| 7:30 AM to 7:59 AM | 11 (3.3%) | 19 (6.1%) |
| 8:00 AM to 8:29 AM | 0 (0.0%) | 38 (12.3%) |
| 8:30 AM to 8:59 AM | 8 (2.4%) | 43 (13.9%) |
| 9:00 AM to 9:59 AM | 23 (7.0%) | 17 (5.5%) |
| 10:00 AM to 10:59 AM | 0 (0.0%) | 0 (0.0%) |
| 11:00 AM to 11:59 AM | 0 (0.0%) | 18 (5.8%) |
| 12:00 PM to 3:59 PM | 72 (21.8%) | 47 (15.2%) |
| 4:00 PM to 11:59 PM | 0 (0.0%) | 59 (19.0%) |
| Total | 330 (100.0%) | 310 (100.0%) |
Housing Occupancy in West Lawn
Occupancy by Ownership in West Lawn
Of the total 573 dwellings in West Lawn, owner-occupied units account for 305 (53.2%), while renter-occupied units make up 268 (46.8%).
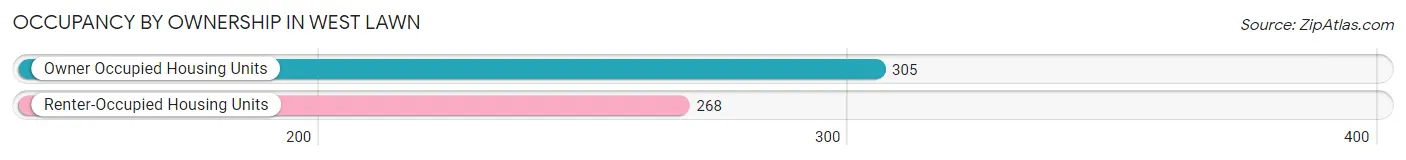
| Occupancy | # Housing Units | % Housing Units |
| Owner Occupied Housing Units | 305 | 53.2% |
| Renter-Occupied Housing Units | 268 | 46.8% |
| Total Occupied Housing Units | 573 | 100.0% |
Occupancy by Household Size in West Lawn
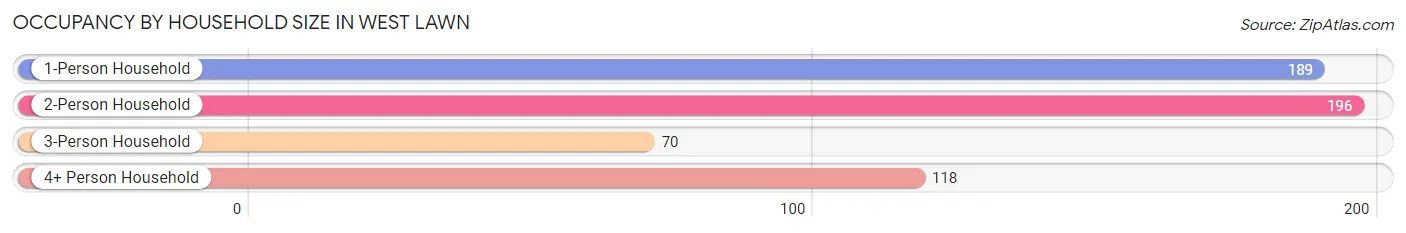
| Household Size | # Housing Units | % Housing Units |
| 1-Person Household | 189 | 33.0% |
| 2-Person Household | 196 | 34.2% |
| 3-Person Household | 70 | 12.2% |
| 4+ Person Household | 118 | 20.6% |
| Total Housing Units | 573 | 100.0% |
Occupancy by Ownership by Household Size in West Lawn
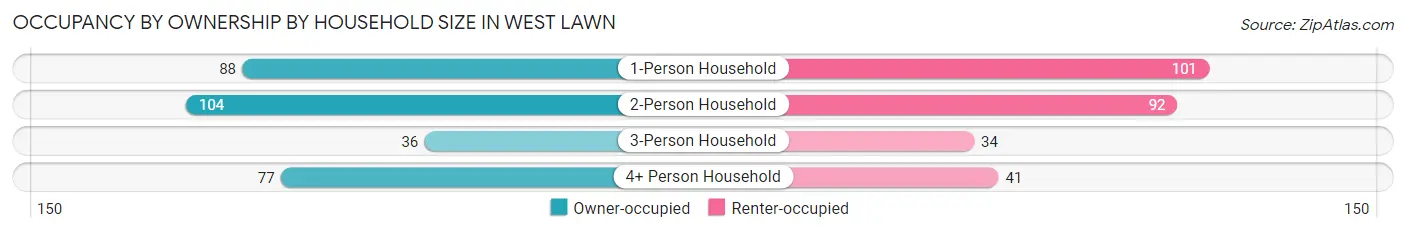
| Household Size | Owner-occupied | Renter-occupied |
| 1-Person Household | 88 (46.6%) | 101 (53.4%) |
| 2-Person Household | 104 (53.1%) | 92 (46.9%) |
| 3-Person Household | 36 (51.4%) | 34 (48.6%) |
| 4+ Person Household | 77 (65.2%) | 41 (34.7%) |
| Total Housing Units | 305 (53.2%) | 268 (46.8%) |
Occupancy by Educational Attainment in West Lawn
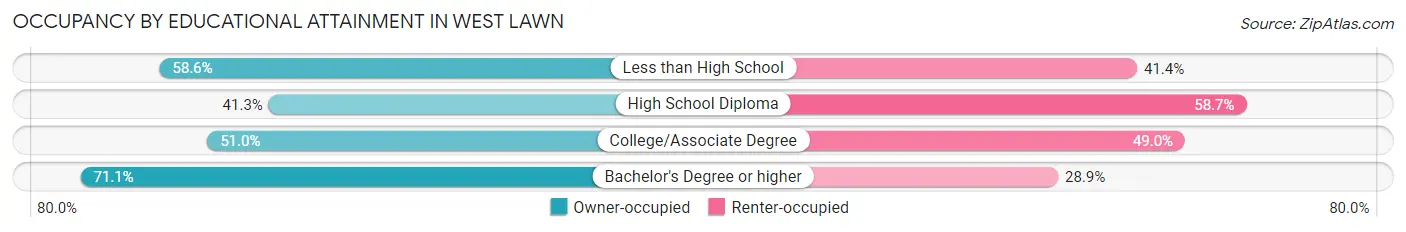
| Household Size | Owner-occupied | Renter-occupied |
| Less than High School | 17 (58.6%) | 12 (41.4%) |
| High School Diploma | 83 (41.3%) | 118 (58.7%) |
| College/Associate Degree | 99 (51.0%) | 95 (49.0%) |
| Bachelor's Degree or higher | 106 (71.1%) | 43 (28.9%) |
Occupancy by Age of Householder in West Lawn
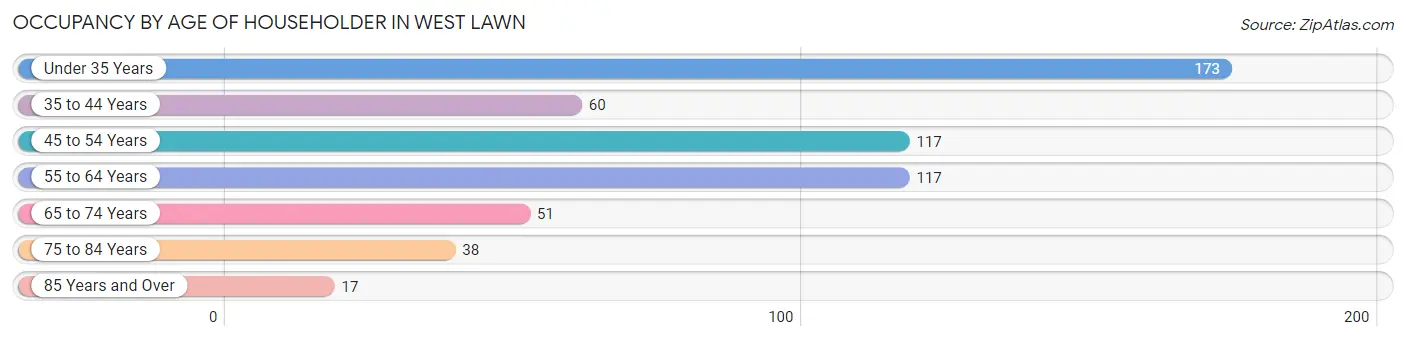
| Age Bracket | # Households | % Households |
| Under 35 Years | 173 | 30.2% |
| 35 to 44 Years | 60 | 10.5% |
| 45 to 54 Years | 117 | 20.4% |
| 55 to 64 Years | 117 | 20.4% |
| 65 to 74 Years | 51 | 8.9% |
| 75 to 84 Years | 38 | 6.6% |
| 85 Years and Over | 17 | 3.0% |
| Total | 573 | 100.0% |
Housing Finances in West Lawn
Median Income by Occupancy in West Lawn
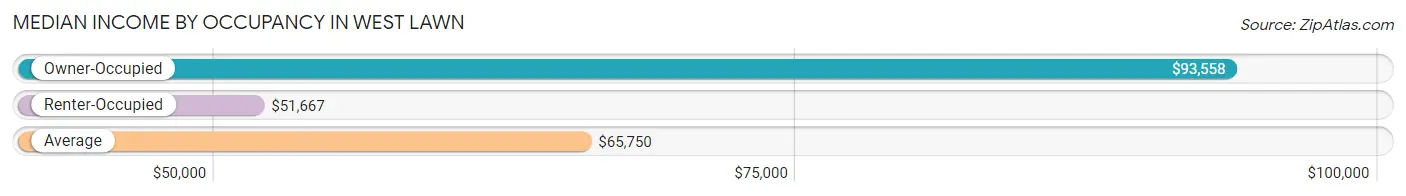
| Occupancy Type | # Households | Median Income |
| Owner-Occupied | 305 (53.2%) | $93,558 |
| Renter-Occupied | 268 (46.8%) | $51,667 |
| Average | 573 (100.0%) | $65,750 |
Occupancy by Householder Income Bracket in West Lawn
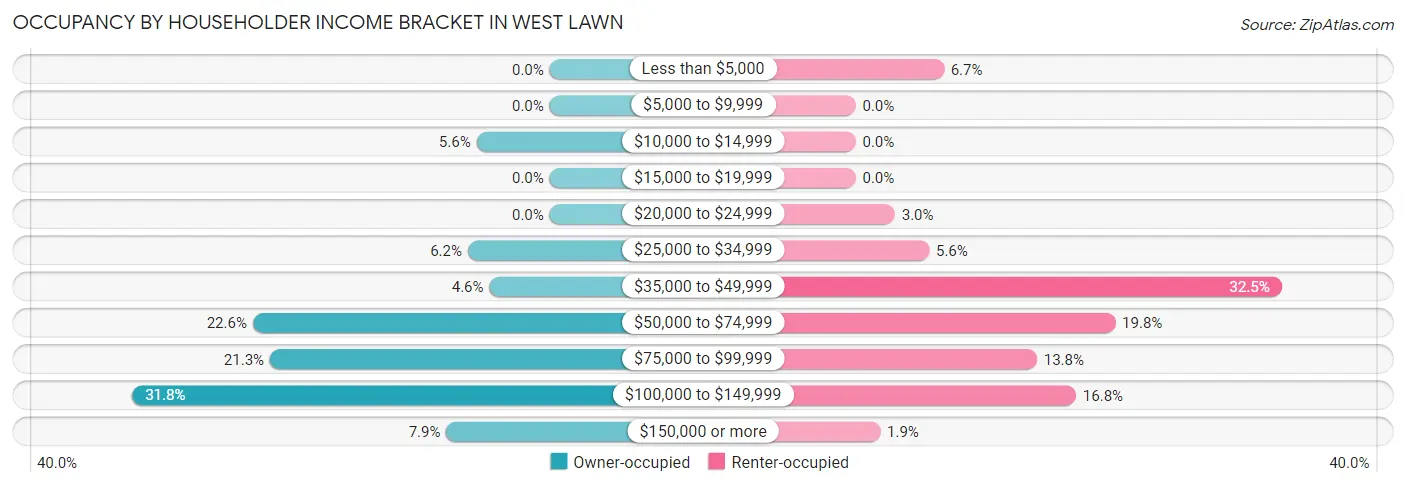
| Income Bracket | Owner-occupied | Renter-occupied |
| Less than $5,000 | 0 (0.0%) | 18 (6.7%) |
| $5,000 to $9,999 | 0 (0.0%) | 0 (0.0%) |
| $10,000 to $14,999 | 17 (5.6%) | 0 (0.0%) |
| $15,000 to $19,999 | 0 (0.0%) | 0 (0.0%) |
| $20,000 to $24,999 | 0 (0.0%) | 8 (3.0%) |
| $25,000 to $34,999 | 19 (6.2%) | 15 (5.6%) |
| $35,000 to $49,999 | 14 (4.6%) | 87 (32.5%) |
| $50,000 to $74,999 | 69 (22.6%) | 53 (19.8%) |
| $75,000 to $99,999 | 65 (21.3%) | 37 (13.8%) |
| $100,000 to $149,999 | 97 (31.8%) | 45 (16.8%) |
| $150,000 or more | 24 (7.9%) | 5 (1.9%) |
| Total | 305 (100.0%) | 268 (100.0%) |
Monthly Housing Cost Tiers in West Lawn
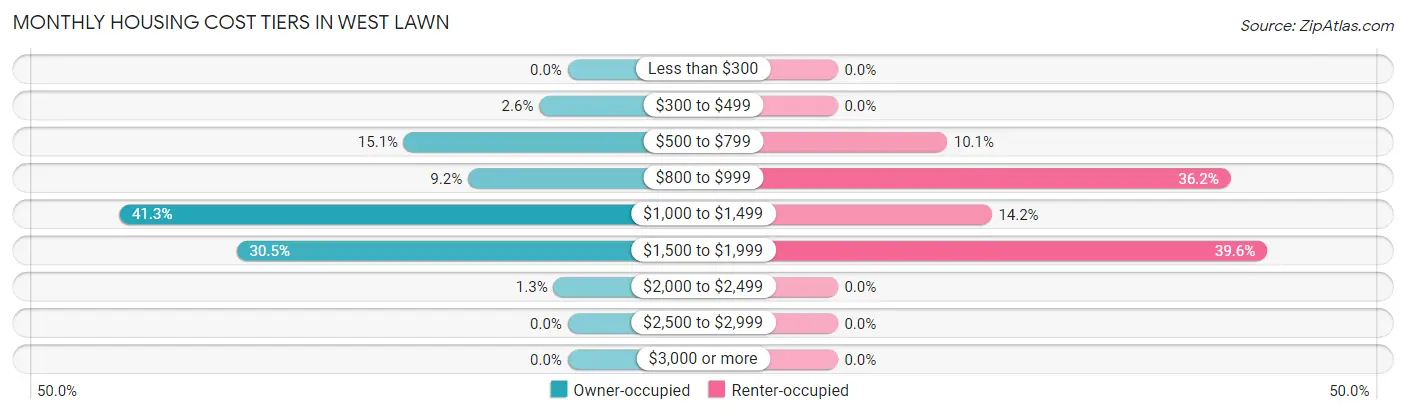
| Monthly Cost | Owner-occupied | Renter-occupied |
| Less than $300 | 0 (0.0%) | 0 (0.0%) |
| $300 to $499 | 8 (2.6%) | 0 (0.0%) |
| $500 to $799 | 46 (15.1%) | 27 (10.1%) |
| $800 to $999 | 28 (9.2%) | 97 (36.2%) |
| $1,000 to $1,499 | 126 (41.3%) | 38 (14.2%) |
| $1,500 to $1,999 | 93 (30.5%) | 106 (39.6%) |
| $2,000 to $2,499 | 4 (1.3%) | 0 (0.0%) |
| $2,500 to $2,999 | 0 (0.0%) | 0 (0.0%) |
| $3,000 or more | 0 (0.0%) | 0 (0.0%) |
| Total | 305 (100.0%) | 268 (100.0%) |
Physical Housing Characteristics in West Lawn
Housing Structures in West Lawn
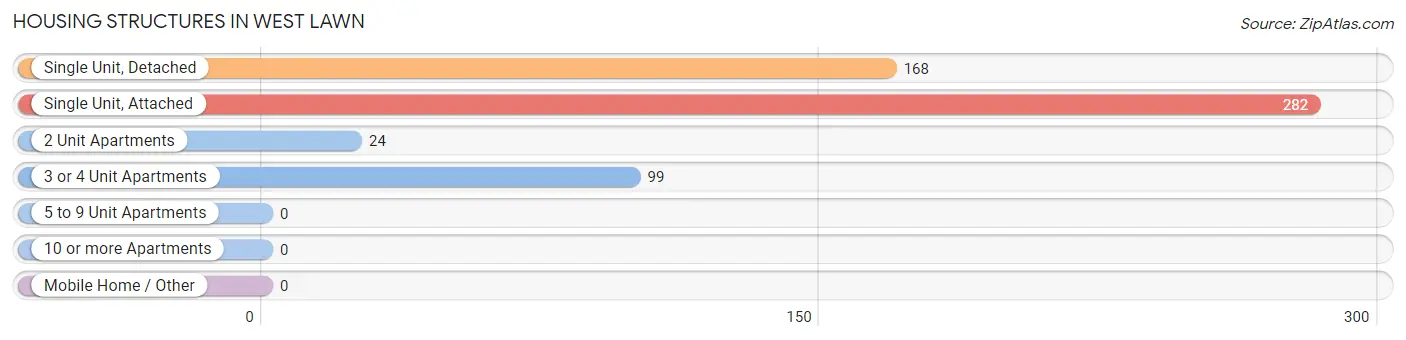
| Structure Type | # Housing Units | % Housing Units |
| Single Unit, Detached | 168 | 29.3% |
| Single Unit, Attached | 282 | 49.2% |
| 2 Unit Apartments | 24 | 4.2% |
| 3 or 4 Unit Apartments | 99 | 17.3% |
| 5 to 9 Unit Apartments | 0 | 0.0% |
| 10 or more Apartments | 0 | 0.0% |
| Mobile Home / Other | 0 | 0.0% |
| Total | 573 | 100.0% |
Housing Structures by Occupancy in West Lawn
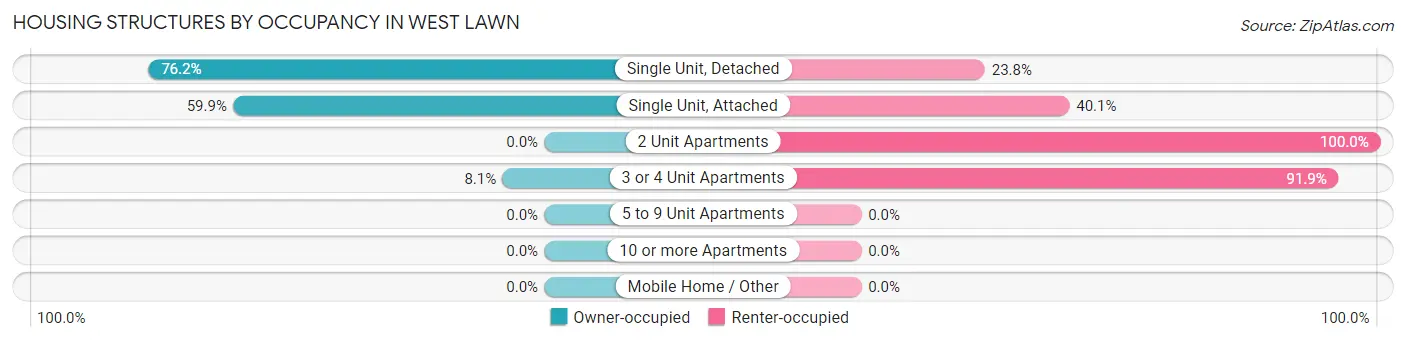
| Structure Type | Owner-occupied | Renter-occupied |
| Single Unit, Detached | 128 (76.2%) | 40 (23.8%) |
| Single Unit, Attached | 169 (59.9%) | 113 (40.1%) |
| 2 Unit Apartments | 0 (0.0%) | 24 (100.0%) |
| 3 or 4 Unit Apartments | 8 (8.1%) | 91 (91.9%) |
| 5 to 9 Unit Apartments | 0 (0.0%) | 0 (0.0%) |
| 10 or more Apartments | 0 (0.0%) | 0 (0.0%) |
| Mobile Home / Other | 0 (0.0%) | 0 (0.0%) |
| Total | 305 (53.2%) | 268 (46.8%) |
Housing Structures by Number of Rooms in West Lawn
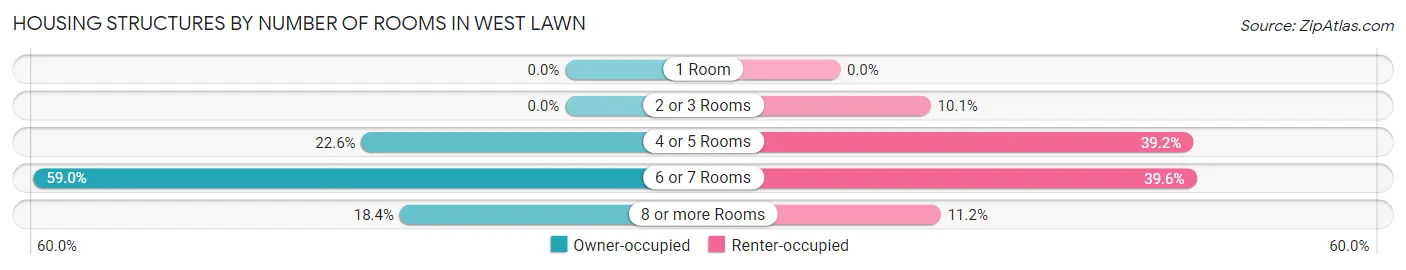
| Number of Rooms | Owner-occupied | Renter-occupied |
| 1 Room | 0 (0.0%) | 0 (0.0%) |
| 2 or 3 Rooms | 0 (0.0%) | 27 (10.1%) |
| 4 or 5 Rooms | 69 (22.6%) | 105 (39.2%) |
| 6 or 7 Rooms | 180 (59.0%) | 106 (39.6%) |
| 8 or more Rooms | 56 (18.4%) | 30 (11.2%) |
| Total | 305 (100.0%) | 268 (100.0%) |
Housing Structure by Heating Type in West Lawn
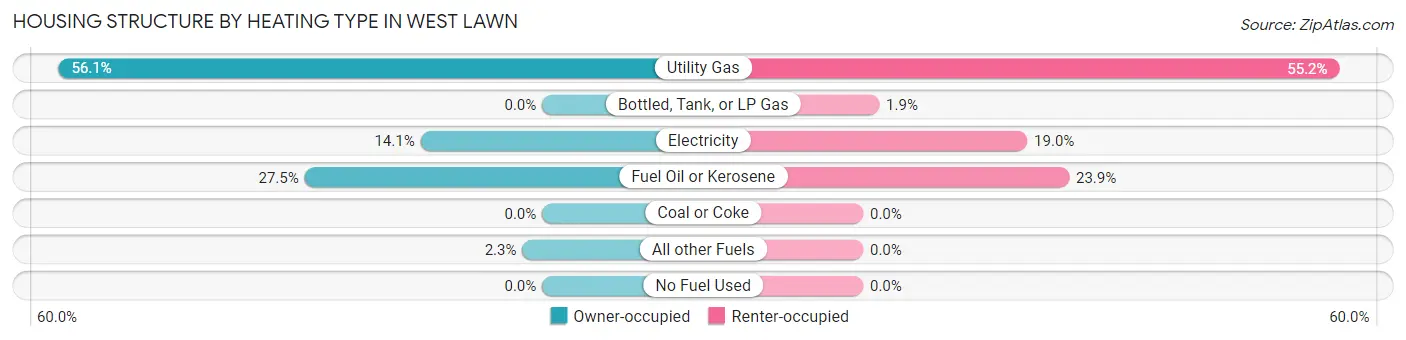
| Heating Type | Owner-occupied | Renter-occupied |
| Utility Gas | 171 (56.1%) | 148 (55.2%) |
| Bottled, Tank, or LP Gas | 0 (0.0%) | 5 (1.9%) |
| Electricity | 43 (14.1%) | 51 (19.0%) |
| Fuel Oil or Kerosene | 84 (27.5%) | 64 (23.9%) |
| Coal or Coke | 0 (0.0%) | 0 (0.0%) |
| All other Fuels | 7 (2.3%) | 0 (0.0%) |
| No Fuel Used | 0 (0.0%) | 0 (0.0%) |
| Total | 305 (100.0%) | 268 (100.0%) |
Household Vehicle Usage in West Lawn
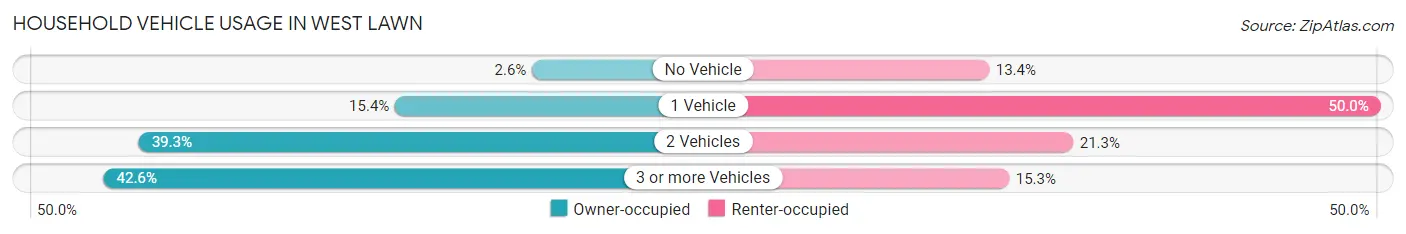
| Vehicles per Household | Owner-occupied | Renter-occupied |
| No Vehicle | 8 (2.6%) | 36 (13.4%) |
| 1 Vehicle | 47 (15.4%) | 134 (50.0%) |
| 2 Vehicles | 120 (39.3%) | 57 (21.3%) |
| 3 or more Vehicles | 130 (42.6%) | 41 (15.3%) |
| Total | 305 (100.0%) | 268 (100.0%) |
Real Estate & Mortgages in West Lawn
Real Estate and Mortgage Overview in West Lawn
| Characteristic | Without Mortgage | With Mortgage |
| Housing Units | 82 | 223 |
| Median Property Value | $146,600 | $183,900 |
| Median Household Income | $103,750 | $24 |
| Monthly Housing Costs | $741 | $0 |
| Real Estate Taxes | $3,400 | $0 |
Property Value by Mortgage Status in West Lawn
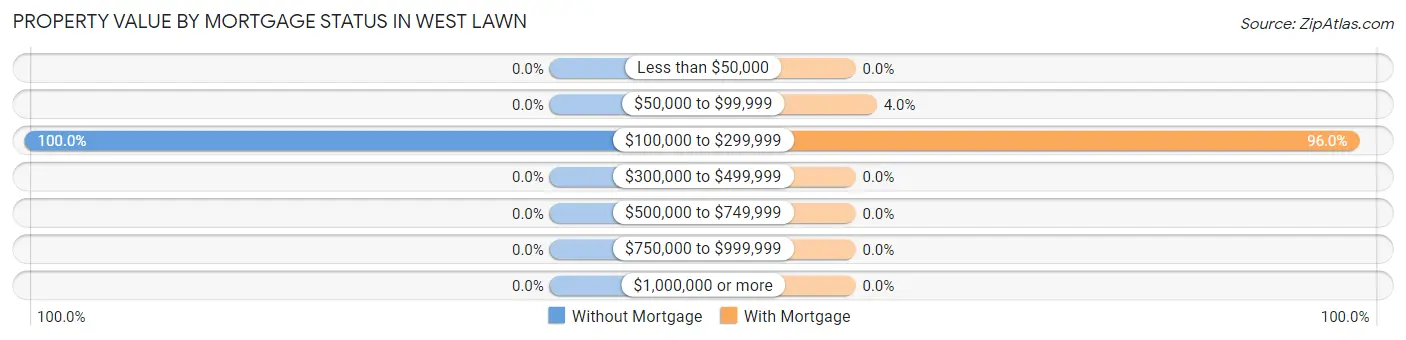
| Property Value | Without Mortgage | With Mortgage |
| Less than $50,000 | 0 (0.0%) | 0 (0.0%) |
| $50,000 to $99,999 | 0 (0.0%) | 9 (4.0%) |
| $100,000 to $299,999 | 82 (100.0%) | 214 (96.0%) |
| $300,000 to $499,999 | 0 (0.0%) | 0 (0.0%) |
| $500,000 to $749,999 | 0 (0.0%) | 0 (0.0%) |
| $750,000 to $999,999 | 0 (0.0%) | 0 (0.0%) |
| $1,000,000 or more | 0 (0.0%) | 0 (0.0%) |
| Total | 82 (100.0%) | 223 (100.0%) |
Household Income by Mortgage Status in West Lawn
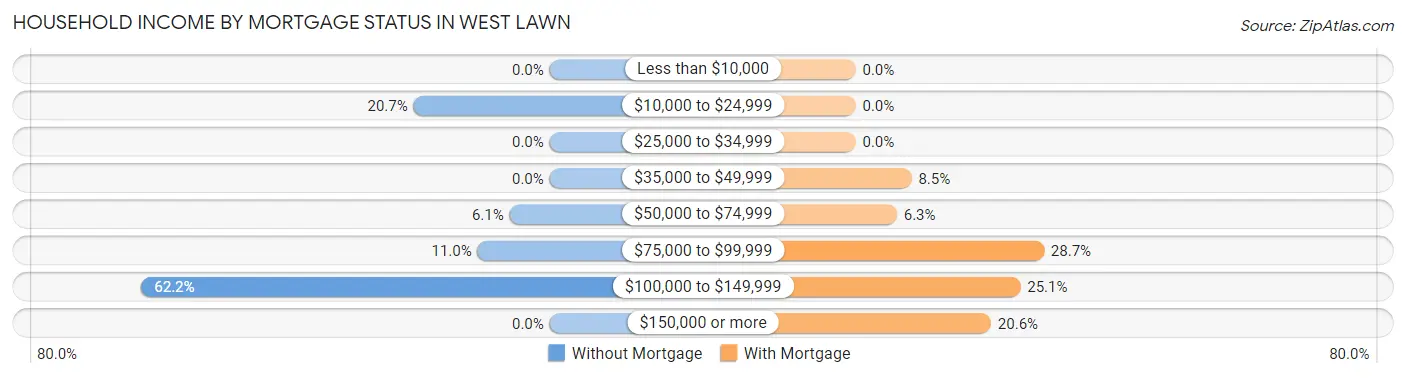
| Household Income | Without Mortgage | With Mortgage |
| Less than $10,000 | 0 (0.0%) | 0 (0.0%) |
| $10,000 to $24,999 | 17 (20.7%) | 0 (0.0%) |
| $25,000 to $34,999 | 0 (0.0%) | 0 (0.0%) |
| $35,000 to $49,999 | 0 (0.0%) | 19 (8.5%) |
| $50,000 to $74,999 | 5 (6.1%) | 14 (6.3%) |
| $75,000 to $99,999 | 9 (11.0%) | 64 (28.7%) |
| $100,000 to $149,999 | 51 (62.2%) | 56 (25.1%) |
| $150,000 or more | 0 (0.0%) | 46 (20.6%) |
| Total | 82 (100.0%) | 223 (100.0%) |
Property Value to Household Income Ratio in West Lawn
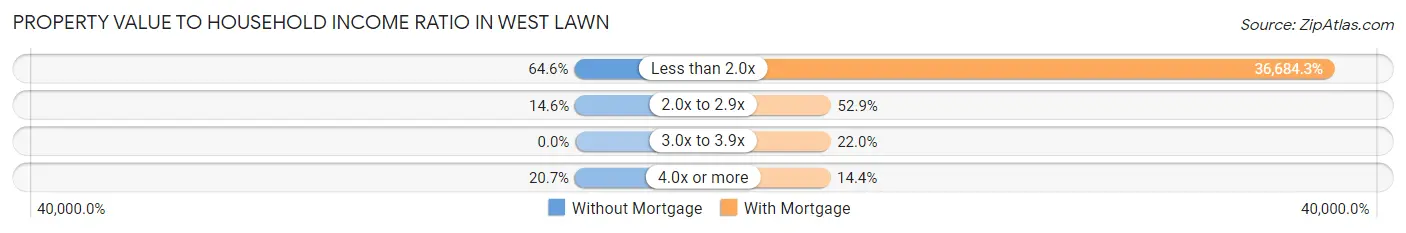
| Value-to-Income Ratio | Without Mortgage | With Mortgage |
| Less than 2.0x | 53 (64.6%) | 81,806 (36,684.3%) |
| 2.0x to 2.9x | 12 (14.6%) | 118 (52.9%) |
| 3.0x to 3.9x | 0 (0.0%) | 49 (22.0%) |
| 4.0x or more | 17 (20.7%) | 32 (14.3%) |
| Total | 82 (100.0%) | 223 (100.0%) |
Real Estate Taxes by Mortgage Status in West Lawn
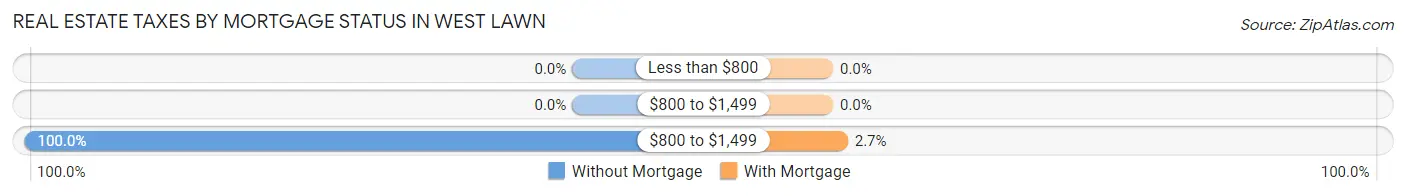
| Property Taxes | Without Mortgage | With Mortgage |
| Less than $800 | 0 (0.0%) | 0 (0.0%) |
| $800 to $1,499 | 0 (0.0%) | 0 (0.0%) |
| $800 to $1,499 | 82 (100.0%) | 6 (2.7%) |
| Total | 82 (100.0%) | 223 (100.0%) |
Health & Disability in West Lawn
Health Insurance Coverage by Age in West Lawn
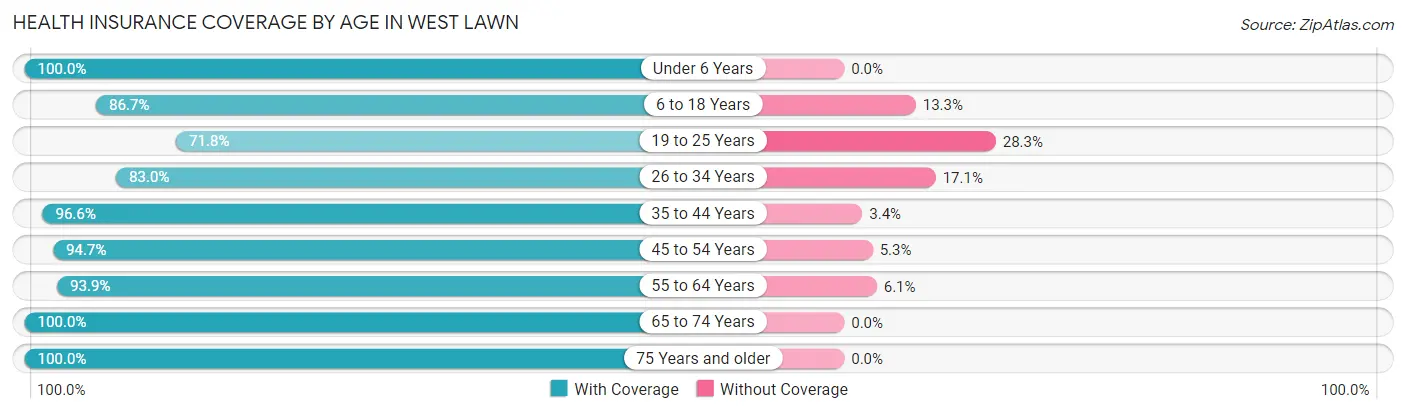
| Age Bracket | With Coverage | Without Coverage |
| Under 6 Years | 79 (100.0%) | 0 (0.0%) |
| 6 to 18 Years | 208 (86.7%) | 32 (13.3%) |
| 19 to 25 Years | 127 (71.8%) | 50 (28.2%) |
| 26 to 34 Years | 214 (83.0%) | 44 (17.1%) |
| 35 to 44 Years | 144 (96.6%) | 5 (3.4%) |
| 45 to 54 Years | 250 (94.7%) | 14 (5.3%) |
| 55 to 64 Years | 155 (93.9%) | 10 (6.1%) |
| 65 to 74 Years | 77 (100.0%) | 0 (0.0%) |
| 75 Years and older | 72 (100.0%) | 0 (0.0%) |
| Total | 1,326 (89.5%) | 155 (10.5%) |
Health Insurance Coverage by Citizenship Status in West Lawn
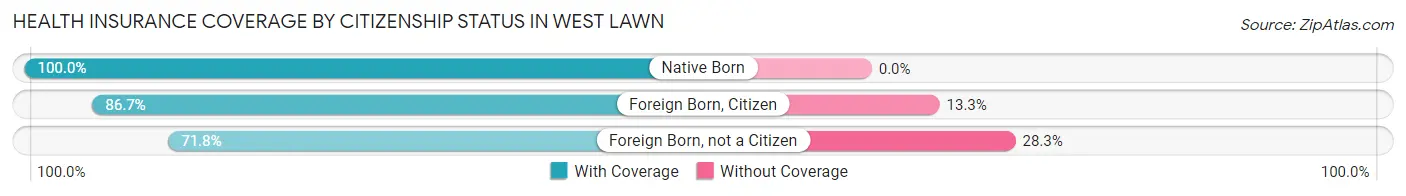
| Citizenship Status | With Coverage | Without Coverage |
| Native Born | 79 (100.0%) | 0 (0.0%) |
| Foreign Born, Citizen | 208 (86.7%) | 32 (13.3%) |
| Foreign Born, not a Citizen | 127 (71.8%) | 50 (28.2%) |
Health Insurance Coverage by Household Income in West Lawn
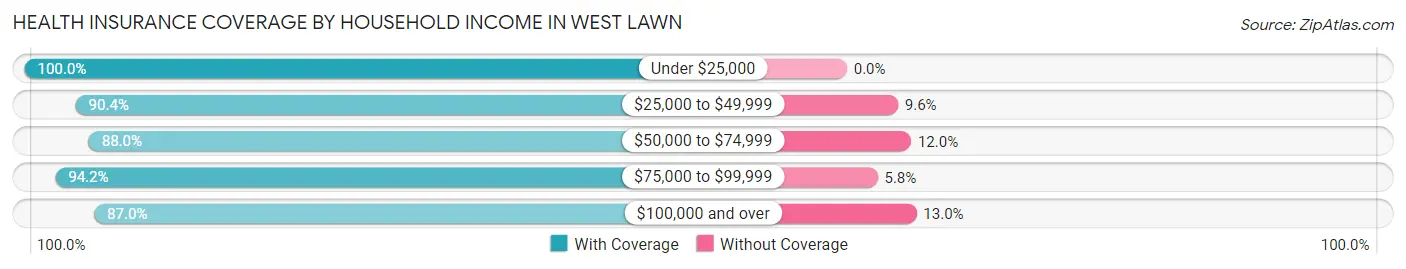
| Household Income | With Coverage | Without Coverage |
| Under $25,000 | 52 (100.0%) | 0 (0.0%) |
| $25,000 to $49,999 | 170 (90.4%) | 18 (9.6%) |
| $50,000 to $74,999 | 395 (88.0%) | 54 (12.0%) |
| $75,000 to $99,999 | 262 (94.2%) | 16 (5.8%) |
| $100,000 and over | 447 (87.0%) | 67 (13.0%) |
Public vs Private Health Insurance Coverage by Age in West Lawn
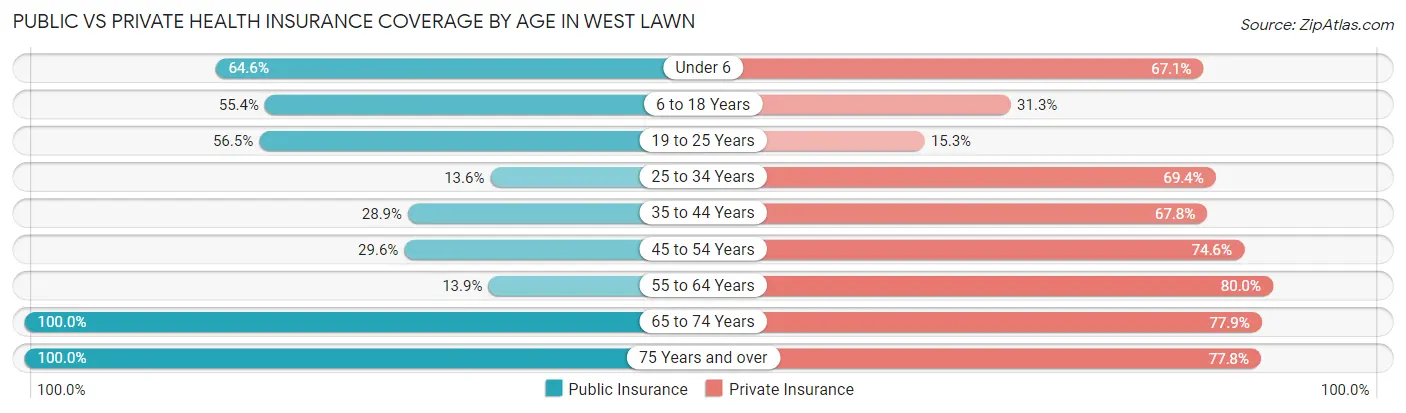
| Age Bracket | Public Insurance | Private Insurance |
| Under 6 | 51 (64.6%) | 53 (67.1%) |
| 6 to 18 Years | 133 (55.4%) | 75 (31.2%) |
| 19 to 25 Years | 100 (56.5%) | 27 (15.2%) |
| 25 to 34 Years | 35 (13.6%) | 179 (69.4%) |
| 35 to 44 Years | 43 (28.9%) | 101 (67.8%) |
| 45 to 54 Years | 78 (29.5%) | 197 (74.6%) |
| 55 to 64 Years | 23 (13.9%) | 132 (80.0%) |
| 65 to 74 Years | 77 (100.0%) | 60 (77.9%) |
| 75 Years and over | 72 (100.0%) | 56 (77.8%) |
| Total | 612 (41.3%) | 880 (59.4%) |
Disability Status by Sex by Age in West Lawn
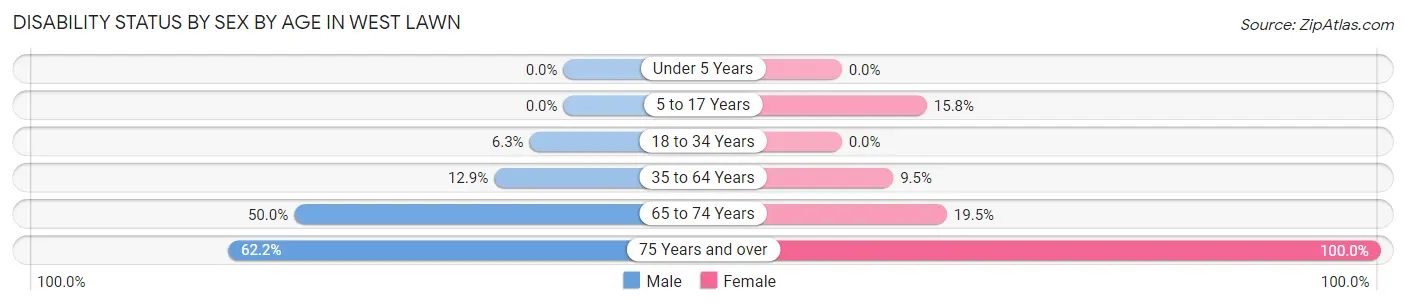
| Age Bracket | Male | Female |
| Under 5 Years | 0 (0.0%) | 0 (0.0%) |
| 5 to 17 Years | 0 (0.0%) | 27 (15.8%) |
| 18 to 34 Years | 18 (6.3%) | 0 (0.0%) |
| 35 to 64 Years | 38 (12.9%) | 27 (9.5%) |
| 65 to 74 Years | 18 (50.0%) | 8 (19.5%) |
| 75 Years and over | 28 (62.2%) | 27 (100.0%) |
Disability Class by Sex by Age in West Lawn
Disability Class: Hearing Difficulty
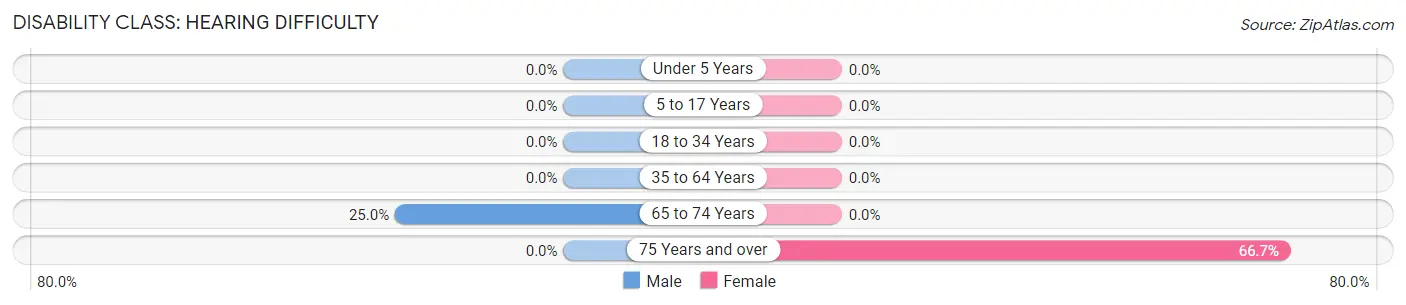
| Age Bracket | Male | Female |
| Under 5 Years | 0 (0.0%) | 0 (0.0%) |
| 5 to 17 Years | 0 (0.0%) | 0 (0.0%) |
| 18 to 34 Years | 0 (0.0%) | 0 (0.0%) |
| 35 to 64 Years | 0 (0.0%) | 0 (0.0%) |
| 65 to 74 Years | 9 (25.0%) | 0 (0.0%) |
| 75 Years and over | 0 (0.0%) | 18 (66.7%) |
Disability Class: Vision Difficulty
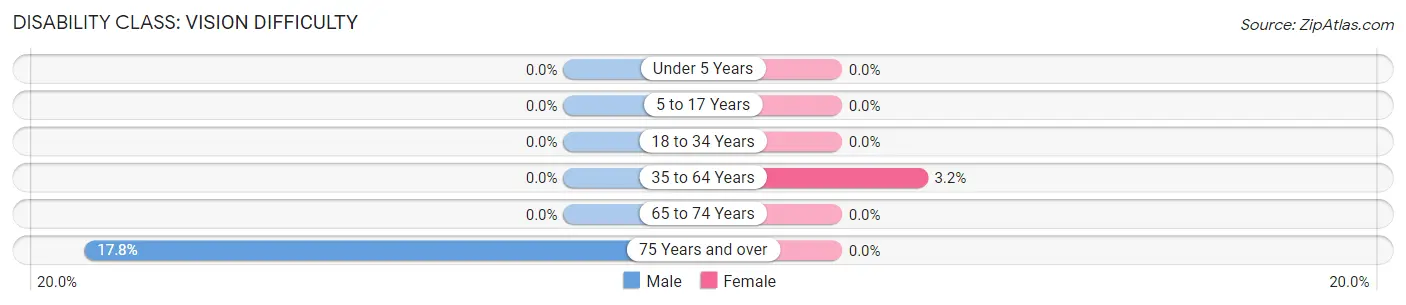
| Age Bracket | Male | Female |
| Under 5 Years | 0 (0.0%) | 0 (0.0%) |
| 5 to 17 Years | 0 (0.0%) | 0 (0.0%) |
| 18 to 34 Years | 0 (0.0%) | 0 (0.0%) |
| 35 to 64 Years | 0 (0.0%) | 9 (3.2%) |
| 65 to 74 Years | 0 (0.0%) | 0 (0.0%) |
| 75 Years and over | 8 (17.8%) | 0 (0.0%) |
Disability Class: Cognitive Difficulty
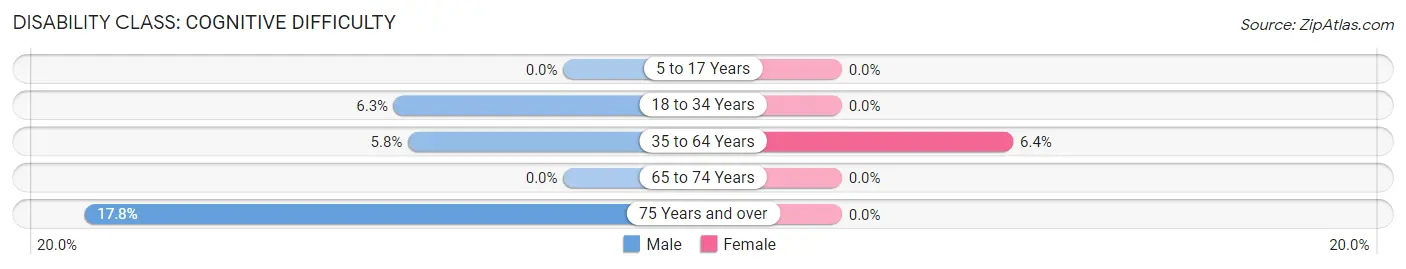
| Age Bracket | Male | Female |
| 5 to 17 Years | 0 (0.0%) | 0 (0.0%) |
| 18 to 34 Years | 18 (6.3%) | 0 (0.0%) |
| 35 to 64 Years | 17 (5.8%) | 18 (6.4%) |
| 65 to 74 Years | 0 (0.0%) | 0 (0.0%) |
| 75 Years and over | 8 (17.8%) | 0 (0.0%) |
Disability Class: Ambulatory Difficulty
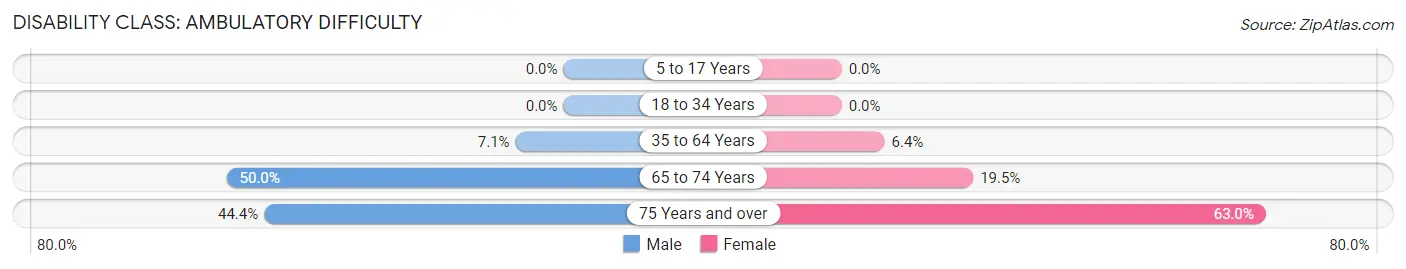
| Age Bracket | Male | Female |
| 5 to 17 Years | 0 (0.0%) | 0 (0.0%) |
| 18 to 34 Years | 0 (0.0%) | 0 (0.0%) |
| 35 to 64 Years | 21 (7.1%) | 18 (6.4%) |
| 65 to 74 Years | 18 (50.0%) | 8 (19.5%) |
| 75 Years and over | 20 (44.4%) | 17 (63.0%) |
Disability Class: Self-Care Difficulty
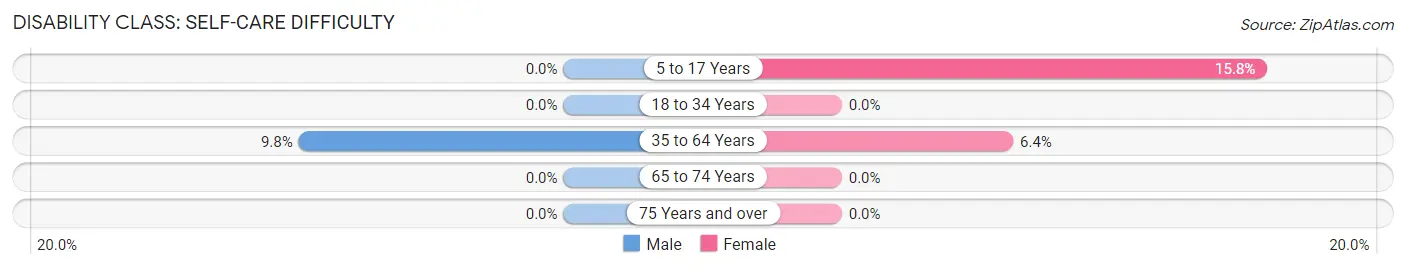
| Age Bracket | Male | Female |
| 5 to 17 Years | 0 (0.0%) | 27 (15.8%) |
| 18 to 34 Years | 0 (0.0%) | 0 (0.0%) |
| 35 to 64 Years | 29 (9.8%) | 18 (6.4%) |
| 65 to 74 Years | 0 (0.0%) | 0 (0.0%) |
| 75 Years and over | 0 (0.0%) | 0 (0.0%) |
Technology Access in West Lawn
Computing Device Access in West Lawn
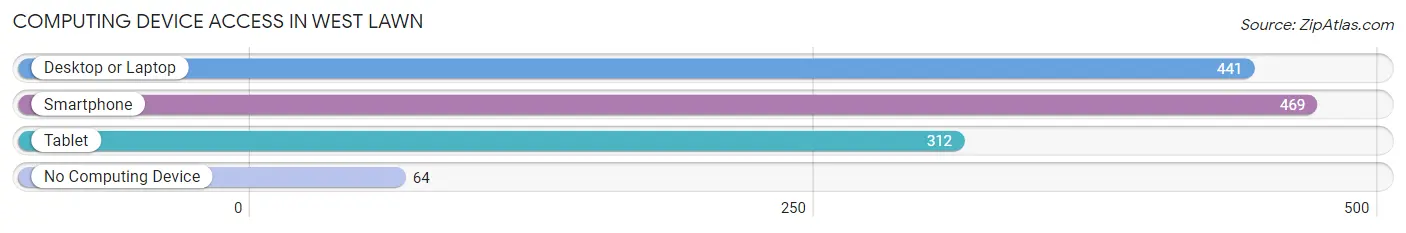
| Device Type | # Households | % Households |
| Desktop or Laptop | 441 | 77.0% |
| Smartphone | 469 | 81.9% |
| Tablet | 312 | 54.4% |
| No Computing Device | 64 | 11.2% |
| Total | 573 | 100.0% |
Internet Access in West Lawn
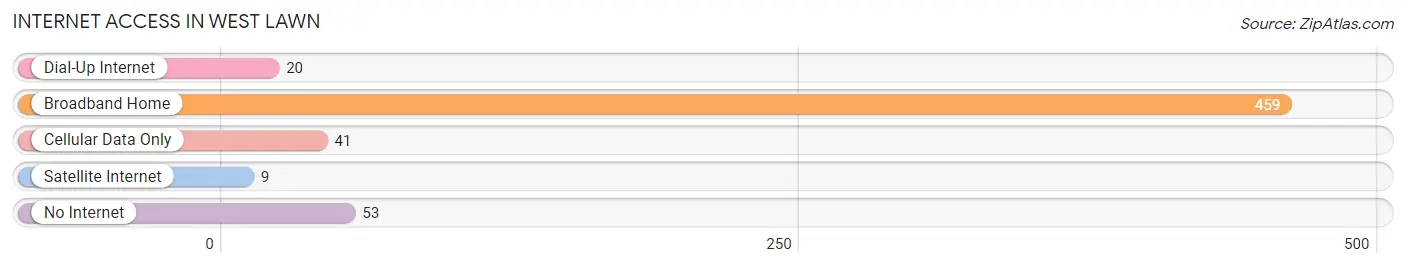
| Internet Type | # Households | % Households |
| Dial-Up Internet | 20 | 3.5% |
| Broadband Home | 459 | 80.1% |
| Cellular Data Only | 41 | 7.2% |
| Satellite Internet | 9 | 1.6% |
| No Internet | 53 | 9.2% |
| Total | 573 | 100.0% |
West Lawn Summary
History
West Lawn, Pennsylvania is a small borough located in Berks County, Pennsylvania. It is situated in the southeastern corner of the county, just north of the city of Reading. The borough was incorporated in 1891 and is home to approximately 4,000 people.
West Lawn has a rich history that dates back to the early 1700s. The area was originally inhabited by the Lenape Indians, who were later displaced by European settlers. The first settlers in the area were German immigrants who arrived in the late 1700s. They established farms and businesses, and the area quickly grew.
In the early 1800s, the area was known as “West Lawn” due to its location on the western side of the Schuylkill River. The name was officially adopted in 1891 when the borough was incorporated.
Geography
West Lawn is located in southeastern Berks County, Pennsylvania. It is situated just north of the city of Reading and is bordered by the boroughs of Wyomissing, Shillington, and Sinking Spring. The borough is situated on a hillside and is surrounded by rolling hills and farmland.
The borough covers an area of 1.2 square miles and is home to approximately 4,000 people. The terrain is mostly flat, with some hills and valleys. The climate is temperate, with hot summers and cold winters.
Economy
West Lawn’s economy is largely based on agriculture and manufacturing. The borough is home to several small businesses, including a few restaurants, a grocery store, and a hardware store. The borough also has a few small industrial parks, which are home to a variety of businesses.
The borough is also home to several large employers, including the Reading Hospital and Medical Center, the Reading School District, and the Reading Public Library. The borough is also home to several small businesses, including a few restaurants, a grocery store, and a hardware store.
Demographics
As of the 2010 census, West Lawn had a population of 4,000 people. The racial makeup of the borough was 94.2% White, 2.2% African American, 0.7% Asian, 0.3% Native American, and 2.6% from other races. The median household income was $50,000, and the median family income was $60,000.
The population of West Lawn is largely made up of families. The borough is home to several churches, a library, and a few parks. The borough also has a few schools, including a public elementary school and a private high school.
Conclusion
West Lawn, Pennsylvania is a small borough located in Berks County, Pennsylvania. It is situated in the southeastern corner of the county, just north of the city of Reading. The borough was incorporated in 1891 and is home to approximately 4,000 people. West Lawn has a rich history that dates back to the early 1700s, and its economy is largely based on agriculture and manufacturing. The population of West Lawn is largely made up of families, and the borough is home to several churches, a library, and a few parks.
Common Questions
What is Per Capita Income in West Lawn?
Per Capita income in West Lawn is $31,778.
What is the Median Family Income in West Lawn?
Median Family Income in West Lawn is $94,348.
What is the Median Household income in West Lawn?
Median Household Income in West Lawn is $65,750.
What is Income or Wage Gap in West Lawn?
Income or Wage Gap in West Lawn is 1.1%.
Women in West Lawn earn 98.9 cents for every dollar earned by a man.
What is Inequality or Gini Index in West Lawn?
Inequality or Gini Index in West Lawn is 0.32.
What is the Total Population of West Lawn?
Total Population of West Lawn is 1,481.
What is the Total Male Population of West Lawn?
Total Male Population of West Lawn is 789.
What is the Total Female Population of West Lawn?
Total Female Population of West Lawn is 692.
What is the Ratio of Males per 100 Females in West Lawn?
There are 114.02 Males per 100 Females in West Lawn.
What is the Ratio of Females per 100 Males in West Lawn?
There are 87.71 Females per 100 Males in West Lawn.
What is the Median Population Age in West Lawn?
Median Population Age in West Lawn is 34.9 Years.
What is the Average Family Size in West Lawn
Average Family Size in West Lawn is 3.1 People.
What is the Average Household Size in West Lawn
Average Household Size in West Lawn is 2.6 People.
How Large is the Labor Force in West Lawn?
There are 869 People in the Labor Forcein in West Lawn.
What is the Percentage of People in the Labor Force in West Lawn?
72.5% of People are in the Labor Force in West Lawn.
What is the Unemployment Rate in West Lawn?
Unemployment Rate in West Lawn is 7.9%.