Shenandoah borough, PA Map & Demographics
Shenandoah borough Overview
$25,799
PER CAPITA INCOME
$42,245
AVG FAMILY INCOME
$40,435
AVG HOUSEHOLD INCOME
45.3%
WAGE / INCOME GAP [ % ]
54.7¢/ $1
WAGE / INCOME GAP [ $ ]
$10,639
FAMILY INCOME DEFICIT
0.53
INEQUALITY / GINI INDEX
4,288
TOTAL POPULATION
2,384
MALE POPULATION
1,904
FEMALE POPULATION
125.21
MALES / 100 FEMALES
79.87
FEMALES / 100 MALES
32.9
MEDIAN AGE
3.5
AVG FAMILY SIZE
2.5
AVG HOUSEHOLD SIZE
1,544
LABOR FORCE [ PEOPLE ]
50.1%
PERCENT IN LABOR FORCE
11.8%
UNEMPLOYMENT RATE
Income in Shenandoah borough
Income Overview in Shenandoah borough
Per Capita Income in Shenandoah borough is $25,799, while median incomes of families and households are $42,245 and $40,435 respectively.
| Characteristic | Number | Measure |
| Per Capita Income | 4,288 | $25,799 |
| Median Family Income | 899 | $42,245 |
| Mean Family Income | 899 | $69,638 |
| Median Household Income | 1,627 | $40,435 |
| Mean Household Income | 1,627 | $63,461 |
| Income Deficit | 899 | $10,639 |
| Wage / Income Gap (%) | 4,288 | 45.34% |
| Wage / Income Gap ($) | 4,288 | 54.66¢ per $1 |
| Gini / Inequality Index | 4,288 | 0.53 |
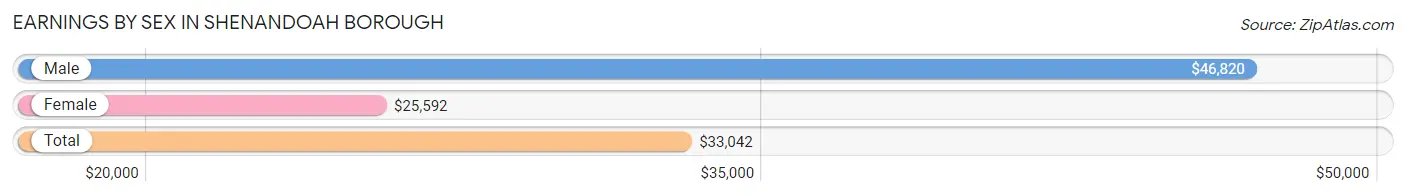
Earnings by Sex in Shenandoah borough
Average Earnings in Shenandoah borough are $33,042, $46,820 for men and $25,592 for women, a difference of 45.3%.
| Sex | Number | Average Earnings |
| Male | 855 (54.0%) | $46,820 |
| Female | 727 (46.0%) | $25,592 |
| Total | 1,582 (100.0%) | $33,042 |
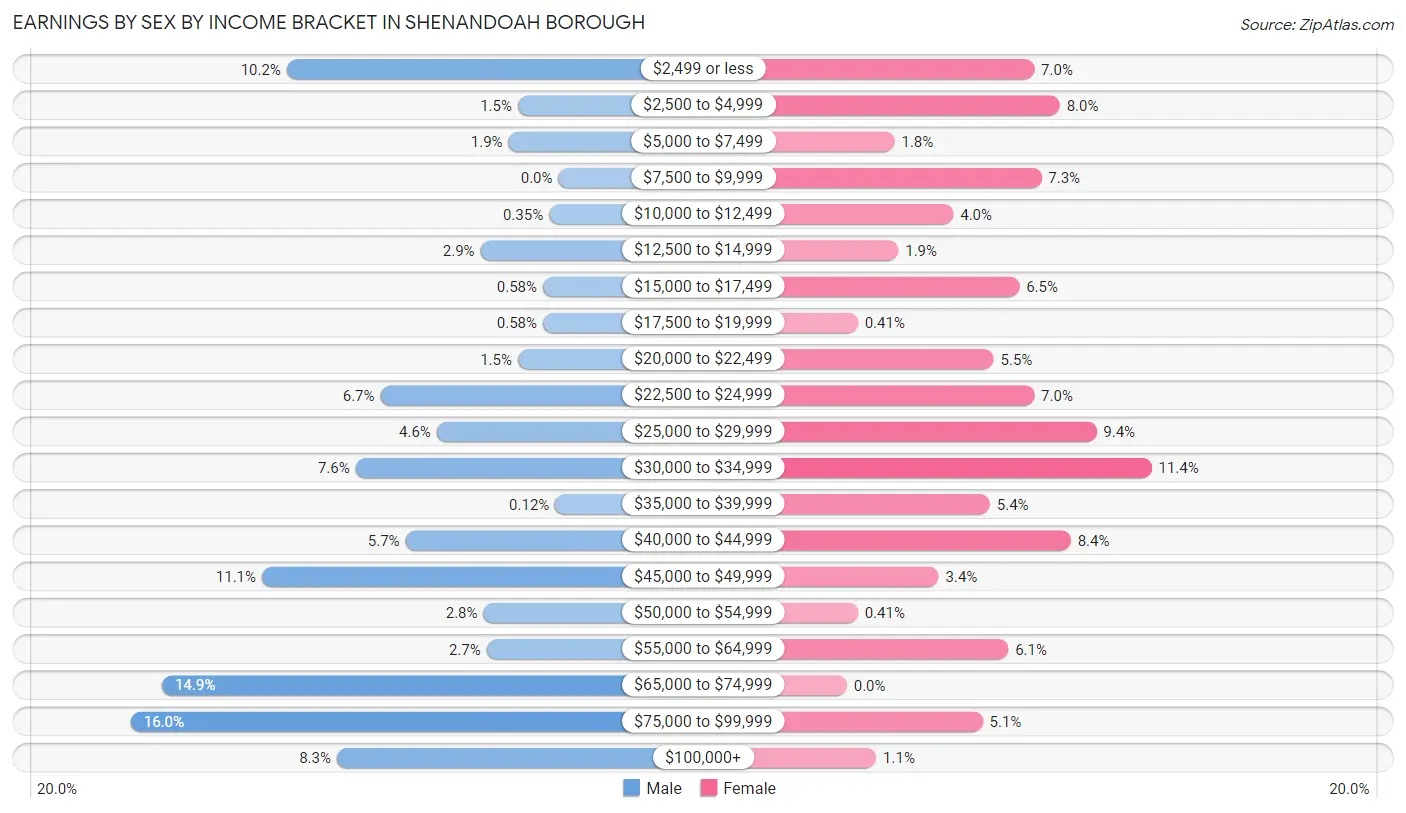
Earnings by Sex by Income Bracket in Shenandoah borough
The most common earnings brackets in Shenandoah borough are $75,000 to $99,999 for men (137 | 16.0%) and $30,000 to $34,999 for women (83 | 11.4%).
| Income | Male | Female |
| $2,499 or less | 87 (10.2%) | 51 (7.0%) |
| $2,500 to $4,999 | 13 (1.5%) | 58 (8.0%) |
| $5,000 to $7,499 | 16 (1.9%) | 13 (1.8%) |
| $7,500 to $9,999 | 0 (0.0%) | 53 (7.3%) |
| $10,000 to $12,499 | 3 (0.4%) | 29 (4.0%) |
| $12,500 to $14,999 | 25 (2.9%) | 14 (1.9%) |
| $15,000 to $17,499 | 5 (0.6%) | 47 (6.5%) |
| $17,500 to $19,999 | 5 (0.6%) | 3 (0.4%) |
| $20,000 to $22,499 | 13 (1.5%) | 40 (5.5%) |
| $22,500 to $24,999 | 57 (6.7%) | 51 (7.0%) |
| $25,000 to $29,999 | 39 (4.6%) | 68 (9.3%) |
| $30,000 to $34,999 | 65 (7.6%) | 83 (11.4%) |
| $35,000 to $39,999 | 1 (0.1%) | 39 (5.4%) |
| $40,000 to $44,999 | 49 (5.7%) | 61 (8.4%) |
| $45,000 to $49,999 | 95 (11.1%) | 25 (3.4%) |
| $50,000 to $54,999 | 24 (2.8%) | 3 (0.4%) |
| $55,000 to $64,999 | 23 (2.7%) | 44 (6.0%) |
| $65,000 to $74,999 | 127 (14.8%) | 0 (0.0%) |
| $75,000 to $99,999 | 137 (16.0%) | 37 (5.1%) |
| $100,000+ | 71 (8.3%) | 8 (1.1%) |
| Total | 855 (100.0%) | 727 (100.0%) |
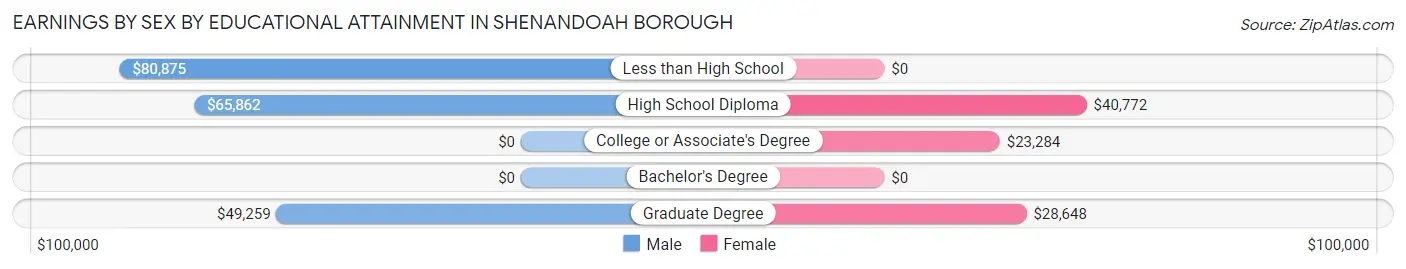
Earnings by Sex by Educational Attainment in Shenandoah borough
Average earnings in Shenandoah borough are $56,250 for men and $29,439 for women, a difference of 47.7%. Men with an educational attainment of less than high school enjoy the highest average annual earnings of $80,875, while those with graduate degree education earn the least with $49,259. Women with an educational attainment of high school diploma earn the most with the average annual earnings of $40,772, while those with college or associate's degree education have the smallest earnings of $23,284.
| Educational Attainment | Male Income | Female Income |
| Less than High School | $80,875 | $0 |
| High School Diploma | $65,862 | $40,772 |
| College or Associate's Degree | - | - |
| Bachelor's Degree | - | - |
| Graduate Degree | $49,259 | $28,648 |
| Total | $56,250 | $29,439 |
Family Income in Shenandoah borough
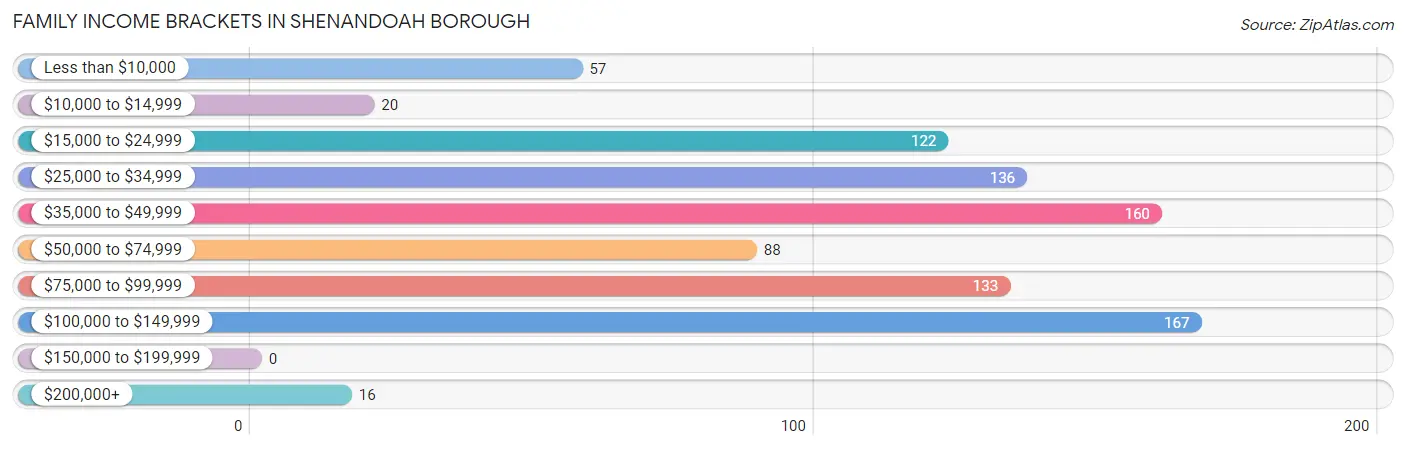
Family Income Brackets in Shenandoah borough
According to the Shenandoah borough family income data, there are 167 families falling into the $100,000 to $149,999 income range, which is the most common income bracket and makes up 18.6% of all families.
| Income Bracket | # Families | % Families |
| Less than $10,000 | 57 | 6.3% |
| $10,000 to $14,999 | 20 | 2.2% |
| $15,000 to $24,999 | 122 | 13.6% |
| $25,000 to $34,999 | 136 | 15.1% |
| $35,000 to $49,999 | 160 | 17.8% |
| $50,000 to $74,999 | 88 | 9.8% |
| $75,000 to $99,999 | 133 | 14.8% |
| $100,000 to $149,999 | 167 | 18.6% |
| $150,000 to $199,999 | 0 | 0.0% |
| $200,000+ | 16 | 1.8% |
Family Income by Famaliy Size in Shenandoah borough
4-person families (110 | 12.2%) account for the highest median family income in Shenandoah borough with $82,976 per family, while 2-person families (514 | 57.2%) have the highest median income of $21,193 per family member.
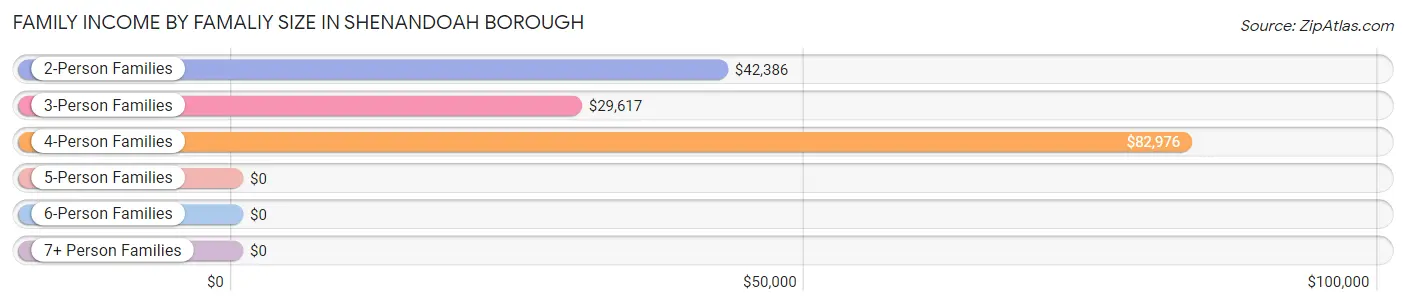
| Income Bracket | # Families | Median Income |
| 2-Person Families | 514 (57.2%) | $42,386 |
| 3-Person Families | 181 (20.1%) | $29,617 |
| 4-Person Families | 110 (12.2%) | $82,976 |
| 5-Person Families | 53 (5.9%) | $0 |
| 6-Person Families | 9 (1.0%) | $0 |
| 7+ Person Families | 32 (3.6%) | $0 |
| Total | 899 (100.0%) | $42,245 |
Family Income by Number of Earners in Shenandoah borough
The median family income in Shenandoah borough is $42,245, with families comprising 3+ earners (51) having the highest median family income of $94,438, while families with no earners (192) have the lowest median family income of $25,250, accounting for 5.7% and 21.4% of families, respectively.
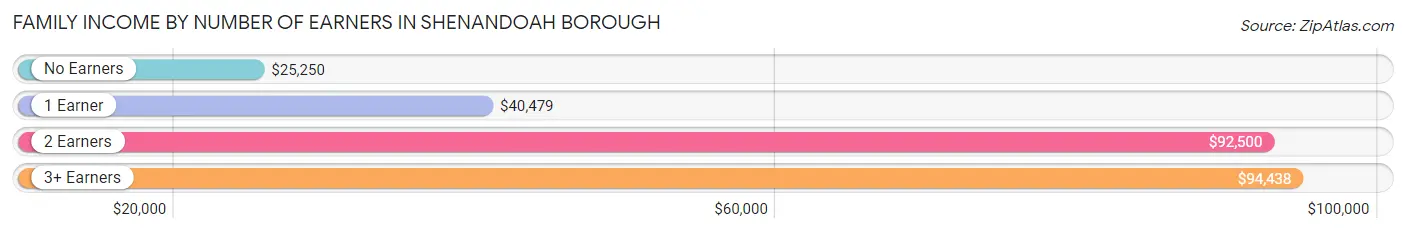
| Number of Earners | # Families | Median Income |
| No Earners | 192 (21.4%) | $25,250 |
| 1 Earner | 416 (46.3%) | $40,479 |
| 2 Earners | 240 (26.7%) | $92,500 |
| 3+ Earners | 51 (5.7%) | $94,438 |
| Total | 899 (100.0%) | $42,245 |
Household Income in Shenandoah borough
Household Income Brackets in Shenandoah borough
With 303 households falling in the category, the $35,000 to $49,999 income range is the most frequent in Shenandoah borough, accounting for 18.6% of all households.
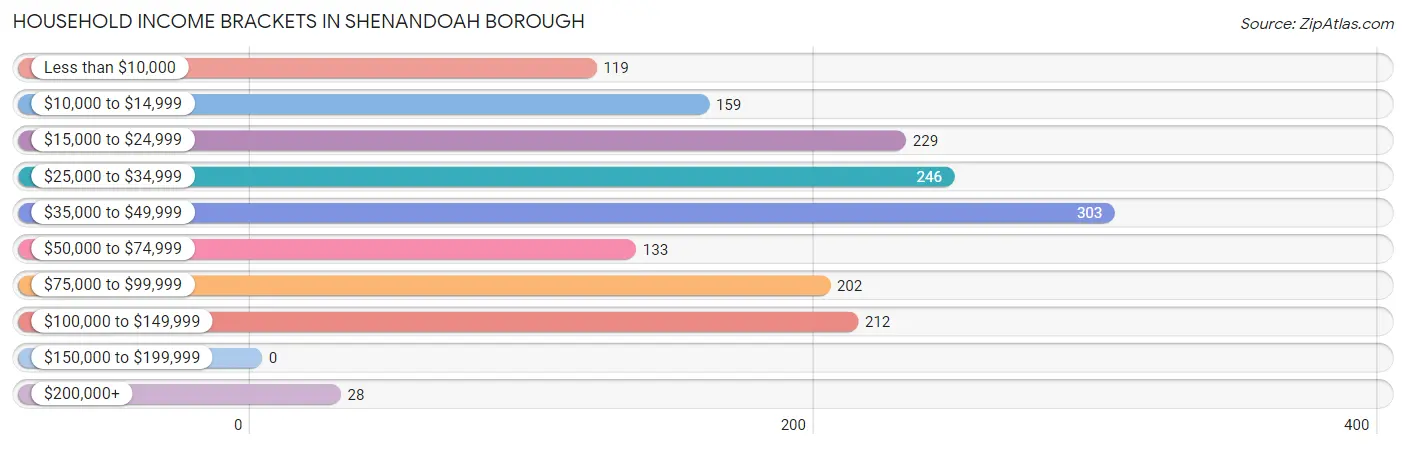
| Income Bracket | # Households | % Households |
| Less than $10,000 | 119 | 7.3% |
| $10,000 to $14,999 | 159 | 9.8% |
| $15,000 to $24,999 | 229 | 14.1% |
| $25,000 to $34,999 | 246 | 15.1% |
| $35,000 to $49,999 | 303 | 18.6% |
| $50,000 to $74,999 | 133 | 8.2% |
| $75,000 to $99,999 | 202 | 12.4% |
| $100,000 to $149,999 | 212 | 13.0% |
| $150,000 to $199,999 | 0 | 0.0% |
| $200,000+ | 28 | 1.7% |
Household Income by Householder Age in Shenandoah borough
The median household income in Shenandoah borough is $40,435, with the highest median household income of $46,304 found in the 45 to 64 years age bracket for the primary householder. A total of 650 households (40.0%) fall into this category. Meanwhile, the 15 to 24 years age bracket for the primary householder has the lowest median household income of $0, with 24 households (1.5%) in this group.
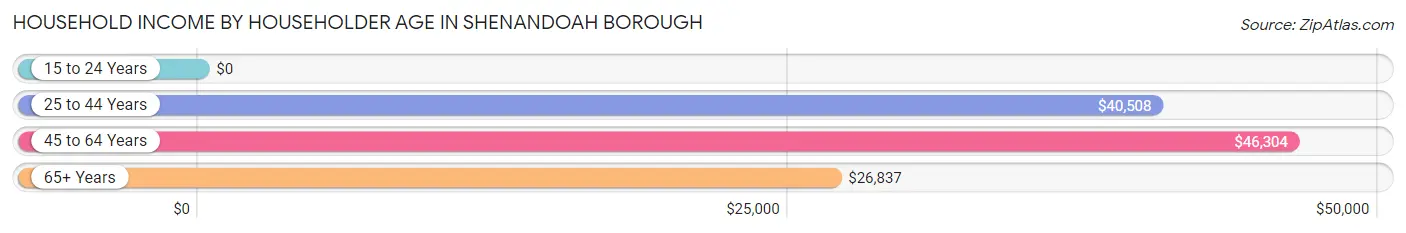
| Income Bracket | # Households | Median Income |
| 15 to 24 Years | 24 (1.5%) | $0 |
| 25 to 44 Years | 479 (29.4%) | $40,508 |
| 45 to 64 Years | 650 (40.0%) | $46,304 |
| 65+ Years | 474 (29.1%) | $26,837 |
| Total | 1,627 (100.0%) | $40,435 |
Poverty in Shenandoah borough
Income Below Poverty by Sex and Age in Shenandoah borough
With 34.1% poverty level for males and 26.1% for females among the residents of Shenandoah borough, 5 year old males and under 5 year old females are the most vulnerable to poverty, with 244 males (94.6%) and 51 females (54.3%) in their respective age groups living below the poverty level.
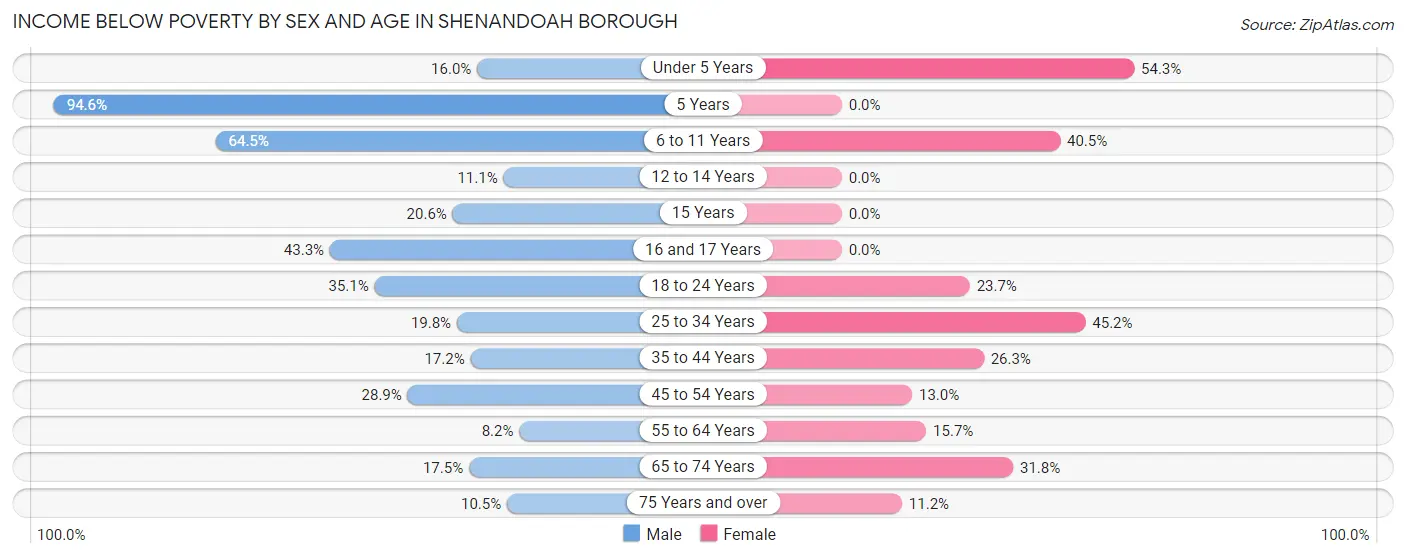
| Age Bracket | Male | Female |
| Under 5 Years | 12 (16.0%) | 51 (54.3%) |
| 5 Years | 244 (94.6%) | 0 (0.0%) |
| 6 to 11 Years | 202 (64.5%) | 79 (40.5%) |
| 12 to 14 Years | 15 (11.1%) | 0 (0.0%) |
| 15 Years | 15 (20.5%) | 0 (0.0%) |
| 16 and 17 Years | 13 (43.3%) | 0 (0.0%) |
| 18 to 24 Years | 68 (35.0%) | 52 (23.7%) |
| 25 to 34 Years | 62 (19.8%) | 85 (45.2%) |
| 35 to 44 Years | 35 (17.2%) | 54 (26.3%) |
| 45 to 54 Years | 74 (28.9%) | 30 (13.0%) |
| 55 to 64 Years | 22 (8.2%) | 26 (15.7%) |
| 65 to 74 Years | 24 (17.5%) | 62 (31.8%) |
| 75 Years and over | 7 (10.4%) | 25 (11.2%) |
| Total | 793 (34.1%) | 464 (26.1%) |
Income Above Poverty by Sex and Age in Shenandoah borough
According to the poverty statistics in Shenandoah borough, males aged 55 to 64 years and females aged 12 to 14 years are the age groups that are most secure financially, with 91.8% of males and 100.0% of females in these age groups living above the poverty line.
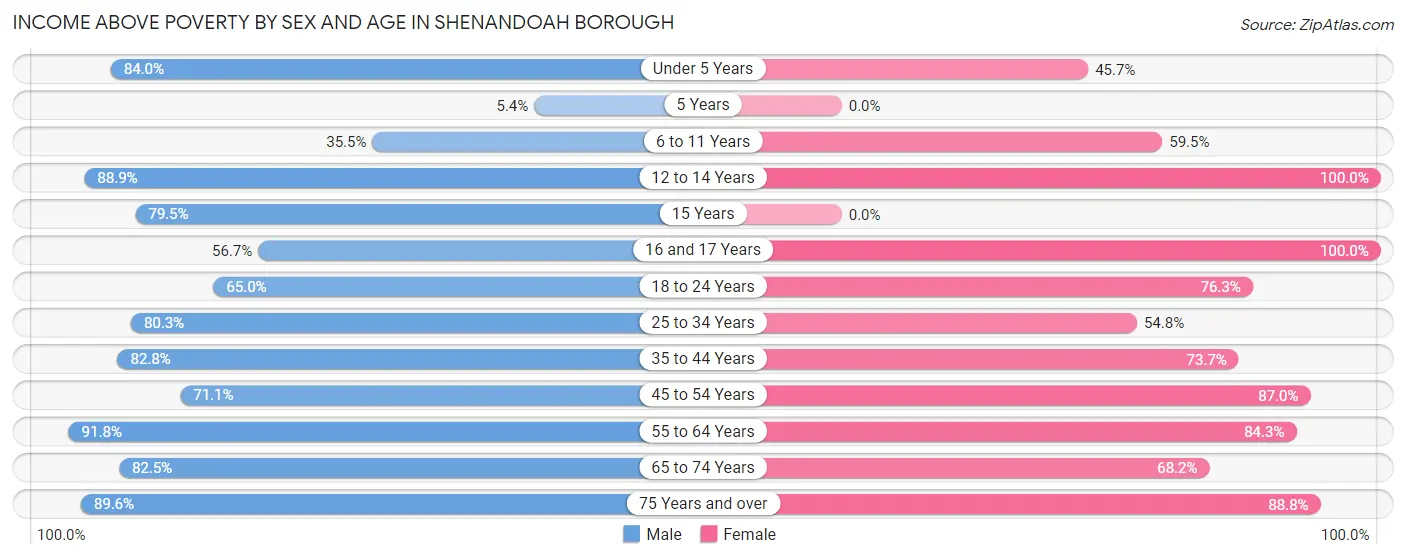
| Age Bracket | Male | Female |
| Under 5 Years | 63 (84.0%) | 43 (45.7%) |
| 5 Years | 14 (5.4%) | 0 (0.0%) |
| 6 to 11 Years | 111 (35.5%) | 116 (59.5%) |
| 12 to 14 Years | 120 (88.9%) | 38 (100.0%) |
| 15 Years | 58 (79.4%) | 0 (0.0%) |
| 16 and 17 Years | 17 (56.7%) | 26 (100.0%) |
| 18 to 24 Years | 126 (64.9%) | 167 (76.3%) |
| 25 to 34 Years | 252 (80.2%) | 103 (54.8%) |
| 35 to 44 Years | 168 (82.8%) | 151 (73.7%) |
| 45 to 54 Years | 182 (71.1%) | 200 (87.0%) |
| 55 to 64 Years | 247 (91.8%) | 140 (84.3%) |
| 65 to 74 Years | 113 (82.5%) | 133 (68.2%) |
| 75 Years and over | 60 (89.5%) | 199 (88.8%) |
| Total | 1,531 (65.9%) | 1,316 (73.9%) |
Income Below Poverty Among Married-Couple Families in Shenandoah borough
The poverty statistics for married-couple families in Shenandoah borough show that 18.3% or 68 of the total 372 families live below the poverty line. Families with 3 or 4 children have the highest poverty rate of 76.9%, comprising of 30 families. On the other hand, families with 5 or more children have the lowest poverty rate of 0.0%, which includes 0 families.
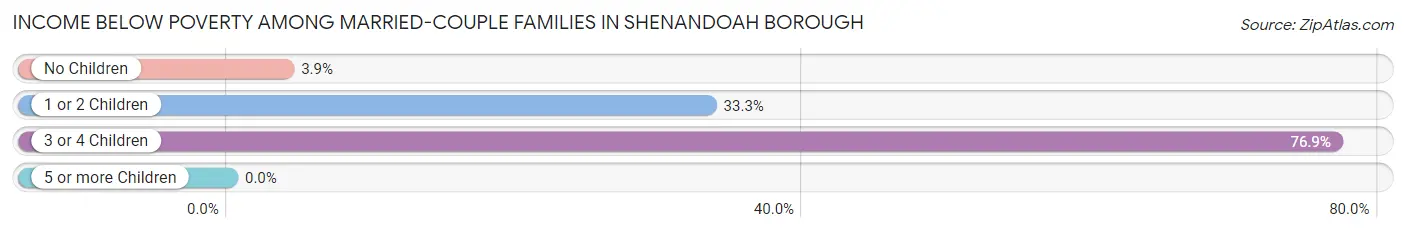
| Children | Above Poverty | Below Poverty |
| No Children | 221 (96.1%) | 9 (3.9%) |
| 1 or 2 Children | 58 (66.7%) | 29 (33.3%) |
| 3 or 4 Children | 9 (23.1%) | 30 (76.9%) |
| 5 or more Children | 16 (100.0%) | 0 (0.0%) |
| Total | 304 (81.7%) | 68 (18.3%) |
Income Below Poverty Among Single-Parent Households in Shenandoah borough
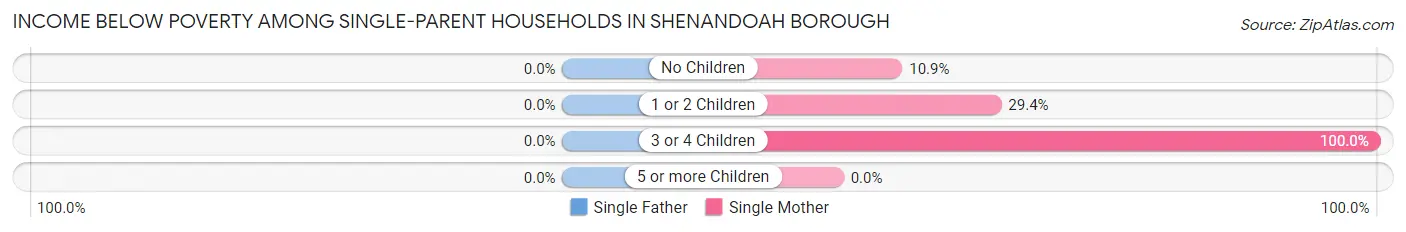
| Children | Single Father | Single Mother |
| No Children | 0 (0.0%) | 13 (10.9%) |
| 1 or 2 Children | 0 (0.0%) | 62 (29.4%) |
| 3 or 4 Children | 0 (0.0%) | 17 (100.0%) |
| 5 or more Children | 0 (0.0%) | 0 (0.0%) |
| Total | 0 (0.0%) | 92 (26.5%) |
Income Below Poverty Among Married-Couple vs Single-Parent Households in Shenandoah borough
The poverty data for Shenandoah borough shows that 68 of the married-couple family households (18.3%) and 92 of the single-parent households (17.5%) are living below the poverty level. Within the married-couple family households, those with 3 or 4 children have the highest poverty rate, with 30 households (76.9%) falling below the poverty line. Among the single-parent households, those with 3 or 4 children have the highest poverty rate, with 17 household (100.0%) living below poverty.
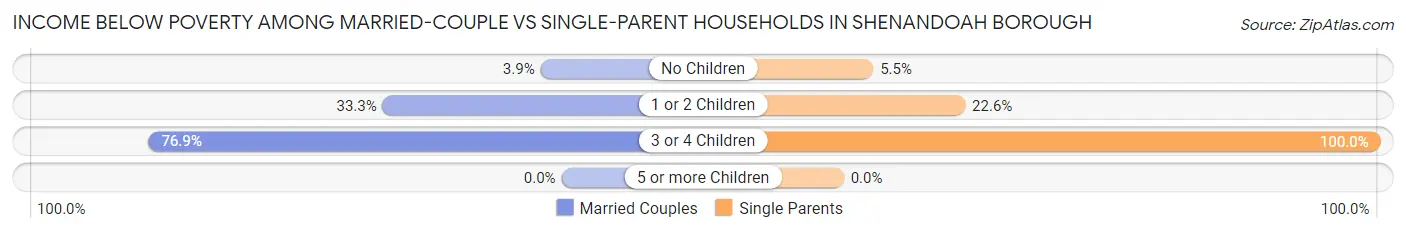
| Children | Married-Couple Families | Single-Parent Households |
| No Children | 9 (3.9%) | 13 (5.5%) |
| 1 or 2 Children | 29 (33.3%) | 62 (22.6%) |
| 3 or 4 Children | 30 (76.9%) | 17 (100.0%) |
| 5 or more Children | 0 (0.0%) | 0 (0.0%) |
| Total | 68 (18.3%) | 92 (17.5%) |
Race in Shenandoah borough
The most populous races in Shenandoah borough are White / Caucasian (2,954 | 68.9%), Hispanic or Latino (1,562 | 36.4%), and Some other Race (815 | 19.0%).
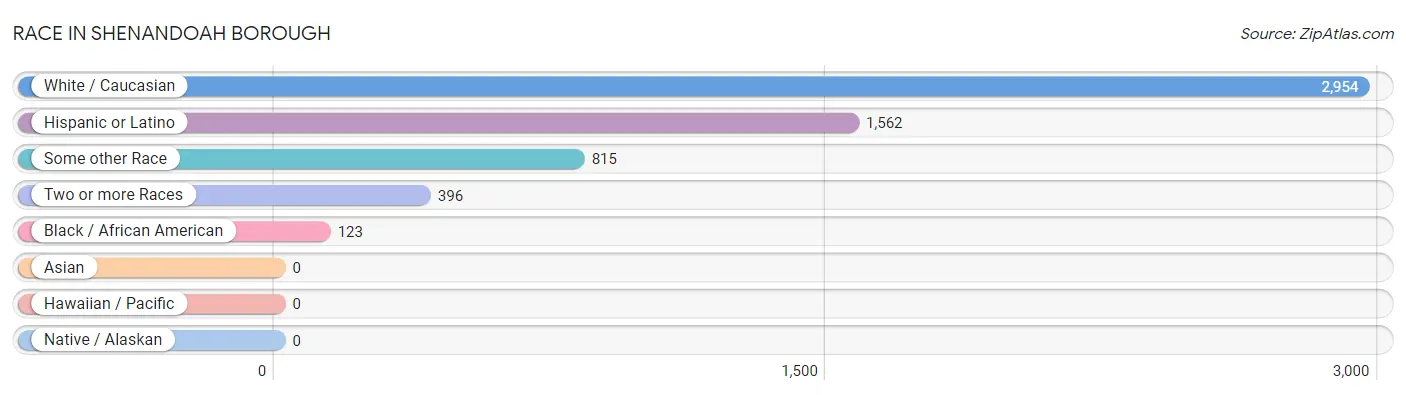
| Race | # Population | % Population |
| Asian | 0 | 0.0% |
| Black / African American | 123 | 2.9% |
| Hawaiian / Pacific | 0 | 0.0% |
| Hispanic or Latino | 1,562 | 36.4% |
| Native / Alaskan | 0 | 0.0% |
| White / Caucasian | 2,954 | 68.9% |
| Two or more Races | 396 | 9.2% |
| Some other Race | 815 | 19.0% |
| Total | 4,288 | 100.0% |
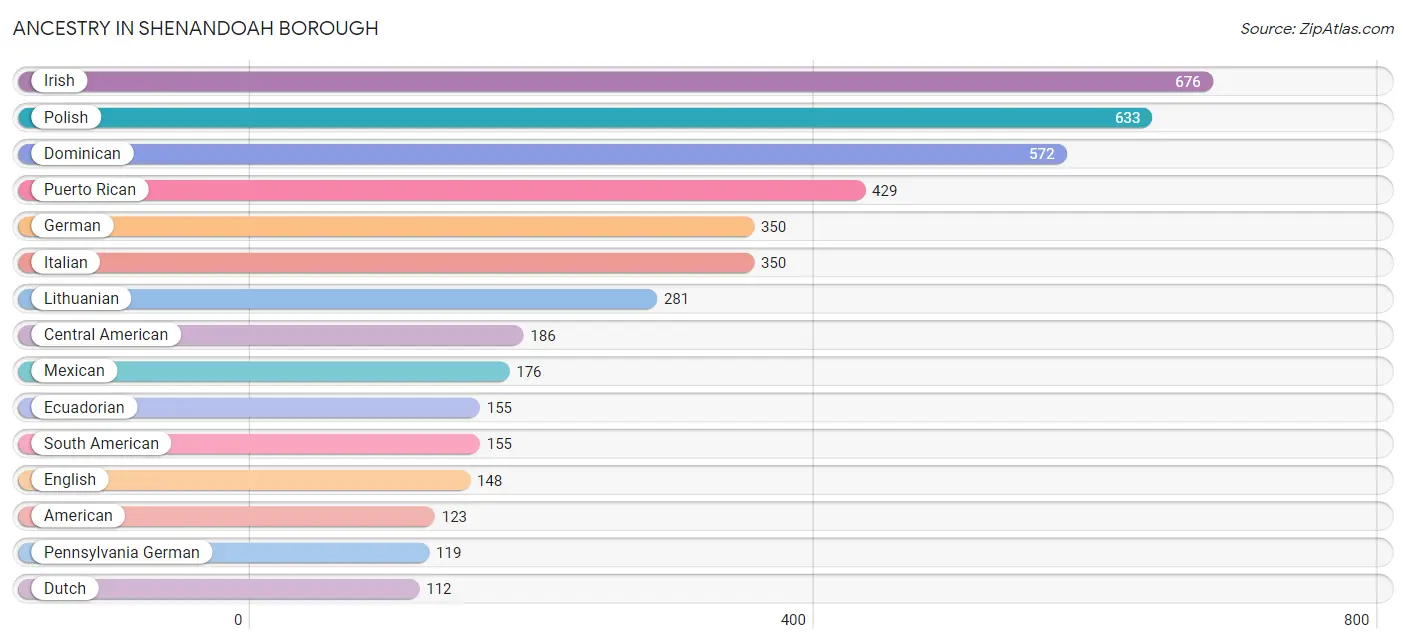
Ancestry in Shenandoah borough
The most populous ancestries reported in Shenandoah borough are Irish (676 | 15.8%), Polish (633 | 14.8%), Dominican (572 | 13.3%), Puerto Rican (429 | 10.0%), and German (350 | 8.2%), together accounting for 62.0% of all Shenandoah borough residents.
| Ancestry | # Population | % Population |
| American | 123 | 2.9% |
| Arab | 41 | 1.0% |
| Austrian | 10 | 0.2% |
| Bhutanese | 91 | 2.1% |
| Central American | 186 | 4.3% |
| Danish | 7 | 0.2% |
| Dominican | 572 | 13.3% |
| Dutch | 112 | 2.6% |
| Eastern European | 9 | 0.2% |
| Ecuadorian | 155 | 3.6% |
| Egyptian | 21 | 0.5% |
| English | 148 | 3.5% |
| Ethiopian | 33 | 0.8% |
| European | 45 | 1.1% |
| French | 14 | 0.3% |
| German | 350 | 8.2% |
| Greek | 55 | 1.3% |
| Guatemalan | 112 | 2.6% |
| Honduran | 57 | 1.3% |
| Hungarian | 14 | 0.3% |
| Irish | 676 | 15.8% |
| Italian | 350 | 8.2% |
| Jamaican | 8 | 0.2% |
| Lebanese | 20 | 0.5% |
| Lithuanian | 281 | 6.6% |
| Mexican | 176 | 4.1% |
| Norwegian | 5 | 0.1% |
| Pennsylvania German | 119 | 2.8% |
| Polish | 633 | 14.8% |
| Puerto Rican | 429 | 10.0% |
| Russian | 33 | 0.8% |
| Salvadoran | 17 | 0.4% |
| Scottish | 1 | 0.0% |
| Serbian | 12 | 0.3% |
| Slavic | 5 | 0.1% |
| Slovak | 25 | 0.6% |
| South American | 155 | 3.6% |
| Spanish | 29 | 0.7% |
| Subsaharan African | 33 | 0.8% |
| Swedish | 13 | 0.3% |
| Ukrainian | 37 | 0.9% |
| Welsh | 45 | 1.1% | View All 42 Rows |
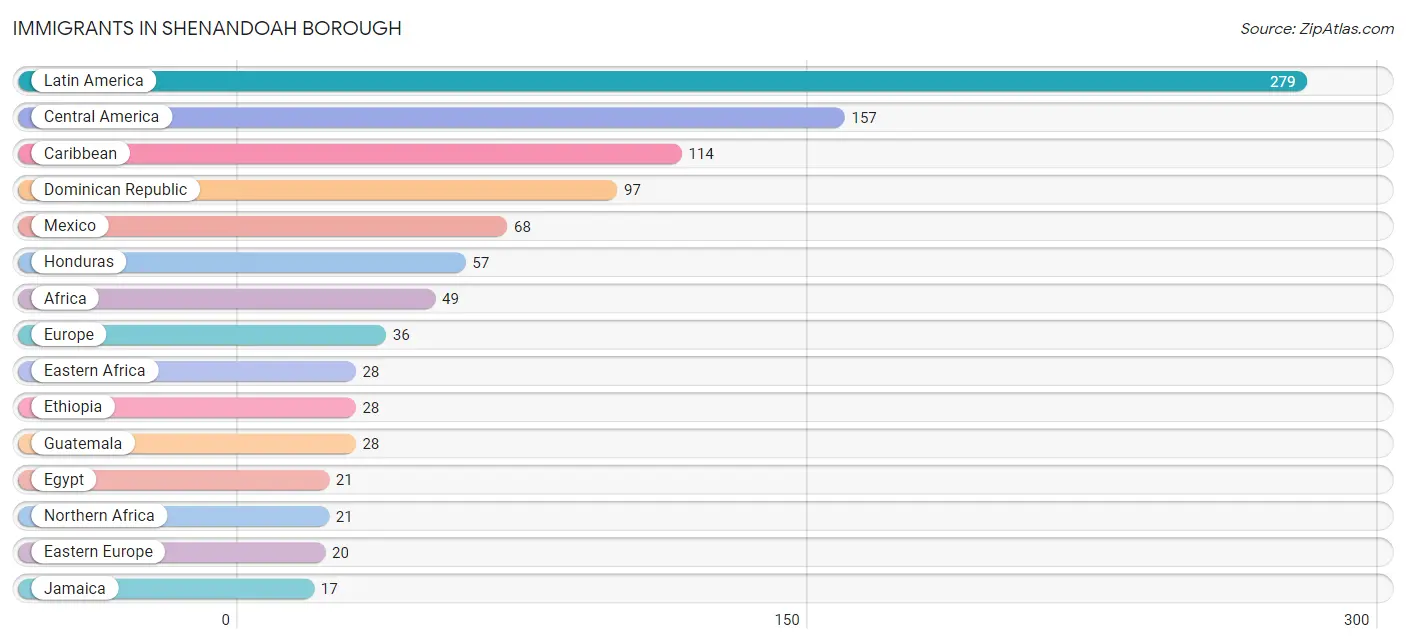
Immigrants in Shenandoah borough
The most numerous immigrant groups reported in Shenandoah borough came from Latin America (279 | 6.5%), Central America (157 | 3.7%), Caribbean (114 | 2.7%), Dominican Republic (97 | 2.3%), and Mexico (68 | 1.6%), together accounting for 16.7% of all Shenandoah borough residents.
| Immigration Origin | # Population | % Population |
| Africa | 49 | 1.1% |
| Caribbean | 114 | 2.7% |
| Central America | 157 | 3.7% |
| Dominican Republic | 97 | 2.3% |
| Eastern Africa | 28 | 0.6% |
| Eastern Europe | 20 | 0.5% |
| Egypt | 21 | 0.5% |
| El Salvador | 4 | 0.1% |
| Ethiopia | 28 | 0.6% |
| Europe | 36 | 0.8% |
| Guatemala | 28 | 0.6% |
| Honduras | 57 | 1.3% |
| Italy | 16 | 0.4% |
| Jamaica | 17 | 0.4% |
| Latin America | 279 | 6.5% |
| Mexico | 68 | 1.6% |
| Northern Africa | 21 | 0.5% |
| Peru | 8 | 0.2% |
| Poland | 8 | 0.2% |
| Serbia | 12 | 0.3% |
| South America | 8 | 0.2% |
| Southern Europe | 16 | 0.4% | View All 22 Rows |
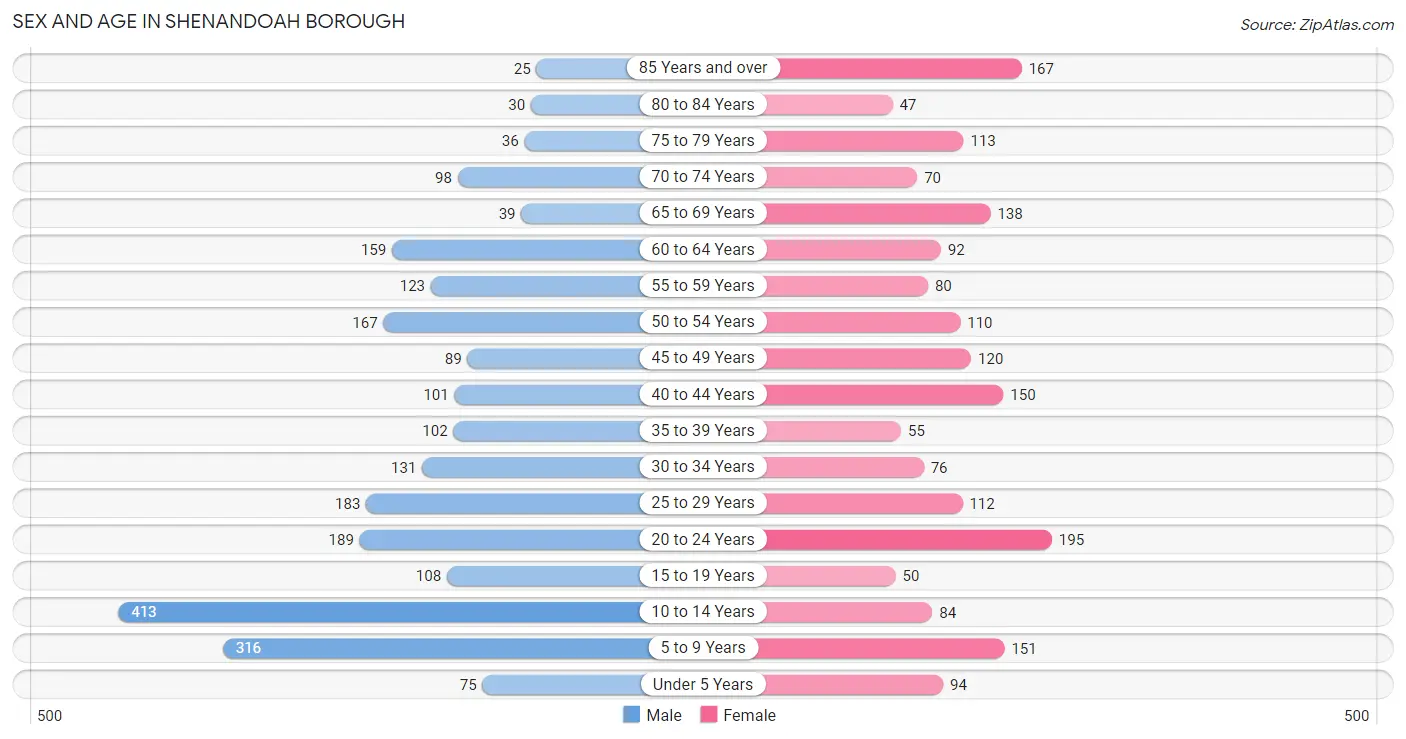
Sex and Age in Shenandoah borough
Sex and Age in Shenandoah borough
The most populous age groups in Shenandoah borough are 10 to 14 Years (413 | 17.3%) for men and 20 to 24 Years (195 | 10.2%) for women.
| Age Bracket | Male | Female |
| Under 5 Years | 75 (3.2%) | 94 (4.9%) |
| 5 to 9 Years | 316 (13.3%) | 151 (7.9%) |
| 10 to 14 Years | 413 (17.3%) | 84 (4.4%) |
| 15 to 19 Years | 108 (4.5%) | 50 (2.6%) |
| 20 to 24 Years | 189 (7.9%) | 195 (10.2%) |
| 25 to 29 Years | 183 (7.7%) | 112 (5.9%) |
| 30 to 34 Years | 131 (5.5%) | 76 (4.0%) |
| 35 to 39 Years | 102 (4.3%) | 55 (2.9%) |
| 40 to 44 Years | 101 (4.2%) | 150 (7.9%) |
| 45 to 49 Years | 89 (3.7%) | 120 (6.3%) |
| 50 to 54 Years | 167 (7.0%) | 110 (5.8%) |
| 55 to 59 Years | 123 (5.2%) | 80 (4.2%) |
| 60 to 64 Years | 159 (6.7%) | 92 (4.8%) |
| 65 to 69 Years | 39 (1.6%) | 138 (7.2%) |
| 70 to 74 Years | 98 (4.1%) | 70 (3.7%) |
| 75 to 79 Years | 36 (1.5%) | 113 (5.9%) |
| 80 to 84 Years | 30 (1.3%) | 47 (2.5%) |
| 85 Years and over | 25 (1.1%) | 167 (8.8%) |
| Total | 2,384 (100.0%) | 1,904 (100.0%) |
Families and Households in Shenandoah borough
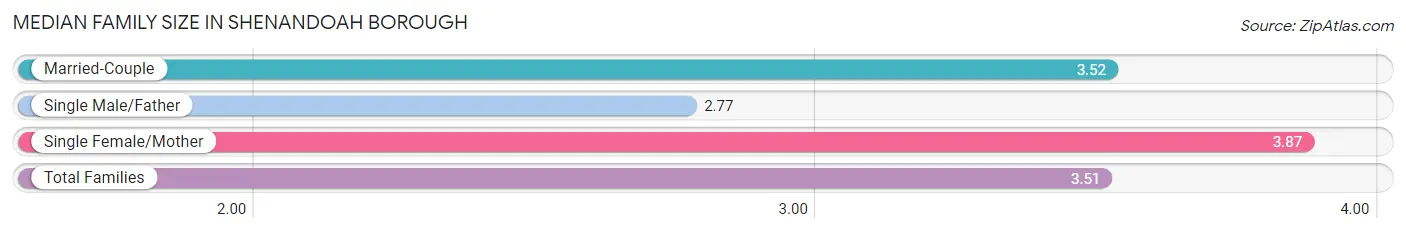
Median Family Size in Shenandoah borough
The median family size in Shenandoah borough is 3.51 persons per family, with single female/mother families (347 | 38.6%) accounting for the largest median family size of 3.87 persons per family. On the other hand, single male/father families (180 | 20.0%) represent the smallest median family size with 2.77 persons per family.
| Family Type | # Families | Family Size |
| Married-Couple | 372 (41.4%) | 3.52 |
| Single Male/Father | 180 (20.0%) | 2.77 |
| Single Female/Mother | 347 (38.6%) | 3.87 |
| Total Families | 899 (100.0%) | 3.51 |
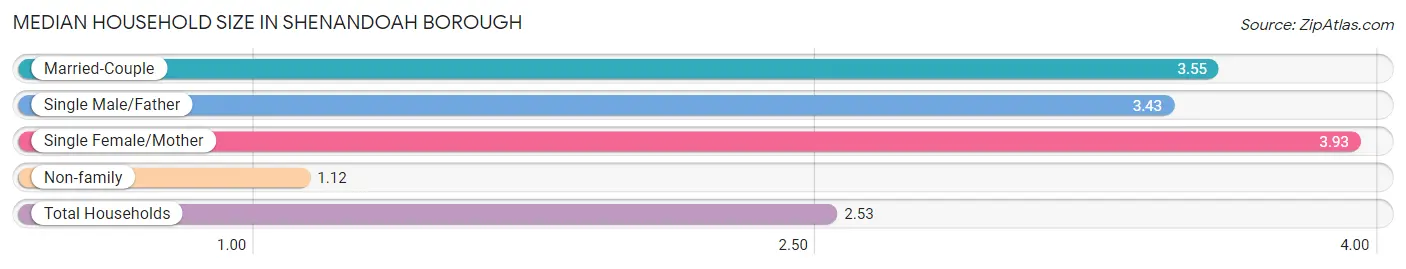
Median Household Size in Shenandoah borough
The median household size in Shenandoah borough is 2.53 persons per household, with single female/mother households (347 | 21.3%) accounting for the largest median household size of 3.93 persons per household. non-family households (728 | 44.7%) represent the smallest median household size with 1.12 persons per household.
| Household Type | # Households | Household Size |
| Married-Couple | 372 (22.9%) | 3.55 |
| Single Male/Father | 180 (11.1%) | 3.43 |
| Single Female/Mother | 347 (21.3%) | 3.93 |
| Non-family | 728 (44.7%) | 1.12 |
| Total Households | 1,627 (100.0%) | 2.53 |
Household Size by Marriage Status in Shenandoah borough
Out of a total of 1,627 households in Shenandoah borough, 899 (55.3%) are family households, while 728 (44.7%) are nonfamily households. The most numerous type of family households are 2-person households, comprising 486, and the most common type of nonfamily households are 1-person households, comprising 666.
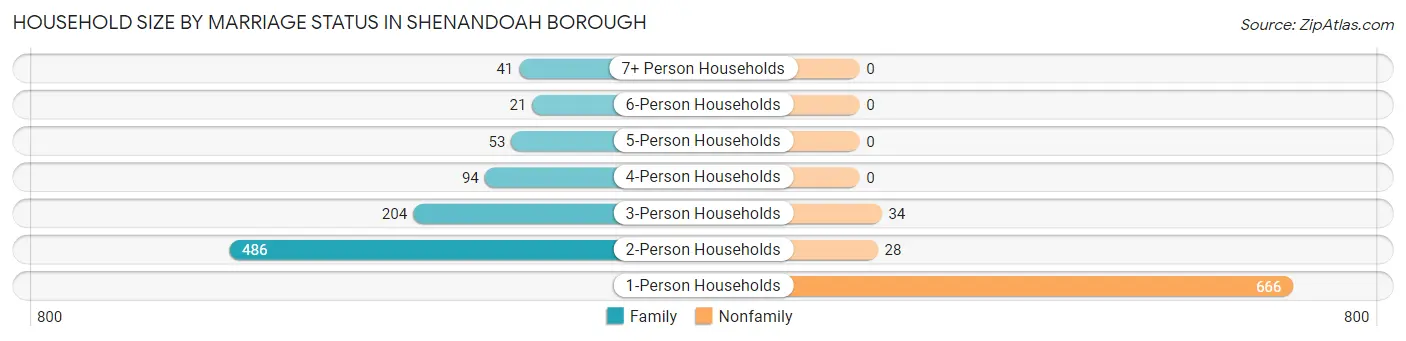
| Household Size | Family Households | Nonfamily Households |
| 1-Person Households | - | 666 (40.9%) |
| 2-Person Households | 486 (29.9%) | 28 (1.7%) |
| 3-Person Households | 204 (12.5%) | 34 (2.1%) |
| 4-Person Households | 94 (5.8%) | 0 (0.0%) |
| 5-Person Households | 53 (3.3%) | 0 (0.0%) |
| 6-Person Households | 21 (1.3%) | 0 (0.0%) |
| 7+ Person Households | 41 (2.5%) | 0 (0.0%) |
| Total | 899 (55.3%) | 728 (44.7%) |
Female Fertility in Shenandoah borough
Fertility by Age in Shenandoah borough
Average fertility rate in Shenandoah borough is 44.0 births per 1,000 women. Women in the age bracket of 35 to 50 years have the highest fertility rate with 68.0 births per 1,000 women. Women in the age bracket of 35 to 50 years acount for 66.7% of all women with births.
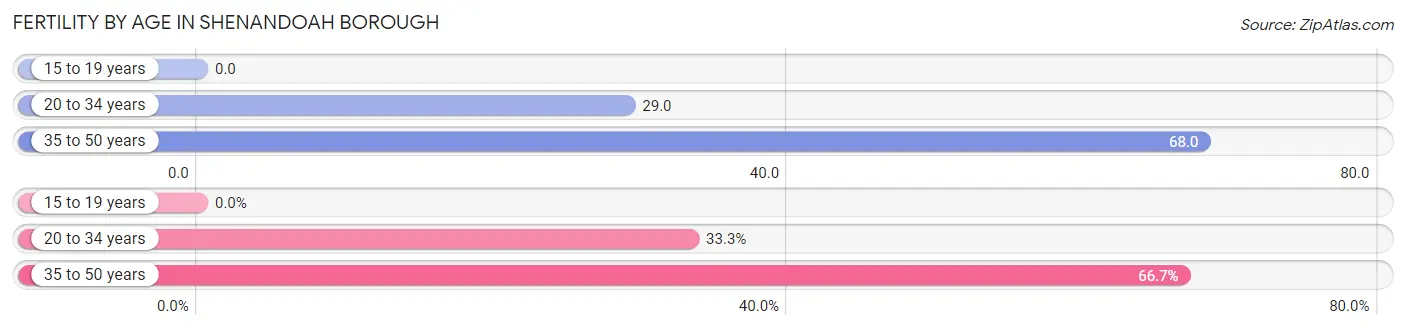
| Age Bracket | Women with Births | Births / 1,000 Women |
| 15 to 19 years | 0 (0.0%) | 0.0 |
| 20 to 34 years | 11 (33.3%) | 29.0 |
| 35 to 50 years | 22 (66.7%) | 68.0 |
| Total | 33 (100.0%) | 44.0 |
Fertility by Age by Marriage Status in Shenandoah borough
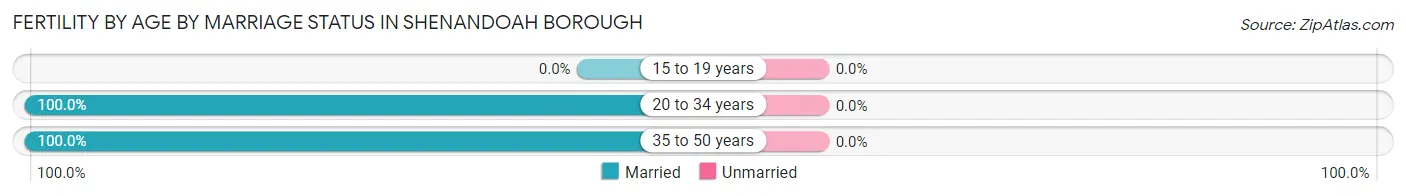
| Age Bracket | Married | Unmarried |
| 15 to 19 years | 0 (0.0%) | 0 (0.0%) |
| 20 to 34 years | 11 (100.0%) | 0 (0.0%) |
| 35 to 50 years | 22 (100.0%) | 0 (0.0%) |
| Total | 33 (100.0%) | 0 (0.0%) |
Fertility by Education in Shenandoah borough
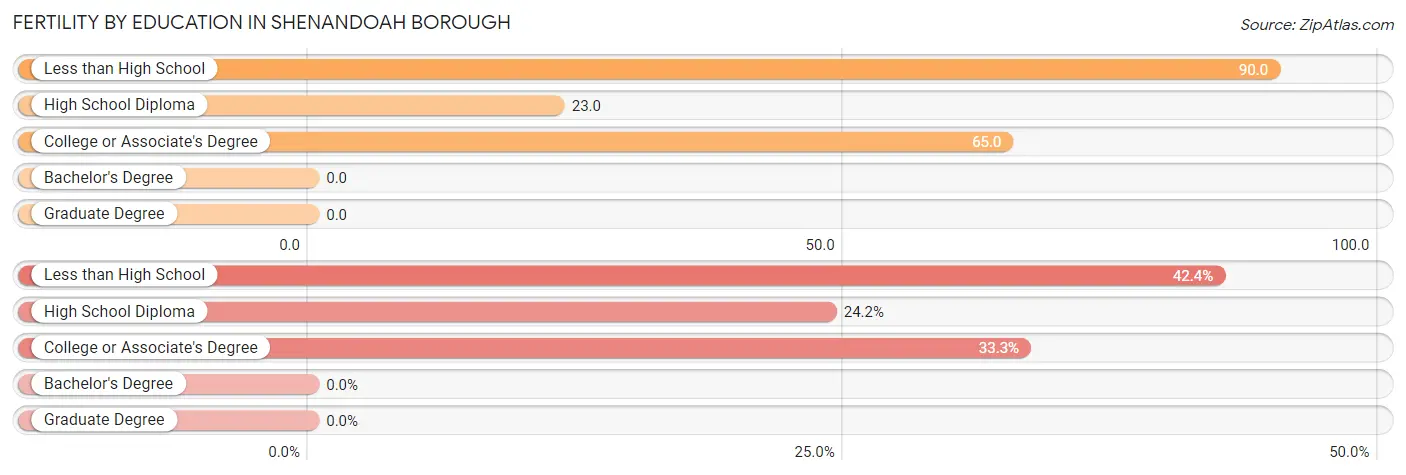
| Educational Attainment | Women with Births | Births / 1,000 Women |
| Less than High School | 14 (42.4%) | 90.0 |
| High School Diploma | 8 (24.2%) | 23.0 |
| College or Associate's Degree | 11 (33.3%) | 65.0 |
| Bachelor's Degree | 0 (0.0%) | 0.0 |
| Graduate Degree | 0 (0.0%) | 0.0 |
| Total | 33 (100.0%) | 44.0 |
Fertility by Education by Marriage Status in Shenandoah borough
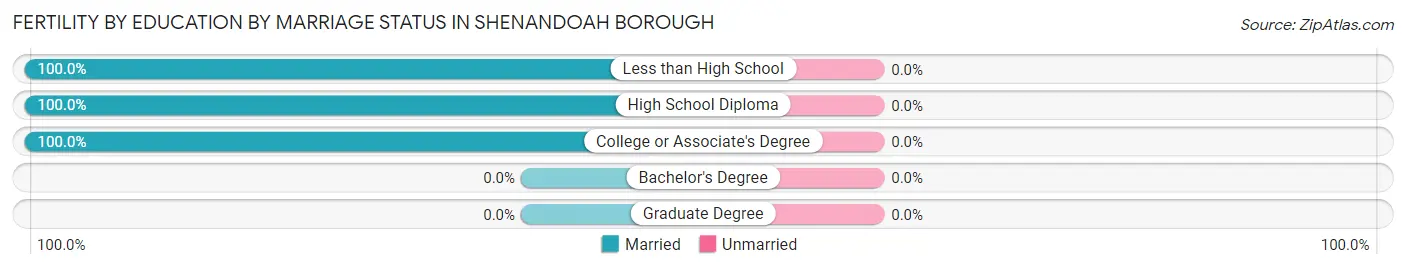
| Educational Attainment | Married | Unmarried |
| Less than High School | 14 (100.0%) | 0 (0.0%) |
| High School Diploma | 8 (100.0%) | 0 (0.0%) |
| College or Associate's Degree | 11 (100.0%) | 0 (0.0%) |
| Bachelor's Degree | 0 (0.0%) | 0 (0.0%) |
| Graduate Degree | 0 (0.0%) | 0 (0.0%) |
| Total | 33 (100.0%) | 0 (0.0%) |
Employment Characteristics in Shenandoah borough
Employment by Class of Employer in Shenandoah borough
Among the 1,321 employed individuals in Shenandoah borough, private company employees (1,040 | 78.7%), local government employees (133 | 10.1%), and state government employees (79 | 6.0%) make up the most common classes of employment.
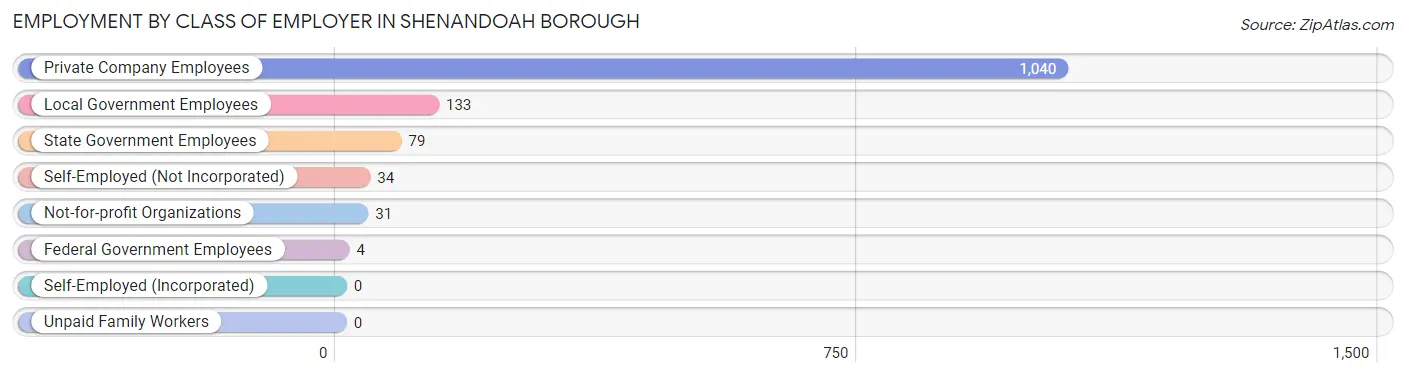
| Employer Class | # Employees | % Employees |
| Private Company Employees | 1,040 | 78.7% |
| Self-Employed (Incorporated) | 0 | 0.0% |
| Self-Employed (Not Incorporated) | 34 | 2.6% |
| Not-for-profit Organizations | 31 | 2.4% |
| Local Government Employees | 133 | 10.1% |
| State Government Employees | 79 | 6.0% |
| Federal Government Employees | 4 | 0.3% |
| Unpaid Family Workers | 0 | 0.0% |
| Total | 1,321 | 100.0% |
Employment Status by Age in Shenandoah borough
According to the labor force statistics for Shenandoah borough, out of the total population over 16 years of age (3,082), 50.1% or 1,544 individuals are in the labor force, with 11.8% or 182 of them unemployed. The age group with the highest labor force participation rate is 30 to 34 years, with 96.1% or 199 individuals in the labor force. Within the labor force, the 20 to 24 years age range has the highest percentage of unemployed individuals, with 36.4% or 80 of them being unemployed.
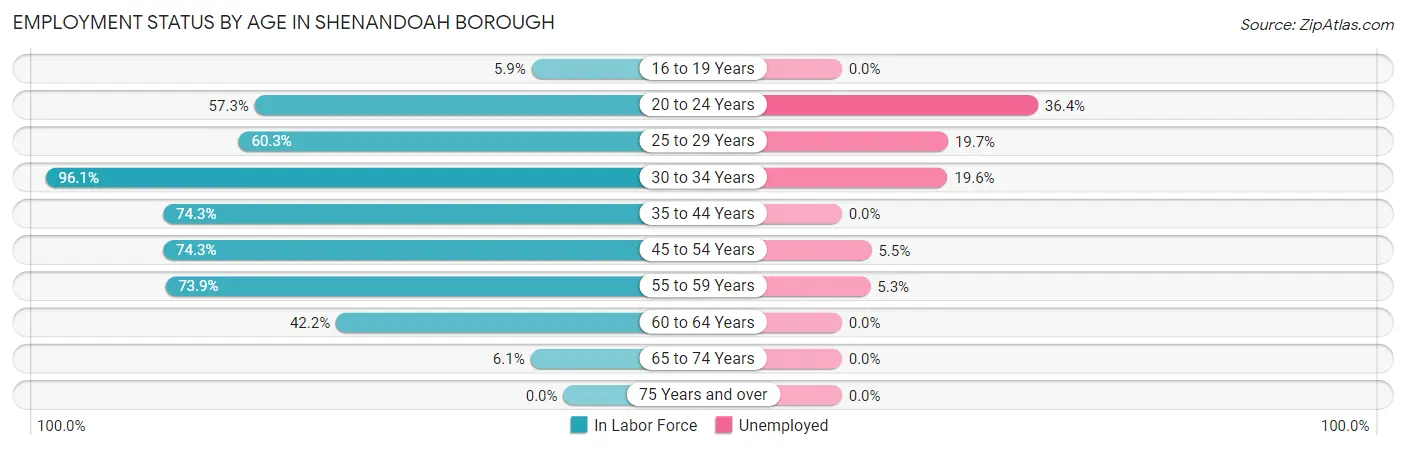
| Age Bracket | In Labor Force | Unemployed |
| 16 to 19 Years | 5 (5.9%) | 0 (0.0%) |
| 20 to 24 Years | 220 (57.3%) | 80 (36.4%) |
| 25 to 29 Years | 178 (60.3%) | 35 (19.7%) |
| 30 to 34 Years | 199 (96.1%) | 39 (19.6%) |
| 35 to 44 Years | 303 (74.3%) | 0 (0.0%) |
| 45 to 54 Years | 361 (74.3%) | 20 (5.5%) |
| 55 to 59 Years | 150 (73.9%) | 8 (5.3%) |
| 60 to 64 Years | 106 (42.2%) | 0 (0.0%) |
| 65 to 74 Years | 21 (6.1%) | 0 (0.0%) |
| 75 Years and over | 0 (0.0%) | 0 (0.0%) |
| Total | 1,544 (50.1%) | 182 (11.8%) |
Employment Status by Educational Attainment in Shenandoah borough
According to labor force statistics for Shenandoah borough, 70.1% of individuals (1,297) out of the total population between 25 and 64 years of age (1,850) are in the labor force, with 7.9% or 102 of them being unemployed. The group with the highest labor force participation rate are those with the educational attainment of bachelor's degree or higher, with 91.8% or 169 individuals in the labor force. Within the labor force, individuals with less than high school education have the highest percentage of unemployment, with 14.6% or 18 of them being unemployed.
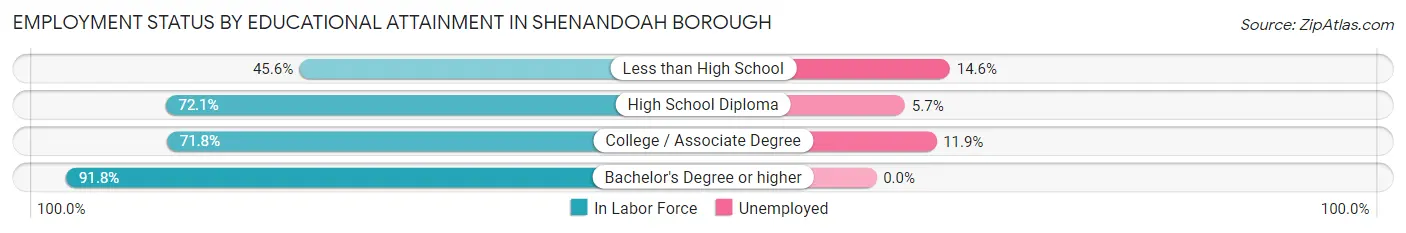
| Educational Attainment | In Labor Force | Unemployed |
| Less than High School | 123 (45.6%) | 39 (14.6%) |
| High School Diploma | 575 (72.1%) | 45 (5.7%) |
| College / Associate Degree | 430 (71.8%) | 71 (11.9%) |
| Bachelor's Degree or higher | 169 (91.8%) | 0 (0.0%) |
| Total | 1,297 (70.1%) | 146 (7.9%) |
Employment Occupations by Sex in Shenandoah borough
Management, Business, Science and Arts Occupations
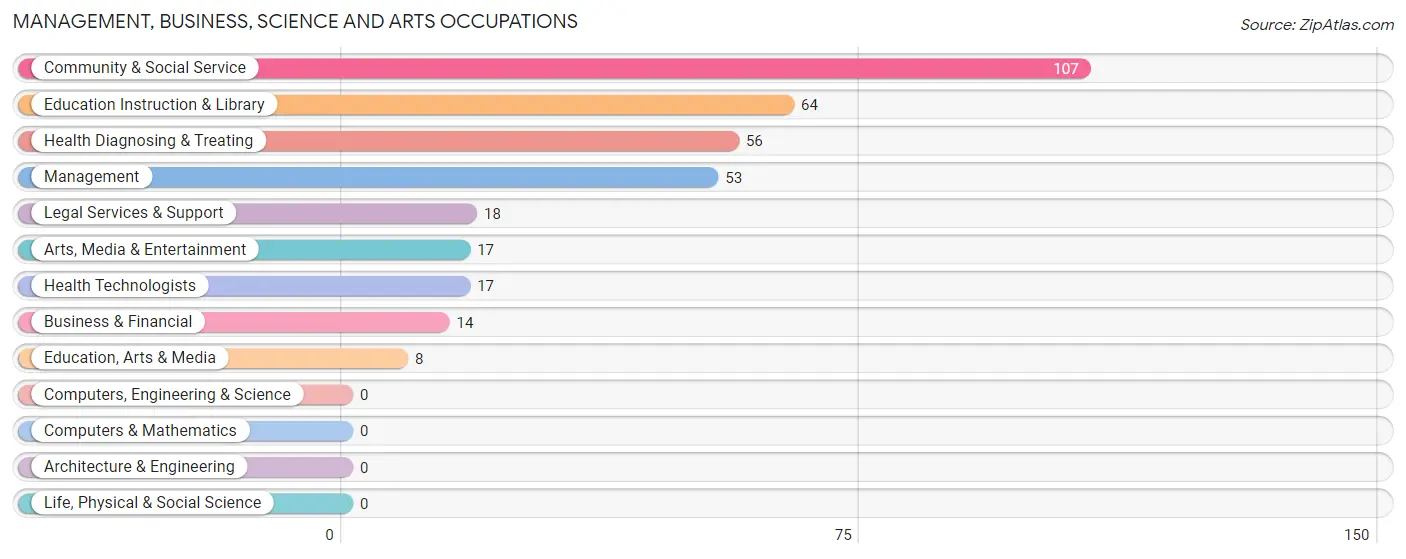
The most common Management, Business, Science and Arts occupations in Shenandoah borough are Community & Social Service (107 | 7.9%), Education Instruction & Library (64 | 4.7%), Health Diagnosing & Treating (56 | 4.1%), Management (53 | 3.9%), and Legal Services & Support (18 | 1.3%).
Management, Business, Science and Arts Occupations by Sex
Within the Management, Business, Science and Arts occupations in Shenandoah borough, the most male-oriented occupations are Legal Services & Support (100.0%), Management (84.9%), and Arts, Media & Entertainment (76.5%), while the most female-oriented occupations are Health Technologists (100.0%), Education Instruction & Library (90.6%), and Community & Social Service (59.8%).
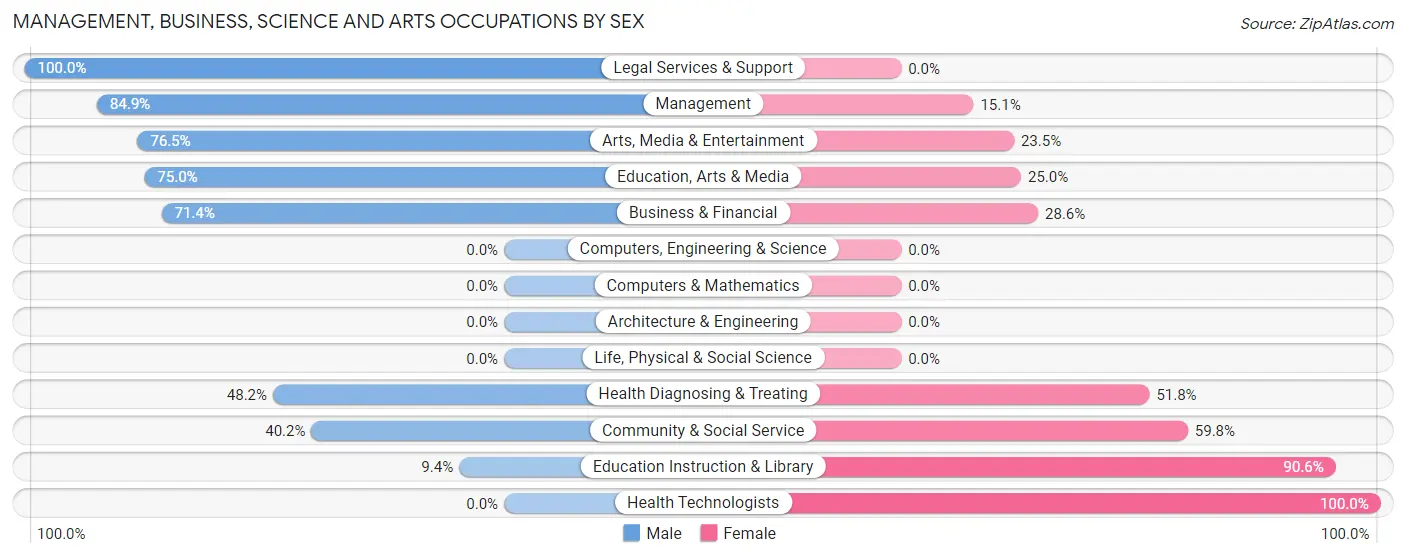
| Occupation | Male | Female |
| Management | 45 (84.9%) | 8 (15.1%) |
| Business & Financial | 10 (71.4%) | 4 (28.6%) |
| Computers, Engineering & Science | 0 (0.0%) | 0 (0.0%) |
| Computers & Mathematics | 0 (0.0%) | 0 (0.0%) |
| Architecture & Engineering | 0 (0.0%) | 0 (0.0%) |
| Life, Physical & Social Science | 0 (0.0%) | 0 (0.0%) |
| Community & Social Service | 43 (40.2%) | 64 (59.8%) |
| Education, Arts & Media | 6 (75.0%) | 2 (25.0%) |
| Legal Services & Support | 18 (100.0%) | 0 (0.0%) |
| Education Instruction & Library | 6 (9.4%) | 58 (90.6%) |
| Arts, Media & Entertainment | 13 (76.5%) | 4 (23.5%) |
| Health Diagnosing & Treating | 27 (48.2%) | 29 (51.8%) |
| Health Technologists | 0 (0.0%) | 17 (100.0%) |
| Total (Category) | 125 (54.3%) | 105 (45.7%) |
| Total (Overall) | 738 (54.2%) | 623 (45.8%) |
Services Occupations
The most common Services occupations in Shenandoah borough are Healthcare Support (72 | 5.3%), Cleaning & Maintenance (70 | 5.1%), Security & Protection (37 | 2.7%), Law Enforcement (37 | 2.7%), and Food Preparation & Serving (35 | 2.6%).
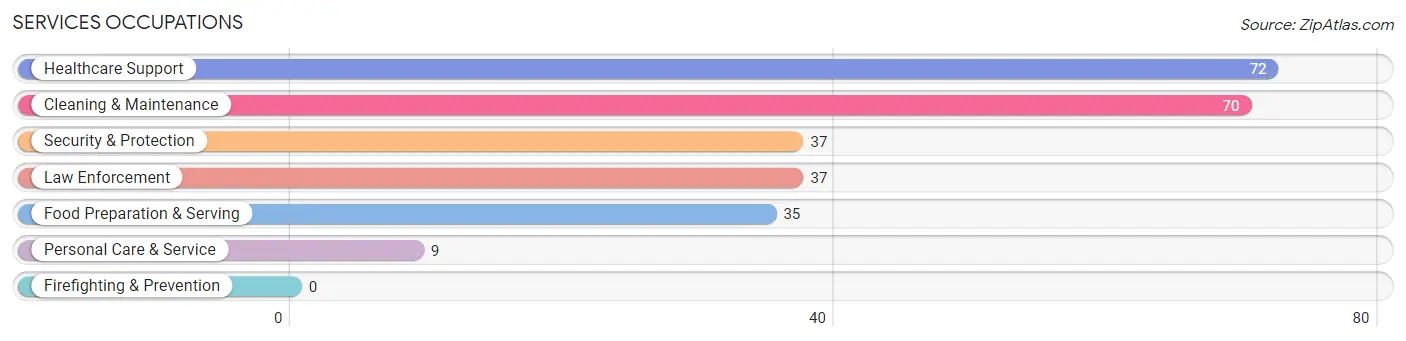
Services Occupations by Sex
Within the Services occupations in Shenandoah borough, the most male-oriented occupations are Security & Protection (70.3%), Law Enforcement (70.3%), and Cleaning & Maintenance (41.4%), while the most female-oriented occupations are Healthcare Support (100.0%), Personal Care & Service (100.0%), and Food Preparation & Serving (85.7%).
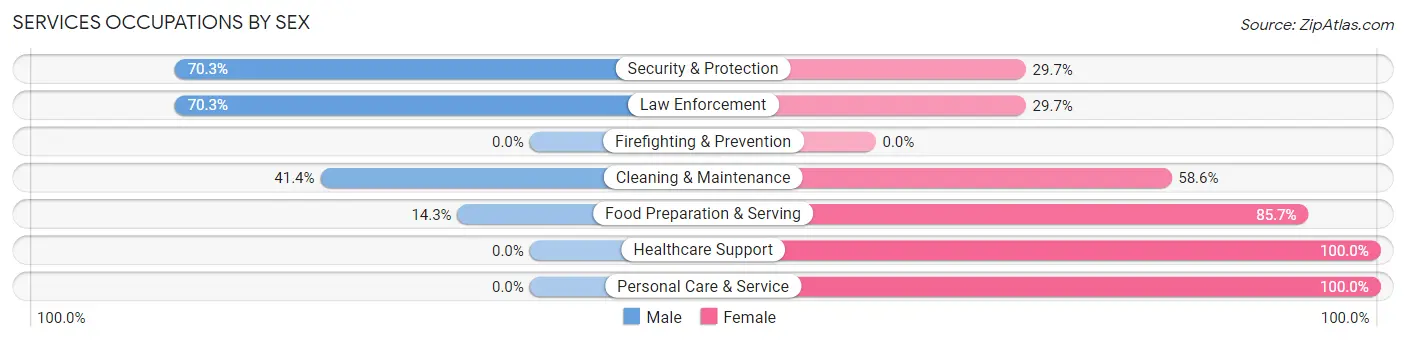
| Occupation | Male | Female |
| Healthcare Support | 0 (0.0%) | 72 (100.0%) |
| Security & Protection | 26 (70.3%) | 11 (29.7%) |
| Firefighting & Prevention | 0 (0.0%) | 0 (0.0%) |
| Law Enforcement | 26 (70.3%) | 11 (29.7%) |
| Food Preparation & Serving | 5 (14.3%) | 30 (85.7%) |
| Cleaning & Maintenance | 29 (41.4%) | 41 (58.6%) |
| Personal Care & Service | 0 (0.0%) | 9 (100.0%) |
| Total (Category) | 60 (26.9%) | 163 (73.1%) |
| Total (Overall) | 738 (54.2%) | 623 (45.8%) |
Sales and Office Occupations
The most common Sales and Office occupations in Shenandoah borough are Office & Administration (125 | 9.2%), and Sales & Related (87 | 6.4%).
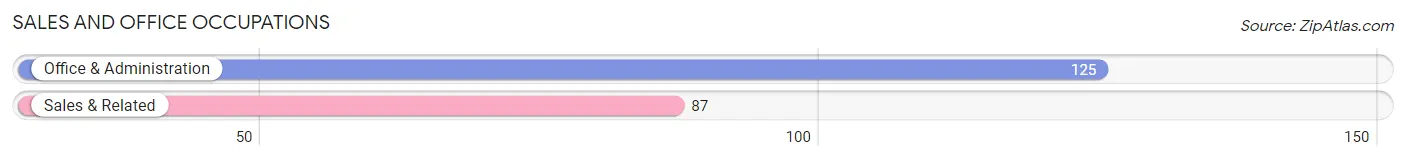
Sales and Office Occupations by Sex
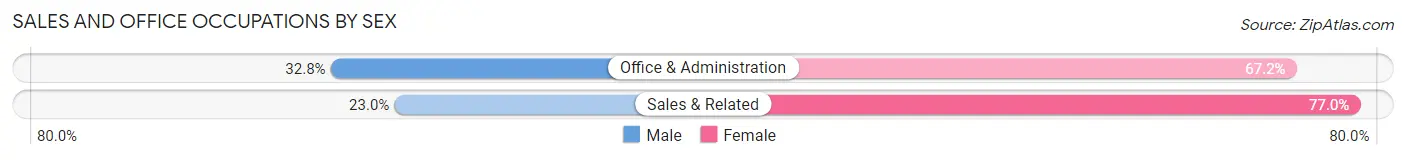
| Occupation | Male | Female |
| Sales & Related | 20 (23.0%) | 67 (77.0%) |
| Office & Administration | 41 (32.8%) | 84 (67.2%) |
| Total (Category) | 61 (28.8%) | 151 (71.2%) |
| Total (Overall) | 738 (54.2%) | 623 (45.8%) |
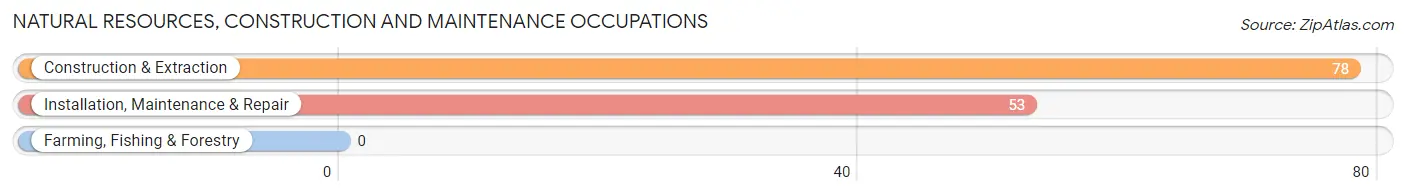
Natural Resources, Construction and Maintenance Occupations
The most common Natural Resources, Construction and Maintenance occupations in Shenandoah borough are Construction & Extraction (78 | 5.7%), and Installation, Maintenance & Repair (53 | 3.9%).
Natural Resources, Construction and Maintenance Occupations by Sex
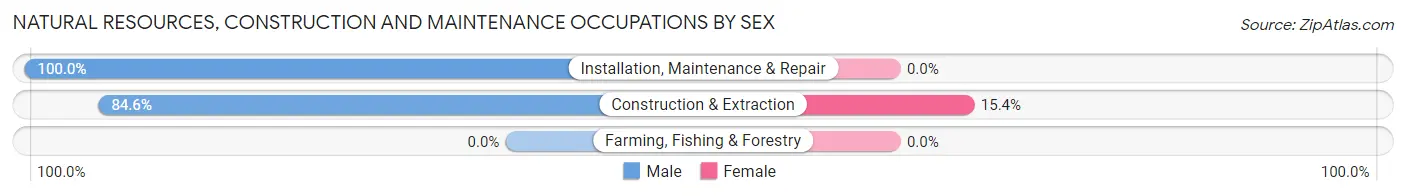
| Occupation | Male | Female |
| Farming, Fishing & Forestry | 0 (0.0%) | 0 (0.0%) |
| Construction & Extraction | 66 (84.6%) | 12 (15.4%) |
| Installation, Maintenance & Repair | 53 (100.0%) | 0 (0.0%) |
| Total (Category) | 119 (90.8%) | 12 (9.2%) |
| Total (Overall) | 738 (54.2%) | 623 (45.8%) |
Production, Transportation and Moving Occupations
The most common Production, Transportation and Moving occupations in Shenandoah borough are Material Moving (261 | 19.2%), Production (204 | 15.0%), and Transportation (100 | 7.3%).
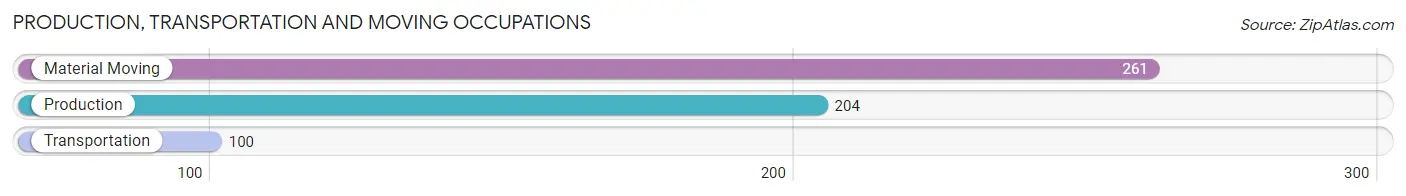
Production, Transportation and Moving Occupations by Sex
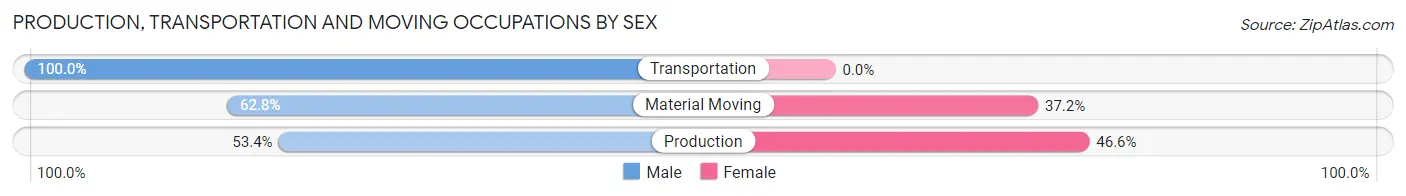
| Occupation | Male | Female |
| Production | 109 (53.4%) | 95 (46.6%) |
| Transportation | 100 (100.0%) | 0 (0.0%) |
| Material Moving | 164 (62.8%) | 97 (37.2%) |
| Total (Category) | 373 (66.0%) | 192 (34.0%) |
| Total (Overall) | 738 (54.2%) | 623 (45.8%) |
Employment Industries by Sex in Shenandoah borough
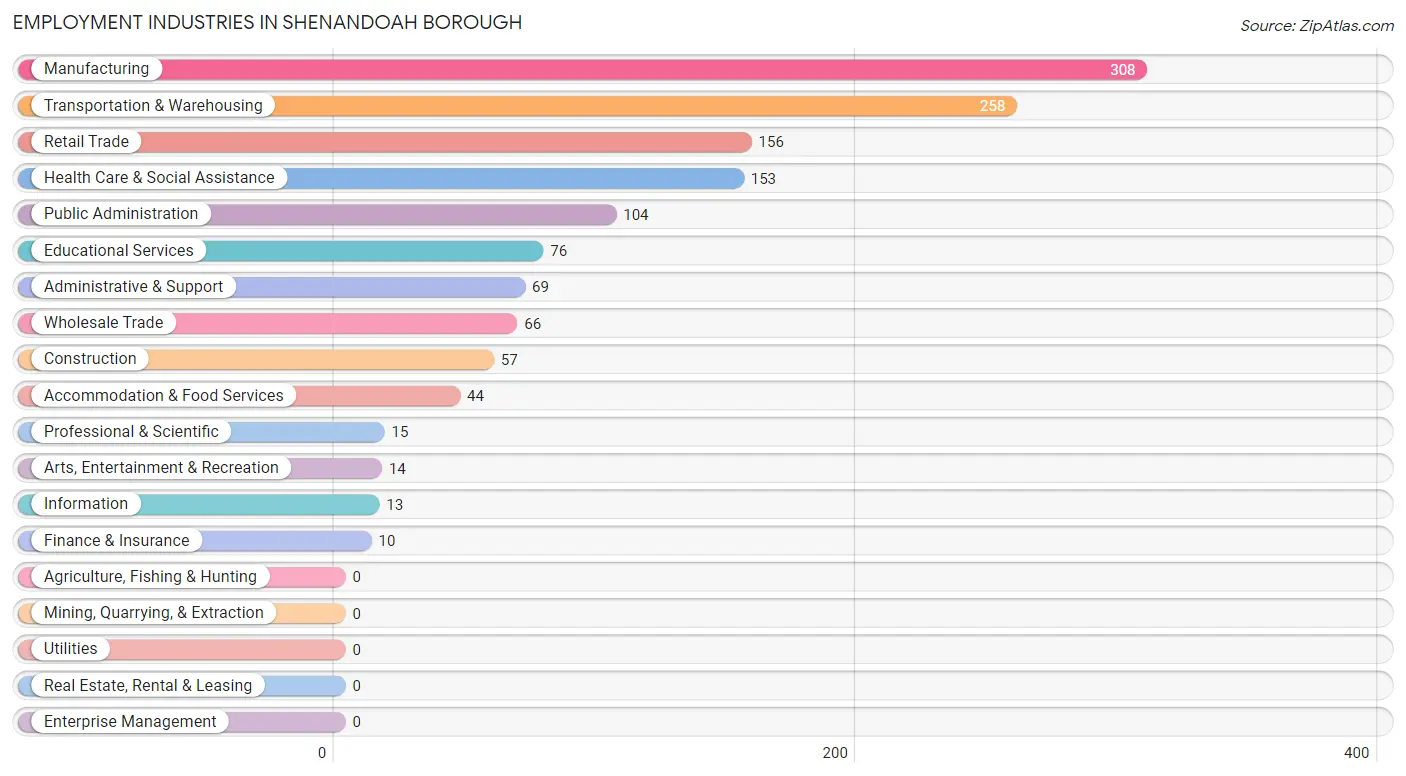
Employment Industries in Shenandoah borough
The major employment industries in Shenandoah borough include Manufacturing (308 | 22.6%), Transportation & Warehousing (258 | 19.0%), Retail Trade (156 | 11.5%), Health Care & Social Assistance (153 | 11.2%), and Public Administration (104 | 7.6%).
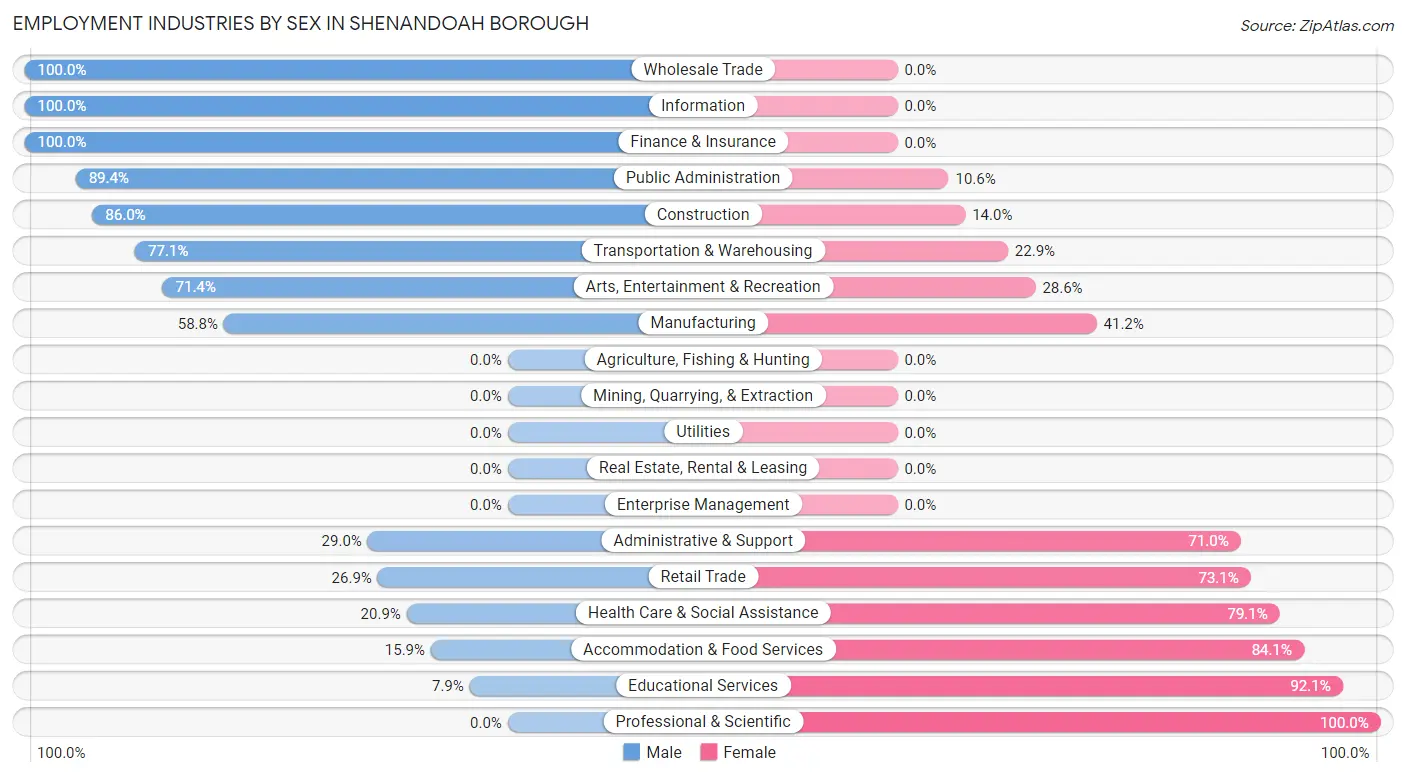
Employment Industries by Sex in Shenandoah borough
The Shenandoah borough industries that see more men than women are Wholesale Trade (100.0%), Information (100.0%), and Finance & Insurance (100.0%), whereas the industries that tend to have a higher number of women are Professional & Scientific (100.0%), Educational Services (92.1%), and Accommodation & Food Services (84.1%).
| Industry | Male | Female |
| Agriculture, Fishing & Hunting | 0 (0.0%) | 0 (0.0%) |
| Mining, Quarrying, & Extraction | 0 (0.0%) | 0 (0.0%) |
| Construction | 49 (86.0%) | 8 (14.0%) |
| Manufacturing | 181 (58.8%) | 127 (41.2%) |
| Wholesale Trade | 66 (100.0%) | 0 (0.0%) |
| Retail Trade | 42 (26.9%) | 114 (73.1%) |
| Transportation & Warehousing | 199 (77.1%) | 59 (22.9%) |
| Utilities | 0 (0.0%) | 0 (0.0%) |
| Information | 13 (100.0%) | 0 (0.0%) |
| Finance & Insurance | 10 (100.0%) | 0 (0.0%) |
| Real Estate, Rental & Leasing | 0 (0.0%) | 0 (0.0%) |
| Professional & Scientific | 0 (0.0%) | 15 (100.0%) |
| Enterprise Management | 0 (0.0%) | 0 (0.0%) |
| Administrative & Support | 20 (29.0%) | 49 (71.0%) |
| Educational Services | 6 (7.9%) | 70 (92.1%) |
| Health Care & Social Assistance | 32 (20.9%) | 121 (79.1%) |
| Arts, Entertainment & Recreation | 10 (71.4%) | 4 (28.6%) |
| Accommodation & Food Services | 7 (15.9%) | 37 (84.1%) |
| Public Administration | 93 (89.4%) | 11 (10.6%) |
| Total | 738 (54.2%) | 623 (45.8%) |
Education in Shenandoah borough
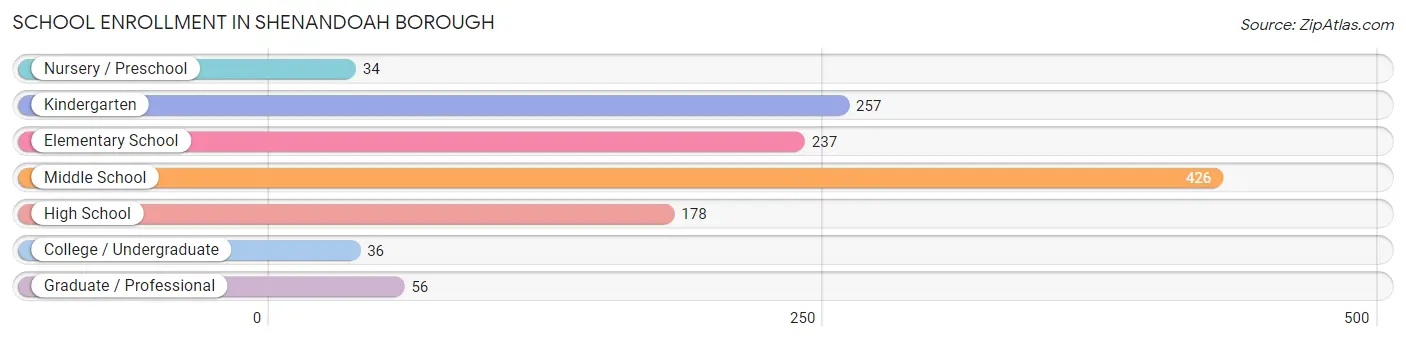
School Enrollment in Shenandoah borough
The most common levels of schooling among the 1,224 students in Shenandoah borough are middle school (426 | 34.8%), kindergarten (257 | 21.0%), and elementary school (237 | 19.4%).
| School Level | # Students | % Students |
| Nursery / Preschool | 34 | 2.8% |
| Kindergarten | 257 | 21.0% |
| Elementary School | 237 | 19.4% |
| Middle School | 426 | 34.8% |
| High School | 178 | 14.5% |
| College / Undergraduate | 36 | 2.9% |
| Graduate / Professional | 56 | 4.6% |
| Total | 1,224 | 100.0% |
School Enrollment by Age by Funding Source in Shenandoah borough
Out of a total of 1,224 students who are enrolled in schools in Shenandoah borough, 250 (20.4%) attend a private institution, while the remaining 974 (79.6%) are enrolled in public schools. The age group of 35 years and over has the highest likelihood of being enrolled in private schools, with 49 (87.5% in the age bracket) enrolled. Conversely, the age group of 3 to 4 year olds has the lowest likelihood of being enrolled in a private school, with 20 (100.0% in the age bracket) attending a public institution.
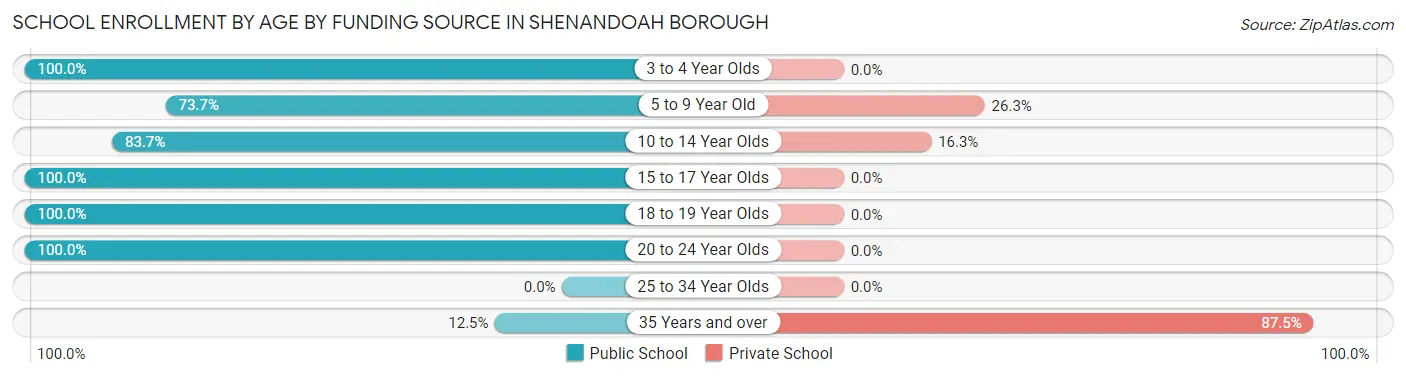
| Age Bracket | Public School | Private School |
| 3 to 4 Year Olds | 20 (100.0%) | 0 (0.0%) |
| 5 to 9 Year Old | 337 (73.7%) | 120 (26.3%) |
| 10 to 14 Year Olds | 416 (83.7%) | 81 (16.3%) |
| 15 to 17 Year Olds | 129 (100.0%) | 0 (0.0%) |
| 18 to 19 Year Olds | 29 (100.0%) | 0 (0.0%) |
| 20 to 24 Year Olds | 36 (100.0%) | 0 (0.0%) |
| 25 to 34 Year Olds | 0 (0.0%) | 0 (0.0%) |
| 35 Years and over | 7 (12.5%) | 49 (87.5%) |
| Total | 974 (79.6%) | 250 (20.4%) |
Educational Attainment by Field of Study in Shenandoah borough
Liberal arts & history (77 | 26.5%), social sciences (53 | 18.2%), science & technology (53 | 18.2%), education (39 | 13.4%), and psychology (24 | 8.3%) are the most common fields of study among 291 individuals in Shenandoah borough who have obtained a bachelor's degree or higher.
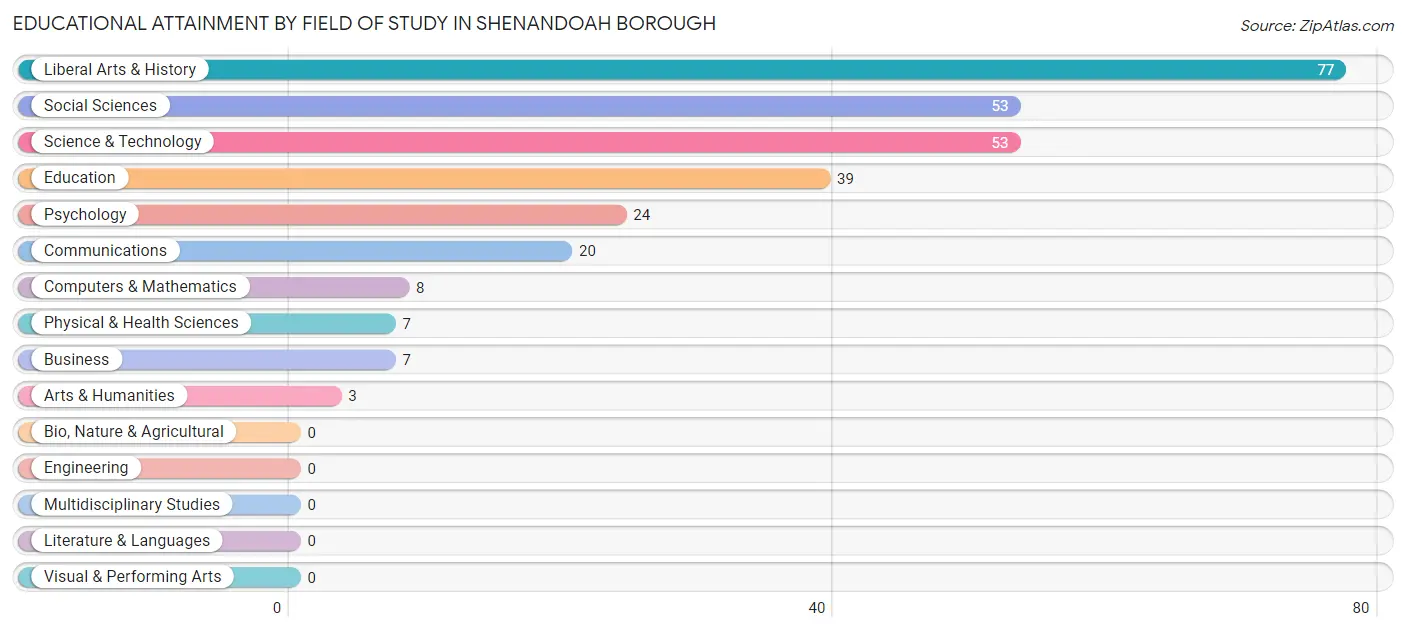
| Field of Study | # Graduates | % Graduates |
| Computers & Mathematics | 8 | 2.8% |
| Bio, Nature & Agricultural | 0 | 0.0% |
| Physical & Health Sciences | 7 | 2.4% |
| Psychology | 24 | 8.3% |
| Social Sciences | 53 | 18.2% |
| Engineering | 0 | 0.0% |
| Multidisciplinary Studies | 0 | 0.0% |
| Science & Technology | 53 | 18.2% |
| Business | 7 | 2.4% |
| Education | 39 | 13.4% |
| Literature & Languages | 0 | 0.0% |
| Liberal Arts & History | 77 | 26.5% |
| Visual & Performing Arts | 0 | 0.0% |
| Communications | 20 | 6.9% |
| Arts & Humanities | 3 | 1.0% |
| Total | 291 | 100.0% |
Transportation & Commute in Shenandoah borough
Vehicle Availability by Sex in Shenandoah borough
The most prevalent vehicle ownership categories in Shenandoah borough are males with 2 vehicles (295, accounting for 40.5%) and females with 2 vehicles (194, making up 50.0%).
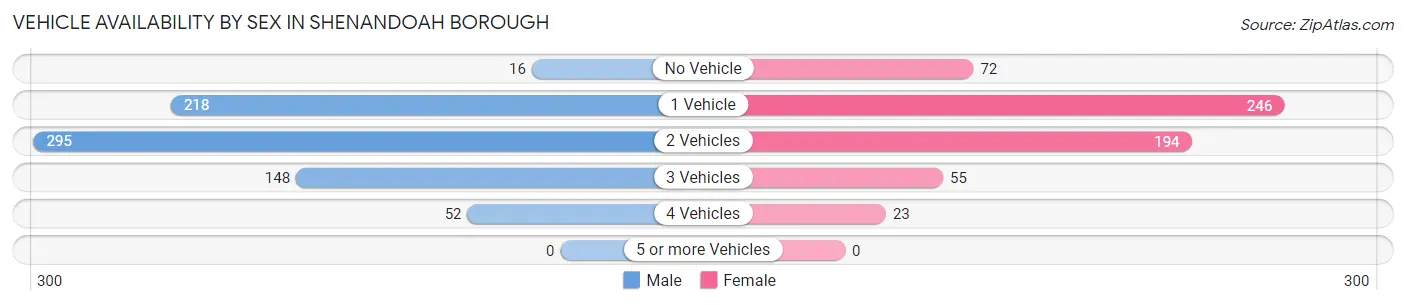
| Vehicles Available | Male | Female |
| No Vehicle | 16 (2.2%) | 72 (12.2%) |
| 1 Vehicle | 218 (29.9%) | 246 (41.7%) |
| 2 Vehicles | 295 (40.5%) | 194 (32.9%) |
| 3 Vehicles | 148 (20.3%) | 55 (9.3%) |
| 4 Vehicles | 52 (7.1%) | 23 (3.9%) |
| 5 or more Vehicles | 0 (0.0%) | 0 (0.0%) |
| Total | 729 (100.0%) | 590 (100.0%) |
Commute Time in Shenandoah borough
The most frequently occuring commute durations in Shenandoah borough are 20 to 24 minutes (305 commuters, 23.9%), 5 to 9 minutes (220 commuters, 17.3%), and 25 to 29 minutes (190 commuters, 14.9%).
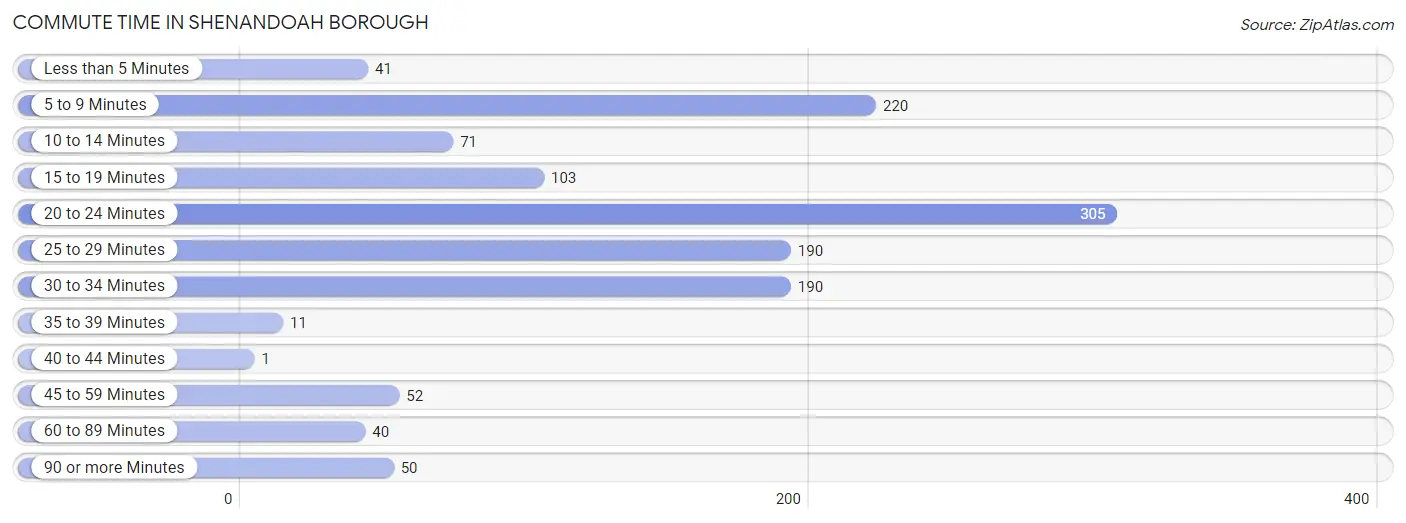
| Commute Time | # Commuters | % Commuters |
| Less than 5 Minutes | 41 | 3.2% |
| 5 to 9 Minutes | 220 | 17.3% |
| 10 to 14 Minutes | 71 | 5.6% |
| 15 to 19 Minutes | 103 | 8.1% |
| 20 to 24 Minutes | 305 | 23.9% |
| 25 to 29 Minutes | 190 | 14.9% |
| 30 to 34 Minutes | 190 | 14.9% |
| 35 to 39 Minutes | 11 | 0.9% |
| 40 to 44 Minutes | 1 | 0.1% |
| 45 to 59 Minutes | 52 | 4.1% |
| 60 to 89 Minutes | 40 | 3.1% |
| 90 or more Minutes | 50 | 3.9% |
Commute Time by Sex in Shenandoah borough
The most common commute times in Shenandoah borough are 20 to 24 minutes (229 commuters, 32.7%) for males and 5 to 9 minutes (152 commuters, 26.5%) for females.
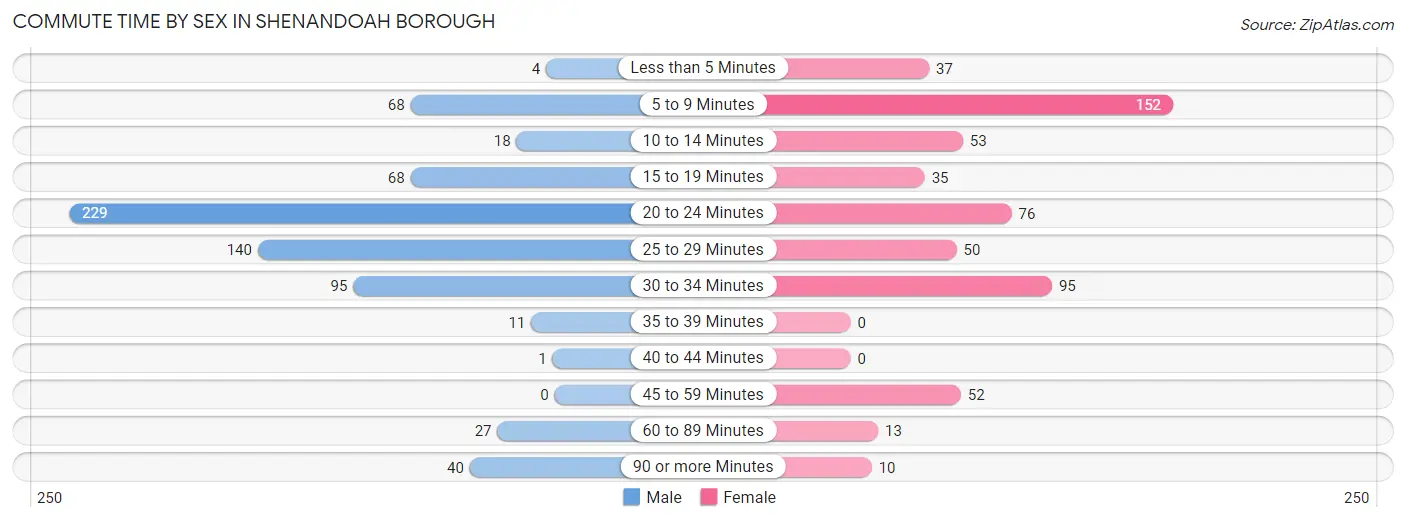
| Commute Time | Male | Female |
| Less than 5 Minutes | 4 (0.6%) | 37 (6.5%) |
| 5 to 9 Minutes | 68 (9.7%) | 152 (26.5%) |
| 10 to 14 Minutes | 18 (2.6%) | 53 (9.2%) |
| 15 to 19 Minutes | 68 (9.7%) | 35 (6.1%) |
| 20 to 24 Minutes | 229 (32.7%) | 76 (13.3%) |
| 25 to 29 Minutes | 140 (20.0%) | 50 (8.7%) |
| 30 to 34 Minutes | 95 (13.6%) | 95 (16.6%) |
| 35 to 39 Minutes | 11 (1.6%) | 0 (0.0%) |
| 40 to 44 Minutes | 1 (0.1%) | 0 (0.0%) |
| 45 to 59 Minutes | 0 (0.0%) | 52 (9.1%) |
| 60 to 89 Minutes | 27 (3.8%) | 13 (2.3%) |
| 90 or more Minutes | 40 (5.7%) | 10 (1.8%) |
Time of Departure to Work by Sex in Shenandoah borough
The most frequent times of departure to work in Shenandoah borough are 6:00 AM to 6:29 AM (204, 29.1%) for males and 7:00 AM to 7:29 AM (104, 18.1%) for females.

| Time of Departure | Male | Female |
| 12:00 AM to 4:59 AM | 127 (18.1%) | 24 (4.2%) |
| 5:00 AM to 5:29 AM | 86 (12.3%) | 78 (13.6%) |
| 5:30 AM to 5:59 AM | 1 (0.1%) | 0 (0.0%) |
| 6:00 AM to 6:29 AM | 204 (29.1%) | 37 (6.5%) |
| 6:30 AM to 6:59 AM | 0 (0.0%) | 72 (12.6%) |
| 7:00 AM to 7:29 AM | 9 (1.3%) | 104 (18.1%) |
| 7:30 AM to 7:59 AM | 30 (4.3%) | 95 (16.6%) |
| 8:00 AM to 8:29 AM | 9 (1.3%) | 28 (4.9%) |
| 8:30 AM to 8:59 AM | 5 (0.7%) | 34 (5.9%) |
| 9:00 AM to 9:59 AM | 0 (0.0%) | 2 (0.4%) |
| 10:00 AM to 10:59 AM | 1 (0.1%) | 0 (0.0%) |
| 11:00 AM to 11:59 AM | 0 (0.0%) | 0 (0.0%) |
| 12:00 PM to 3:59 PM | 146 (20.8%) | 26 (4.5%) |
| 4:00 PM to 11:59 PM | 83 (11.8%) | 73 (12.7%) |
| Total | 701 (100.0%) | 573 (100.0%) |
Housing Occupancy in Shenandoah borough
Occupancy by Ownership in Shenandoah borough
Of the total 1,627 dwellings in Shenandoah borough, owner-occupied units account for 1,162 (71.4%), while renter-occupied units make up 465 (28.6%).
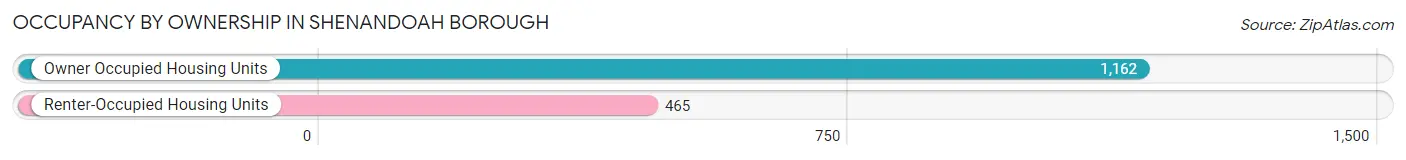
| Occupancy | # Housing Units | % Housing Units |
| Owner Occupied Housing Units | 1,162 | 71.4% |
| Renter-Occupied Housing Units | 465 | 28.6% |
| Total Occupied Housing Units | 1,627 | 100.0% |
Occupancy by Household Size in Shenandoah borough
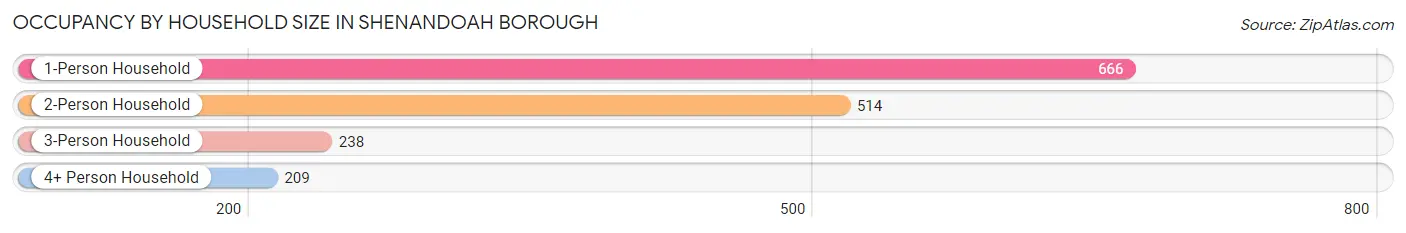
| Household Size | # Housing Units | % Housing Units |
| 1-Person Household | 666 | 40.9% |
| 2-Person Household | 514 | 31.6% |
| 3-Person Household | 238 | 14.6% |
| 4+ Person Household | 209 | 12.9% |
| Total Housing Units | 1,627 | 100.0% |
Occupancy by Ownership by Household Size in Shenandoah borough
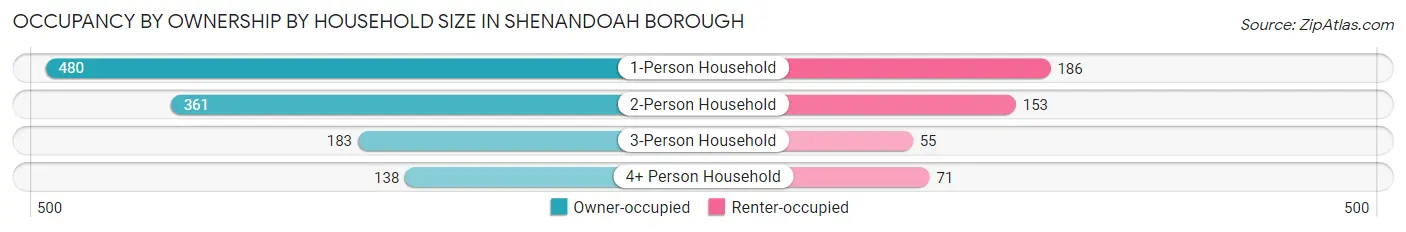
| Household Size | Owner-occupied | Renter-occupied |
| 1-Person Household | 480 (72.1%) | 186 (27.9%) |
| 2-Person Household | 361 (70.2%) | 153 (29.8%) |
| 3-Person Household | 183 (76.9%) | 55 (23.1%) |
| 4+ Person Household | 138 (66.0%) | 71 (34.0%) |
| Total Housing Units | 1,162 (71.4%) | 465 (28.6%) |
Occupancy by Educational Attainment in Shenandoah borough
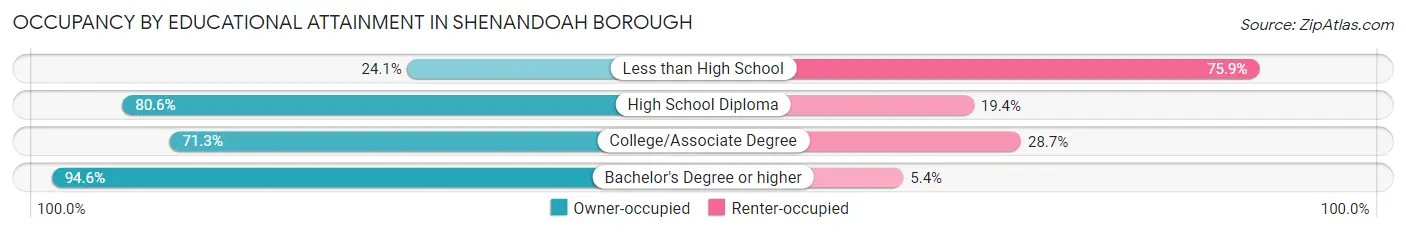
| Household Size | Owner-occupied | Renter-occupied |
| Less than High School | 58 (24.1%) | 183 (75.9%) |
| High School Diploma | 591 (80.6%) | 142 (19.4%) |
| College/Associate Degree | 320 (71.3%) | 129 (28.7%) |
| Bachelor's Degree or higher | 193 (94.6%) | 11 (5.4%) |
Occupancy by Age of Householder in Shenandoah borough
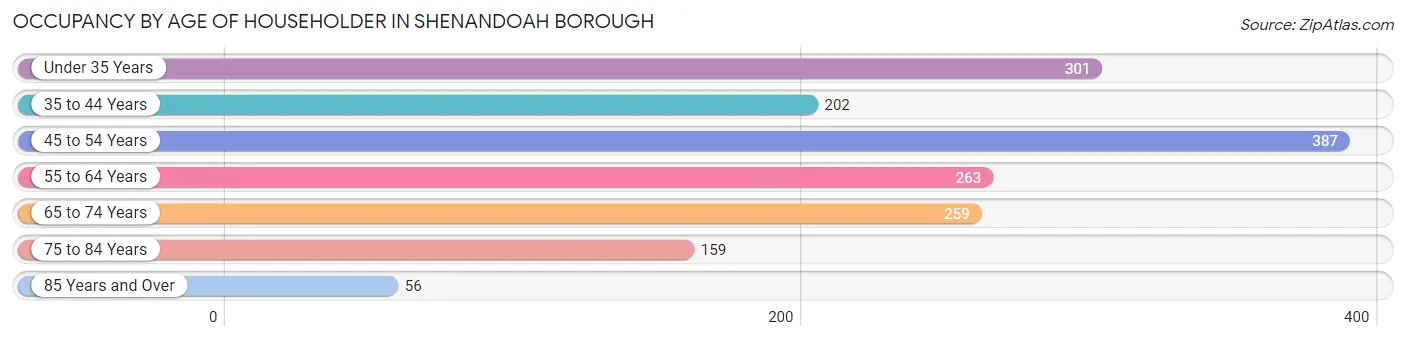
| Age Bracket | # Households | % Households |
| Under 35 Years | 301 | 18.5% |
| 35 to 44 Years | 202 | 12.4% |
| 45 to 54 Years | 387 | 23.8% |
| 55 to 64 Years | 263 | 16.2% |
| 65 to 74 Years | 259 | 15.9% |
| 75 to 84 Years | 159 | 9.8% |
| 85 Years and Over | 56 | 3.4% |
| Total | 1,627 | 100.0% |
Housing Finances in Shenandoah borough
Median Income by Occupancy in Shenandoah borough
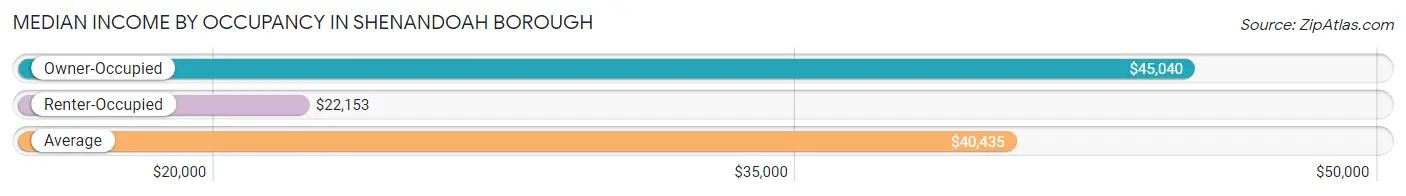
| Occupancy Type | # Households | Median Income |
| Owner-Occupied | 1,162 (71.4%) | $45,040 |
| Renter-Occupied | 465 (28.6%) | $22,153 |
| Average | 1,627 (100.0%) | $40,435 |
Occupancy by Householder Income Bracket in Shenandoah borough
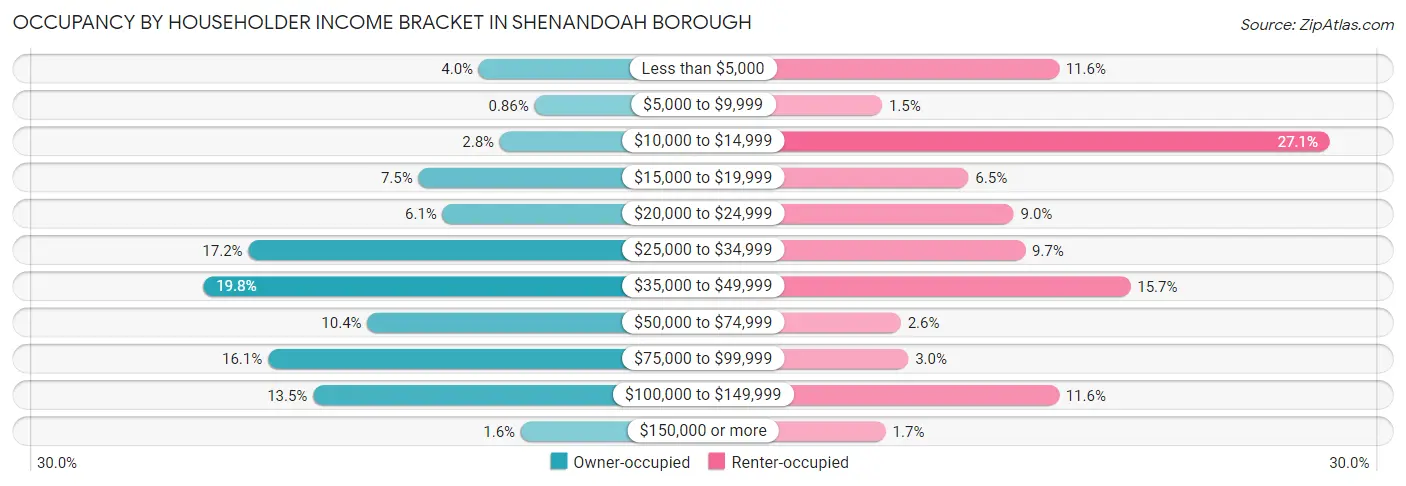
| Income Bracket | Owner-occupied | Renter-occupied |
| Less than $5,000 | 47 (4.0%) | 54 (11.6%) |
| $5,000 to $9,999 | 10 (0.9%) | 7 (1.5%) |
| $10,000 to $14,999 | 33 (2.8%) | 126 (27.1%) |
| $15,000 to $19,999 | 87 (7.5%) | 30 (6.5%) |
| $20,000 to $24,999 | 71 (6.1%) | 42 (9.0%) |
| $25,000 to $34,999 | 200 (17.2%) | 45 (9.7%) |
| $35,000 to $49,999 | 230 (19.8%) | 73 (15.7%) |
| $50,000 to $74,999 | 121 (10.4%) | 12 (2.6%) |
| $75,000 to $99,999 | 187 (16.1%) | 14 (3.0%) |
| $100,000 to $149,999 | 157 (13.5%) | 54 (11.6%) |
| $150,000 or more | 19 (1.6%) | 8 (1.7%) |
| Total | 1,162 (100.0%) | 465 (100.0%) |
Monthly Housing Cost Tiers in Shenandoah borough
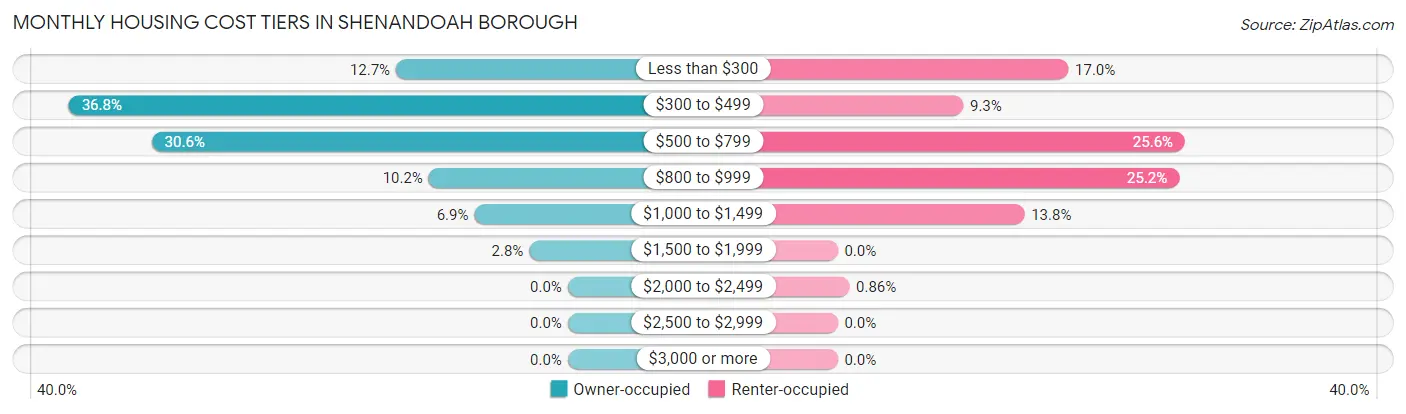
| Monthly Cost | Owner-occupied | Renter-occupied |
| Less than $300 | 147 (12.7%) | 79 (17.0%) |
| $300 to $499 | 427 (36.7%) | 43 (9.2%) |
| $500 to $799 | 356 (30.6%) | 119 (25.6%) |
| $800 to $999 | 119 (10.2%) | 117 (25.2%) |
| $1,000 to $1,499 | 80 (6.9%) | 64 (13.8%) |
| $1,500 to $1,999 | 33 (2.8%) | 0 (0.0%) |
| $2,000 to $2,499 | 0 (0.0%) | 4 (0.9%) |
| $2,500 to $2,999 | 0 (0.0%) | 0 (0.0%) |
| $3,000 or more | 0 (0.0%) | 0 (0.0%) |
| Total | 1,162 (100.0%) | 465 (100.0%) |
Physical Housing Characteristics in Shenandoah borough
Housing Structures in Shenandoah borough
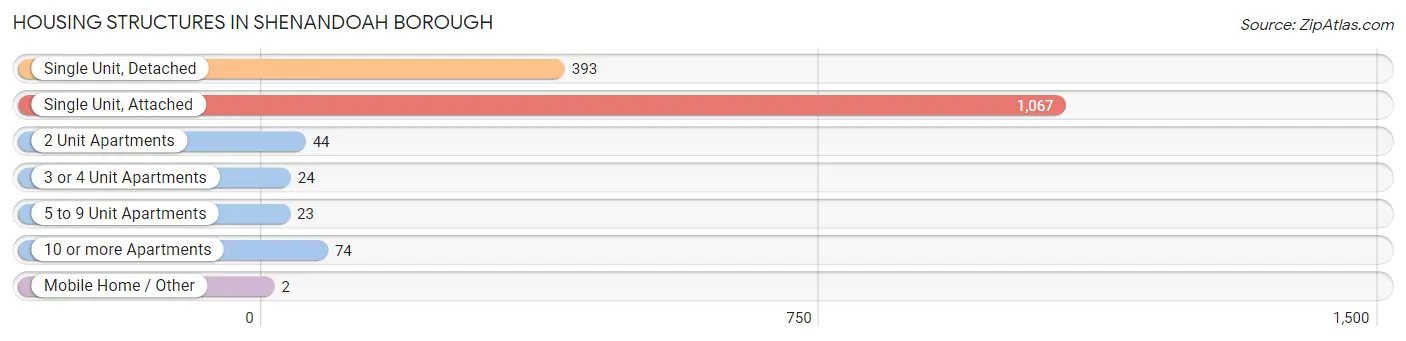
| Structure Type | # Housing Units | % Housing Units |
| Single Unit, Detached | 393 | 24.1% |
| Single Unit, Attached | 1,067 | 65.6% |
| 2 Unit Apartments | 44 | 2.7% |
| 3 or 4 Unit Apartments | 24 | 1.5% |
| 5 to 9 Unit Apartments | 23 | 1.4% |
| 10 or more Apartments | 74 | 4.5% |
| Mobile Home / Other | 2 | 0.1% |
| Total | 1,627 | 100.0% |
Housing Structures by Occupancy in Shenandoah borough
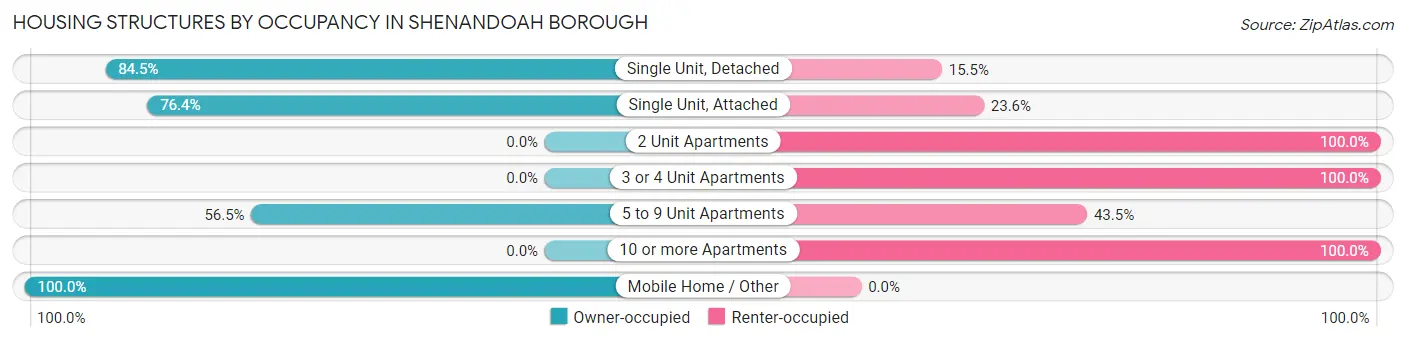
| Structure Type | Owner-occupied | Renter-occupied |
| Single Unit, Detached | 332 (84.5%) | 61 (15.5%) |
| Single Unit, Attached | 815 (76.4%) | 252 (23.6%) |
| 2 Unit Apartments | 0 (0.0%) | 44 (100.0%) |
| 3 or 4 Unit Apartments | 0 (0.0%) | 24 (100.0%) |
| 5 to 9 Unit Apartments | 13 (56.5%) | 10 (43.5%) |
| 10 or more Apartments | 0 (0.0%) | 74 (100.0%) |
| Mobile Home / Other | 2 (100.0%) | 0 (0.0%) |
| Total | 1,162 (71.4%) | 465 (28.6%) |
Housing Structures by Number of Rooms in Shenandoah borough
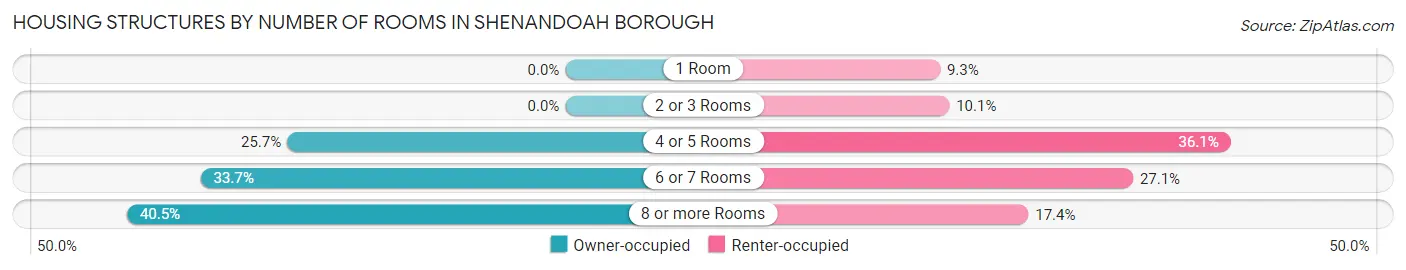
| Number of Rooms | Owner-occupied | Renter-occupied |
| 1 Room | 0 (0.0%) | 43 (9.2%) |
| 2 or 3 Rooms | 0 (0.0%) | 47 (10.1%) |
| 4 or 5 Rooms | 299 (25.7%) | 168 (36.1%) |
| 6 or 7 Rooms | 392 (33.7%) | 126 (27.1%) |
| 8 or more Rooms | 471 (40.5%) | 81 (17.4%) |
| Total | 1,162 (100.0%) | 465 (100.0%) |
Housing Structure by Heating Type in Shenandoah borough
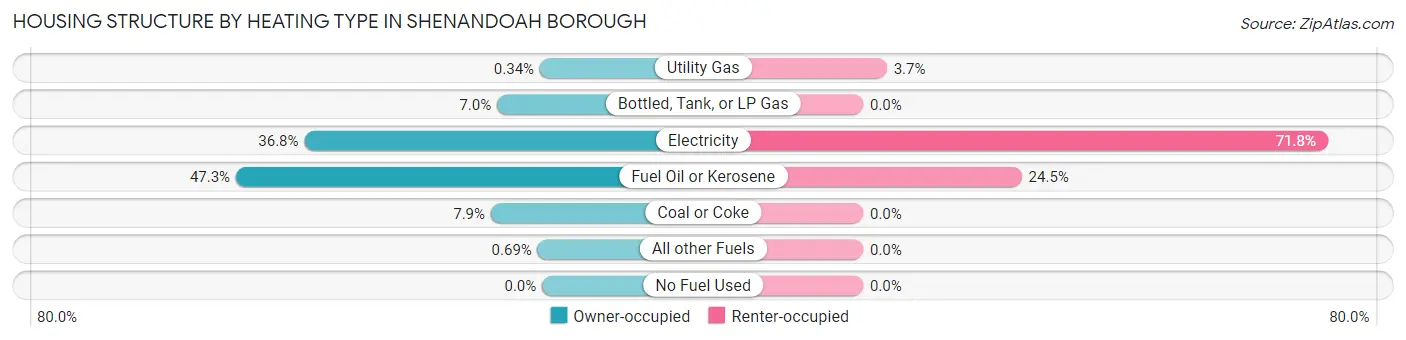
| Heating Type | Owner-occupied | Renter-occupied |
| Utility Gas | 4 (0.3%) | 17 (3.7%) |
| Bottled, Tank, or LP Gas | 81 (7.0%) | 0 (0.0%) |
| Electricity | 427 (36.7%) | 334 (71.8%) |
| Fuel Oil or Kerosene | 550 (47.3%) | 114 (24.5%) |
| Coal or Coke | 92 (7.9%) | 0 (0.0%) |
| All other Fuels | 8 (0.7%) | 0 (0.0%) |
| No Fuel Used | 0 (0.0%) | 0 (0.0%) |
| Total | 1,162 (100.0%) | 465 (100.0%) |
Household Vehicle Usage in Shenandoah borough
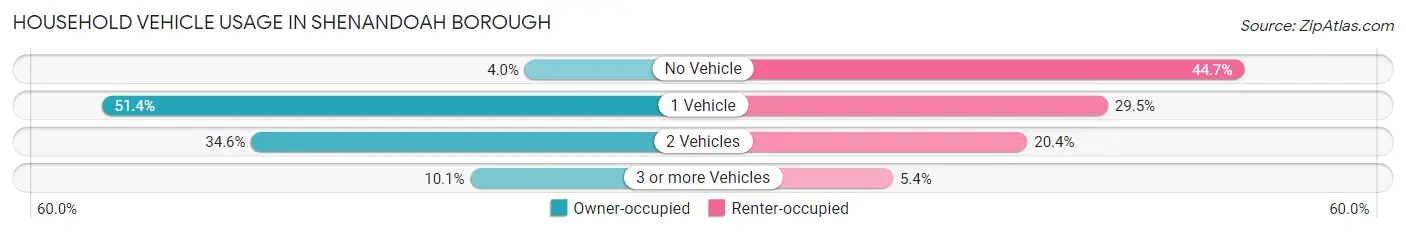
| Vehicles per Household | Owner-occupied | Renter-occupied |
| No Vehicle | 46 (4.0%) | 208 (44.7%) |
| 1 Vehicle | 597 (51.4%) | 137 (29.5%) |
| 2 Vehicles | 402 (34.6%) | 95 (20.4%) |
| 3 or more Vehicles | 117 (10.1%) | 25 (5.4%) |
| Total | 1,162 (100.0%) | 465 (100.0%) |
Real Estate & Mortgages in Shenandoah borough
Real Estate and Mortgage Overview in Shenandoah borough
| Characteristic | Without Mortgage | With Mortgage |
| Housing Units | 926 | 236 |
| Median Property Value | $36,400 | $61,900 |
| Median Household Income | $42,976 | $0 |
| Monthly Housing Costs | $451 | $0 |
| Real Estate Taxes | $790 | $0 |
Property Value by Mortgage Status in Shenandoah borough
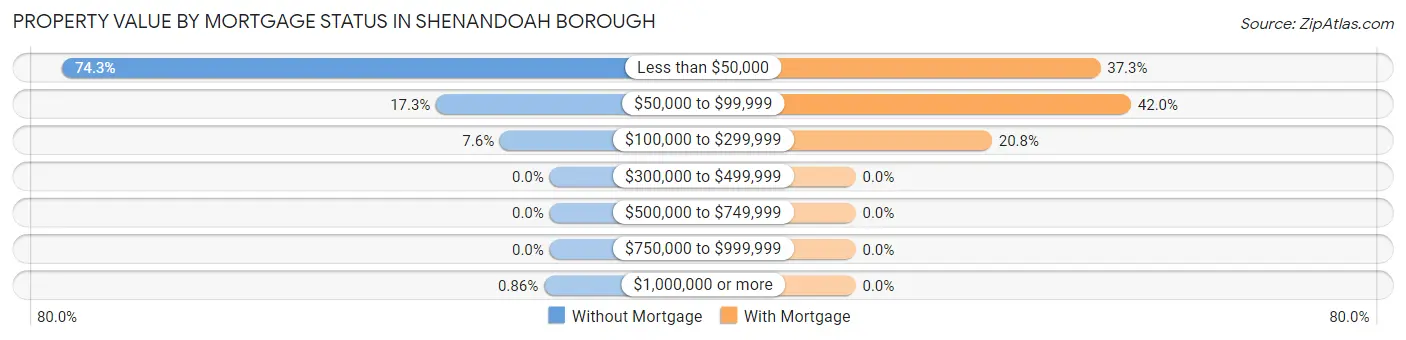
| Property Value | Without Mortgage | With Mortgage |
| Less than $50,000 | 688 (74.3%) | 88 (37.3%) |
| $50,000 to $99,999 | 160 (17.3%) | 99 (41.9%) |
| $100,000 to $299,999 | 70 (7.6%) | 49 (20.8%) |
| $300,000 to $499,999 | 0 (0.0%) | 0 (0.0%) |
| $500,000 to $749,999 | 0 (0.0%) | 0 (0.0%) |
| $750,000 to $999,999 | 0 (0.0%) | 0 (0.0%) |
| $1,000,000 or more | 8 (0.9%) | 0 (0.0%) |
| Total | 926 (100.0%) | 236 (100.0%) |
Household Income by Mortgage Status in Shenandoah borough
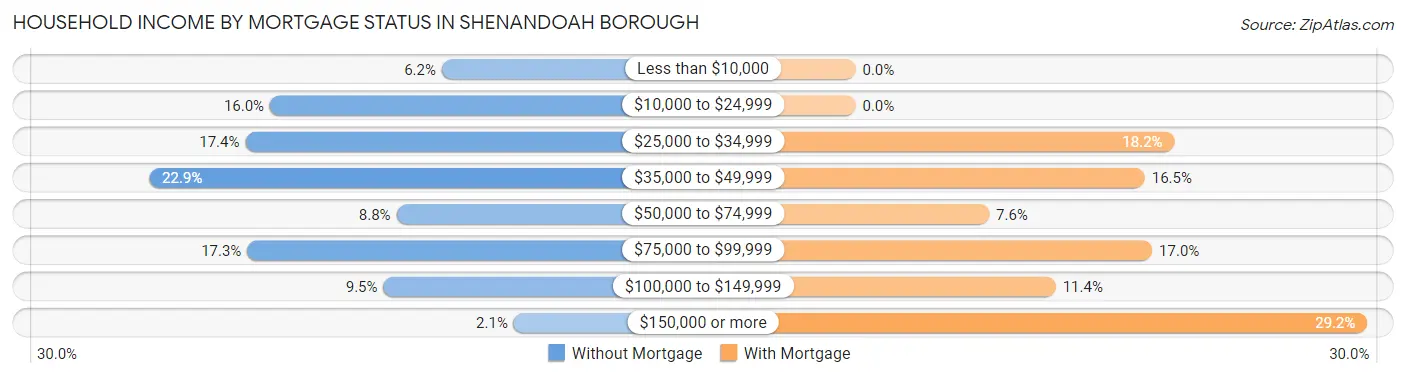
| Household Income | Without Mortgage | With Mortgage |
| Less than $10,000 | 57 (6.2%) | 0 (0.0%) |
| $10,000 to $24,999 | 148 (16.0%) | 0 (0.0%) |
| $25,000 to $34,999 | 161 (17.4%) | 43 (18.2%) |
| $35,000 to $49,999 | 212 (22.9%) | 39 (16.5%) |
| $50,000 to $74,999 | 81 (8.7%) | 18 (7.6%) |
| $75,000 to $99,999 | 160 (17.3%) | 40 (17.0%) |
| $100,000 to $149,999 | 88 (9.5%) | 27 (11.4%) |
| $150,000 or more | 19 (2.1%) | 69 (29.2%) |
| Total | 926 (100.0%) | 236 (100.0%) |
Property Value to Household Income Ratio in Shenandoah borough
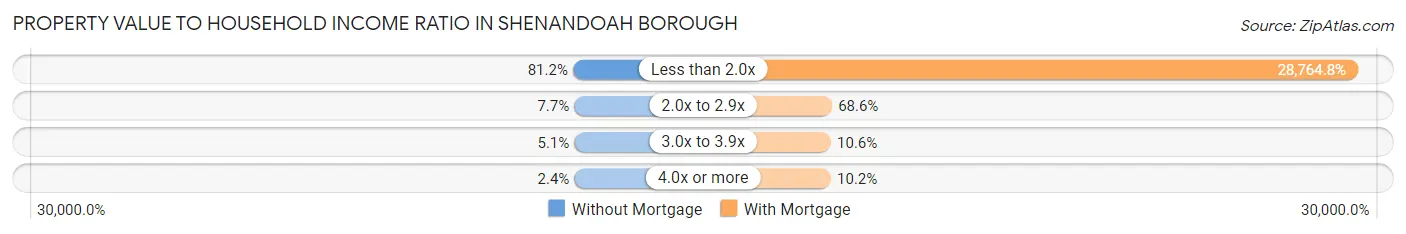
| Value-to-Income Ratio | Without Mortgage | With Mortgage |
| Less than 2.0x | 752 (81.2%) | 67,885 (28,764.8%) |
| 2.0x to 2.9x | 71 (7.7%) | 162 (68.6%) |
| 3.0x to 3.9x | 47 (5.1%) | 25 (10.6%) |
| 4.0x or more | 22 (2.4%) | 24 (10.2%) |
| Total | 926 (100.0%) | 236 (100.0%) |
Real Estate Taxes by Mortgage Status in Shenandoah borough
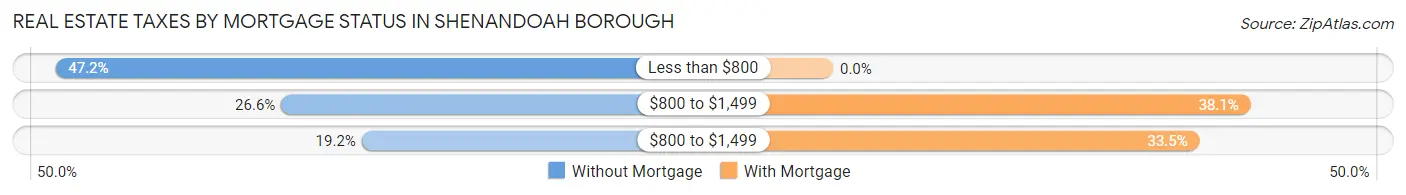
| Property Taxes | Without Mortgage | With Mortgage |
| Less than $800 | 437 (47.2%) | 0 (0.0%) |
| $800 to $1,499 | 246 (26.6%) | 90 (38.1%) |
| $800 to $1,499 | 178 (19.2%) | 79 (33.5%) |
| Total | 926 (100.0%) | 236 (100.0%) |
Health & Disability in Shenandoah borough
Health Insurance Coverage by Age in Shenandoah borough
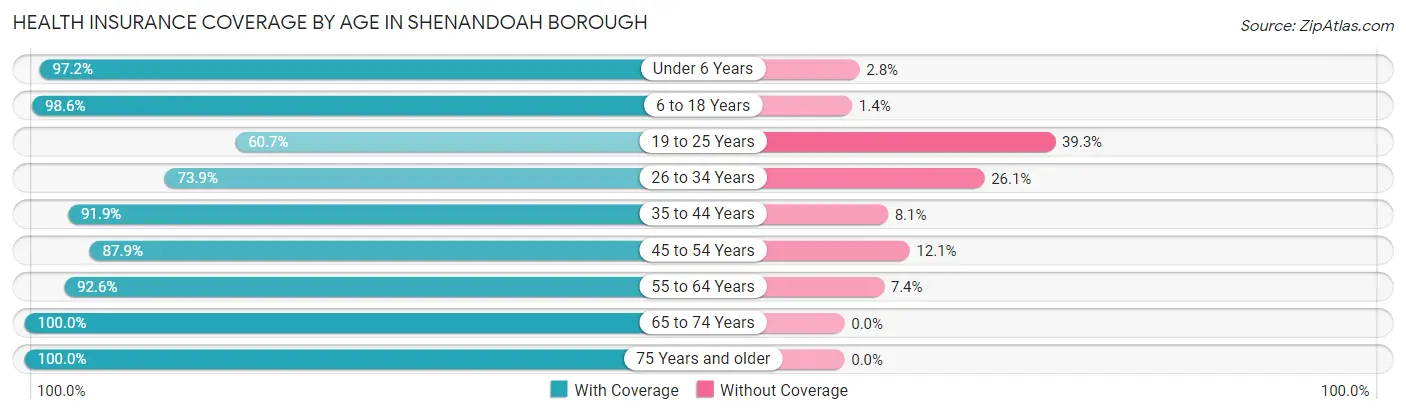
| Age Bracket | With Coverage | Without Coverage |
| Under 6 Years | 415 (97.2%) | 12 (2.8%) |
| 6 to 18 Years | 835 (98.6%) | 12 (1.4%) |
| 19 to 25 Years | 269 (60.7%) | 174 (39.3%) |
| 26 to 34 Years | 340 (73.9%) | 120 (26.1%) |
| 35 to 44 Years | 375 (91.9%) | 33 (8.1%) |
| 45 to 54 Years | 427 (87.9%) | 59 (12.1%) |
| 55 to 64 Years | 403 (92.6%) | 32 (7.4%) |
| 65 to 74 Years | 332 (100.0%) | 0 (0.0%) |
| 75 Years and older | 291 (100.0%) | 0 (0.0%) |
| Total | 3,687 (89.3%) | 442 (10.7%) |
Health Insurance Coverage by Citizenship Status in Shenandoah borough
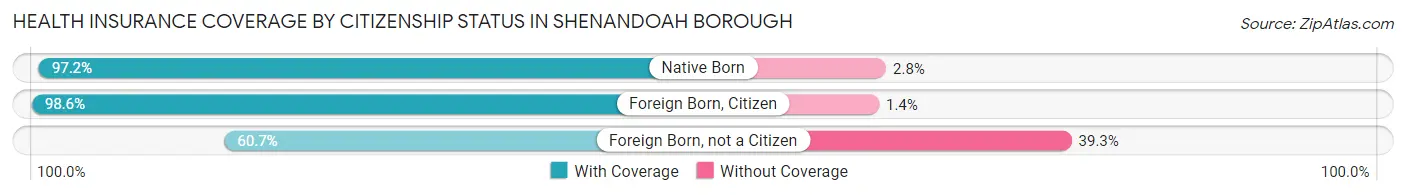
| Citizenship Status | With Coverage | Without Coverage |
| Native Born | 415 (97.2%) | 12 (2.8%) |
| Foreign Born, Citizen | 835 (98.6%) | 12 (1.4%) |
| Foreign Born, not a Citizen | 269 (60.7%) | 174 (39.3%) |
Health Insurance Coverage by Household Income in Shenandoah borough
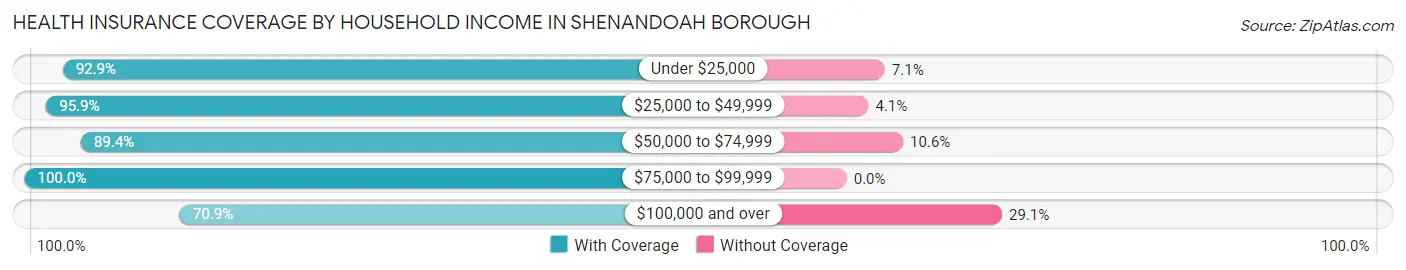
| Household Income | With Coverage | Without Coverage |
| Under $25,000 | 1,158 (92.9%) | 89 (7.1%) |
| $25,000 to $49,999 | 1,084 (95.9%) | 46 (4.1%) |
| $50,000 to $74,999 | 254 (89.4%) | 30 (10.6%) |
| $75,000 to $99,999 | 503 (100.0%) | 0 (0.0%) |
| $100,000 and over | 675 (70.9%) | 277 (29.1%) |
Public vs Private Health Insurance Coverage by Age in Shenandoah borough
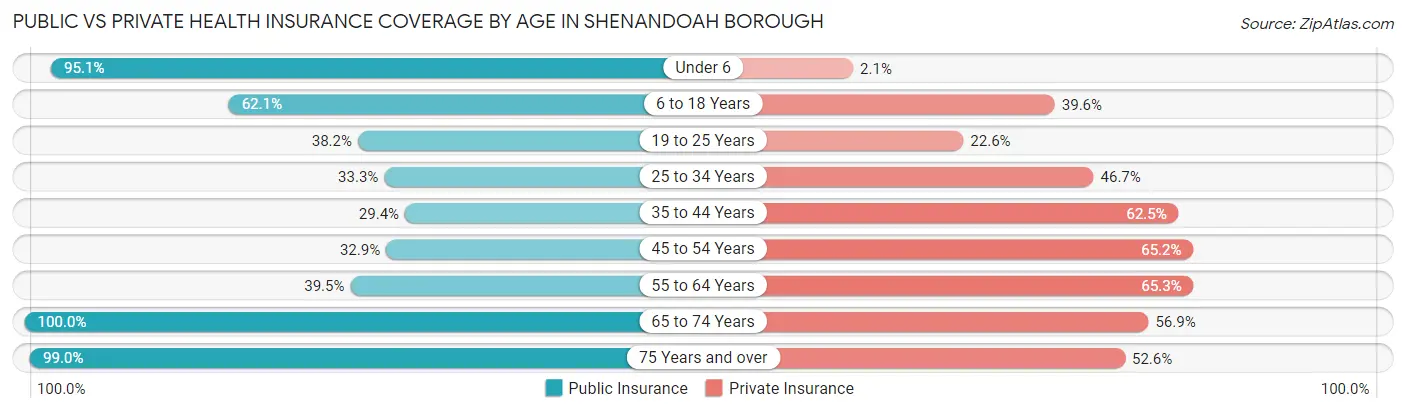
| Age Bracket | Public Insurance | Private Insurance |
| Under 6 | 406 (95.1%) | 9 (2.1%) |
| 6 to 18 Years | 526 (62.1%) | 335 (39.6%) |
| 19 to 25 Years | 169 (38.2%) | 100 (22.6%) |
| 25 to 34 Years | 153 (33.3%) | 215 (46.7%) |
| 35 to 44 Years | 120 (29.4%) | 255 (62.5%) |
| 45 to 54 Years | 160 (32.9%) | 317 (65.2%) |
| 55 to 64 Years | 172 (39.5%) | 284 (65.3%) |
| 65 to 74 Years | 332 (100.0%) | 189 (56.9%) |
| 75 Years and over | 288 (99.0%) | 153 (52.6%) |
| Total | 2,326 (56.3%) | 1,857 (45.0%) |
Disability Status by Sex by Age in Shenandoah borough
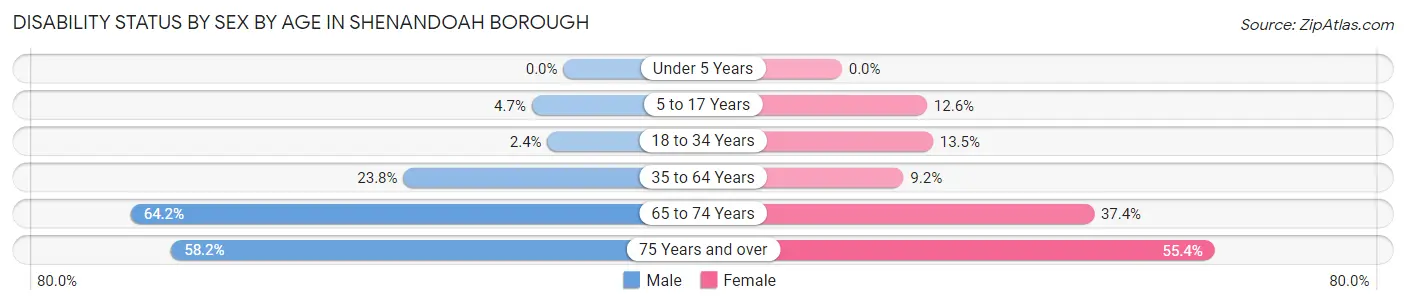
| Age Bracket | Male | Female |
| Under 5 Years | 0 (0.0%) | 0 (0.0%) |
| 5 to 17 Years | 39 (4.7%) | 33 (12.6%) |
| 18 to 34 Years | 12 (2.4%) | 55 (13.5%) |
| 35 to 64 Years | 173 (23.8%) | 55 (9.1%) |
| 65 to 74 Years | 88 (64.2%) | 73 (37.4%) |
| 75 Years and over | 39 (58.2%) | 124 (55.4%) |
Disability Class by Sex by Age in Shenandoah borough
Disability Class: Hearing Difficulty
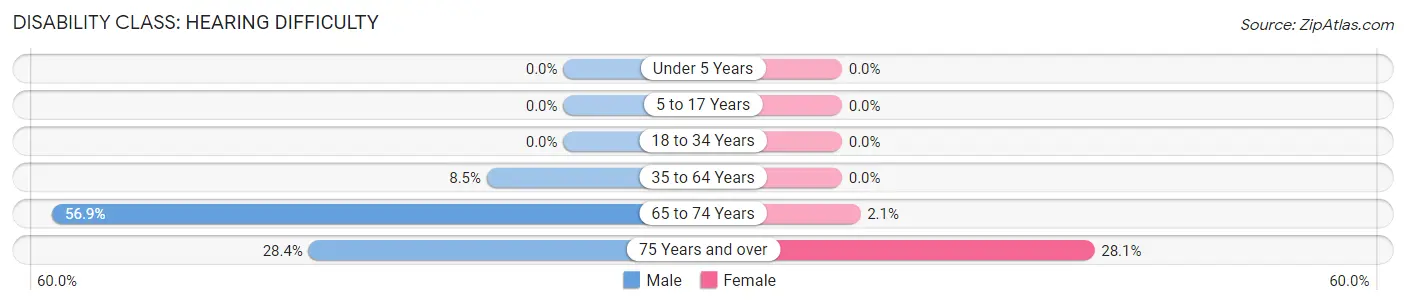
| Age Bracket | Male | Female |
| Under 5 Years | 0 (0.0%) | 0 (0.0%) |
| 5 to 17 Years | 0 (0.0%) | 0 (0.0%) |
| 18 to 34 Years | 0 (0.0%) | 0 (0.0%) |
| 35 to 64 Years | 62 (8.5%) | 0 (0.0%) |
| 65 to 74 Years | 78 (56.9%) | 4 (2.1%) |
| 75 Years and over | 19 (28.4%) | 63 (28.1%) |
Disability Class: Vision Difficulty
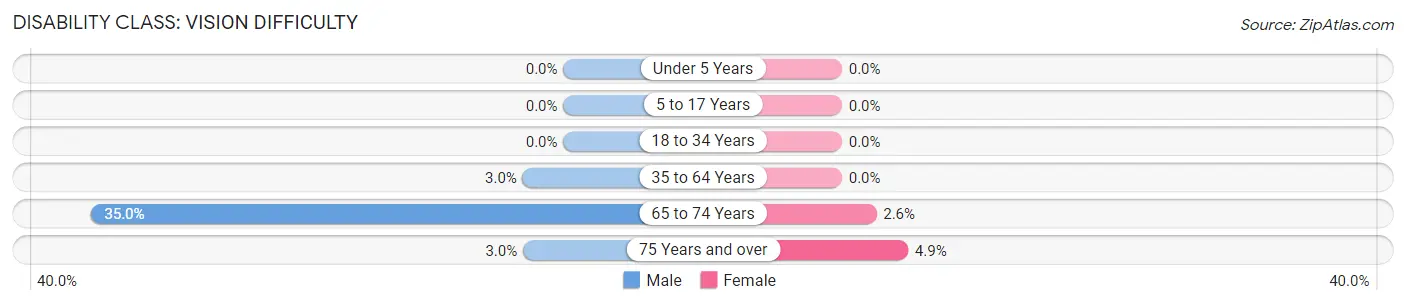
| Age Bracket | Male | Female |
| Under 5 Years | 0 (0.0%) | 0 (0.0%) |
| 5 to 17 Years | 0 (0.0%) | 0 (0.0%) |
| 18 to 34 Years | 0 (0.0%) | 0 (0.0%) |
| 35 to 64 Years | 22 (3.0%) | 0 (0.0%) |
| 65 to 74 Years | 48 (35.0%) | 5 (2.6%) |
| 75 Years and over | 2 (3.0%) | 11 (4.9%) |
Disability Class: Cognitive Difficulty
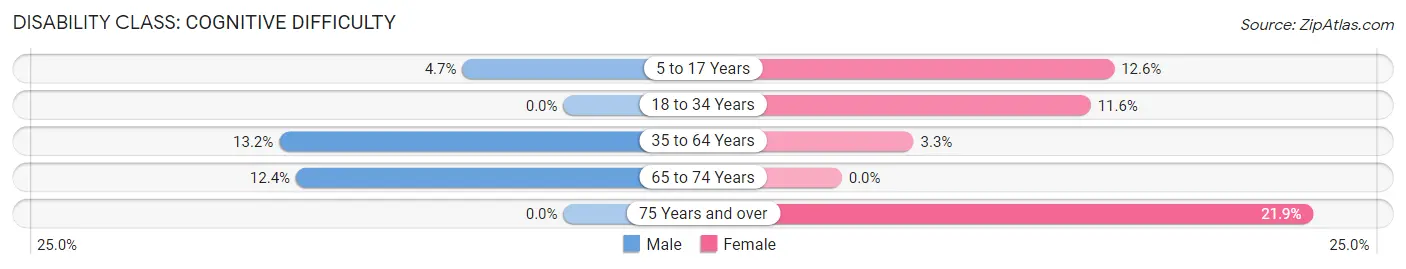
| Age Bracket | Male | Female |
| 5 to 17 Years | 39 (4.7%) | 33 (12.6%) |
| 18 to 34 Years | 0 (0.0%) | 47 (11.6%) |
| 35 to 64 Years | 96 (13.2%) | 20 (3.3%) |
| 65 to 74 Years | 17 (12.4%) | 0 (0.0%) |
| 75 Years and over | 0 (0.0%) | 49 (21.9%) |
Disability Class: Ambulatory Difficulty
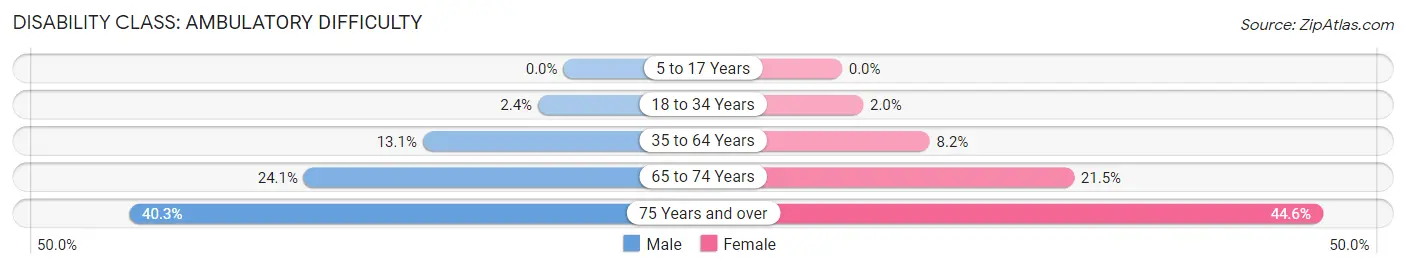
| Age Bracket | Male | Female |
| 5 to 17 Years | 0 (0.0%) | 0 (0.0%) |
| 18 to 34 Years | 12 (2.4%) | 8 (2.0%) |
| 35 to 64 Years | 95 (13.1%) | 49 (8.2%) |
| 65 to 74 Years | 33 (24.1%) | 42 (21.5%) |
| 75 Years and over | 27 (40.3%) | 100 (44.6%) |
Disability Class: Self-Care Difficulty
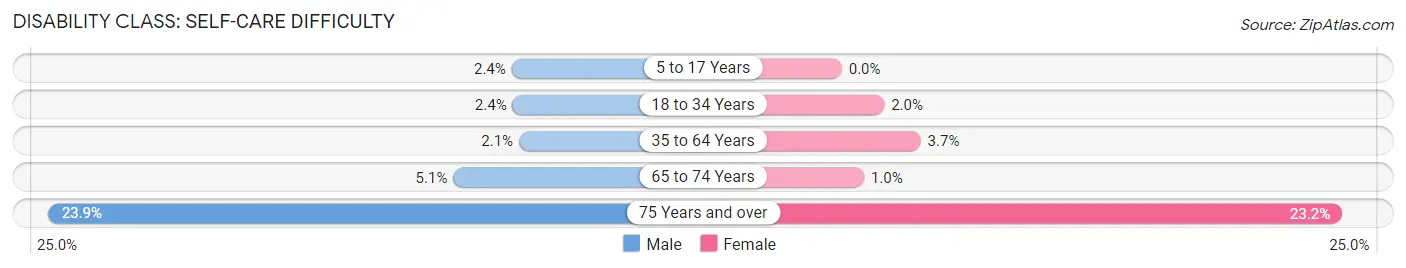
| Age Bracket | Male | Female |
| 5 to 17 Years | 20 (2.4%) | 0 (0.0%) |
| 18 to 34 Years | 12 (2.4%) | 8 (2.0%) |
| 35 to 64 Years | 15 (2.1%) | 22 (3.7%) |
| 65 to 74 Years | 7 (5.1%) | 2 (1.0%) |
| 75 Years and over | 16 (23.9%) | 52 (23.2%) |
Technology Access in Shenandoah borough
Computing Device Access in Shenandoah borough
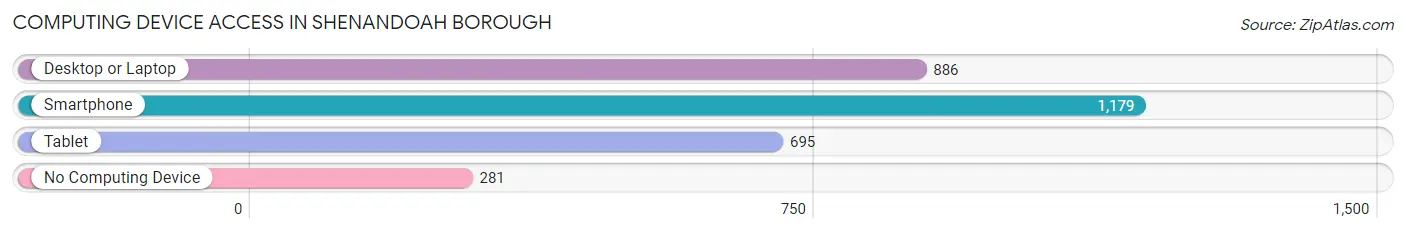
| Device Type | # Households | % Households |
| Desktop or Laptop | 886 | 54.5% |
| Smartphone | 1,179 | 72.5% |
| Tablet | 695 | 42.7% |
| No Computing Device | 281 | 17.3% |
| Total | 1,627 | 100.0% |
Internet Access in Shenandoah borough
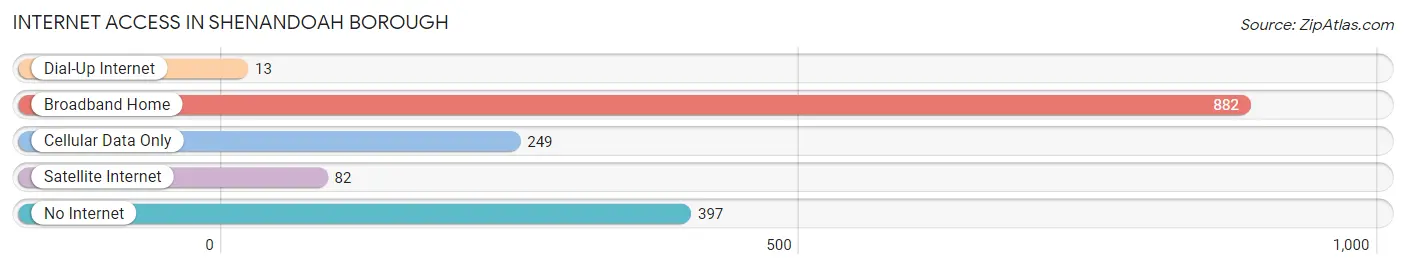
| Internet Type | # Households | % Households |
| Dial-Up Internet | 13 | 0.8% |
| Broadband Home | 882 | 54.2% |
| Cellular Data Only | 249 | 15.3% |
| Satellite Internet | 82 | 5.0% |
| No Internet | 397 | 24.4% |
| Total | 1,627 | 100.0% |
Shenandoah borough Summary
Shenandoah Borough is a small borough located in Schuylkill County, Pennsylvania. It is situated in the heart of the anthracite coal region of the state, and is home to a population of approximately 5,000 people. The borough is located in the southern part of the county, and is bordered by the towns of Frackville, Mahanoy City, and Shenandoah Heights.
History
Shenandoah Borough was founded in 1845 by a group of Welsh immigrants who had come to the area to work in the coal mines. The town was originally known as “Shenandoah Valley”, and was named after the nearby Shenandoah River. The town was incorporated as a borough in 1851, and the first mayor was elected in 1852.
The town grew rapidly in the late 19th century, as the coal industry in the area flourished. The population of the borough increased from 1,000 in 1880 to over 5,000 by the turn of the century. The town was home to a variety of businesses, including coal mines, brickyards, and breweries.
The town was also home to a large number of immigrants, including Poles, Slovaks, Lithuanians, and Ukrainians. These immigrants brought with them their own culture and traditions, which can still be seen in the town today.
Geography
Shenandoah Borough is located in the southern part of Schuylkill County, Pennsylvania. It is situated in the heart of the anthracite coal region of the state, and is bordered by the towns of Frackville, Mahanoy City, and Shenandoah Heights. The borough is located at an elevation of 1,000 feet above sea level, and is situated on the banks of the Shenandoah River.
The borough covers an area of 1.2 square miles, and is home to a population of approximately 5,000 people. The town is located in the Appalachian Mountains, and is surrounded by rolling hills and forests. The climate in the area is humid continental, with cold winters and hot summers.
Economy
The economy of Shenandoah Borough is largely based on the coal industry. The town is home to several coal mines, and the coal industry is the main source of employment for the town’s residents. The town is also home to a variety of other businesses, including brickyards, breweries, and retail stores.
The town is also home to a number of manufacturing companies, including a paper mill and a steel mill. The town is also home to a number of small businesses, including restaurants, bars, and shops.
Demographics
As of the 2010 census, the population of Shenandoah Borough was 5,071. The racial makeup of the town was 94.3% White, 2.3% African American, 0.3% Native American, 0.7% Asian, 0.1% Pacific Islander, and 2.3% from other races. Hispanic or Latino of any race were 4.2% of the population.
The median household income in the borough was $31,250, and the median family income was $37,500. The per capita income for the borough was $15,945. About 17.2% of the population was below the poverty line.
Shenandoah Borough is a small borough located in Schuylkill County, Pennsylvania. It is situated in the heart of the anthracite coal region of the state, and is home to a population of approximately 5,000 people. The borough has a long history, and is home to a variety of businesses and industries. The economy of the borough is largely based on the coal industry, and the town is also home to a number of small businesses. The population of the borough is largely white, with a small percentage of African Americans, Native Americans, Asians, and other races. The median household income in the borough is $31,250, and the per capita income is $15,945.
Common Questions
What is Per Capita Income in Shenandoah borough?
Per Capita income in Shenandoah borough is $25,799.
What is the Median Family Income in Shenandoah borough?
Median Family Income in Shenandoah borough is $42,245.
What is the Median Household income in Shenandoah borough?
Median Household Income in Shenandoah borough is $40,435.
What is Income or Wage Gap in Shenandoah borough?
Income or Wage Gap in Shenandoah borough is 45.3%.
Women in Shenandoah borough earn 54.7 cents for every dollar earned by a man.
What is Family Income Deficit in Shenandoah borough?
Family Income Deficit in Shenandoah borough is $10,639.
Families that are below poverty line in Shenandoah borough earn $10,639 less on average than the poverty threshold level.
What is Inequality or Gini Index in Shenandoah borough?
Inequality or Gini Index in Shenandoah borough is 0.53.
What is the Total Population of Shenandoah borough?
Total Population of Shenandoah borough is 4,288.
What is the Total Male Population of Shenandoah borough?
Total Male Population of Shenandoah borough is 2,384.
What is the Total Female Population of Shenandoah borough?
Total Female Population of Shenandoah borough is 1,904.
What is the Ratio of Males per 100 Females in Shenandoah borough?
There are 125.21 Males per 100 Females in Shenandoah borough.
What is the Ratio of Females per 100 Males in Shenandoah borough?
There are 79.87 Females per 100 Males in Shenandoah borough.
What is the Median Population Age in Shenandoah borough?
Median Population Age in Shenandoah borough is 32.9 Years.
What is the Average Family Size in Shenandoah borough
Average Family Size in Shenandoah borough is 3.5 People.
What is the Average Household Size in Shenandoah borough
Average Household Size in Shenandoah borough is 2.5 People.
How Large is the Labor Force in Shenandoah borough?
There are 1,544 People in the Labor Forcein in Shenandoah borough.
What is the Percentage of People in the Labor Force in Shenandoah borough?
50.1% of People are in the Labor Force in Shenandoah borough.
What is the Unemployment Rate in Shenandoah borough?
Unemployment Rate in Shenandoah borough is 11.8%.