Mifflintown borough, PA Map & Demographics
Mifflintown borough Overview
$26,414
PER CAPITA INCOME
$47,188
AVG FAMILY INCOME
$48,333
AVG HOUSEHOLD INCOME
34.0%
WAGE / INCOME GAP [ % ]
66.0¢/ $1
WAGE / INCOME GAP [ $ ]
0.36
INEQUALITY / GINI INDEX
886
TOTAL POPULATION
510
MALE POPULATION
376
FEMALE POPULATION
135.64
MALES / 100 FEMALES
73.73
FEMALES / 100 MALES
41.4
MEDIAN AGE
3.1
AVG FAMILY SIZE
2.5
AVG HOUSEHOLD SIZE
479
LABOR FORCE [ PEOPLE ]
63.7%
PERCENT IN LABOR FORCE
7.5%
UNEMPLOYMENT RATE
Income in Mifflintown borough
Income Overview in Mifflintown borough
Per Capita Income in Mifflintown borough is $26,414, while median incomes of families and households are $47,188 and $48,333 respectively.
| Characteristic | Number | Measure |
| Per Capita Income | 886 | $26,414 |
| Median Family Income | 229 | $47,188 |
| Mean Family Income | 229 | $68,182 |
| Median Household Income | 348 | $48,333 |
| Mean Household Income | 348 | $63,676 |
| Income Deficit | 229 | $0 |
| Wage / Income Gap (%) | 886 | 33.99% |
| Wage / Income Gap ($) | 886 | 66.01¢ per $1 |
| Gini / Inequality Index | 886 | 0.36 |
Earnings by Sex in Mifflintown borough
Average Earnings in Mifflintown borough are $33,194, $36,452 for men and $24,063 for women, a difference of 34.0%.
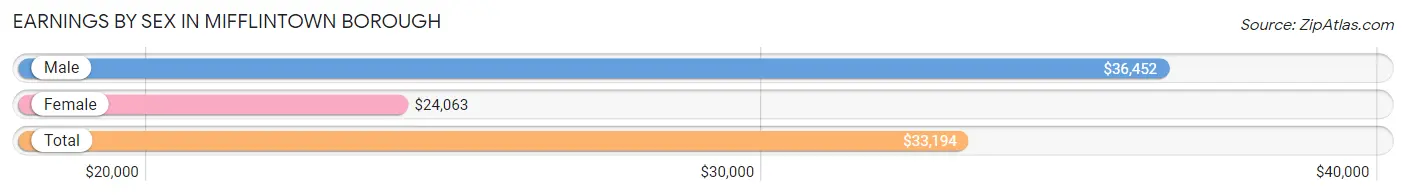
| Sex | Number | Average Earnings |
| Male | 318 (63.7%) | $36,452 |
| Female | 181 (36.3%) | $24,063 |
| Total | 499 (100.0%) | $33,194 |
Earnings by Sex by Income Bracket in Mifflintown borough
The most common earnings brackets in Mifflintown borough are $30,000 to $34,999 for men (51 | 16.0%) and $25,000 to $29,999 for women (24 | 13.3%).
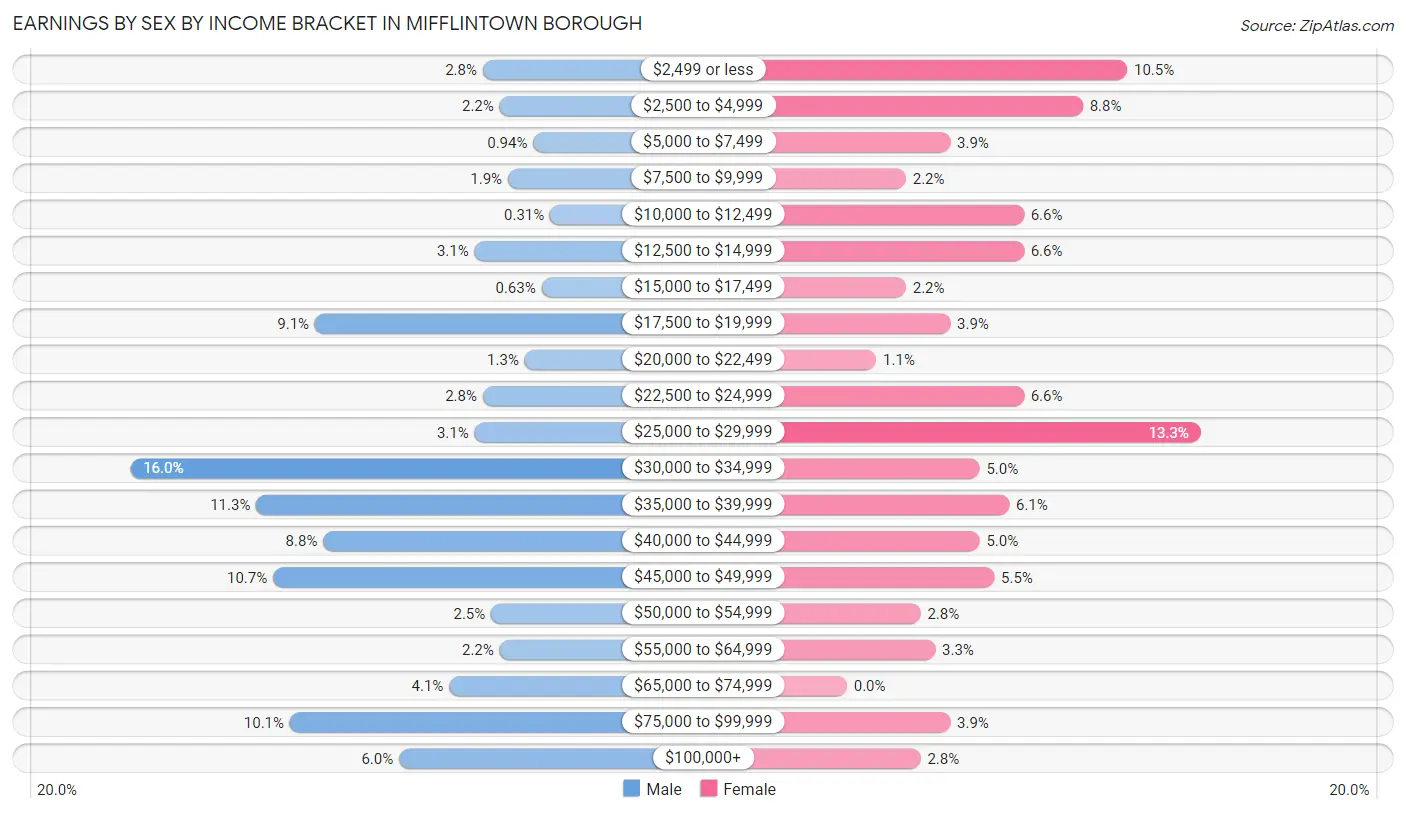
| Income | Male | Female |
| $2,499 or less | 9 (2.8%) | 19 (10.5%) |
| $2,500 to $4,999 | 7 (2.2%) | 16 (8.8%) |
| $5,000 to $7,499 | 3 (0.9%) | 7 (3.9%) |
| $7,500 to $9,999 | 6 (1.9%) | 4 (2.2%) |
| $10,000 to $12,499 | 1 (0.3%) | 12 (6.6%) |
| $12,500 to $14,999 | 10 (3.1%) | 12 (6.6%) |
| $15,000 to $17,499 | 2 (0.6%) | 4 (2.2%) |
| $17,500 to $19,999 | 29 (9.1%) | 7 (3.9%) |
| $20,000 to $22,499 | 4 (1.3%) | 2 (1.1%) |
| $22,500 to $24,999 | 9 (2.8%) | 12 (6.6%) |
| $25,000 to $29,999 | 10 (3.1%) | 24 (13.3%) |
| $30,000 to $34,999 | 51 (16.0%) | 9 (5.0%) |
| $35,000 to $39,999 | 36 (11.3%) | 11 (6.1%) |
| $40,000 to $44,999 | 28 (8.8%) | 9 (5.0%) |
| $45,000 to $49,999 | 34 (10.7%) | 10 (5.5%) |
| $50,000 to $54,999 | 8 (2.5%) | 5 (2.8%) |
| $55,000 to $64,999 | 7 (2.2%) | 6 (3.3%) |
| $65,000 to $74,999 | 13 (4.1%) | 0 (0.0%) |
| $75,000 to $99,999 | 32 (10.1%) | 7 (3.9%) |
| $100,000+ | 19 (6.0%) | 5 (2.8%) |
| Total | 318 (100.0%) | 181 (100.0%) |
Earnings by Sex by Educational Attainment in Mifflintown borough
Average earnings in Mifflintown borough are $37,750 for men and $28,125 for women, a difference of 25.5%. Men with an educational attainment of college or associate's degree enjoy the highest average annual earnings of $45,774, while those with less than high school education earn the least with $36,136. Women with an educational attainment of bachelor's degree earn the most with the average annual earnings of $57,083, while those with high school diploma education have the smallest earnings of $19,643.
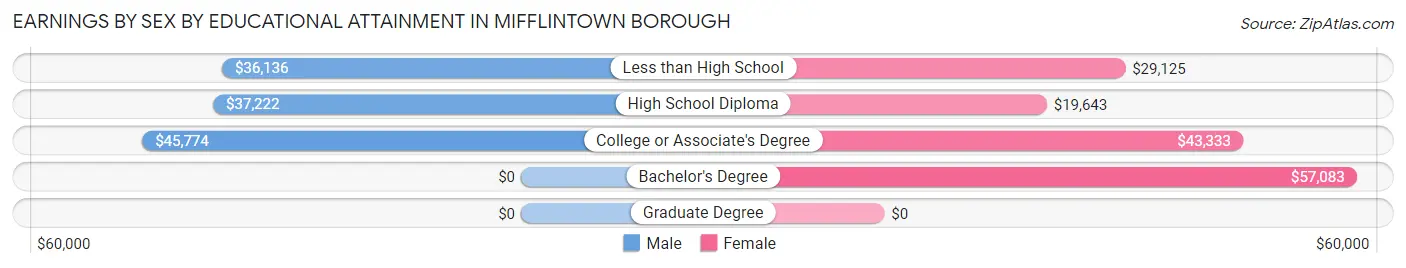
| Educational Attainment | Male Income | Female Income |
| Less than High School | $36,136 | $29,125 |
| High School Diploma | $37,222 | $19,643 |
| College or Associate's Degree | $45,774 | $43,333 |
| Bachelor's Degree | - | - |
| Graduate Degree | - | - |
| Total | $37,750 | $28,125 |
Family Income in Mifflintown borough
Family Income Brackets in Mifflintown borough
According to the Mifflintown borough family income data, there are 103 families falling into the $35,000 to $49,999 income range, which is the most common income bracket and makes up 45.0% of all families.
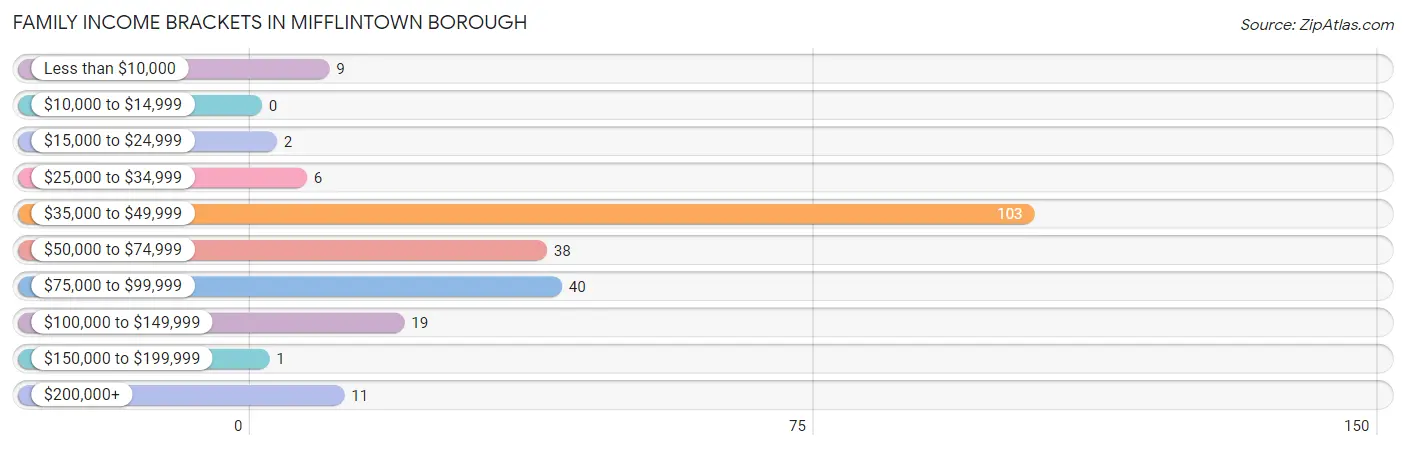
| Income Bracket | # Families | % Families |
| Less than $10,000 | 9 | 3.9% |
| $10,000 to $14,999 | 0 | 0.0% |
| $15,000 to $24,999 | 2 | 0.9% |
| $25,000 to $34,999 | 6 | 2.6% |
| $35,000 to $49,999 | 103 | 45.0% |
| $50,000 to $74,999 | 38 | 16.6% |
| $75,000 to $99,999 | 40 | 17.5% |
| $100,000 to $149,999 | 19 | 8.3% |
| $150,000 to $199,999 | 1 | 0.4% |
| $200,000+ | 11 | 4.8% |
Family Income by Famaliy Size in Mifflintown borough
4-person families (57 | 24.9%) account for the highest median family income in Mifflintown borough with $56,875 per family, while 2-person families (106 | 46.3%) have the highest median income of $26,818 per family member.
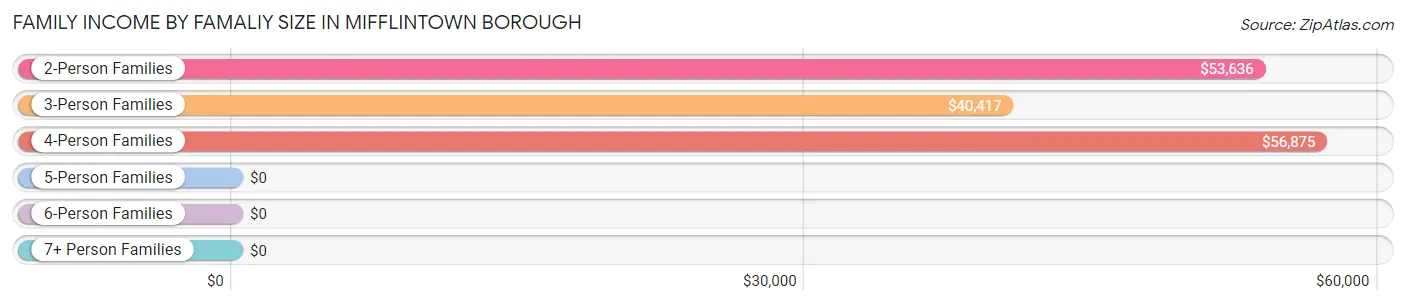
| Income Bracket | # Families | Median Income |
| 2-Person Families | 106 (46.3%) | $53,636 |
| 3-Person Families | 29 (12.7%) | $40,417 |
| 4-Person Families | 57 (24.9%) | $56,875 |
| 5-Person Families | 37 (16.2%) | $0 |
| 6-Person Families | 0 (0.0%) | $0 |
| 7+ Person Families | 0 (0.0%) | $0 |
| Total | 229 (100.0%) | $47,188 |
Family Income by Number of Earners in Mifflintown borough
The median family income in Mifflintown borough is $47,188, with families comprising 3+ earners (27) having the highest median family income of $127,083, while families with no earners (22) have the lowest median family income of $37,500, accounting for 11.8% and 9.6% of families, respectively.
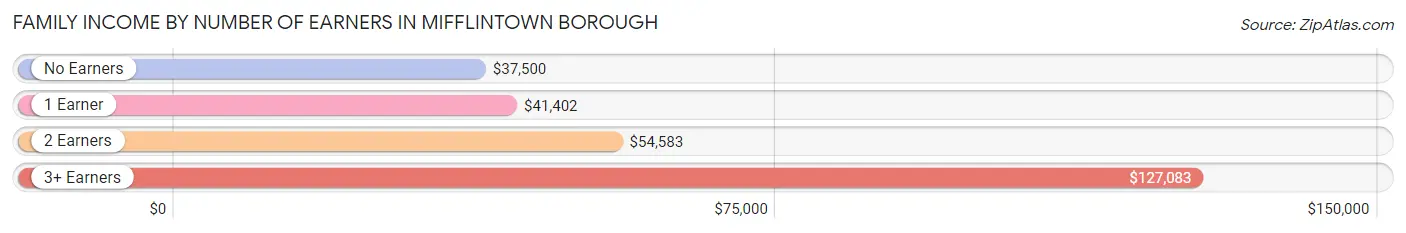
| Number of Earners | # Families | Median Income |
| No Earners | 22 (9.6%) | $37,500 |
| 1 Earner | 89 (38.9%) | $41,402 |
| 2 Earners | 91 (39.7%) | $54,583 |
| 3+ Earners | 27 (11.8%) | $127,083 |
| Total | 229 (100.0%) | $47,188 |
Household Income in Mifflintown borough
Household Income Brackets in Mifflintown borough
With 112 households falling in the category, the $35,000 to $49,999 income range is the most frequent in Mifflintown borough, accounting for 32.2% of all households. In contrast, only 3 households (0.9%) fall into the $150,000 to $199,999 income bracket, making it the least populous group.
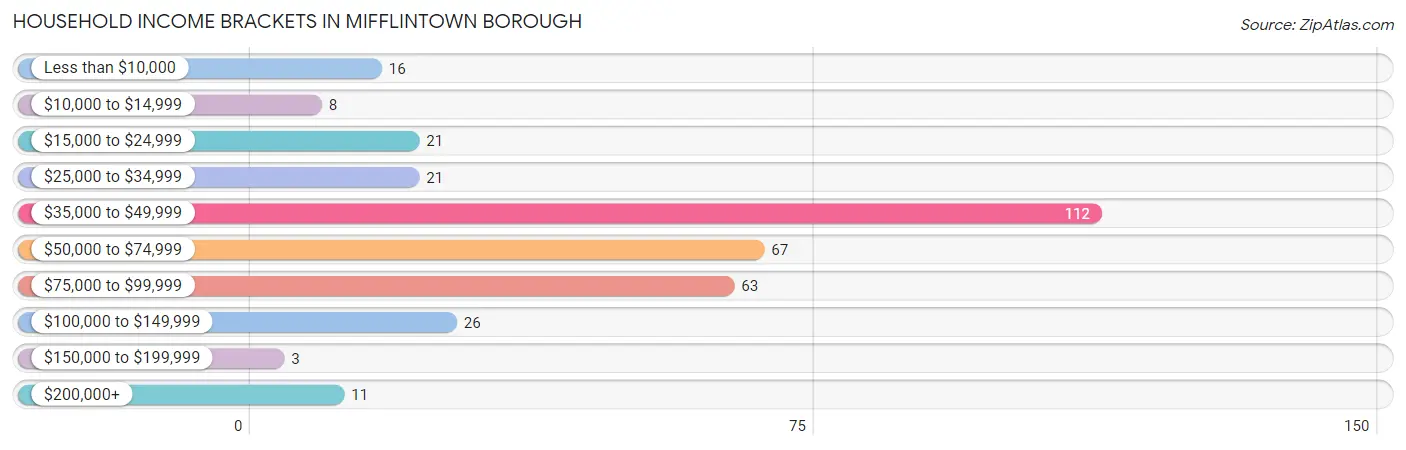
| Income Bracket | # Households | % Households |
| Less than $10,000 | 16 | 4.6% |
| $10,000 to $14,999 | 8 | 2.3% |
| $15,000 to $24,999 | 21 | 6.0% |
| $25,000 to $34,999 | 21 | 6.0% |
| $35,000 to $49,999 | 112 | 32.2% |
| $50,000 to $74,999 | 67 | 19.3% |
| $75,000 to $99,999 | 63 | 18.1% |
| $100,000 to $149,999 | 26 | 7.5% |
| $150,000 to $199,999 | 3 | 0.9% |
| $200,000+ | 11 | 3.2% |
Household Income by Householder Age in Mifflintown borough
The median household income in Mifflintown borough is $48,333, with the highest median household income of $56,786 found in the 25 to 44 years age bracket for the primary householder. A total of 96 households (27.6%) fall into this category. Meanwhile, the 15 to 24 years age bracket for the primary householder has the lowest median household income of $30,000, with 6 households (1.7%) in this group.
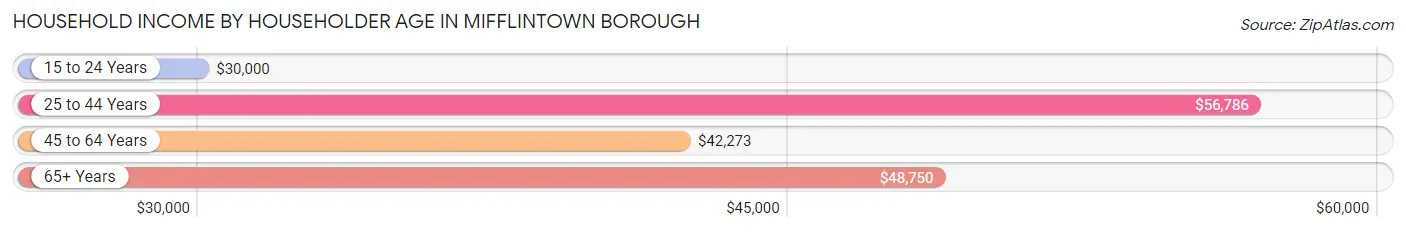
| Income Bracket | # Households | Median Income |
| 15 to 24 Years | 6 (1.7%) | $30,000 |
| 25 to 44 Years | 96 (27.6%) | $56,786 |
| 45 to 64 Years | 134 (38.5%) | $42,273 |
| 65+ Years | 112 (32.2%) | $48,750 |
| Total | 348 (100.0%) | $48,333 |
Poverty in Mifflintown borough
Income Below Poverty by Sex and Age in Mifflintown borough
With 7.2% poverty level for males and 12.2% for females among the residents of Mifflintown borough, 35 to 44 year old males and 5 year old females are the most vulnerable to poverty, with 9 males (17.6%) and 1 females (100.0%) in their respective age groups living below the poverty level.
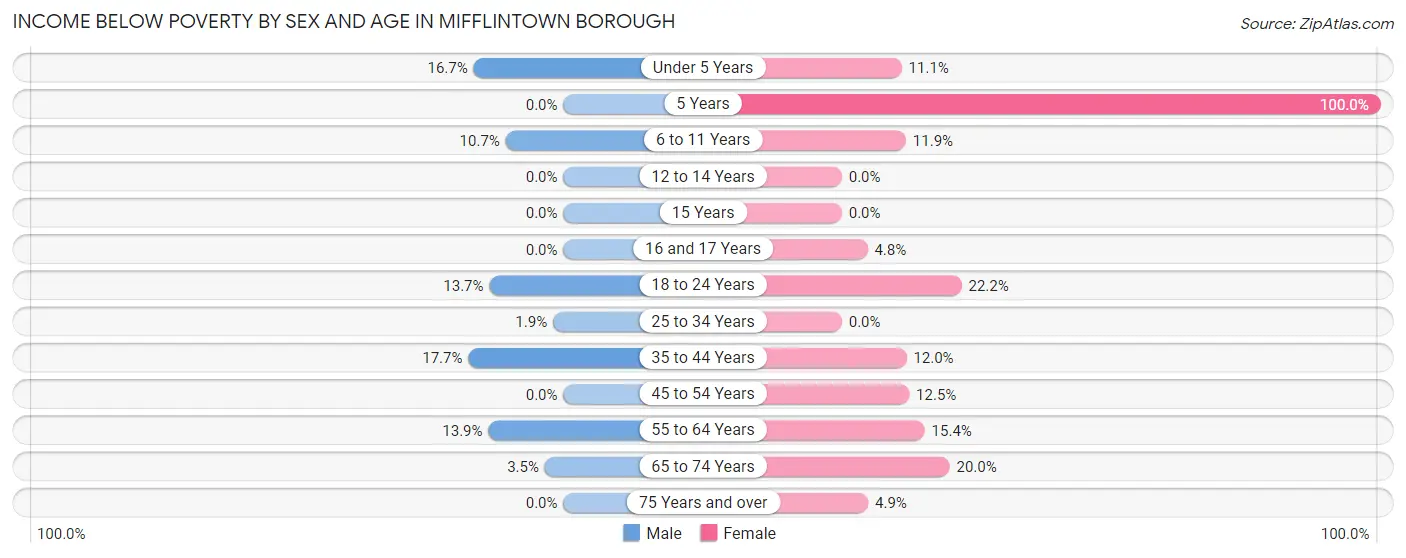
| Age Bracket | Male | Female |
| Under 5 Years | 1 (16.7%) | 2 (11.1%) |
| 5 Years | 0 (0.0%) | 1 (100.0%) |
| 6 to 11 Years | 6 (10.7%) | 5 (11.9%) |
| 12 to 14 Years | 0 (0.0%) | 0 (0.0%) |
| 15 Years | 0 (0.0%) | 0 (0.0%) |
| 16 and 17 Years | 0 (0.0%) | 1 (4.8%) |
| 18 to 24 Years | 7 (13.7%) | 10 (22.2%) |
| 25 to 34 Years | 1 (1.9%) | 0 (0.0%) |
| 35 to 44 Years | 9 (17.6%) | 6 (12.0%) |
| 45 to 54 Years | 0 (0.0%) | 5 (12.5%) |
| 55 to 64 Years | 11 (13.9%) | 6 (15.4%) |
| 65 to 74 Years | 2 (3.5%) | 8 (20.0%) |
| 75 Years and over | 0 (0.0%) | 2 (4.9%) |
| Total | 37 (7.2%) | 46 (12.2%) |
Income Above Poverty by Sex and Age in Mifflintown borough
According to the poverty statistics in Mifflintown borough, males aged 5 years and females aged 25 to 34 years are the age groups that are most secure financially, with 100.0% of males and 100.0% of females in these age groups living above the poverty line.
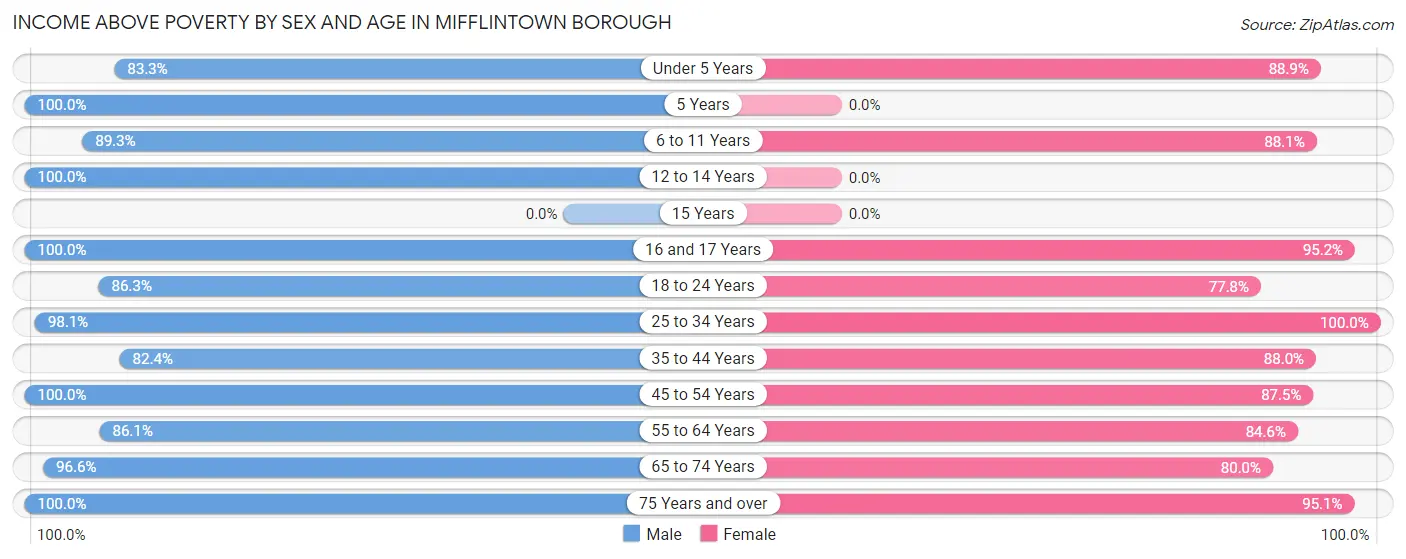
| Age Bracket | Male | Female |
| Under 5 Years | 5 (83.3%) | 16 (88.9%) |
| 5 Years | 2 (100.0%) | 0 (0.0%) |
| 6 to 11 Years | 50 (89.3%) | 37 (88.1%) |
| 12 to 14 Years | 9 (100.0%) | 0 (0.0%) |
| 15 Years | 0 (0.0%) | 0 (0.0%) |
| 16 and 17 Years | 24 (100.0%) | 20 (95.2%) |
| 18 to 24 Years | 44 (86.3%) | 35 (77.8%) |
| 25 to 34 Years | 51 (98.1%) | 39 (100.0%) |
| 35 to 44 Years | 42 (82.4%) | 44 (88.0%) |
| 45 to 54 Years | 96 (100.0%) | 35 (87.5%) |
| 55 to 64 Years | 68 (86.1%) | 33 (84.6%) |
| 65 to 74 Years | 56 (96.6%) | 32 (80.0%) |
| 75 Years and over | 26 (100.0%) | 39 (95.1%) |
| Total | 473 (92.7%) | 330 (87.8%) |
Income Below Poverty Among Married-Couple Families in Mifflintown borough
The poverty statistics for married-couple families in Mifflintown borough show that 4.5% or 8 of the total 176 families live below the poverty line. Families with 1 or 2 children have the highest poverty rate of 6.3%, comprising of 6 families. On the other hand, families with no children have the lowest poverty rate of 2.5%, which includes 2 families.
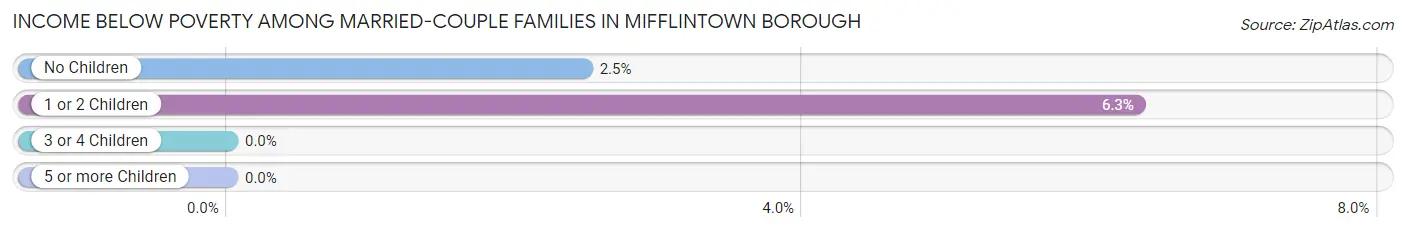
| Children | Above Poverty | Below Poverty |
| No Children | 79 (97.5%) | 2 (2.5%) |
| 1 or 2 Children | 89 (93.7%) | 6 (6.3%) |
| 3 or 4 Children | 0 (0.0%) | 0 (0.0%) |
| 5 or more Children | 0 (0.0%) | 0 (0.0%) |
| Total | 168 (95.5%) | 8 (4.5%) |
Income Below Poverty Among Single-Parent Households in Mifflintown borough
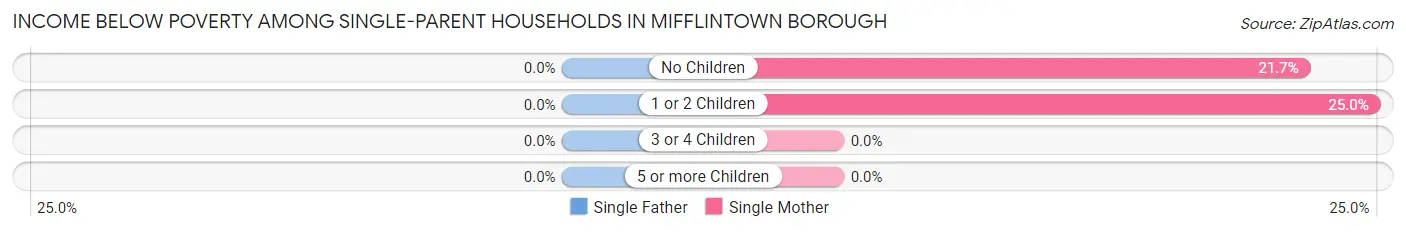
| Children | Single Father | Single Mother |
| No Children | 0 (0.0%) | 5 (21.7%) |
| 1 or 2 Children | 0 (0.0%) | 3 (25.0%) |
| 3 or 4 Children | 0 (0.0%) | 0 (0.0%) |
| 5 or more Children | 0 (0.0%) | 0 (0.0%) |
| Total | 0 (0.0%) | 8 (22.9%) |
Income Below Poverty Among Married-Couple vs Single-Parent Households in Mifflintown borough
The poverty data for Mifflintown borough shows that 8 of the married-couple family households (4.5%) and 8 of the single-parent households (15.1%) are living below the poverty level. Within the married-couple family households, those with 1 or 2 children have the highest poverty rate, with 6 households (6.3%) falling below the poverty line. Among the single-parent households, those with no children have the highest poverty rate, with 5 household (17.2%) living below poverty.
| Children | Married-Couple Families | Single-Parent Households |
| No Children | 2 (2.5%) | 5 (17.2%) |
| 1 or 2 Children | 6 (6.3%) | 3 (12.5%) |
| 3 or 4 Children | 0 (0.0%) | 0 (0.0%) |
| 5 or more Children | 0 (0.0%) | 0 (0.0%) |
| Total | 8 (4.5%) | 8 (15.1%) |
Race in Mifflintown borough
The most populous races in Mifflintown borough are White / Caucasian (658 | 74.3%), Hispanic or Latino (340 | 38.4%), and Two or more Races (186 | 21.0%).
| Race | # Population | % Population |
| Asian | 3 | 0.3% |
| Black / African American | 0 | 0.0% |
| Hawaiian / Pacific | 0 | 0.0% |
| Hispanic or Latino | 340 | 38.4% |
| Native / Alaskan | 0 | 0.0% |
| White / Caucasian | 658 | 74.3% |
| Two or more Races | 186 | 21.0% |
| Some other Race | 39 | 4.4% |
| Total | 886 | 100.0% |
Ancestry in Mifflintown borough
The most populous ancestries reported in Mifflintown borough are German (221 | 24.9%), Central American (184 | 20.8%), Salvadoran (154 | 17.4%), Irish (82 | 9.3%), and American (64 | 7.2%), together accounting for 79.6% of all Mifflintown borough residents.
| Ancestry | # Population | % Population |
| American | 64 | 7.2% |
| Bhutanese | 3 | 0.3% |
| Central American | 184 | 20.8% |
| Chilean | 17 | 1.9% |
| Colombian | 5 | 0.6% |
| Cuban | 1 | 0.1% |
| Danish | 6 | 0.7% |
| Dominican | 43 | 4.9% |
| Dutch | 12 | 1.3% |
| English | 55 | 6.2% |
| European | 2 | 0.2% |
| French | 9 | 1.0% |
| German | 221 | 24.9% |
| Honduran | 30 | 3.4% |
| Hungarian | 4 | 0.4% |
| Irish | 82 | 9.3% |
| Italian | 22 | 2.5% |
| Mexican | 14 | 1.6% |
| Polish | 7 | 0.8% |
| Portuguese | 6 | 0.7% |
| Puerto Rican | 64 | 7.2% |
| Salvadoran | 154 | 17.4% |
| Scotch-Irish | 5 | 0.6% |
| Scottish | 9 | 1.0% |
| Slovene | 7 | 0.8% |
| South American | 22 | 2.5% |
| Spanish | 12 | 1.3% |
| Welsh | 3 | 0.3% | View All 28 Rows |
Immigrants in Mifflintown borough
The most numerous immigrant groups reported in Mifflintown borough came from Latin America (183 | 20.6%), Central America (115 | 13.0%), El Salvador (90 | 10.2%), Caribbean (41 | 4.6%), and Dominican Republic (41 | 4.6%), together accounting for 53.0% of all Mifflintown borough residents.
| Immigration Origin | # Population | % Population |
| Caribbean | 41 | 4.6% |
| Central America | 115 | 13.0% |
| Chile | 22 | 2.5% |
| Colombia | 5 | 0.6% |
| Dominican Republic | 41 | 4.6% |
| El Salvador | 90 | 10.2% |
| Europe | 6 | 0.7% |
| Honduras | 20 | 2.3% |
| Latin America | 183 | 20.6% |
| Mexico | 5 | 0.6% |
| Portugal | 6 | 0.7% |
| South America | 27 | 3.0% |
| Southern Europe | 6 | 0.7% | View All 13 Rows |
Sex and Age in Mifflintown borough
Sex and Age in Mifflintown borough
The most populous age groups in Mifflintown borough are 50 to 54 Years (61 | 12.0%) for men and 15 to 19 Years (52 | 13.8%) for women.
| Age Bracket | Male | Female |
| Under 5 Years | 6 (1.2%) | 18 (4.8%) |
| 5 to 9 Years | 58 (11.4%) | 6 (1.6%) |
| 10 to 14 Years | 9 (1.8%) | 37 (9.8%) |
| 15 to 19 Years | 48 (9.4%) | 52 (13.8%) |
| 20 to 24 Years | 27 (5.3%) | 14 (3.7%) |
| 25 to 29 Years | 25 (4.9%) | 23 (6.1%) |
| 30 to 34 Years | 27 (5.3%) | 16 (4.3%) |
| 35 to 39 Years | 35 (6.9%) | 28 (7.4%) |
| 40 to 44 Years | 16 (3.1%) | 22 (5.9%) |
| 45 to 49 Years | 35 (6.9%) | 21 (5.6%) |
| 50 to 54 Years | 61 (12.0%) | 19 (5.1%) |
| 55 to 59 Years | 40 (7.8%) | 24 (6.4%) |
| 60 to 64 Years | 39 (7.6%) | 15 (4.0%) |
| 65 to 69 Years | 43 (8.4%) | 15 (4.0%) |
| 70 to 74 Years | 15 (2.9%) | 25 (6.7%) |
| 75 to 79 Years | 4 (0.8%) | 23 (6.1%) |
| 80 to 84 Years | 18 (3.5%) | 16 (4.3%) |
| 85 Years and over | 4 (0.8%) | 2 (0.5%) |
| Total | 510 (100.0%) | 376 (100.0%) |
Families and Households in Mifflintown borough
Median Family Size in Mifflintown borough
The median family size in Mifflintown borough is 3.14 persons per family, with married-couple families (176 | 76.9%) accounting for the largest median family size of 3.32 persons per family. On the other hand, single male/father families (18 | 7.9%) represent the smallest median family size with 2.28 persons per family.
| Family Type | # Families | Family Size |
| Married-Couple | 176 (76.9%) | 3.32 |
| Single Male/Father | 18 (7.9%) | 2.28 |
| Single Female/Mother | 35 (15.3%) | 2.71 |
| Total Families | 229 (100.0%) | 3.14 |
Median Household Size in Mifflintown borough
The median household size in Mifflintown borough is 2.55 persons per household, with married-couple households (176 | 50.6%) accounting for the largest median household size of 3.37 persons per household. non-family households (119 | 34.2%) represent the smallest median household size with 1.15 persons per household.
| Household Type | # Households | Household Size |
| Married-Couple | 176 (50.6%) | 3.37 |
| Single Male/Father | 18 (5.2%) | 2.72 |
| Single Female/Mother | 35 (10.1%) | 3.06 |
| Non-family | 119 (34.2%) | 1.15 |
| Total Households | 348 (100.0%) | 2.55 |
Household Size by Marriage Status in Mifflintown borough
Out of a total of 348 households in Mifflintown borough, 229 (65.8%) are family households, while 119 (34.2%) are nonfamily households. The most numerous type of family households are 2-person households, comprising 86, and the most common type of nonfamily households are 1-person households, comprising 103.
| Household Size | Family Households | Nonfamily Households |
| 1-Person Households | - | 103 (29.6%) |
| 2-Person Households | 86 (24.7%) | 16 (4.6%) |
| 3-Person Households | 48 (13.8%) | 0 (0.0%) |
| 4-Person Households | 55 (15.8%) | 0 (0.0%) |
| 5-Person Households | 37 (10.6%) | 0 (0.0%) |
| 6-Person Households | 3 (0.9%) | 0 (0.0%) |
| 7+ Person Households | 0 (0.0%) | 0 (0.0%) |
| Total | 229 (65.8%) | 119 (34.2%) |
Female Fertility in Mifflintown borough
Fertility by Age in Mifflintown borough
Average fertility rate in Mifflintown borough is 28.0 births per 1,000 women. Women in the age bracket of 20 to 34 years have the highest fertility rate with 94.0 births per 1,000 women. Women in the age bracket of 20 to 34 years acount for 100.0% of all women with births.
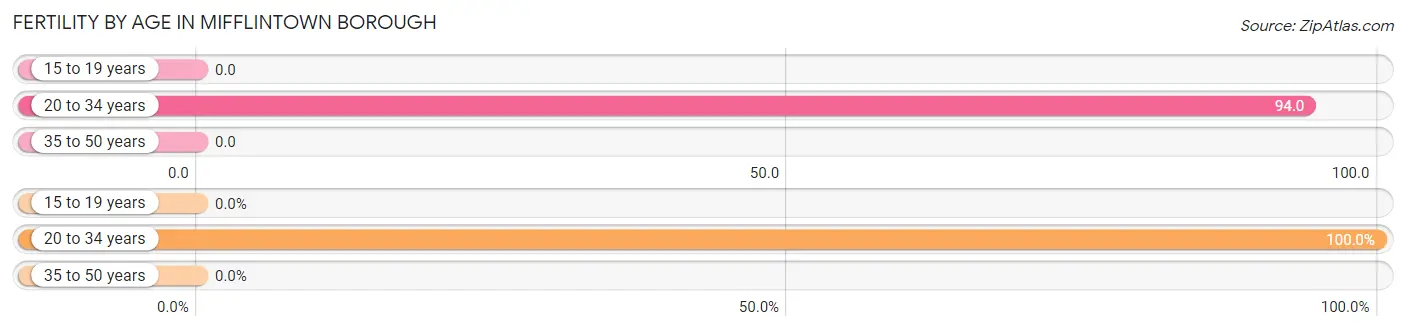
| Age Bracket | Women with Births | Births / 1,000 Women |
| 15 to 19 years | 0 (0.0%) | 0.0 |
| 20 to 34 years | 5 (100.0%) | 94.0 |
| 35 to 50 years | 0 (0.0%) | 0.0 |
| Total | 5 (100.0%) | 28.0 |
Fertility by Age by Marriage Status in Mifflintown borough
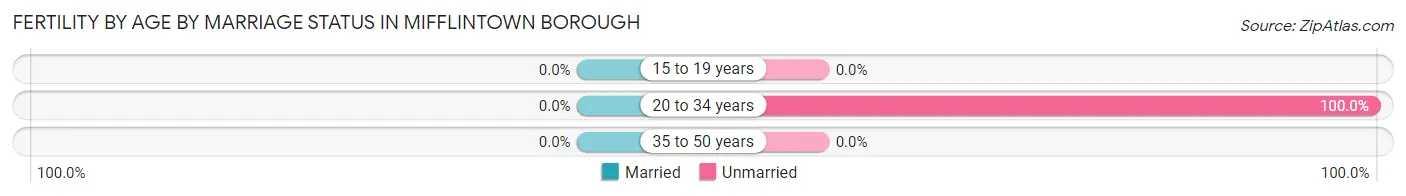
| Age Bracket | Married | Unmarried |
| 15 to 19 years | 0 (0.0%) | 0 (0.0%) |
| 20 to 34 years | 0 (0.0%) | 5 (100.0%) |
| 35 to 50 years | 0 (0.0%) | 0 (0.0%) |
| Total | 0 (0.0%) | 5 (100.0%) |
Fertility by Education in Mifflintown borough
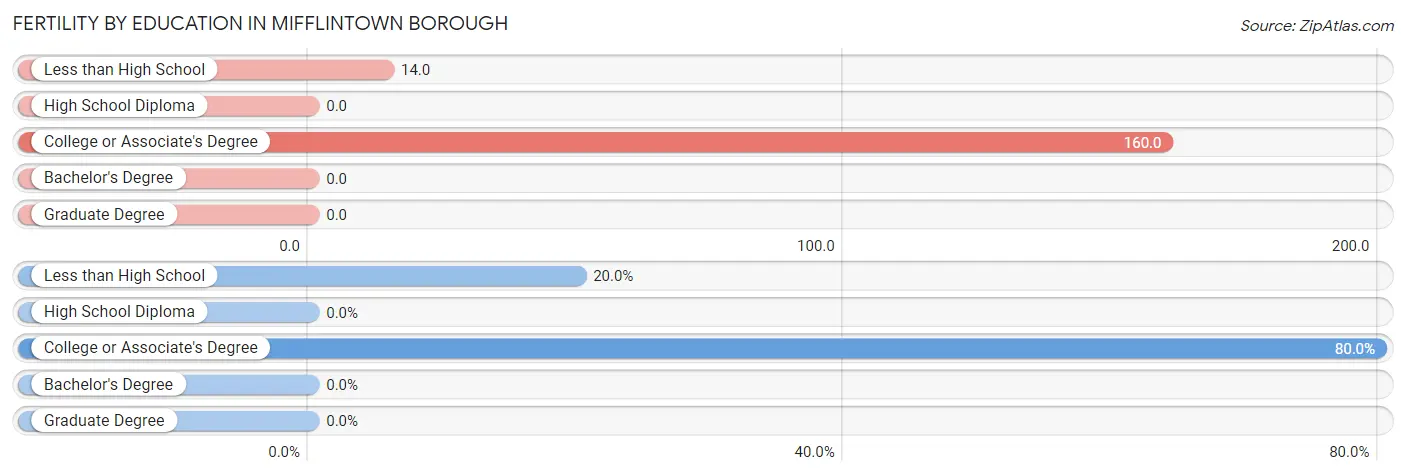
| Educational Attainment | Women with Births | Births / 1,000 Women |
| Less than High School | 1 (20.0%) | 14.0 |
| High School Diploma | 0 (0.0%) | 0.0 |
| College or Associate's Degree | 4 (80.0%) | 160.0 |
| Bachelor's Degree | 0 (0.0%) | 0.0 |
| Graduate Degree | 0 (0.0%) | 0.0 |
| Total | 5 (100.0%) | 28.0 |
Fertility by Education by Marriage Status in Mifflintown borough
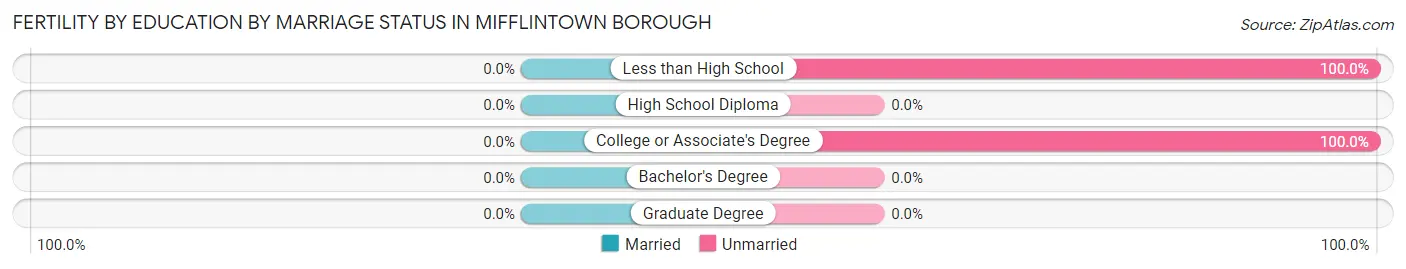
| Educational Attainment | Married | Unmarried |
| Less than High School | 0 (0.0%) | 1 (100.0%) |
| High School Diploma | 0 (0.0%) | 0 (0.0%) |
| College or Associate's Degree | 0 (0.0%) | 4 (100.0%) |
| Bachelor's Degree | 0 (0.0%) | 0 (0.0%) |
| Graduate Degree | 0 (0.0%) | 0 (0.0%) |
| Total | 0 (0.0%) | 5 (100.0%) |
Employment Characteristics in Mifflintown borough
Employment by Class of Employer in Mifflintown borough
Among the 438 employed individuals in Mifflintown borough, private company employees (365 | 83.3%), not-for-profit organizations (29 | 6.6%), and self-employed (not incorporated) (18 | 4.1%) make up the most common classes of employment.
| Employer Class | # Employees | % Employees |
| Private Company Employees | 365 | 83.3% |
| Self-Employed (Incorporated) | 2 | 0.5% |
| Self-Employed (Not Incorporated) | 18 | 4.1% |
| Not-for-profit Organizations | 29 | 6.6% |
| Local Government Employees | 11 | 2.5% |
| State Government Employees | 13 | 3.0% |
| Federal Government Employees | 0 | 0.0% |
| Unpaid Family Workers | 0 | 0.0% |
| Total | 438 | 100.0% |
Employment Status by Age in Mifflintown borough
According to the labor force statistics for Mifflintown borough, out of the total population over 16 years of age (752), 63.7% or 479 individuals are in the labor force, with 7.5% or 36 of them unemployed. The age group with the highest labor force participation rate is 45 to 54 years, with 94.1% or 128 individuals in the labor force. Within the labor force, the 16 to 19 years age range has the highest percentage of unemployed individuals, with 60.0% or 24 of them being unemployed.
| Age Bracket | In Labor Force | Unemployed |
| 16 to 19 Years | 40 (40.0%) | 24 (60.0%) |
| 20 to 24 Years | 26 (63.4%) | 2 (7.7%) |
| 25 to 29 Years | 39 (81.3%) | 2 (5.1%) |
| 30 to 34 Years | 40 (93.0%) | 6 (15.0%) |
| 35 to 44 Years | 64 (63.4%) | 0 (0.0%) |
| 45 to 54 Years | 128 (94.1%) | 0 (0.0%) |
| 55 to 59 Years | 50 (78.1%) | 0 (0.0%) |
| 60 to 64 Years | 46 (85.2%) | 2 (4.3%) |
| 65 to 74 Years | 40 (40.8%) | 0 (0.0%) |
| 75 Years and over | 6 (9.0%) | 0 (0.0%) |
| Total | 479 (63.7%) | 36 (7.5%) |
Employment Status by Educational Attainment in Mifflintown borough
According to labor force statistics for Mifflintown borough, 82.3% of individuals (367) out of the total population between 25 and 64 years of age (446) are in the labor force, with 2.7% or 10 of them being unemployed. The group with the highest labor force participation rate are those with the educational attainment of high school diploma, with 92.1% or 174 individuals in the labor force. Within the labor force, individuals with high school diploma education have the highest percentage of unemployment, with 5.7% or 10 of them being unemployed.
| Educational Attainment | In Labor Force | Unemployed |
| Less than High School | 105 (71.4%) | 0 (0.0%) |
| High School Diploma | 174 (92.1%) | 11 (5.7%) |
| College / Associate Degree | 56 (87.5%) | 0 (0.0%) |
| Bachelor's Degree or higher | 32 (69.6%) | 0 (0.0%) |
| Total | 367 (82.3%) | 12 (2.7%) |
Employment Occupations by Sex in Mifflintown borough
Management, Business, Science and Arts Occupations
The most common Management, Business, Science and Arts occupations in Mifflintown borough are Community & Social Service (27 | 6.1%), Health Diagnosing & Treating (18 | 4.1%), Business & Financial (16 | 3.6%), Management (15 | 3.4%), and Legal Services & Support (13 | 2.9%).
Management, Business, Science and Arts Occupations by Sex
Within the Management, Business, Science and Arts occupations in Mifflintown borough, the most male-oriented occupations are Legal Services & Support (100.0%), Management (80.0%), and Community & Social Service (55.6%), while the most female-oriented occupations are Computers, Engineering & Science (100.0%), Life, Physical & Social Science (100.0%), and Education, Arts & Media (100.0%).
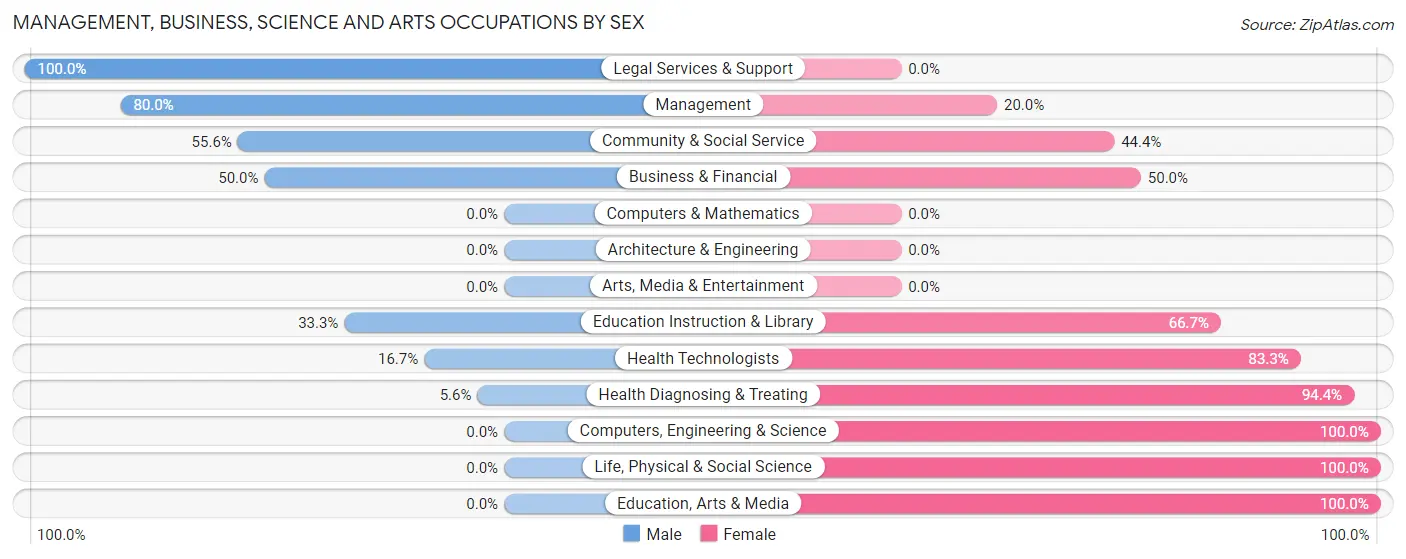
| Occupation | Male | Female |
| Management | 12 (80.0%) | 3 (20.0%) |
| Business & Financial | 8 (50.0%) | 8 (50.0%) |
| Computers, Engineering & Science | 0 (0.0%) | 3 (100.0%) |
| Computers & Mathematics | 0 (0.0%) | 0 (0.0%) |
| Architecture & Engineering | 0 (0.0%) | 0 (0.0%) |
| Life, Physical & Social Science | 0 (0.0%) | 3 (100.0%) |
| Community & Social Service | 15 (55.6%) | 12 (44.4%) |
| Education, Arts & Media | 0 (0.0%) | 8 (100.0%) |
| Legal Services & Support | 13 (100.0%) | 0 (0.0%) |
| Education Instruction & Library | 2 (33.3%) | 4 (66.7%) |
| Arts, Media & Entertainment | 0 (0.0%) | 0 (0.0%) |
| Health Diagnosing & Treating | 1 (5.6%) | 17 (94.4%) |
| Health Technologists | 1 (16.7%) | 5 (83.3%) |
| Total (Category) | 36 (45.6%) | 43 (54.4%) |
| Total (Overall) | 296 (66.8%) | 147 (33.2%) |
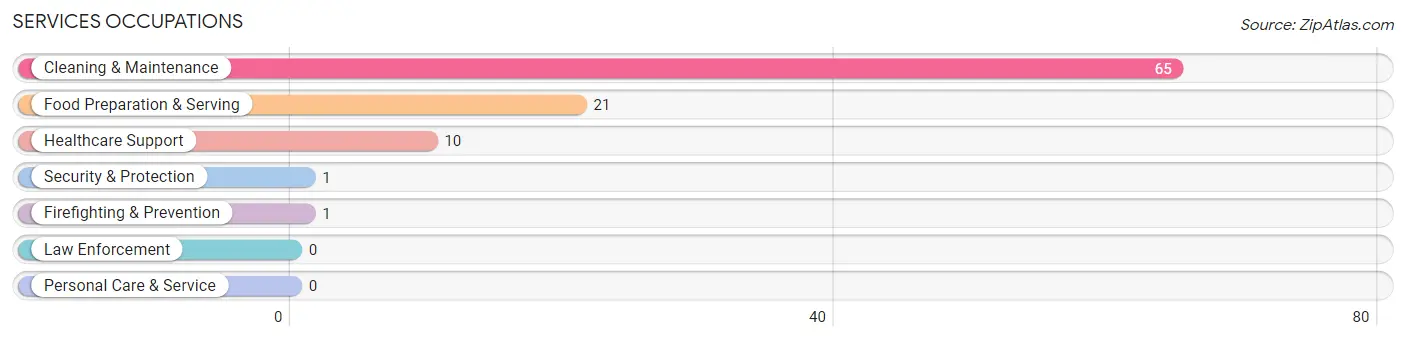
Services Occupations
The most common Services occupations in Mifflintown borough are Cleaning & Maintenance (65 | 14.7%), Food Preparation & Serving (21 | 4.7%), Healthcare Support (10 | 2.3%), Security & Protection (1 | 0.2%), and Firefighting & Prevention (1 | 0.2%).
Services Occupations by Sex
Within the Services occupations in Mifflintown borough, the most male-oriented occupations are Security & Protection (100.0%), Firefighting & Prevention (100.0%), and Cleaning & Maintenance (67.7%), while the most female-oriented occupations are Healthcare Support (100.0%), Food Preparation & Serving (71.4%), and Cleaning & Maintenance (32.3%).
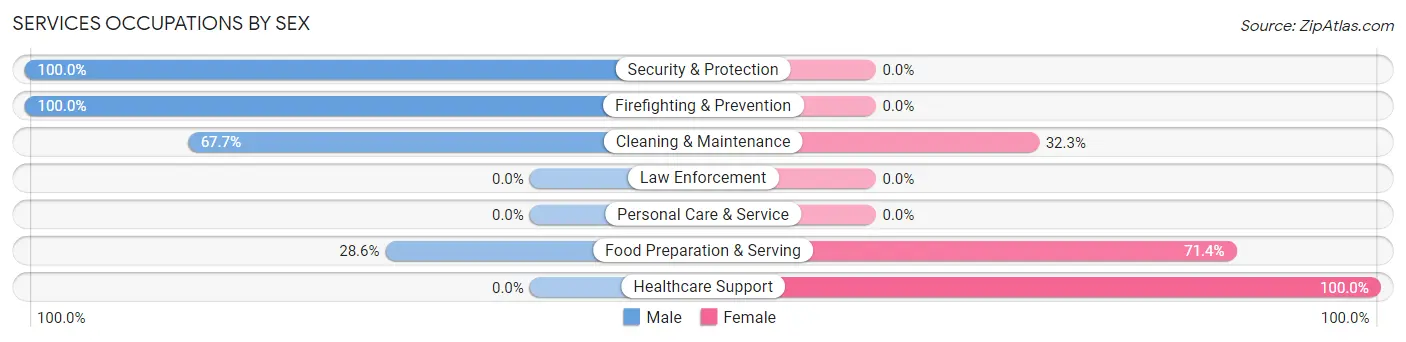
| Occupation | Male | Female |
| Healthcare Support | 0 (0.0%) | 10 (100.0%) |
| Security & Protection | 1 (100.0%) | 0 (0.0%) |
| Firefighting & Prevention | 1 (100.0%) | 0 (0.0%) |
| Law Enforcement | 0 (0.0%) | 0 (0.0%) |
| Food Preparation & Serving | 6 (28.6%) | 15 (71.4%) |
| Cleaning & Maintenance | 44 (67.7%) | 21 (32.3%) |
| Personal Care & Service | 0 (0.0%) | 0 (0.0%) |
| Total (Category) | 51 (52.6%) | 46 (47.4%) |
| Total (Overall) | 296 (66.8%) | 147 (33.2%) |
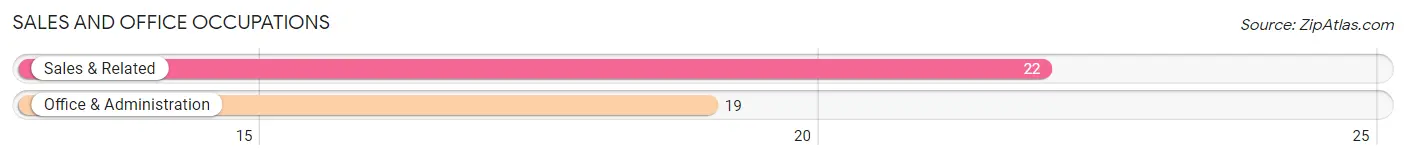
Sales and Office Occupations
The most common Sales and Office occupations in Mifflintown borough are Sales & Related (22 | 5.0%), and Office & Administration (19 | 4.3%).
Sales and Office Occupations by Sex
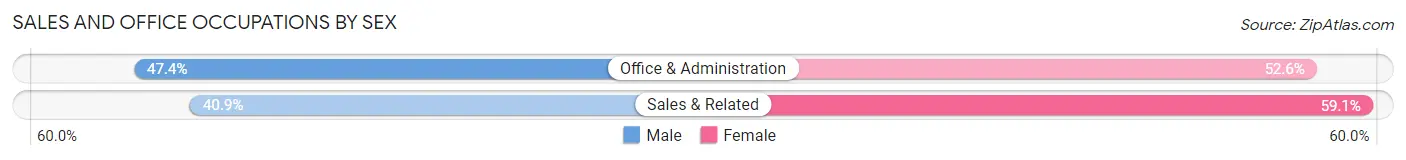
| Occupation | Male | Female |
| Sales & Related | 9 (40.9%) | 13 (59.1%) |
| Office & Administration | 9 (47.4%) | 10 (52.6%) |
| Total (Category) | 18 (43.9%) | 23 (56.1%) |
| Total (Overall) | 296 (66.8%) | 147 (33.2%) |
Natural Resources, Construction and Maintenance Occupations
The most common Natural Resources, Construction and Maintenance occupations in Mifflintown borough are Construction & Extraction (29 | 6.6%), Installation, Maintenance & Repair (16 | 3.6%), and Farming, Fishing & Forestry (1 | 0.2%).
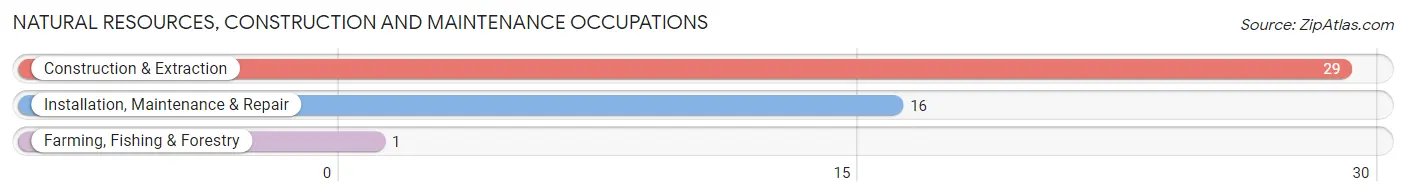
Natural Resources, Construction and Maintenance Occupations by Sex
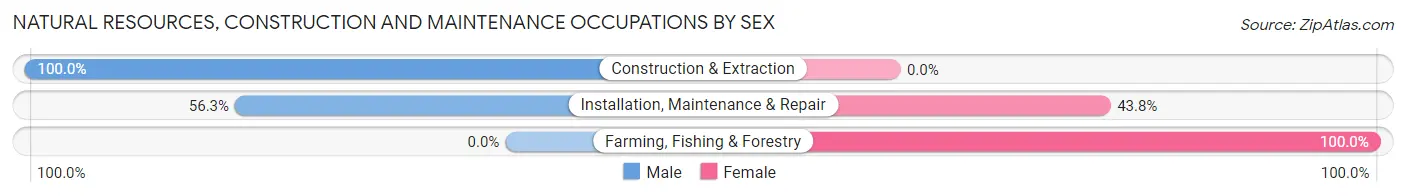
| Occupation | Male | Female |
| Farming, Fishing & Forestry | 0 (0.0%) | 1 (100.0%) |
| Construction & Extraction | 29 (100.0%) | 0 (0.0%) |
| Installation, Maintenance & Repair | 9 (56.2%) | 7 (43.8%) |
| Total (Category) | 38 (82.6%) | 8 (17.4%) |
| Total (Overall) | 296 (66.8%) | 147 (33.2%) |
Production, Transportation and Moving Occupations
The most common Production, Transportation and Moving occupations in Mifflintown borough are Production (92 | 20.8%), Material Moving (69 | 15.6%), and Transportation (19 | 4.3%).
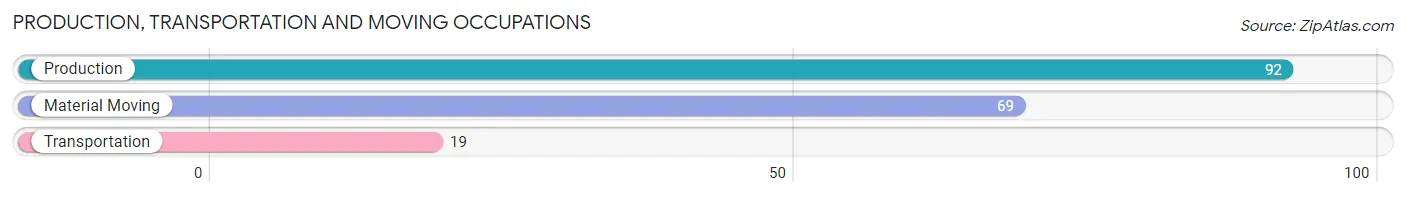
Production, Transportation and Moving Occupations by Sex
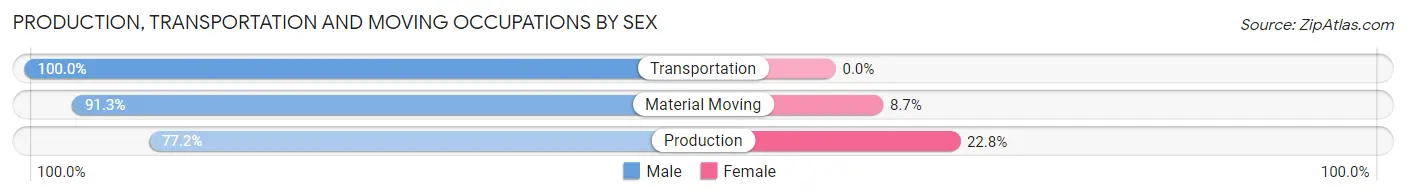
| Occupation | Male | Female |
| Production | 71 (77.2%) | 21 (22.8%) |
| Transportation | 19 (100.0%) | 0 (0.0%) |
| Material Moving | 63 (91.3%) | 6 (8.7%) |
| Total (Category) | 153 (85.0%) | 27 (15.0%) |
| Total (Overall) | 296 (66.8%) | 147 (33.2%) |
Employment Industries by Sex in Mifflintown borough
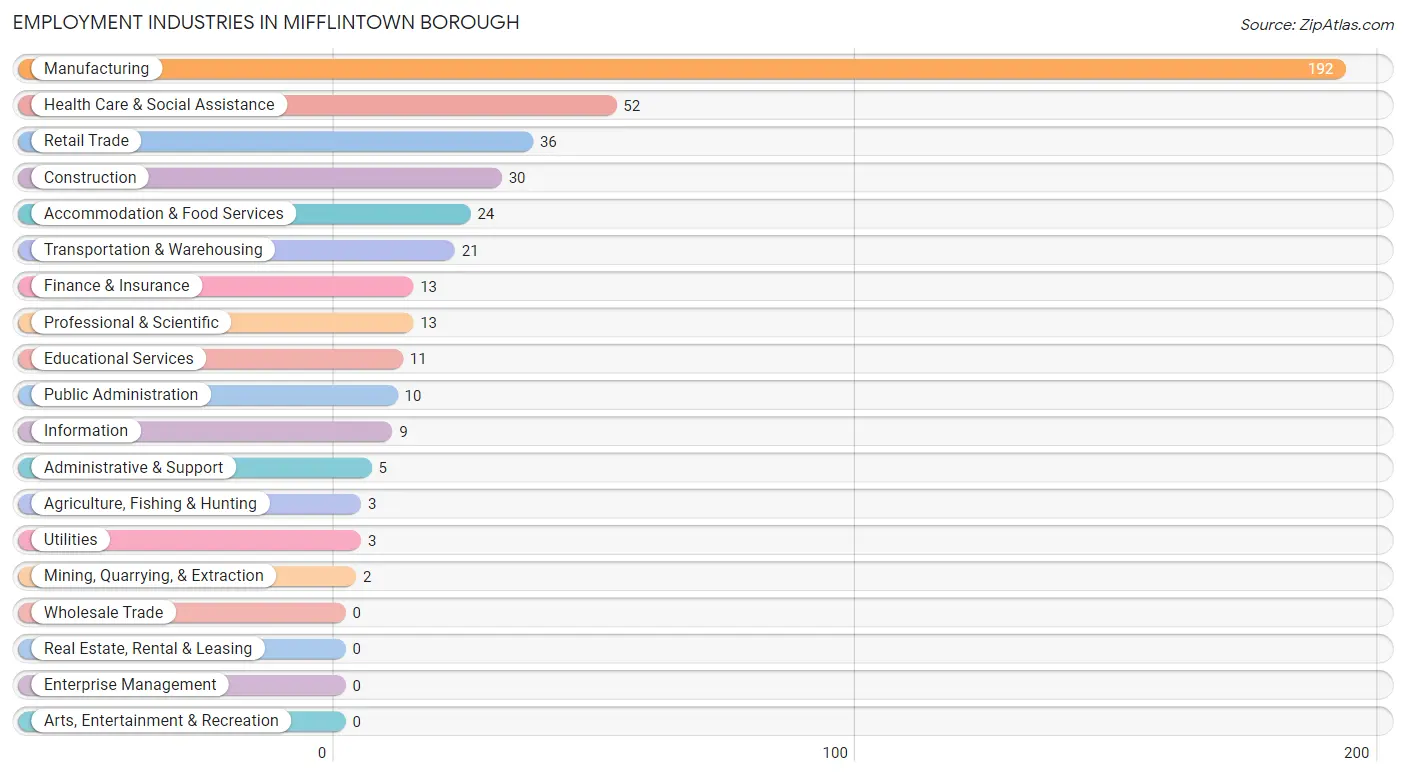
Employment Industries in Mifflintown borough
The major employment industries in Mifflintown borough include Manufacturing (192 | 43.3%), Health Care & Social Assistance (52 | 11.7%), Retail Trade (36 | 8.1%), Construction (30 | 6.8%), and Accommodation & Food Services (24 | 5.4%).
Employment Industries by Sex in Mifflintown borough
The Mifflintown borough industries that see more men than women are Mining, Quarrying, & Extraction (100.0%), Utilities (100.0%), and Information (100.0%), whereas the industries that tend to have a higher number of women are Educational Services (81.8%), Finance & Insurance (69.2%), and Accommodation & Food Services (66.7%).
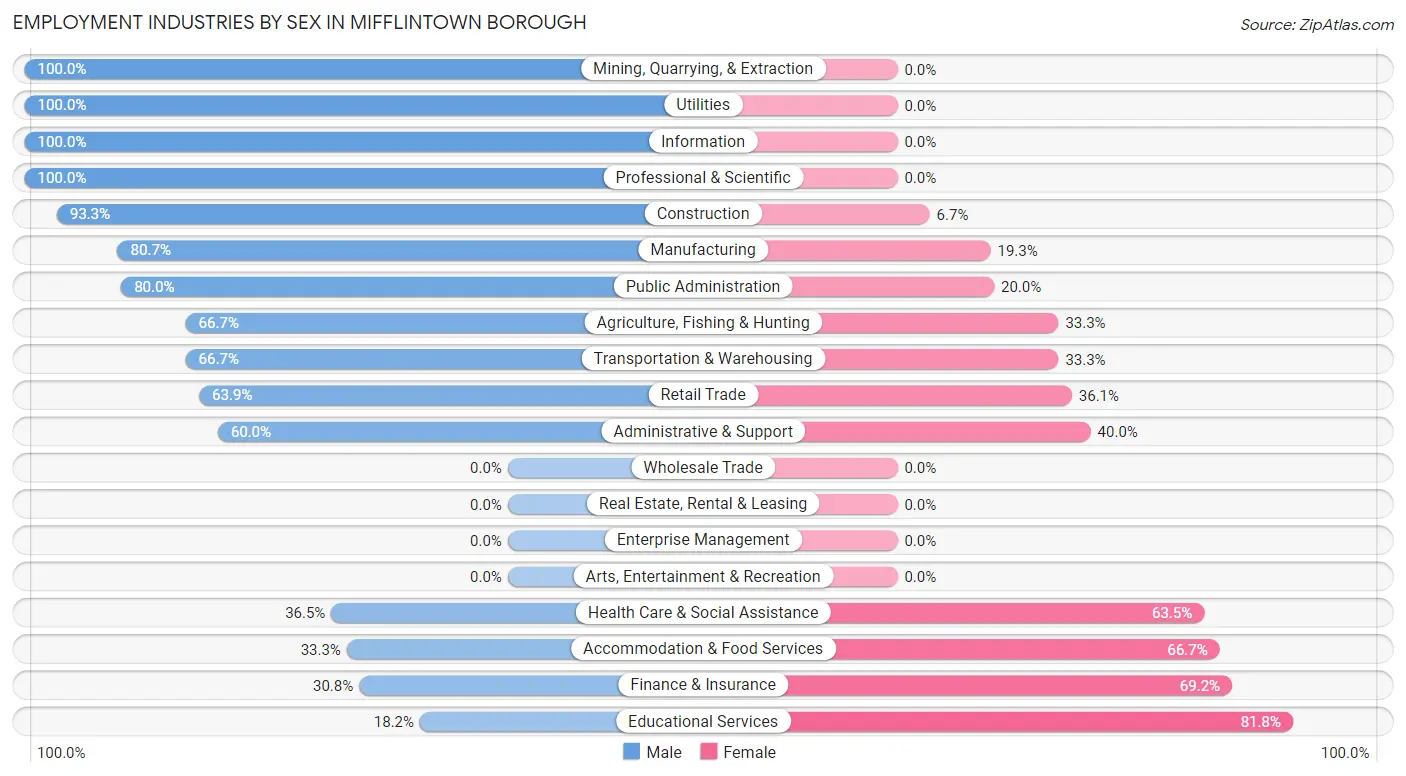
| Industry | Male | Female |
| Agriculture, Fishing & Hunting | 2 (66.7%) | 1 (33.3%) |
| Mining, Quarrying, & Extraction | 2 (100.0%) | 0 (0.0%) |
| Construction | 28 (93.3%) | 2 (6.7%) |
| Manufacturing | 155 (80.7%) | 37 (19.3%) |
| Wholesale Trade | 0 (0.0%) | 0 (0.0%) |
| Retail Trade | 23 (63.9%) | 13 (36.1%) |
| Transportation & Warehousing | 14 (66.7%) | 7 (33.3%) |
| Utilities | 3 (100.0%) | 0 (0.0%) |
| Information | 9 (100.0%) | 0 (0.0%) |
| Finance & Insurance | 4 (30.8%) | 9 (69.2%) |
| Real Estate, Rental & Leasing | 0 (0.0%) | 0 (0.0%) |
| Professional & Scientific | 13 (100.0%) | 0 (0.0%) |
| Enterprise Management | 0 (0.0%) | 0 (0.0%) |
| Administrative & Support | 3 (60.0%) | 2 (40.0%) |
| Educational Services | 2 (18.2%) | 9 (81.8%) |
| Health Care & Social Assistance | 19 (36.5%) | 33 (63.5%) |
| Arts, Entertainment & Recreation | 0 (0.0%) | 0 (0.0%) |
| Accommodation & Food Services | 8 (33.3%) | 16 (66.7%) |
| Public Administration | 8 (80.0%) | 2 (20.0%) |
| Total | 296 (66.8%) | 147 (33.2%) |
Education in Mifflintown borough
School Enrollment in Mifflintown borough
The most common levels of schooling among the 219 students in Mifflintown borough are high school (70 | 32.0%), middle school (46 | 21.0%), and elementary school (45 | 20.5%).
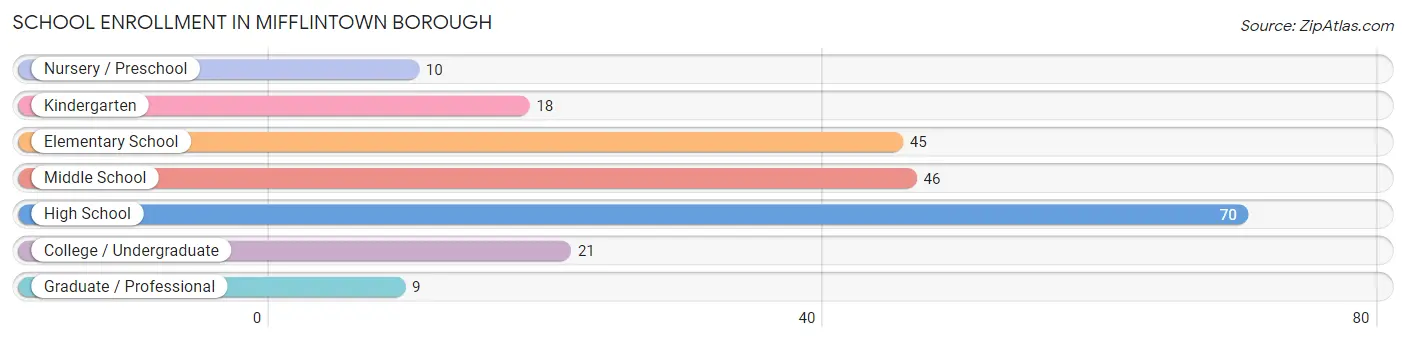
| School Level | # Students | % Students |
| Nursery / Preschool | 10 | 4.6% |
| Kindergarten | 18 | 8.2% |
| Elementary School | 45 | 20.5% |
| Middle School | 46 | 21.0% |
| High School | 70 | 32.0% |
| College / Undergraduate | 21 | 9.6% |
| Graduate / Professional | 9 | 4.1% |
| Total | 219 | 100.0% |
School Enrollment by Age by Funding Source in Mifflintown borough
Out of a total of 219 students who are enrolled in schools in Mifflintown borough, 17 (7.8%) attend a private institution, while the remaining 202 (92.2%) are enrolled in public schools. The age group of 18 to 19 year olds has the highest likelihood of being enrolled in private schools, with 12 (50.0% in the age bracket) enrolled. Conversely, the age group of 3 to 4 year olds has the lowest likelihood of being enrolled in a private school, with 10 (100.0% in the age bracket) attending a public institution.
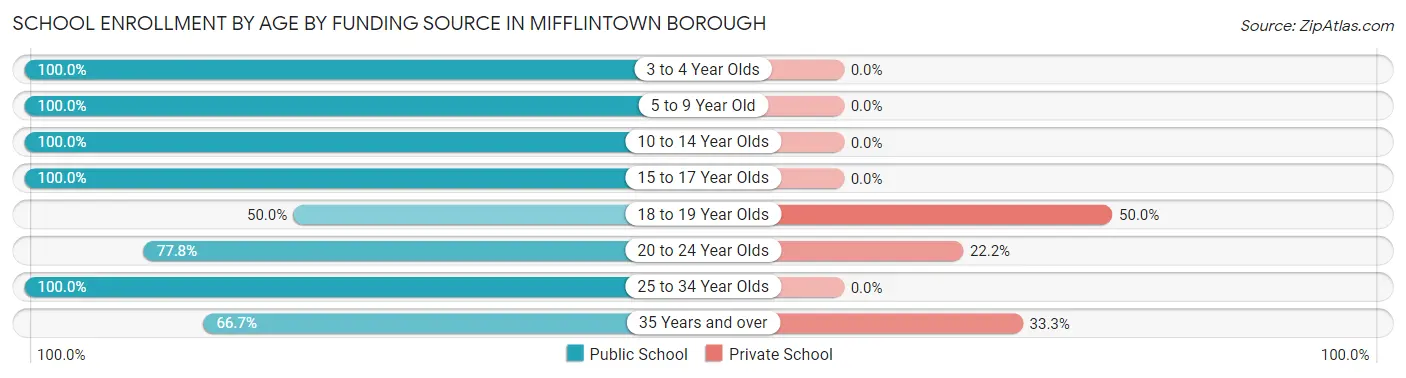
| Age Bracket | Public School | Private School |
| 3 to 4 Year Olds | 10 (100.0%) | 0 (0.0%) |
| 5 to 9 Year Old | 63 (100.0%) | 0 (0.0%) |
| 10 to 14 Year Olds | 46 (100.0%) | 0 (0.0%) |
| 15 to 17 Year Olds | 45 (100.0%) | 0 (0.0%) |
| 18 to 19 Year Olds | 12 (50.0%) | 12 (50.0%) |
| 20 to 24 Year Olds | 7 (77.8%) | 2 (22.2%) |
| 25 to 34 Year Olds | 13 (100.0%) | 0 (0.0%) |
| 35 Years and over | 6 (66.7%) | 3 (33.3%) |
| Total | 202 (92.2%) | 17 (7.8%) |
Educational Attainment by Field of Study in Mifflintown borough
Education (22 | 31.4%), social sciences (15 | 21.4%), psychology (11 | 15.7%), science & technology (6 | 8.6%), and business (5 | 7.1%) are the most common fields of study among 70 individuals in Mifflintown borough who have obtained a bachelor's degree or higher.
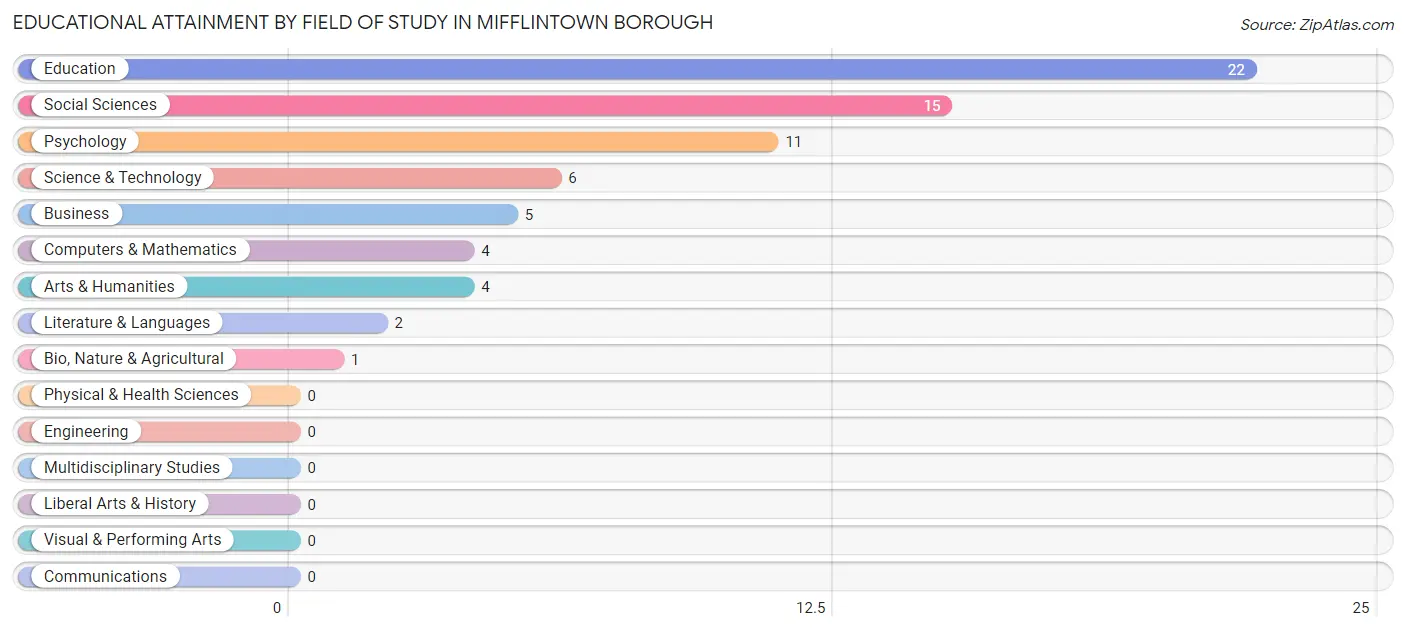
| Field of Study | # Graduates | % Graduates |
| Computers & Mathematics | 4 | 5.7% |
| Bio, Nature & Agricultural | 1 | 1.4% |
| Physical & Health Sciences | 0 | 0.0% |
| Psychology | 11 | 15.7% |
| Social Sciences | 15 | 21.4% |
| Engineering | 0 | 0.0% |
| Multidisciplinary Studies | 0 | 0.0% |
| Science & Technology | 6 | 8.6% |
| Business | 5 | 7.1% |
| Education | 22 | 31.4% |
| Literature & Languages | 2 | 2.9% |
| Liberal Arts & History | 0 | 0.0% |
| Visual & Performing Arts | 0 | 0.0% |
| Communications | 0 | 0.0% |
| Arts & Humanities | 4 | 5.7% |
| Total | 70 | 100.0% |
Transportation & Commute in Mifflintown borough
Vehicle Availability by Sex in Mifflintown borough
The most prevalent vehicle ownership categories in Mifflintown borough are males with 2 vehicles (112, accounting for 38.5%) and females with 2 vehicles (49, making up 76.2%).
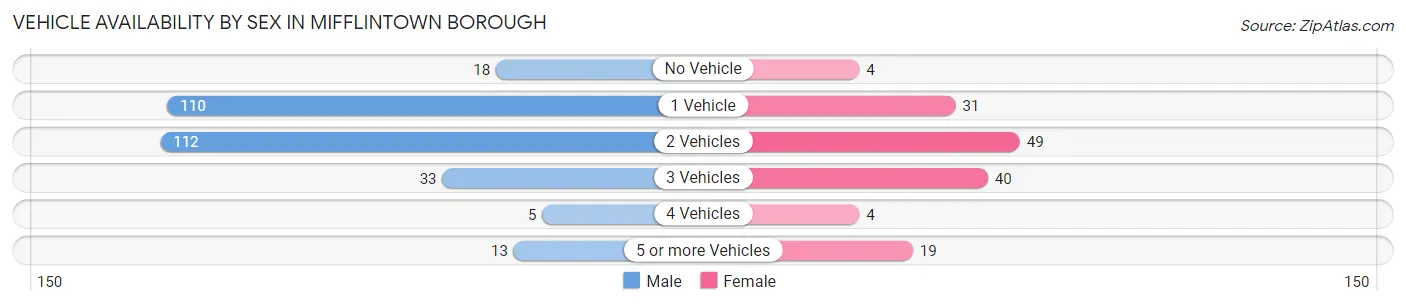
| Vehicles Available | Male | Female |
| No Vehicle | 18 (6.2%) | 4 (2.7%) |
| 1 Vehicle | 110 (37.8%) | 31 (21.1%) |
| 2 Vehicles | 112 (38.5%) | 49 (33.3%) |
| 3 Vehicles | 33 (11.3%) | 40 (27.2%) |
| 4 Vehicles | 5 (1.7%) | 4 (2.7%) |
| 5 or more Vehicles | 13 (4.5%) | 19 (12.9%) |
| Total | 291 (100.0%) | 147 (100.0%) |
Commute Time in Mifflintown borough
The most frequently occuring commute durations in Mifflintown borough are 5 to 9 minutes (145 commuters, 35.8%), 60 to 89 minutes (64 commuters, 15.8%), and 15 to 19 minutes (46 commuters, 11.4%).
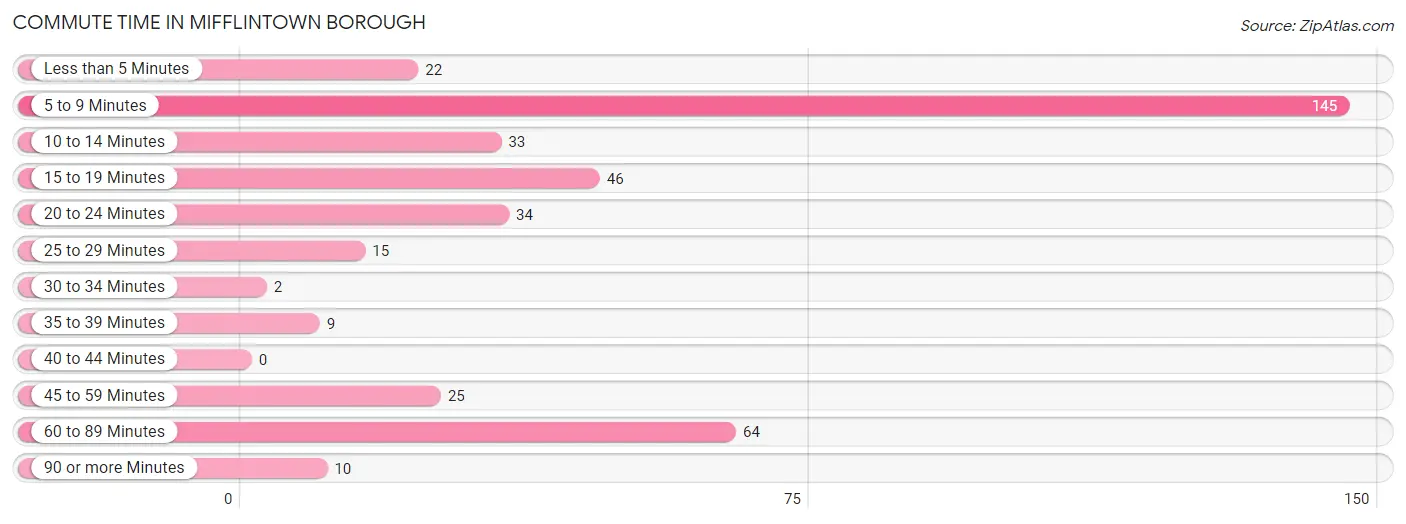
| Commute Time | # Commuters | % Commuters |
| Less than 5 Minutes | 22 | 5.4% |
| 5 to 9 Minutes | 145 | 35.8% |
| 10 to 14 Minutes | 33 | 8.2% |
| 15 to 19 Minutes | 46 | 11.4% |
| 20 to 24 Minutes | 34 | 8.4% |
| 25 to 29 Minutes | 15 | 3.7% |
| 30 to 34 Minutes | 2 | 0.5% |
| 35 to 39 Minutes | 9 | 2.2% |
| 40 to 44 Minutes | 0 | 0.0% |
| 45 to 59 Minutes | 25 | 6.2% |
| 60 to 89 Minutes | 64 | 15.8% |
| 90 or more Minutes | 10 | 2.5% |
Commute Time by Sex in Mifflintown borough
The most common commute times in Mifflintown borough are 5 to 9 minutes (90 commuters, 33.2%) for males and 5 to 9 minutes (55 commuters, 41.0%) for females.
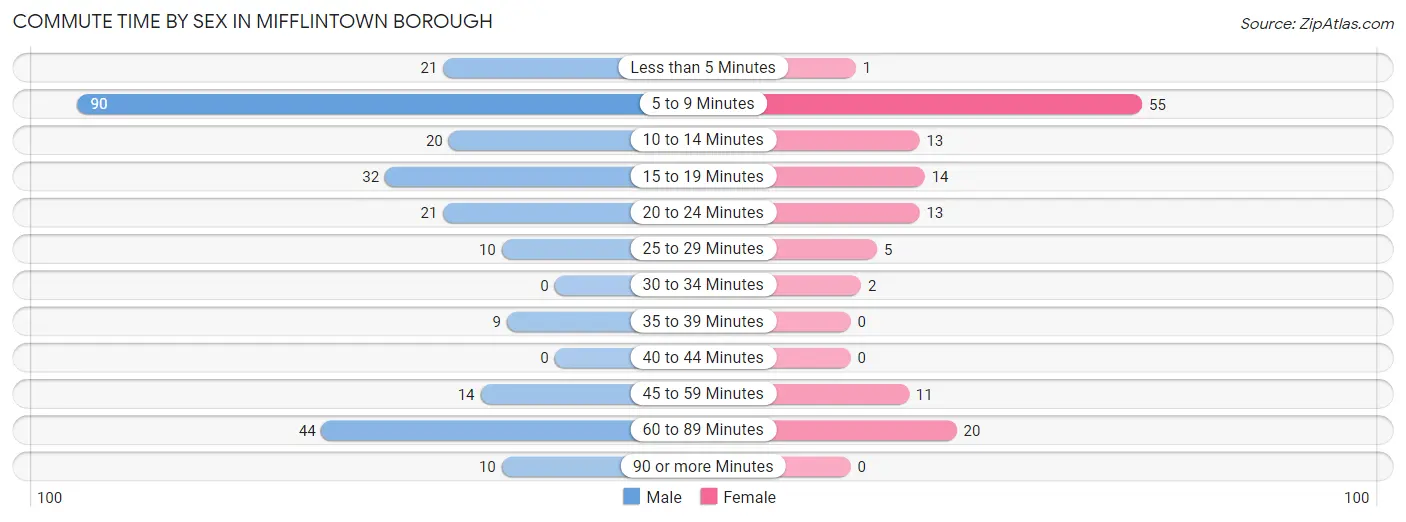
| Commute Time | Male | Female |
| Less than 5 Minutes | 21 (7.7%) | 1 (0.7%) |
| 5 to 9 Minutes | 90 (33.2%) | 55 (41.0%) |
| 10 to 14 Minutes | 20 (7.4%) | 13 (9.7%) |
| 15 to 19 Minutes | 32 (11.8%) | 14 (10.4%) |
| 20 to 24 Minutes | 21 (7.7%) | 13 (9.7%) |
| 25 to 29 Minutes | 10 (3.7%) | 5 (3.7%) |
| 30 to 34 Minutes | 0 (0.0%) | 2 (1.5%) |
| 35 to 39 Minutes | 9 (3.3%) | 0 (0.0%) |
| 40 to 44 Minutes | 0 (0.0%) | 0 (0.0%) |
| 45 to 59 Minutes | 14 (5.2%) | 11 (8.2%) |
| 60 to 89 Minutes | 44 (16.2%) | 20 (14.9%) |
| 90 or more Minutes | 10 (3.7%) | 0 (0.0%) |
Time of Departure to Work by Sex in Mifflintown borough
The most frequent times of departure to work in Mifflintown borough are 12:00 AM to 4:59 AM (98, 36.2%) for males and 5:30 AM to 5:59 AM (18, 13.4%) for females.
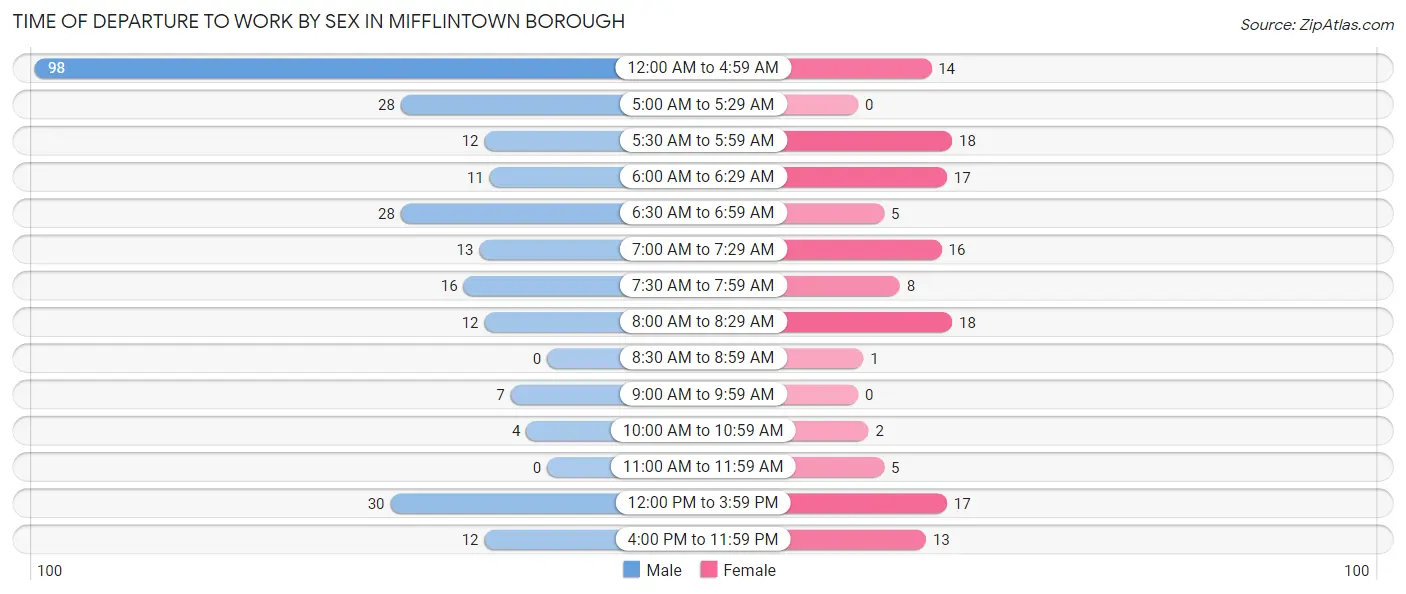
| Time of Departure | Male | Female |
| 12:00 AM to 4:59 AM | 98 (36.2%) | 14 (10.4%) |
| 5:00 AM to 5:29 AM | 28 (10.3%) | 0 (0.0%) |
| 5:30 AM to 5:59 AM | 12 (4.4%) | 18 (13.4%) |
| 6:00 AM to 6:29 AM | 11 (4.1%) | 17 (12.7%) |
| 6:30 AM to 6:59 AM | 28 (10.3%) | 5 (3.7%) |
| 7:00 AM to 7:29 AM | 13 (4.8%) | 16 (11.9%) |
| 7:30 AM to 7:59 AM | 16 (5.9%) | 8 (6.0%) |
| 8:00 AM to 8:29 AM | 12 (4.4%) | 18 (13.4%) |
| 8:30 AM to 8:59 AM | 0 (0.0%) | 1 (0.7%) |
| 9:00 AM to 9:59 AM | 7 (2.6%) | 0 (0.0%) |
| 10:00 AM to 10:59 AM | 4 (1.5%) | 2 (1.5%) |
| 11:00 AM to 11:59 AM | 0 (0.0%) | 5 (3.7%) |
| 12:00 PM to 3:59 PM | 30 (11.1%) | 17 (12.7%) |
| 4:00 PM to 11:59 PM | 12 (4.4%) | 13 (9.7%) |
| Total | 271 (100.0%) | 134 (100.0%) |
Housing Occupancy in Mifflintown borough
Occupancy by Ownership in Mifflintown borough
Of the total 348 dwellings in Mifflintown borough, owner-occupied units account for 135 (38.8%), while renter-occupied units make up 213 (61.2%).
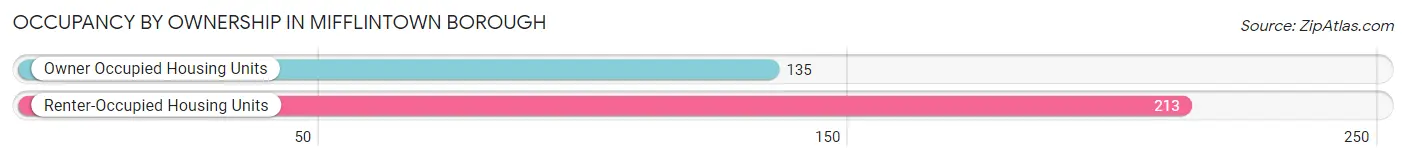
| Occupancy | # Housing Units | % Housing Units |
| Owner Occupied Housing Units | 135 | 38.8% |
| Renter-Occupied Housing Units | 213 | 61.2% |
| Total Occupied Housing Units | 348 | 100.0% |
Occupancy by Household Size in Mifflintown borough
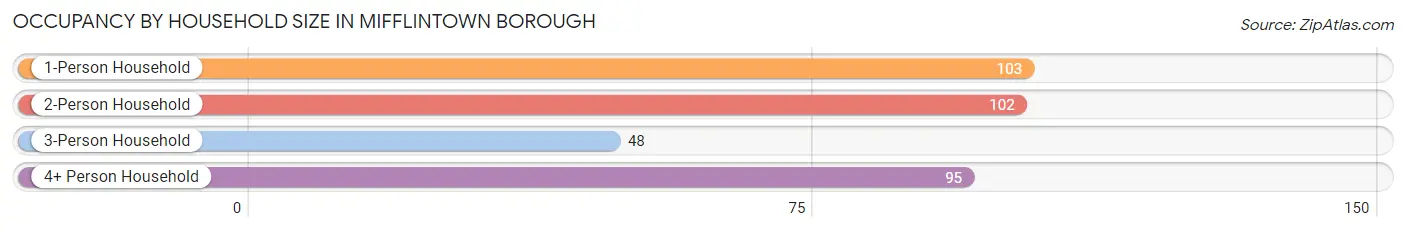
| Household Size | # Housing Units | % Housing Units |
| 1-Person Household | 103 | 29.6% |
| 2-Person Household | 102 | 29.3% |
| 3-Person Household | 48 | 13.8% |
| 4+ Person Household | 95 | 27.3% |
| Total Housing Units | 348 | 100.0% |
Occupancy by Ownership by Household Size in Mifflintown borough
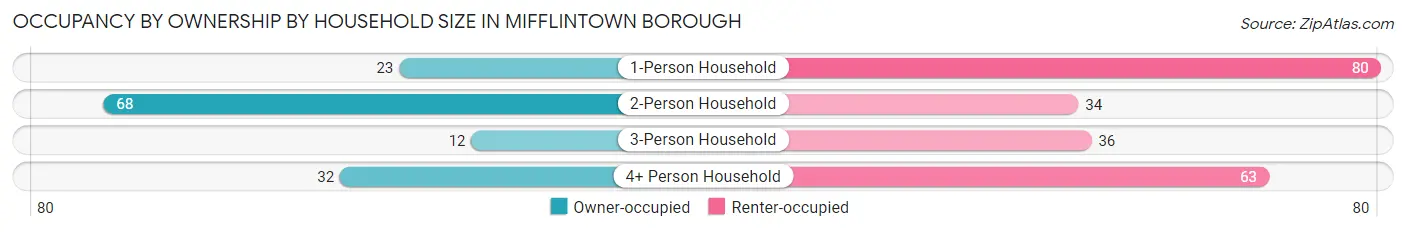
| Household Size | Owner-occupied | Renter-occupied |
| 1-Person Household | 23 (22.3%) | 80 (77.7%) |
| 2-Person Household | 68 (66.7%) | 34 (33.3%) |
| 3-Person Household | 12 (25.0%) | 36 (75.0%) |
| 4+ Person Household | 32 (33.7%) | 63 (66.3%) |
| Total Housing Units | 135 (38.8%) | 213 (61.2%) |
Occupancy by Educational Attainment in Mifflintown borough
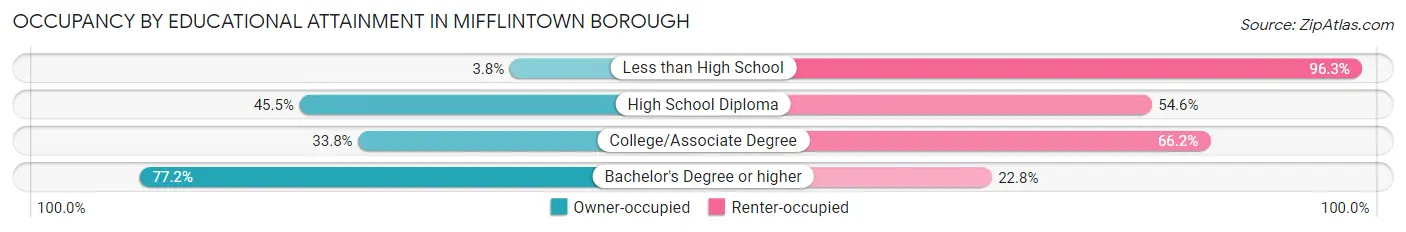
| Household Size | Owner-occupied | Renter-occupied |
| Less than High School | 3 (3.7%) | 77 (96.3%) |
| High School Diploma | 65 (45.5%) | 78 (54.5%) |
| College/Associate Degree | 23 (33.8%) | 45 (66.2%) |
| Bachelor's Degree or higher | 44 (77.2%) | 13 (22.8%) |
Occupancy by Age of Householder in Mifflintown borough
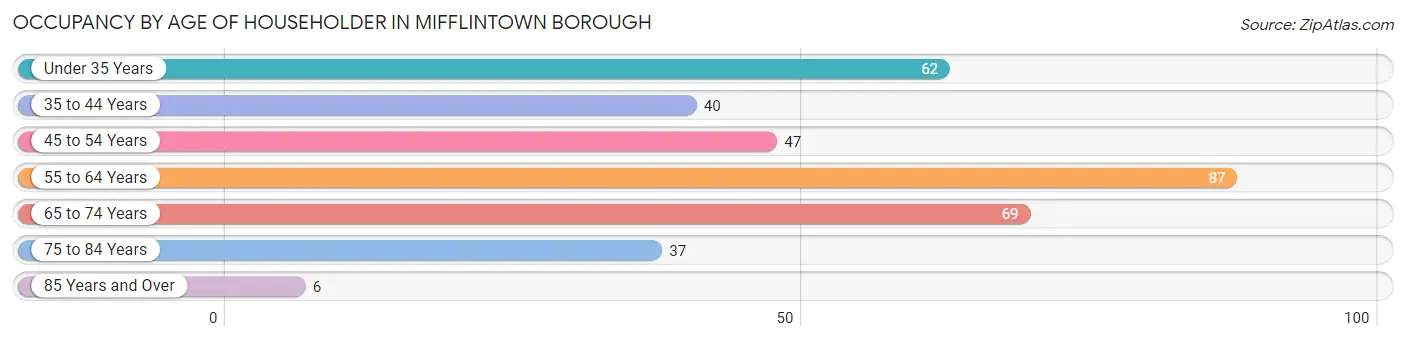
| Age Bracket | # Households | % Households |
| Under 35 Years | 62 | 17.8% |
| 35 to 44 Years | 40 | 11.5% |
| 45 to 54 Years | 47 | 13.5% |
| 55 to 64 Years | 87 | 25.0% |
| 65 to 74 Years | 69 | 19.8% |
| 75 to 84 Years | 37 | 10.6% |
| 85 Years and Over | 6 | 1.7% |
| Total | 348 | 100.0% |
Housing Finances in Mifflintown borough
Median Income by Occupancy in Mifflintown borough
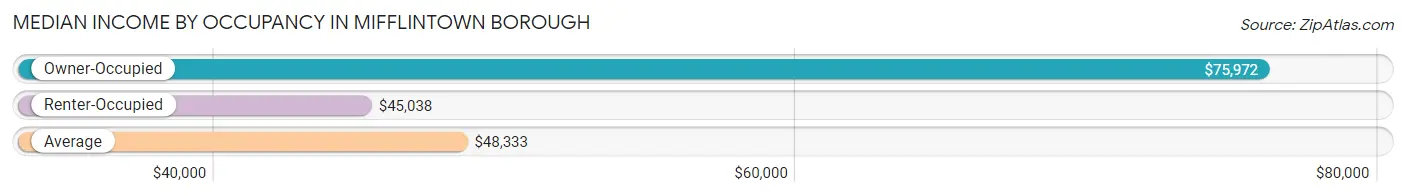
| Occupancy Type | # Households | Median Income |
| Owner-Occupied | 135 (38.8%) | $75,972 |
| Renter-Occupied | 213 (61.2%) | $45,038 |
| Average | 348 (100.0%) | $48,333 |
Occupancy by Householder Income Bracket in Mifflintown borough
| Income Bracket | Owner-occupied | Renter-occupied |
| Less than $5,000 | 7 (5.2%) | 6 (2.8%) |
| $5,000 to $9,999 | 0 (0.0%) | 3 (1.4%) |
| $10,000 to $14,999 | 0 (0.0%) | 8 (3.8%) |
| $15,000 to $19,999 | 0 (0.0%) | 11 (5.2%) |
| $20,000 to $24,999 | 2 (1.5%) | 8 (3.8%) |
| $25,000 to $34,999 | 4 (3.0%) | 17 (8.0%) |
| $35,000 to $49,999 | 20 (14.8%) | 92 (43.2%) |
| $50,000 to $74,999 | 31 (23.0%) | 36 (16.9%) |
| $75,000 to $99,999 | 40 (29.6%) | 23 (10.8%) |
| $100,000 to $149,999 | 19 (14.1%) | 7 (3.3%) |
| $150,000 or more | 12 (8.9%) | 2 (0.9%) |
| Total | 135 (100.0%) | 213 (100.0%) |
Monthly Housing Cost Tiers in Mifflintown borough
| Monthly Cost | Owner-occupied | Renter-occupied |
| Less than $300 | 3 (2.2%) | 16 (7.5%) |
| $300 to $499 | 15 (11.1%) | 12 (5.6%) |
| $500 to $799 | 40 (29.6%) | 112 (52.6%) |
| $800 to $999 | 17 (12.6%) | 20 (9.4%) |
| $1,000 to $1,499 | 43 (31.9%) | 36 (16.9%) |
| $1,500 to $1,999 | 4 (3.0%) | 0 (0.0%) |
| $2,000 to $2,499 | 8 (5.9%) | 0 (0.0%) |
| $2,500 to $2,999 | 0 (0.0%) | 0 (0.0%) |
| $3,000 or more | 5 (3.7%) | 2 (0.9%) |
| Total | 135 (100.0%) | 213 (100.0%) |
Physical Housing Characteristics in Mifflintown borough
Housing Structures in Mifflintown borough
| Structure Type | # Housing Units | % Housing Units |
| Single Unit, Detached | 124 | 35.6% |
| Single Unit, Attached | 39 | 11.2% |
| 2 Unit Apartments | 31 | 8.9% |
| 3 or 4 Unit Apartments | 46 | 13.2% |
| 5 to 9 Unit Apartments | 46 | 13.2% |
| 10 or more Apartments | 62 | 17.8% |
| Mobile Home / Other | 0 | 0.0% |
| Total | 348 | 100.0% |
Housing Structures by Occupancy in Mifflintown borough
| Structure Type | Owner-occupied | Renter-occupied |
| Single Unit, Detached | 110 (88.7%) | 14 (11.3%) |
| Single Unit, Attached | 15 (38.5%) | 24 (61.5%) |
| 2 Unit Apartments | 6 (19.4%) | 25 (80.6%) |
| 3 or 4 Unit Apartments | 0 (0.0%) | 46 (100.0%) |
| 5 to 9 Unit Apartments | 4 (8.7%) | 42 (91.3%) |
| 10 or more Apartments | 0 (0.0%) | 62 (100.0%) |
| Mobile Home / Other | 0 (0.0%) | 0 (0.0%) |
| Total | 135 (38.8%) | 213 (61.2%) |
Housing Structures by Number of Rooms in Mifflintown borough
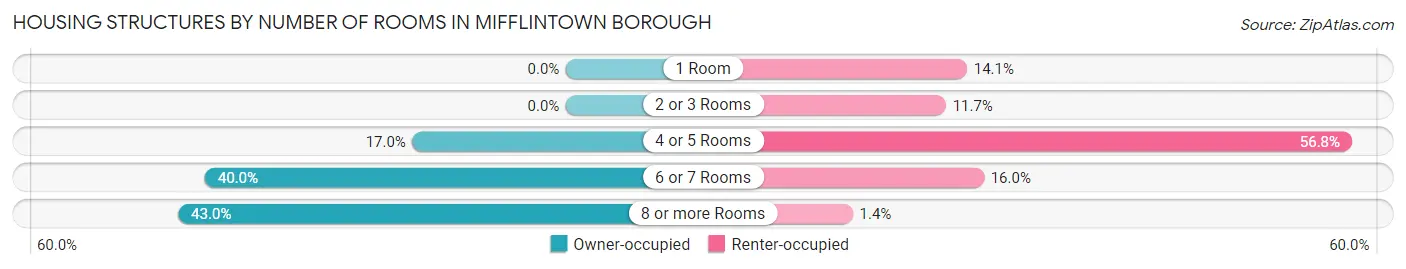
| Number of Rooms | Owner-occupied | Renter-occupied |
| 1 Room | 0 (0.0%) | 30 (14.1%) |
| 2 or 3 Rooms | 0 (0.0%) | 25 (11.7%) |
| 4 or 5 Rooms | 23 (17.0%) | 121 (56.8%) |
| 6 or 7 Rooms | 54 (40.0%) | 34 (16.0%) |
| 8 or more Rooms | 58 (43.0%) | 3 (1.4%) |
| Total | 135 (100.0%) | 213 (100.0%) |
Housing Structure by Heating Type in Mifflintown borough
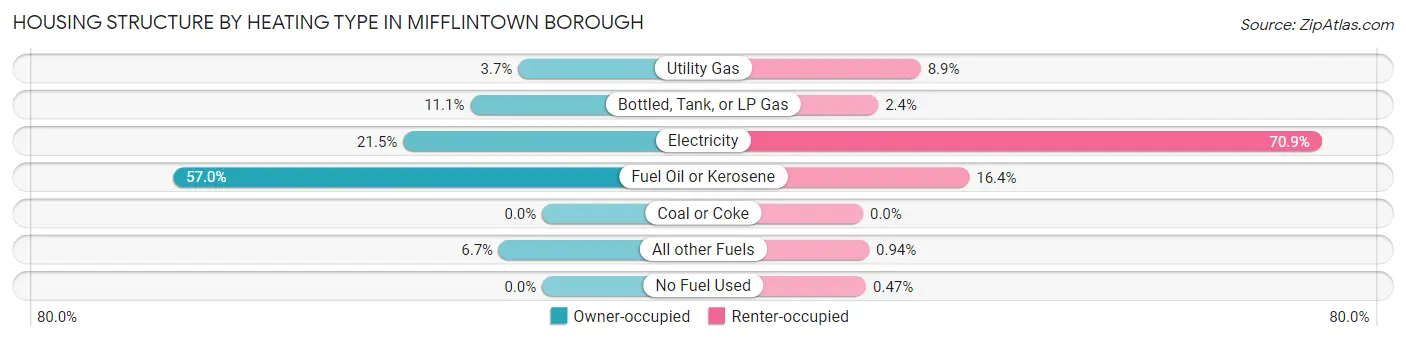
| Heating Type | Owner-occupied | Renter-occupied |
| Utility Gas | 5 (3.7%) | 19 (8.9%) |
| Bottled, Tank, or LP Gas | 15 (11.1%) | 5 (2.4%) |
| Electricity | 29 (21.5%) | 151 (70.9%) |
| Fuel Oil or Kerosene | 77 (57.0%) | 35 (16.4%) |
| Coal or Coke | 0 (0.0%) | 0 (0.0%) |
| All other Fuels | 9 (6.7%) | 2 (0.9%) |
| No Fuel Used | 0 (0.0%) | 1 (0.5%) |
| Total | 135 (100.0%) | 213 (100.0%) |
Household Vehicle Usage in Mifflintown borough
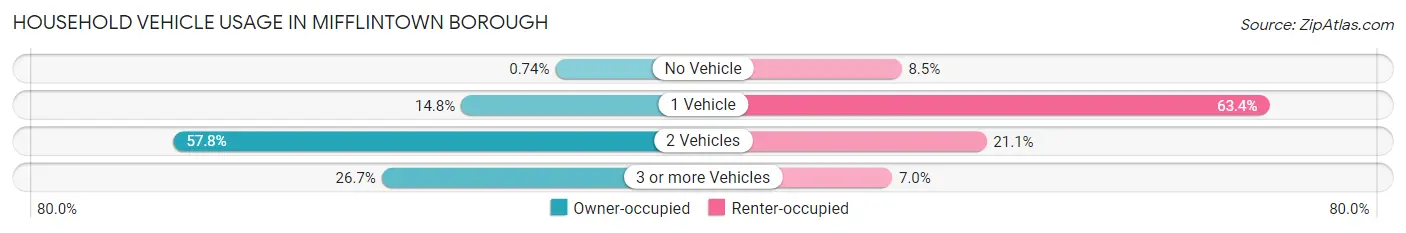
| Vehicles per Household | Owner-occupied | Renter-occupied |
| No Vehicle | 1 (0.7%) | 18 (8.5%) |
| 1 Vehicle | 20 (14.8%) | 135 (63.4%) |
| 2 Vehicles | 78 (57.8%) | 45 (21.1%) |
| 3 or more Vehicles | 36 (26.7%) | 15 (7.0%) |
| Total | 135 (100.0%) | 213 (100.0%) |
Real Estate & Mortgages in Mifflintown borough
Real Estate and Mortgage Overview in Mifflintown borough
| Characteristic | Without Mortgage | With Mortgage |
| Housing Units | 47 | 88 |
| Median Property Value | $113,100 | $120,500 |
| Median Household Income | $52,917 | $12 |
| Monthly Housing Costs | $537 | $5 |
| Real Estate Taxes | $1,167 | $0 |
Property Value by Mortgage Status in Mifflintown borough
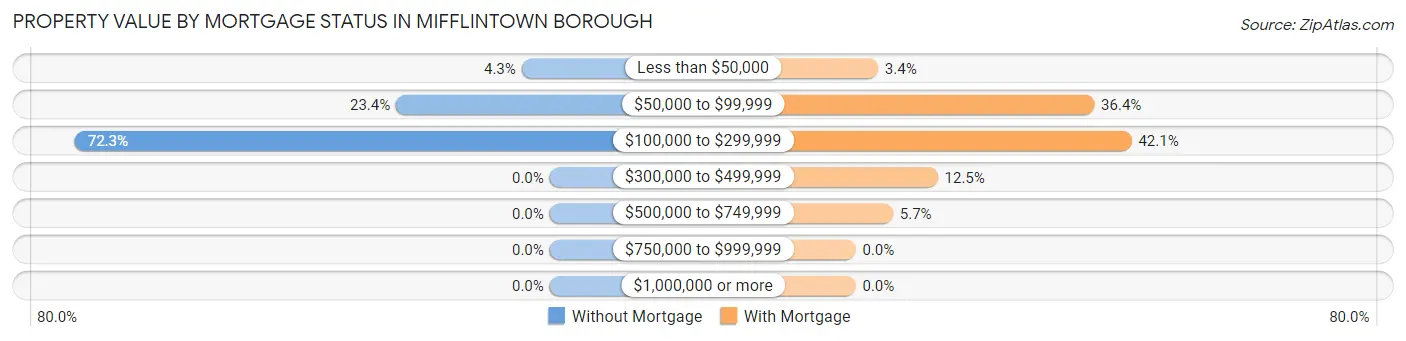
| Property Value | Without Mortgage | With Mortgage |
| Less than $50,000 | 2 (4.3%) | 3 (3.4%) |
| $50,000 to $99,999 | 11 (23.4%) | 32 (36.4%) |
| $100,000 to $299,999 | 34 (72.3%) | 37 (42.0%) |
| $300,000 to $499,999 | 0 (0.0%) | 11 (12.5%) |
| $500,000 to $749,999 | 0 (0.0%) | 5 (5.7%) |
| $750,000 to $999,999 | 0 (0.0%) | 0 (0.0%) |
| $1,000,000 or more | 0 (0.0%) | 0 (0.0%) |
| Total | 47 (100.0%) | 88 (100.0%) |
Household Income by Mortgage Status in Mifflintown borough
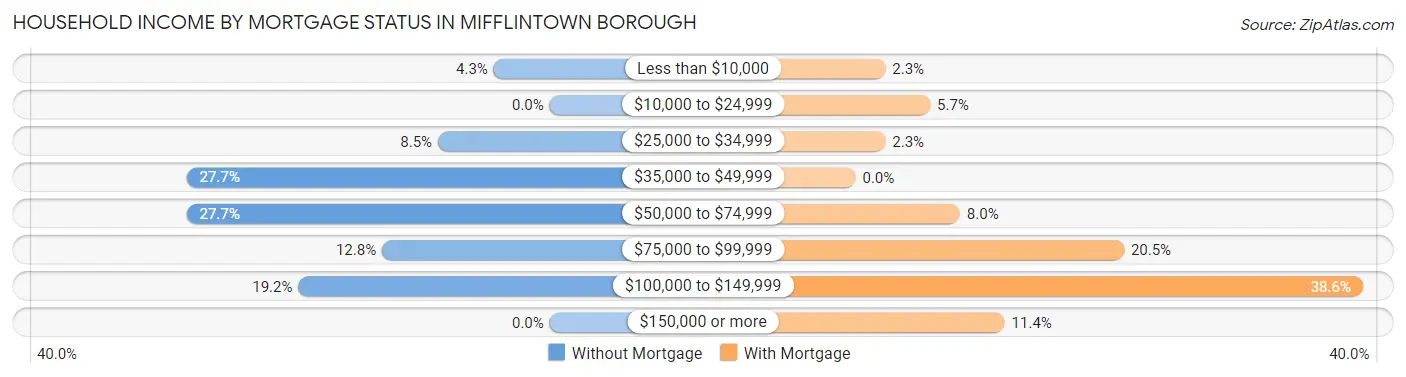
| Household Income | Without Mortgage | With Mortgage |
| Less than $10,000 | 2 (4.3%) | 2 (2.3%) |
| $10,000 to $24,999 | 0 (0.0%) | 5 (5.7%) |
| $25,000 to $34,999 | 4 (8.5%) | 2 (2.3%) |
| $35,000 to $49,999 | 13 (27.7%) | 0 (0.0%) |
| $50,000 to $74,999 | 13 (27.7%) | 7 (8.0%) |
| $75,000 to $99,999 | 6 (12.8%) | 18 (20.4%) |
| $100,000 to $149,999 | 9 (19.2%) | 34 (38.6%) |
| $150,000 or more | 0 (0.0%) | 10 (11.4%) |
| Total | 47 (100.0%) | 88 (100.0%) |
Property Value to Household Income Ratio in Mifflintown borough
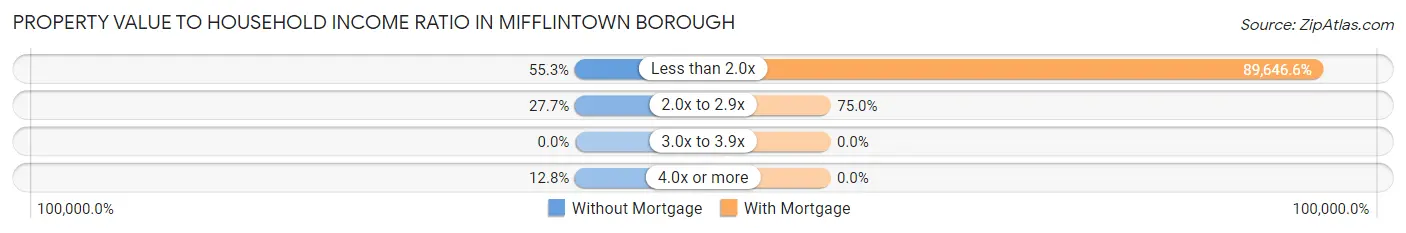
| Value-to-Income Ratio | Without Mortgage | With Mortgage |
| Less than 2.0x | 26 (55.3%) | 78,889 (89,646.6%) |
| 2.0x to 2.9x | 13 (27.7%) | 66 (75.0%) |
| 3.0x to 3.9x | 0 (0.0%) | 0 (0.0%) |
| 4.0x or more | 6 (12.8%) | 0 (0.0%) |
| Total | 47 (100.0%) | 88 (100.0%) |
Real Estate Taxes by Mortgage Status in Mifflintown borough
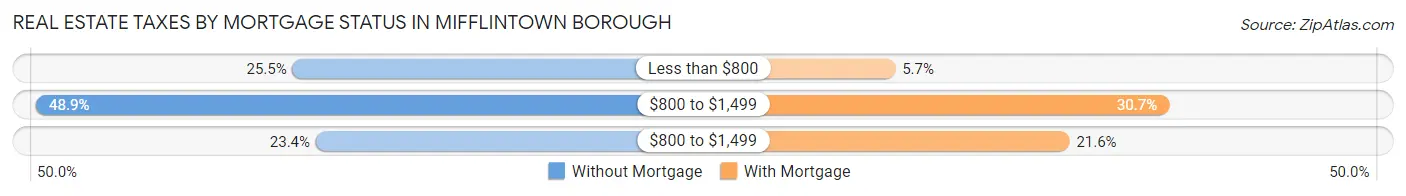
| Property Taxes | Without Mortgage | With Mortgage |
| Less than $800 | 12 (25.5%) | 5 (5.7%) |
| $800 to $1,499 | 23 (48.9%) | 27 (30.7%) |
| $800 to $1,499 | 11 (23.4%) | 19 (21.6%) |
| Total | 47 (100.0%) | 88 (100.0%) |
Health & Disability in Mifflintown borough
Health Insurance Coverage by Age in Mifflintown borough
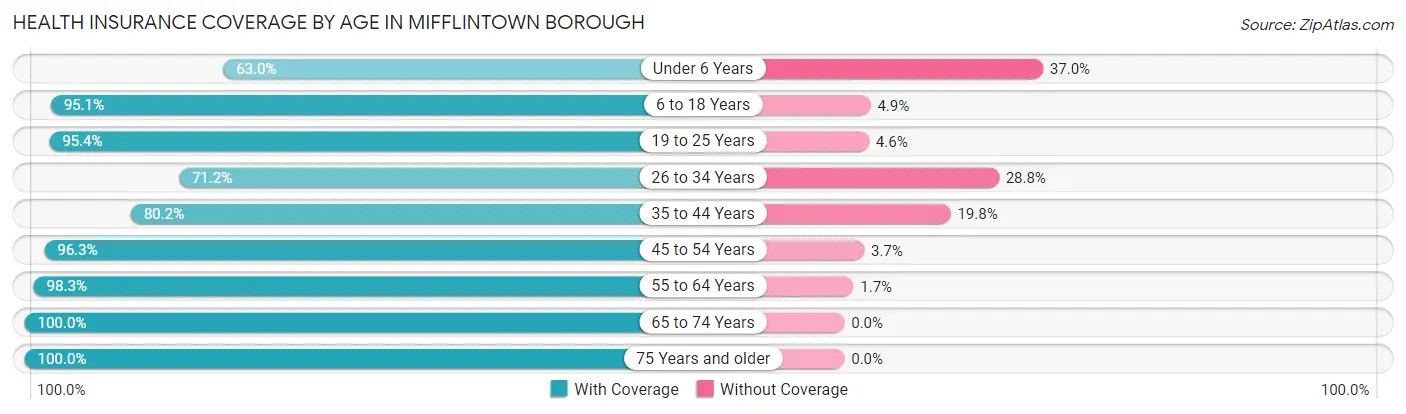
| Age Bracket | With Coverage | Without Coverage |
| Under 6 Years | 17 (63.0%) | 10 (37.0%) |
| 6 to 18 Years | 156 (95.1%) | 8 (4.9%) |
| 19 to 25 Years | 104 (95.4%) | 5 (4.6%) |
| 26 to 34 Years | 47 (71.2%) | 19 (28.8%) |
| 35 to 44 Years | 81 (80.2%) | 20 (19.8%) |
| 45 to 54 Years | 131 (96.3%) | 5 (3.7%) |
| 55 to 64 Years | 116 (98.3%) | 2 (1.7%) |
| 65 to 74 Years | 98 (100.0%) | 0 (0.0%) |
| 75 Years and older | 67 (100.0%) | 0 (0.0%) |
| Total | 817 (92.2%) | 69 (7.8%) |
Health Insurance Coverage by Citizenship Status in Mifflintown borough
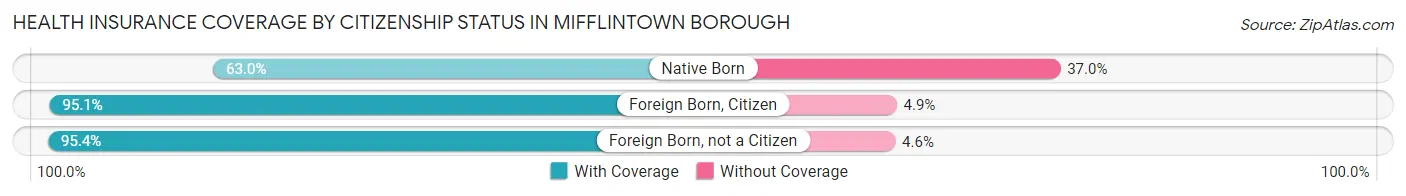
| Citizenship Status | With Coverage | Without Coverage |
| Native Born | 17 (63.0%) | 10 (37.0%) |
| Foreign Born, Citizen | 156 (95.1%) | 8 (4.9%) |
| Foreign Born, not a Citizen | 104 (95.4%) | 5 (4.6%) |
Health Insurance Coverage by Household Income in Mifflintown borough
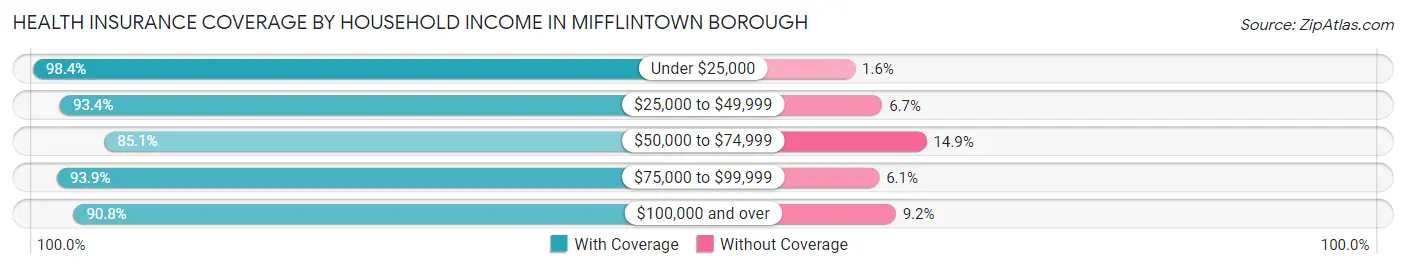
| Household Income | With Coverage | Without Coverage |
| Under $25,000 | 63 (98.4%) | 1 (1.6%) |
| $25,000 to $49,999 | 351 (93.3%) | 25 (6.7%) |
| $50,000 to $74,999 | 114 (85.1%) | 20 (14.9%) |
| $75,000 to $99,999 | 170 (93.9%) | 11 (6.1%) |
| $100,000 and over | 119 (90.8%) | 12 (9.2%) |
Public vs Private Health Insurance Coverage by Age in Mifflintown borough
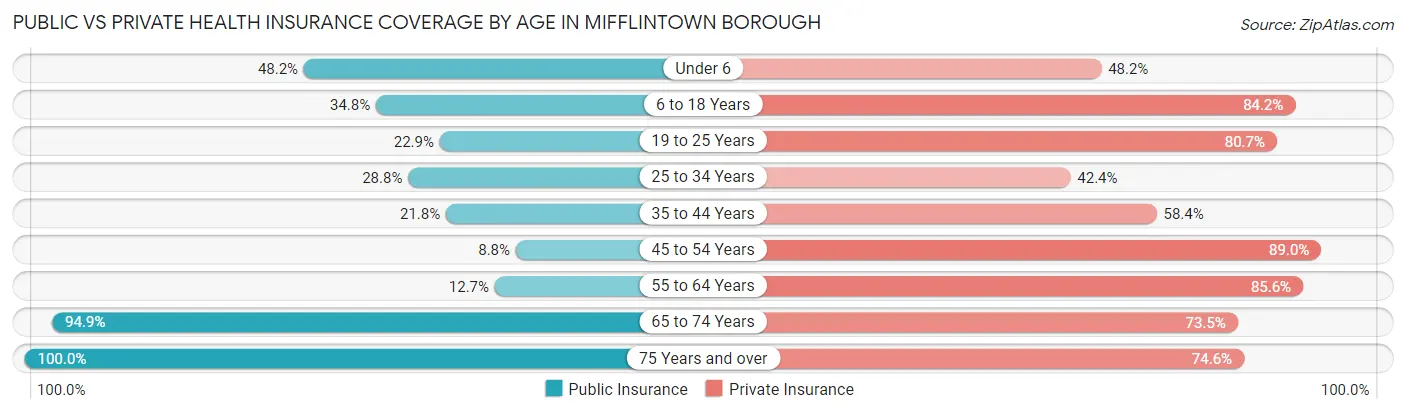
| Age Bracket | Public Insurance | Private Insurance |
| Under 6 | 13 (48.1%) | 13 (48.1%) |
| 6 to 18 Years | 57 (34.8%) | 138 (84.2%) |
| 19 to 25 Years | 25 (22.9%) | 88 (80.7%) |
| 25 to 34 Years | 19 (28.8%) | 28 (42.4%) |
| 35 to 44 Years | 22 (21.8%) | 59 (58.4%) |
| 45 to 54 Years | 12 (8.8%) | 121 (89.0%) |
| 55 to 64 Years | 15 (12.7%) | 101 (85.6%) |
| 65 to 74 Years | 93 (94.9%) | 72 (73.5%) |
| 75 Years and over | 67 (100.0%) | 50 (74.6%) |
| Total | 323 (36.5%) | 670 (75.6%) |
Disability Status by Sex by Age in Mifflintown borough
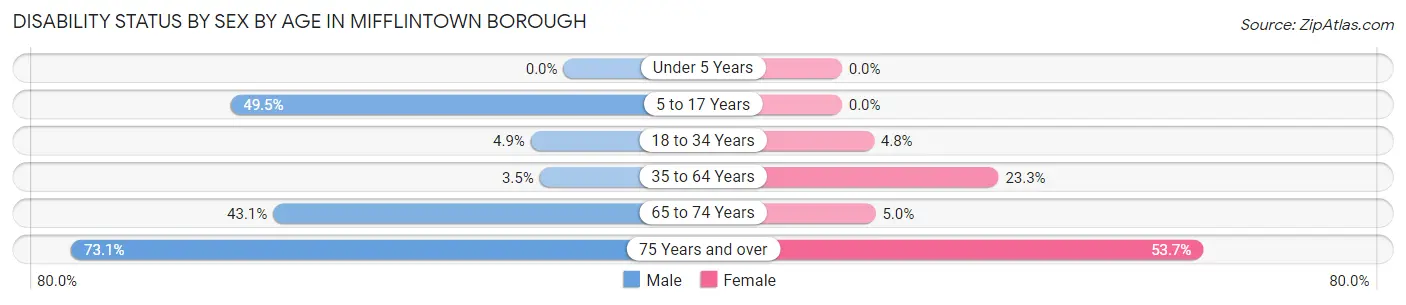
| Age Bracket | Male | Female |
| Under 5 Years | 0 (0.0%) | 0 (0.0%) |
| 5 to 17 Years | 45 (49.4%) | 0 (0.0%) |
| 18 to 34 Years | 5 (4.9%) | 4 (4.8%) |
| 35 to 64 Years | 8 (3.5%) | 30 (23.3%) |
| 65 to 74 Years | 25 (43.1%) | 2 (5.0%) |
| 75 Years and over | 19 (73.1%) | 22 (53.7%) |
Disability Class by Sex by Age in Mifflintown borough
Disability Class: Hearing Difficulty
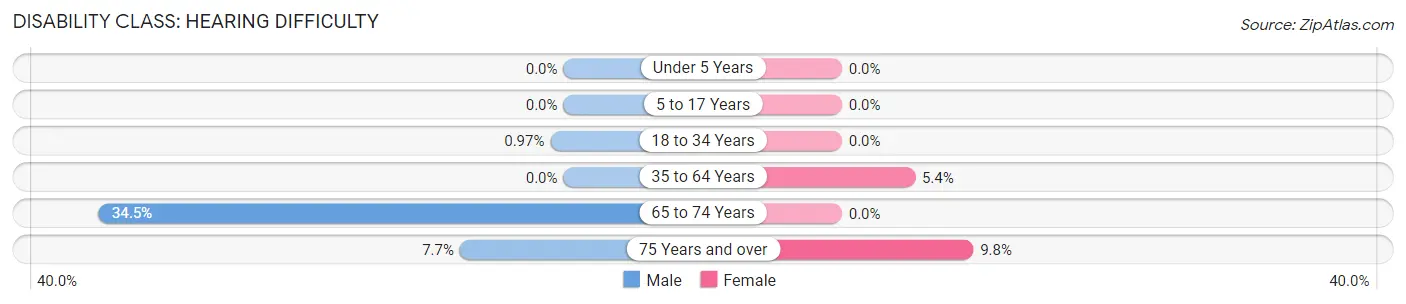
| Age Bracket | Male | Female |
| Under 5 Years | 0 (0.0%) | 0 (0.0%) |
| 5 to 17 Years | 0 (0.0%) | 0 (0.0%) |
| 18 to 34 Years | 1 (1.0%) | 0 (0.0%) |
| 35 to 64 Years | 0 (0.0%) | 7 (5.4%) |
| 65 to 74 Years | 20 (34.5%) | 0 (0.0%) |
| 75 Years and over | 2 (7.7%) | 4 (9.8%) |
Disability Class: Vision Difficulty
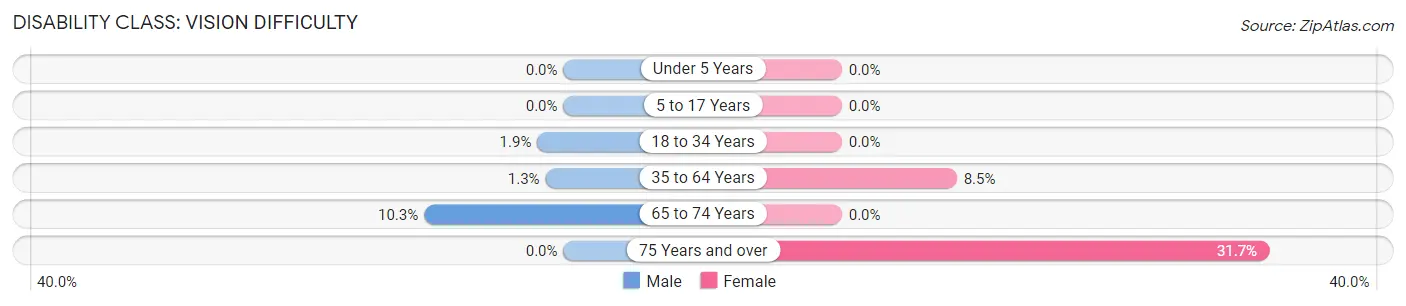
| Age Bracket | Male | Female |
| Under 5 Years | 0 (0.0%) | 0 (0.0%) |
| 5 to 17 Years | 0 (0.0%) | 0 (0.0%) |
| 18 to 34 Years | 2 (1.9%) | 0 (0.0%) |
| 35 to 64 Years | 3 (1.3%) | 11 (8.5%) |
| 65 to 74 Years | 6 (10.3%) | 0 (0.0%) |
| 75 Years and over | 0 (0.0%) | 13 (31.7%) |
Disability Class: Cognitive Difficulty
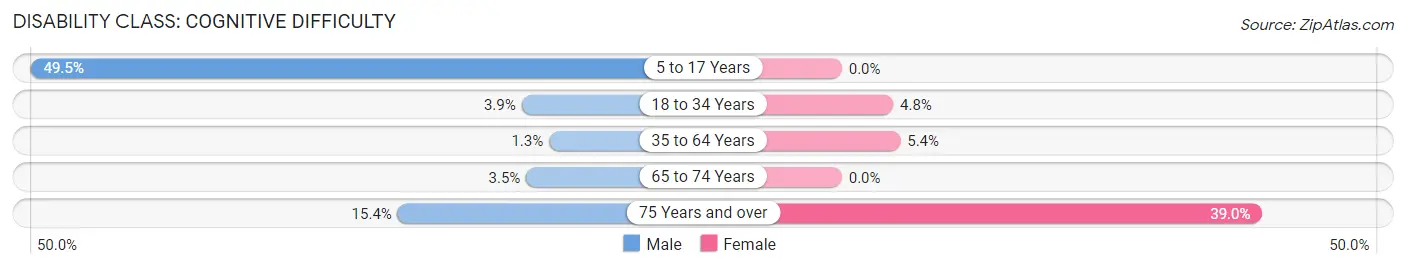
| Age Bracket | Male | Female |
| 5 to 17 Years | 45 (49.4%) | 0 (0.0%) |
| 18 to 34 Years | 4 (3.9%) | 4 (4.8%) |
| 35 to 64 Years | 3 (1.3%) | 7 (5.4%) |
| 65 to 74 Years | 2 (3.5%) | 0 (0.0%) |
| 75 Years and over | 4 (15.4%) | 16 (39.0%) |
Disability Class: Ambulatory Difficulty
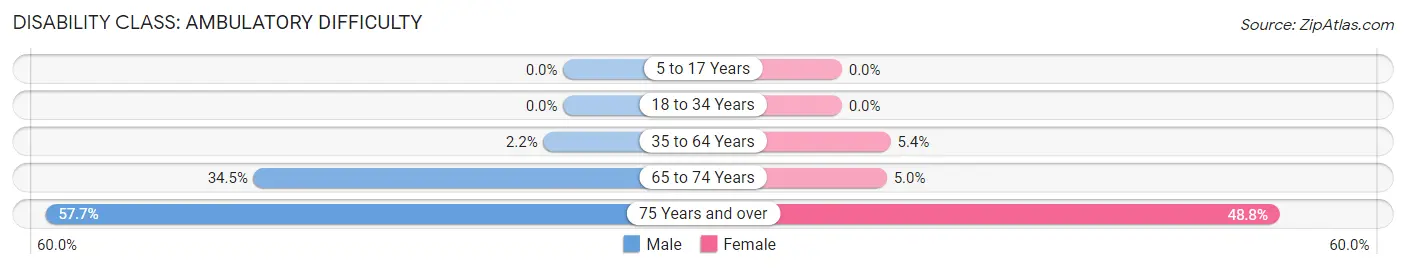
| Age Bracket | Male | Female |
| 5 to 17 Years | 0 (0.0%) | 0 (0.0%) |
| 18 to 34 Years | 0 (0.0%) | 0 (0.0%) |
| 35 to 64 Years | 5 (2.2%) | 7 (5.4%) |
| 65 to 74 Years | 20 (34.5%) | 2 (5.0%) |
| 75 Years and over | 15 (57.7%) | 20 (48.8%) |
Disability Class: Self-Care Difficulty
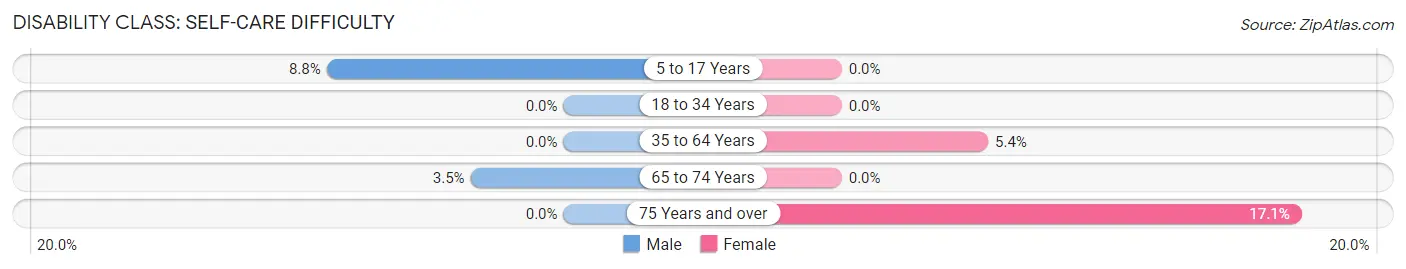
| Age Bracket | Male | Female |
| 5 to 17 Years | 8 (8.8%) | 0 (0.0%) |
| 18 to 34 Years | 0 (0.0%) | 0 (0.0%) |
| 35 to 64 Years | 0 (0.0%) | 7 (5.4%) |
| 65 to 74 Years | 2 (3.5%) | 0 (0.0%) |
| 75 Years and over | 0 (0.0%) | 7 (17.1%) |
Technology Access in Mifflintown borough
Computing Device Access in Mifflintown borough
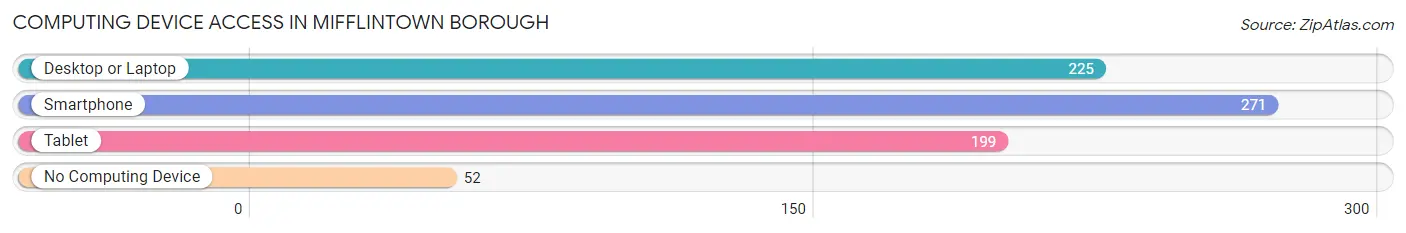
| Device Type | # Households | % Households |
| Desktop or Laptop | 225 | 64.7% |
| Smartphone | 271 | 77.9% |
| Tablet | 199 | 57.2% |
| No Computing Device | 52 | 14.9% |
| Total | 348 | 100.0% |
Internet Access in Mifflintown borough
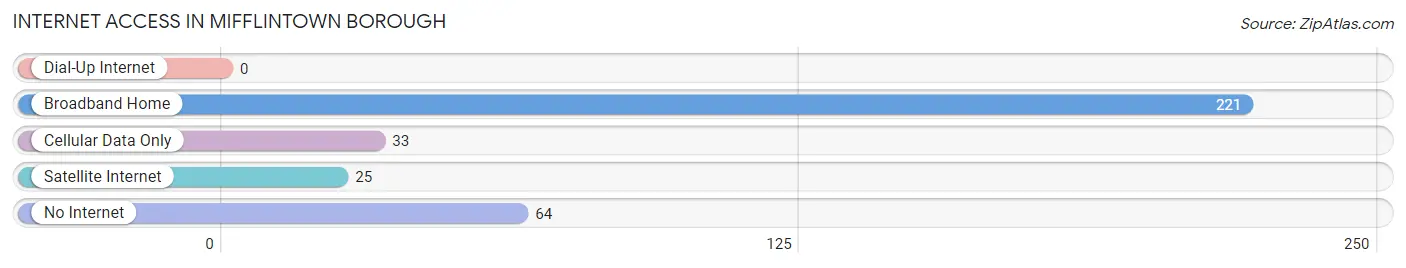
| Internet Type | # Households | % Households |
| Dial-Up Internet | 0 | 0.0% |
| Broadband Home | 221 | 63.5% |
| Cellular Data Only | 33 | 9.5% |
| Satellite Internet | 25 | 7.2% |
| No Internet | 64 | 18.4% |
| Total | 348 | 100.0% |
Mifflintown borough Summary
Mifflintown Borough is a small borough located in Juniata County, Pennsylvania. It is situated in the Juniata River Valley, approximately 10 miles south of Lewistown, the county seat. The borough is home to a population of approximately 1,000 people and is part of the larger Mifflin-Juniata region.
History
Mifflintown was founded in 1817 by John Mifflin, a Revolutionary War veteran. The town was originally known as Mifflinburg, but the name was changed to Mifflintown in 1820. The town was laid out in a grid pattern, with the main street running east-west and the cross streets running north-south. The town was incorporated as a borough in 1845.
Mifflintown was an important stop on the Pennsylvania Canal, which ran through the town from 1834 to 1871. The canal was a major transportation route for goods and people, and it helped to spur the growth of the town. The canal also provided a source of employment for many of the town's residents.
The town was also an important stop on the Pennsylvania Railroad, which ran through the town from 1871 to 1971. The railroad provided a major source of employment for many of the town's residents.
Geography
Mifflintown is located in the Juniata River Valley, approximately 10 miles south of Lewistown, the county seat. The borough is situated on the east bank of the Juniata River, and is surrounded by the townships of Fermanagh, Turbett, and Lack. The borough is located at an elevation of 590 feet above sea level.
The borough covers an area of 0.6 square miles, all of which is land. The terrain is mostly flat, with some rolling hills. The climate is humid continental, with cold winters and hot, humid summers.
Economy
Mifflintown's economy is largely based on agriculture and light manufacturing. The town is home to several small businesses, including a grocery store, a hardware store, and a restaurant. The town is also home to a number of small farms, which produce a variety of crops, including corn, soybeans, and hay.
The town is also home to a number of light manufacturing businesses, including a furniture factory, a plastics factory, and a printing company. The town is also home to a number of service-based businesses, including a bank, a post office, and a number of professional offices.
Demographics
Mifflintown has a population of approximately 1,000 people. The population is predominantly white (97.2%), with a small minority population (2.8%). The median household income is $37,500, and the median home value is $90,000. The town has a high rate of homeownership (83.3%), and the unemployment rate is 4.2%.
The town is served by the Juniata County School District, which includes two elementary schools, one middle school, and one high school. The town is also home to a number of churches, including the Mifflintown United Methodist Church, the Mifflintown Presbyterian Church, and the Mifflintown Baptist Church.
Conclusion
Mifflintown is a small borough located in Juniata County, Pennsylvania. It is situated in the Juniata River Valley, approximately 10 miles south of Lewistown, the county seat. The borough is home to a population of approximately 1,000 people and is part of the larger Mifflin-Juniata region. The town's economy is largely based on agriculture and light manufacturing, and the town is served by the Juniata County School District. Mifflintown is a small, close-knit community with a rich history and a bright future.
Common Questions
What is Per Capita Income in Mifflintown borough?
Per Capita income in Mifflintown borough is $26,414.
What is the Median Family Income in Mifflintown borough?
Median Family Income in Mifflintown borough is $47,188.
What is the Median Household income in Mifflintown borough?
Median Household Income in Mifflintown borough is $48,333.
What is Income or Wage Gap in Mifflintown borough?
Income or Wage Gap in Mifflintown borough is 34.0%.
Women in Mifflintown borough earn 66.0 cents for every dollar earned by a man.
What is Inequality or Gini Index in Mifflintown borough?
Inequality or Gini Index in Mifflintown borough is 0.36.
What is the Total Population of Mifflintown borough?
Total Population of Mifflintown borough is 886.
What is the Total Male Population of Mifflintown borough?
Total Male Population of Mifflintown borough is 510.
What is the Total Female Population of Mifflintown borough?
Total Female Population of Mifflintown borough is 376.
What is the Ratio of Males per 100 Females in Mifflintown borough?
There are 135.64 Males per 100 Females in Mifflintown borough.
What is the Ratio of Females per 100 Males in Mifflintown borough?
There are 73.73 Females per 100 Males in Mifflintown borough.
What is the Median Population Age in Mifflintown borough?
Median Population Age in Mifflintown borough is 41.4 Years.
What is the Average Family Size in Mifflintown borough
Average Family Size in Mifflintown borough is 3.1 People.
What is the Average Household Size in Mifflintown borough
Average Household Size in Mifflintown borough is 2.5 People.
How Large is the Labor Force in Mifflintown borough?
There are 479 People in the Labor Forcein in Mifflintown borough.
What is the Percentage of People in the Labor Force in Mifflintown borough?
63.7% of People are in the Labor Force in Mifflintown borough.
What is the Unemployment Rate in Mifflintown borough?
Unemployment Rate in Mifflintown borough is 7.5%.