Bethlehem, PA Map & Demographics
Bethlehem Map
Bethlehem Overview
$38,313
PER CAPITA INCOME
$76,937
AVG FAMILY INCOME
$62,072
AVG HOUSEHOLD INCOME
20.8%
WAGE / INCOME GAP [ % ]
79.2¢/ $1
WAGE / INCOME GAP [ $ ]
$9,782
FAMILY INCOME DEFICIT
0.49
INEQUALITY / GINI INDEX
76,555
TOTAL POPULATION
37,062
MALE POPULATION
39,493
FEMALE POPULATION
93.84
MALES / 100 FEMALES
106.56
FEMALES / 100 MALES
35.9
MEDIAN AGE
3.0
AVG FAMILY SIZE
2.3
AVG HOUSEHOLD SIZE
38,410
LABOR FORCE [ PEOPLE ]
59.4%
PERCENT IN LABOR FORCE
5.6%
UNEMPLOYMENT RATE
Income in Bethlehem
Income Overview in Bethlehem
Per Capita Income in Bethlehem is $38,313, while median incomes of families and households are $76,937 and $62,072 respectively.
| Characteristic | Number | Measure |
| Per Capita Income | 76,555 | $38,313 |
| Median Family Income | 16,798 | $76,937 |
| Mean Family Income | 16,798 | $106,701 |
| Median Household Income | 30,162 | $62,072 |
| Mean Household Income | 30,162 | $89,931 |
| Income Deficit | 16,798 | $9,782 |
| Wage / Income Gap (%) | 76,555 | 20.81% |
| Wage / Income Gap ($) | 76,555 | 79.19¢ per $1 |
| Gini / Inequality Index | 76,555 | 0.49 |
Earnings by Sex in Bethlehem
Average Earnings in Bethlehem are $35,547, $39,895 for men and $31,593 for women, a difference of 20.8%.
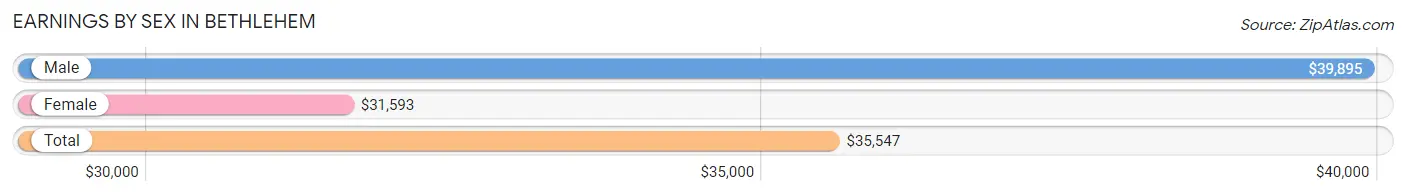
| Sex | Number | Average Earnings |
| Male | 21,685 (51.9%) | $39,895 |
| Female | 20,094 (48.1%) | $31,593 |
| Total | 41,779 (100.0%) | $35,547 |
Earnings by Sex by Income Bracket in Bethlehem
The most common earnings brackets in Bethlehem are $100,000+ for men (2,720 | 12.5%) and $2,499 or less for women (1,682 | 8.4%).
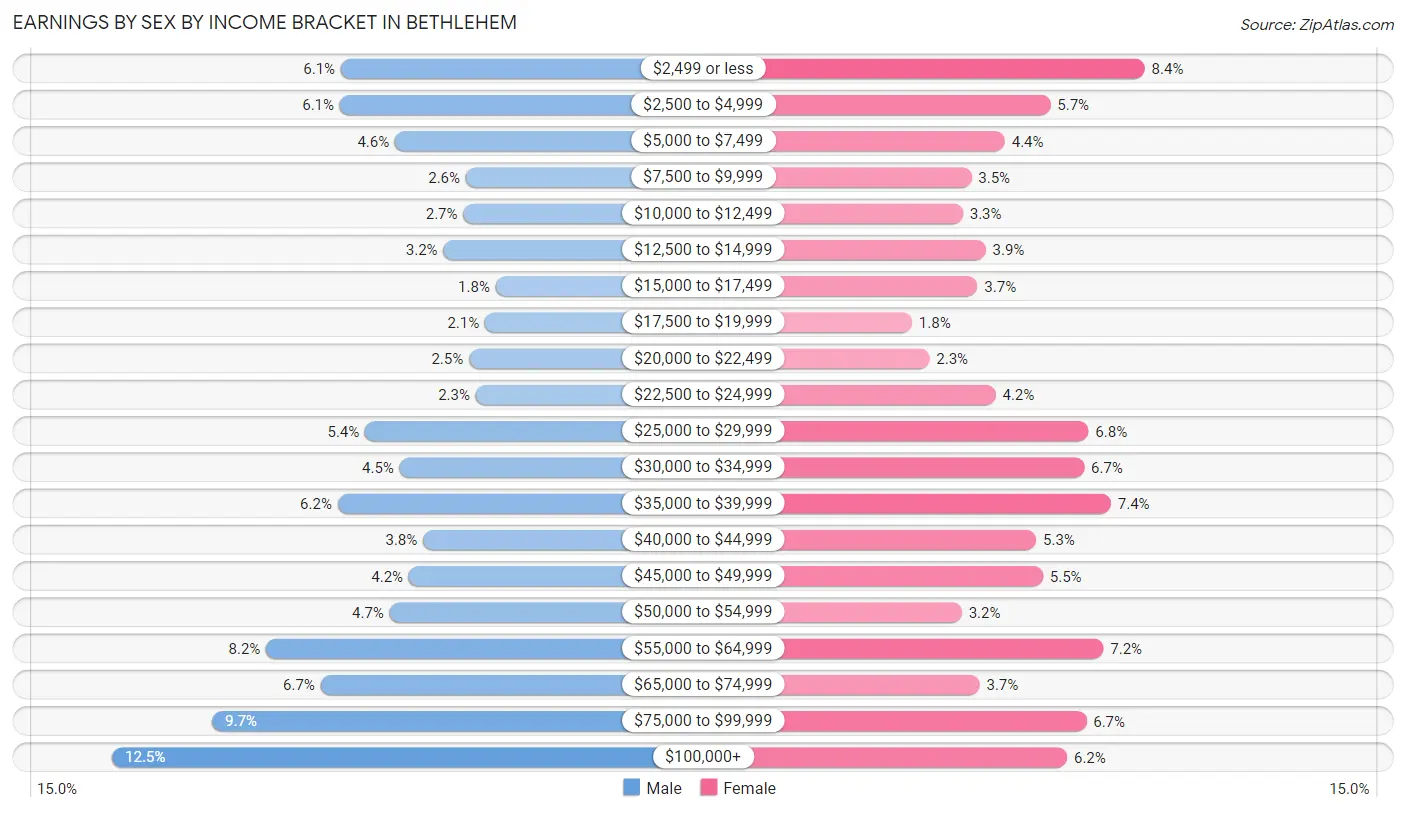
| Income | Male | Female |
| $2,499 or less | 1,324 (6.1%) | 1,682 (8.4%) |
| $2,500 to $4,999 | 1,332 (6.1%) | 1,149 (5.7%) |
| $5,000 to $7,499 | 995 (4.6%) | 893 (4.4%) |
| $7,500 to $9,999 | 564 (2.6%) | 704 (3.5%) |
| $10,000 to $12,499 | 580 (2.7%) | 655 (3.3%) |
| $12,500 to $14,999 | 701 (3.2%) | 784 (3.9%) |
| $15,000 to $17,499 | 382 (1.8%) | 738 (3.7%) |
| $17,500 to $19,999 | 446 (2.1%) | 367 (1.8%) |
| $20,000 to $22,499 | 544 (2.5%) | 467 (2.3%) |
| $22,500 to $24,999 | 503 (2.3%) | 840 (4.2%) |
| $25,000 to $29,999 | 1,177 (5.4%) | 1,364 (6.8%) |
| $30,000 to $34,999 | 968 (4.5%) | 1,340 (6.7%) |
| $35,000 to $39,999 | 1,345 (6.2%) | 1,491 (7.4%) |
| $40,000 to $44,999 | 825 (3.8%) | 1,070 (5.3%) |
| $45,000 to $49,999 | 911 (4.2%) | 1,108 (5.5%) |
| $50,000 to $54,999 | 1,027 (4.7%) | 649 (3.2%) |
| $55,000 to $64,999 | 1,781 (8.2%) | 1,448 (7.2%) |
| $65,000 to $74,999 | 1,449 (6.7%) | 750 (3.7%) |
| $75,000 to $99,999 | 2,111 (9.7%) | 1,352 (6.7%) |
| $100,000+ | 2,720 (12.5%) | 1,243 (6.2%) |
| Total | 21,685 (100.0%) | 20,094 (100.0%) |
Earnings by Sex by Educational Attainment in Bethlehem
Average earnings in Bethlehem are $51,996 for men and $39,323 for women, a difference of 24.4%. Men with an educational attainment of bachelor's degree enjoy the highest average annual earnings of $60,901, while those with less than high school education earn the least with $39,750. Women with an educational attainment of graduate degree earn the most with the average annual earnings of $68,140, while those with less than high school education have the smallest earnings of $21,576.
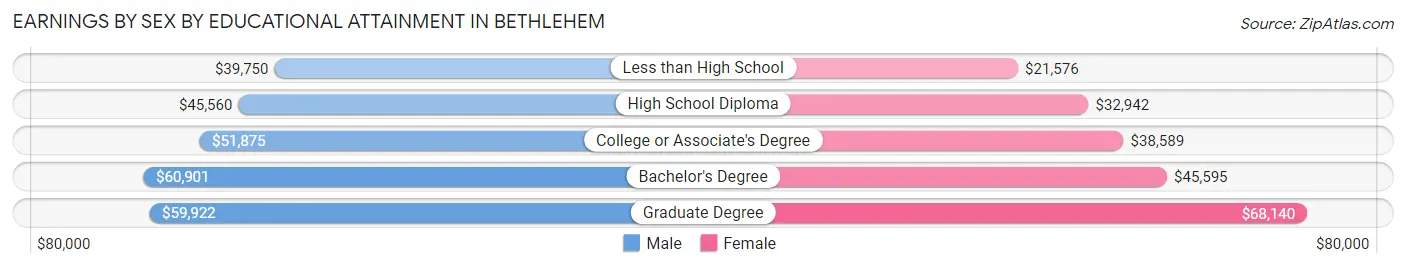
| Educational Attainment | Male Income | Female Income |
| Less than High School | $39,750 | $21,576 |
| High School Diploma | $45,560 | $32,942 |
| College or Associate's Degree | $51,875 | $38,589 |
| Bachelor's Degree | $60,901 | $45,595 |
| Graduate Degree | $59,922 | $68,140 |
| Total | $51,996 | $39,323 |
Family Income in Bethlehem
Family Income Brackets in Bethlehem
According to the Bethlehem family income data, there are 3,326 families falling into the $100,000 to $149,999 income range, which is the most common income bracket and makes up 19.8% of all families. Conversely, the $10,000 to $14,999 income bracket is the least frequent group with only 437 families (2.6%) belonging to this category.
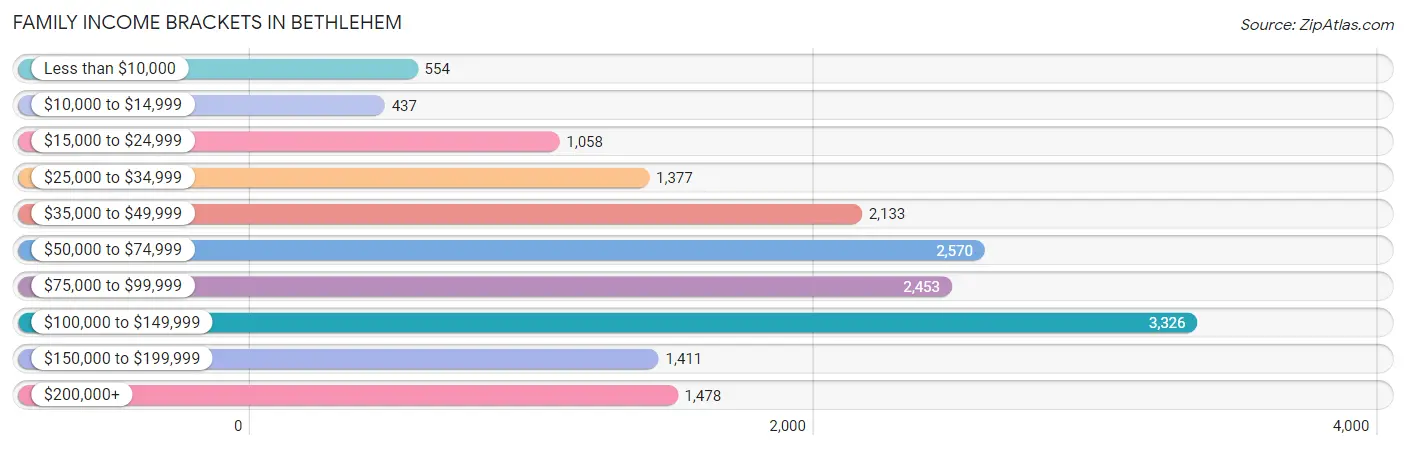
| Income Bracket | # Families | % Families |
| Less than $10,000 | 554 | 3.3% |
| $10,000 to $14,999 | 437 | 2.6% |
| $15,000 to $24,999 | 1,058 | 6.3% |
| $25,000 to $34,999 | 1,377 | 8.2% |
| $35,000 to $49,999 | 2,133 | 12.7% |
| $50,000 to $74,999 | 2,570 | 15.3% |
| $75,000 to $99,999 | 2,453 | 14.6% |
| $100,000 to $149,999 | 3,326 | 19.8% |
| $150,000 to $199,999 | 1,411 | 8.4% |
| $200,000+ | 1,478 | 8.8% |
Family Income by Famaliy Size in Bethlehem
7+ person families (417 | 2.5%) account for the highest median family income in Bethlehem with $102,950 per family, while 2-person families (8,660 | 51.5%) have the highest median income of $38,508 per family member.
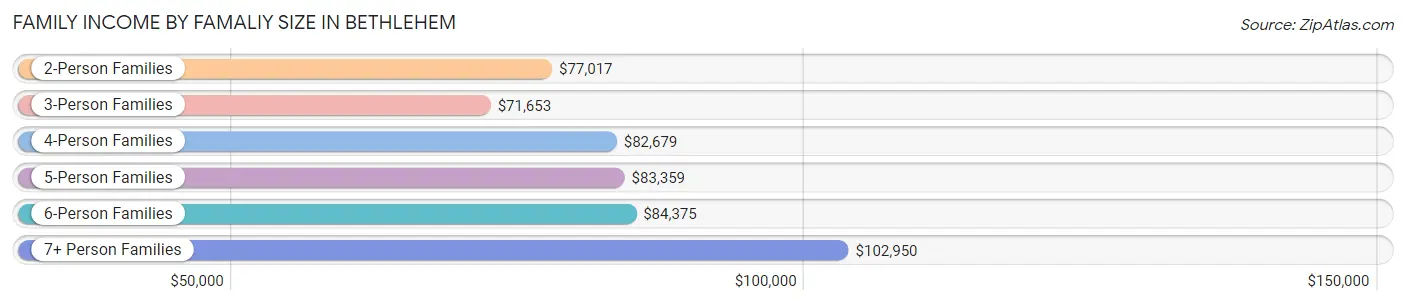
| Income Bracket | # Families | Median Income |
| 2-Person Families | 8,660 (51.5%) | $77,017 |
| 3-Person Families | 4,146 (24.7%) | $71,653 |
| 4-Person Families | 2,405 (14.3%) | $82,679 |
| 5-Person Families | 892 (5.3%) | $83,359 |
| 6-Person Families | 278 (1.7%) | $84,375 |
| 7+ Person Families | 417 (2.5%) | $102,950 |
| Total | 16,798 (100.0%) | $76,937 |
Family Income by Number of Earners in Bethlehem
The median family income in Bethlehem is $76,937, with families comprising 3+ earners (1,550) having the highest median family income of $142,941, while families with no earners (2,778) have the lowest median family income of $48,772, accounting for 9.2% and 16.5% of families, respectively.
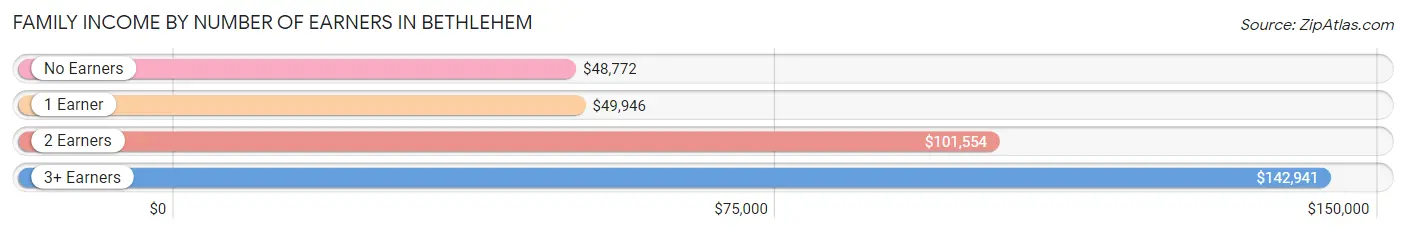
| Number of Earners | # Families | Median Income |
| No Earners | 2,778 (16.5%) | $48,772 |
| 1 Earner | 5,966 (35.5%) | $49,946 |
| 2 Earners | 6,504 (38.7%) | $101,554 |
| 3+ Earners | 1,550 (9.2%) | $142,941 |
| Total | 16,798 (100.0%) | $76,937 |
Household Income in Bethlehem
Household Income Brackets in Bethlehem
With 4,886 households falling in the category, the $100,000 to $149,999 income range is the most frequent in Bethlehem, accounting for 16.2% of all households. In contrast, only 1,297 households (4.3%) fall into the less than $10,000 income bracket, making it the least populous group.
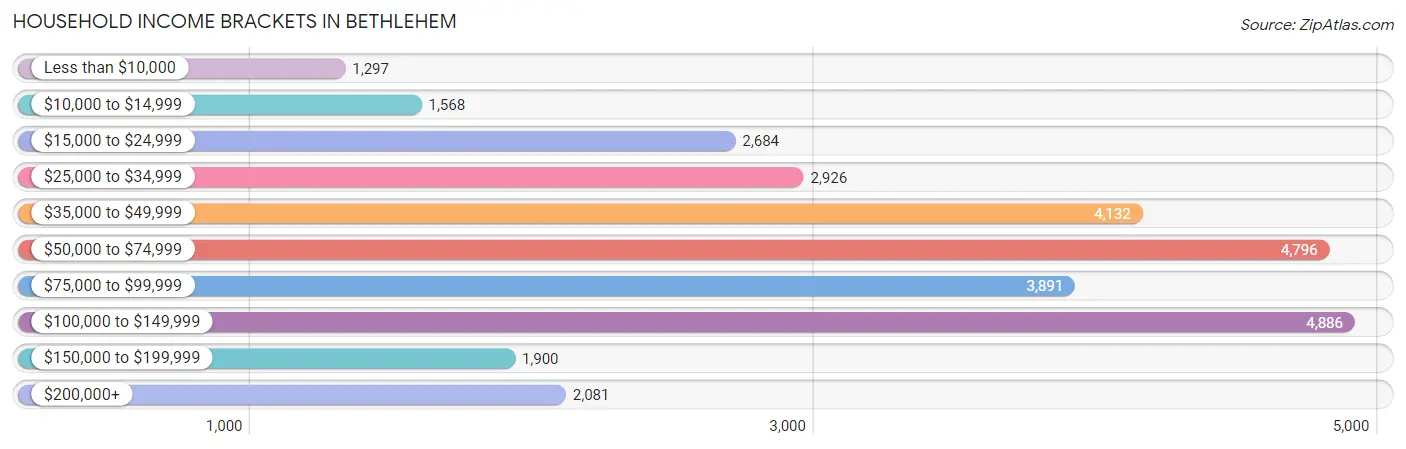
| Income Bracket | # Households | % Households |
| Less than $10,000 | 1,297 | 4.3% |
| $10,000 to $14,999 | 1,568 | 5.2% |
| $15,000 to $24,999 | 2,684 | 8.9% |
| $25,000 to $34,999 | 2,926 | 9.7% |
| $35,000 to $49,999 | 4,132 | 13.7% |
| $50,000 to $74,999 | 4,796 | 15.9% |
| $75,000 to $99,999 | 3,891 | 12.9% |
| $100,000 to $149,999 | 4,886 | 16.2% |
| $150,000 to $199,999 | 1,900 | 6.3% |
| $200,000+ | 2,081 | 6.9% |
Household Income by Householder Age in Bethlehem
The median household income in Bethlehem is $62,072, with the highest median household income of $72,500 found in the 45 to 64 years age bracket for the primary householder. A total of 9,632 households (31.9%) fall into this category. Meanwhile, the 15 to 24 years age bracket for the primary householder has the lowest median household income of $45,217, with 1,448 households (4.8%) in this group.
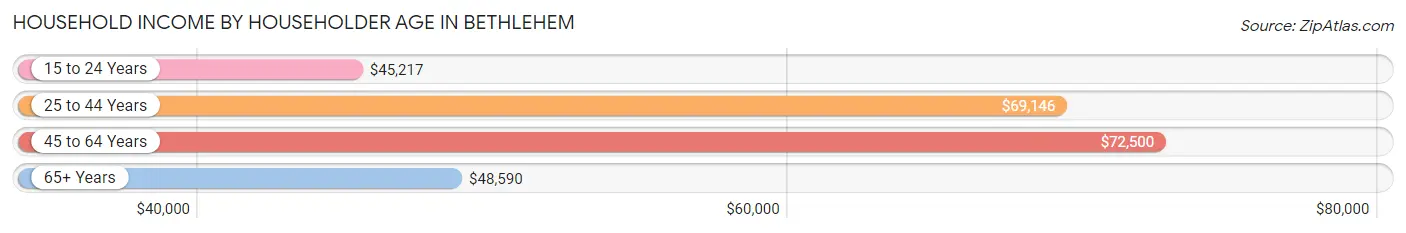
| Income Bracket | # Households | Median Income |
| 15 to 24 Years | 1,448 (4.8%) | $45,217 |
| 25 to 44 Years | 10,209 (33.9%) | $69,146 |
| 45 to 64 Years | 9,632 (31.9%) | $72,500 |
| 65+ Years | 8,873 (29.4%) | $48,590 |
| Total | 30,162 (100.0%) | $62,072 |
Poverty in Bethlehem
Income Below Poverty by Sex and Age in Bethlehem
With 18.3% poverty level for males and 18.3% for females among the residents of Bethlehem, 18 to 24 year old males and 6 to 11 year old females are the most vulnerable to poverty, with 1,680 males (38.8%) and 632 females (32.8%) in their respective age groups living below the poverty level.
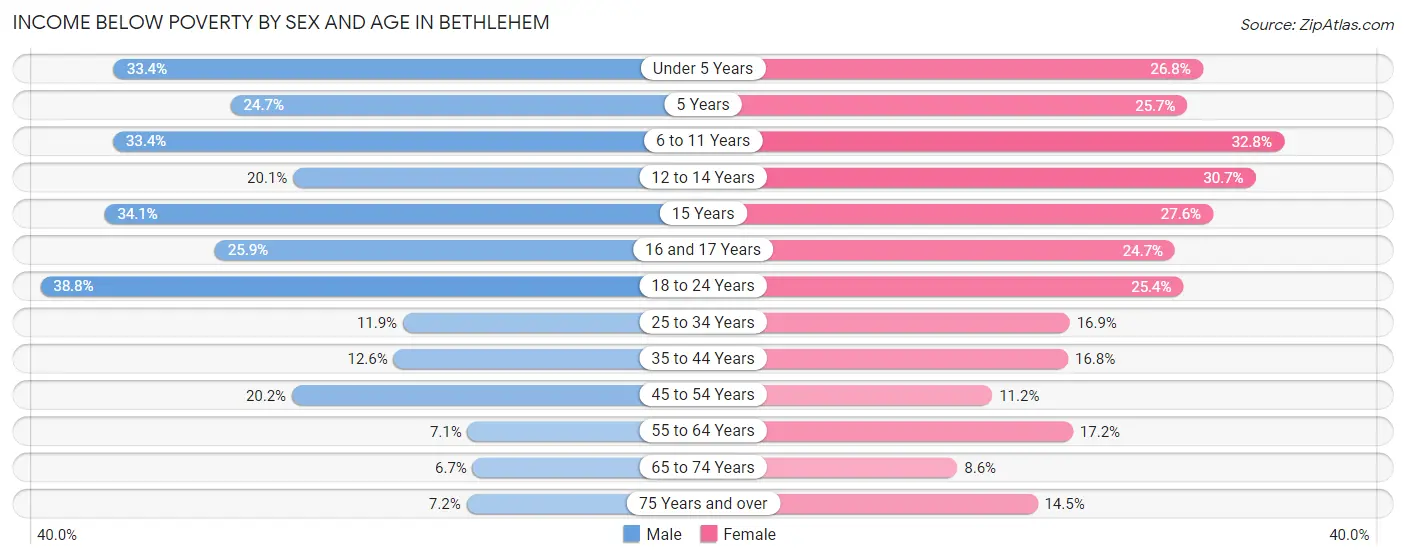
| Age Bracket | Male | Female |
| Under 5 Years | 571 (33.4%) | 481 (26.8%) |
| 5 Years | 61 (24.7%) | 79 (25.7%) |
| 6 to 11 Years | 736 (33.4%) | 632 (32.8%) |
| 12 to 14 Years | 199 (20.1%) | 508 (30.7%) |
| 15 Years | 123 (34.1%) | 127 (27.6%) |
| 16 and 17 Years | 201 (25.9%) | 161 (24.7%) |
| 18 to 24 Years | 1,680 (38.8%) | 910 (25.4%) |
| 25 to 34 Years | 694 (11.9%) | 904 (16.9%) |
| 35 to 44 Years | 559 (12.6%) | 753 (16.8%) |
| 45 to 54 Years | 753 (20.2%) | 443 (11.2%) |
| 55 to 64 Years | 285 (7.1%) | 748 (17.2%) |
| 65 to 74 Years | 221 (6.7%) | 353 (8.6%) |
| 75 Years and over | 155 (7.2%) | 540 (14.5%) |
| Total | 6,238 (18.3%) | 6,639 (18.3%) |
Income Above Poverty by Sex and Age in Bethlehem
According to the poverty statistics in Bethlehem, males aged 65 to 74 years and females aged 65 to 74 years are the age groups that are most secure financially, with 93.3% of males and 91.4% of females in these age groups living above the poverty line.
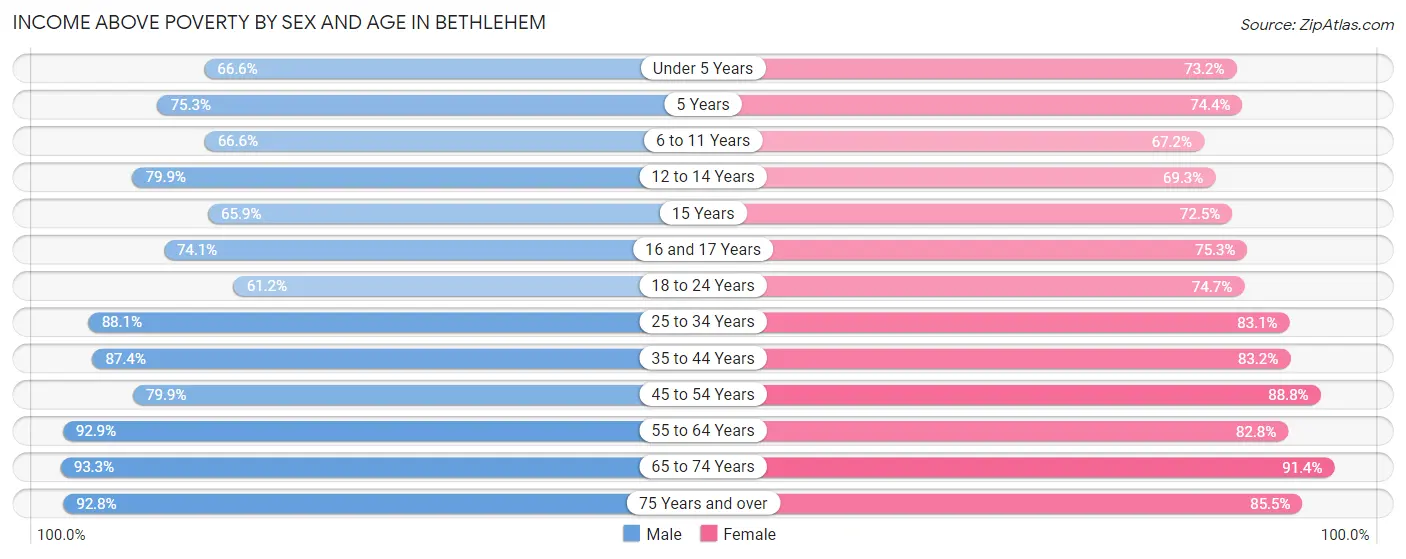
| Age Bracket | Male | Female |
| Under 5 Years | 1,140 (66.6%) | 1,315 (73.2%) |
| 5 Years | 186 (75.3%) | 229 (74.4%) |
| 6 to 11 Years | 1,465 (66.6%) | 1,294 (67.2%) |
| 12 to 14 Years | 793 (79.9%) | 1,146 (69.3%) |
| 15 Years | 238 (65.9%) | 334 (72.5%) |
| 16 and 17 Years | 576 (74.1%) | 490 (75.3%) |
| 18 to 24 Years | 2,647 (61.2%) | 2,680 (74.7%) |
| 25 to 34 Years | 5,134 (88.1%) | 4,439 (83.1%) |
| 35 to 44 Years | 3,874 (87.4%) | 3,729 (83.2%) |
| 45 to 54 Years | 2,984 (79.8%) | 3,524 (88.8%) |
| 55 to 64 Years | 3,721 (92.9%) | 3,610 (82.8%) |
| 65 to 74 Years | 3,064 (93.3%) | 3,761 (91.4%) |
| 75 Years and over | 2,000 (92.8%) | 3,177 (85.5%) |
| Total | 27,822 (81.7%) | 29,728 (81.7%) |
Income Below Poverty Among Married-Couple Families in Bethlehem
The poverty statistics for married-couple families in Bethlehem show that 4.2% or 434 of the total 10,335 families live below the poverty line. Families with 5 or more children have the highest poverty rate of 34.2%, comprising of 76 families. On the other hand, families with no children have the lowest poverty rate of 2.7%, which includes 191 families.
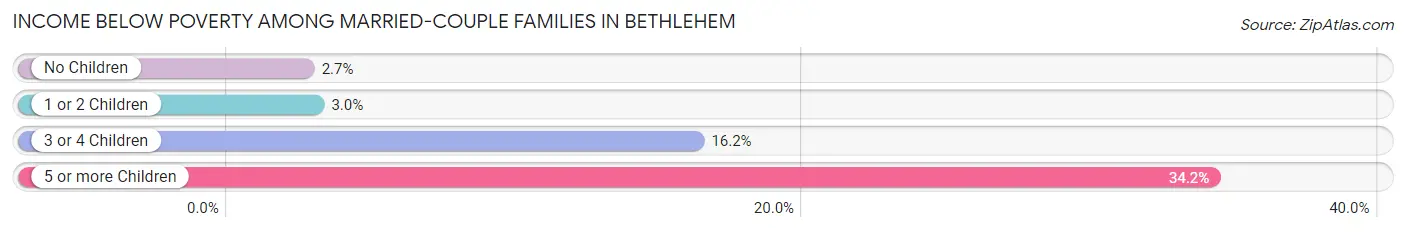
| Children | Above Poverty | Below Poverty |
| No Children | 6,975 (97.3%) | 191 (2.7%) |
| 1 or 2 Children | 2,285 (97.0%) | 71 (3.0%) |
| 3 or 4 Children | 495 (83.8%) | 96 (16.2%) |
| 5 or more Children | 146 (65.8%) | 76 (34.2%) |
| Total | 9,901 (95.8%) | 434 (4.2%) |
Income Below Poverty Among Single-Parent Households in Bethlehem
According to the poverty data in Bethlehem, 17.6% or 268 single-father households and 26.4% or 1,305 single-mother households are living below the poverty line. Among single-father households, those with 5 or more children have the highest poverty rate, with 8 households (100.0%) experiencing poverty. Likewise, among single-mother households, those with 5 or more children have the highest poverty rate, with 60 households (69.8%) falling below the poverty line.
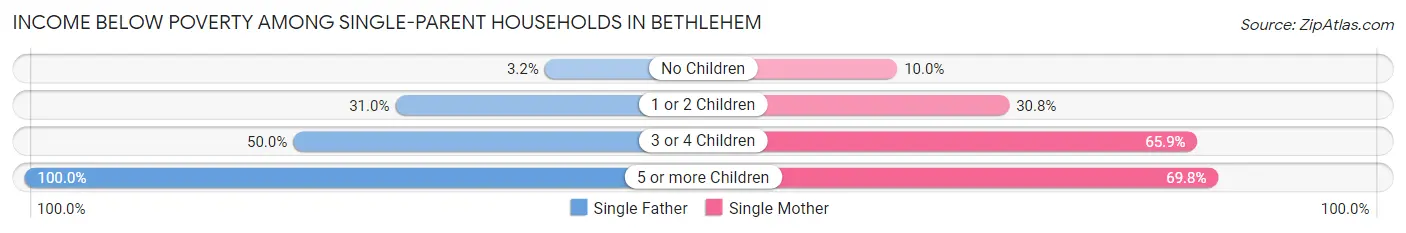
| Children | Single Father | Single Mother |
| No Children | 26 (3.2%) | 185 (10.0%) |
| 1 or 2 Children | 183 (31.0%) | 805 (30.8%) |
| 3 or 4 Children | 51 (50.0%) | 255 (65.9%) |
| 5 or more Children | 8 (100.0%) | 60 (69.8%) |
| Total | 268 (17.6%) | 1,305 (26.4%) |
Income Below Poverty Among Married-Couple vs Single-Parent Households in Bethlehem
The poverty data for Bethlehem shows that 434 of the married-couple family households (4.2%) and 1,573 of the single-parent households (24.3%) are living below the poverty level. Within the married-couple family households, those with 5 or more children have the highest poverty rate, with 76 households (34.2%) falling below the poverty line. Among the single-parent households, those with 5 or more children have the highest poverty rate, with 68 household (72.3%) living below poverty.
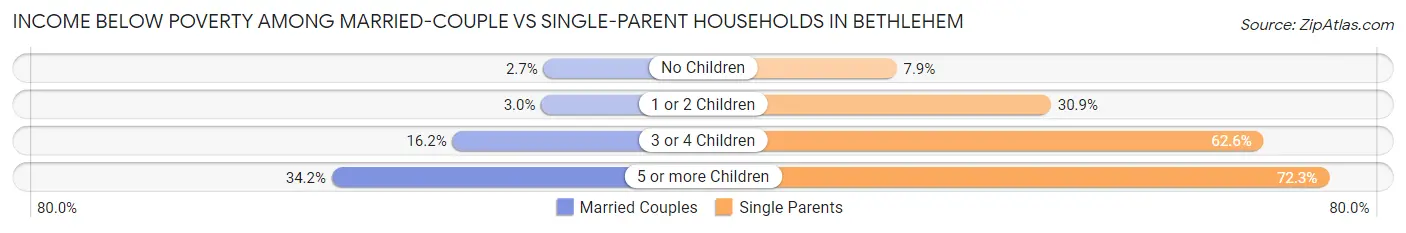
| Children | Married-Couple Families | Single-Parent Households |
| No Children | 191 (2.7%) | 211 (7.9%) |
| 1 or 2 Children | 71 (3.0%) | 988 (30.9%) |
| 3 or 4 Children | 96 (16.2%) | 306 (62.6%) |
| 5 or more Children | 76 (34.2%) | 68 (72.3%) |
| Total | 434 (4.2%) | 1,573 (24.3%) |
Race in Bethlehem
The most populous races in Bethlehem are White / Caucasian (50,180 | 65.5%), Hispanic or Latino (23,083 | 30.1%), and Two or more Races (8,689 | 11.4%).
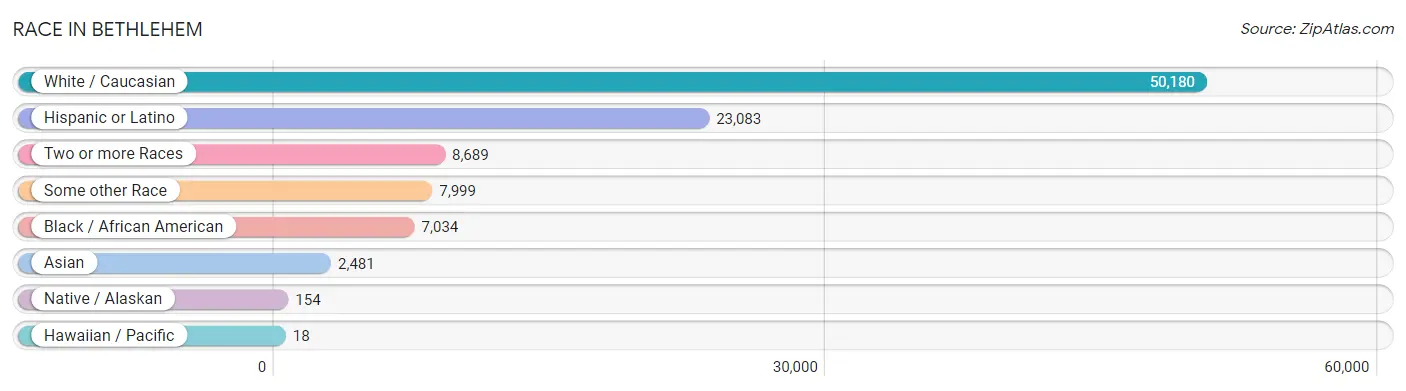
| Race | # Population | % Population |
| Asian | 2,481 | 3.2% |
| Black / African American | 7,034 | 9.2% |
| Hawaiian / Pacific | 18 | 0.0% |
| Hispanic or Latino | 23,083 | 30.1% |
| Native / Alaskan | 154 | 0.2% |
| White / Caucasian | 50,180 | 65.5% |
| Two or more Races | 8,689 | 11.4% |
| Some other Race | 7,999 | 10.4% |
| Total | 76,555 | 100.0% |
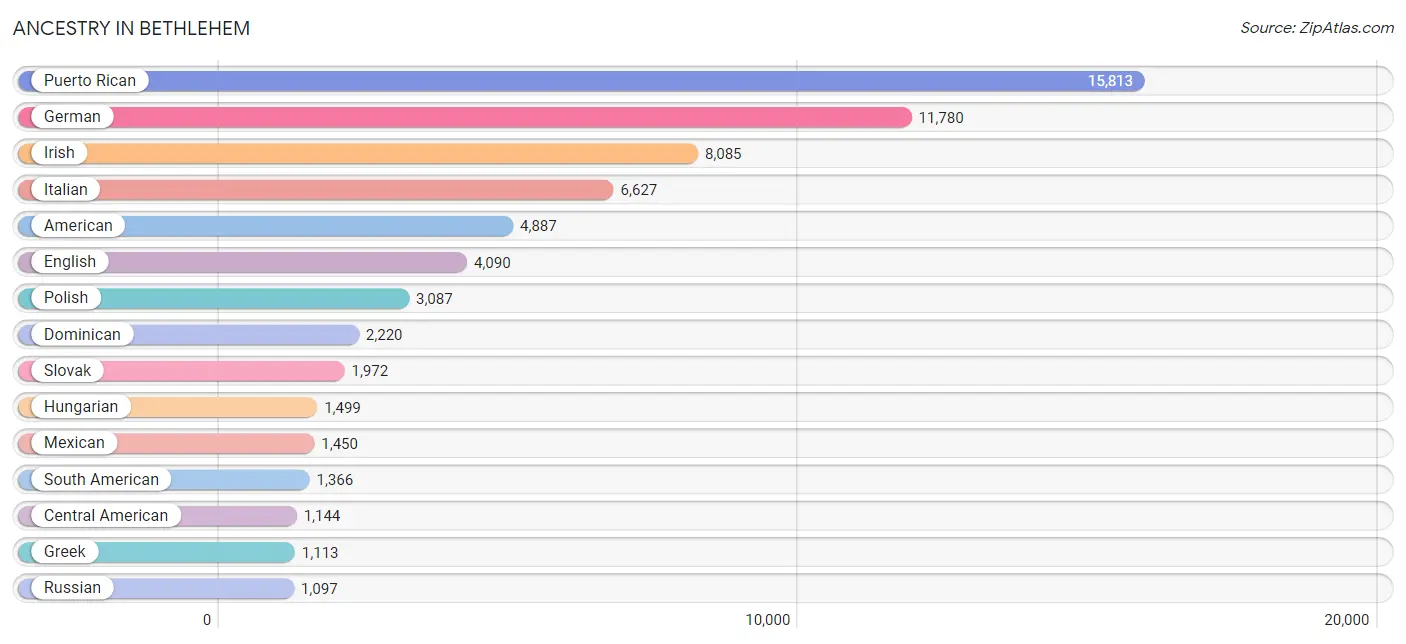
Ancestry in Bethlehem
The most populous ancestries reported in Bethlehem are Puerto Rican (15,813 | 20.7%), German (11,780 | 15.4%), Irish (8,085 | 10.6%), Italian (6,627 | 8.7%), and American (4,887 | 6.4%), together accounting for 61.7% of all Bethlehem residents.
| Ancestry | # Population | % Population |
| Afghan | 11 | 0.0% |
| African | 614 | 0.8% |
| Alaska Native | 35 | 0.1% |
| Albanian | 16 | 0.0% |
| Alsatian | 10 | 0.0% |
| American | 4,887 | 6.4% |
| Arab | 386 | 0.5% |
| Argentinean | 52 | 0.1% |
| Armenian | 5 | 0.0% |
| Austrian | 281 | 0.4% |
| Belgian | 40 | 0.1% |
| Bermudan | 7 | 0.0% |
| Bhutanese | 64 | 0.1% |
| Blackfeet | 5 | 0.0% |
| Brazilian | 196 | 0.3% |
| British | 246 | 0.3% |
| British West Indian | 30 | 0.0% |
| Bulgarian | 12 | 0.0% |
| Burmese | 210 | 0.3% |
| Canadian | 117 | 0.2% |
| Central American | 1,144 | 1.5% |
| Central American Indian | 393 | 0.5% |
| Cherokee | 204 | 0.3% |
| Chilean | 62 | 0.1% |
| Colombian | 311 | 0.4% |
| Costa Rican | 79 | 0.1% |
| Croatian | 174 | 0.2% |
| Cuban | 131 | 0.2% |
| Czech | 134 | 0.2% |
| Czechoslovakian | 194 | 0.3% |
| Danish | 232 | 0.3% |
| Dominican | 2,220 | 2.9% |
| Dutch | 821 | 1.1% |
| Eastern European | 219 | 0.3% |
| Ecuadorian | 484 | 0.6% |
| Egyptian | 62 | 0.1% |
| English | 4,090 | 5.3% |
| Ethiopian | 49 | 0.1% |
| European | 838 | 1.1% |
| Filipino | 28 | 0.0% |
| Finnish | 65 | 0.1% |
| French | 837 | 1.1% |
| French Canadian | 81 | 0.1% |
| German | 11,780 | 15.4% |
| Greek | 1,113 | 1.5% |
| Guatemalan | 570 | 0.7% |
| Guyanese | 27 | 0.0% |
| Haitian | 210 | 0.3% |
| Honduran | 335 | 0.4% |
| Hungarian | 1,499 | 2.0% |
| Indian (Asian) | 1,095 | 1.4% |
| Iranian | 22 | 0.0% |
| Irish | 8,085 | 10.6% |
| Iroquois | 32 | 0.0% |
| Israeli | 25 | 0.0% |
| Italian | 6,627 | 8.7% |
| Jamaican | 885 | 1.2% |
| Korean | 579 | 0.8% |
| Lebanese | 135 | 0.2% |
| Liberian | 16 | 0.0% |
| Lithuanian | 279 | 0.4% |
| Luxembourger | 11 | 0.0% |
| Mexican | 1,450 | 1.9% |
| Mexican American Indian | 170 | 0.2% |
| Native Hawaiian | 44 | 0.1% |
| New Zealander | 10 | 0.0% |
| Nicaraguan | 68 | 0.1% |
| Nigerian | 46 | 0.1% |
| Northern European | 149 | 0.2% |
| Norwegian | 217 | 0.3% |
| Pakistani | 32 | 0.0% |
| Panamanian | 37 | 0.1% |
| Pennsylvania German | 1,005 | 1.3% |
| Peruvian | 311 | 0.4% |
| Polish | 3,087 | 4.0% |
| Portuguese | 594 | 0.8% |
| Puerto Rican | 15,813 | 20.7% |
| Romanian | 19 | 0.0% |
| Russian | 1,097 | 1.4% |
| Salvadoran | 55 | 0.1% |
| Samoan | 1 | 0.0% |
| Scandinavian | 105 | 0.1% |
| Scotch-Irish | 291 | 0.4% |
| Scottish | 783 | 1.0% |
| Seminole | 10 | 0.0% |
| Serbian | 77 | 0.1% |
| Slavic | 69 | 0.1% |
| Slovak | 1,972 | 2.6% |
| Slovene | 123 | 0.2% |
| South American | 1,366 | 1.8% |
| Spaniard | 359 | 0.5% |
| Spanish | 149 | 0.2% |
| Sri Lankan | 152 | 0.2% |
| Subsaharan African | 1,034 | 1.3% |
| Swedish | 199 | 0.3% |
| Swiss | 104 | 0.1% |
| Syrian | 117 | 0.2% |
| Thai | 604 | 0.8% |
| Trinidadian and Tobagonian | 50 | 0.1% |
| Turkish | 50 | 0.1% |
| U.S. Virgin Islander | 9 | 0.0% |
| Ugandan | 42 | 0.1% |
| Ukrainian | 637 | 0.8% |
| Uruguayan | 100 | 0.1% |
| Venezuelan | 37 | 0.1% |
| Welsh | 899 | 1.2% |
| West Indian | 200 | 0.3% |
| Yugoslavian | 90 | 0.1% | View All 108 Rows |
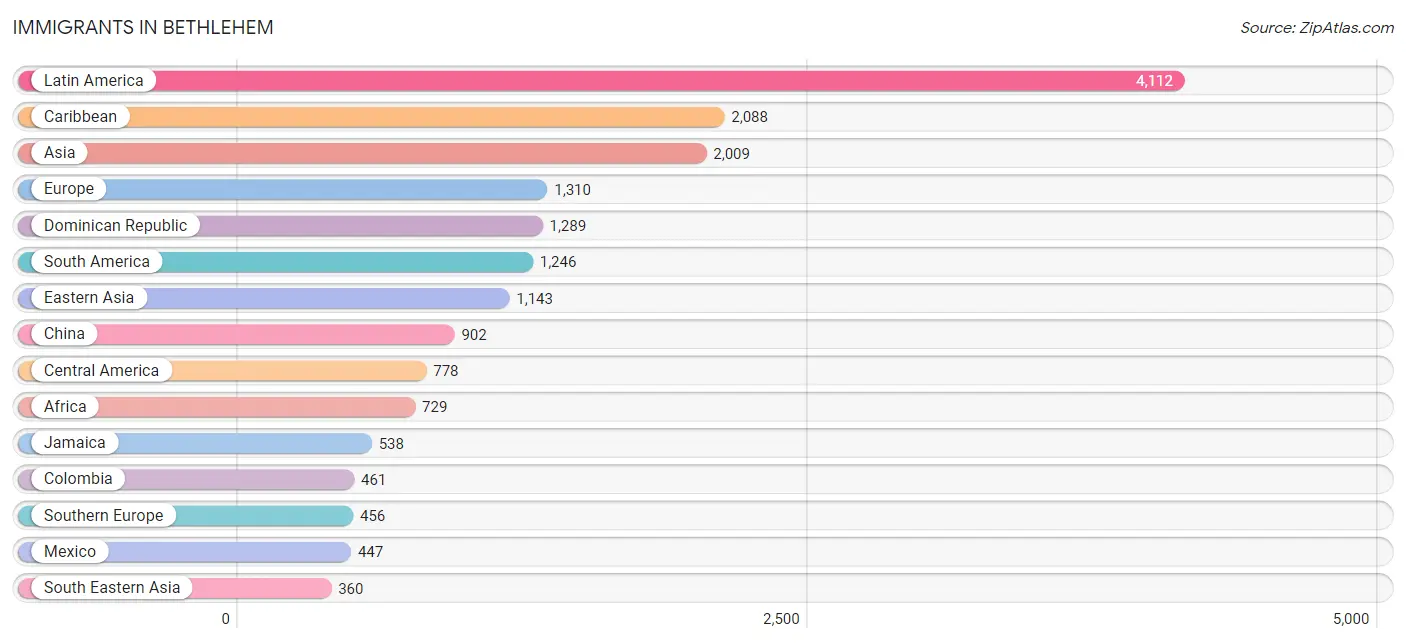
Immigrants in Bethlehem
The most numerous immigrant groups reported in Bethlehem came from Latin America (4,112 | 5.4%), Caribbean (2,088 | 2.7%), Asia (2,009 | 2.6%), Europe (1,310 | 1.7%), and Dominican Republic (1,289 | 1.7%), together accounting for 14.1% of all Bethlehem residents.
| Immigration Origin | # Population | % Population |
| Afghanistan | 11 | 0.0% |
| Africa | 729 | 0.9% |
| Armenia | 89 | 0.1% |
| Asia | 2,009 | 2.6% |
| Austria | 10 | 0.0% |
| Belgium | 11 | 0.0% |
| Bosnia and Herzegovina | 8 | 0.0% |
| Brazil | 313 | 0.4% |
| Bulgaria | 12 | 0.0% |
| Cameroon | 234 | 0.3% |
| Canada | 54 | 0.1% |
| Caribbean | 2,088 | 2.7% |
| Central America | 778 | 1.0% |
| China | 902 | 1.2% |
| Colombia | 461 | 0.6% |
| Costa Rica | 45 | 0.1% |
| Croatia | 22 | 0.0% |
| Dominica | 18 | 0.0% |
| Dominican Republic | 1,289 | 1.7% |
| Eastern Africa | 189 | 0.3% |
| Eastern Asia | 1,143 | 1.5% |
| Eastern Europe | 340 | 0.4% |
| Ecuador | 221 | 0.3% |
| Egypt | 28 | 0.0% |
| El Salvador | 29 | 0.0% |
| England | 61 | 0.1% |
| Ethiopia | 60 | 0.1% |
| Europe | 1,310 | 1.7% |
| France | 107 | 0.1% |
| Germany | 177 | 0.2% |
| Greece | 175 | 0.2% |
| Guatemala | 69 | 0.1% |
| Guyana | 50 | 0.1% |
| Haiti | 168 | 0.2% |
| Honduras | 139 | 0.2% |
| Hong Kong | 5 | 0.0% |
| Hungary | 18 | 0.0% |
| India | 263 | 0.3% |
| Iran | 17 | 0.0% |
| Ireland | 66 | 0.1% |
| Israel | 20 | 0.0% |
| Italy | 30 | 0.0% |
| Jamaica | 538 | 0.7% |
| Japan | 34 | 0.0% |
| Kenya | 86 | 0.1% |
| Korea | 207 | 0.3% |
| Latin America | 4,112 | 5.4% |
| Lebanon | 25 | 0.0% |
| Liberia | 16 | 0.0% |
| Mexico | 447 | 0.6% |
| Middle Africa | 234 | 0.3% |
| Morocco | 101 | 0.1% |
| Netherlands | 21 | 0.0% |
| Nicaragua | 49 | 0.1% |
| Nigeria | 33 | 0.0% |
| Northern Africa | 142 | 0.2% |
| Northern Europe | 188 | 0.3% |
| Oceania | 10 | 0.0% |
| Pakistan | 13 | 0.0% |
| Peru | 100 | 0.1% |
| Philippines | 244 | 0.3% |
| Poland | 41 | 0.1% |
| Portugal | 251 | 0.3% |
| Romania | 18 | 0.0% |
| Russia | 120 | 0.2% |
| Saudi Arabia | 13 | 0.0% |
| Scotland | 9 | 0.0% |
| Serbia | 30 | 0.0% |
| Singapore | 13 | 0.0% |
| South America | 1,246 | 1.6% |
| South Central Asia | 304 | 0.4% |
| South Eastern Asia | 360 | 0.5% |
| Southern Europe | 456 | 0.6% |
| Taiwan | 55 | 0.1% |
| Trinidad and Tobago | 16 | 0.0% |
| Turkey | 35 | 0.1% |
| Uganda | 42 | 0.1% |
| Ukraine | 51 | 0.1% |
| Uruguay | 11 | 0.0% |
| Venezuela | 62 | 0.1% |
| Vietnam | 103 | 0.1% |
| Western Africa | 97 | 0.1% |
| Western Asia | 202 | 0.3% |
| Western Europe | 326 | 0.4% | View All 84 Rows |
Sex and Age in Bethlehem
Sex and Age in Bethlehem
The most populous age groups in Bethlehem are 20 to 24 Years (4,239 | 11.4%) for men and 20 to 24 Years (3,952 | 10.0%) for women.
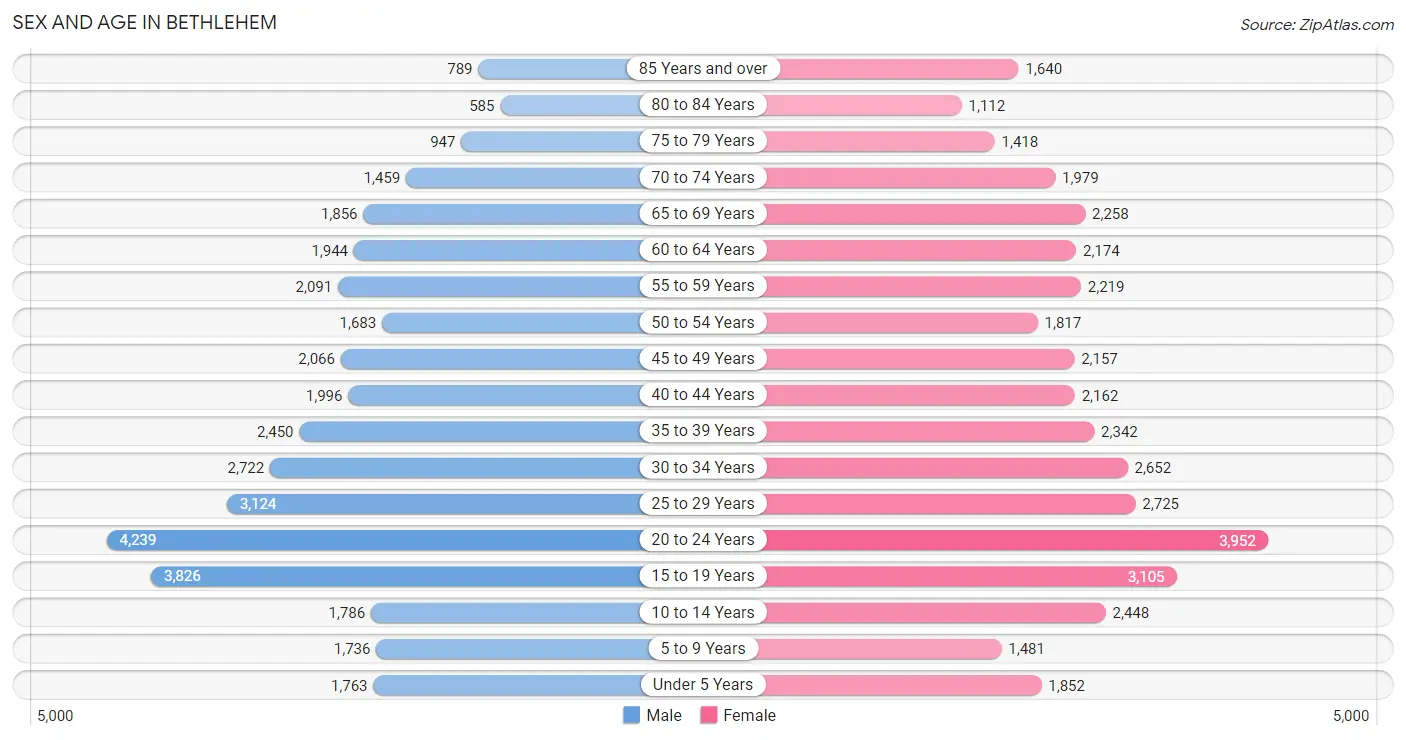
| Age Bracket | Male | Female |
| Under 5 Years | 1,763 (4.8%) | 1,852 (4.7%) |
| 5 to 9 Years | 1,736 (4.7%) | 1,481 (3.7%) |
| 10 to 14 Years | 1,786 (4.8%) | 2,448 (6.2%) |
| 15 to 19 Years | 3,826 (10.3%) | 3,105 (7.9%) |
| 20 to 24 Years | 4,239 (11.4%) | 3,952 (10.0%) |
| 25 to 29 Years | 3,124 (8.4%) | 2,725 (6.9%) |
| 30 to 34 Years | 2,722 (7.3%) | 2,652 (6.7%) |
| 35 to 39 Years | 2,450 (6.6%) | 2,342 (5.9%) |
| 40 to 44 Years | 1,996 (5.4%) | 2,162 (5.5%) |
| 45 to 49 Years | 2,066 (5.6%) | 2,157 (5.5%) |
| 50 to 54 Years | 1,683 (4.5%) | 1,817 (4.6%) |
| 55 to 59 Years | 2,091 (5.6%) | 2,219 (5.6%) |
| 60 to 64 Years | 1,944 (5.2%) | 2,174 (5.5%) |
| 65 to 69 Years | 1,856 (5.0%) | 2,258 (5.7%) |
| 70 to 74 Years | 1,459 (3.9%) | 1,979 (5.0%) |
| 75 to 79 Years | 947 (2.6%) | 1,418 (3.6%) |
| 80 to 84 Years | 585 (1.6%) | 1,112 (2.8%) |
| 85 Years and over | 789 (2.1%) | 1,640 (4.2%) |
| Total | 37,062 (100.0%) | 39,493 (100.0%) |
Families and Households in Bethlehem
Median Family Size in Bethlehem
The median family size in Bethlehem is 2.96 persons per family, with single female/mother families (4,939 | 29.4%) accounting for the largest median family size of 3.06 persons per family. On the other hand, single male/father families (1,524 | 9.1%) represent the smallest median family size with 2.80 persons per family.
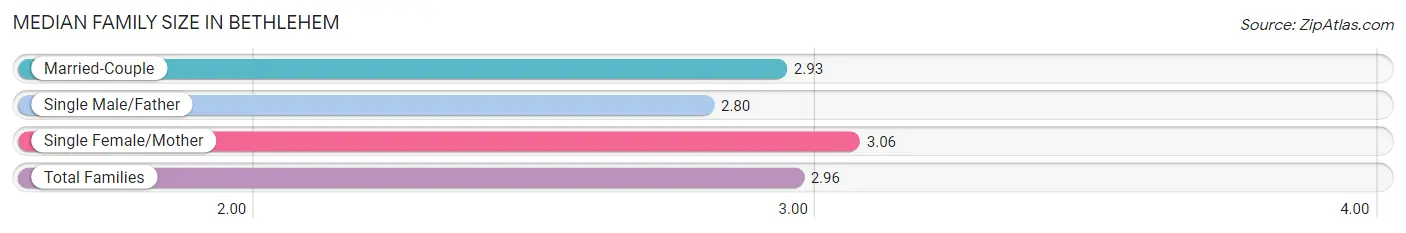
| Family Type | # Families | Family Size |
| Married-Couple | 10,335 (61.5%) | 2.93 |
| Single Male/Father | 1,524 (9.1%) | 2.80 |
| Single Female/Mother | 4,939 (29.4%) | 3.06 |
| Total Families | 16,798 (100.0%) | 2.96 |
Median Household Size in Bethlehem
The median household size in Bethlehem is 2.33 persons per household, with single female/mother households (4,939 | 16.4%) accounting for the largest median household size of 3.27 persons per household. non-family households (13,364 | 44.3%) represent the smallest median household size with 1.39 persons per household.
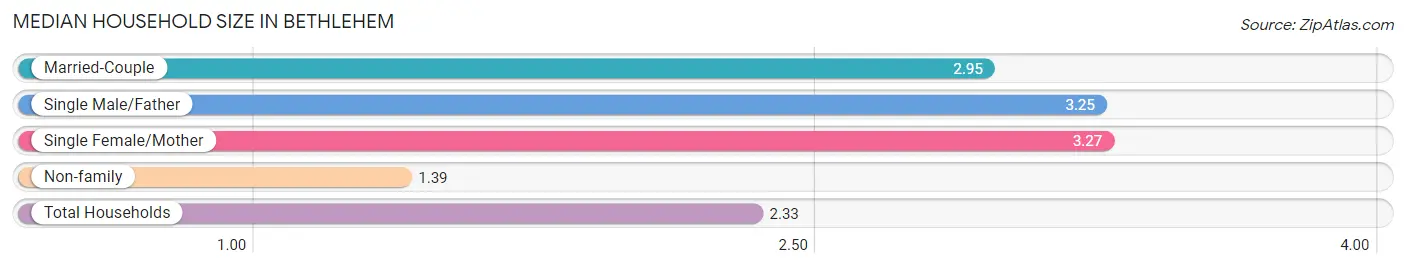
| Household Type | # Households | Household Size |
| Married-Couple | 10,335 (34.3%) | 2.95 |
| Single Male/Father | 1,524 (5.1%) | 3.25 |
| Single Female/Mother | 4,939 (16.4%) | 3.27 |
| Non-family | 13,364 (44.3%) | 1.39 |
| Total Households | 30,162 (100.0%) | 2.33 |
Household Size by Marriage Status in Bethlehem
Out of a total of 30,162 households in Bethlehem, 16,798 (55.7%) are family households, while 13,364 (44.3%) are nonfamily households. The most numerous type of family households are 2-person households, comprising 8,159, and the most common type of nonfamily households are 1-person households, comprising 10,398.
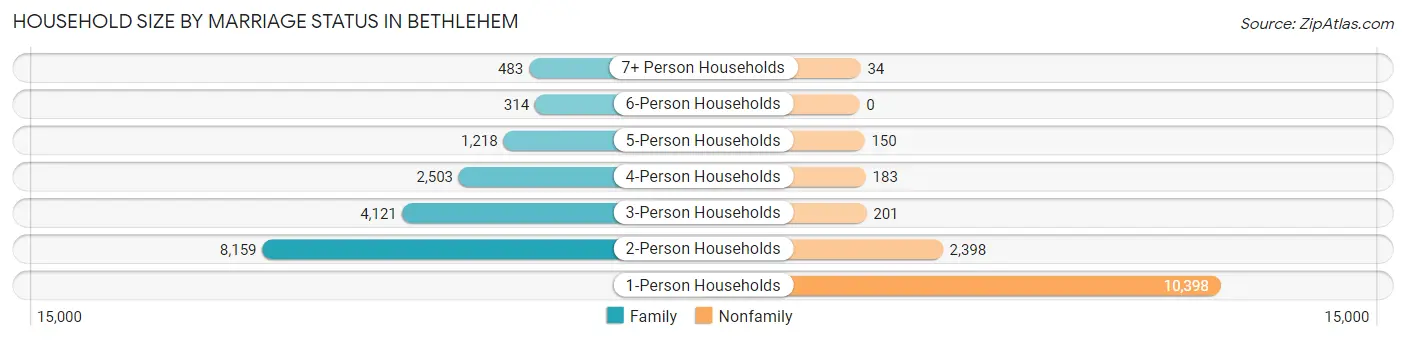
| Household Size | Family Households | Nonfamily Households |
| 1-Person Households | - | 10,398 (34.5%) |
| 2-Person Households | 8,159 (27.1%) | 2,398 (8.0%) |
| 3-Person Households | 4,121 (13.7%) | 201 (0.7%) |
| 4-Person Households | 2,503 (8.3%) | 183 (0.6%) |
| 5-Person Households | 1,218 (4.0%) | 150 (0.5%) |
| 6-Person Households | 314 (1.0%) | 0 (0.0%) |
| 7+ Person Households | 483 (1.6%) | 34 (0.1%) |
| Total | 16,798 (55.7%) | 13,364 (44.3%) |
Female Fertility in Bethlehem
Fertility by Age in Bethlehem
Average fertility rate in Bethlehem is 43.0 births per 1,000 women. Women in the age bracket of 20 to 34 years have the highest fertility rate with 62.0 births per 1,000 women. Women in the age bracket of 20 to 34 years acount for 69.1% of all women with births.
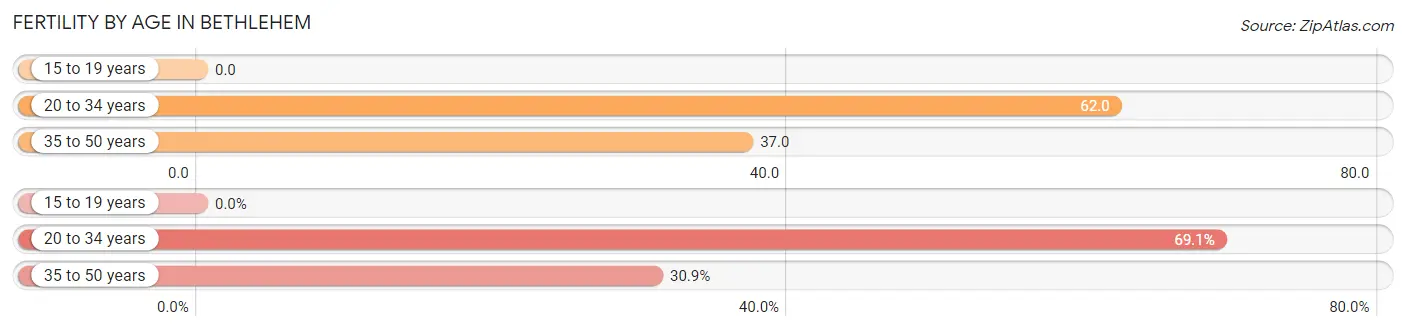
| Age Bracket | Women with Births | Births / 1,000 Women |
| 15 to 19 years | 0 (0.0%) | 0.0 |
| 20 to 34 years | 582 (69.1%) | 62.0 |
| 35 to 50 years | 260 (30.9%) | 37.0 |
| Total | 842 (100.0%) | 43.0 |
Fertility by Age by Marriage Status in Bethlehem
57.0% of women with births (842) in Bethlehem are married. The highest percentage of unmarried women with births falls into 20 to 34 years age bracket with 56.2% of them unmarried at the time of birth, while the lowest percentage of unmarried women with births belong to 35 to 50 years age bracket with 13.5% of them unmarried.
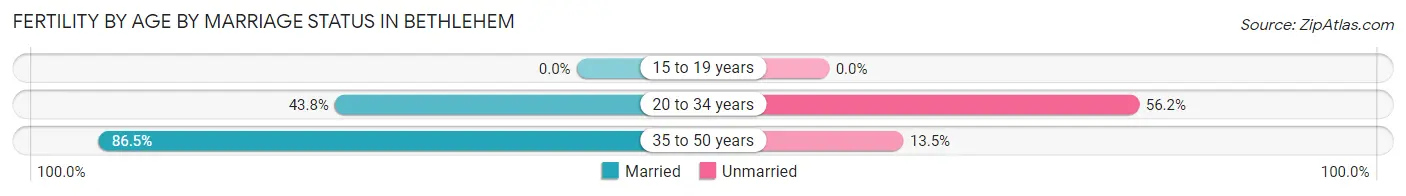
| Age Bracket | Married | Unmarried |
| 15 to 19 years | 0 (0.0%) | 0 (0.0%) |
| 20 to 34 years | 255 (43.8%) | 327 (56.2%) |
| 35 to 50 years | 225 (86.5%) | 35 (13.5%) |
| Total | 480 (57.0%) | 362 (43.0%) |
Fertility by Education in Bethlehem
Average fertility rate in Bethlehem is 43.0 births per 1,000 women. Women with the education attainment of high school diploma have the highest fertility rate of 64.0 births per 1,000 women, while women with the education attainment of less than high school have the lowest fertility at 25.0 births per 1,000 women. Women with the education attainment of high school diploma represent 31.2% of all women with births.
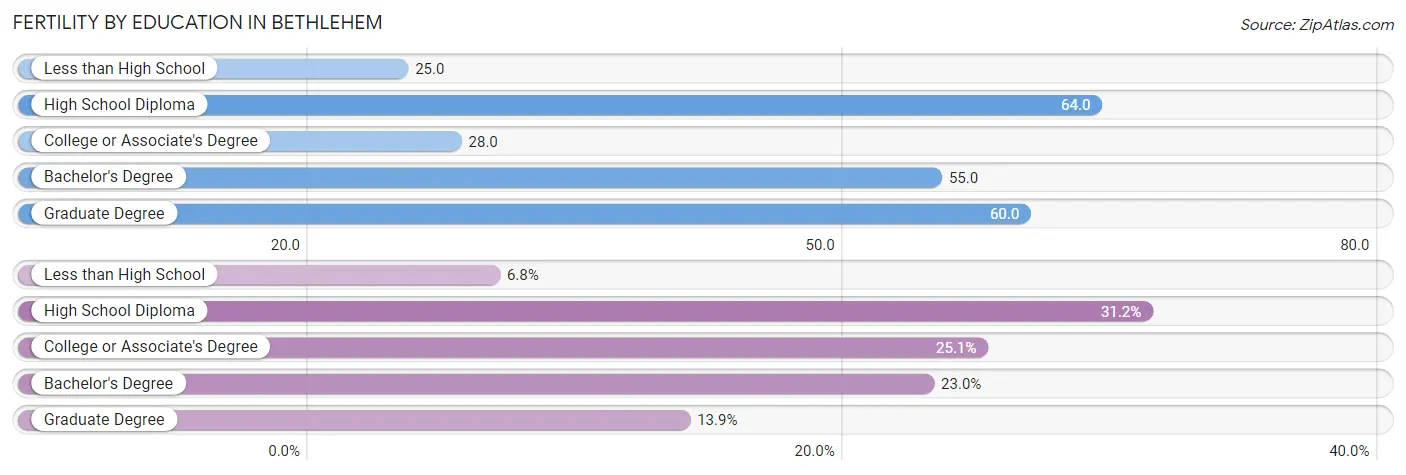
| Educational Attainment | Women with Births | Births / 1,000 Women |
| Less than High School | 57 (6.8%) | 25.0 |
| High School Diploma | 263 (31.2%) | 64.0 |
| College or Associate's Degree | 211 (25.1%) | 28.0 |
| Bachelor's Degree | 194 (23.0%) | 55.0 |
| Graduate Degree | 117 (13.9%) | 60.0 |
| Total | 842 (100.0%) | 43.0 |
Fertility by Education by Marriage Status in Bethlehem
43.0% of women with births in Bethlehem are unmarried. Women with the educational attainment of bachelor's degree are most likely to be married with 94.9% of them married at childbirth, while women with the educational attainment of high school diploma are least likely to be married with 67.7% of them unmarried at childbirth.
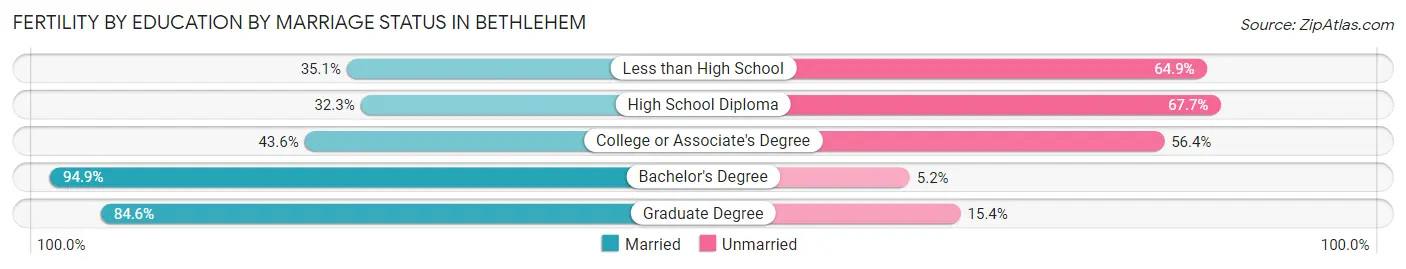
| Educational Attainment | Married | Unmarried |
| Less than High School | 20 (35.1%) | 37 (64.9%) |
| High School Diploma | 85 (32.3%) | 178 (67.7%) |
| College or Associate's Degree | 92 (43.6%) | 119 (56.4%) |
| Bachelor's Degree | 184 (94.9%) | 10 (5.1%) |
| Graduate Degree | 99 (84.6%) | 18 (15.4%) |
| Total | 480 (57.0%) | 362 (43.0%) |
Employment Characteristics in Bethlehem
Employment by Class of Employer in Bethlehem
Among the 35,589 employed individuals in Bethlehem, private company employees (25,213 | 70.8%), not-for-profit organizations (5,252 | 14.8%), and local government employees (1,958 | 5.5%) make up the most common classes of employment.
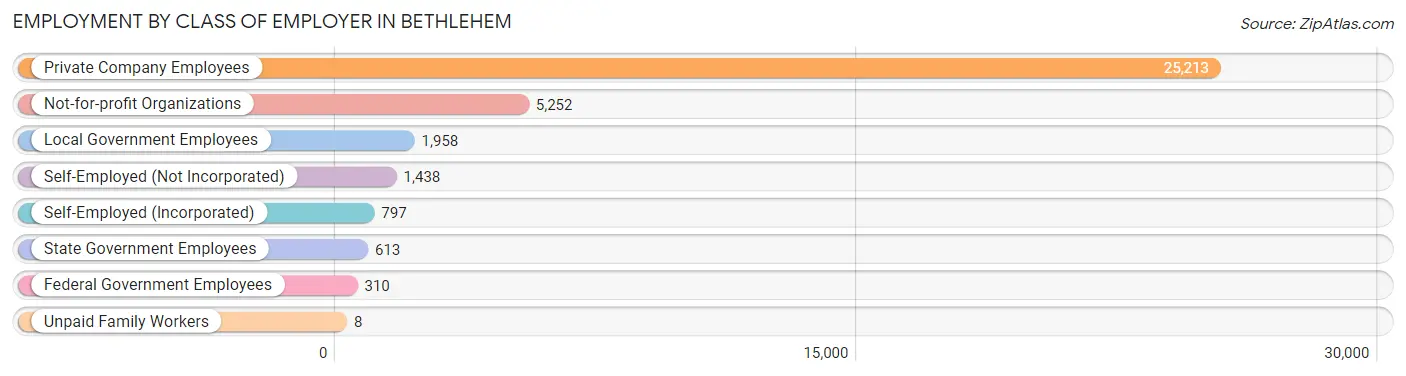
| Employer Class | # Employees | % Employees |
| Private Company Employees | 25,213 | 70.8% |
| Self-Employed (Incorporated) | 797 | 2.2% |
| Self-Employed (Not Incorporated) | 1,438 | 4.0% |
| Not-for-profit Organizations | 5,252 | 14.8% |
| Local Government Employees | 1,958 | 5.5% |
| State Government Employees | 613 | 1.7% |
| Federal Government Employees | 310 | 0.9% |
| Unpaid Family Workers | 8 | 0.0% |
| Total | 35,589 | 100.0% |
Employment Status by Age in Bethlehem
According to the labor force statistics for Bethlehem, out of the total population over 16 years of age (64,663), 59.4% or 38,410 individuals are in the labor force, with 5.6% or 2,151 of them unemployed. The age group with the highest labor force participation rate is 25 to 29 years, with 86.4% or 5,054 individuals in the labor force. Within the labor force, the 16 to 19 years age range has the highest percentage of unemployed individuals, with 15.9% or 377 of them being unemployed.
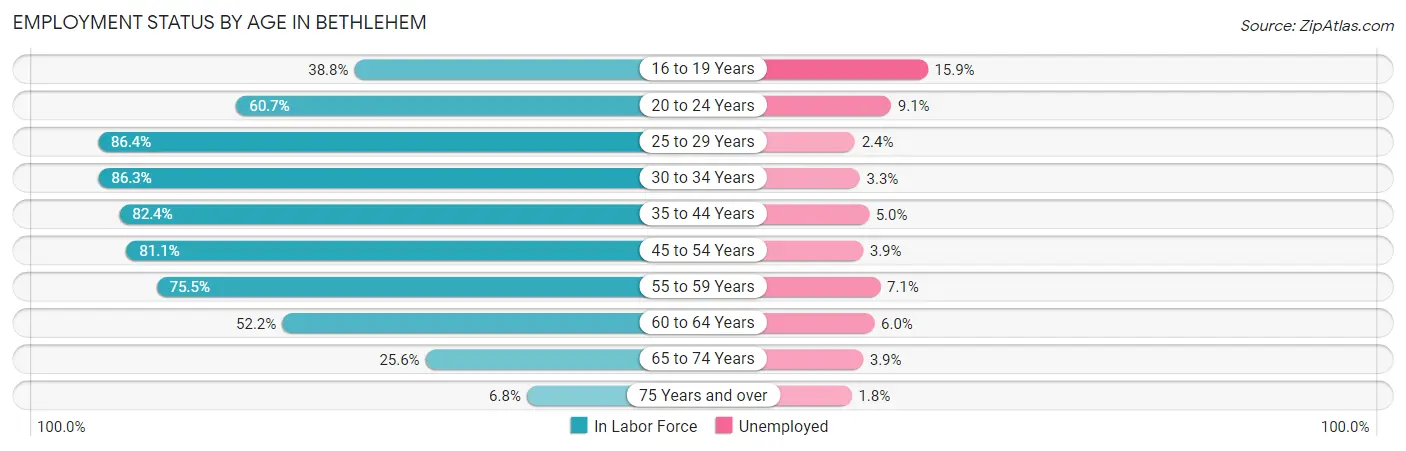
| Age Bracket | In Labor Force | Unemployed |
| 16 to 19 Years | 2,369 (38.8%) | 377 (15.9%) |
| 20 to 24 Years | 4,972 (60.7%) | 452 (9.1%) |
| 25 to 29 Years | 5,054 (86.4%) | 121 (2.4%) |
| 30 to 34 Years | 4,638 (86.3%) | 153 (3.3%) |
| 35 to 44 Years | 7,375 (82.4%) | 369 (5.0%) |
| 45 to 54 Years | 6,263 (81.1%) | 244 (3.9%) |
| 55 to 59 Years | 3,254 (75.5%) | 231 (7.1%) |
| 60 to 64 Years | 2,150 (52.2%) | 129 (6.0%) |
| 65 to 74 Years | 1,933 (25.6%) | 75 (3.9%) |
| 75 Years and over | 441 (6.8%) | 8 (1.8%) |
| Total | 38,410 (59.4%) | 2,151 (5.6%) |
Employment Status by Educational Attainment in Bethlehem
According to labor force statistics for Bethlehem, 79.1% of individuals (28,732) out of the total population between 25 and 64 years of age (36,324) are in the labor force, with 4.3% or 1,235 of them being unemployed. The group with the highest labor force participation rate are those with the educational attainment of bachelor's degree or higher, with 86.7% or 11,195 individuals in the labor force. Within the labor force, individuals with less than high school education have the highest percentage of unemployment, with 6.5% or 122 of them being unemployed.
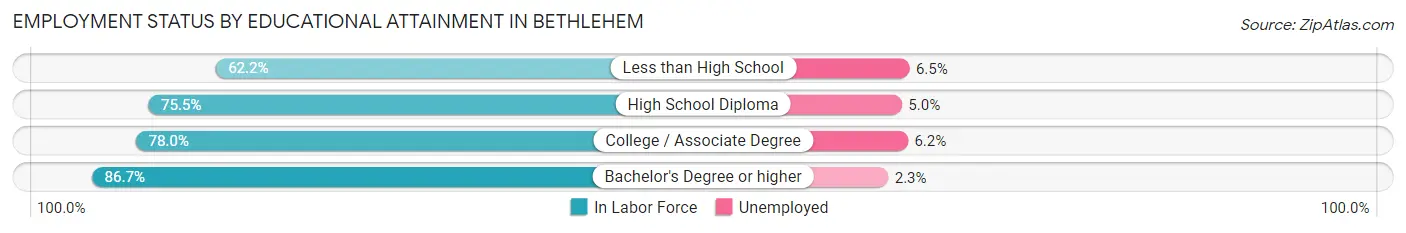
| Educational Attainment | In Labor Force | Unemployed |
| Less than High School | 1,878 (62.2%) | 196 (6.5%) |
| High School Diploma | 7,711 (75.5%) | 511 (5.0%) |
| College / Associate Degree | 7,940 (78.0%) | 631 (6.2%) |
| Bachelor's Degree or higher | 11,195 (86.7%) | 297 (2.3%) |
| Total | 28,732 (79.1%) | 1,562 (4.3%) |
Employment Occupations by Sex in Bethlehem
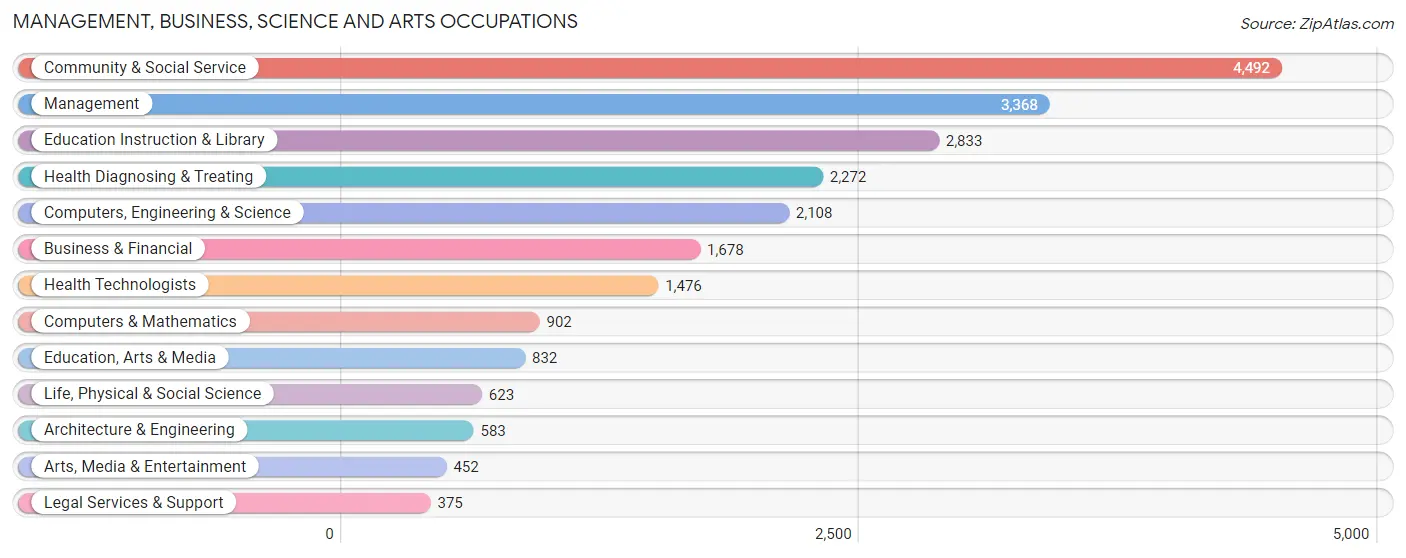
Management, Business, Science and Arts Occupations
The most common Management, Business, Science and Arts occupations in Bethlehem are Community & Social Service (4,492 | 12.4%), Management (3,368 | 9.3%), Education Instruction & Library (2,833 | 7.8%), Health Diagnosing & Treating (2,272 | 6.3%), and Computers, Engineering & Science (2,108 | 5.8%).
Management, Business, Science and Arts Occupations by Sex
Within the Management, Business, Science and Arts occupations in Bethlehem, the most male-oriented occupations are Computers & Mathematics (80.2%), Architecture & Engineering (74.1%), and Computers, Engineering & Science (73.4%), while the most female-oriented occupations are Health Diagnosing & Treating (79.1%), Health Technologists (76.8%), and Education, Arts & Media (73.8%).
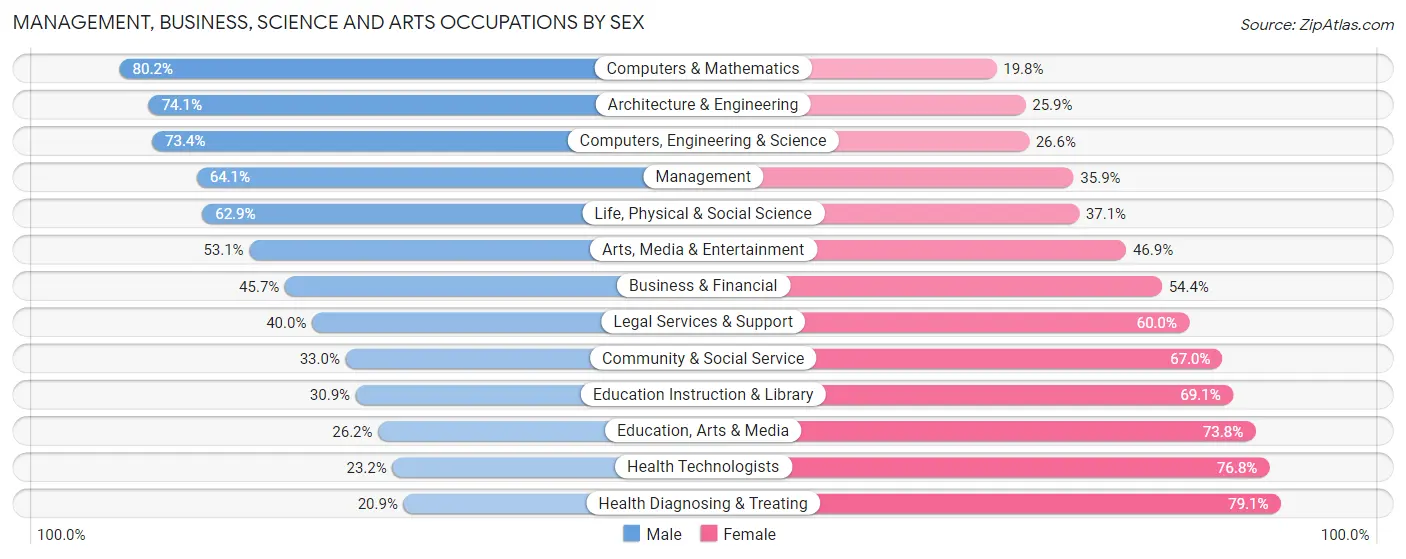
| Occupation | Male | Female |
| Management | 2,158 (64.1%) | 1,210 (35.9%) |
| Business & Financial | 766 (45.7%) | 912 (54.3%) |
| Computers, Engineering & Science | 1,547 (73.4%) | 561 (26.6%) |
| Computers & Mathematics | 723 (80.2%) | 179 (19.8%) |
| Architecture & Engineering | 432 (74.1%) | 151 (25.9%) |
| Life, Physical & Social Science | 392 (62.9%) | 231 (37.1%) |
| Community & Social Service | 1,483 (33.0%) | 3,009 (67.0%) |
| Education, Arts & Media | 218 (26.2%) | 614 (73.8%) |
| Legal Services & Support | 150 (40.0%) | 225 (60.0%) |
| Education Instruction & Library | 875 (30.9%) | 1,958 (69.1%) |
| Arts, Media & Entertainment | 240 (53.1%) | 212 (46.9%) |
| Health Diagnosing & Treating | 475 (20.9%) | 1,797 (79.1%) |
| Health Technologists | 343 (23.2%) | 1,133 (76.8%) |
| Total (Category) | 6,429 (46.2%) | 7,489 (53.8%) |
| Total (Overall) | 18,605 (51.3%) | 17,669 (48.7%) |
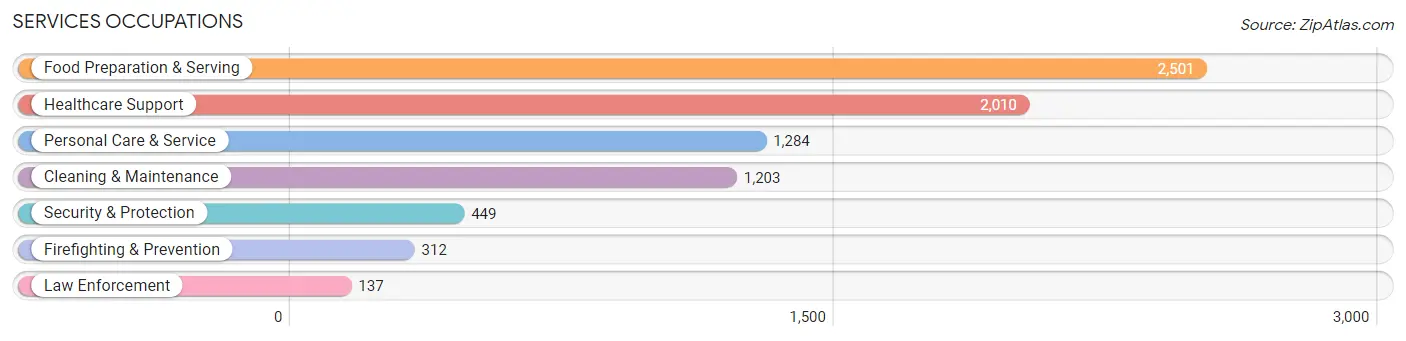
Services Occupations
The most common Services occupations in Bethlehem are Food Preparation & Serving (2,501 | 6.9%), Healthcare Support (2,010 | 5.5%), Personal Care & Service (1,284 | 3.5%), Cleaning & Maintenance (1,203 | 3.3%), and Security & Protection (449 | 1.2%).
Services Occupations by Sex
Within the Services occupations in Bethlehem, the most male-oriented occupations are Firefighting & Prevention (92.6%), Security & Protection (90.4%), and Law Enforcement (85.4%), while the most female-oriented occupations are Healthcare Support (84.7%), Personal Care & Service (71.9%), and Cleaning & Maintenance (50.0%).
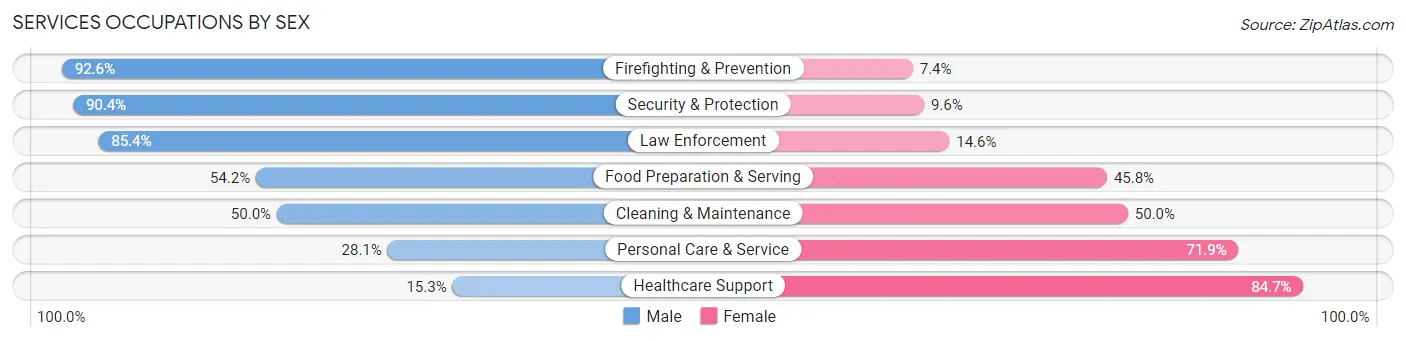
| Occupation | Male | Female |
| Healthcare Support | 307 (15.3%) | 1,703 (84.7%) |
| Security & Protection | 406 (90.4%) | 43 (9.6%) |
| Firefighting & Prevention | 289 (92.6%) | 23 (7.4%) |
| Law Enforcement | 117 (85.4%) | 20 (14.6%) |
| Food Preparation & Serving | 1,355 (54.2%) | 1,146 (45.8%) |
| Cleaning & Maintenance | 602 (50.0%) | 601 (50.0%) |
| Personal Care & Service | 361 (28.1%) | 923 (71.9%) |
| Total (Category) | 3,031 (40.7%) | 4,416 (59.3%) |
| Total (Overall) | 18,605 (51.3%) | 17,669 (48.7%) |
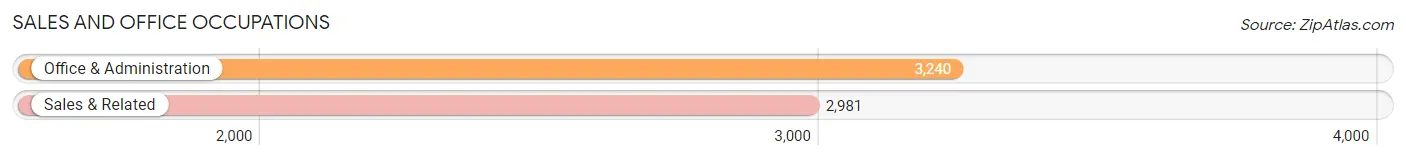
Sales and Office Occupations
The most common Sales and Office occupations in Bethlehem are Office & Administration (3,240 | 8.9%), and Sales & Related (2,981 | 8.2%).
Sales and Office Occupations by Sex
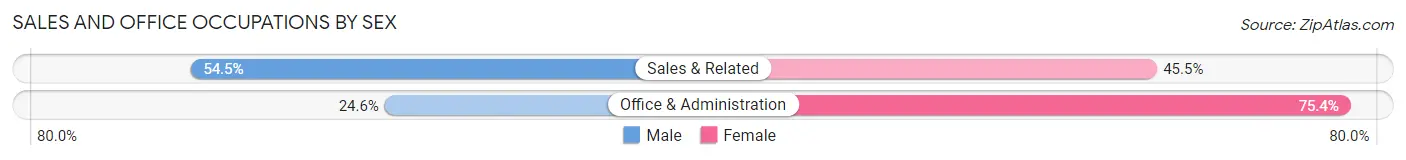
| Occupation | Male | Female |
| Sales & Related | 1,625 (54.5%) | 1,356 (45.5%) |
| Office & Administration | 797 (24.6%) | 2,443 (75.4%) |
| Total (Category) | 2,422 (38.9%) | 3,799 (61.1%) |
| Total (Overall) | 18,605 (51.3%) | 17,669 (48.7%) |
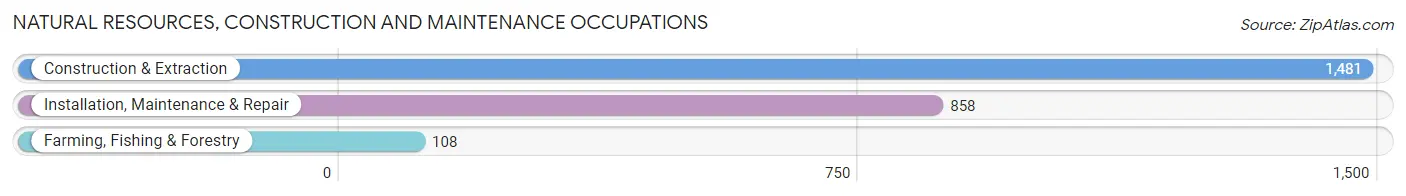
Natural Resources, Construction and Maintenance Occupations
The most common Natural Resources, Construction and Maintenance occupations in Bethlehem are Construction & Extraction (1,481 | 4.1%), Installation, Maintenance & Repair (858 | 2.4%), and Farming, Fishing & Forestry (108 | 0.3%).
Natural Resources, Construction and Maintenance Occupations by Sex
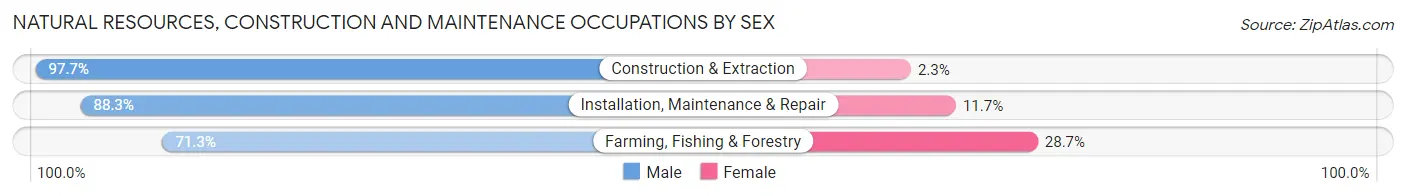
| Occupation | Male | Female |
| Farming, Fishing & Forestry | 77 (71.3%) | 31 (28.7%) |
| Construction & Extraction | 1,447 (97.7%) | 34 (2.3%) |
| Installation, Maintenance & Repair | 758 (88.3%) | 100 (11.7%) |
| Total (Category) | 2,282 (93.3%) | 165 (6.7%) |
| Total (Overall) | 18,605 (51.3%) | 17,669 (48.7%) |
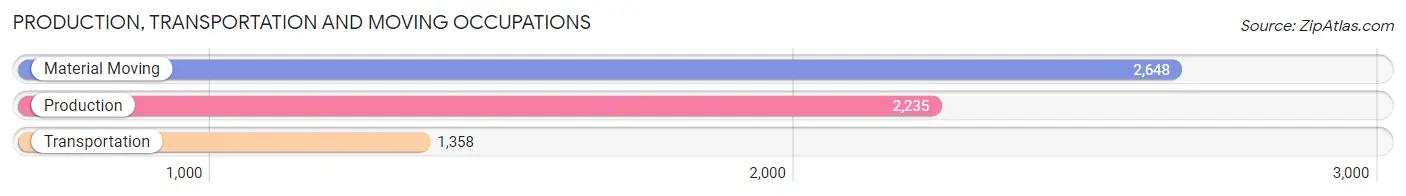
Production, Transportation and Moving Occupations
The most common Production, Transportation and Moving occupations in Bethlehem are Material Moving (2,648 | 7.3%), Production (2,235 | 6.2%), and Transportation (1,358 | 3.7%).
Production, Transportation and Moving Occupations by Sex
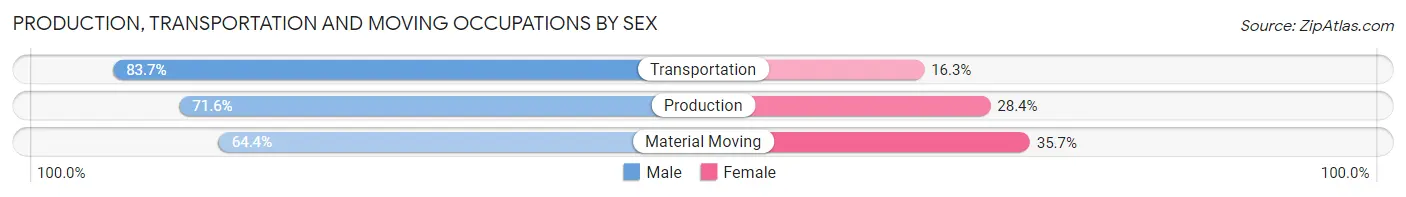
| Occupation | Male | Female |
| Production | 1,600 (71.6%) | 635 (28.4%) |
| Transportation | 1,137 (83.7%) | 221 (16.3%) |
| Material Moving | 1,704 (64.3%) | 944 (35.6%) |
| Total (Category) | 4,441 (71.2%) | 1,800 (28.8%) |
| Total (Overall) | 18,605 (51.3%) | 17,669 (48.7%) |
Employment Industries by Sex in Bethlehem
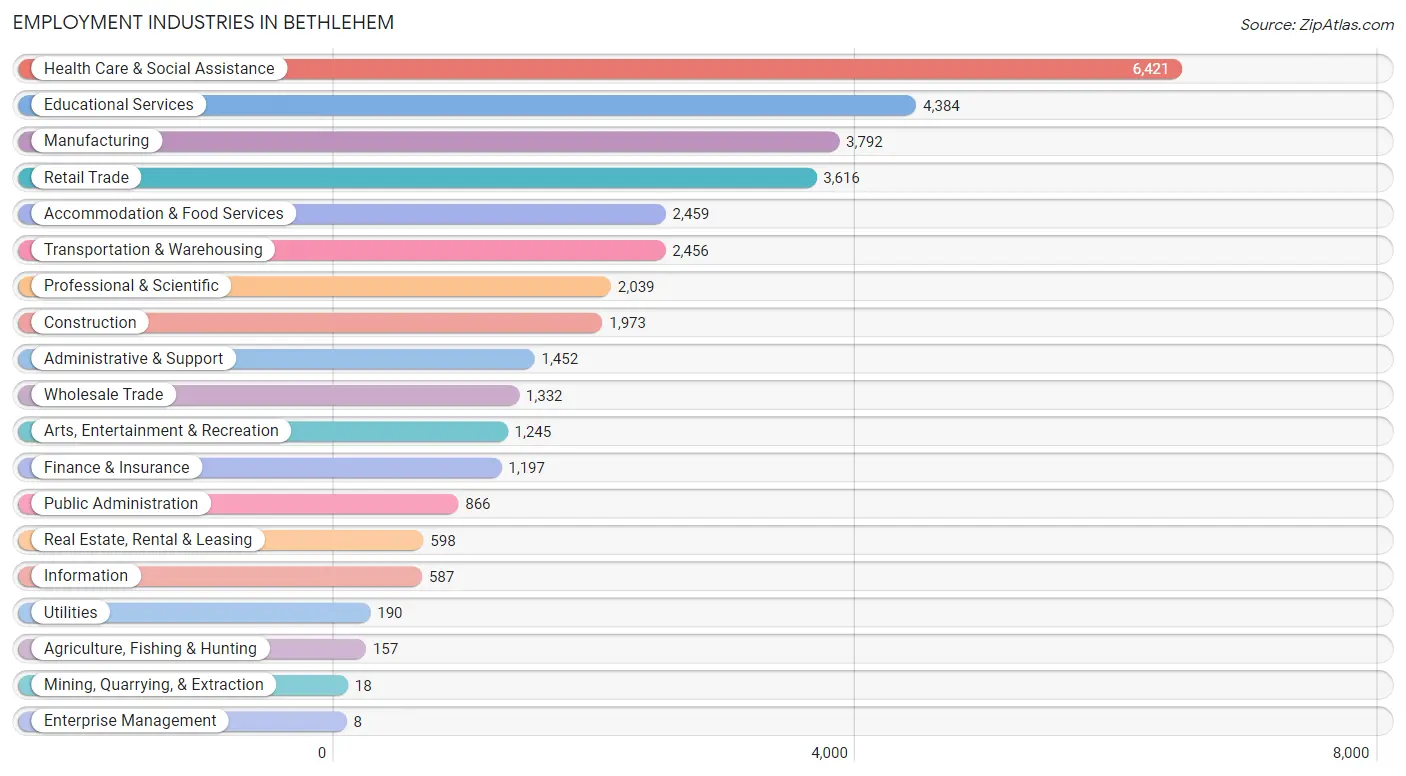
Employment Industries in Bethlehem
The major employment industries in Bethlehem include Health Care & Social Assistance (6,421 | 17.7%), Educational Services (4,384 | 12.1%), Manufacturing (3,792 | 10.4%), Retail Trade (3,616 | 10.0%), and Accommodation & Food Services (2,459 | 6.8%).
Employment Industries by Sex in Bethlehem
The Bethlehem industries that see more men than women are Mining, Quarrying, & Extraction (100.0%), Construction (91.5%), and Utilities (84.2%), whereas the industries that tend to have a higher number of women are Enterprise Management (100.0%), Health Care & Social Assistance (81.9%), and Finance & Insurance (59.9%).
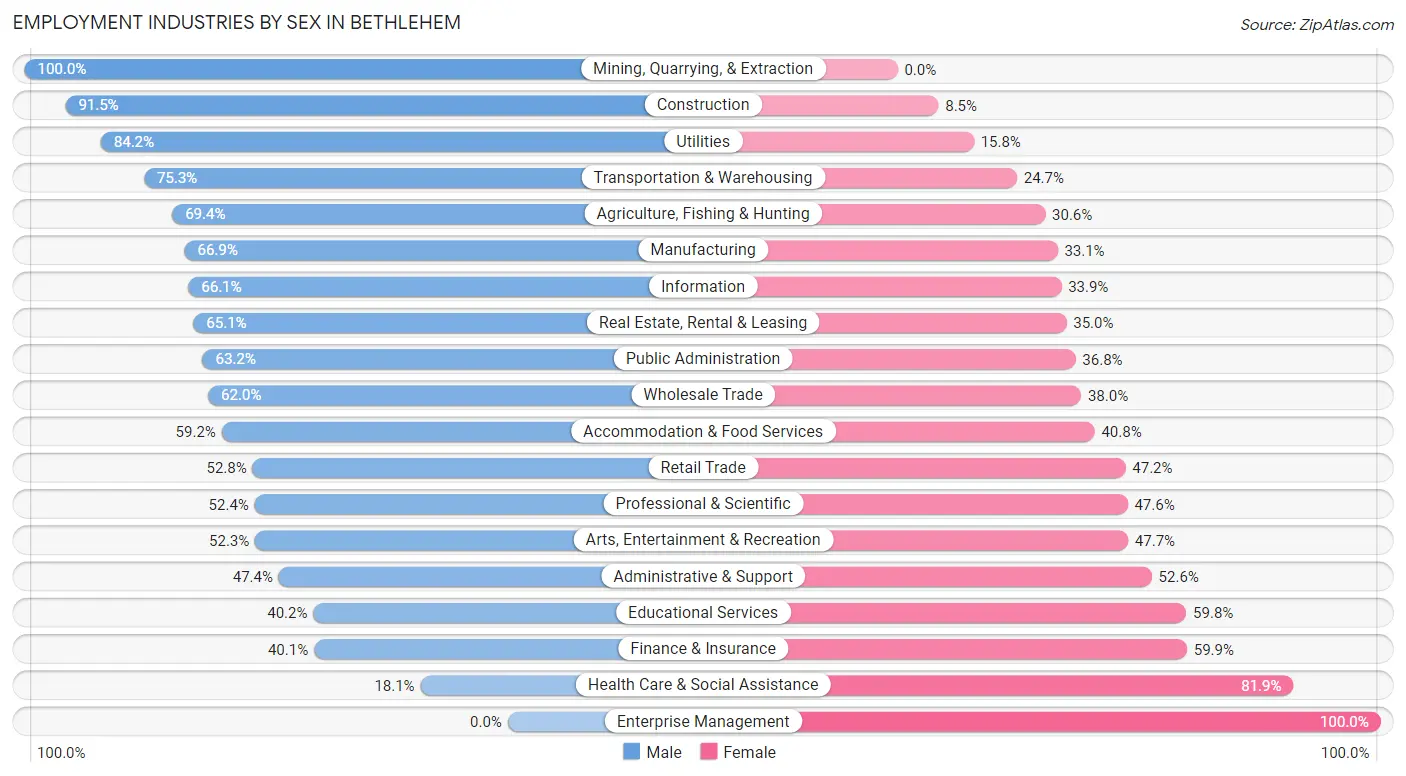
| Industry | Male | Female |
| Agriculture, Fishing & Hunting | 109 (69.4%) | 48 (30.6%) |
| Mining, Quarrying, & Extraction | 18 (100.0%) | 0 (0.0%) |
| Construction | 1,806 (91.5%) | 167 (8.5%) |
| Manufacturing | 2,536 (66.9%) | 1,256 (33.1%) |
| Wholesale Trade | 826 (62.0%) | 506 (38.0%) |
| Retail Trade | 1,910 (52.8%) | 1,706 (47.2%) |
| Transportation & Warehousing | 1,849 (75.3%) | 607 (24.7%) |
| Utilities | 160 (84.2%) | 30 (15.8%) |
| Information | 388 (66.1%) | 199 (33.9%) |
| Finance & Insurance | 480 (40.1%) | 717 (59.9%) |
| Real Estate, Rental & Leasing | 389 (65.0%) | 209 (34.9%) |
| Professional & Scientific | 1,068 (52.4%) | 971 (47.6%) |
| Enterprise Management | 0 (0.0%) | 8 (100.0%) |
| Administrative & Support | 688 (47.4%) | 764 (52.6%) |
| Educational Services | 1,764 (40.2%) | 2,620 (59.8%) |
| Health Care & Social Assistance | 1,160 (18.1%) | 5,261 (81.9%) |
| Arts, Entertainment & Recreation | 651 (52.3%) | 594 (47.7%) |
| Accommodation & Food Services | 1,456 (59.2%) | 1,003 (40.8%) |
| Public Administration | 547 (63.2%) | 319 (36.8%) |
| Total | 18,605 (51.3%) | 17,669 (48.7%) |
Education in Bethlehem
School Enrollment in Bethlehem
The most common levels of schooling among the 21,419 students in Bethlehem are college / undergraduate (8,658 | 40.4%), high school (3,510 | 16.4%), and middle school (3,082 | 14.4%).
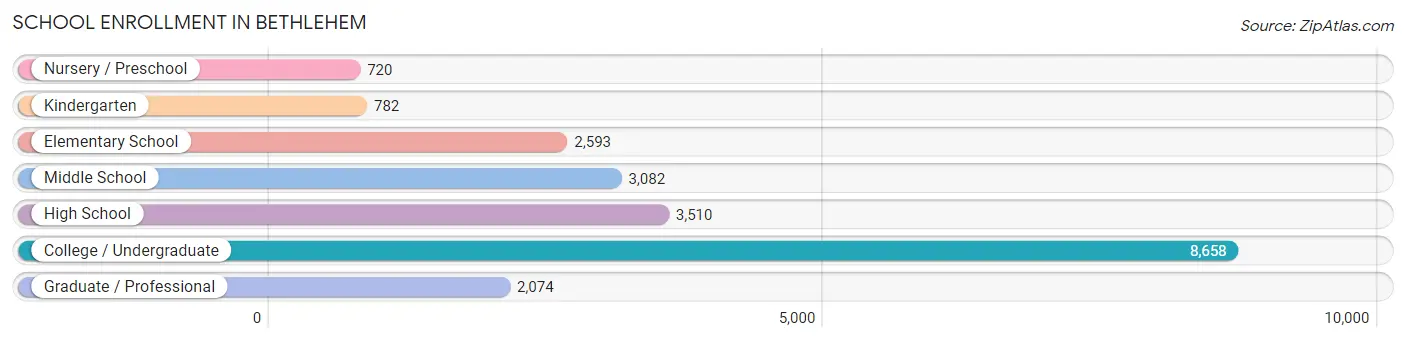
| School Level | # Students | % Students |
| Nursery / Preschool | 720 | 3.4% |
| Kindergarten | 782 | 3.6% |
| Elementary School | 2,593 | 12.1% |
| Middle School | 3,082 | 14.4% |
| High School | 3,510 | 16.4% |
| College / Undergraduate | 8,658 | 40.4% |
| Graduate / Professional | 2,074 | 9.7% |
| Total | 21,419 | 100.0% |
School Enrollment by Age by Funding Source in Bethlehem
Out of a total of 21,419 students who are enrolled in schools in Bethlehem, 8,867 (41.4%) attend a private institution, while the remaining 12,552 (58.6%) are enrolled in public schools. The age group of 18 to 19 year olds has the highest likelihood of being enrolled in private schools, with 3,026 (74.2% in the age bracket) enrolled. Conversely, the age group of 10 to 14 year olds has the lowest likelihood of being enrolled in a private school, with 3,982 (95.1% in the age bracket) attending a public institution.
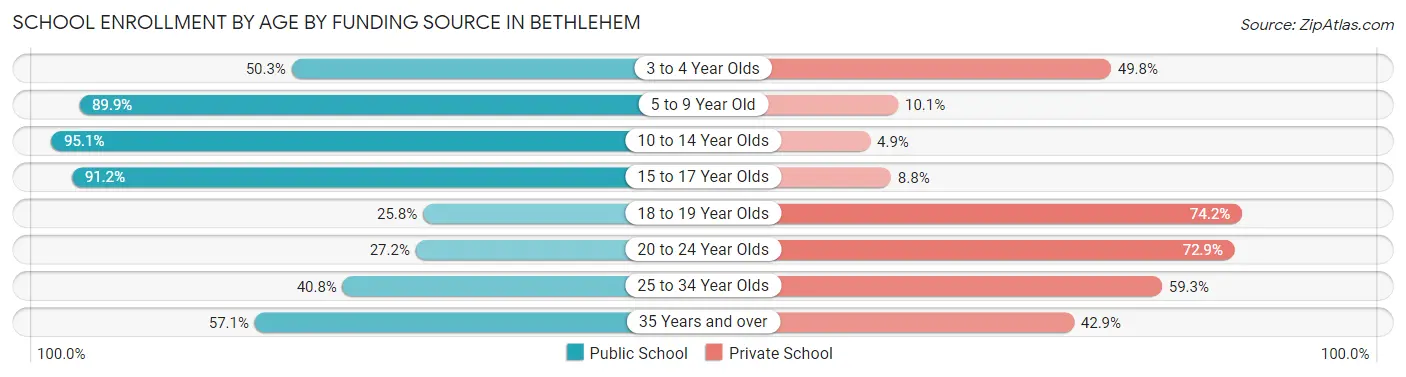
| Age Bracket | Public School | Private School |
| 3 to 4 Year Olds | 298 (50.2%) | 295 (49.7%) |
| 5 to 9 Year Old | 2,794 (89.9%) | 315 (10.1%) |
| 10 to 14 Year Olds | 3,982 (95.1%) | 206 (4.9%) |
| 15 to 17 Year Olds | 2,000 (91.2%) | 193 (8.8%) |
| 18 to 19 Year Olds | 1,051 (25.8%) | 3,026 (74.2%) |
| 20 to 24 Year Olds | 1,256 (27.2%) | 3,371 (72.9%) |
| 25 to 34 Year Olds | 815 (40.7%) | 1,185 (59.3%) |
| 35 Years and over | 361 (57.1%) | 271 (42.9%) |
| Total | 12,552 (58.6%) | 8,867 (41.4%) |
Educational Attainment by Field of Study in Bethlehem
Business (2,975 | 15.7%), education (2,173 | 11.5%), science & technology (1,759 | 9.3%), engineering (1,508 | 8.0%), and social sciences (1,354 | 7.1%) are the most common fields of study among 18,966 individuals in Bethlehem who have obtained a bachelor's degree or higher.
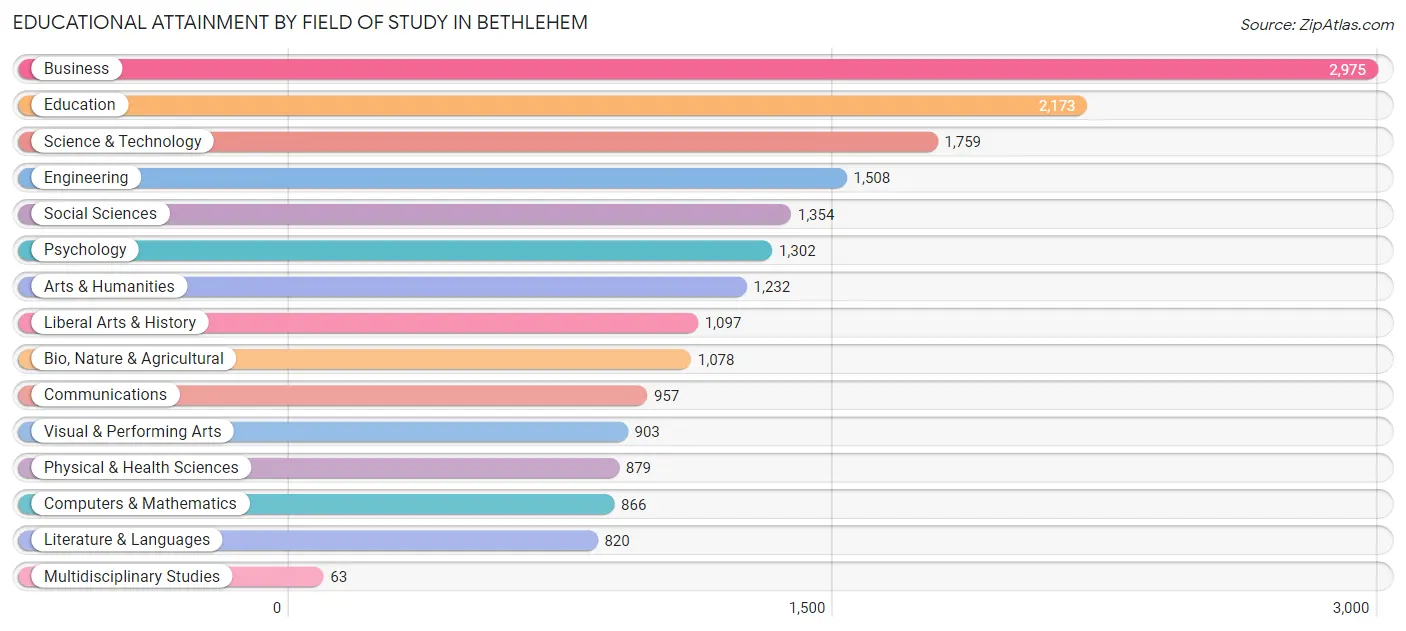
| Field of Study | # Graduates | % Graduates |
| Computers & Mathematics | 866 | 4.6% |
| Bio, Nature & Agricultural | 1,078 | 5.7% |
| Physical & Health Sciences | 879 | 4.6% |
| Psychology | 1,302 | 6.9% |
| Social Sciences | 1,354 | 7.1% |
| Engineering | 1,508 | 8.0% |
| Multidisciplinary Studies | 63 | 0.3% |
| Science & Technology | 1,759 | 9.3% |
| Business | 2,975 | 15.7% |
| Education | 2,173 | 11.5% |
| Literature & Languages | 820 | 4.3% |
| Liberal Arts & History | 1,097 | 5.8% |
| Visual & Performing Arts | 903 | 4.8% |
| Communications | 957 | 5.1% |
| Arts & Humanities | 1,232 | 6.5% |
| Total | 18,966 | 100.0% |
Transportation & Commute in Bethlehem
Vehicle Availability by Sex in Bethlehem
The most prevalent vehicle ownership categories in Bethlehem are males with 2 vehicles (7,553, accounting for 42.4%) and females with 2 vehicles (6,192, making up 46.2%).
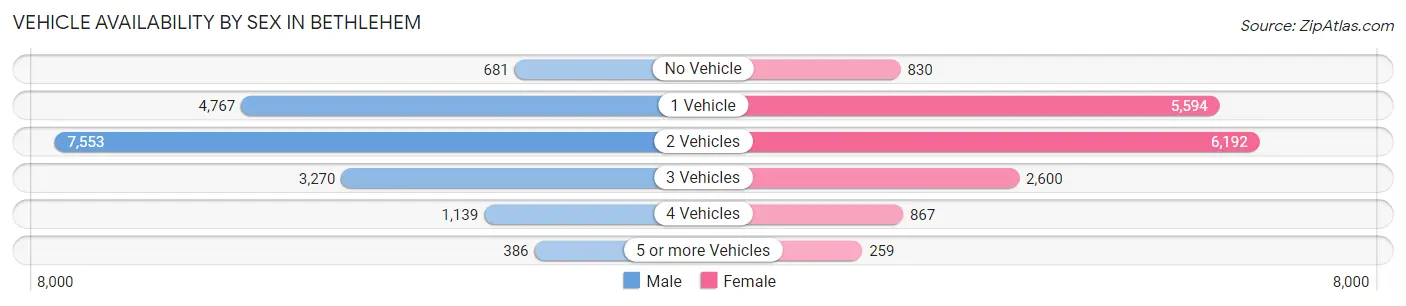
| Vehicles Available | Male | Female |
| No Vehicle | 681 (3.8%) | 830 (5.1%) |
| 1 Vehicle | 4,767 (26.8%) | 5,594 (34.2%) |
| 2 Vehicles | 7,553 (42.4%) | 6,192 (37.9%) |
| 3 Vehicles | 3,270 (18.4%) | 2,600 (15.9%) |
| 4 Vehicles | 1,139 (6.4%) | 867 (5.3%) |
| 5 or more Vehicles | 386 (2.2%) | 259 (1.6%) |
| Total | 17,796 (100.0%) | 16,342 (100.0%) |
Commute Time in Bethlehem
The most frequently occuring commute durations in Bethlehem are 10 to 14 minutes (6,457 commuters, 20.7%), 15 to 19 minutes (6,269 commuters, 20.1%), and 20 to 24 minutes (4,565 commuters, 14.7%).
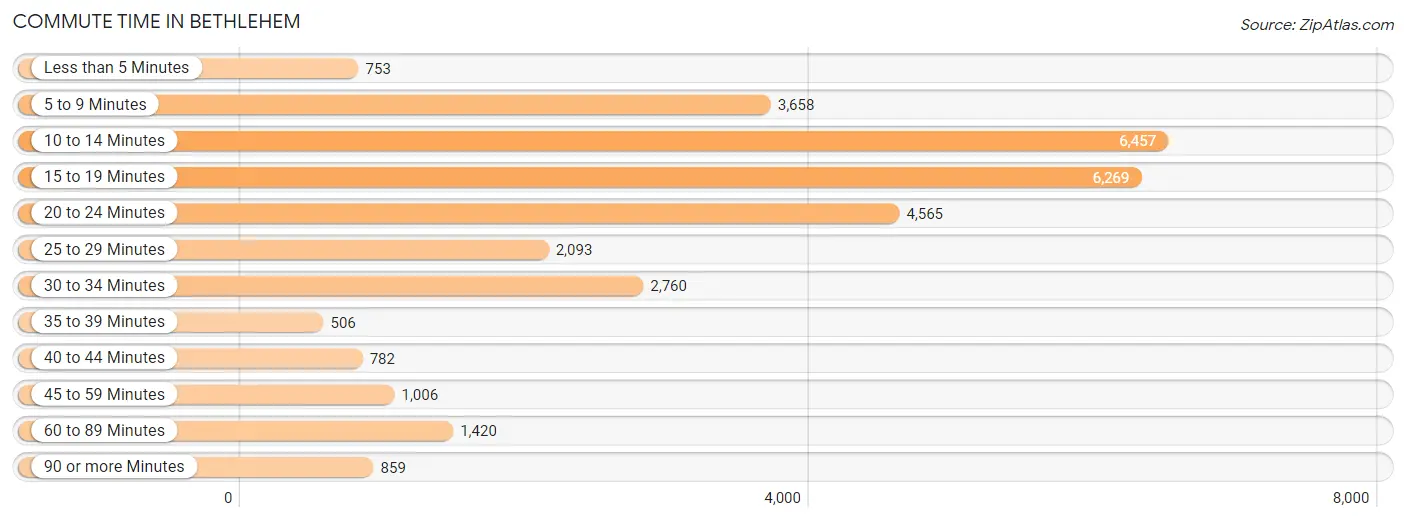
| Commute Time | # Commuters | % Commuters |
| Less than 5 Minutes | 753 | 2.4% |
| 5 to 9 Minutes | 3,658 | 11.7% |
| 10 to 14 Minutes | 6,457 | 20.7% |
| 15 to 19 Minutes | 6,269 | 20.1% |
| 20 to 24 Minutes | 4,565 | 14.7% |
| 25 to 29 Minutes | 2,093 | 6.7% |
| 30 to 34 Minutes | 2,760 | 8.9% |
| 35 to 39 Minutes | 506 | 1.6% |
| 40 to 44 Minutes | 782 | 2.5% |
| 45 to 59 Minutes | 1,006 | 3.2% |
| 60 to 89 Minutes | 1,420 | 4.6% |
| 90 or more Minutes | 859 | 2.8% |
Commute Time by Sex in Bethlehem
The most common commute times in Bethlehem are 15 to 19 minutes (3,507 commuters, 21.9%) for males and 10 to 14 minutes (3,375 commuters, 22.3%) for females.
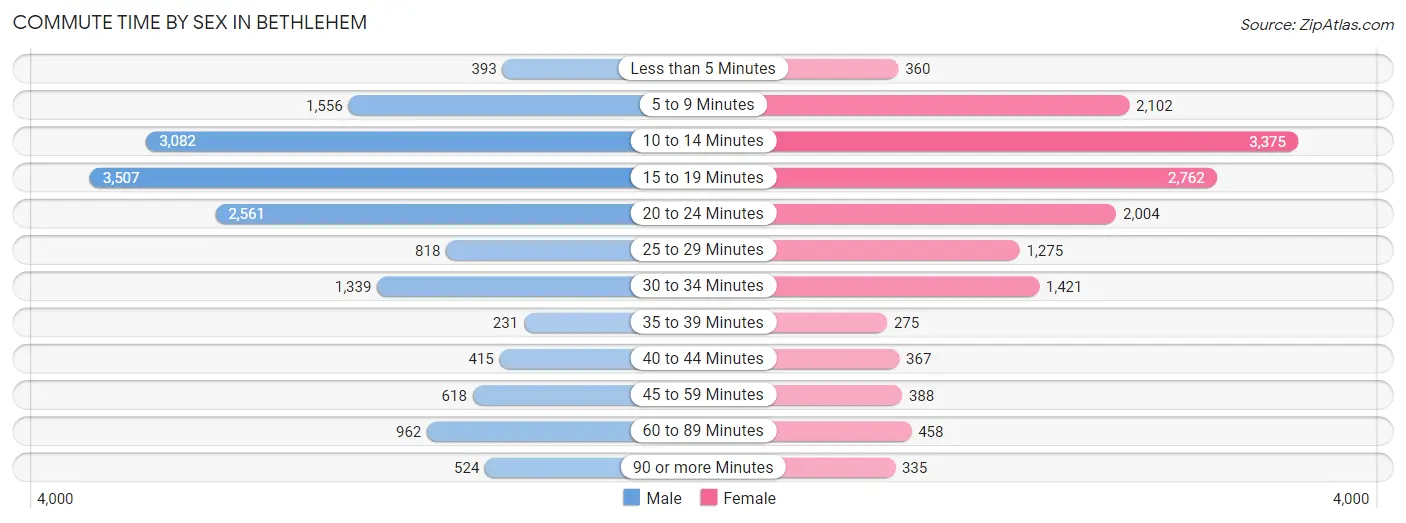
| Commute Time | Male | Female |
| Less than 5 Minutes | 393 (2.5%) | 360 (2.4%) |
| 5 to 9 Minutes | 1,556 (9.7%) | 2,102 (13.9%) |
| 10 to 14 Minutes | 3,082 (19.3%) | 3,375 (22.3%) |
| 15 to 19 Minutes | 3,507 (21.9%) | 2,762 (18.3%) |
| 20 to 24 Minutes | 2,561 (16.0%) | 2,004 (13.3%) |
| 25 to 29 Minutes | 818 (5.1%) | 1,275 (8.4%) |
| 30 to 34 Minutes | 1,339 (8.4%) | 1,421 (9.4%) |
| 35 to 39 Minutes | 231 (1.4%) | 275 (1.8%) |
| 40 to 44 Minutes | 415 (2.6%) | 367 (2.4%) |
| 45 to 59 Minutes | 618 (3.9%) | 388 (2.6%) |
| 60 to 89 Minutes | 962 (6.0%) | 458 (3.0%) |
| 90 or more Minutes | 524 (3.3%) | 335 (2.2%) |
Time of Departure to Work by Sex in Bethlehem
The most frequent times of departure to work in Bethlehem are 7:00 AM to 7:29 AM (2,302, 14.4%) for males and 7:30 AM to 7:59 AM (2,404, 15.9%) for females.
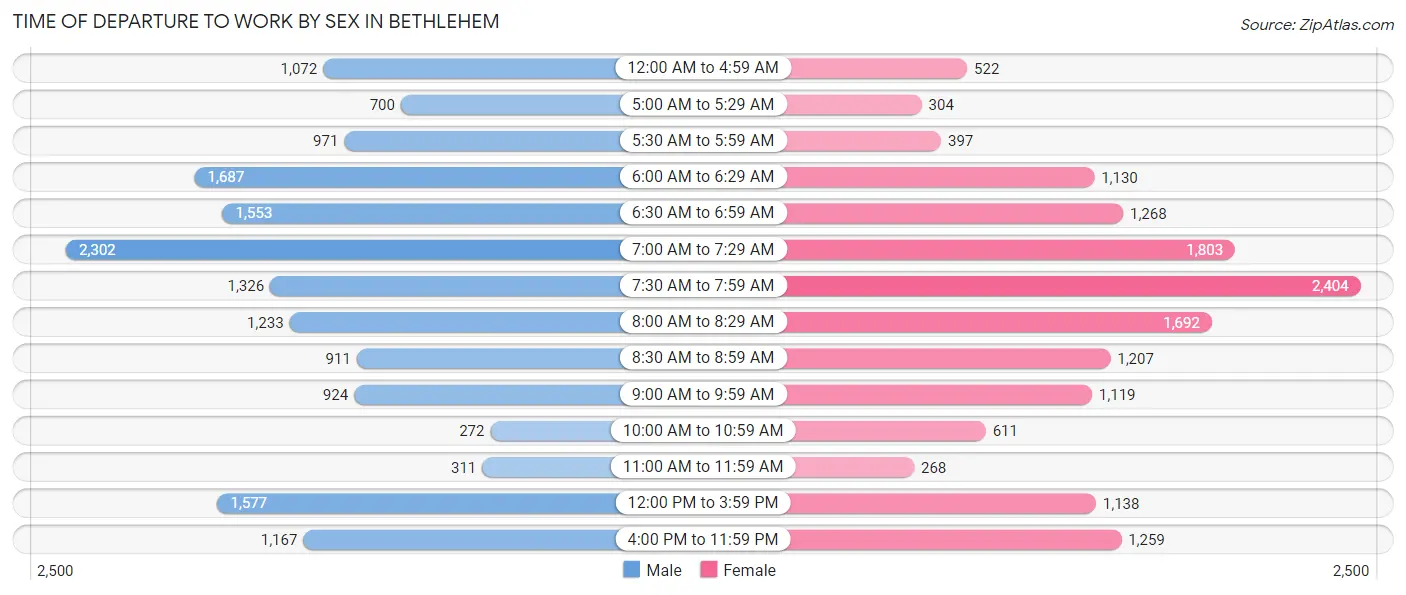
| Time of Departure | Male | Female |
| 12:00 AM to 4:59 AM | 1,072 (6.7%) | 522 (3.5%) |
| 5:00 AM to 5:29 AM | 700 (4.4%) | 304 (2.0%) |
| 5:30 AM to 5:59 AM | 971 (6.1%) | 397 (2.6%) |
| 6:00 AM to 6:29 AM | 1,687 (10.5%) | 1,130 (7.5%) |
| 6:30 AM to 6:59 AM | 1,553 (9.7%) | 1,268 (8.4%) |
| 7:00 AM to 7:29 AM | 2,302 (14.4%) | 1,803 (11.9%) |
| 7:30 AM to 7:59 AM | 1,326 (8.3%) | 2,404 (15.9%) |
| 8:00 AM to 8:29 AM | 1,233 (7.7%) | 1,692 (11.2%) |
| 8:30 AM to 8:59 AM | 911 (5.7%) | 1,207 (8.0%) |
| 9:00 AM to 9:59 AM | 924 (5.8%) | 1,119 (7.4%) |
| 10:00 AM to 10:59 AM | 272 (1.7%) | 611 (4.0%) |
| 11:00 AM to 11:59 AM | 311 (1.9%) | 268 (1.8%) |
| 12:00 PM to 3:59 PM | 1,577 (9.9%) | 1,138 (7.5%) |
| 4:00 PM to 11:59 PM | 1,167 (7.3%) | 1,259 (8.3%) |
| Total | 16,006 (100.0%) | 15,122 (100.0%) |
Housing Occupancy in Bethlehem
Occupancy by Ownership in Bethlehem
Of the total 30,162 dwellings in Bethlehem, owner-occupied units account for 15,309 (50.8%), while renter-occupied units make up 14,853 (49.2%).
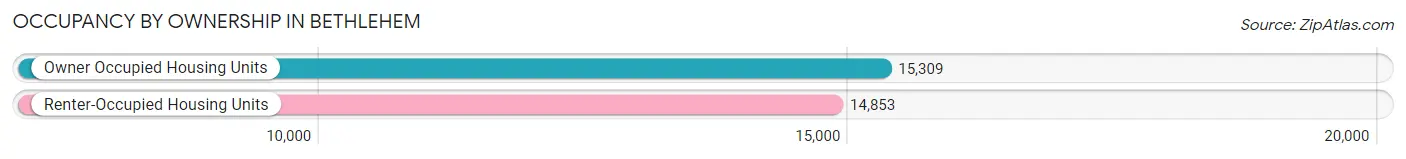
| Occupancy | # Housing Units | % Housing Units |
| Owner Occupied Housing Units | 15,309 | 50.8% |
| Renter-Occupied Housing Units | 14,853 | 49.2% |
| Total Occupied Housing Units | 30,162 | 100.0% |
Occupancy by Household Size in Bethlehem
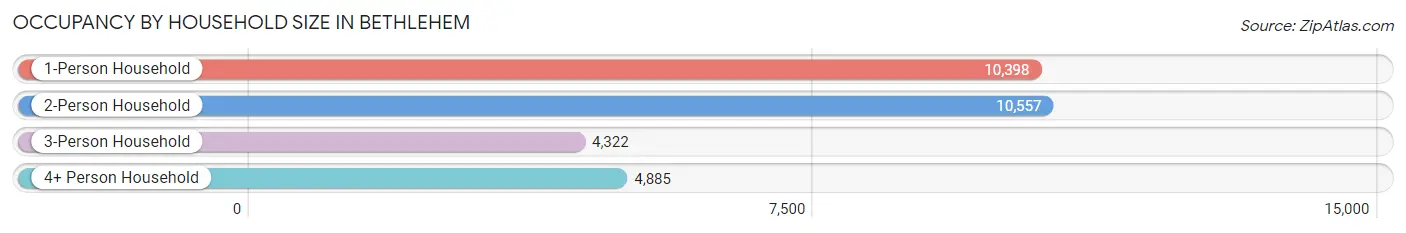
| Household Size | # Housing Units | % Housing Units |
| 1-Person Household | 10,398 | 34.5% |
| 2-Person Household | 10,557 | 35.0% |
| 3-Person Household | 4,322 | 14.3% |
| 4+ Person Household | 4,885 | 16.2% |
| Total Housing Units | 30,162 | 100.0% |
Occupancy by Ownership by Household Size in Bethlehem
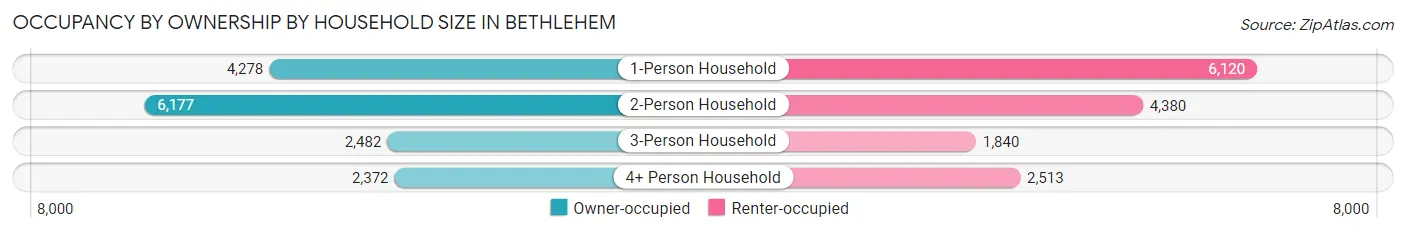
| Household Size | Owner-occupied | Renter-occupied |
| 1-Person Household | 4,278 (41.1%) | 6,120 (58.9%) |
| 2-Person Household | 6,177 (58.5%) | 4,380 (41.5%) |
| 3-Person Household | 2,482 (57.4%) | 1,840 (42.6%) |
| 4+ Person Household | 2,372 (48.6%) | 2,513 (51.4%) |
| Total Housing Units | 15,309 (50.8%) | 14,853 (49.2%) |
Occupancy by Educational Attainment in Bethlehem
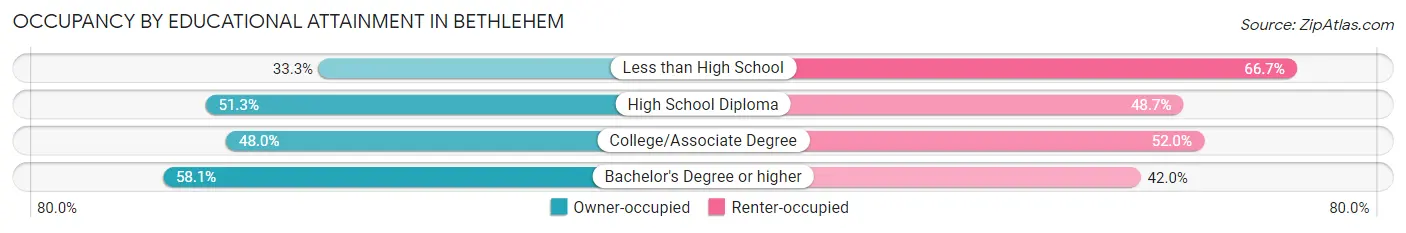
| Household Size | Owner-occupied | Renter-occupied |
| Less than High School | 1,080 (33.3%) | 2,161 (66.7%) |
| High School Diploma | 4,255 (51.3%) | 4,040 (48.7%) |
| College/Associate Degree | 4,022 (48.0%) | 4,351 (52.0%) |
| Bachelor's Degree or higher | 5,952 (58.1%) | 4,301 (41.9%) |
Occupancy by Age of Householder in Bethlehem
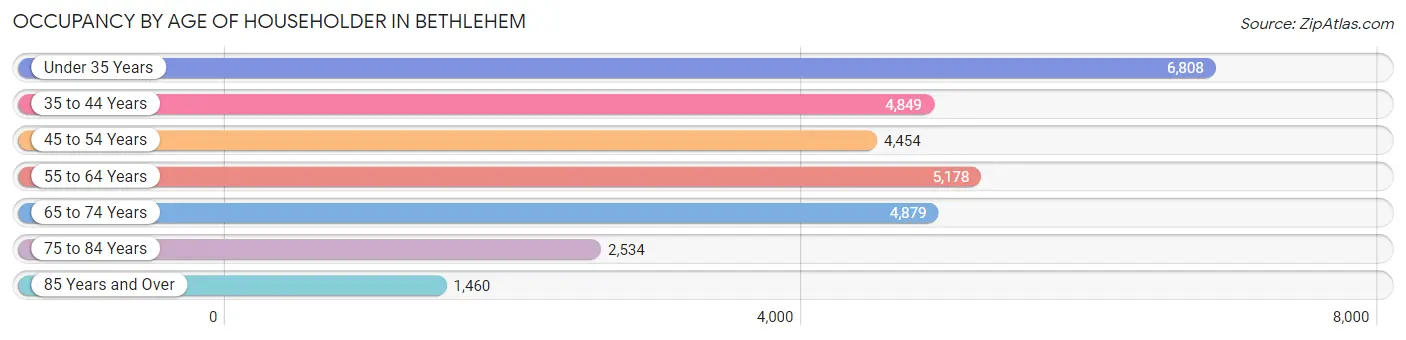
| Age Bracket | # Households | % Households |
| Under 35 Years | 6,808 | 22.6% |
| 35 to 44 Years | 4,849 | 16.1% |
| 45 to 54 Years | 4,454 | 14.8% |
| 55 to 64 Years | 5,178 | 17.2% |
| 65 to 74 Years | 4,879 | 16.2% |
| 75 to 84 Years | 2,534 | 8.4% |
| 85 Years and Over | 1,460 | 4.8% |
| Total | 30,162 | 100.0% |
Housing Finances in Bethlehem
Median Income by Occupancy in Bethlehem
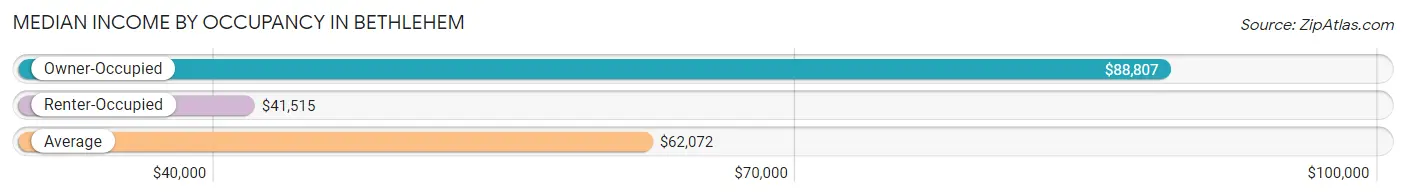
| Occupancy Type | # Households | Median Income |
| Owner-Occupied | 15,309 (50.8%) | $88,807 |
| Renter-Occupied | 14,853 (49.2%) | $41,515 |
| Average | 30,162 (100.0%) | $62,072 |
Occupancy by Householder Income Bracket in Bethlehem
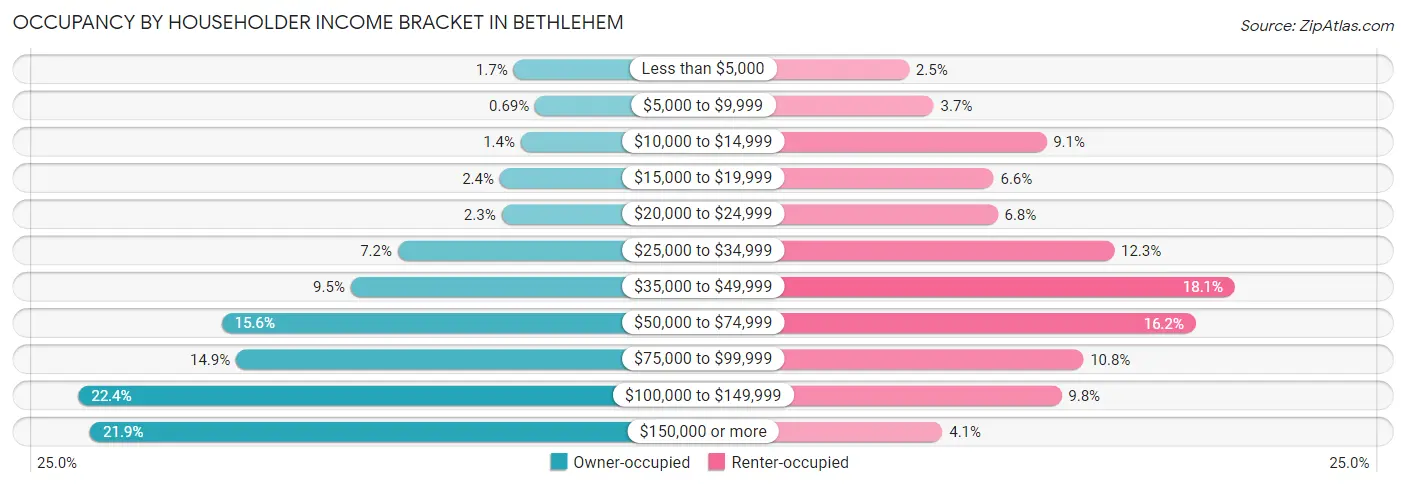
| Income Bracket | Owner-occupied | Renter-occupied |
| Less than $5,000 | 263 (1.7%) | 377 (2.5%) |
| $5,000 to $9,999 | 106 (0.7%) | 552 (3.7%) |
| $10,000 to $14,999 | 209 (1.4%) | 1,349 (9.1%) |
| $15,000 to $19,999 | 363 (2.4%) | 976 (6.6%) |
| $20,000 to $24,999 | 351 (2.3%) | 1,004 (6.8%) |
| $25,000 to $34,999 | 1,107 (7.2%) | 1,829 (12.3%) |
| $35,000 to $49,999 | 1,449 (9.5%) | 2,682 (18.1%) |
| $50,000 to $74,999 | 2,392 (15.6%) | 2,406 (16.2%) |
| $75,000 to $99,999 | 2,285 (14.9%) | 1,610 (10.8%) |
| $100,000 to $149,999 | 3,435 (22.4%) | 1,455 (9.8%) |
| $150,000 or more | 3,349 (21.9%) | 613 (4.1%) |
| Total | 15,309 (100.0%) | 14,853 (100.0%) |
Monthly Housing Cost Tiers in Bethlehem
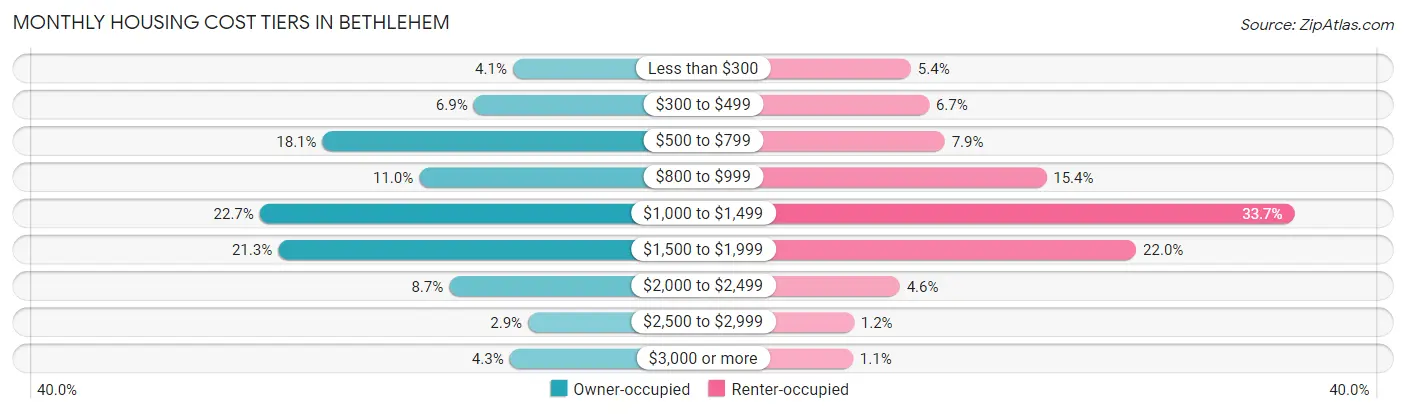
| Monthly Cost | Owner-occupied | Renter-occupied |
| Less than $300 | 620 (4.1%) | 803 (5.4%) |
| $300 to $499 | 1,063 (6.9%) | 1,001 (6.7%) |
| $500 to $799 | 2,767 (18.1%) | 1,174 (7.9%) |
| $800 to $999 | 1,676 (11.0%) | 2,285 (15.4%) |
| $1,000 to $1,499 | 3,473 (22.7%) | 4,998 (33.7%) |
| $1,500 to $1,999 | 3,267 (21.3%) | 3,267 (22.0%) |
| $2,000 to $2,499 | 1,338 (8.7%) | 682 (4.6%) |
| $2,500 to $2,999 | 449 (2.9%) | 179 (1.2%) |
| $3,000 or more | 656 (4.3%) | 170 (1.1%) |
| Total | 15,309 (100.0%) | 14,853 (100.0%) |
Physical Housing Characteristics in Bethlehem
Housing Structures in Bethlehem
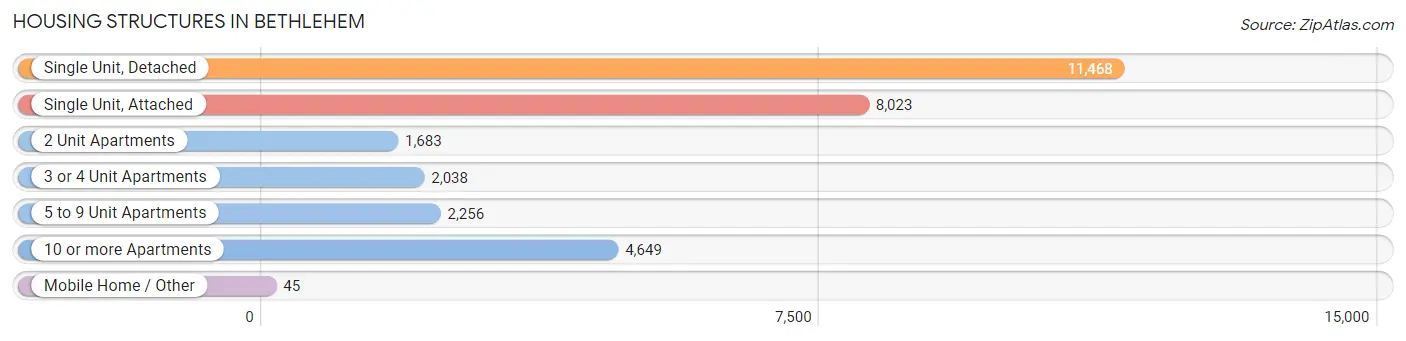
| Structure Type | # Housing Units | % Housing Units |
| Single Unit, Detached | 11,468 | 38.0% |
| Single Unit, Attached | 8,023 | 26.6% |
| 2 Unit Apartments | 1,683 | 5.6% |
| 3 or 4 Unit Apartments | 2,038 | 6.8% |
| 5 to 9 Unit Apartments | 2,256 | 7.5% |
| 10 or more Apartments | 4,649 | 15.4% |
| Mobile Home / Other | 45 | 0.2% |
| Total | 30,162 | 100.0% |
Housing Structures by Occupancy in Bethlehem
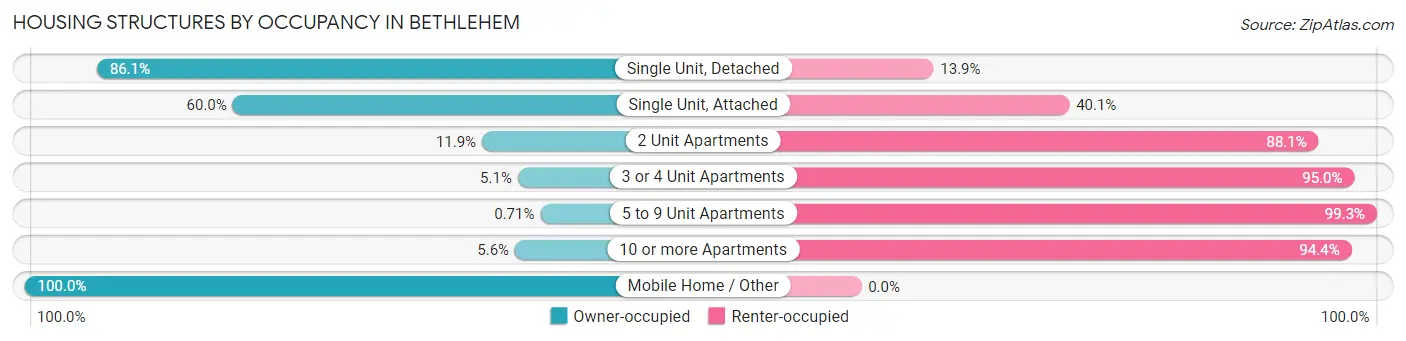
| Structure Type | Owner-occupied | Renter-occupied |
| Single Unit, Detached | 9,874 (86.1%) | 1,594 (13.9%) |
| Single Unit, Attached | 4,810 (60.0%) | 3,213 (40.1%) |
| 2 Unit Apartments | 201 (11.9%) | 1,482 (88.1%) |
| 3 or 4 Unit Apartments | 103 (5.1%) | 1,935 (95.0%) |
| 5 to 9 Unit Apartments | 16 (0.7%) | 2,240 (99.3%) |
| 10 or more Apartments | 260 (5.6%) | 4,389 (94.4%) |
| Mobile Home / Other | 45 (100.0%) | 0 (0.0%) |
| Total | 15,309 (50.8%) | 14,853 (49.2%) |
Housing Structures by Number of Rooms in Bethlehem
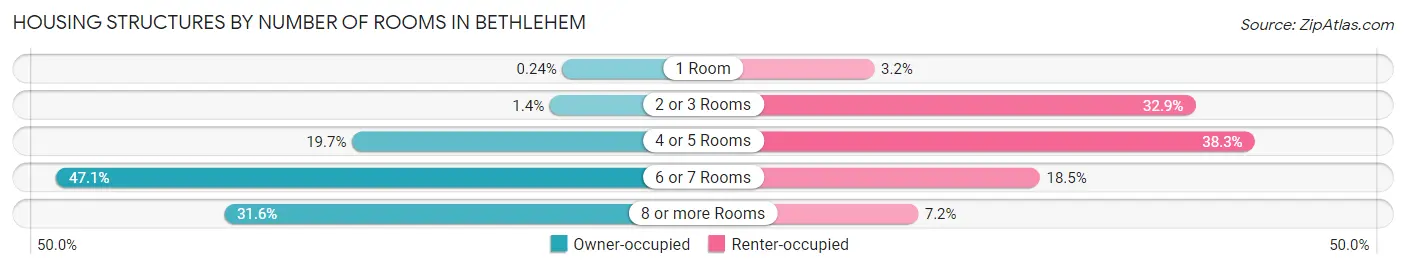
| Number of Rooms | Owner-occupied | Renter-occupied |
| 1 Room | 37 (0.2%) | 469 (3.2%) |
| 2 or 3 Rooms | 216 (1.4%) | 4,879 (32.9%) |
| 4 or 5 Rooms | 3,016 (19.7%) | 5,693 (38.3%) |
| 6 or 7 Rooms | 7,208 (47.1%) | 2,742 (18.5%) |
| 8 or more Rooms | 4,832 (31.6%) | 1,070 (7.2%) |
| Total | 15,309 (100.0%) | 14,853 (100.0%) |
Housing Structure by Heating Type in Bethlehem
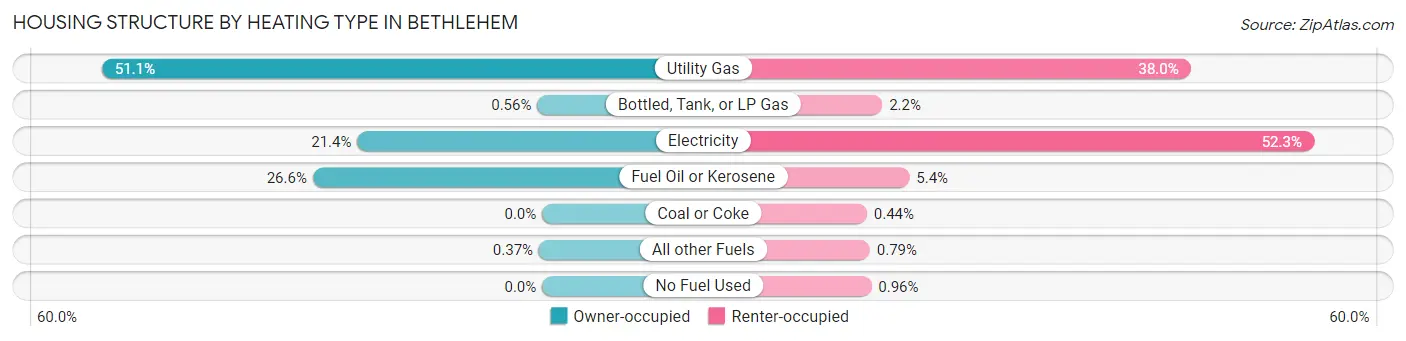
| Heating Type | Owner-occupied | Renter-occupied |
| Utility Gas | 7,815 (51.0%) | 5,639 (38.0%) |
| Bottled, Tank, or LP Gas | 86 (0.6%) | 329 (2.2%) |
| Electricity | 3,281 (21.4%) | 7,761 (52.2%) |
| Fuel Oil or Kerosene | 4,070 (26.6%) | 798 (5.4%) |
| Coal or Coke | 0 (0.0%) | 66 (0.4%) |
| All other Fuels | 57 (0.4%) | 118 (0.8%) |
| No Fuel Used | 0 (0.0%) | 142 (1.0%) |
| Total | 15,309 (100.0%) | 14,853 (100.0%) |
Household Vehicle Usage in Bethlehem
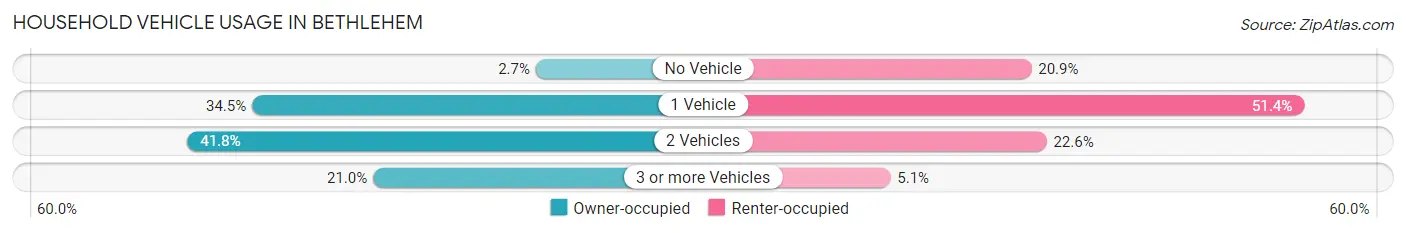
| Vehicles per Household | Owner-occupied | Renter-occupied |
| No Vehicle | 420 (2.7%) | 3,102 (20.9%) |
| 1 Vehicle | 5,285 (34.5%) | 7,641 (51.4%) |
| 2 Vehicles | 6,394 (41.8%) | 3,354 (22.6%) |
| 3 or more Vehicles | 3,210 (21.0%) | 756 (5.1%) |
| Total | 15,309 (100.0%) | 14,853 (100.0%) |
Real Estate & Mortgages in Bethlehem
Real Estate and Mortgage Overview in Bethlehem
| Characteristic | Without Mortgage | With Mortgage |
| Housing Units | 6,379 | 8,930 |
| Median Property Value | $217,900 | $222,000 |
| Median Household Income | $69,886 | $2,284 |
| Monthly Housing Costs | $660 | $645 |
| Real Estate Taxes | $3,825 | $134 |
Property Value by Mortgage Status in Bethlehem
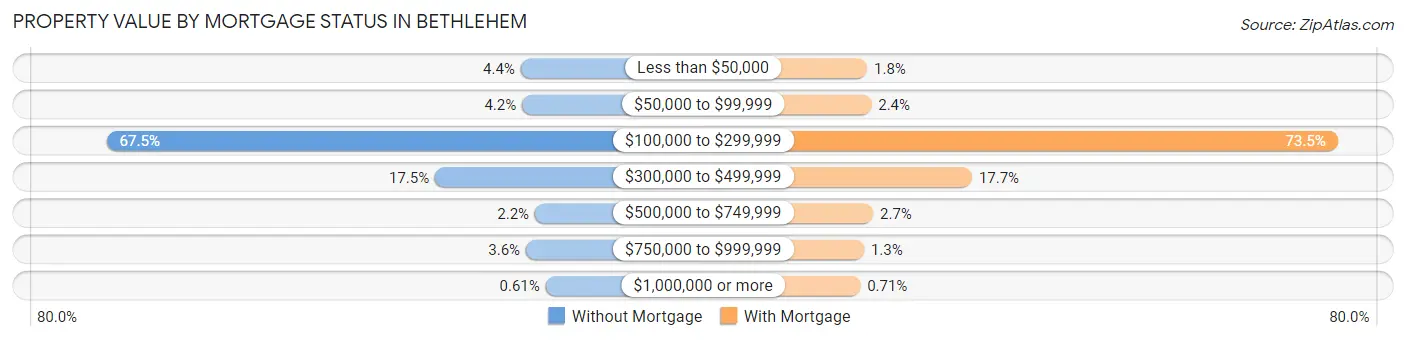
| Property Value | Without Mortgage | With Mortgage |
| Less than $50,000 | 281 (4.4%) | 157 (1.8%) |
| $50,000 to $99,999 | 268 (4.2%) | 214 (2.4%) |
| $100,000 to $299,999 | 4,305 (67.5%) | 6,560 (73.5%) |
| $300,000 to $499,999 | 1,113 (17.4%) | 1,584 (17.7%) |
| $500,000 to $749,999 | 143 (2.2%) | 238 (2.7%) |
| $750,000 to $999,999 | 230 (3.6%) | 114 (1.3%) |
| $1,000,000 or more | 39 (0.6%) | 63 (0.7%) |
| Total | 6,379 (100.0%) | 8,930 (100.0%) |
Household Income by Mortgage Status in Bethlehem
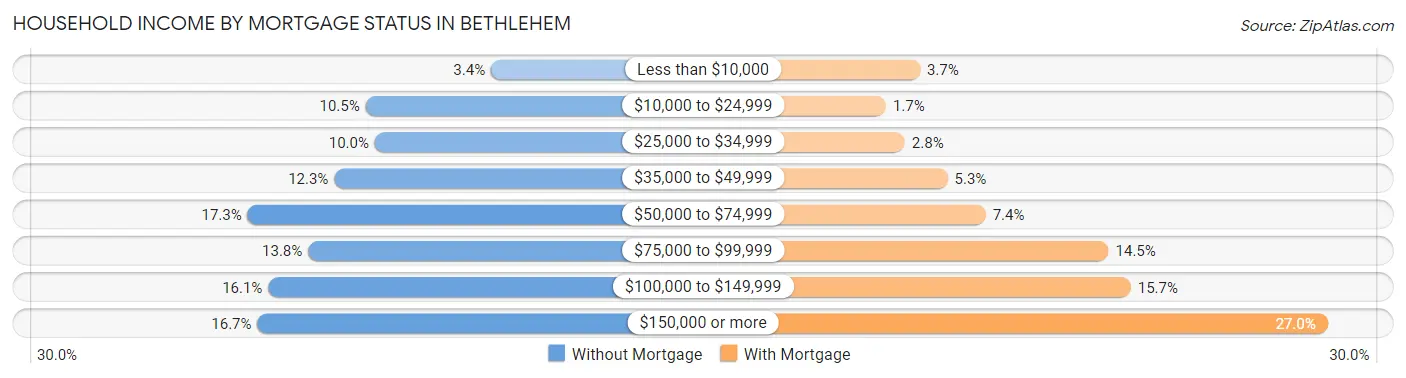
| Household Income | Without Mortgage | With Mortgage |
| Less than $10,000 | 214 (3.4%) | 329 (3.7%) |
| $10,000 to $24,999 | 671 (10.5%) | 155 (1.7%) |
| $25,000 to $34,999 | 637 (10.0%) | 252 (2.8%) |
| $35,000 to $49,999 | 785 (12.3%) | 470 (5.3%) |
| $50,000 to $74,999 | 1,101 (17.3%) | 664 (7.4%) |
| $75,000 to $99,999 | 880 (13.8%) | 1,291 (14.5%) |
| $100,000 to $149,999 | 1,026 (16.1%) | 1,405 (15.7%) |
| $150,000 or more | 1,065 (16.7%) | 2,409 (27.0%) |
| Total | 6,379 (100.0%) | 8,930 (100.0%) |
Property Value to Household Income Ratio in Bethlehem
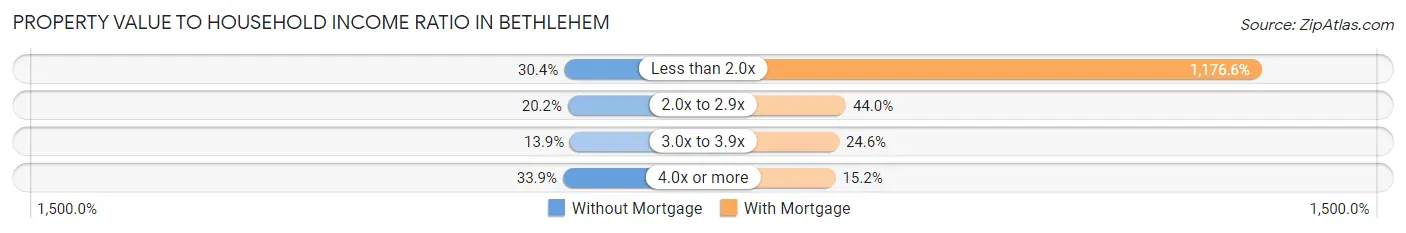
| Value-to-Income Ratio | Without Mortgage | With Mortgage |
| Less than 2.0x | 1,942 (30.4%) | 105,066 (1,176.5%) |
| 2.0x to 2.9x | 1,286 (20.2%) | 3,933 (44.0%) |
| 3.0x to 3.9x | 889 (13.9%) | 2,195 (24.6%) |
| 4.0x or more | 2,164 (33.9%) | 1,358 (15.2%) |
| Total | 6,379 (100.0%) | 8,930 (100.0%) |
Real Estate Taxes by Mortgage Status in Bethlehem
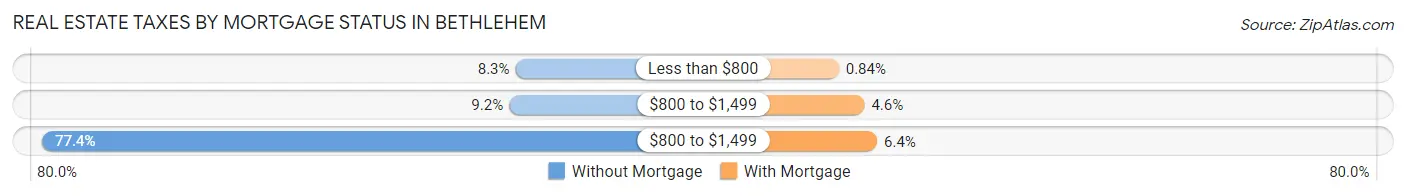
| Property Taxes | Without Mortgage | With Mortgage |
| Less than $800 | 529 (8.3%) | 75 (0.8%) |
| $800 to $1,499 | 588 (9.2%) | 410 (4.6%) |
| $800 to $1,499 | 4,940 (77.4%) | 575 (6.4%) |
| Total | 6,379 (100.0%) | 8,930 (100.0%) |
Health & Disability in Bethlehem
Health Insurance Coverage by Age in Bethlehem
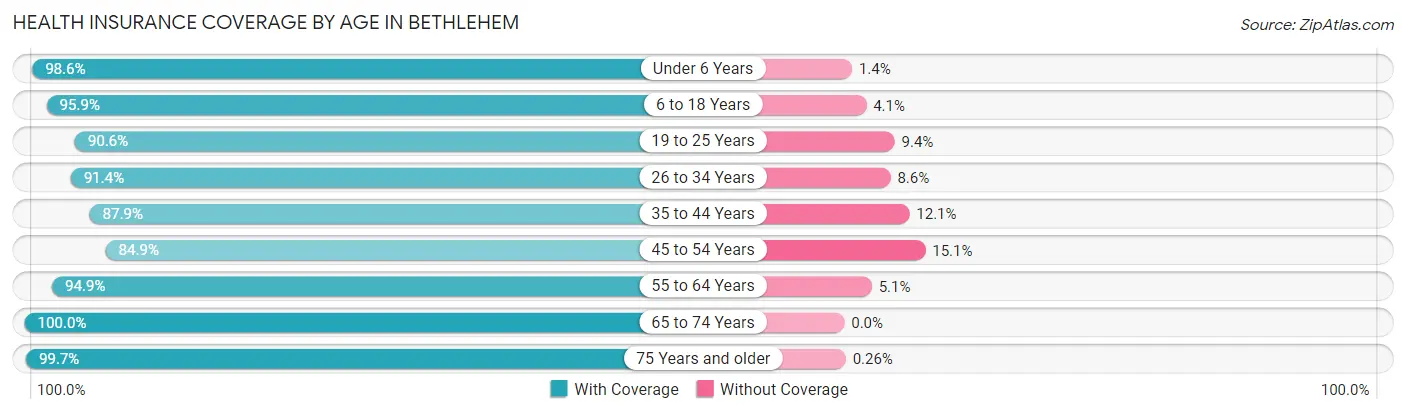
| Age Bracket | With Coverage | Without Coverage |
| Under 6 Years | 4,125 (98.6%) | 60 (1.4%) |
| 6 to 18 Years | 11,320 (95.9%) | 483 (4.1%) |
| 19 to 25 Years | 10,643 (90.6%) | 1,102 (9.4%) |
| 26 to 34 Years | 8,828 (91.4%) | 832 (8.6%) |
| 35 to 44 Years | 7,835 (87.9%) | 1,082 (12.1%) |
| 45 to 54 Years | 6,540 (84.9%) | 1,164 (15.1%) |
| 55 to 64 Years | 7,936 (94.9%) | 428 (5.1%) |
| 65 to 74 Years | 7,399 (100.0%) | 0 (0.0%) |
| 75 Years and older | 5,857 (99.7%) | 15 (0.3%) |
| Total | 70,483 (93.2%) | 5,166 (6.8%) |
Health Insurance Coverage by Citizenship Status in Bethlehem
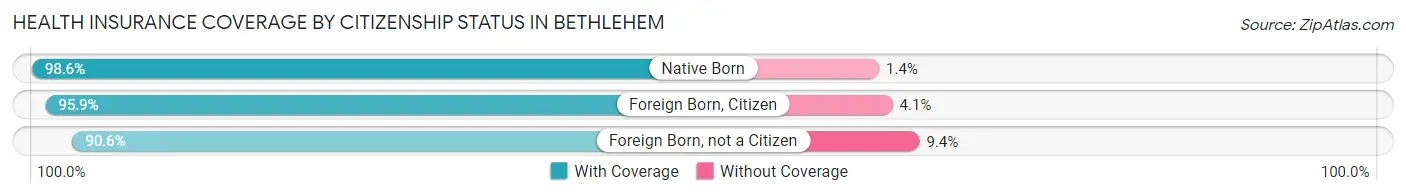
| Citizenship Status | With Coverage | Without Coverage |
| Native Born | 4,125 (98.6%) | 60 (1.4%) |
| Foreign Born, Citizen | 11,320 (95.9%) | 483 (4.1%) |
| Foreign Born, not a Citizen | 10,643 (90.6%) | 1,102 (9.4%) |
Health Insurance Coverage by Household Income in Bethlehem
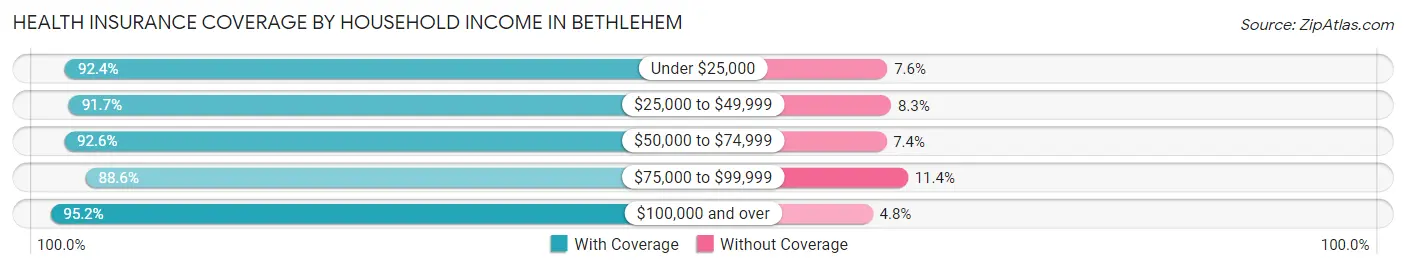
| Household Income | With Coverage | Without Coverage |
| Under $25,000 | 9,016 (92.4%) | 739 (7.6%) |
| $25,000 to $49,999 | 13,605 (91.7%) | 1,227 (8.3%) |
| $50,000 to $74,999 | 9,869 (92.6%) | 787 (7.4%) |
| $75,000 to $99,999 | 8,114 (88.6%) | 1,046 (11.4%) |
| $100,000 and over | 24,555 (95.2%) | 1,246 (4.8%) |
Public vs Private Health Insurance Coverage by Age in Bethlehem
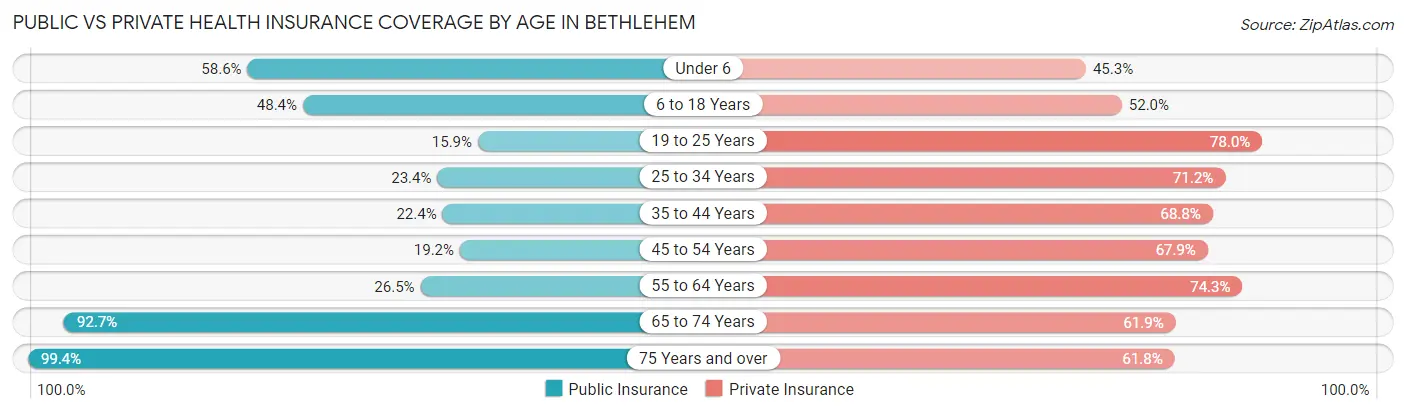
| Age Bracket | Public Insurance | Private Insurance |
| Under 6 | 2,454 (58.6%) | 1,897 (45.3%) |
| 6 to 18 Years | 5,707 (48.3%) | 6,136 (52.0%) |
| 19 to 25 Years | 1,864 (15.9%) | 9,164 (78.0%) |
| 25 to 34 Years | 2,260 (23.4%) | 6,873 (71.2%) |
| 35 to 44 Years | 2,000 (22.4%) | 6,138 (68.8%) |
| 45 to 54 Years | 1,480 (19.2%) | 5,232 (67.9%) |
| 55 to 64 Years | 2,219 (26.5%) | 6,218 (74.3%) |
| 65 to 74 Years | 6,859 (92.7%) | 4,582 (61.9%) |
| 75 Years and over | 5,836 (99.4%) | 3,626 (61.8%) |
| Total | 30,679 (40.6%) | 49,866 (65.9%) |
Disability Status by Sex by Age in Bethlehem
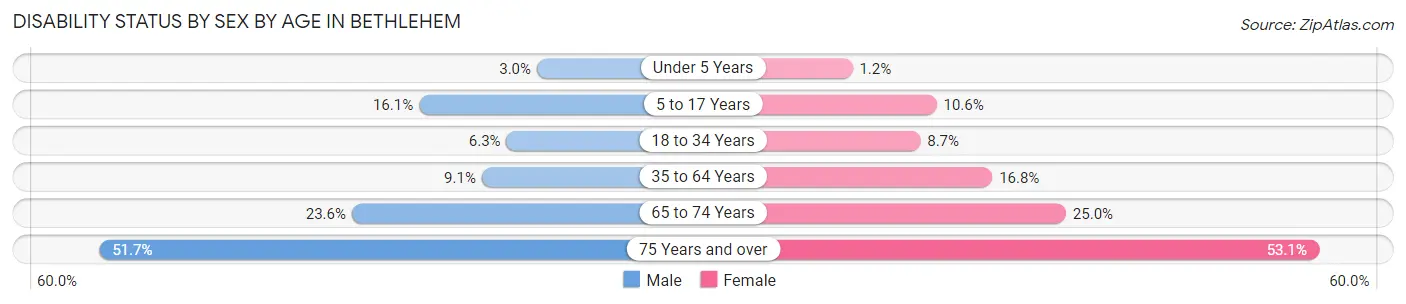
| Age Bracket | Male | Female |
| Under 5 Years | 52 (2.9%) | 22 (1.2%) |
| 5 to 17 Years | 754 (16.1%) | 534 (10.5%) |
| 18 to 34 Years | 807 (6.3%) | 987 (8.7%) |
| 35 to 64 Years | 1,107 (9.1%) | 2,145 (16.8%) |
| 65 to 74 Years | 774 (23.6%) | 1,027 (25.0%) |
| 75 Years and over | 1,114 (51.7%) | 1,974 (53.1%) |
Disability Class by Sex by Age in Bethlehem
Disability Class: Hearing Difficulty
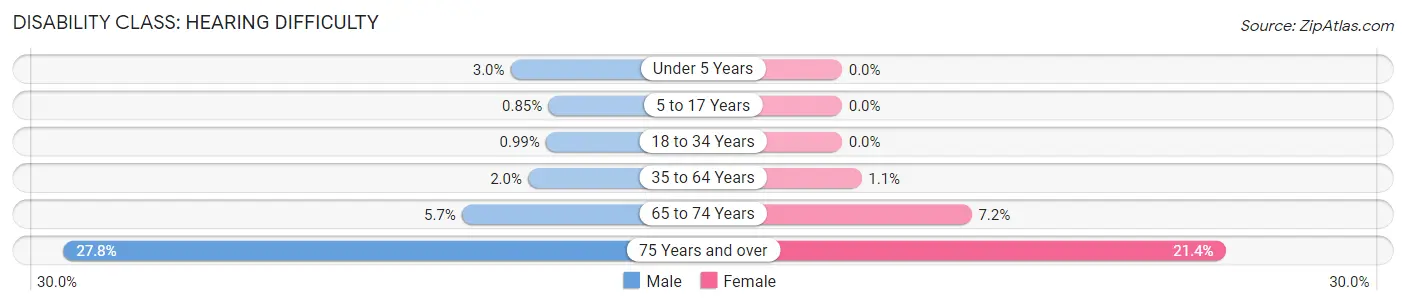
| Age Bracket | Male | Female |
| Under 5 Years | 52 (2.9%) | 0 (0.0%) |
| 5 to 17 Years | 40 (0.9%) | 0 (0.0%) |
| 18 to 34 Years | 126 (1.0%) | 0 (0.0%) |
| 35 to 64 Years | 241 (2.0%) | 140 (1.1%) |
| 65 to 74 Years | 186 (5.7%) | 297 (7.2%) |
| 75 Years and over | 600 (27.8%) | 794 (21.4%) |
Disability Class: Vision Difficulty
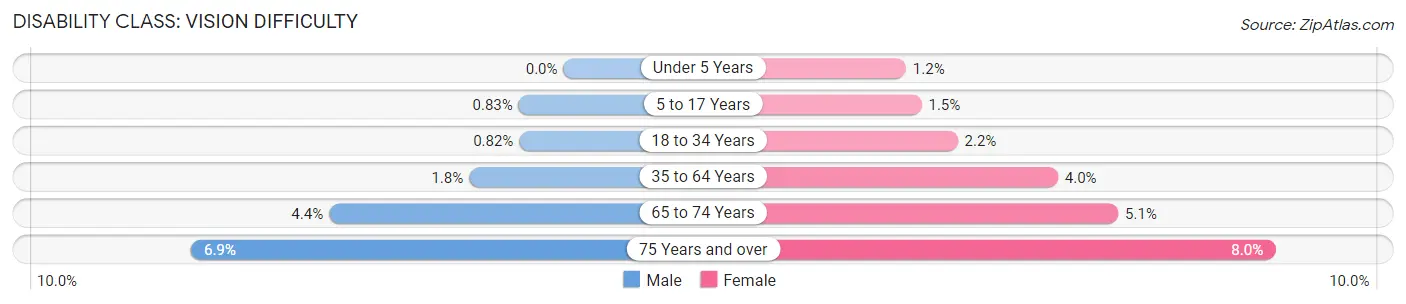
| Age Bracket | Male | Female |
| Under 5 Years | 0 (0.0%) | 22 (1.2%) |
| 5 to 17 Years | 39 (0.8%) | 75 (1.5%) |
| 18 to 34 Years | 105 (0.8%) | 243 (2.1%) |
| 35 to 64 Years | 213 (1.8%) | 514 (4.0%) |
| 65 to 74 Years | 143 (4.3%) | 211 (5.1%) |
| 75 Years and over | 149 (6.9%) | 299 (8.0%) |
Disability Class: Cognitive Difficulty
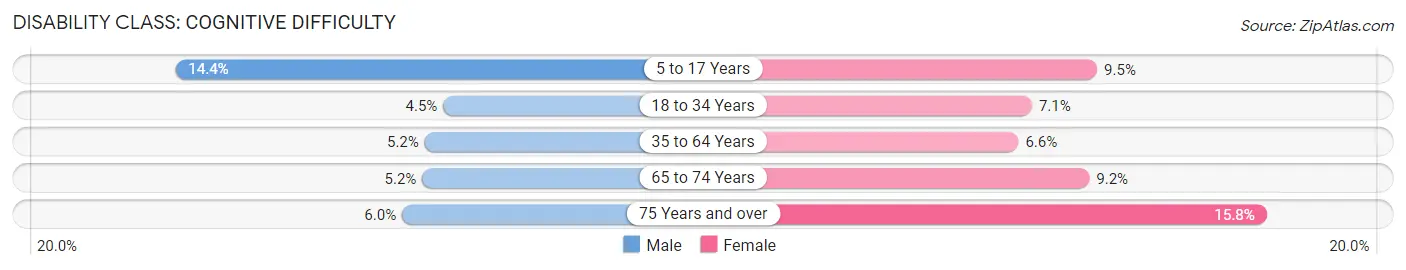
| Age Bracket | Male | Female |
| 5 to 17 Years | 675 (14.4%) | 480 (9.5%) |
| 18 to 34 Years | 568 (4.5%) | 797 (7.1%) |
| 35 to 64 Years | 627 (5.1%) | 840 (6.6%) |
| 65 to 74 Years | 172 (5.2%) | 378 (9.2%) |
| 75 Years and over | 129 (6.0%) | 586 (15.8%) |
Disability Class: Ambulatory Difficulty
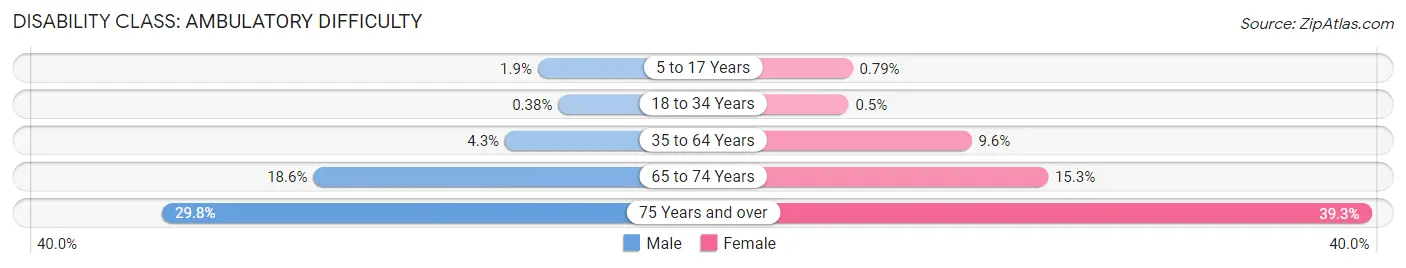
| Age Bracket | Male | Female |
| 5 to 17 Years | 89 (1.9%) | 40 (0.8%) |
| 18 to 34 Years | 49 (0.4%) | 57 (0.5%) |
| 35 to 64 Years | 529 (4.3%) | 1,233 (9.6%) |
| 65 to 74 Years | 610 (18.6%) | 630 (15.3%) |
| 75 Years and over | 642 (29.8%) | 1,461 (39.3%) |
Disability Class: Self-Care Difficulty
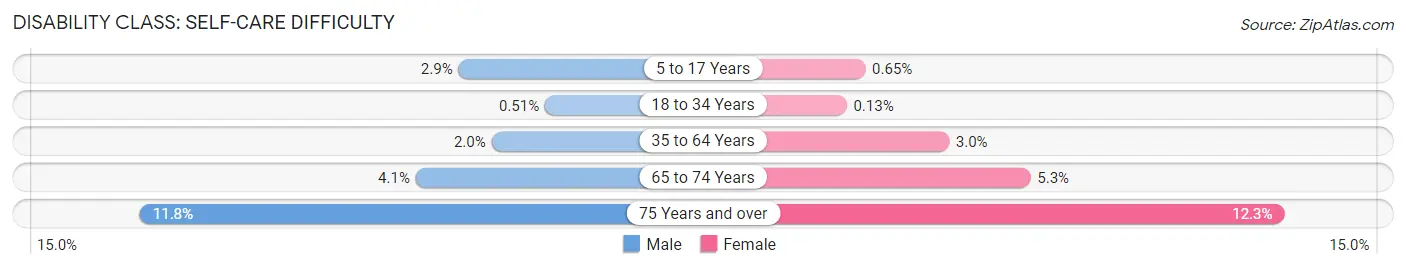
| Age Bracket | Male | Female |
| 5 to 17 Years | 137 (2.9%) | 33 (0.6%) |
| 18 to 34 Years | 65 (0.5%) | 15 (0.1%) |
| 35 to 64 Years | 244 (2.0%) | 382 (3.0%) |
| 65 to 74 Years | 135 (4.1%) | 216 (5.2%) |
| 75 Years and over | 254 (11.8%) | 458 (12.3%) |
Technology Access in Bethlehem
Computing Device Access in Bethlehem
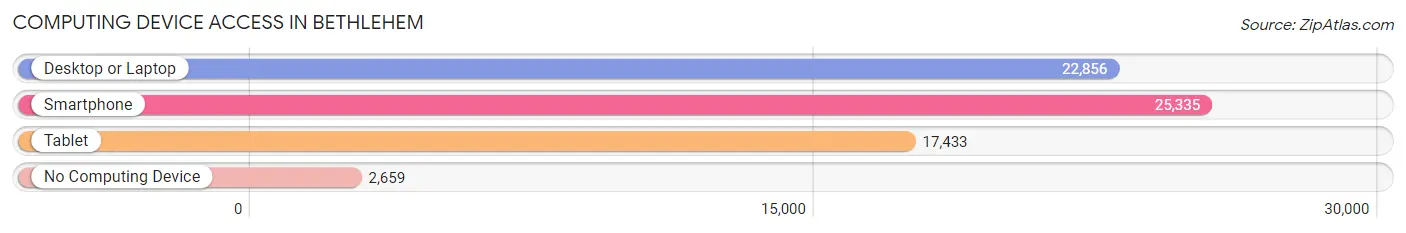
| Device Type | # Households | % Households |
| Desktop or Laptop | 22,856 | 75.8% |
| Smartphone | 25,335 | 84.0% |
| Tablet | 17,433 | 57.8% |
| No Computing Device | 2,659 | 8.8% |
| Total | 30,162 | 100.0% |
Internet Access in Bethlehem
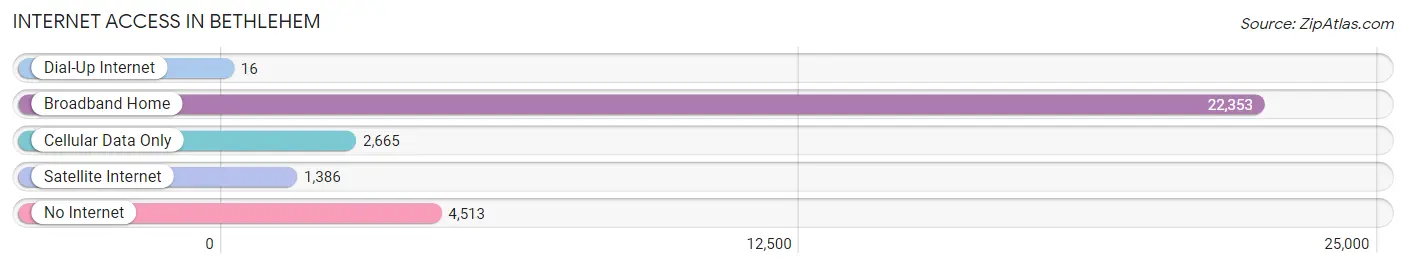
| Internet Type | # Households | % Households |
| Dial-Up Internet | 16 | 0.1% |
| Broadband Home | 22,353 | 74.1% |
| Cellular Data Only | 2,665 | 8.8% |
| Satellite Internet | 1,386 | 4.6% |
| No Internet | 4,513 | 15.0% |
| Total | 30,162 | 100.0% |
Bethlehem Summary
Bethlehem, Pennsylvania is a city located in Northampton County in the Lehigh Valley region of the state. It is the seventh-largest city in Pennsylvania and the largest city in the Lehigh Valley. Bethlehem is located approximately 70 miles north of Philadelphia and 70 miles west of New York City. The city is situated on the Lehigh River and is home to Lehigh University and Moravian College.
History
Bethlehem was founded in 1741 by Moravian settlers from Germany. The city was named after the Biblical town of Bethlehem, which is located in the West Bank. The Moravians were a religious group that had been persecuted in their homeland and sought refuge in the New World. The Moravians established a settlement in Bethlehem and built a church, a school, and a gristmill. The settlement quickly grew and by 1762, Bethlehem had become the largest town in Northampton County.
In the 19th century, Bethlehem became an important industrial center. The city was home to several iron and steel mills, as well as a large shipbuilding industry. Bethlehem Steel, which was founded in 1904, was the largest steel producer in the United States for much of the 20th century. The city also became a major center for the production of silk and other textiles.
Geography
Bethlehem is located in the Lehigh Valley region of Pennsylvania. The city is situated on the Lehigh River and is surrounded by rolling hills and farmland. The city has a total area of 10.3 square miles, of which 10.2 square miles is land and 0.1 square miles is water.
Economy
Bethlehem is a major industrial center in the Lehigh Valley region. The city is home to several large companies, including Air Products and Chemicals, Olympus Corporation, and B. Braun Medical. Bethlehem is also home to several large manufacturing companies, including Bethlehem Steel, which was the largest steel producer in the United States for much of the 20th century.
The city is also home to several large educational institutions, including Lehigh University and Moravian College. These institutions are major employers in the city and contribute significantly to the local economy.
Demographics
As of the 2010 census, Bethlehem had a population of 74,982. The city has a population density of 7,300 people per square mile. The racial makeup of the city is 79.2% White, 11.3% African American, 0.3% Native American, 2.3% Asian, and 6.9% from other races.
The median household income in Bethlehem is $45,945, and the median family income is $58,945. The city has a poverty rate of 16.3%. The largest employers in the city are Lehigh University, St. Luke's University Health Network, and Air Products and Chemicals.
Common Questions
What is Per Capita Income in Bethlehem?
Per Capita income in Bethlehem is $38,313.
What is the Median Family Income in Bethlehem?
Median Family Income in Bethlehem is $76,937.
What is the Median Household income in Bethlehem?
Median Household Income in Bethlehem is $62,072.
What is Income or Wage Gap in Bethlehem?
Income or Wage Gap in Bethlehem is 20.8%.
Women in Bethlehem earn 79.2 cents for every dollar earned by a man.
What is Family Income Deficit in Bethlehem?
Family Income Deficit in Bethlehem is $9,782.
Families that are below poverty line in Bethlehem earn $9,782 less on average than the poverty threshold level.
What is Inequality or Gini Index in Bethlehem?
Inequality or Gini Index in Bethlehem is 0.49.
What is the Total Population of Bethlehem?
Total Population of Bethlehem is 76,555.
What is the Total Male Population of Bethlehem?
Total Male Population of Bethlehem is 37,062.
What is the Total Female Population of Bethlehem?
Total Female Population of Bethlehem is 39,493.
What is the Ratio of Males per 100 Females in Bethlehem?
There are 93.84 Males per 100 Females in Bethlehem.
What is the Ratio of Females per 100 Males in Bethlehem?
There are 106.56 Females per 100 Males in Bethlehem.
What is the Median Population Age in Bethlehem?
Median Population Age in Bethlehem is 35.9 Years.
What is the Average Family Size in Bethlehem
Average Family Size in Bethlehem is 3.0 People.
What is the Average Household Size in Bethlehem
Average Household Size in Bethlehem is 2.3 People.
How Large is the Labor Force in Bethlehem?
There are 38,410 People in the Labor Forcein in Bethlehem.
What is the Percentage of People in the Labor Force in Bethlehem?
59.4% of People are in the Labor Force in Bethlehem.
What is the Unemployment Rate in Bethlehem?
Unemployment Rate in Bethlehem is 5.6%.