Pleasant Hill, PA Map & Demographics
Pleasant Hill Map
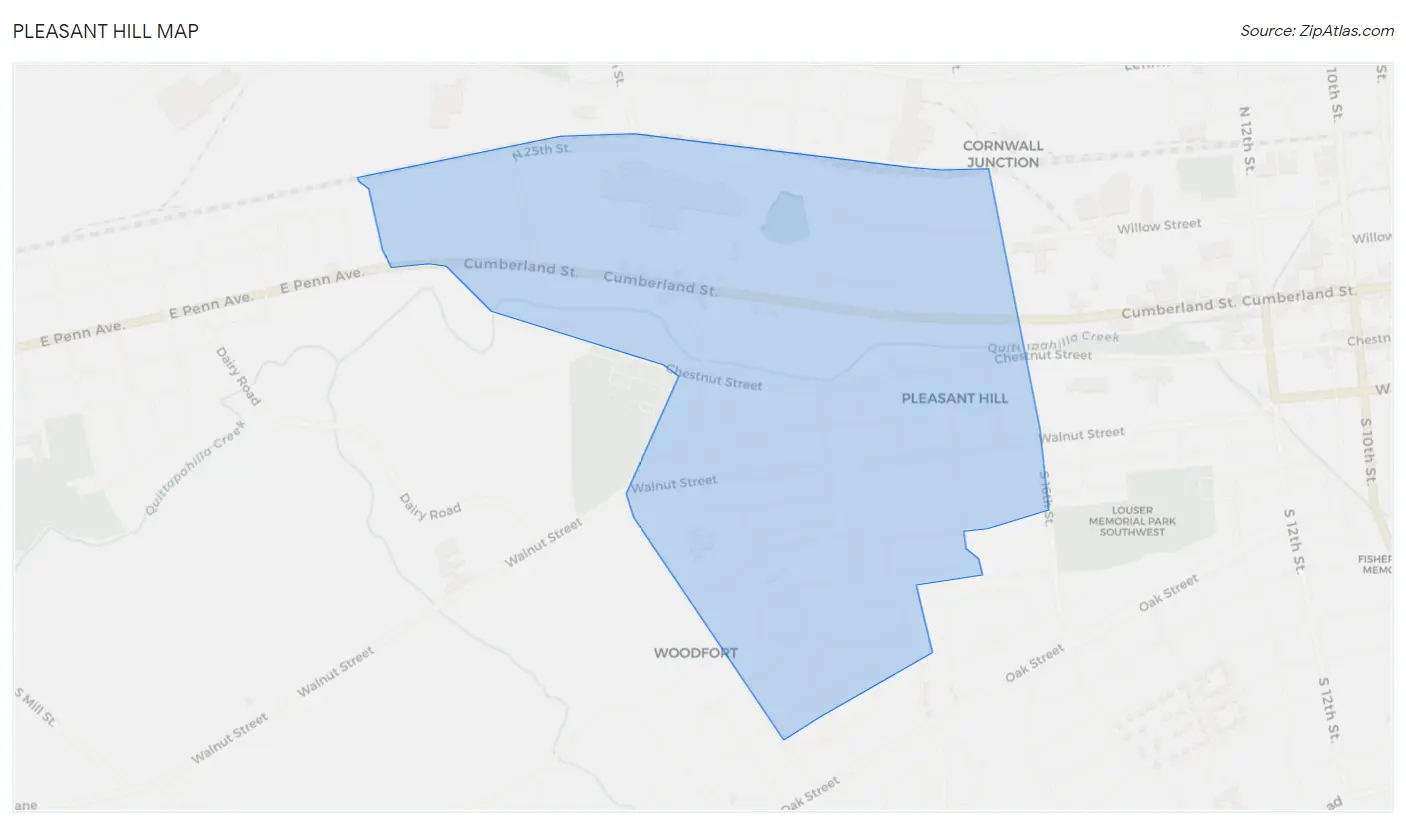
Pleasant Hill Overview
$26,465
PER CAPITA INCOME
$58,446
AVG FAMILY INCOME
$58,366
AVG HOUSEHOLD INCOME
26.1%
WAGE / INCOME GAP [ % ]
73.9¢/ $1
WAGE / INCOME GAP [ $ ]
$23,836
FAMILY INCOME DEFICIT
0.39
INEQUALITY / GINI INDEX
3,263
TOTAL POPULATION
1,607
MALE POPULATION
1,656
FEMALE POPULATION
97.04
MALES / 100 FEMALES
103.05
FEMALES / 100 MALES
33.8
MEDIAN AGE
3.1
AVG FAMILY SIZE
2.8
AVG HOUSEHOLD SIZE
1,718
LABOR FORCE [ PEOPLE ]
72.3%
PERCENT IN LABOR FORCE
19.7%
UNEMPLOYMENT RATE
Income in Pleasant Hill
Income Overview in Pleasant Hill
Per Capita Income in Pleasant Hill is $26,465, while median incomes of families and households are $58,446 and $58,366 respectively.
| Characteristic | Number | Measure |
| Per Capita Income | 3,263 | $26,465 |
| Median Family Income | 819 | $58,446 |
| Mean Family Income | 819 | $69,745 |
| Median Household Income | 1,163 | $58,366 |
| Mean Household Income | 1,163 | $71,655 |
| Income Deficit | 819 | $23,836 |
| Wage / Income Gap (%) | 3,263 | 26.13% |
| Wage / Income Gap ($) | 3,263 | 73.87¢ per $1 |
| Gini / Inequality Index | 3,263 | 0.39 |
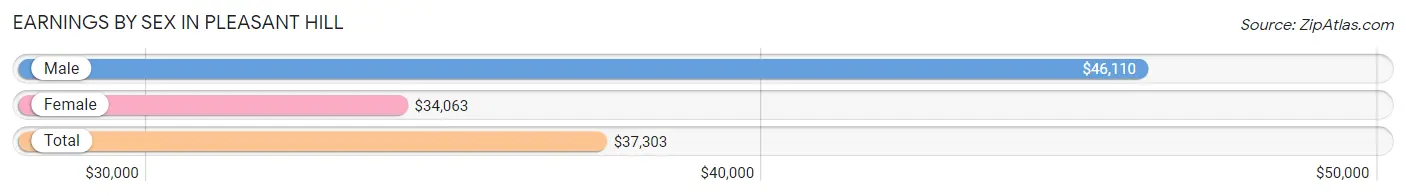
Earnings by Sex in Pleasant Hill
Average Earnings in Pleasant Hill are $37,303, $46,110 for men and $34,063 for women, a difference of 26.1%.
| Sex | Number | Average Earnings |
| Male | 901 (55.4%) | $46,110 |
| Female | 726 (44.6%) | $34,063 |
| Total | 1,627 (100.0%) | $37,303 |
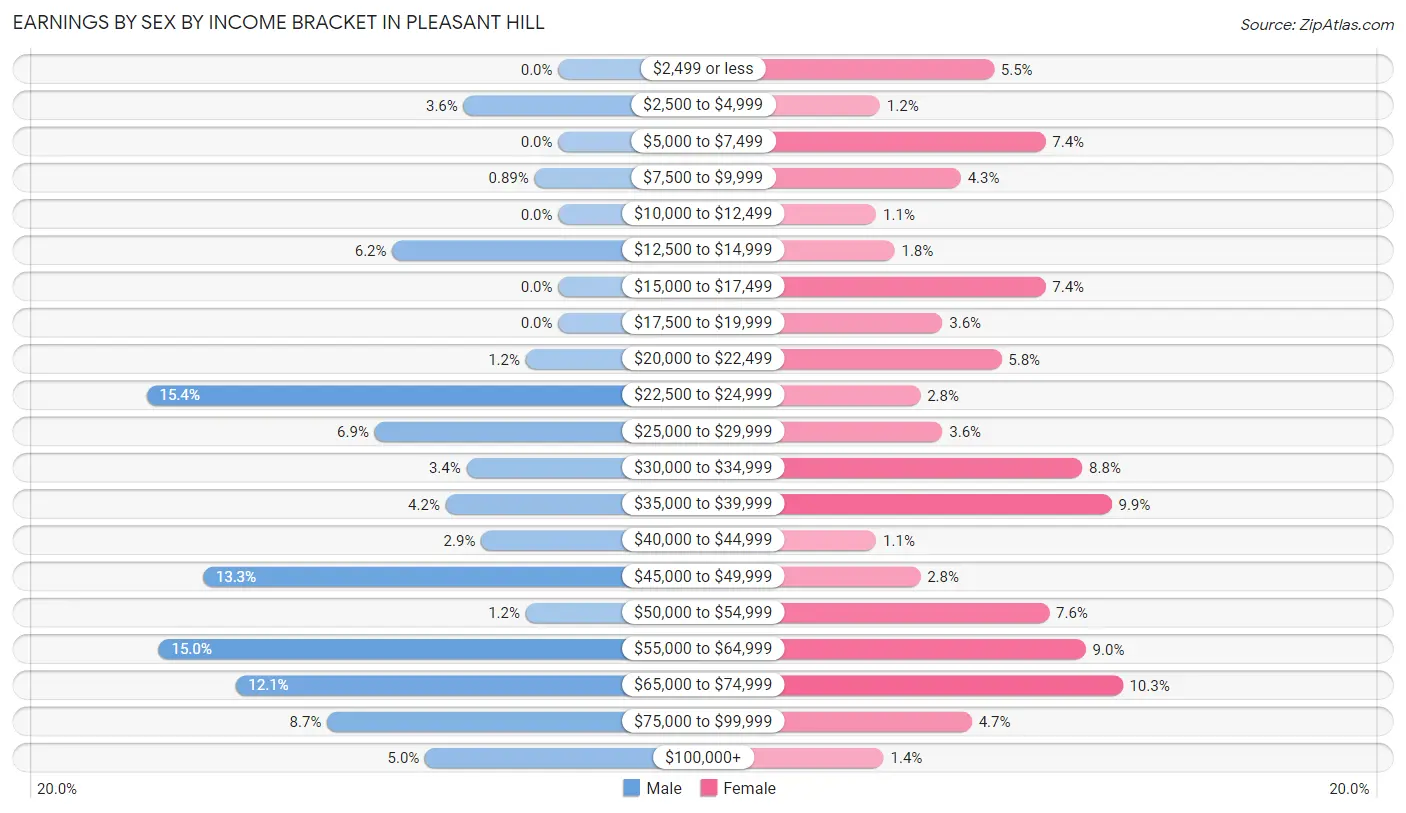
Earnings by Sex by Income Bracket in Pleasant Hill
The most common earnings brackets in Pleasant Hill are $22,500 to $24,999 for men (139 | 15.4%) and $65,000 to $74,999 for women (75 | 10.3%).
| Income | Male | Female |
| $2,499 or less | 0 (0.0%) | 40 (5.5%) |
| $2,500 to $4,999 | 32 (3.5%) | 9 (1.2%) |
| $5,000 to $7,499 | 0 (0.0%) | 54 (7.4%) |
| $7,500 to $9,999 | 8 (0.9%) | 31 (4.3%) |
| $10,000 to $12,499 | 0 (0.0%) | 8 (1.1%) |
| $12,500 to $14,999 | 56 (6.2%) | 13 (1.8%) |
| $15,000 to $17,499 | 0 (0.0%) | 54 (7.4%) |
| $17,500 to $19,999 | 0 (0.0%) | 26 (3.6%) |
| $20,000 to $22,499 | 11 (1.2%) | 42 (5.8%) |
| $22,500 to $24,999 | 139 (15.4%) | 20 (2.8%) |
| $25,000 to $29,999 | 62 (6.9%) | 26 (3.6%) |
| $30,000 to $34,999 | 31 (3.4%) | 64 (8.8%) |
| $35,000 to $39,999 | 38 (4.2%) | 72 (9.9%) |
| $40,000 to $44,999 | 26 (2.9%) | 8 (1.1%) |
| $45,000 to $49,999 | 120 (13.3%) | 20 (2.8%) |
| $50,000 to $54,999 | 11 (1.2%) | 55 (7.6%) |
| $55,000 to $64,999 | 135 (15.0%) | 65 (8.9%) |
| $65,000 to $74,999 | 109 (12.1%) | 75 (10.3%) |
| $75,000 to $99,999 | 78 (8.7%) | 34 (4.7%) |
| $100,000+ | 45 (5.0%) | 10 (1.4%) |
| Total | 901 (100.0%) | 726 (100.0%) |
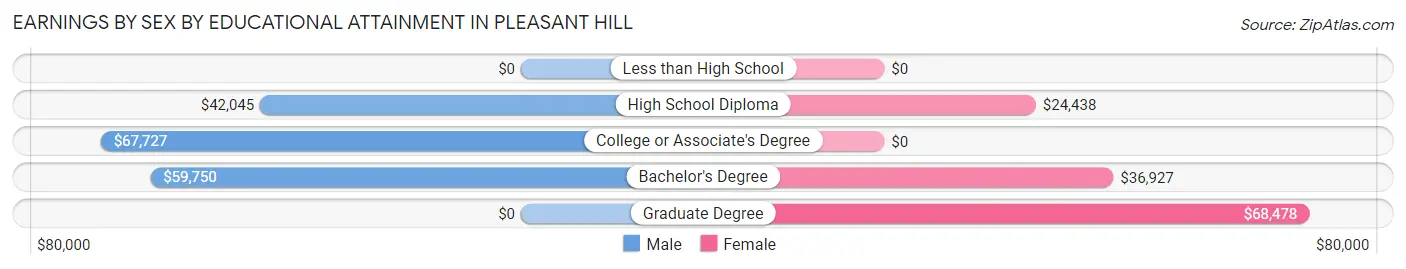
Earnings by Sex by Educational Attainment in Pleasant Hill
Average earnings in Pleasant Hill are $57,564 for men and $34,883 for women, a difference of 39.4%. Men with an educational attainment of college or associate's degree enjoy the highest average annual earnings of $67,727, while those with high school diploma education earn the least with $42,045. Women with an educational attainment of graduate degree earn the most with the average annual earnings of $68,478, while those with high school diploma education have the smallest earnings of $24,438.
| Educational Attainment | Male Income | Female Income |
| Less than High School | - | - |
| High School Diploma | $42,045 | $24,438 |
| College or Associate's Degree | $67,727 | $0 |
| Bachelor's Degree | $59,750 | $36,927 |
| Graduate Degree | - | - |
| Total | $57,564 | $34,883 |
Family Income in Pleasant Hill
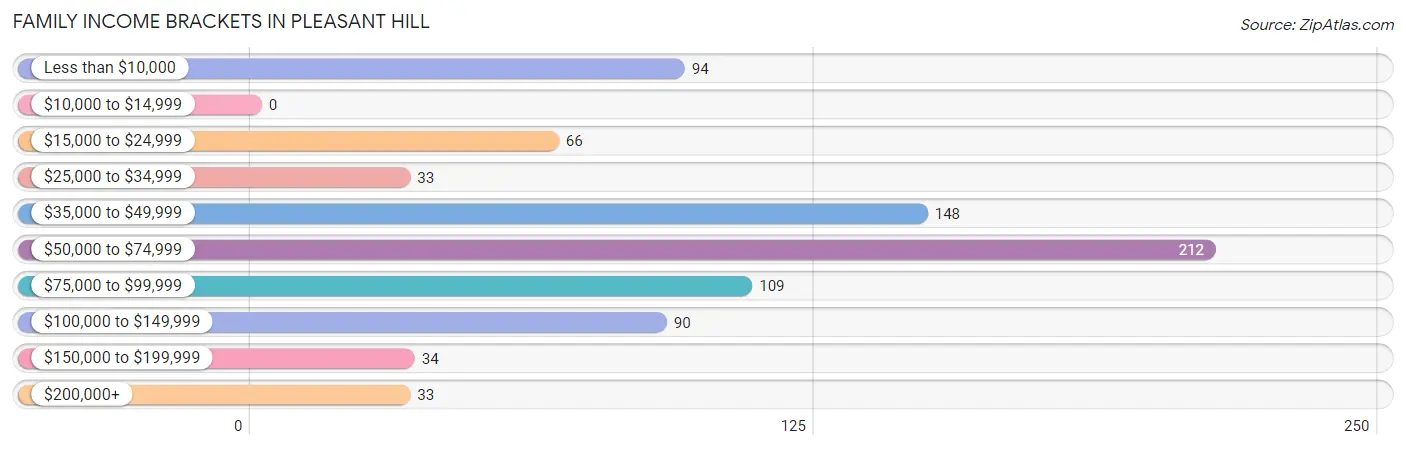
Family Income Brackets in Pleasant Hill
According to the Pleasant Hill family income data, there are 212 families falling into the $50,000 to $74,999 income range, which is the most common income bracket and makes up 25.9% of all families.
| Income Bracket | # Families | % Families |
| Less than $10,000 | 94 | 11.5% |
| $10,000 to $14,999 | 0 | 0.0% |
| $15,000 to $24,999 | 66 | 8.1% |
| $25,000 to $34,999 | 33 | 4.0% |
| $35,000 to $49,999 | 148 | 18.1% |
| $50,000 to $74,999 | 212 | 25.9% |
| $75,000 to $99,999 | 109 | 13.3% |
| $100,000 to $149,999 | 90 | 11.0% |
| $150,000 to $199,999 | 34 | 4.2% |
| $200,000+ | 33 | 4.0% |
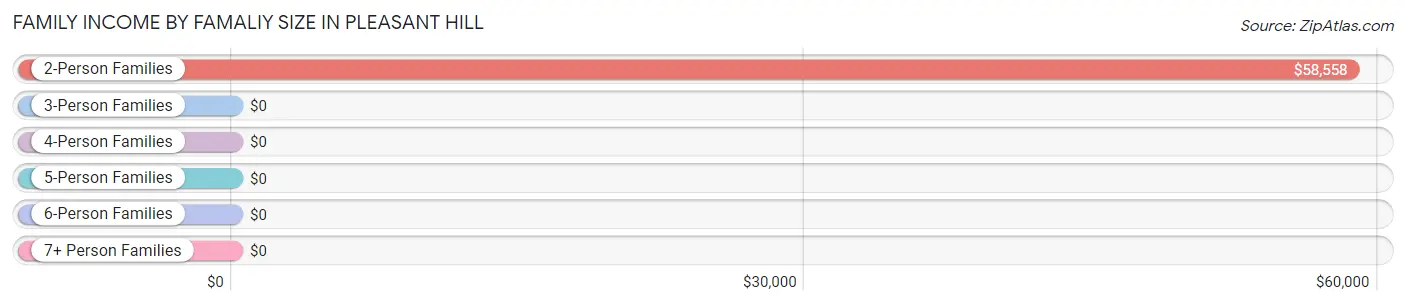
Family Income by Famaliy Size in Pleasant Hill
2-person families (475 | 58.0%) account for the highest median family income in Pleasant Hill with $58,558 per family, while 2-person families (475 | 58.0%) have the highest median income of $29,279 per family member.
| Income Bracket | # Families | Median Income |
| 2-Person Families | 475 (58.0%) | $58,558 |
| 3-Person Families | 170 (20.8%) | $0 |
| 4-Person Families | 66 (8.1%) | $0 |
| 5-Person Families | 94 (11.5%) | $0 |
| 6-Person Families | 14 (1.7%) | $0 |
| 7+ Person Families | 0 (0.0%) | $0 |
| Total | 819 (100.0%) | $58,446 |
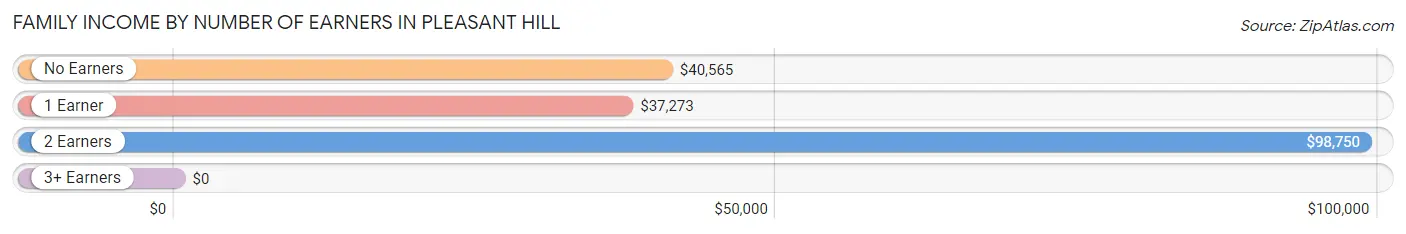
Family Income by Number of Earners in Pleasant Hill
| Number of Earners | # Families | Median Income |
| No Earners | 141 (17.2%) | $40,565 |
| 1 Earner | 422 (51.5%) | $37,273 |
| 2 Earners | 188 (23.0%) | $98,750 |
| 3+ Earners | 68 (8.3%) | $0 |
| Total | 819 (100.0%) | $58,446 |
Household Income in Pleasant Hill
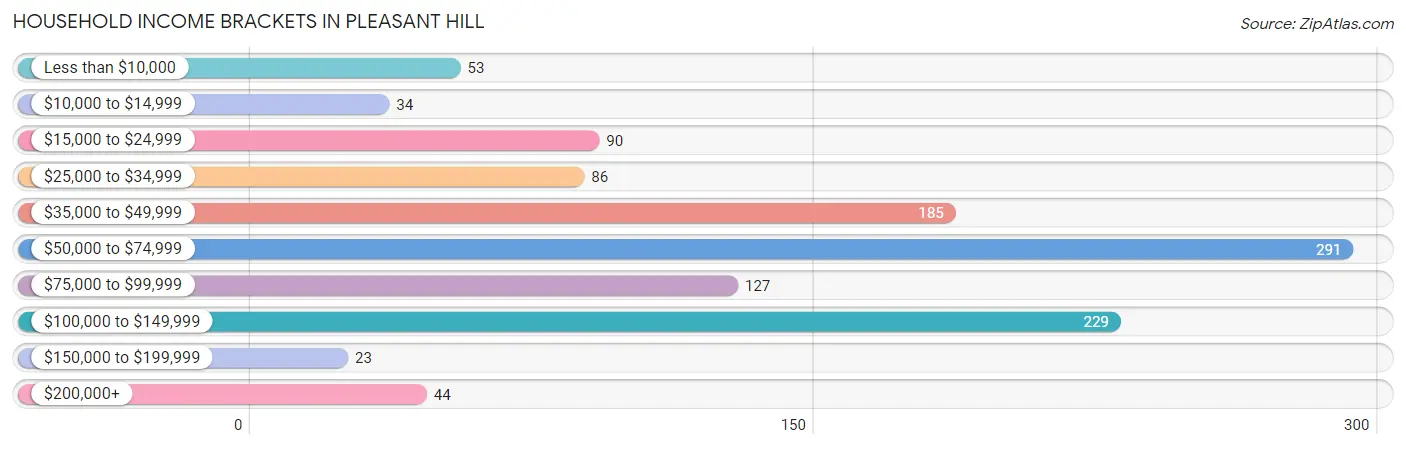
Household Income Brackets in Pleasant Hill
With 291 households falling in the category, the $50,000 to $74,999 income range is the most frequent in Pleasant Hill, accounting for 25.0% of all households. In contrast, only 23 households (2.0%) fall into the $150,000 to $199,999 income bracket, making it the least populous group.
| Income Bracket | # Households | % Households |
| Less than $10,000 | 53 | 4.6% |
| $10,000 to $14,999 | 34 | 2.9% |
| $15,000 to $24,999 | 90 | 7.7% |
| $25,000 to $34,999 | 86 | 7.4% |
| $35,000 to $49,999 | 185 | 15.9% |
| $50,000 to $74,999 | 291 | 25.0% |
| $75,000 to $99,999 | 127 | 10.9% |
| $100,000 to $149,999 | 229 | 19.7% |
| $150,000 to $199,999 | 23 | 2.0% |
| $200,000+ | 44 | 3.8% |
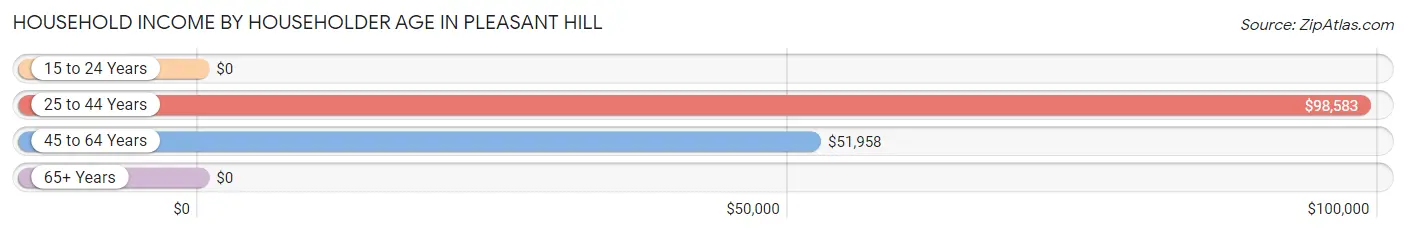
Household Income by Householder Age in Pleasant Hill
The median household income in Pleasant Hill is $58,366, with the highest median household income of $98,583 found in the 25 to 44 years age bracket for the primary householder. A total of 446 households (38.4%) fall into this category. Meanwhile, the 15 to 24 years age bracket for the primary householder has the lowest median household income of $0, with 16 households (1.4%) in this group.
| Income Bracket | # Households | Median Income |
| 15 to 24 Years | 16 (1.4%) | $0 |
| 25 to 44 Years | 446 (38.4%) | $98,583 |
| 45 to 64 Years | 536 (46.1%) | $51,958 |
| 65+ Years | 165 (14.2%) | $0 |
| Total | 1,163 (100.0%) | $58,366 |
Poverty in Pleasant Hill
Income Below Poverty by Sex and Age in Pleasant Hill
With 18.8% poverty level for males and 21.4% for females among the residents of Pleasant Hill, under 5 year old males and 5 year old females are the most vulnerable to poverty, with 161 males (85.6%) and 27 females (100.0%) in their respective age groups living below the poverty level.
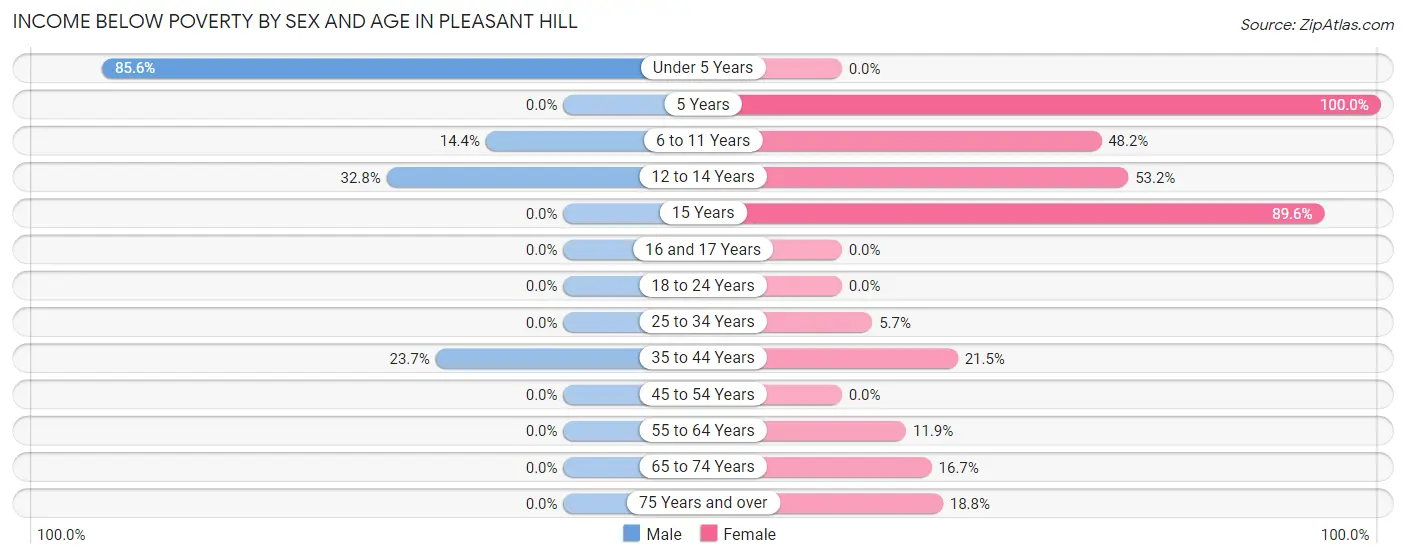
| Age Bracket | Male | Female |
| Under 5 Years | 161 (85.6%) | 0 (0.0%) |
| 5 Years | 0 (0.0%) | 27 (100.0%) |
| 6 to 11 Years | 19 (14.4%) | 39 (48.1%) |
| 12 to 14 Years | 43 (32.8%) | 101 (53.2%) |
| 15 Years | 0 (0.0%) | 60 (89.5%) |
| 16 and 17 Years | 0 (0.0%) | 0 (0.0%) |
| 18 to 24 Years | 0 (0.0%) | 0 (0.0%) |
| 25 to 34 Years | 0 (0.0%) | 13 (5.7%) |
| 35 to 44 Years | 74 (23.7%) | 54 (21.5%) |
| 45 to 54 Years | 0 (0.0%) | 0 (0.0%) |
| 55 to 64 Years | 0 (0.0%) | 36 (11.9%) |
| 65 to 74 Years | 0 (0.0%) | 10 (16.7%) |
| 75 Years and over | 0 (0.0%) | 15 (18.8%) |
| Total | 297 (18.8%) | 355 (21.4%) |
Income Above Poverty by Sex and Age in Pleasant Hill
According to the poverty statistics in Pleasant Hill, males aged 16 and 17 years and females aged under 5 years are the age groups that are most secure financially, with 100.0% of males and 100.0% of females in these age groups living above the poverty line.
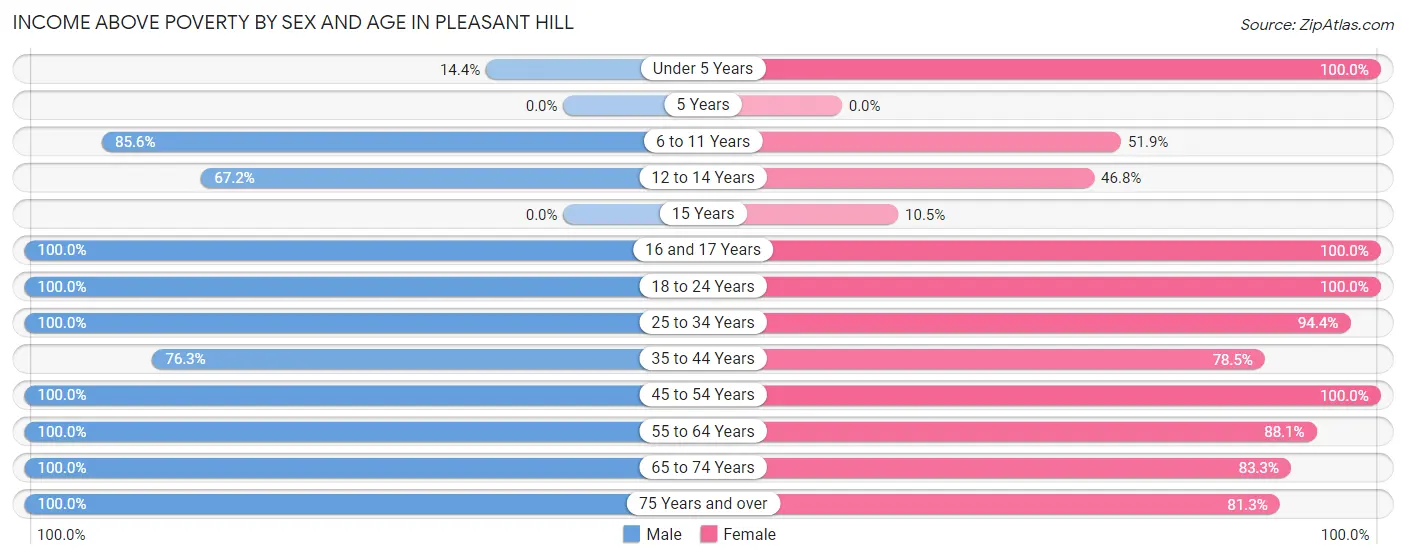
| Age Bracket | Male | Female |
| Under 5 Years | 27 (14.4%) | 45 (100.0%) |
| 5 Years | 0 (0.0%) | 0 (0.0%) |
| 6 to 11 Years | 113 (85.6%) | 42 (51.8%) |
| 12 to 14 Years | 88 (67.2%) | 89 (46.8%) |
| 15 Years | 0 (0.0%) | 7 (10.4%) |
| 16 and 17 Years | 24 (100.0%) | 8 (100.0%) |
| 18 to 24 Years | 299 (100.0%) | 123 (100.0%) |
| 25 to 34 Years | 113 (100.0%) | 217 (94.4%) |
| 35 to 44 Years | 238 (76.3%) | 197 (78.5%) |
| 45 to 54 Years | 129 (100.0%) | 192 (100.0%) |
| 55 to 64 Years | 184 (100.0%) | 266 (88.1%) |
| 65 to 74 Years | 53 (100.0%) | 50 (83.3%) |
| 75 Years and over | 16 (100.0%) | 65 (81.2%) |
| Total | 1,284 (81.2%) | 1,301 (78.6%) |
Income Below Poverty Among Married-Couple Families in Pleasant Hill
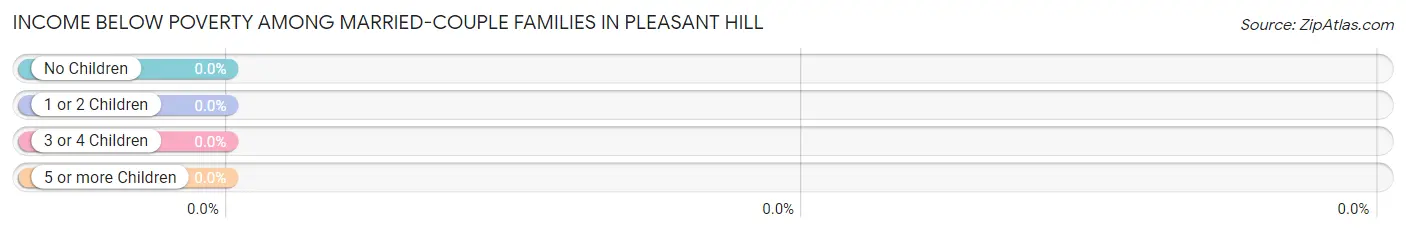
| Children | Above Poverty | Below Poverty |
| No Children | 281 (100.0%) | 0 (0.0%) |
| 1 or 2 Children | 85 (100.0%) | 0 (0.0%) |
| 3 or 4 Children | 57 (100.0%) | 0 (0.0%) |
| 5 or more Children | 0 (0.0%) | 0 (0.0%) |
| Total | 423 (100.0%) | 0 (0.0%) |
Income Below Poverty Among Single-Parent Households in Pleasant Hill
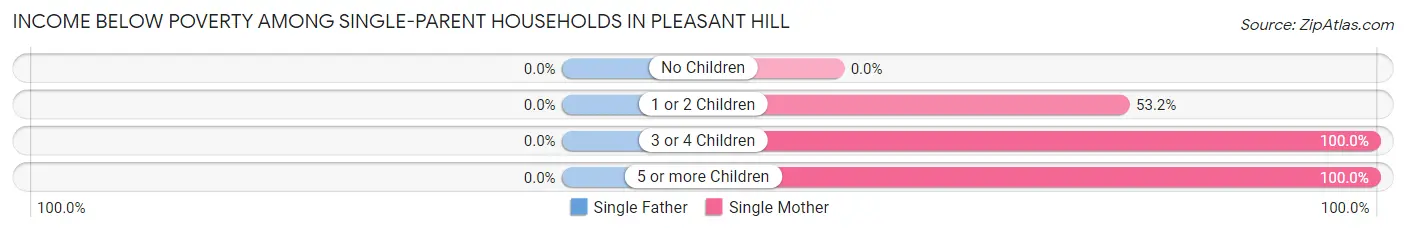
| Children | Single Father | Single Mother |
| No Children | 0 (0.0%) | 0 (0.0%) |
| 1 or 2 Children | 0 (0.0%) | 67 (53.2%) |
| 3 or 4 Children | 0 (0.0%) | 13 (100.0%) |
| 5 or more Children | 0 (0.0%) | 14 (100.0%) |
| Total | 0 (0.0%) | 94 (29.2%) |
Income Below Poverty Among Married-Couple vs Single-Parent Households in Pleasant Hill
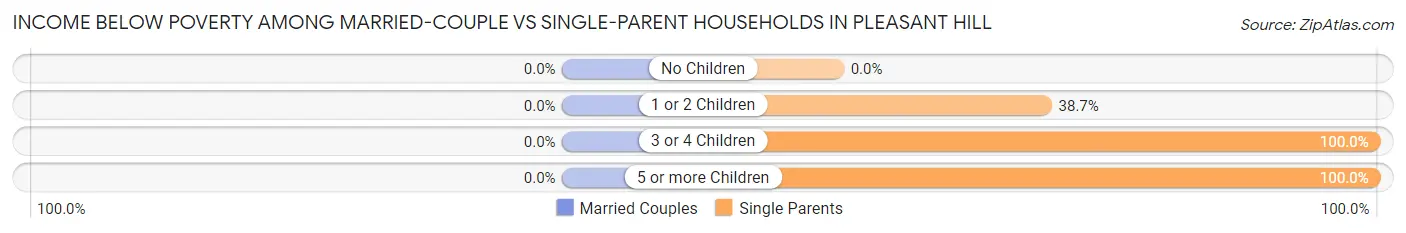
| Children | Married-Couple Families | Single-Parent Households |
| No Children | 0 (0.0%) | 0 (0.0%) |
| 1 or 2 Children | 0 (0.0%) | 67 (38.7%) |
| 3 or 4 Children | 0 (0.0%) | 13 (100.0%) |
| 5 or more Children | 0 (0.0%) | 14 (100.0%) |
| Total | 0 (0.0%) | 94 (23.7%) |
Race in Pleasant Hill
The most populous races in Pleasant Hill are White / Caucasian (2,038 | 62.5%), Hispanic or Latino (1,000 | 30.6%), and Two or more Races (681 | 20.9%).
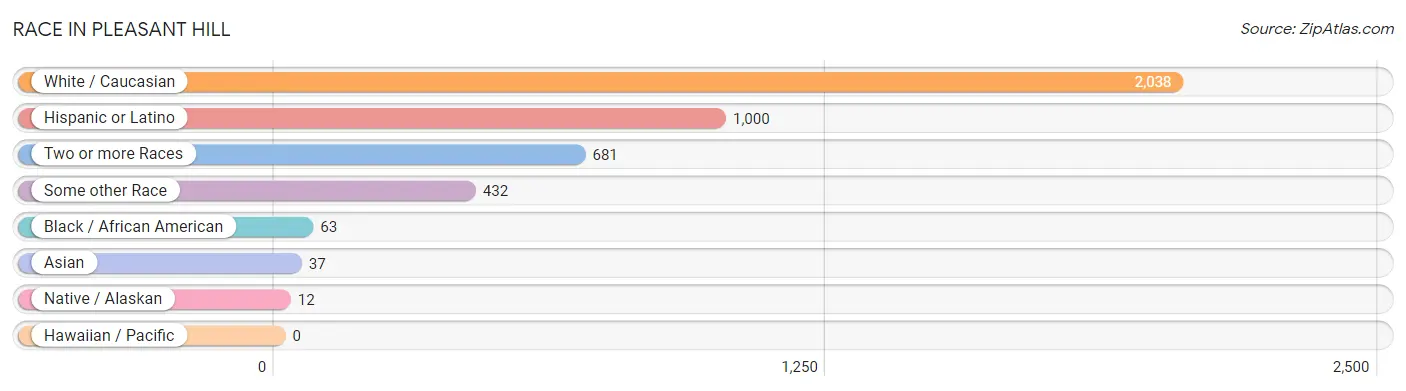
| Race | # Population | % Population |
| Asian | 37 | 1.1% |
| Black / African American | 63 | 1.9% |
| Hawaiian / Pacific | 0 | 0.0% |
| Hispanic or Latino | 1,000 | 30.6% |
| Native / Alaskan | 12 | 0.4% |
| White / Caucasian | 2,038 | 62.5% |
| Two or more Races | 681 | 20.9% |
| Some other Race | 432 | 13.2% |
| Total | 3,263 | 100.0% |
Ancestry in Pleasant Hill
The most populous ancestries reported in Pleasant Hill are German (994 | 30.5%), Puerto Rican (857 | 26.3%), American (508 | 15.6%), Italian (244 | 7.5%), and Irish (195 | 6.0%), together accounting for 85.7% of all Pleasant Hill residents.
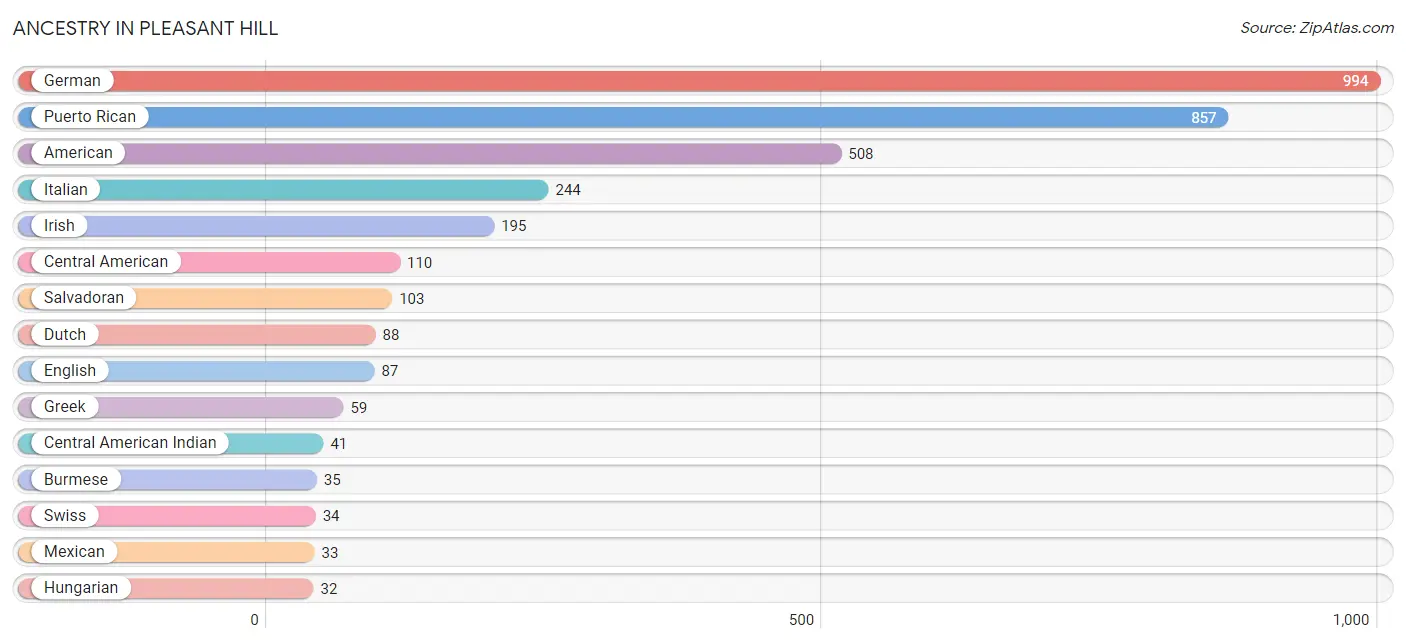
| Ancestry | # Population | % Population |
| American | 508 | 15.6% |
| Brazilian | 14 | 0.4% |
| British | 11 | 0.3% |
| Burmese | 35 | 1.1% |
| Central American | 110 | 3.4% |
| Central American Indian | 41 | 1.3% |
| Czechoslovakian | 9 | 0.3% |
| Dutch | 88 | 2.7% |
| English | 87 | 2.7% |
| German | 994 | 30.5% |
| Greek | 59 | 1.8% |
| Haitian | 15 | 0.5% |
| Hungarian | 32 | 1.0% |
| Irish | 195 | 6.0% |
| Italian | 244 | 7.5% |
| Korean | 9 | 0.3% |
| Mexican | 33 | 1.0% |
| Norwegian | 9 | 0.3% |
| Panamanian | 7 | 0.2% |
| Pennsylvania German | 25 | 0.8% |
| Polish | 21 | 0.6% |
| Puerto Rican | 857 | 26.3% |
| Salvadoran | 103 | 3.2% |
| Scandinavian | 18 | 0.5% |
| Scotch-Irish | 9 | 0.3% |
| Scottish | 7 | 0.2% |
| Slovak | 8 | 0.3% |
| Swedish | 19 | 0.6% |
| Swiss | 34 | 1.0% |
| Welsh | 2 | 0.1% | View All 30 Rows |
Immigrants in Pleasant Hill
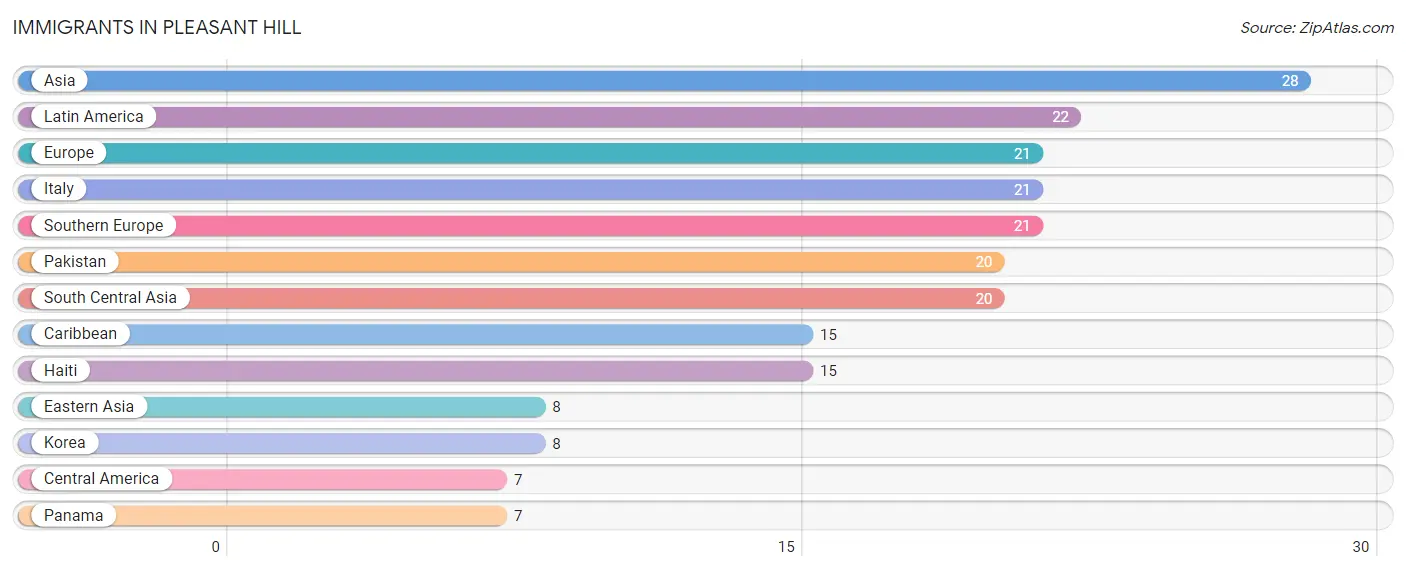
The most numerous immigrant groups reported in Pleasant Hill came from Asia (28 | 0.9%), Latin America (22 | 0.7%), Europe (21 | 0.6%), Italy (21 | 0.6%), and Southern Europe (21 | 0.6%), together accounting for 3.5% of all Pleasant Hill residents.
| Immigration Origin | # Population | % Population |
| Asia | 28 | 0.9% |
| Caribbean | 15 | 0.5% |
| Central America | 7 | 0.2% |
| Eastern Asia | 8 | 0.3% |
| Europe | 21 | 0.6% |
| Haiti | 15 | 0.5% |
| Italy | 21 | 0.6% |
| Korea | 8 | 0.3% |
| Latin America | 22 | 0.7% |
| Pakistan | 20 | 0.6% |
| Panama | 7 | 0.2% |
| South Central Asia | 20 | 0.6% |
| Southern Europe | 21 | 0.6% | View All 13 Rows |
Sex and Age in Pleasant Hill
Sex and Age in Pleasant Hill
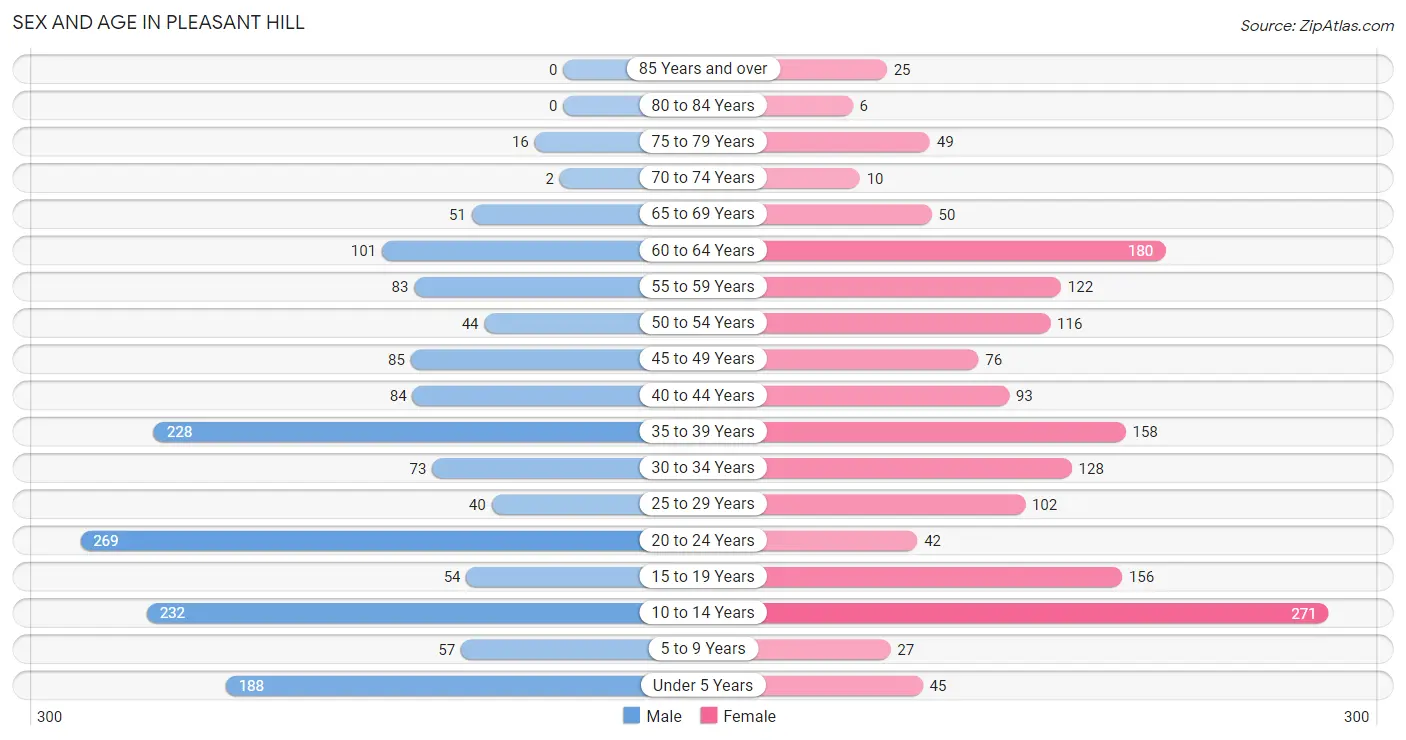
The most populous age groups in Pleasant Hill are 20 to 24 Years (269 | 16.7%) for men and 10 to 14 Years (271 | 16.4%) for women.
| Age Bracket | Male | Female |
| Under 5 Years | 188 (11.7%) | 45 (2.7%) |
| 5 to 9 Years | 57 (3.5%) | 27 (1.6%) |
| 10 to 14 Years | 232 (14.4%) | 271 (16.4%) |
| 15 to 19 Years | 54 (3.4%) | 156 (9.4%) |
| 20 to 24 Years | 269 (16.7%) | 42 (2.5%) |
| 25 to 29 Years | 40 (2.5%) | 102 (6.2%) |
| 30 to 34 Years | 73 (4.5%) | 128 (7.7%) |
| 35 to 39 Years | 228 (14.2%) | 158 (9.5%) |
| 40 to 44 Years | 84 (5.2%) | 93 (5.6%) |
| 45 to 49 Years | 85 (5.3%) | 76 (4.6%) |
| 50 to 54 Years | 44 (2.7%) | 116 (7.0%) |
| 55 to 59 Years | 83 (5.2%) | 122 (7.4%) |
| 60 to 64 Years | 101 (6.3%) | 180 (10.9%) |
| 65 to 69 Years | 51 (3.2%) | 50 (3.0%) |
| 70 to 74 Years | 2 (0.1%) | 10 (0.6%) |
| 75 to 79 Years | 16 (1.0%) | 49 (3.0%) |
| 80 to 84 Years | 0 (0.0%) | 6 (0.4%) |
| 85 Years and over | 0 (0.0%) | 25 (1.5%) |
| Total | 1,607 (100.0%) | 1,656 (100.0%) |
Families and Households in Pleasant Hill
Median Family Size in Pleasant Hill
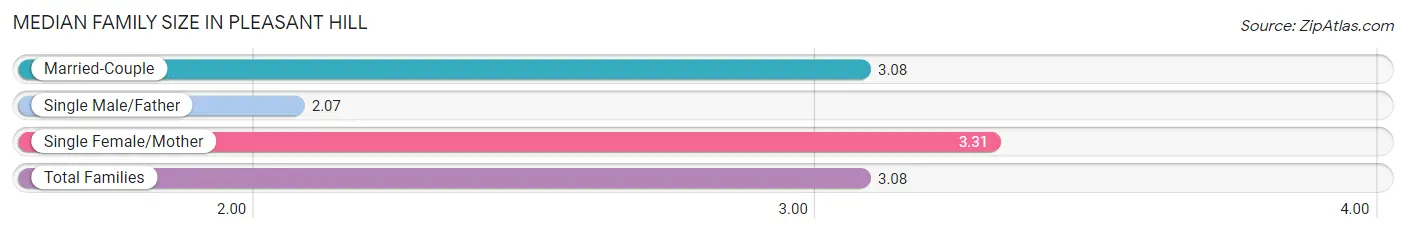
The median family size in Pleasant Hill is 3.08 persons per family, with single female/mother families (322 | 39.3%) accounting for the largest median family size of 3.31 persons per family. On the other hand, single male/father families (74 | 9.0%) represent the smallest median family size with 2.07 persons per family.
| Family Type | # Families | Family Size |
| Married-Couple | 423 (51.6%) | 3.08 |
| Single Male/Father | 74 (9.0%) | 2.07 |
| Single Female/Mother | 322 (39.3%) | 3.31 |
| Total Families | 819 (100.0%) | 3.08 |
Median Household Size in Pleasant Hill
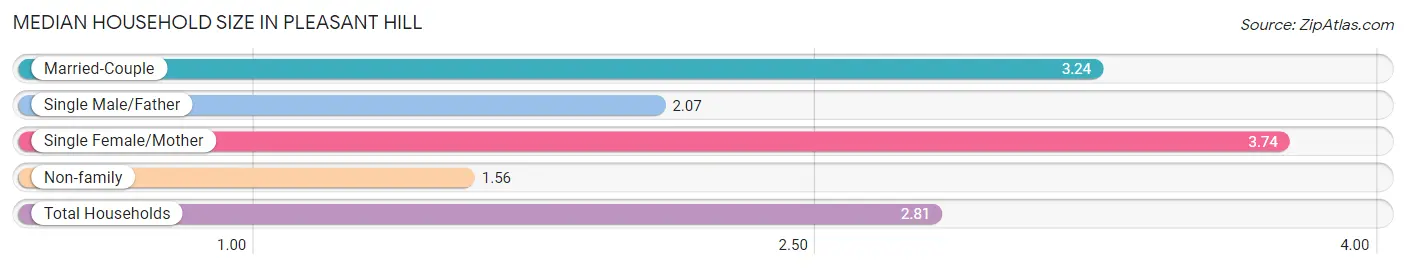
The median household size in Pleasant Hill is 2.81 persons per household, with single female/mother households (322 | 27.7%) accounting for the largest median household size of 3.74 persons per household. non-family households (344 | 29.6%) represent the smallest median household size with 1.56 persons per household.
| Household Type | # Households | Household Size |
| Married-Couple | 423 (36.4%) | 3.24 |
| Single Male/Father | 74 (6.4%) | 2.07 |
| Single Female/Mother | 322 (27.7%) | 3.74 |
| Non-family | 344 (29.6%) | 1.56 |
| Total Households | 1,163 (100.0%) | 2.81 |
Household Size by Marriage Status in Pleasant Hill
Out of a total of 1,163 households in Pleasant Hill, 819 (70.4%) are family households, while 344 (29.6%) are nonfamily households. The most numerous type of family households are 2-person households, comprising 399, and the most common type of nonfamily households are 1-person households, comprising 236.
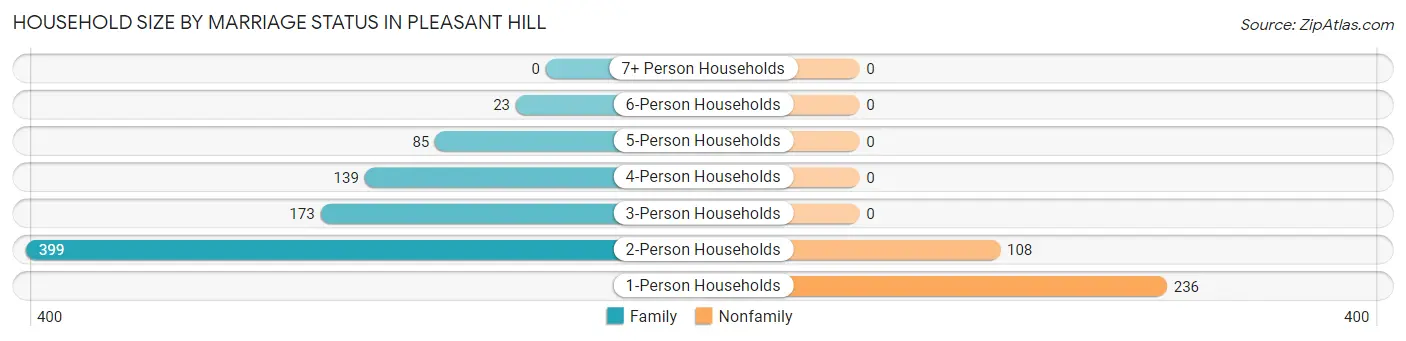
| Household Size | Family Households | Nonfamily Households |
| 1-Person Households | - | 236 (20.3%) |
| 2-Person Households | 399 (34.3%) | 108 (9.3%) |
| 3-Person Households | 173 (14.9%) | 0 (0.0%) |
| 4-Person Households | 139 (11.9%) | 0 (0.0%) |
| 5-Person Households | 85 (7.3%) | 0 (0.0%) |
| 6-Person Households | 23 (2.0%) | 0 (0.0%) |
| 7+ Person Households | 0 (0.0%) | 0 (0.0%) |
| Total | 819 (70.4%) | 344 (29.6%) |
Female Fertility in Pleasant Hill
Fertility by Age in Pleasant Hill
Average fertility rate in Pleasant Hill is 56.0 births per 1,000 women. Women in the age bracket of 35 to 50 years have the highest fertility rate with 128.0 births per 1,000 women. Women in the age bracket of 35 to 50 years acount for 100.0% of all women with births.
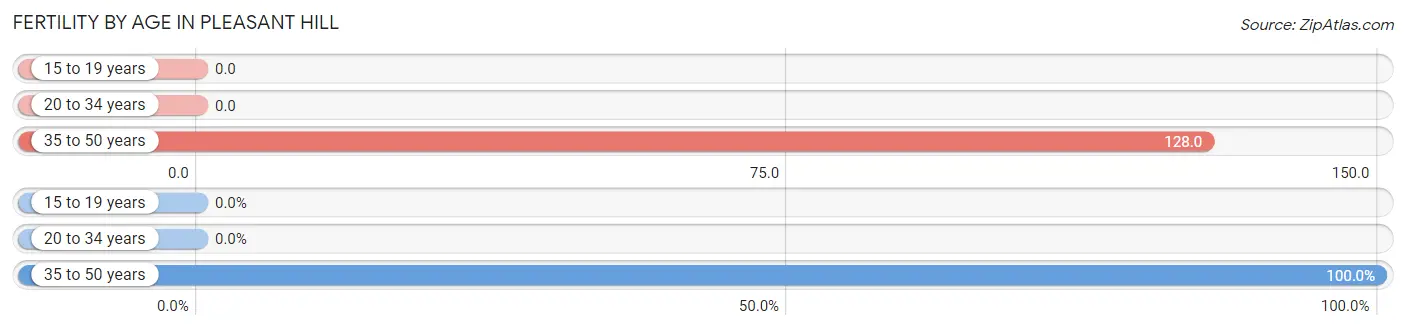
| Age Bracket | Women with Births | Births / 1,000 Women |
| 15 to 19 years | 0 (0.0%) | 0.0 |
| 20 to 34 years | 0 (0.0%) | 0.0 |
| 35 to 50 years | 42 (100.0%) | 128.0 |
| Total | 42 (100.0%) | 56.0 |
Fertility by Age by Marriage Status in Pleasant Hill
66.7% of women with births (42) in Pleasant Hill are married. The highest percentage of unmarried women with births falls into 35 to 50 years age bracket with 33.3% of them unmarried at the time of birth, while the lowest percentage of unmarried women with births belong to 35 to 50 years age bracket with 33.3% of them unmarried.
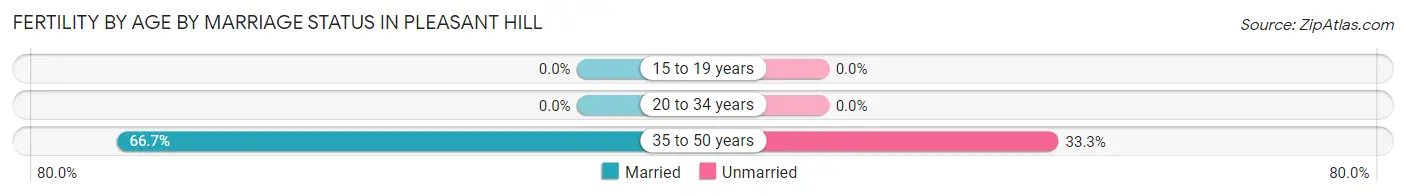
| Age Bracket | Married | Unmarried |
| 15 to 19 years | 0 (0.0%) | 0 (0.0%) |
| 20 to 34 years | 0 (0.0%) | 0 (0.0%) |
| 35 to 50 years | 28 (66.7%) | 14 (33.3%) |
| Total | 28 (66.7%) | 14 (33.3%) |
Fertility by Education in Pleasant Hill
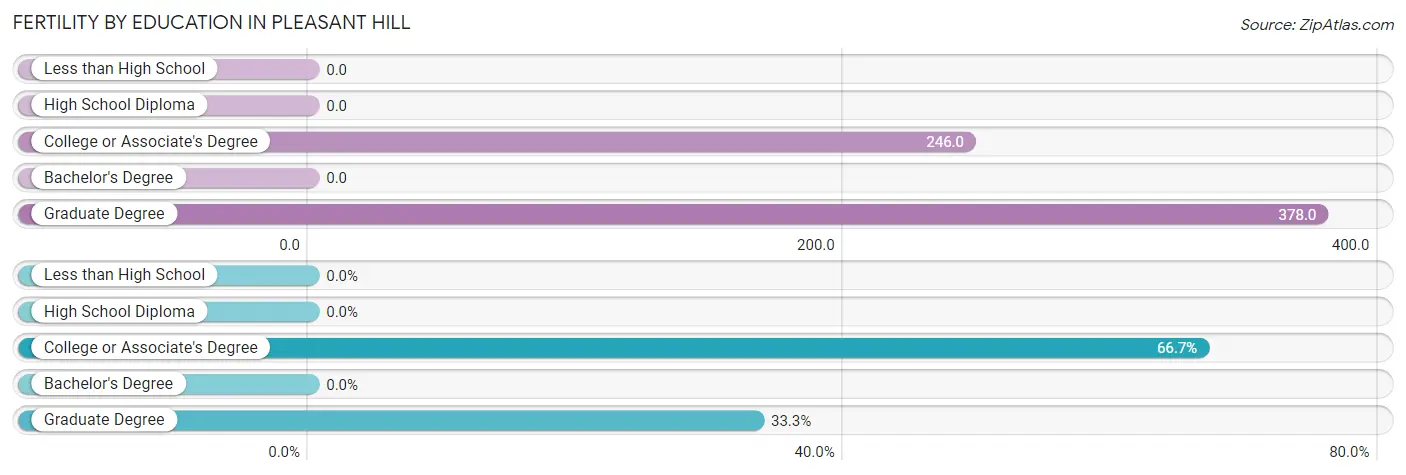
| Educational Attainment | Women with Births | Births / 1,000 Women |
| Less than High School | 0 (0.0%) | 0.0 |
| High School Diploma | 0 (0.0%) | 0.0 |
| College or Associate's Degree | 28 (66.7%) | 246.0 |
| Bachelor's Degree | 0 (0.0%) | 0.0 |
| Graduate Degree | 14 (33.3%) | 378.0 |
| Total | 42 (100.0%) | 56.0 |
Fertility by Education by Marriage Status in Pleasant Hill
33.3% of women with births in Pleasant Hill are unmarried. Women with the educational attainment of graduate degree are most likely to be married with 100.0% of them married at childbirth, while women with the educational attainment of college or associate's degree are least likely to be married with 50.0% of them unmarried at childbirth.
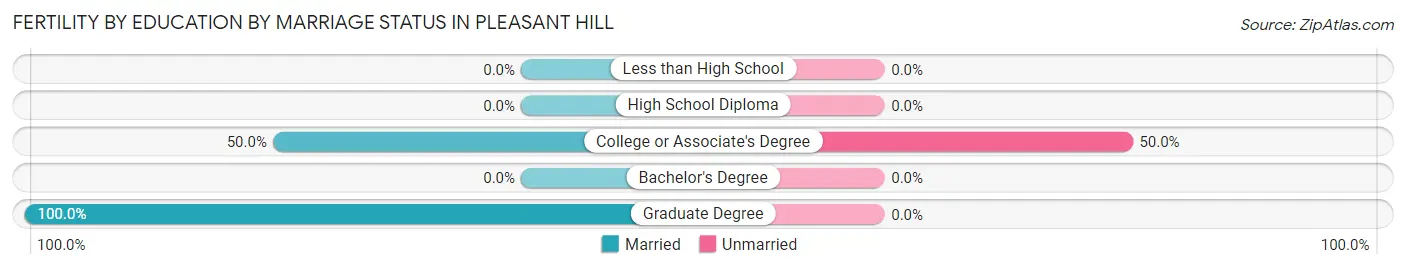
| Educational Attainment | Married | Unmarried |
| Less than High School | 0 (0.0%) | 0 (0.0%) |
| High School Diploma | 0 (0.0%) | 0 (0.0%) |
| College or Associate's Degree | 14 (50.0%) | 14 (50.0%) |
| Bachelor's Degree | 0 (0.0%) | 0 (0.0%) |
| Graduate Degree | 14 (100.0%) | 0 (0.0%) |
| Total | 28 (66.7%) | 14 (33.3%) |
Employment Characteristics in Pleasant Hill
Employment by Class of Employer in Pleasant Hill
Among the 1,379 employed individuals in Pleasant Hill, private company employees (965 | 70.0%), not-for-profit organizations (168 | 12.2%), and federal government employees (147 | 10.7%) make up the most common classes of employment.
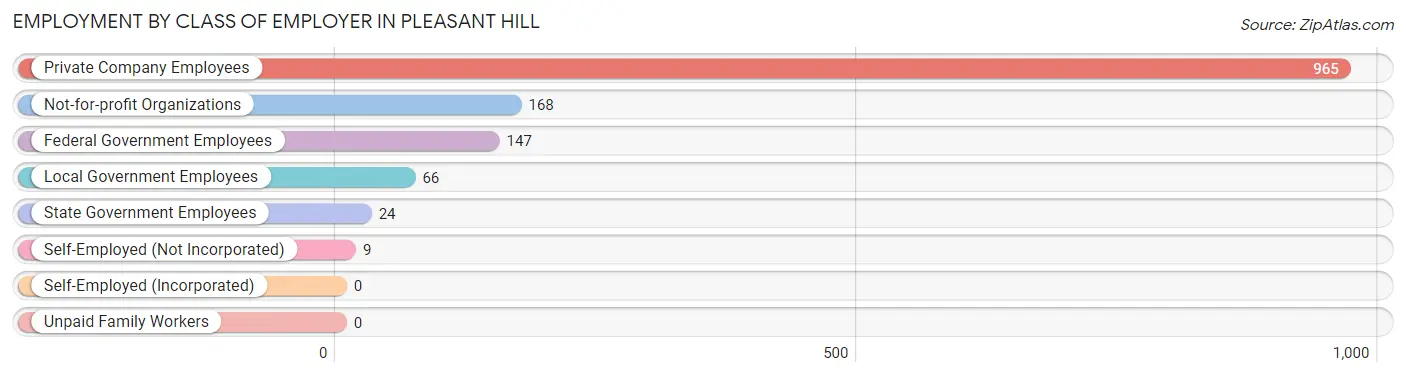
| Employer Class | # Employees | % Employees |
| Private Company Employees | 965 | 70.0% |
| Self-Employed (Incorporated) | 0 | 0.0% |
| Self-Employed (Not Incorporated) | 9 | 0.6% |
| Not-for-profit Organizations | 168 | 12.2% |
| Local Government Employees | 66 | 4.8% |
| State Government Employees | 24 | 1.7% |
| Federal Government Employees | 147 | 10.7% |
| Unpaid Family Workers | 0 | 0.0% |
| Total | 1,379 | 100.0% |
Employment Status by Age in Pleasant Hill
According to the labor force statistics for Pleasant Hill, out of the total population over 16 years of age (2,376), 72.3% or 1,718 individuals are in the labor force, with 19.7% or 338 of them unemployed. The age group with the highest labor force participation rate is 20 to 24 years, with 94.2% or 293 individuals in the labor force. Within the labor force, the 16 to 19 years age range has the highest percentage of unemployed individuals, with 73.0% or 81 of them being unemployed.
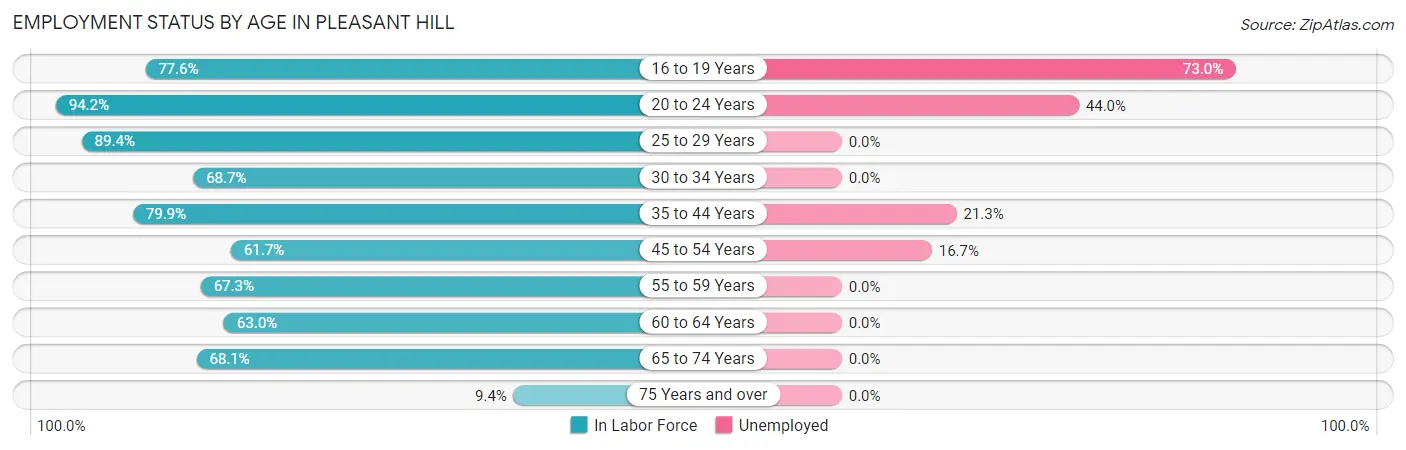
| Age Bracket | In Labor Force | Unemployed |
| 16 to 19 Years | 111 (77.6%) | 81 (73.0%) |
| 20 to 24 Years | 293 (94.2%) | 129 (44.0%) |
| 25 to 29 Years | 127 (89.4%) | 0 (0.0%) |
| 30 to 34 Years | 138 (68.7%) | 0 (0.0%) |
| 35 to 44 Years | 450 (79.9%) | 96 (21.3%) |
| 45 to 54 Years | 198 (61.7%) | 33 (16.7%) |
| 55 to 59 Years | 138 (67.3%) | 0 (0.0%) |
| 60 to 64 Years | 177 (63.0%) | 0 (0.0%) |
| 65 to 74 Years | 77 (68.1%) | 0 (0.0%) |
| 75 Years and over | 9 (9.4%) | 0 (0.0%) |
| Total | 1,718 (72.3%) | 338 (19.7%) |
Employment Status by Educational Attainment in Pleasant Hill
According to labor force statistics for Pleasant Hill, 71.7% of individuals (1,228) out of the total population between 25 and 64 years of age (1,713) are in the labor force, with 10.5% or 129 of them being unemployed. The group with the highest labor force participation rate are those with the educational attainment of college / associate degree, with 94.3% or 410 individuals in the labor force. Within the labor force, individuals with college / associate degree education have the highest percentage of unemployment, with 23.4% or 96 of them being unemployed.
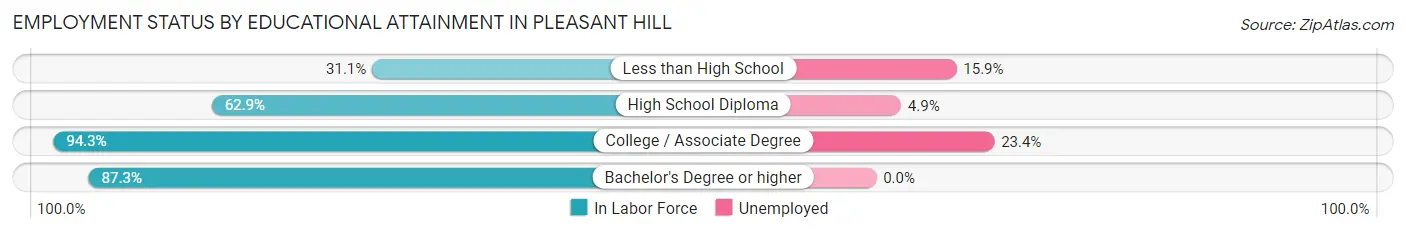
| Educational Attainment | In Labor Force | Unemployed |
| Less than High School | 69 (31.1%) | 35 (15.9%) |
| High School Diploma | 446 (62.9%) | 35 (4.9%) |
| College / Associate Degree | 410 (94.3%) | 102 (23.4%) |
| Bachelor's Degree or higher | 303 (87.3%) | 0 (0.0%) |
| Total | 1,228 (71.7%) | 180 (10.5%) |
Employment Occupations by Sex in Pleasant Hill
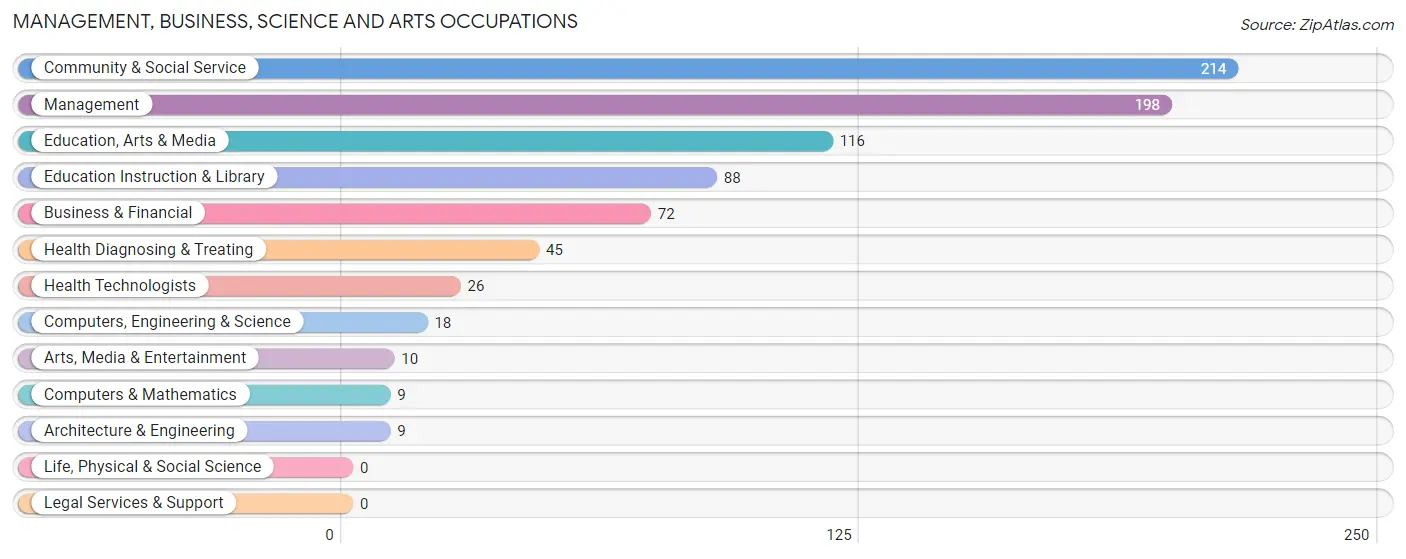
Management, Business, Science and Arts Occupations
The most common Management, Business, Science and Arts occupations in Pleasant Hill are Community & Social Service (214 | 15.5%), Management (198 | 14.4%), Education, Arts & Media (116 | 8.4%), Education Instruction & Library (88 | 6.4%), and Business & Financial (72 | 5.2%).
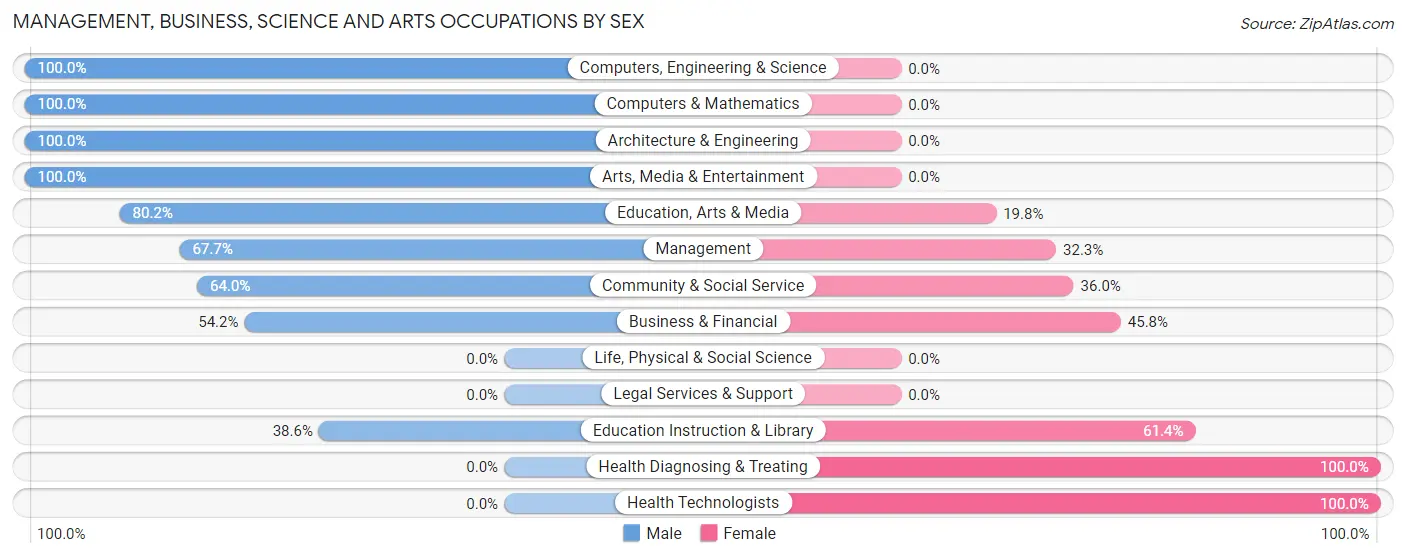
Management, Business, Science and Arts Occupations by Sex
Within the Management, Business, Science and Arts occupations in Pleasant Hill, the most male-oriented occupations are Computers, Engineering & Science (100.0%), Computers & Mathematics (100.0%), and Architecture & Engineering (100.0%), while the most female-oriented occupations are Health Diagnosing & Treating (100.0%), Health Technologists (100.0%), and Education Instruction & Library (61.4%).
| Occupation | Male | Female |
| Management | 134 (67.7%) | 64 (32.3%) |
| Business & Financial | 39 (54.2%) | 33 (45.8%) |
| Computers, Engineering & Science | 18 (100.0%) | 0 (0.0%) |
| Computers & Mathematics | 9 (100.0%) | 0 (0.0%) |
| Architecture & Engineering | 9 (100.0%) | 0 (0.0%) |
| Life, Physical & Social Science | 0 (0.0%) | 0 (0.0%) |
| Community & Social Service | 137 (64.0%) | 77 (36.0%) |
| Education, Arts & Media | 93 (80.2%) | 23 (19.8%) |
| Legal Services & Support | 0 (0.0%) | 0 (0.0%) |
| Education Instruction & Library | 34 (38.6%) | 54 (61.4%) |
| Arts, Media & Entertainment | 10 (100.0%) | 0 (0.0%) |
| Health Diagnosing & Treating | 0 (0.0%) | 45 (100.0%) |
| Health Technologists | 0 (0.0%) | 26 (100.0%) |
| Total (Category) | 328 (60.0%) | 219 (40.0%) |
| Total (Overall) | 708 (51.3%) | 671 (48.7%) |
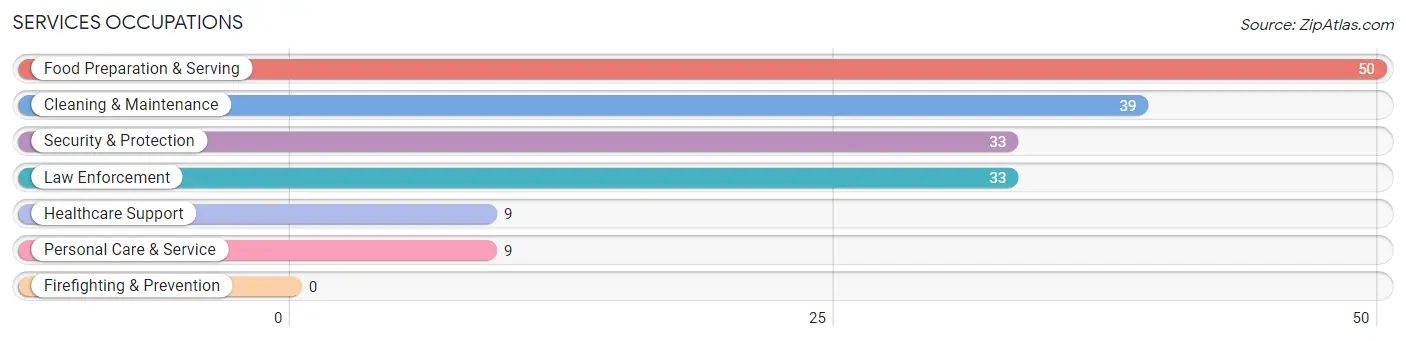
Services Occupations
The most common Services occupations in Pleasant Hill are Food Preparation & Serving (50 | 3.6%), Cleaning & Maintenance (39 | 2.8%), Security & Protection (33 | 2.4%), Law Enforcement (33 | 2.4%), and Healthcare Support (9 | 0.6%).
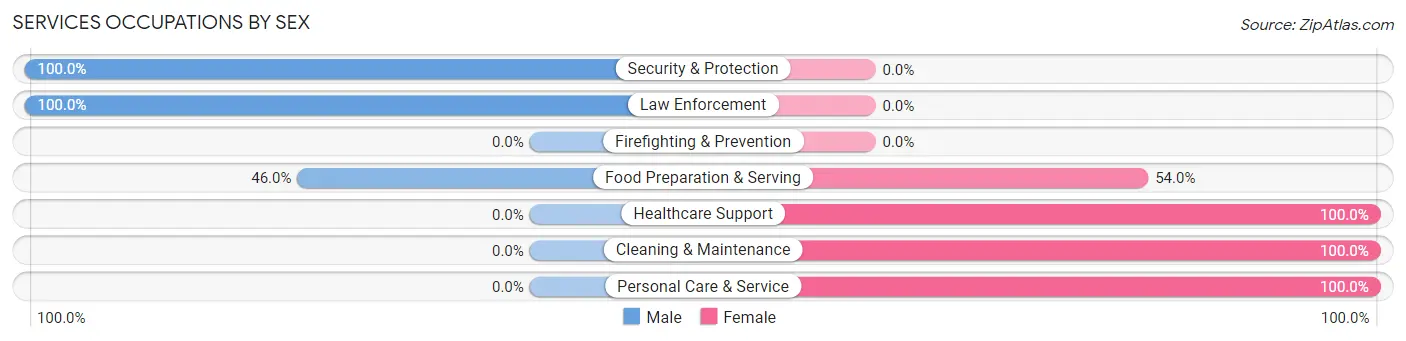
Services Occupations by Sex
Within the Services occupations in Pleasant Hill, the most male-oriented occupations are Security & Protection (100.0%), Law Enforcement (100.0%), and Food Preparation & Serving (46.0%), while the most female-oriented occupations are Healthcare Support (100.0%), Cleaning & Maintenance (100.0%), and Personal Care & Service (100.0%).
| Occupation | Male | Female |
| Healthcare Support | 0 (0.0%) | 9 (100.0%) |
| Security & Protection | 33 (100.0%) | 0 (0.0%) |
| Firefighting & Prevention | 0 (0.0%) | 0 (0.0%) |
| Law Enforcement | 33 (100.0%) | 0 (0.0%) |
| Food Preparation & Serving | 23 (46.0%) | 27 (54.0%) |
| Cleaning & Maintenance | 0 (0.0%) | 39 (100.0%) |
| Personal Care & Service | 0 (0.0%) | 9 (100.0%) |
| Total (Category) | 56 (40.0%) | 84 (60.0%) |
| Total (Overall) | 708 (51.3%) | 671 (48.7%) |
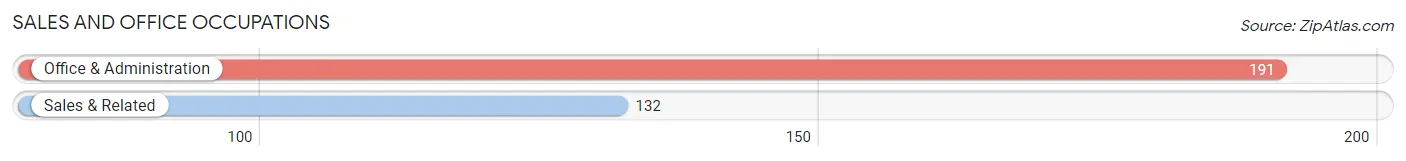
Sales and Office Occupations
The most common Sales and Office occupations in Pleasant Hill are Office & Administration (191 | 13.9%), and Sales & Related (132 | 9.6%).
Sales and Office Occupations by Sex
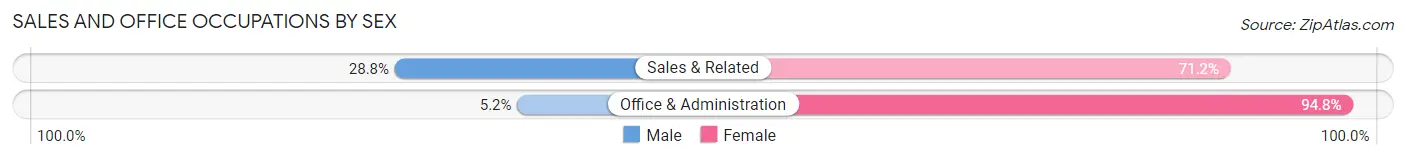
| Occupation | Male | Female |
| Sales & Related | 38 (28.8%) | 94 (71.2%) |
| Office & Administration | 10 (5.2%) | 181 (94.8%) |
| Total (Category) | 48 (14.9%) | 275 (85.1%) |
| Total (Overall) | 708 (51.3%) | 671 (48.7%) |
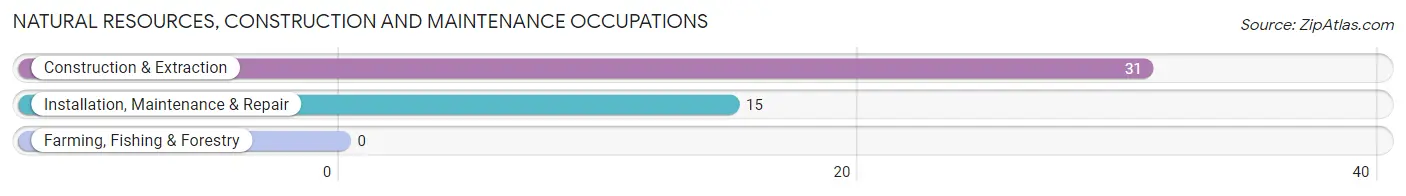
Natural Resources, Construction and Maintenance Occupations
The most common Natural Resources, Construction and Maintenance occupations in Pleasant Hill are Construction & Extraction (31 | 2.2%), and Installation, Maintenance & Repair (15 | 1.1%).
Natural Resources, Construction and Maintenance Occupations by Sex
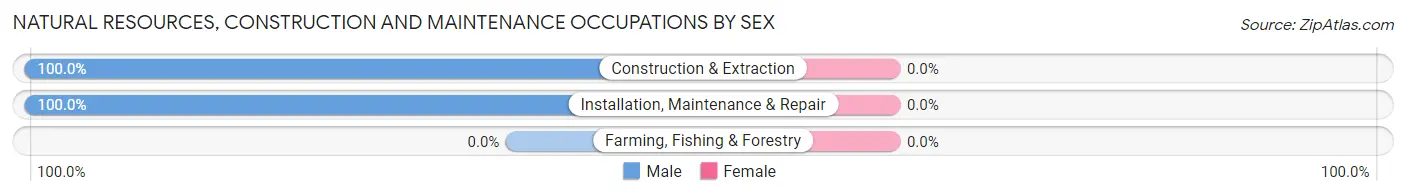
| Occupation | Male | Female |
| Farming, Fishing & Forestry | 0 (0.0%) | 0 (0.0%) |
| Construction & Extraction | 31 (100.0%) | 0 (0.0%) |
| Installation, Maintenance & Repair | 15 (100.0%) | 0 (0.0%) |
| Total (Category) | 46 (100.0%) | 0 (0.0%) |
| Total (Overall) | 708 (51.3%) | 671 (48.7%) |
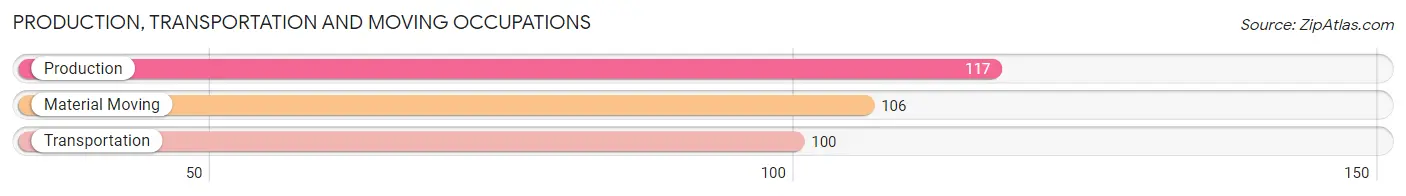
Production, Transportation and Moving Occupations
The most common Production, Transportation and Moving occupations in Pleasant Hill are Production (117 | 8.5%), Material Moving (106 | 7.7%), and Transportation (100 | 7.2%).
Production, Transportation and Moving Occupations by Sex
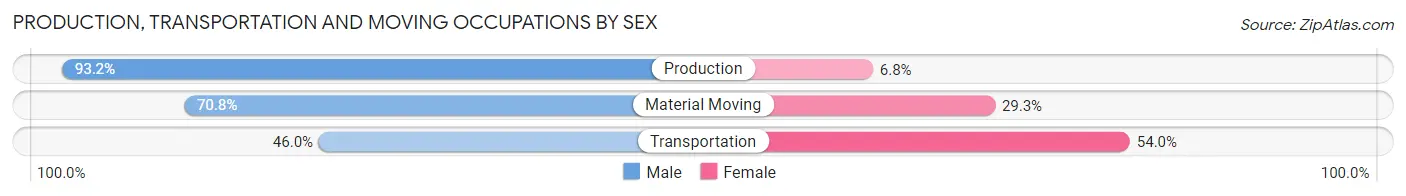
| Occupation | Male | Female |
| Production | 109 (93.2%) | 8 (6.8%) |
| Transportation | 46 (46.0%) | 54 (54.0%) |
| Material Moving | 75 (70.8%) | 31 (29.2%) |
| Total (Category) | 230 (71.2%) | 93 (28.8%) |
| Total (Overall) | 708 (51.3%) | 671 (48.7%) |
Employment Industries by Sex in Pleasant Hill
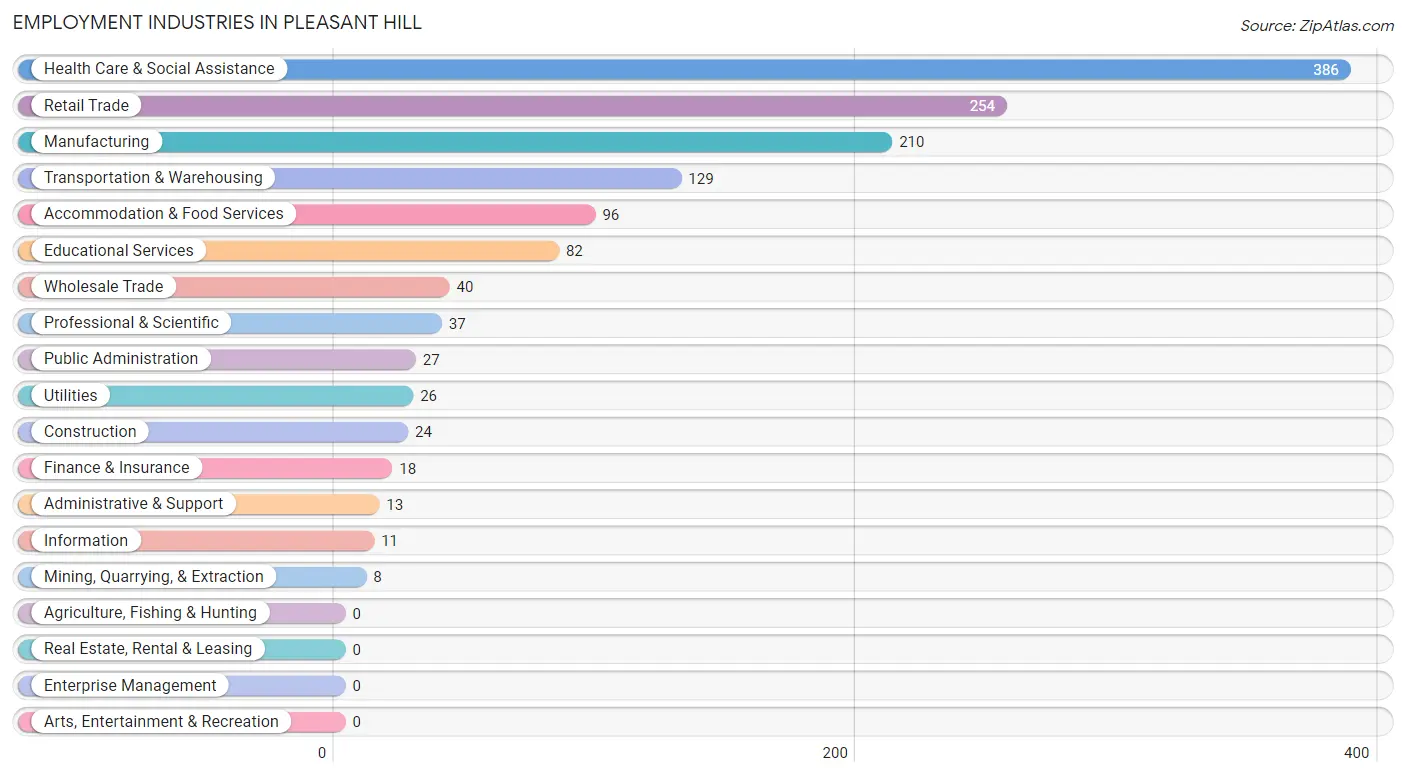
Employment Industries in Pleasant Hill
The major employment industries in Pleasant Hill include Health Care & Social Assistance (386 | 28.0%), Retail Trade (254 | 18.4%), Manufacturing (210 | 15.2%), Transportation & Warehousing (129 | 9.3%), and Accommodation & Food Services (96 | 7.0%).
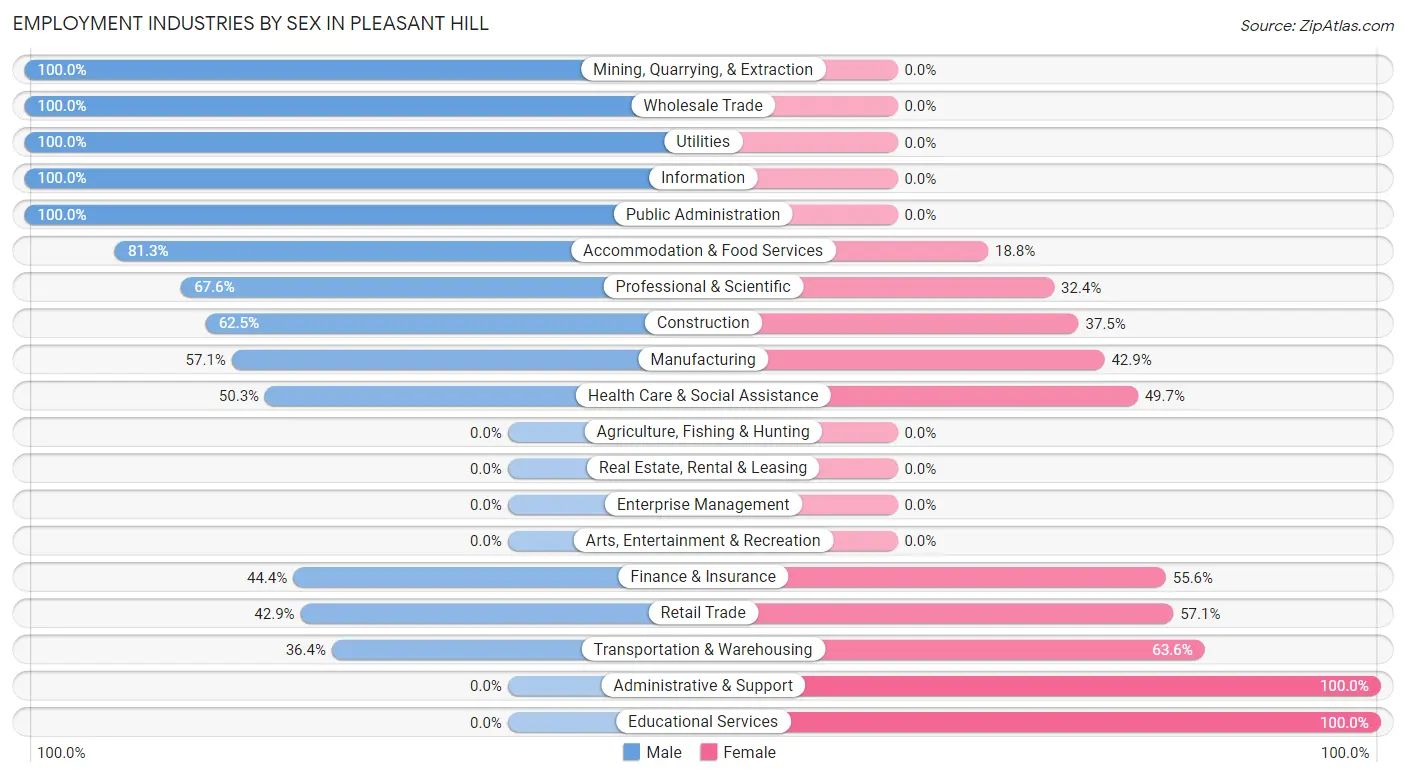
Employment Industries by Sex in Pleasant Hill
The Pleasant Hill industries that see more men than women are Mining, Quarrying, & Extraction (100.0%), Wholesale Trade (100.0%), and Utilities (100.0%), whereas the industries that tend to have a higher number of women are Administrative & Support (100.0%), Educational Services (100.0%), and Transportation & Warehousing (63.6%).
| Industry | Male | Female |
| Agriculture, Fishing & Hunting | 0 (0.0%) | 0 (0.0%) |
| Mining, Quarrying, & Extraction | 8 (100.0%) | 0 (0.0%) |
| Construction | 15 (62.5%) | 9 (37.5%) |
| Manufacturing | 120 (57.1%) | 90 (42.9%) |
| Wholesale Trade | 40 (100.0%) | 0 (0.0%) |
| Retail Trade | 109 (42.9%) | 145 (57.1%) |
| Transportation & Warehousing | 47 (36.4%) | 82 (63.6%) |
| Utilities | 26 (100.0%) | 0 (0.0%) |
| Information | 11 (100.0%) | 0 (0.0%) |
| Finance & Insurance | 8 (44.4%) | 10 (55.6%) |
| Real Estate, Rental & Leasing | 0 (0.0%) | 0 (0.0%) |
| Professional & Scientific | 25 (67.6%) | 12 (32.4%) |
| Enterprise Management | 0 (0.0%) | 0 (0.0%) |
| Administrative & Support | 0 (0.0%) | 13 (100.0%) |
| Educational Services | 0 (0.0%) | 82 (100.0%) |
| Health Care & Social Assistance | 194 (50.3%) | 192 (49.7%) |
| Arts, Entertainment & Recreation | 0 (0.0%) | 0 (0.0%) |
| Accommodation & Food Services | 78 (81.2%) | 18 (18.8%) |
| Public Administration | 27 (100.0%) | 0 (0.0%) |
| Total | 708 (51.3%) | 671 (48.7%) |
Education in Pleasant Hill
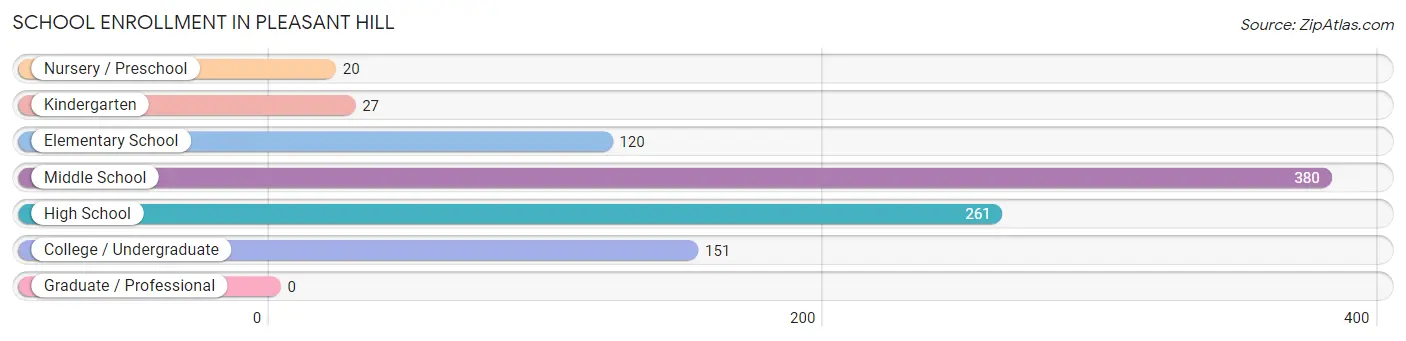
School Enrollment in Pleasant Hill
The most common levels of schooling among the 959 students in Pleasant Hill are middle school (380 | 39.6%), high school (261 | 27.2%), and college / undergraduate (151 | 15.8%).
| School Level | # Students | % Students |
| Nursery / Preschool | 20 | 2.1% |
| Kindergarten | 27 | 2.8% |
| Elementary School | 120 | 12.5% |
| Middle School | 380 | 39.6% |
| High School | 261 | 27.2% |
| College / Undergraduate | 151 | 15.8% |
| Graduate / Professional | 0 | 0.0% |
| Total | 959 | 100.0% |
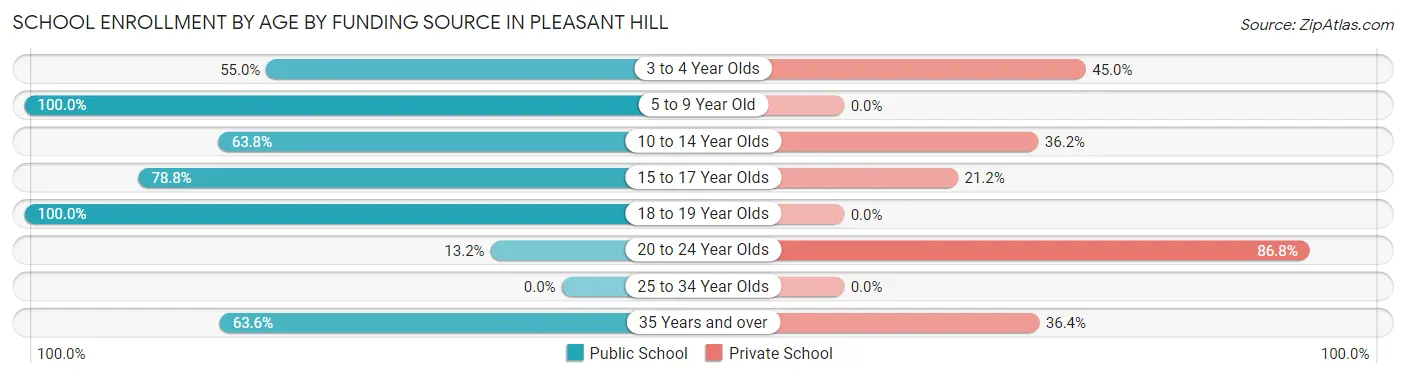
School Enrollment by Age by Funding Source in Pleasant Hill
Out of a total of 959 students who are enrolled in schools in Pleasant Hill, 338 (35.2%) attend a private institution, while the remaining 621 (64.8%) are enrolled in public schools. The age group of 20 to 24 year olds has the highest likelihood of being enrolled in private schools, with 118 (86.8% in the age bracket) enrolled. Conversely, the age group of 5 to 9 year old has the lowest likelihood of being enrolled in a private school, with 84 (100.0% in the age bracket) attending a public institution.
| Age Bracket | Public School | Private School |
| 3 to 4 Year Olds | 11 (55.0%) | 9 (45.0%) |
| 5 to 9 Year Old | 84 (100.0%) | 0 (0.0%) |
| 10 to 14 Year Olds | 321 (63.8%) | 182 (36.2%) |
| 15 to 17 Year Olds | 78 (78.8%) | 21 (21.2%) |
| 18 to 19 Year Olds | 95 (100.0%) | 0 (0.0%) |
| 20 to 24 Year Olds | 18 (13.2%) | 118 (86.8%) |
| 25 to 34 Year Olds | 0 (0.0%) | 0 (0.0%) |
| 35 Years and over | 14 (63.6%) | 8 (36.4%) |
| Total | 621 (64.8%) | 338 (35.2%) |
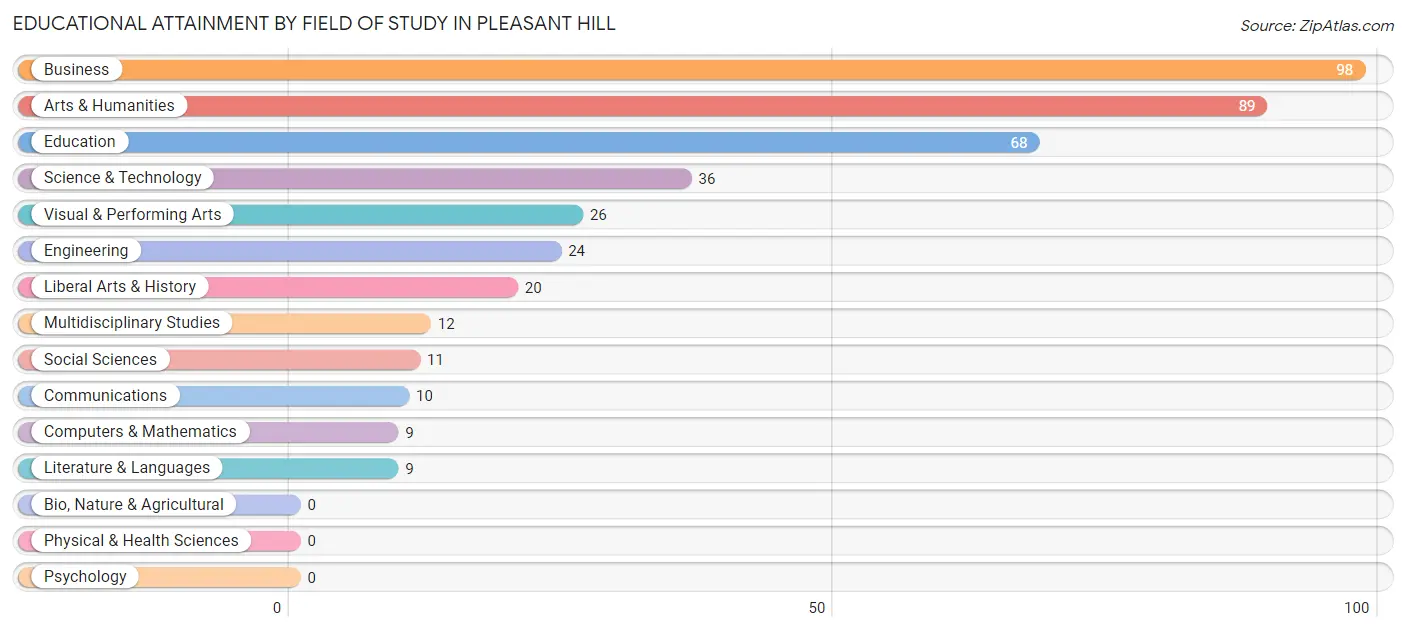
Educational Attainment by Field of Study in Pleasant Hill
Business (98 | 23.8%), arts & humanities (89 | 21.6%), education (68 | 16.5%), science & technology (36 | 8.7%), and visual & performing arts (26 | 6.3%) are the most common fields of study among 412 individuals in Pleasant Hill who have obtained a bachelor's degree or higher.
| Field of Study | # Graduates | % Graduates |
| Computers & Mathematics | 9 | 2.2% |
| Bio, Nature & Agricultural | 0 | 0.0% |
| Physical & Health Sciences | 0 | 0.0% |
| Psychology | 0 | 0.0% |
| Social Sciences | 11 | 2.7% |
| Engineering | 24 | 5.8% |
| Multidisciplinary Studies | 12 | 2.9% |
| Science & Technology | 36 | 8.7% |
| Business | 98 | 23.8% |
| Education | 68 | 16.5% |
| Literature & Languages | 9 | 2.2% |
| Liberal Arts & History | 20 | 4.9% |
| Visual & Performing Arts | 26 | 6.3% |
| Communications | 10 | 2.4% |
| Arts & Humanities | 89 | 21.6% |
| Total | 412 | 100.0% |
Transportation & Commute in Pleasant Hill
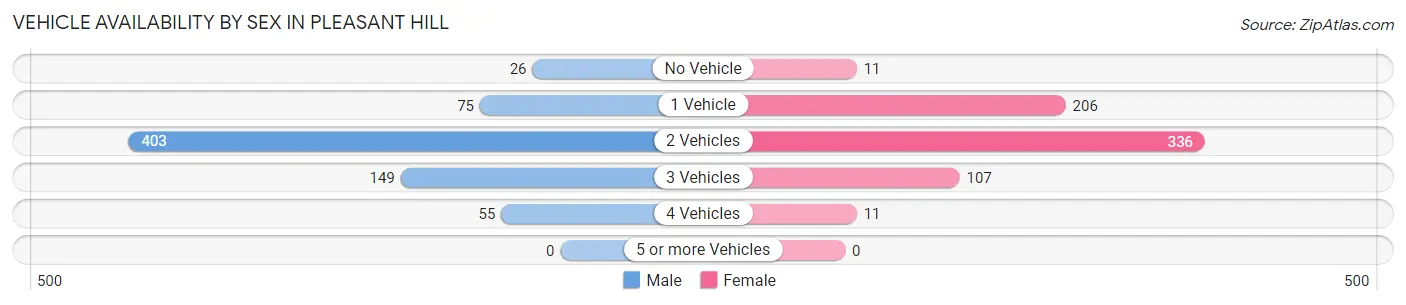
Vehicle Availability by Sex in Pleasant Hill
The most prevalent vehicle ownership categories in Pleasant Hill are males with 2 vehicles (403, accounting for 56.9%) and females with 2 vehicles (336, making up 60.1%).
| Vehicles Available | Male | Female |
| No Vehicle | 26 (3.7%) | 11 (1.6%) |
| 1 Vehicle | 75 (10.6%) | 206 (30.7%) |
| 2 Vehicles | 403 (56.9%) | 336 (50.1%) |
| 3 Vehicles | 149 (21.0%) | 107 (16.0%) |
| 4 Vehicles | 55 (7.8%) | 11 (1.6%) |
| 5 or more Vehicles | 0 (0.0%) | 0 (0.0%) |
| Total | 708 (100.0%) | 671 (100.0%) |
Commute Time in Pleasant Hill
The most frequently occuring commute durations in Pleasant Hill are 10 to 14 minutes (318 commuters, 23.7%), 5 to 9 minutes (227 commuters, 16.9%), and 15 to 19 minutes (215 commuters, 16.0%).
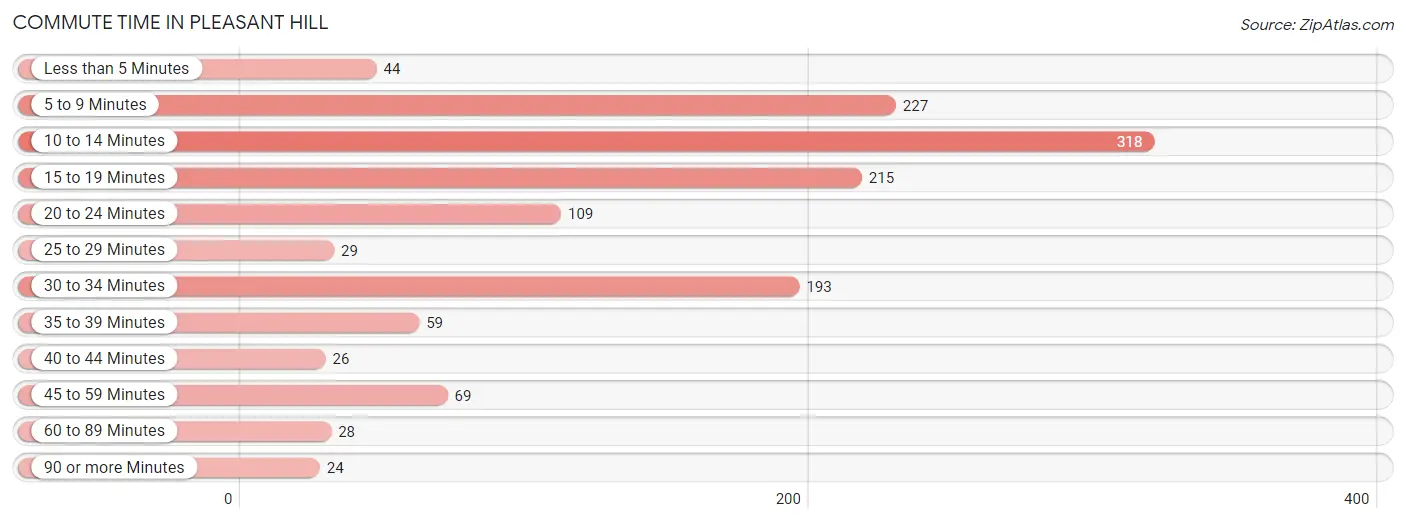
| Commute Time | # Commuters | % Commuters |
| Less than 5 Minutes | 44 | 3.3% |
| 5 to 9 Minutes | 227 | 16.9% |
| 10 to 14 Minutes | 318 | 23.7% |
| 15 to 19 Minutes | 215 | 16.0% |
| 20 to 24 Minutes | 109 | 8.1% |
| 25 to 29 Minutes | 29 | 2.2% |
| 30 to 34 Minutes | 193 | 14.4% |
| 35 to 39 Minutes | 59 | 4.4% |
| 40 to 44 Minutes | 26 | 1.9% |
| 45 to 59 Minutes | 69 | 5.1% |
| 60 to 89 Minutes | 28 | 2.1% |
| 90 or more Minutes | 24 | 1.8% |
Commute Time by Sex in Pleasant Hill
The most common commute times in Pleasant Hill are 5 to 9 minutes (150 commuters, 22.1%) for males and 10 to 14 minutes (231 commuters, 34.9%) for females.
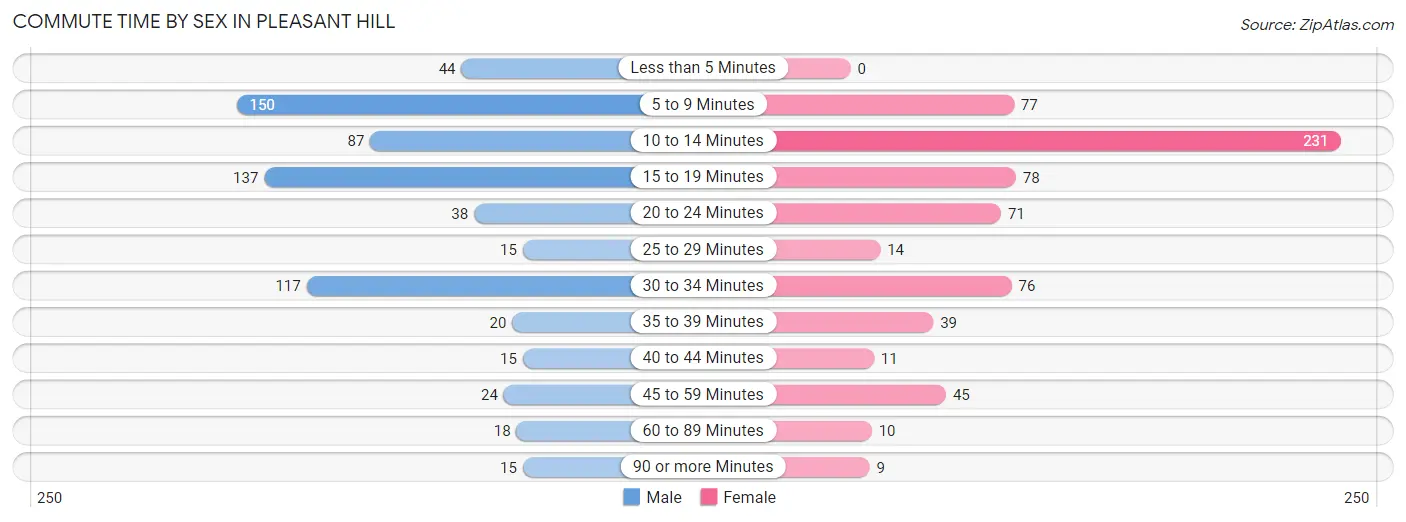
| Commute Time | Male | Female |
| Less than 5 Minutes | 44 (6.5%) | 0 (0.0%) |
| 5 to 9 Minutes | 150 (22.1%) | 77 (11.7%) |
| 10 to 14 Minutes | 87 (12.8%) | 231 (34.9%) |
| 15 to 19 Minutes | 137 (20.2%) | 78 (11.8%) |
| 20 to 24 Minutes | 38 (5.6%) | 71 (10.7%) |
| 25 to 29 Minutes | 15 (2.2%) | 14 (2.1%) |
| 30 to 34 Minutes | 117 (17.2%) | 76 (11.5%) |
| 35 to 39 Minutes | 20 (2.9%) | 39 (5.9%) |
| 40 to 44 Minutes | 15 (2.2%) | 11 (1.7%) |
| 45 to 59 Minutes | 24 (3.5%) | 45 (6.8%) |
| 60 to 89 Minutes | 18 (2.6%) | 10 (1.5%) |
| 90 or more Minutes | 15 (2.2%) | 9 (1.4%) |
Time of Departure to Work by Sex in Pleasant Hill
The most frequent times of departure to work in Pleasant Hill are 7:30 AM to 7:59 AM (128, 18.8%) for males and 7:30 AM to 7:59 AM (134, 20.3%) for females.
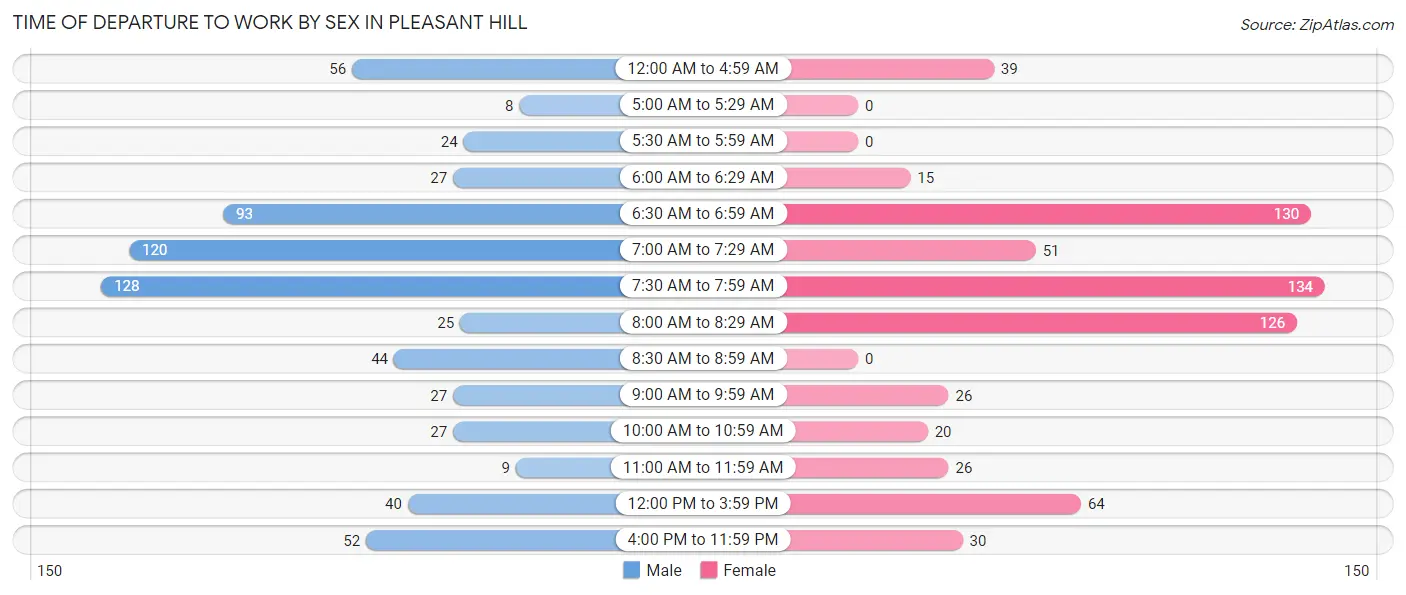
| Time of Departure | Male | Female |
| 12:00 AM to 4:59 AM | 56 (8.2%) | 39 (5.9%) |
| 5:00 AM to 5:29 AM | 8 (1.2%) | 0 (0.0%) |
| 5:30 AM to 5:59 AM | 24 (3.5%) | 0 (0.0%) |
| 6:00 AM to 6:29 AM | 27 (4.0%) | 15 (2.3%) |
| 6:30 AM to 6:59 AM | 93 (13.7%) | 130 (19.7%) |
| 7:00 AM to 7:29 AM | 120 (17.6%) | 51 (7.7%) |
| 7:30 AM to 7:59 AM | 128 (18.8%) | 134 (20.3%) |
| 8:00 AM to 8:29 AM | 25 (3.7%) | 126 (19.1%) |
| 8:30 AM to 8:59 AM | 44 (6.5%) | 0 (0.0%) |
| 9:00 AM to 9:59 AM | 27 (4.0%) | 26 (3.9%) |
| 10:00 AM to 10:59 AM | 27 (4.0%) | 20 (3.0%) |
| 11:00 AM to 11:59 AM | 9 (1.3%) | 26 (3.9%) |
| 12:00 PM to 3:59 PM | 40 (5.9%) | 64 (9.7%) |
| 4:00 PM to 11:59 PM | 52 (7.6%) | 30 (4.5%) |
| Total | 680 (100.0%) | 661 (100.0%) |
Housing Occupancy in Pleasant Hill
Occupancy by Ownership in Pleasant Hill
Of the total 1,163 dwellings in Pleasant Hill, owner-occupied units account for 628 (54.0%), while renter-occupied units make up 535 (46.0%).
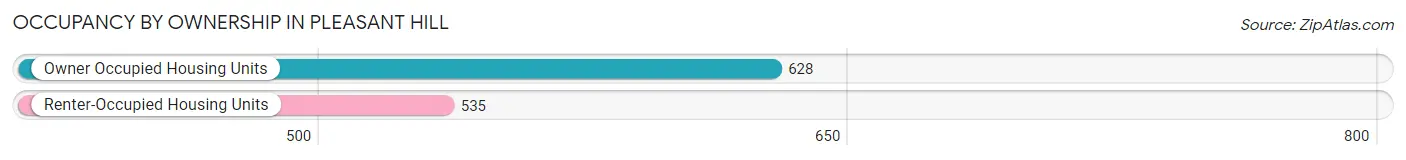
| Occupancy | # Housing Units | % Housing Units |
| Owner Occupied Housing Units | 628 | 54.0% |
| Renter-Occupied Housing Units | 535 | 46.0% |
| Total Occupied Housing Units | 1,163 | 100.0% |
Occupancy by Household Size in Pleasant Hill
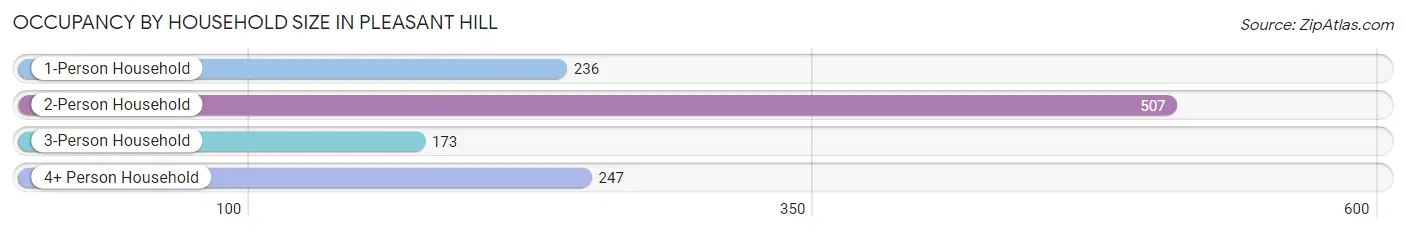
| Household Size | # Housing Units | % Housing Units |
| 1-Person Household | 236 | 20.3% |
| 2-Person Household | 507 | 43.6% |
| 3-Person Household | 173 | 14.9% |
| 4+ Person Household | 247 | 21.2% |
| Total Housing Units | 1,163 | 100.0% |
Occupancy by Ownership by Household Size in Pleasant Hill
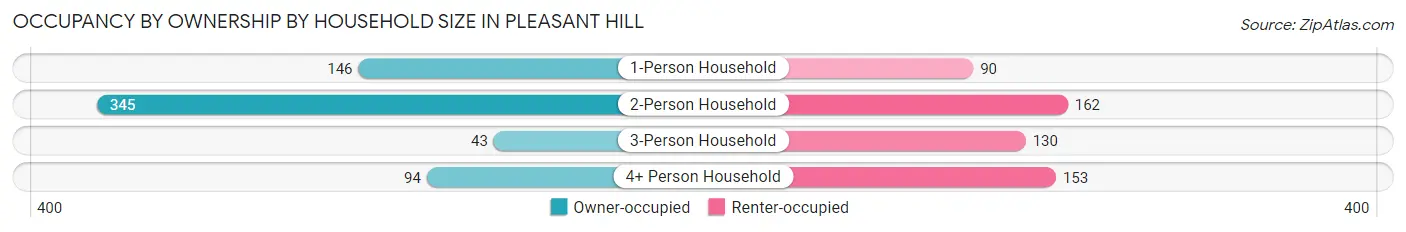
| Household Size | Owner-occupied | Renter-occupied |
| 1-Person Household | 146 (61.9%) | 90 (38.1%) |
| 2-Person Household | 345 (68.0%) | 162 (32.0%) |
| 3-Person Household | 43 (24.9%) | 130 (75.1%) |
| 4+ Person Household | 94 (38.1%) | 153 (61.9%) |
| Total Housing Units | 628 (54.0%) | 535 (46.0%) |
Occupancy by Educational Attainment in Pleasant Hill
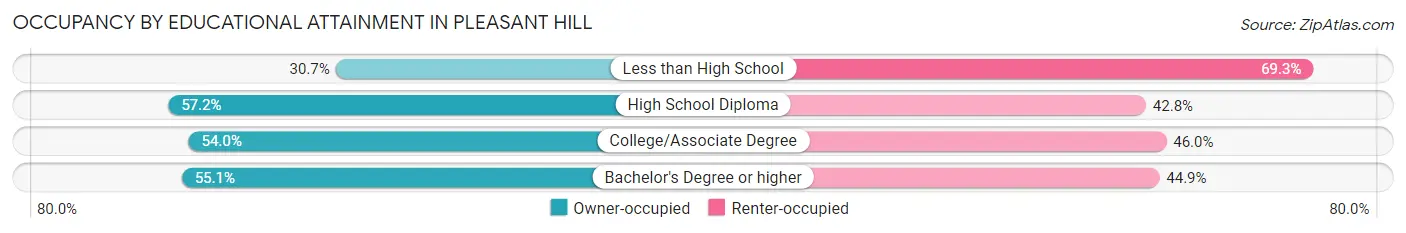
| Household Size | Owner-occupied | Renter-occupied |
| Less than High School | 27 (30.7%) | 61 (69.3%) |
| High School Diploma | 329 (57.2%) | 246 (42.8%) |
| College/Associate Degree | 169 (54.0%) | 144 (46.0%) |
| Bachelor's Degree or higher | 103 (55.1%) | 84 (44.9%) |
Occupancy by Age of Householder in Pleasant Hill
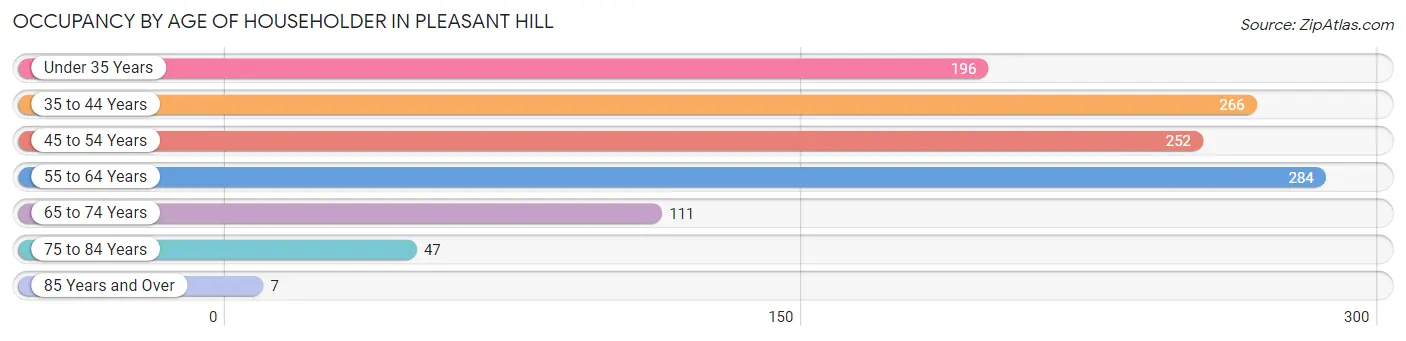
| Age Bracket | # Households | % Households |
| Under 35 Years | 196 | 16.9% |
| 35 to 44 Years | 266 | 22.9% |
| 45 to 54 Years | 252 | 21.7% |
| 55 to 64 Years | 284 | 24.4% |
| 65 to 74 Years | 111 | 9.5% |
| 75 to 84 Years | 47 | 4.0% |
| 85 Years and Over | 7 | 0.6% |
| Total | 1,163 | 100.0% |
Housing Finances in Pleasant Hill
Median Income by Occupancy in Pleasant Hill
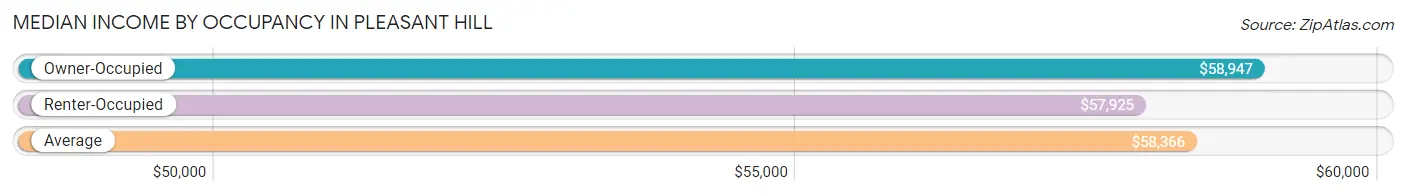
| Occupancy Type | # Households | Median Income |
| Owner-Occupied | 628 (54.0%) | $58,947 |
| Renter-Occupied | 535 (46.0%) | $57,925 |
| Average | 1,163 (100.0%) | $58,366 |
Occupancy by Householder Income Bracket in Pleasant Hill
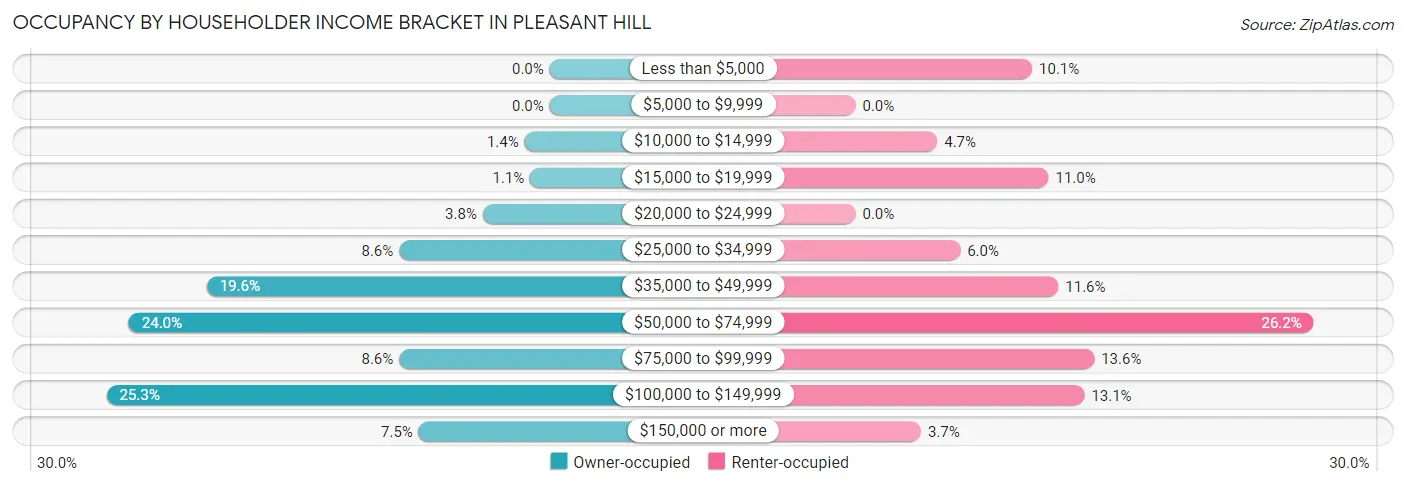
| Income Bracket | Owner-occupied | Renter-occupied |
| Less than $5,000 | 0 (0.0%) | 54 (10.1%) |
| $5,000 to $9,999 | 0 (0.0%) | 0 (0.0%) |
| $10,000 to $14,999 | 9 (1.4%) | 25 (4.7%) |
| $15,000 to $19,999 | 7 (1.1%) | 59 (11.0%) |
| $20,000 to $24,999 | 24 (3.8%) | 0 (0.0%) |
| $25,000 to $34,999 | 54 (8.6%) | 32 (6.0%) |
| $35,000 to $49,999 | 123 (19.6%) | 62 (11.6%) |
| $50,000 to $74,999 | 151 (24.0%) | 140 (26.2%) |
| $75,000 to $99,999 | 54 (8.6%) | 73 (13.6%) |
| $100,000 to $149,999 | 159 (25.3%) | 70 (13.1%) |
| $150,000 or more | 47 (7.5%) | 20 (3.7%) |
| Total | 628 (100.0%) | 535 (100.0%) |
Monthly Housing Cost Tiers in Pleasant Hill
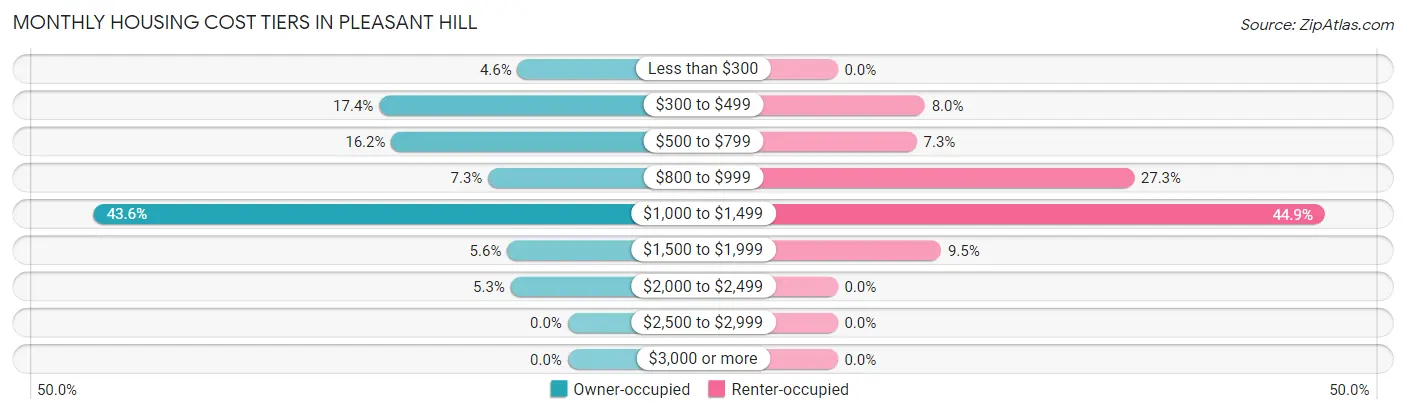
| Monthly Cost | Owner-occupied | Renter-occupied |
| Less than $300 | 29 (4.6%) | 0 (0.0%) |
| $300 to $499 | 109 (17.4%) | 43 (8.0%) |
| $500 to $799 | 102 (16.2%) | 39 (7.3%) |
| $800 to $999 | 46 (7.3%) | 146 (27.3%) |
| $1,000 to $1,499 | 274 (43.6%) | 240 (44.9%) |
| $1,500 to $1,999 | 35 (5.6%) | 51 (9.5%) |
| $2,000 to $2,499 | 33 (5.2%) | 0 (0.0%) |
| $2,500 to $2,999 | 0 (0.0%) | 0 (0.0%) |
| $3,000 or more | 0 (0.0%) | 0 (0.0%) |
| Total | 628 (100.0%) | 535 (100.0%) |
Physical Housing Characteristics in Pleasant Hill
Housing Structures in Pleasant Hill
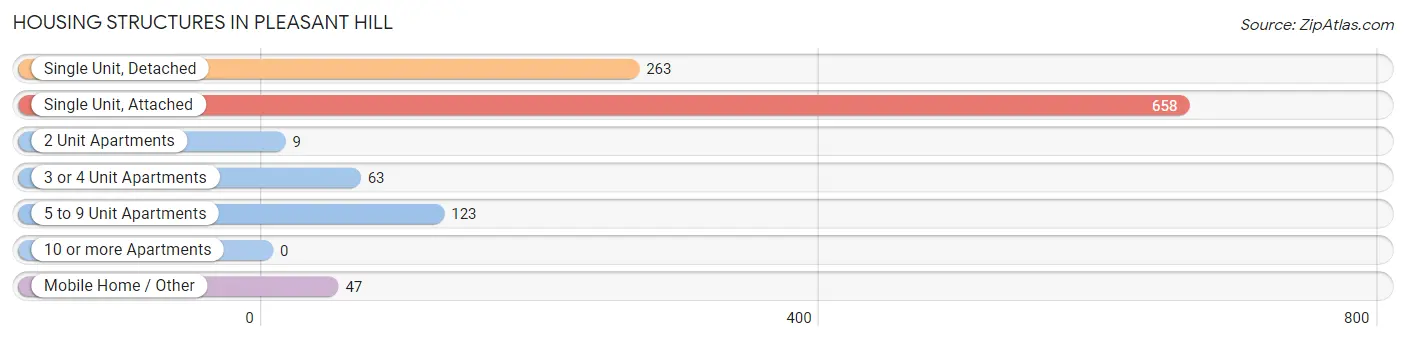
| Structure Type | # Housing Units | % Housing Units |
| Single Unit, Detached | 263 | 22.6% |
| Single Unit, Attached | 658 | 56.6% |
| 2 Unit Apartments | 9 | 0.8% |
| 3 or 4 Unit Apartments | 63 | 5.4% |
| 5 to 9 Unit Apartments | 123 | 10.6% |
| 10 or more Apartments | 0 | 0.0% |
| Mobile Home / Other | 47 | 4.0% |
| Total | 1,163 | 100.0% |
Housing Structures by Occupancy in Pleasant Hill
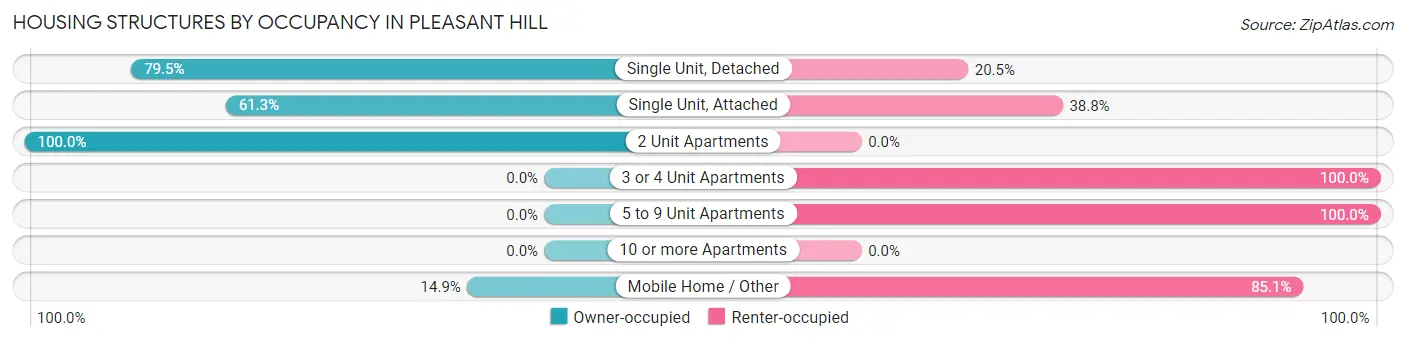
| Structure Type | Owner-occupied | Renter-occupied |
| Single Unit, Detached | 209 (79.5%) | 54 (20.5%) |
| Single Unit, Attached | 403 (61.3%) | 255 (38.8%) |
| 2 Unit Apartments | 9 (100.0%) | 0 (0.0%) |
| 3 or 4 Unit Apartments | 0 (0.0%) | 63 (100.0%) |
| 5 to 9 Unit Apartments | 0 (0.0%) | 123 (100.0%) |
| 10 or more Apartments | 0 (0.0%) | 0 (0.0%) |
| Mobile Home / Other | 7 (14.9%) | 40 (85.1%) |
| Total | 628 (54.0%) | 535 (46.0%) |
Housing Structures by Number of Rooms in Pleasant Hill
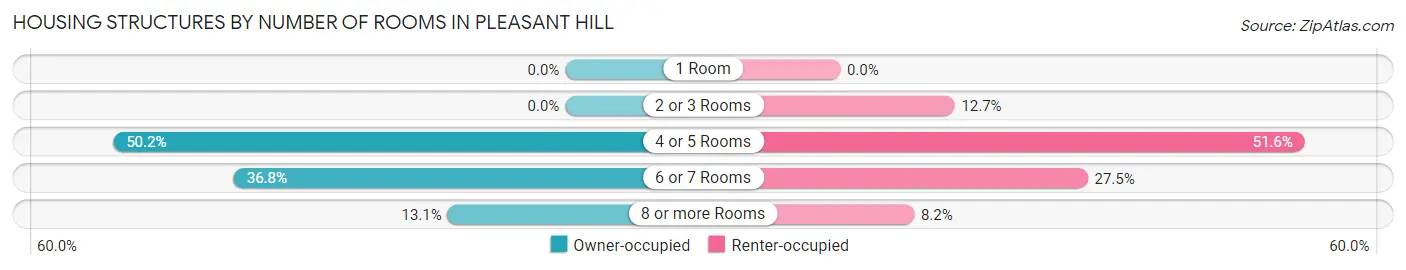
| Number of Rooms | Owner-occupied | Renter-occupied |
| 1 Room | 0 (0.0%) | 0 (0.0%) |
| 2 or 3 Rooms | 0 (0.0%) | 68 (12.7%) |
| 4 or 5 Rooms | 315 (50.2%) | 276 (51.6%) |
| 6 or 7 Rooms | 231 (36.8%) | 147 (27.5%) |
| 8 or more Rooms | 82 (13.1%) | 44 (8.2%) |
| Total | 628 (100.0%) | 535 (100.0%) |
Housing Structure by Heating Type in Pleasant Hill
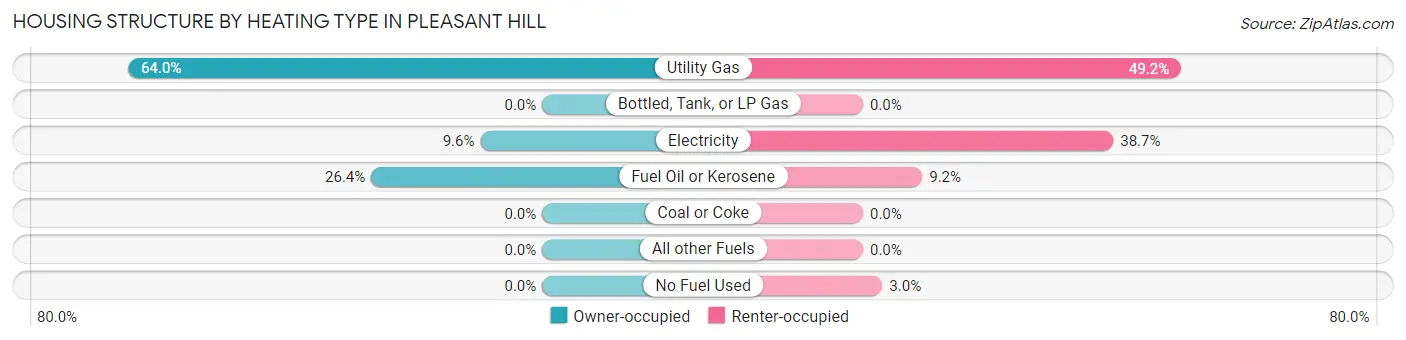
| Heating Type | Owner-occupied | Renter-occupied |
| Utility Gas | 402 (64.0%) | 263 (49.2%) |
| Bottled, Tank, or LP Gas | 0 (0.0%) | 0 (0.0%) |
| Electricity | 60 (9.6%) | 207 (38.7%) |
| Fuel Oil or Kerosene | 166 (26.4%) | 49 (9.2%) |
| Coal or Coke | 0 (0.0%) | 0 (0.0%) |
| All other Fuels | 0 (0.0%) | 0 (0.0%) |
| No Fuel Used | 0 (0.0%) | 16 (3.0%) |
| Total | 628 (100.0%) | 535 (100.0%) |
Household Vehicle Usage in Pleasant Hill
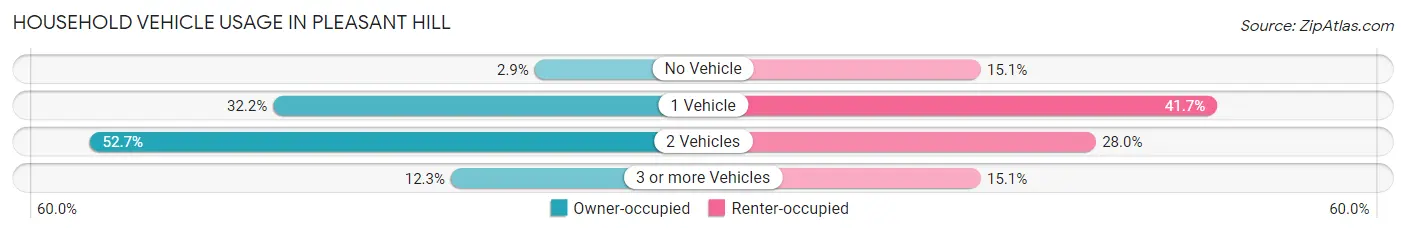
| Vehicles per Household | Owner-occupied | Renter-occupied |
| No Vehicle | 18 (2.9%) | 81 (15.1%) |
| 1 Vehicle | 202 (32.2%) | 223 (41.7%) |
| 2 Vehicles | 331 (52.7%) | 150 (28.0%) |
| 3 or more Vehicles | 77 (12.3%) | 81 (15.1%) |
| Total | 628 (100.0%) | 535 (100.0%) |
Real Estate & Mortgages in Pleasant Hill
Real Estate and Mortgage Overview in Pleasant Hill
| Characteristic | Without Mortgage | With Mortgage |
| Housing Units | 154 | 474 |
| Median Property Value | $137,100 | $148,700 |
| Median Household Income | $51,563 | $47 |
| Monthly Housing Costs | $394 | $0 |
| Real Estate Taxes | $2,013 | $25 |
Property Value by Mortgage Status in Pleasant Hill
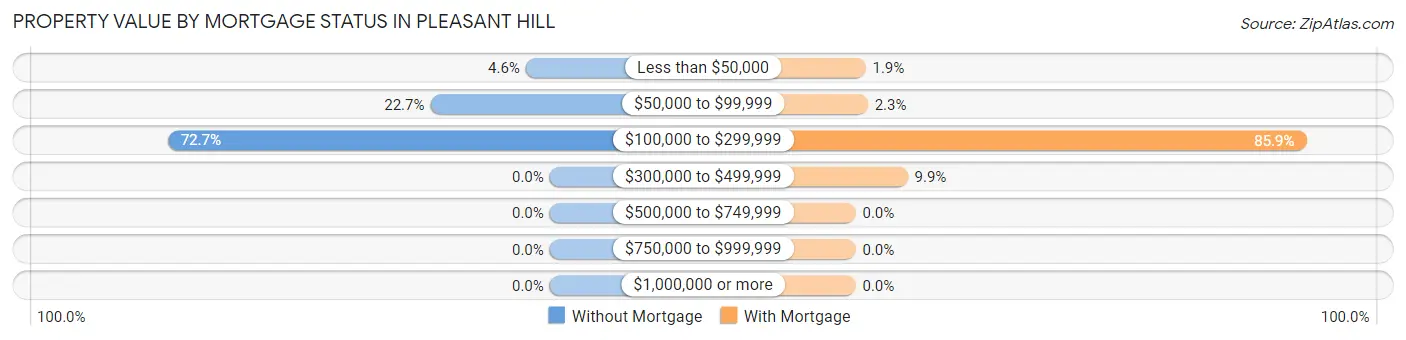
| Property Value | Without Mortgage | With Mortgage |
| Less than $50,000 | 7 (4.5%) | 9 (1.9%) |
| $50,000 to $99,999 | 35 (22.7%) | 11 (2.3%) |
| $100,000 to $299,999 | 112 (72.7%) | 407 (85.9%) |
| $300,000 to $499,999 | 0 (0.0%) | 47 (9.9%) |
| $500,000 to $749,999 | 0 (0.0%) | 0 (0.0%) |
| $750,000 to $999,999 | 0 (0.0%) | 0 (0.0%) |
| $1,000,000 or more | 0 (0.0%) | 0 (0.0%) |
| Total | 154 (100.0%) | 474 (100.0%) |
Household Income by Mortgage Status in Pleasant Hill
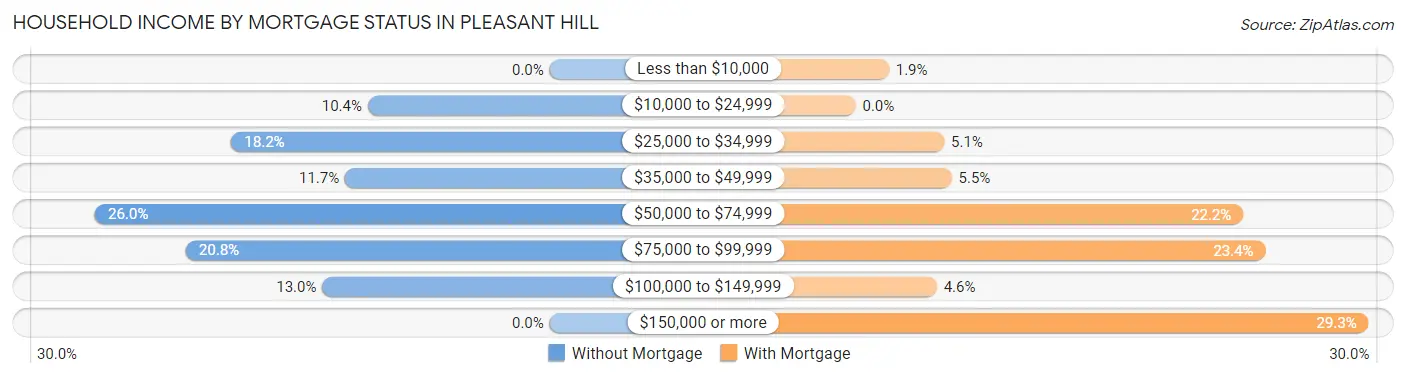
| Household Income | Without Mortgage | With Mortgage |
| Less than $10,000 | 0 (0.0%) | 9 (1.9%) |
| $10,000 to $24,999 | 16 (10.4%) | 0 (0.0%) |
| $25,000 to $34,999 | 28 (18.2%) | 24 (5.1%) |
| $35,000 to $49,999 | 18 (11.7%) | 26 (5.5%) |
| $50,000 to $74,999 | 40 (26.0%) | 105 (22.2%) |
| $75,000 to $99,999 | 32 (20.8%) | 111 (23.4%) |
| $100,000 to $149,999 | 20 (13.0%) | 22 (4.6%) |
| $150,000 or more | 0 (0.0%) | 139 (29.3%) |
| Total | 154 (100.0%) | 474 (100.0%) |
Property Value to Household Income Ratio in Pleasant Hill
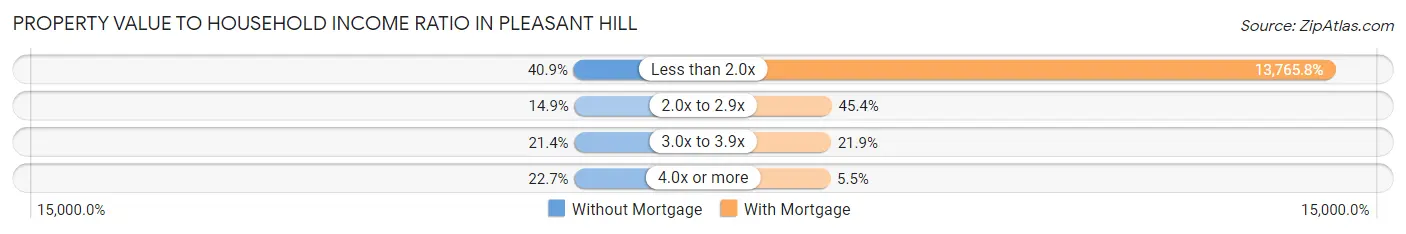
| Value-to-Income Ratio | Without Mortgage | With Mortgage |
| Less than 2.0x | 63 (40.9%) | 65,250 (13,765.8%) |
| 2.0x to 2.9x | 23 (14.9%) | 215 (45.4%) |
| 3.0x to 3.9x | 33 (21.4%) | 104 (21.9%) |
| 4.0x or more | 35 (22.7%) | 26 (5.5%) |
| Total | 154 (100.0%) | 474 (100.0%) |
Real Estate Taxes by Mortgage Status in Pleasant Hill
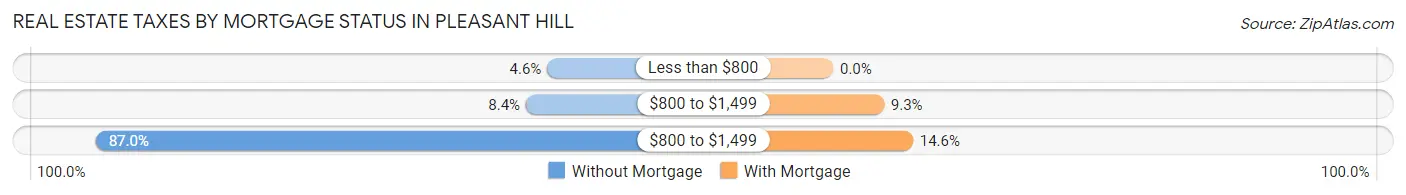
| Property Taxes | Without Mortgage | With Mortgage |
| Less than $800 | 7 (4.5%) | 0 (0.0%) |
| $800 to $1,499 | 13 (8.4%) | 44 (9.3%) |
| $800 to $1,499 | 134 (87.0%) | 69 (14.6%) |
| Total | 154 (100.0%) | 474 (100.0%) |
Health & Disability in Pleasant Hill
Health Insurance Coverage by Age in Pleasant Hill
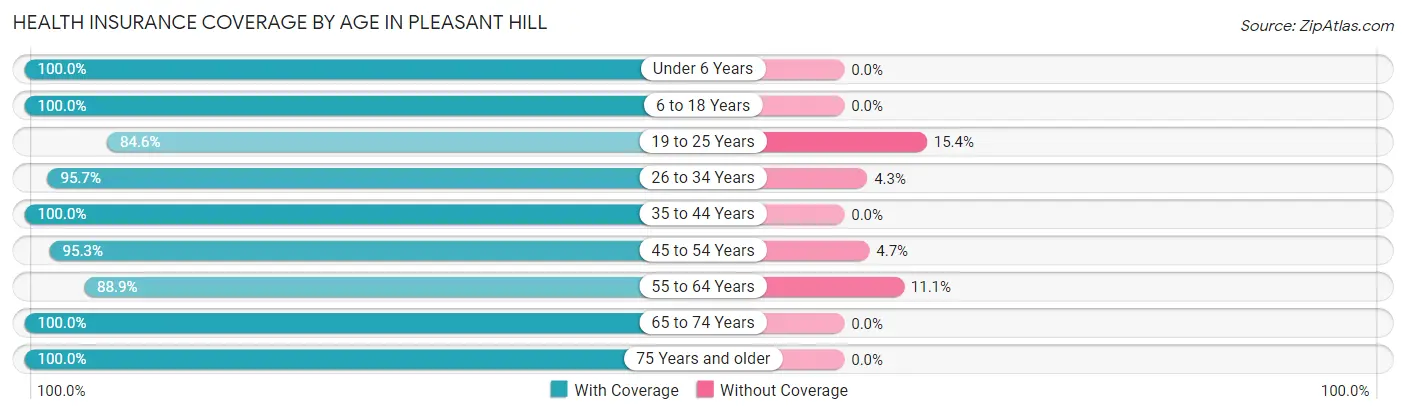
| Age Bracket | With Coverage | Without Coverage |
| Under 6 Years | 260 (100.0%) | 0 (0.0%) |
| 6 to 18 Years | 743 (100.0%) | 0 (0.0%) |
| 19 to 25 Years | 319 (84.6%) | 58 (15.4%) |
| 26 to 34 Years | 291 (95.7%) | 13 (4.3%) |
| 35 to 44 Years | 563 (100.0%) | 0 (0.0%) |
| 45 to 54 Years | 306 (95.3%) | 15 (4.7%) |
| 55 to 64 Years | 432 (88.9%) | 54 (11.1%) |
| 65 to 74 Years | 113 (100.0%) | 0 (0.0%) |
| 75 Years and older | 96 (100.0%) | 0 (0.0%) |
| Total | 3,123 (95.7%) | 140 (4.3%) |
Health Insurance Coverage by Citizenship Status in Pleasant Hill
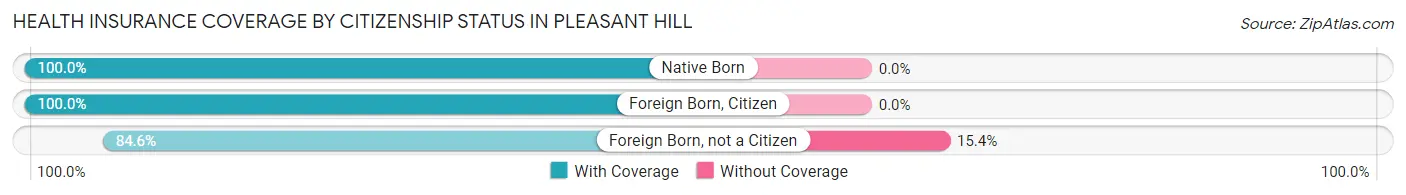
| Citizenship Status | With Coverage | Without Coverage |
| Native Born | 260 (100.0%) | 0 (0.0%) |
| Foreign Born, Citizen | 743 (100.0%) | 0 (0.0%) |
| Foreign Born, not a Citizen | 319 (84.6%) | 58 (15.4%) |
Health Insurance Coverage by Household Income in Pleasant Hill
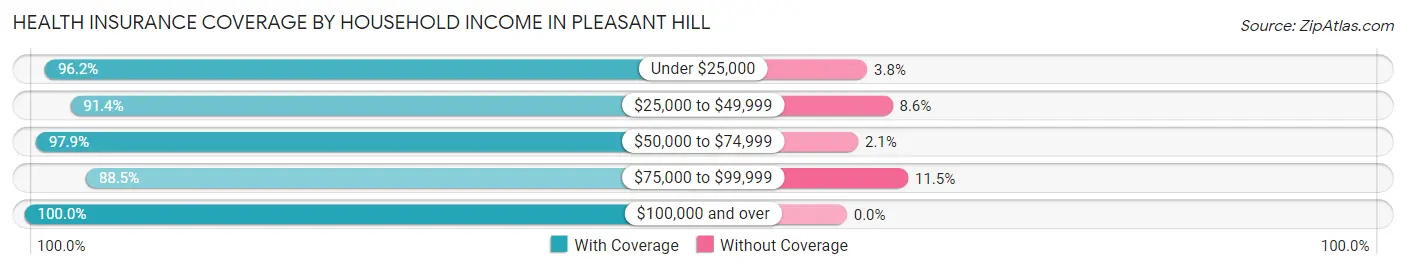
| Household Income | With Coverage | Without Coverage |
| Under $25,000 | 679 (96.2%) | 27 (3.8%) |
| $25,000 to $49,999 | 619 (91.4%) | 58 (8.6%) |
| $50,000 to $74,999 | 603 (97.9%) | 13 (2.1%) |
| $75,000 to $99,999 | 324 (88.5%) | 42 (11.5%) |
| $100,000 and over | 898 (100.0%) | 0 (0.0%) |
Public vs Private Health Insurance Coverage by Age in Pleasant Hill
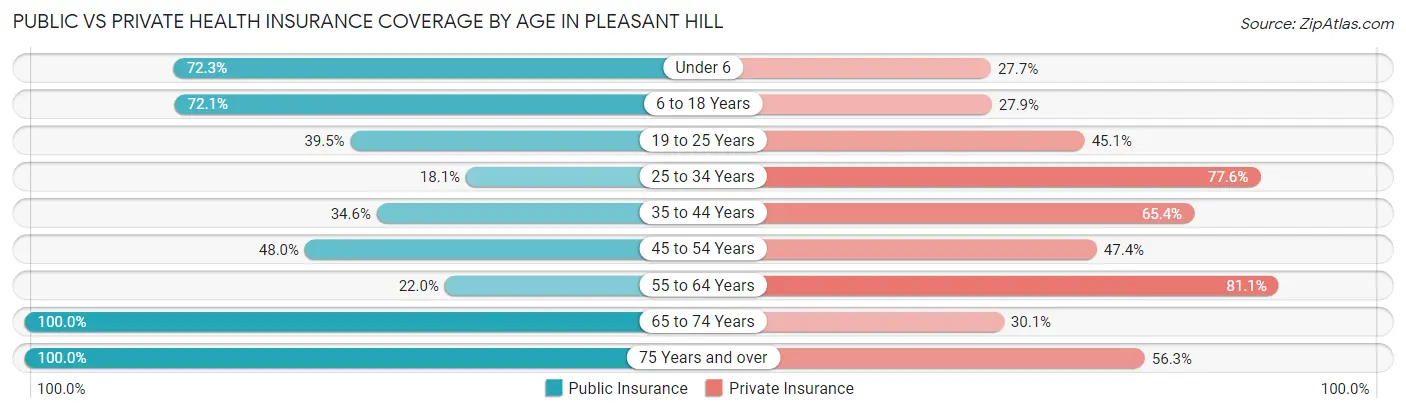
| Age Bracket | Public Insurance | Private Insurance |
| Under 6 | 188 (72.3%) | 72 (27.7%) |
| 6 to 18 Years | 536 (72.1%) | 207 (27.9%) |
| 19 to 25 Years | 149 (39.5%) | 170 (45.1%) |
| 25 to 34 Years | 55 (18.1%) | 236 (77.6%) |
| 35 to 44 Years | 195 (34.6%) | 368 (65.4%) |
| 45 to 54 Years | 154 (48.0%) | 152 (47.3%) |
| 55 to 64 Years | 107 (22.0%) | 394 (81.1%) |
| 65 to 74 Years | 113 (100.0%) | 34 (30.1%) |
| 75 Years and over | 96 (100.0%) | 54 (56.2%) |
| Total | 1,593 (48.8%) | 1,687 (51.7%) |
Disability Status by Sex by Age in Pleasant Hill
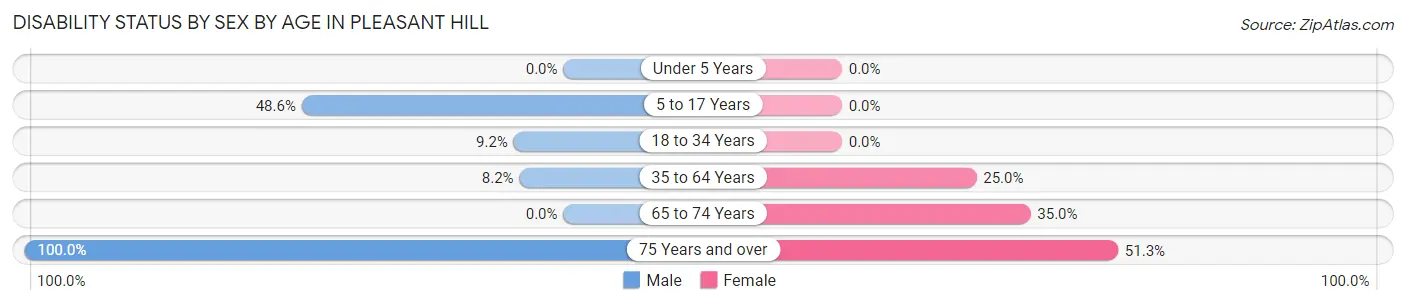
| Age Bracket | Male | Female |
| Under 5 Years | 0 (0.0%) | 0 (0.0%) |
| 5 to 17 Years | 152 (48.6%) | 0 (0.0%) |
| 18 to 34 Years | 38 (9.2%) | 0 (0.0%) |
| 35 to 64 Years | 51 (8.2%) | 186 (25.0%) |
| 65 to 74 Years | 0 (0.0%) | 21 (35.0%) |
| 75 Years and over | 16 (100.0%) | 41 (51.2%) |
Disability Class by Sex by Age in Pleasant Hill
Disability Class: Hearing Difficulty
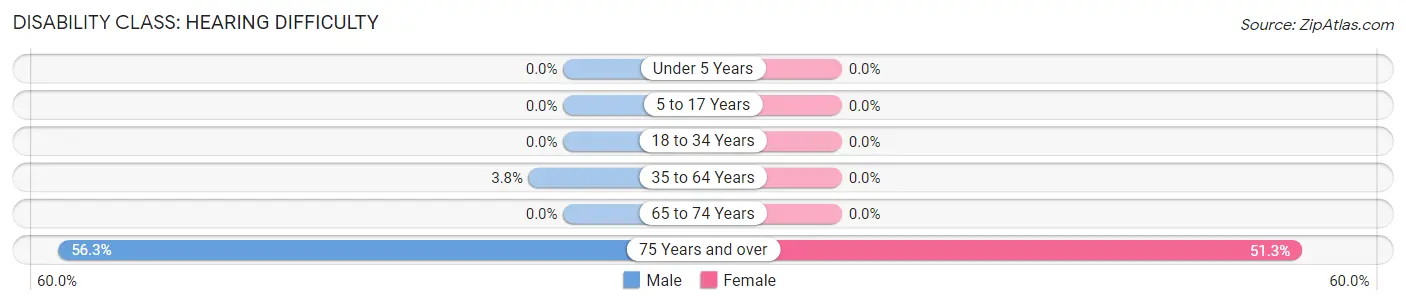
| Age Bracket | Male | Female |
| Under 5 Years | 0 (0.0%) | 0 (0.0%) |
| 5 to 17 Years | 0 (0.0%) | 0 (0.0%) |
| 18 to 34 Years | 0 (0.0%) | 0 (0.0%) |
| 35 to 64 Years | 24 (3.8%) | 0 (0.0%) |
| 65 to 74 Years | 0 (0.0%) | 0 (0.0%) |
| 75 Years and over | 9 (56.2%) | 41 (51.2%) |
Disability Class: Vision Difficulty
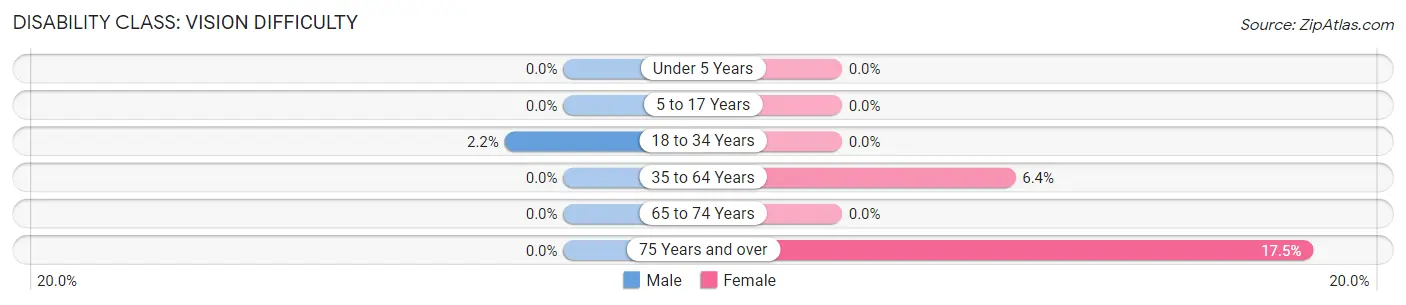
| Age Bracket | Male | Female |
| Under 5 Years | 0 (0.0%) | 0 (0.0%) |
| 5 to 17 Years | 0 (0.0%) | 0 (0.0%) |
| 18 to 34 Years | 9 (2.2%) | 0 (0.0%) |
| 35 to 64 Years | 0 (0.0%) | 48 (6.4%) |
| 65 to 74 Years | 0 (0.0%) | 0 (0.0%) |
| 75 Years and over | 0 (0.0%) | 14 (17.5%) |
Disability Class: Cognitive Difficulty
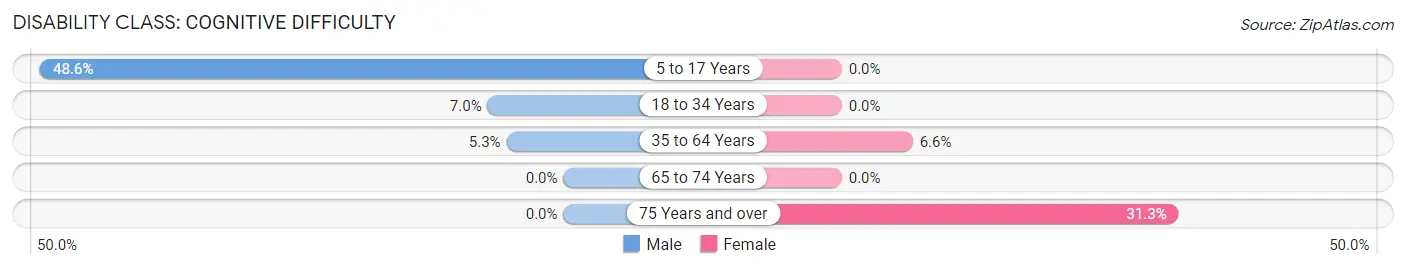
| Age Bracket | Male | Female |
| 5 to 17 Years | 152 (48.6%) | 0 (0.0%) |
| 18 to 34 Years | 29 (7.0%) | 0 (0.0%) |
| 35 to 64 Years | 33 (5.3%) | 49 (6.6%) |
| 65 to 74 Years | 0 (0.0%) | 0 (0.0%) |
| 75 Years and over | 0 (0.0%) | 25 (31.2%) |
Disability Class: Ambulatory Difficulty
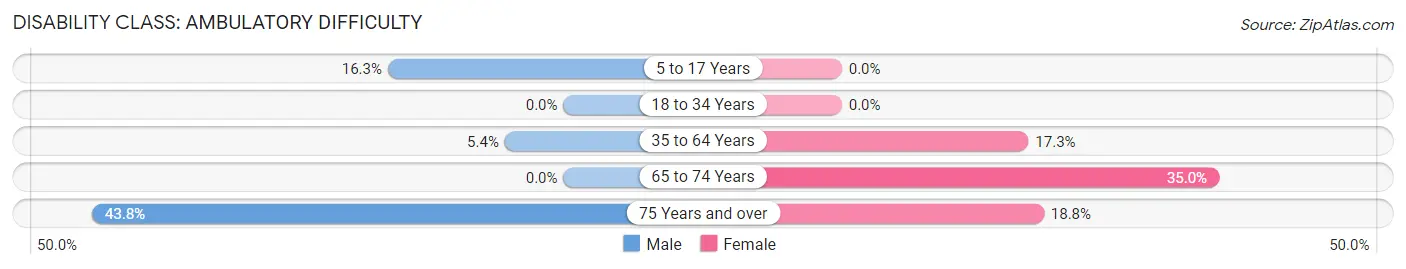
| Age Bracket | Male | Female |
| 5 to 17 Years | 51 (16.3%) | 0 (0.0%) |
| 18 to 34 Years | 0 (0.0%) | 0 (0.0%) |
| 35 to 64 Years | 34 (5.4%) | 129 (17.3%) |
| 65 to 74 Years | 0 (0.0%) | 21 (35.0%) |
| 75 Years and over | 7 (43.8%) | 15 (18.8%) |
Disability Class: Self-Care Difficulty
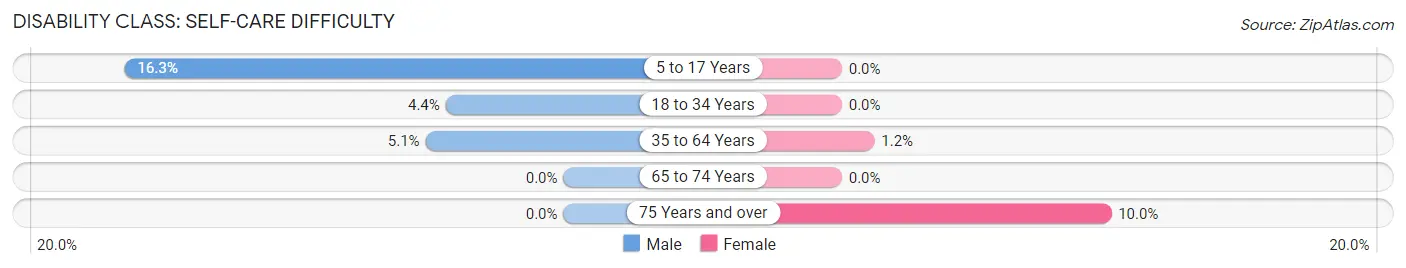
| Age Bracket | Male | Female |
| 5 to 17 Years | 51 (16.3%) | 0 (0.0%) |
| 18 to 34 Years | 18 (4.4%) | 0 (0.0%) |
| 35 to 64 Years | 32 (5.1%) | 9 (1.2%) |
| 65 to 74 Years | 0 (0.0%) | 0 (0.0%) |
| 75 Years and over | 0 (0.0%) | 8 (10.0%) |
Technology Access in Pleasant Hill
Computing Device Access in Pleasant Hill
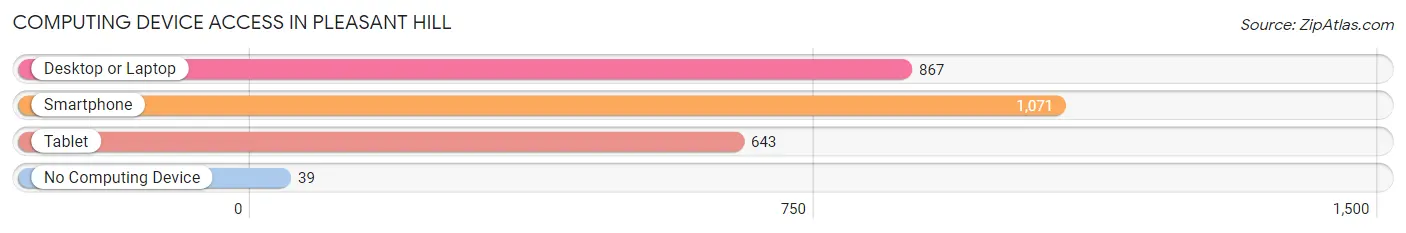
| Device Type | # Households | % Households |
| Desktop or Laptop | 867 | 74.6% |
| Smartphone | 1,071 | 92.1% |
| Tablet | 643 | 55.3% |
| No Computing Device | 39 | 3.4% |
| Total | 1,163 | 100.0% |
Internet Access in Pleasant Hill
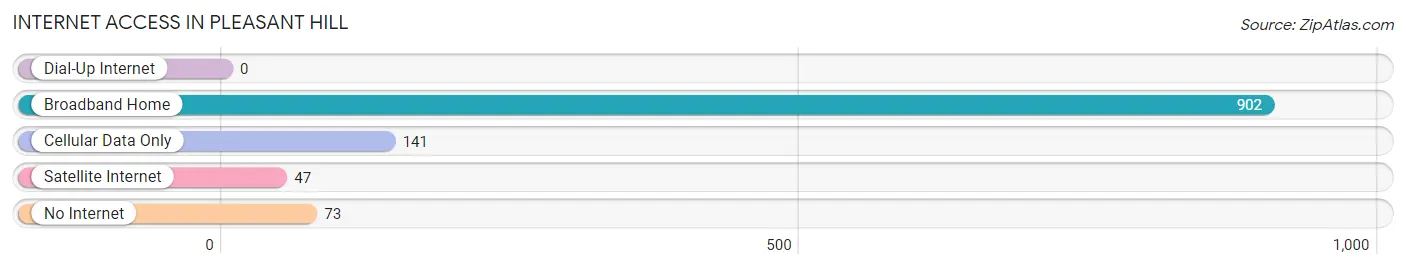
| Internet Type | # Households | % Households |
| Dial-Up Internet | 0 | 0.0% |
| Broadband Home | 902 | 77.6% |
| Cellular Data Only | 141 | 12.1% |
| Satellite Internet | 47 | 4.0% |
| No Internet | 73 | 6.3% |
| Total | 1,163 | 100.0% |
Pleasant Hill Summary
Pleasant Hill is a small borough located in the state of Pennsylvania. It is situated in the northwest corner of the state, in the Allegheny Mountains. The borough is located in the county of Bedford, and is part of the Altoona Metropolitan Statistical Area. The population of Pleasant Hill was 1,093 at the 2010 census.
Geography
Pleasant Hill is located at 40°14'45" North, 78°37'45" West (40.245833, -78.629167). According to the United States Census Bureau, the borough has a total area of 0.3 square miles (0.8 km2), all of it land.
The borough is located in the Allegheny Mountains, and is surrounded by the townships of Bedford, East St. Clair, and West St. Clair. The borough is situated on a hill, and is bordered by the Raystown Branch of the Juniata River to the east.
Economy
The economy of Pleasant Hill is largely based on agriculture and tourism. The borough is home to several small farms, which produce a variety of crops, including corn, soybeans, and hay. The borough also has several small businesses, including a general store, a gas station, and a restaurant.
Tourism is an important part of the economy of Pleasant Hill. The borough is home to several attractions, including the Raystown Lake, which is a popular destination for fishing, boating, and camping. The borough also has several historic sites, including the Pleasant Hill Historic District, which is listed on the National Register of Historic Places.
Demographics
As of the census of 2010, there were 1,093 people, 441 households, and 294 families residing in the borough. The population density was 3,633.3 people per square mile (1,400.2/km2). There were 471 housing units at an average density of 1,566.7 per square mile (604.3/km2). The racial makeup of the borough was 97.7% White, 0.2% African American, 0.2% Native American, 0.2% Asian, 0.2% from other races, and 1.7% from two or more races. Hispanic or Latino of any race were 0.7% of the population.
There were 441 households, out of which 28.2% had children under the age of 18 living with them, 51.6% were married couples living together, 9.3% had a female householder with no husband present, and 34.2% were non-families. 29.2% of all households were made up of individuals, and 14.3% had someone living alone who was 65 years of age or older. The average household size was 2.48 and the average family size was 3.06.
In the borough, the population was spread out, with 24.2% under the age of 18, 7.2% from 18 to 24, 27.2% from 25 to 44, 24.2% from 45 to 64, and 17.2% who were 65 years of age or older. The median age was 39 years. For every 100 females, there were 94.2 males. For every 100 females age 18 and over, there were 91.2 males.
The median income for a household in the borough was $35,000, and the median income for a family was $41,250. Males had a median income of $30,000 versus $21,250 for females. The per capita income for the borough was $17,845. About 8.2% of families and 10.2% of the population were below the poverty line, including 14.3% of those under age 18 and 8.2% of those age 65 or over.
Common Questions
What is Per Capita Income in Pleasant Hill?
Per Capita income in Pleasant Hill is $26,465.
What is the Median Family Income in Pleasant Hill?
Median Family Income in Pleasant Hill is $58,446.
What is the Median Household income in Pleasant Hill?
Median Household Income in Pleasant Hill is $58,366.
What is Income or Wage Gap in Pleasant Hill?
Income or Wage Gap in Pleasant Hill is 26.1%.
Women in Pleasant Hill earn 73.9 cents for every dollar earned by a man.
What is Family Income Deficit in Pleasant Hill?
Family Income Deficit in Pleasant Hill is $23,836.
Families that are below poverty line in Pleasant Hill earn $23,836 less on average than the poverty threshold level.
What is Inequality or Gini Index in Pleasant Hill?
Inequality or Gini Index in Pleasant Hill is 0.39.
What is the Total Population of Pleasant Hill?
Total Population of Pleasant Hill is 3,263.
What is the Total Male Population of Pleasant Hill?
Total Male Population of Pleasant Hill is 1,607.
What is the Total Female Population of Pleasant Hill?
Total Female Population of Pleasant Hill is 1,656.
What is the Ratio of Males per 100 Females in Pleasant Hill?
There are 97.04 Males per 100 Females in Pleasant Hill.
What is the Ratio of Females per 100 Males in Pleasant Hill?
There are 103.05 Females per 100 Males in Pleasant Hill.
What is the Median Population Age in Pleasant Hill?
Median Population Age in Pleasant Hill is 33.8 Years.
What is the Average Family Size in Pleasant Hill
Average Family Size in Pleasant Hill is 3.1 People.
What is the Average Household Size in Pleasant Hill
Average Household Size in Pleasant Hill is 2.8 People.
How Large is the Labor Force in Pleasant Hill?
There are 1,718 People in the Labor Forcein in Pleasant Hill.
What is the Percentage of People in the Labor Force in Pleasant Hill?
72.3% of People are in the Labor Force in Pleasant Hill.
What is the Unemployment Rate in Pleasant Hill?
Unemployment Rate in Pleasant Hill is 19.7%.