Freemansburg borough, PA Map & Demographics
Freemansburg borough Overview
$30,557
PER CAPITA INCOME
$98,214
AVG FAMILY INCOME
$94,902
AVG HOUSEHOLD INCOME
21.4%
WAGE / INCOME GAP [ % ]
78.6¢/ $1
WAGE / INCOME GAP [ $ ]
0.34
INEQUALITY / GINI INDEX
2,861
TOTAL POPULATION
1,315
MALE POPULATION
1,546
FEMALE POPULATION
85.06
MALES / 100 FEMALES
117.57
FEMALES / 100 MALES
41.0
MEDIAN AGE
2.4
AVG FAMILY SIZE
2.3
AVG HOUSEHOLD SIZE
1,529
LABOR FORCE [ PEOPLE ]
64.8%
PERCENT IN LABOR FORCE
4.8%
UNEMPLOYMENT RATE
Income in Freemansburg borough
Income Overview in Freemansburg borough
Per Capita Income in Freemansburg borough is $30,557, while median incomes of families and households are $98,214 and $94,902 respectively.
| Characteristic | Number | Measure |
| Per Capita Income | 2,861 | $30,557 |
| Median Family Income | 1,032 | $98,214 |
| Mean Family Income | 1,032 | $115,571 |
| Median Household Income | 1,224 | $94,902 |
| Mean Household Income | 1,224 | $110,306 |
| Income Deficit | 1,032 | $0 |
| Wage / Income Gap (%) | 2,861 | 21.37% |
| Wage / Income Gap ($) | 2,861 | 78.63¢ per $1 |
| Gini / Inequality Index | 2,861 | 0.34 |
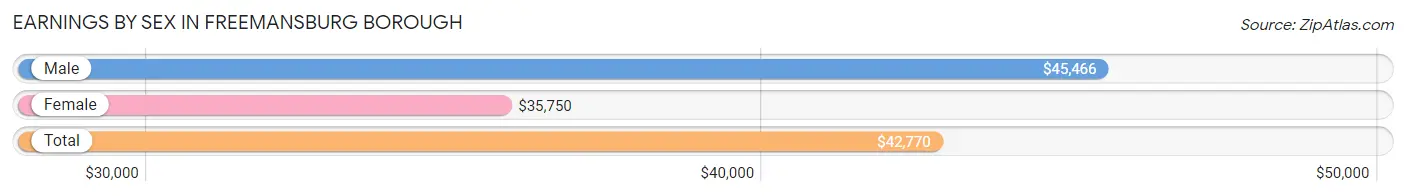
Earnings by Sex in Freemansburg borough
Average Earnings in Freemansburg borough are $42,770, $45,466 for men and $35,750 for women, a difference of 21.4%.
| Sex | Number | Average Earnings |
| Male | 862 (55.0%) | $45,466 |
| Female | 705 (45.0%) | $35,750 |
| Total | 1,567 (100.0%) | $42,770 |
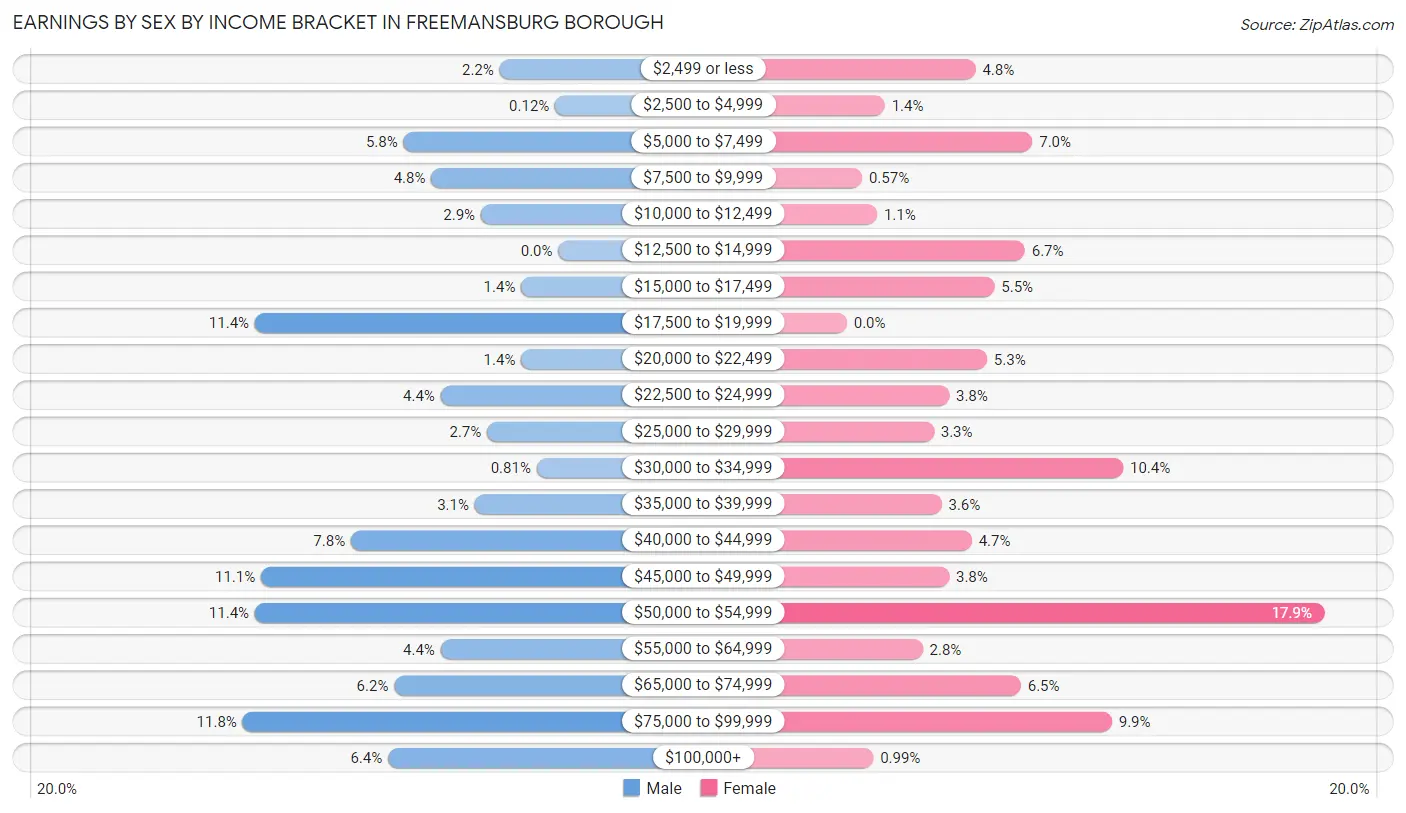
Earnings by Sex by Income Bracket in Freemansburg borough
The most common earnings brackets in Freemansburg borough are $75,000 to $99,999 for men (102 | 11.8%) and $50,000 to $54,999 for women (126 | 17.9%).
| Income | Male | Female |
| $2,499 or less | 19 (2.2%) | 34 (4.8%) |
| $2,500 to $4,999 | 1 (0.1%) | 10 (1.4%) |
| $5,000 to $7,499 | 50 (5.8%) | 49 (7.0%) |
| $7,500 to $9,999 | 41 (4.8%) | 4 (0.6%) |
| $10,000 to $12,499 | 25 (2.9%) | 8 (1.1%) |
| $12,500 to $14,999 | 0 (0.0%) | 47 (6.7%) |
| $15,000 to $17,499 | 12 (1.4%) | 39 (5.5%) |
| $17,500 to $19,999 | 98 (11.4%) | 0 (0.0%) |
| $20,000 to $22,499 | 12 (1.4%) | 37 (5.2%) |
| $22,500 to $24,999 | 38 (4.4%) | 27 (3.8%) |
| $25,000 to $29,999 | 23 (2.7%) | 23 (3.3%) |
| $30,000 to $34,999 | 7 (0.8%) | 73 (10.3%) |
| $35,000 to $39,999 | 27 (3.1%) | 25 (3.5%) |
| $40,000 to $44,999 | 67 (7.8%) | 33 (4.7%) |
| $45,000 to $49,999 | 96 (11.1%) | 27 (3.8%) |
| $50,000 to $54,999 | 98 (11.4%) | 126 (17.9%) |
| $55,000 to $64,999 | 38 (4.4%) | 20 (2.8%) |
| $65,000 to $74,999 | 53 (6.1%) | 46 (6.5%) |
| $75,000 to $99,999 | 102 (11.8%) | 70 (9.9%) |
| $100,000+ | 55 (6.4%) | 7 (1.0%) |
| Total | 862 (100.0%) | 705 (100.0%) |
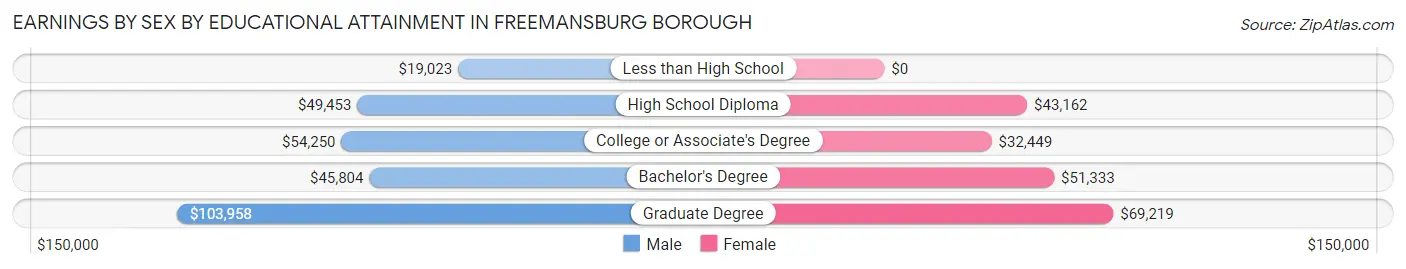
Earnings by Sex by Educational Attainment in Freemansburg borough
Average earnings in Freemansburg borough are $47,245 for men and $44,924 for women, a difference of 4.9%. Men with an educational attainment of graduate degree enjoy the highest average annual earnings of $103,958, while those with less than high school education earn the least with $19,023. Women with an educational attainment of graduate degree earn the most with the average annual earnings of $69,219, while those with college or associate's degree education have the smallest earnings of $32,449.
| Educational Attainment | Male Income | Female Income |
| Less than High School | $19,023 | $0 |
| High School Diploma | $49,453 | $43,162 |
| College or Associate's Degree | $54,250 | $32,449 |
| Bachelor's Degree | $45,804 | $51,333 |
| Graduate Degree | $103,958 | $69,219 |
| Total | $47,245 | $44,924 |
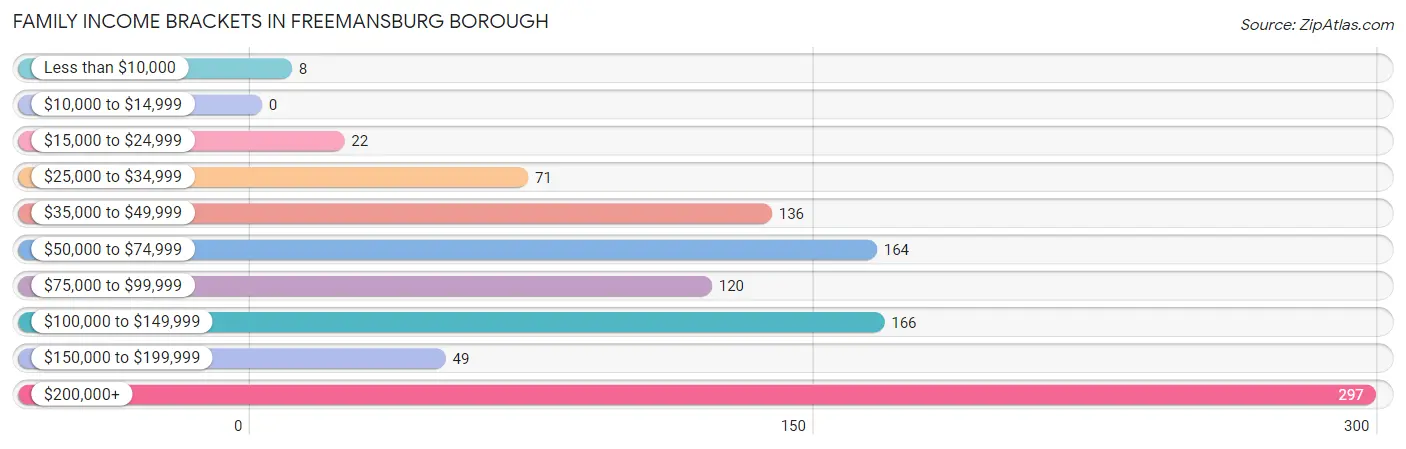
Family Income in Freemansburg borough
Family Income Brackets in Freemansburg borough
According to the Freemansburg borough family income data, there are 297 families falling into the $200,000+ income range, which is the most common income bracket and makes up 28.8% of all families.
| Income Bracket | # Families | % Families |
| Less than $10,000 | 8 | 0.8% |
| $10,000 to $14,999 | 0 | 0.0% |
| $15,000 to $24,999 | 22 | 2.1% |
| $25,000 to $34,999 | 71 | 6.9% |
| $35,000 to $49,999 | 136 | 13.2% |
| $50,000 to $74,999 | 164 | 15.9% |
| $75,000 to $99,999 | 120 | 11.6% |
| $100,000 to $149,999 | 166 | 16.1% |
| $150,000 to $199,999 | 49 | 4.7% |
| $200,000+ | 297 | 28.8% |
Family Income by Famaliy Size in Freemansburg borough
5-person families (55 | 5.3%) account for the highest median family income in Freemansburg borough with $150,170 per family, while 5-person families (55 | 5.3%) have the highest median income of $30,034 per family member.
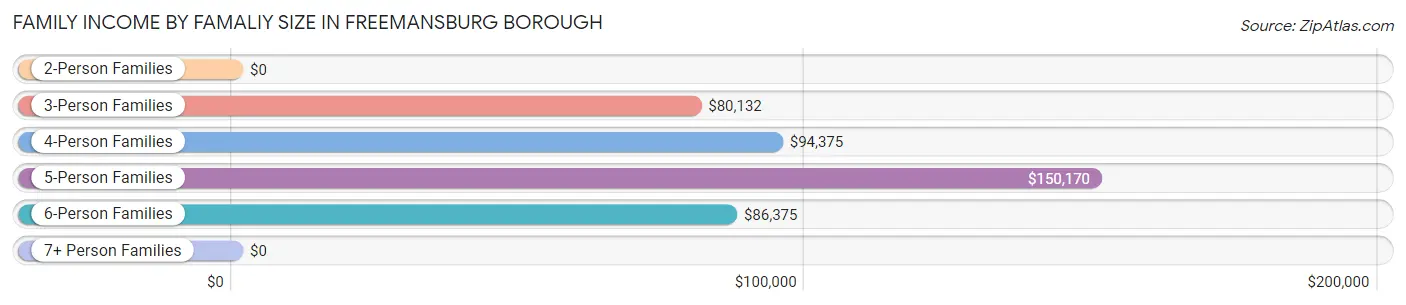
| Income Bracket | # Families | Median Income |
| 2-Person Families | 599 (58.0%) | $0 |
| 3-Person Families | 224 (21.7%) | $80,132 |
| 4-Person Families | 125 (12.1%) | $94,375 |
| 5-Person Families | 55 (5.3%) | $150,170 |
| 6-Person Families | 29 (2.8%) | $86,375 |
| 7+ Person Families | 0 (0.0%) | $0 |
| Total | 1,032 (100.0%) | $98,214 |
Family Income by Number of Earners in Freemansburg borough
The median family income in Freemansburg borough is $98,214, with families comprising no earners (330) having the highest median family income of $208,376, while families with 1 earner (220) have the lowest median family income of $55,321, accounting for 32.0% and 21.3% of families, respectively.
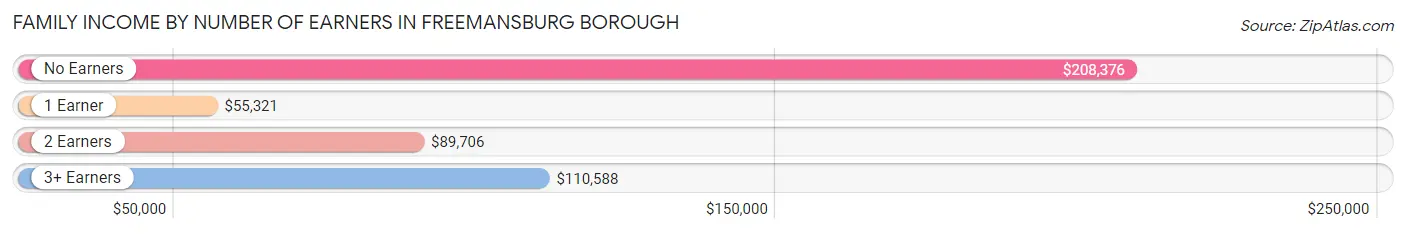
| Number of Earners | # Families | Median Income |
| No Earners | 330 (32.0%) | $208,376 |
| 1 Earner | 220 (21.3%) | $55,321 |
| 2 Earners | 362 (35.1%) | $89,706 |
| 3+ Earners | 120 (11.6%) | $110,588 |
| Total | 1,032 (100.0%) | $98,214 |
Household Income in Freemansburg borough
Household Income Brackets in Freemansburg borough
With 297 households falling in the category, the $200,000+ income range is the most frequent in Freemansburg borough, accounting for 24.3% of all households. In contrast, only 4 households (0.3%) fall into the $10,000 to $14,999 income bracket, making it the least populous group.
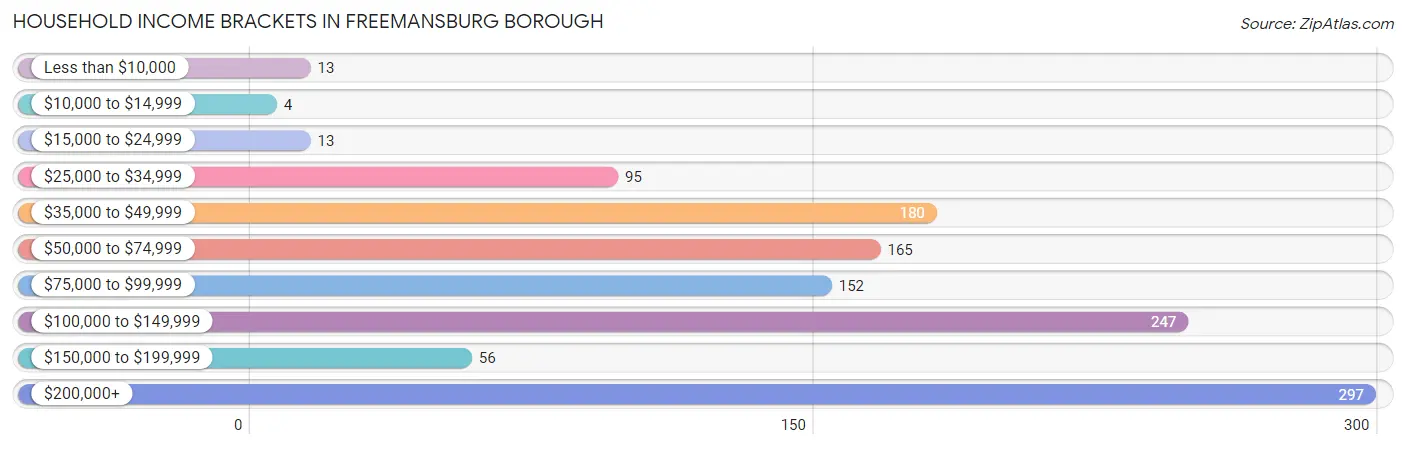
| Income Bracket | # Households | % Households |
| Less than $10,000 | 13 | 1.1% |
| $10,000 to $14,999 | 4 | 0.3% |
| $15,000 to $24,999 | 13 | 1.1% |
| $25,000 to $34,999 | 95 | 7.8% |
| $35,000 to $49,999 | 180 | 14.7% |
| $50,000 to $74,999 | 165 | 13.5% |
| $75,000 to $99,999 | 152 | 12.4% |
| $100,000 to $149,999 | 247 | 20.2% |
| $150,000 to $199,999 | 56 | 4.6% |
| $200,000+ | 297 | 24.3% |
Household Income by Householder Age in Freemansburg borough
The median household income in Freemansburg borough is $94,902, with the highest median household income of $118,036 found in the 45 to 64 years age bracket for the primary householder. A total of 727 households (59.4%) fall into this category. Meanwhile, the 15 to 24 years age bracket for the primary householder has the lowest median household income of $0, with 8 households (0.6%) in this group.
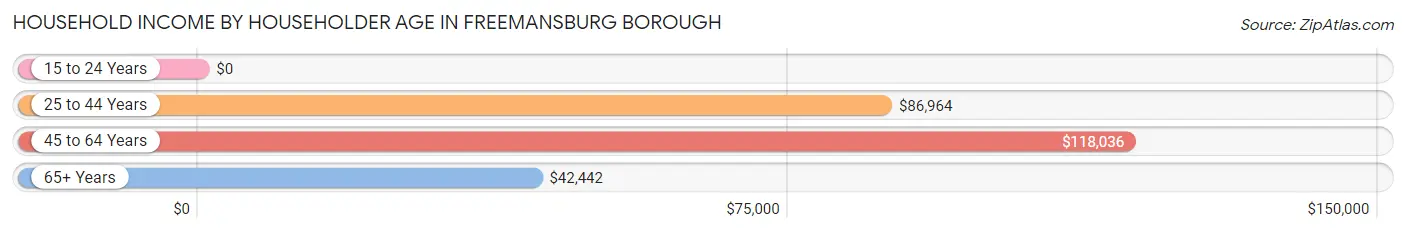
| Income Bracket | # Households | Median Income |
| 15 to 24 Years | 8 (0.6%) | $0 |
| 25 to 44 Years | 357 (29.2%) | $86,964 |
| 45 to 64 Years | 727 (59.4%) | $118,036 |
| 65+ Years | 132 (10.8%) | $42,442 |
| Total | 1,224 (100.0%) | $94,902 |
Poverty in Freemansburg borough
Income Below Poverty by Sex and Age in Freemansburg borough
With 7.7% poverty level for males and 2.9% for females among the residents of Freemansburg borough, under 5 year old males and 65 to 74 year old females are the most vulnerable to poverty, with 9 males (40.9%) and 9 females (14.5%) in their respective age groups living below the poverty level.
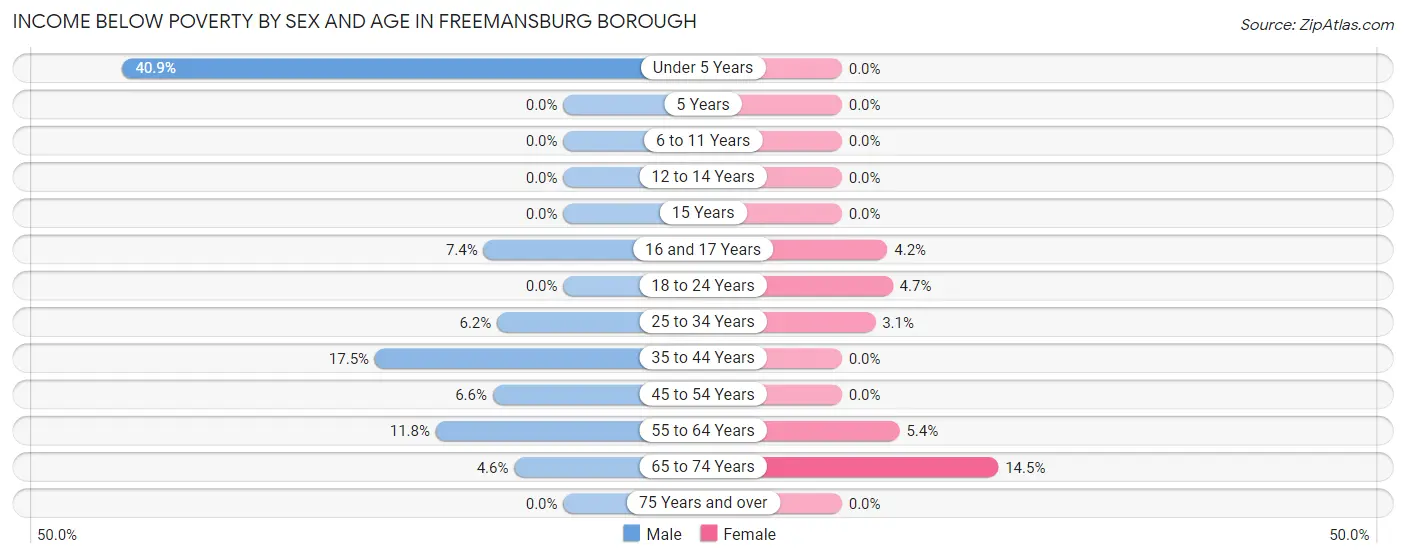
| Age Bracket | Male | Female |
| Under 5 Years | 9 (40.9%) | 0 (0.0%) |
| 5 Years | 0 (0.0%) | 0 (0.0%) |
| 6 to 11 Years | 0 (0.0%) | 0 (0.0%) |
| 12 to 14 Years | 0 (0.0%) | 0 (0.0%) |
| 15 Years | 0 (0.0%) | 0 (0.0%) |
| 16 and 17 Years | 4 (7.4%) | 3 (4.2%) |
| 18 to 24 Years | 0 (0.0%) | 5 (4.7%) |
| 25 to 34 Years | 12 (6.1%) | 4 (3.1%) |
| 35 to 44 Years | 32 (17.5%) | 0 (0.0%) |
| 45 to 54 Years | 11 (6.6%) | 0 (0.0%) |
| 55 to 64 Years | 29 (11.8%) | 23 (5.3%) |
| 65 to 74 Years | 4 (4.5%) | 9 (14.5%) |
| 75 Years and over | 0 (0.0%) | 0 (0.0%) |
| Total | 101 (7.7%) | 44 (2.9%) |
Income Above Poverty by Sex and Age in Freemansburg borough
According to the poverty statistics in Freemansburg borough, males aged 5 years and females aged under 5 years are the age groups that are most secure financially, with 100.0% of males and 100.0% of females in these age groups living above the poverty line.
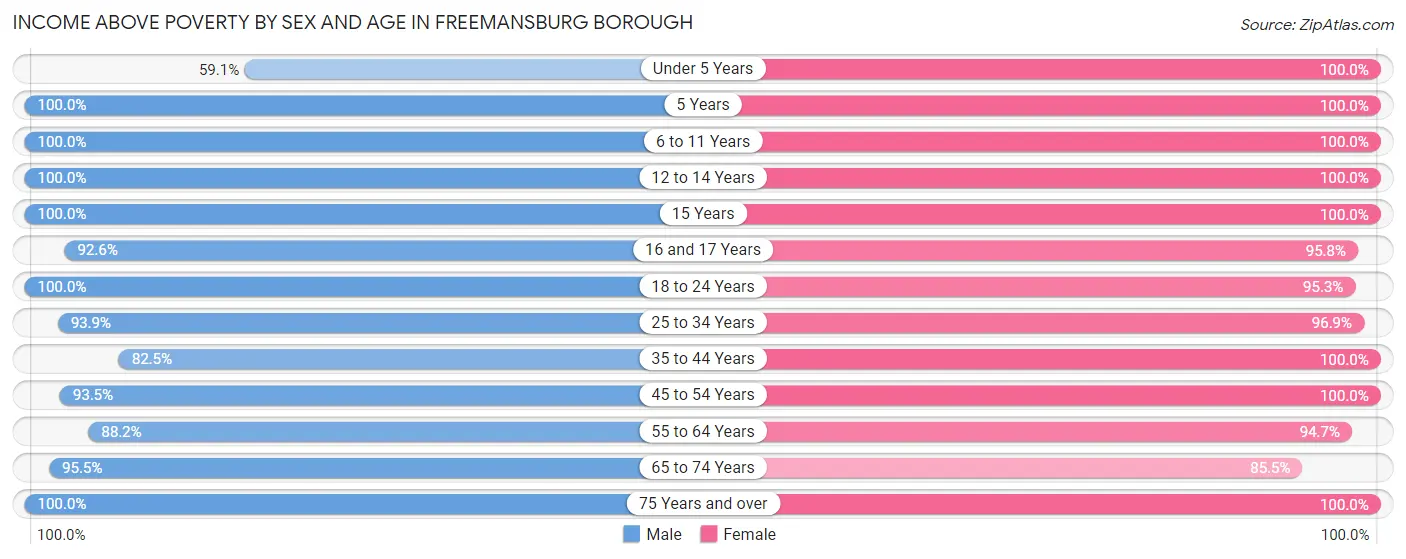
| Age Bracket | Male | Female |
| Under 5 Years | 13 (59.1%) | 52 (100.0%) |
| 5 Years | 14 (100.0%) | 21 (100.0%) |
| 6 to 11 Years | 87 (100.0%) | 108 (100.0%) |
| 12 to 14 Years | 122 (100.0%) | 42 (100.0%) |
| 15 Years | 16 (100.0%) | 18 (100.0%) |
| 16 and 17 Years | 50 (92.6%) | 68 (95.8%) |
| 18 to 24 Years | 82 (100.0%) | 101 (95.3%) |
| 25 to 34 Years | 183 (93.9%) | 125 (96.9%) |
| 35 to 44 Years | 151 (82.5%) | 235 (100.0%) |
| 45 to 54 Years | 157 (93.4%) | 172 (100.0%) |
| 55 to 64 Years | 216 (88.2%) | 407 (94.7%) |
| 65 to 74 Years | 84 (95.5%) | 53 (85.5%) |
| 75 Years and over | 39 (100.0%) | 100 (100.0%) |
| Total | 1,214 (92.3%) | 1,502 (97.2%) |
Income Below Poverty Among Married-Couple Families in Freemansburg borough
The poverty statistics for married-couple families in Freemansburg borough show that 0.6% or 3 of the total 525 families live below the poverty line. Families with no children have the highest poverty rate of 0.9%, comprising of 3 families. On the other hand, families with 1 or 2 children have the lowest poverty rate of 0.0%, which includes 0 families.
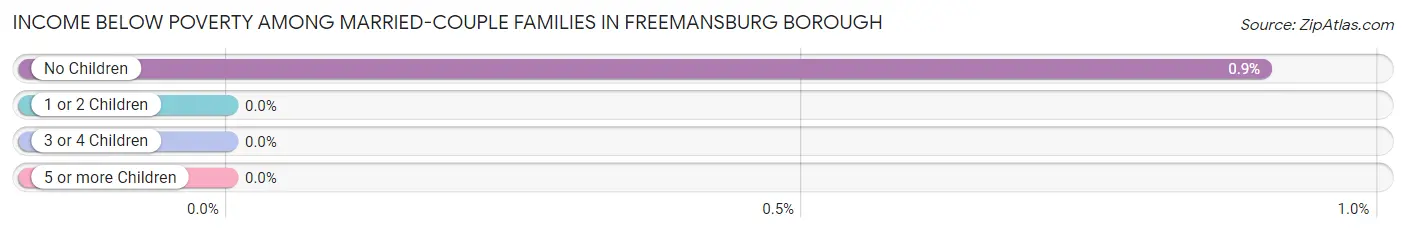
| Children | Above Poverty | Below Poverty |
| No Children | 330 (99.1%) | 3 (0.9%) |
| 1 or 2 Children | 148 (100.0%) | 0 (0.0%) |
| 3 or 4 Children | 44 (100.0%) | 0 (0.0%) |
| 5 or more Children | 0 (0.0%) | 0 (0.0%) |
| Total | 522 (99.4%) | 3 (0.6%) |
Income Below Poverty Among Single-Parent Households in Freemansburg borough
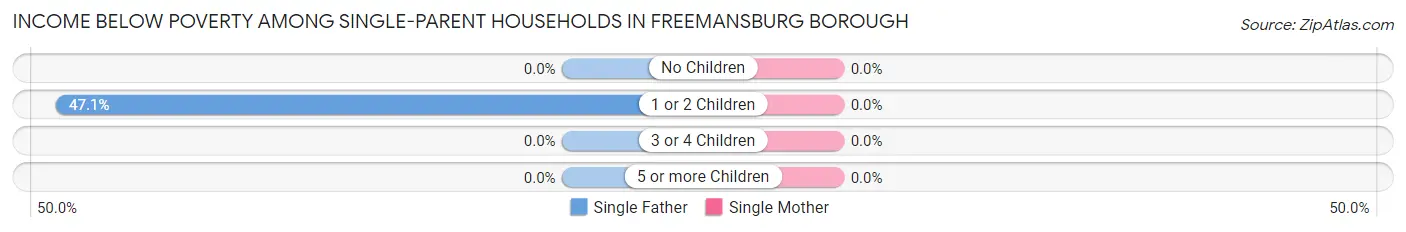
| Children | Single Father | Single Mother |
| No Children | 0 (0.0%) | 0 (0.0%) |
| 1 or 2 Children | 16 (47.1%) | 0 (0.0%) |
| 3 or 4 Children | 0 (0.0%) | 0 (0.0%) |
| 5 or more Children | 0 (0.0%) | 0 (0.0%) |
| Total | 16 (45.7%) | 0 (0.0%) |
Income Below Poverty Among Married-Couple vs Single-Parent Households in Freemansburg borough
The poverty data for Freemansburg borough shows that 3 of the married-couple family households (0.6%) and 16 of the single-parent households (3.2%) are living below the poverty level. Within the married-couple family households, those with no children have the highest poverty rate, with 3 households (0.9%) falling below the poverty line. Among the single-parent households, those with 1 or 2 children have the highest poverty rate, with 16 household (11.8%) living below poverty.
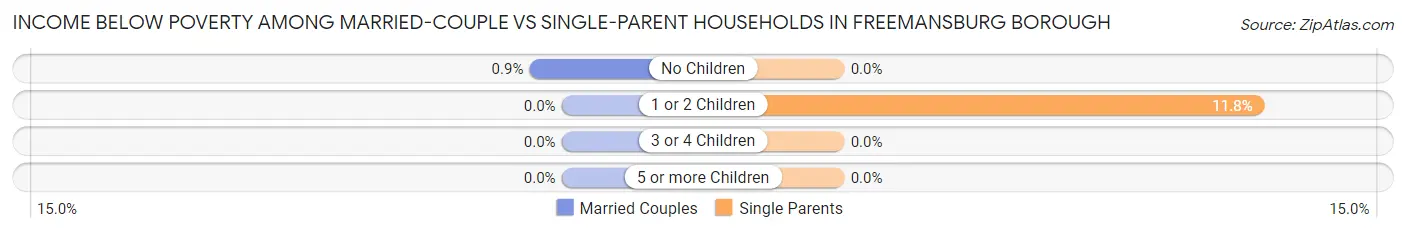
| Children | Married-Couple Families | Single-Parent Households |
| No Children | 3 (0.9%) | 0 (0.0%) |
| 1 or 2 Children | 0 (0.0%) | 16 (11.8%) |
| 3 or 4 Children | 0 (0.0%) | 0 (0.0%) |
| 5 or more Children | 0 (0.0%) | 0 (0.0%) |
| Total | 3 (0.6%) | 16 (3.2%) |
Race in Freemansburg borough
The most populous races in Freemansburg borough are White / Caucasian (1,526 | 53.3%), Hispanic or Latino (898 | 31.4%), and Two or more Races (564 | 19.7%).
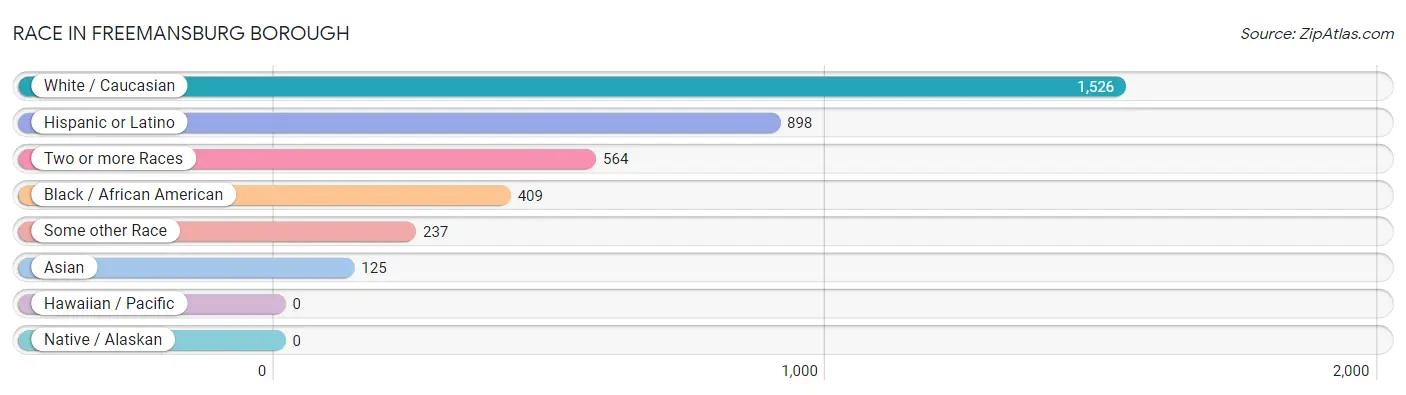
| Race | # Population | % Population |
| Asian | 125 | 4.4% |
| Black / African American | 409 | 14.3% |
| Hawaiian / Pacific | 0 | 0.0% |
| Hispanic or Latino | 898 | 31.4% |
| Native / Alaskan | 0 | 0.0% |
| White / Caucasian | 1,526 | 53.3% |
| Two or more Races | 564 | 19.7% |
| Some other Race | 237 | 8.3% |
| Total | 2,861 | 100.0% |
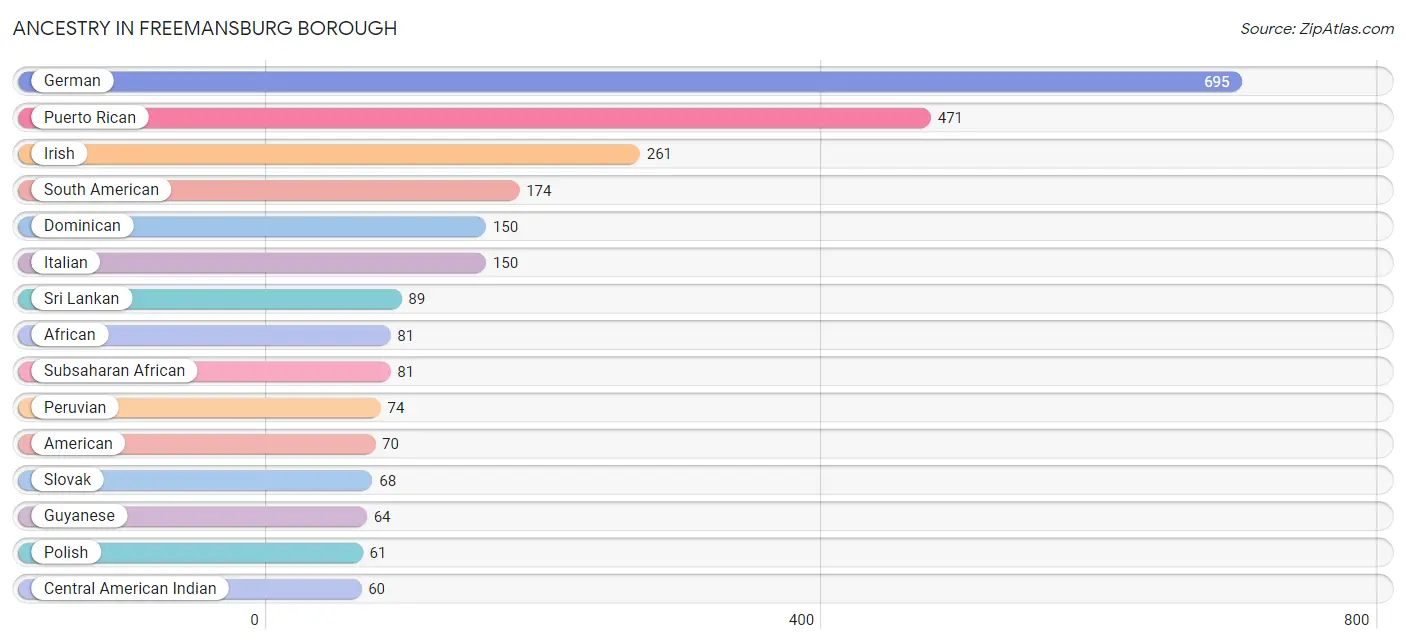
Ancestry in Freemansburg borough
The most populous ancestries reported in Freemansburg borough are German (695 | 24.3%), Puerto Rican (471 | 16.5%), Irish (261 | 9.1%), South American (174 | 6.1%), and Dominican (150 | 5.2%), together accounting for 61.2% of all Freemansburg borough residents.
| Ancestry | # Population | % Population |
| African | 81 | 2.8% |
| American | 70 | 2.5% |
| Austrian | 4 | 0.1% |
| Barbadian | 5 | 0.2% |
| British | 5 | 0.2% |
| Celtic | 7 | 0.2% |
| Central American | 7 | 0.2% |
| Central American Indian | 60 | 2.1% |
| Colombian | 41 | 1.4% |
| Cuban | 26 | 0.9% |
| Czechoslovakian | 32 | 1.1% |
| Dominican | 150 | 5.2% |
| Dutch | 40 | 1.4% |
| Ecuadorian | 59 | 2.1% |
| English | 57 | 2.0% |
| French | 20 | 0.7% |
| French Canadian | 5 | 0.2% |
| German | 695 | 24.3% |
| Greek | 5 | 0.2% |
| Guyanese | 64 | 2.2% |
| Haitian | 54 | 1.9% |
| Honduran | 7 | 0.2% |
| Hungarian | 44 | 1.5% |
| Indian (Asian) | 36 | 1.3% |
| Irish | 261 | 9.1% |
| Italian | 150 | 5.2% |
| Latvian | 5 | 0.2% |
| Mexican | 50 | 1.8% |
| Native Hawaiian | 9 | 0.3% |
| Norwegian | 11 | 0.4% |
| Pennsylvania German | 37 | 1.3% |
| Peruvian | 74 | 2.6% |
| Polish | 61 | 2.1% |
| Portuguese | 27 | 0.9% |
| Puerto Rican | 471 | 16.5% |
| Russian | 19 | 0.7% |
| Scottish | 26 | 0.9% |
| Slovak | 68 | 2.4% |
| Slovene | 25 | 0.9% |
| South American | 174 | 6.1% |
| Spaniard | 6 | 0.2% |
| Spanish | 7 | 0.2% |
| Spanish American | 7 | 0.2% |
| Sri Lankan | 89 | 3.1% |
| Subsaharan African | 81 | 2.8% |
| Welsh | 16 | 0.6% | View All 46 Rows |
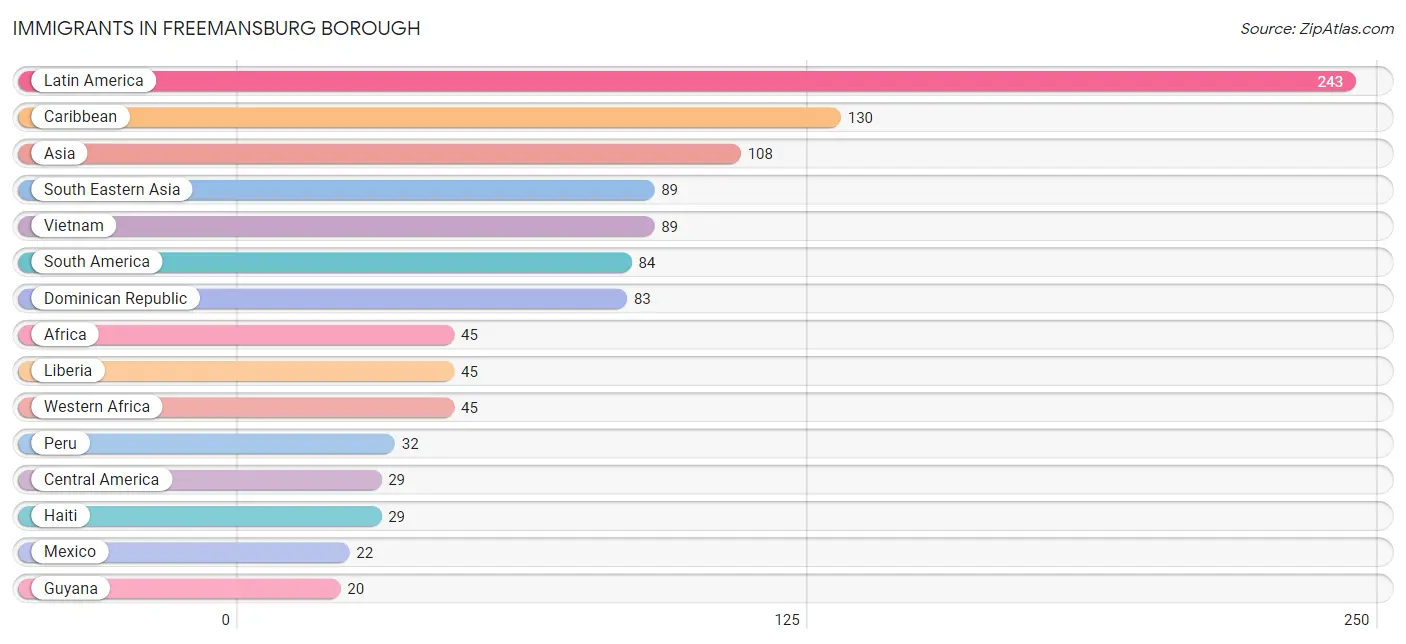
Immigrants in Freemansburg borough
The most numerous immigrant groups reported in Freemansburg borough came from Latin America (243 | 8.5%), Caribbean (130 | 4.5%), Asia (108 | 3.8%), South Eastern Asia (89 | 3.1%), and Vietnam (89 | 3.1%), together accounting for 23.0% of all Freemansburg borough residents.
| Immigration Origin | # Population | % Population |
| Africa | 45 | 1.6% |
| Asia | 108 | 3.8% |
| Barbados | 5 | 0.2% |
| Brazil | 3 | 0.1% |
| Caribbean | 130 | 4.5% |
| Central America | 29 | 1.0% |
| China | 19 | 0.7% |
| Colombia | 14 | 0.5% |
| Dominican Republic | 83 | 2.9% |
| Eastern Asia | 19 | 0.7% |
| Eastern Europe | 9 | 0.3% |
| Ecuador | 15 | 0.5% |
| Europe | 14 | 0.5% |
| Guyana | 20 | 0.7% |
| Haiti | 29 | 1.0% |
| Honduras | 7 | 0.2% |
| Latin America | 243 | 8.5% |
| Liberia | 45 | 1.6% |
| Mexico | 22 | 0.8% |
| Peru | 32 | 1.1% |
| Poland | 8 | 0.3% |
| Portugal | 5 | 0.2% |
| Russia | 1 | 0.0% |
| South America | 84 | 2.9% |
| South Eastern Asia | 89 | 3.1% |
| Southern Europe | 5 | 0.2% |
| Trinidad and Tobago | 13 | 0.4% |
| Vietnam | 89 | 3.1% |
| Western Africa | 45 | 1.6% | View All 29 Rows |
Sex and Age in Freemansburg borough
Sex and Age in Freemansburg borough
The most populous age groups in Freemansburg borough are 55 to 59 Years (170 | 12.9%) for men and 55 to 59 Years (335 | 21.7%) for women.
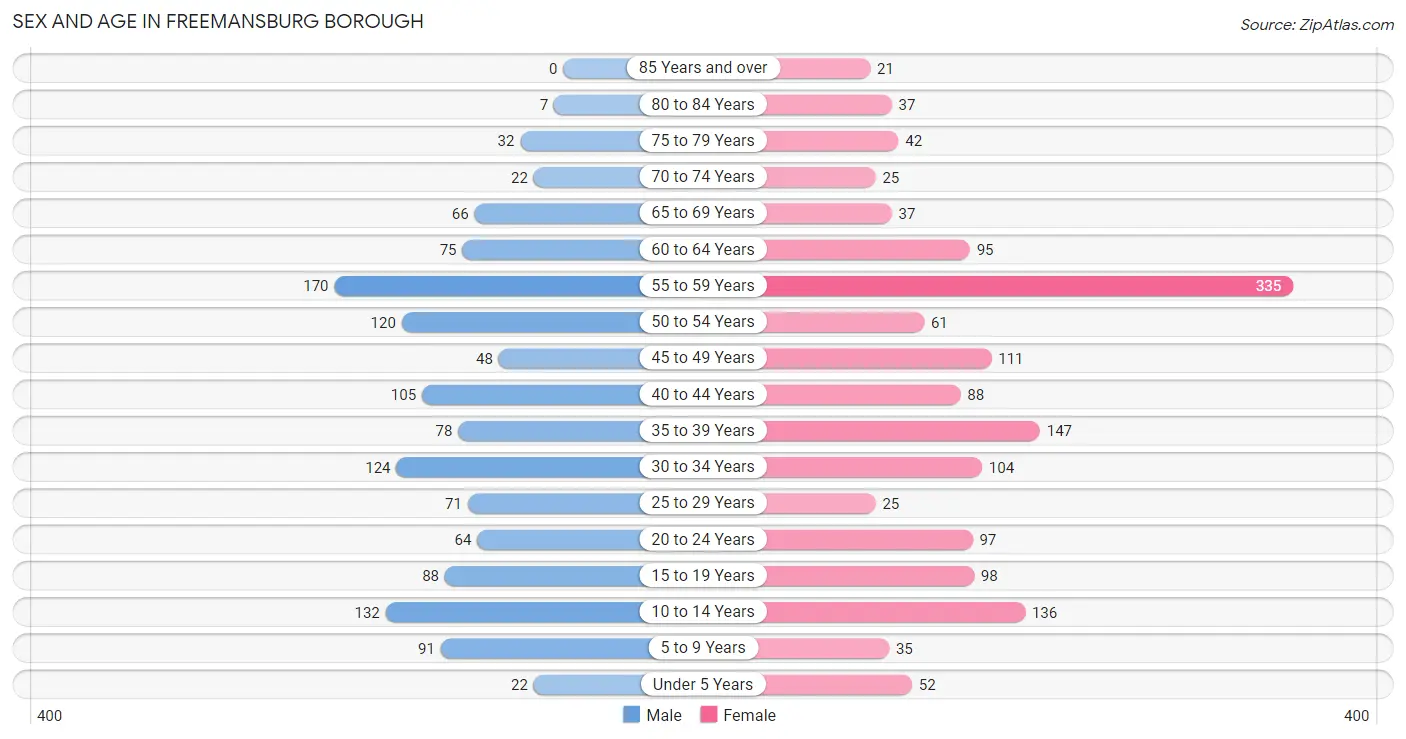
| Age Bracket | Male | Female |
| Under 5 Years | 22 (1.7%) | 52 (3.4%) |
| 5 to 9 Years | 91 (6.9%) | 35 (2.3%) |
| 10 to 14 Years | 132 (10.0%) | 136 (8.8%) |
| 15 to 19 Years | 88 (6.7%) | 98 (6.3%) |
| 20 to 24 Years | 64 (4.9%) | 97 (6.3%) |
| 25 to 29 Years | 71 (5.4%) | 25 (1.6%) |
| 30 to 34 Years | 124 (9.4%) | 104 (6.7%) |
| 35 to 39 Years | 78 (5.9%) | 147 (9.5%) |
| 40 to 44 Years | 105 (8.0%) | 88 (5.7%) |
| 45 to 49 Years | 48 (3.6%) | 111 (7.2%) |
| 50 to 54 Years | 120 (9.1%) | 61 (4.0%) |
| 55 to 59 Years | 170 (12.9%) | 335 (21.7%) |
| 60 to 64 Years | 75 (5.7%) | 95 (6.1%) |
| 65 to 69 Years | 66 (5.0%) | 37 (2.4%) |
| 70 to 74 Years | 22 (1.7%) | 25 (1.6%) |
| 75 to 79 Years | 32 (2.4%) | 42 (2.7%) |
| 80 to 84 Years | 7 (0.5%) | 37 (2.4%) |
| 85 Years and over | 0 (0.0%) | 21 (1.4%) |
| Total | 1,315 (100.0%) | 1,546 (100.0%) |
Families and Households in Freemansburg borough
Median Family Size in Freemansburg borough
The median family size in Freemansburg borough is 2.40 persons per family, with married-couple families (525 | 50.9%) accounting for the largest median family size of 2.92 persons per family. On the other hand, single female/mother families (472 | 45.7%) represent the smallest median family size with 1.83 persons per family.
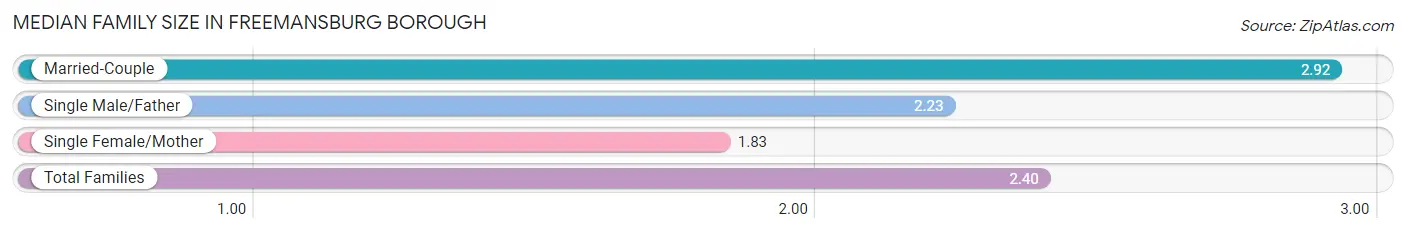
| Family Type | # Families | Family Size |
| Married-Couple | 525 (50.9%) | 2.92 |
| Single Male/Father | 35 (3.4%) | 2.23 |
| Single Female/Mother | 472 (45.7%) | 1.83 |
| Total Families | 1,032 (100.0%) | 2.40 |
Median Household Size in Freemansburg borough
The median household size in Freemansburg borough is 2.31 persons per household, with married-couple households (525 | 42.9%) accounting for the largest median household size of 2.93 persons per household. non-family households (192 | 15.7%) represent the smallest median household size with 1.38 persons per household.
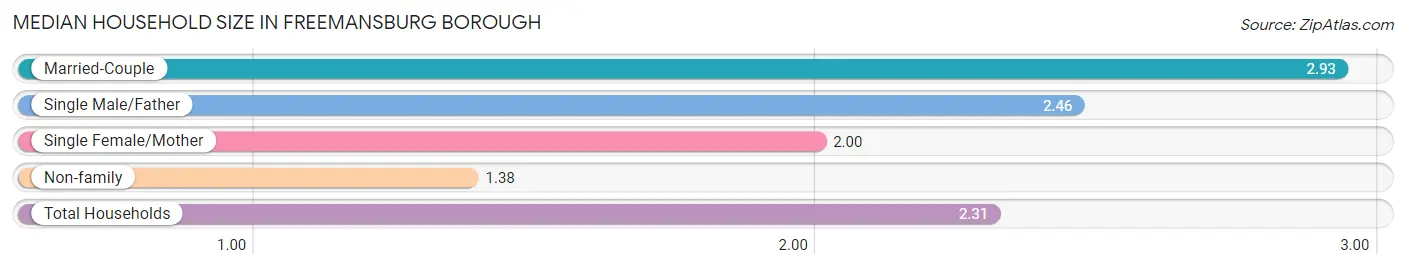
| Household Type | # Households | Household Size |
| Married-Couple | 525 (42.9%) | 2.93 |
| Single Male/Father | 35 (2.9%) | 2.46 |
| Single Female/Mother | 472 (38.6%) | 2.00 |
| Non-family | 192 (15.7%) | 1.38 |
| Total Households | 1,224 (100.0%) | 2.31 |
Household Size by Marriage Status in Freemansburg borough
Out of a total of 1,224 households in Freemansburg borough, 1,032 (84.3%) are family households, while 192 (15.7%) are nonfamily households. The most numerous type of family households are 2-person households, comprising 579, and the most common type of nonfamily households are 1-person households, comprising 130.
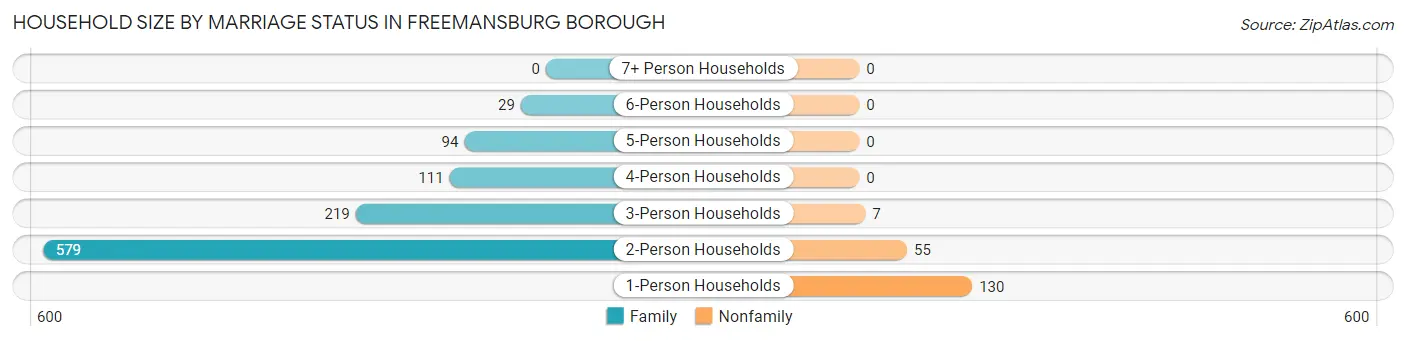
| Household Size | Family Households | Nonfamily Households |
| 1-Person Households | - | 130 (10.6%) |
| 2-Person Households | 579 (47.3%) | 55 (4.5%) |
| 3-Person Households | 219 (17.9%) | 7 (0.6%) |
| 4-Person Households | 111 (9.1%) | 0 (0.0%) |
| 5-Person Households | 94 (7.7%) | 0 (0.0%) |
| 6-Person Households | 29 (2.4%) | 0 (0.0%) |
| 7+ Person Households | 0 (0.0%) | 0 (0.0%) |
| Total | 1,032 (84.3%) | 192 (15.7%) |
Female Fertility in Freemansburg borough
Fertility by Age in Freemansburg borough
Average fertility rate in Freemansburg borough is 12.0 births per 1,000 women. Women in the age bracket of 35 to 50 years have the highest fertility rate with 22.0 births per 1,000 women. Women in the age bracket of 35 to 50 years acount for 100.0% of all women with births.
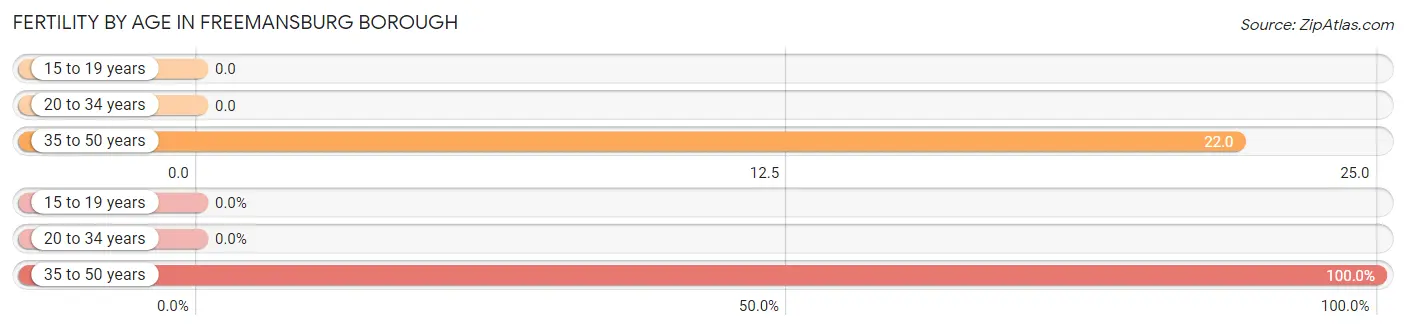
| Age Bracket | Women with Births | Births / 1,000 Women |
| 15 to 19 years | 0 (0.0%) | 0.0 |
| 20 to 34 years | 0 (0.0%) | 0.0 |
| 35 to 50 years | 8 (100.0%) | 22.0 |
| Total | 8 (100.0%) | 12.0 |
Fertility by Age by Marriage Status in Freemansburg borough
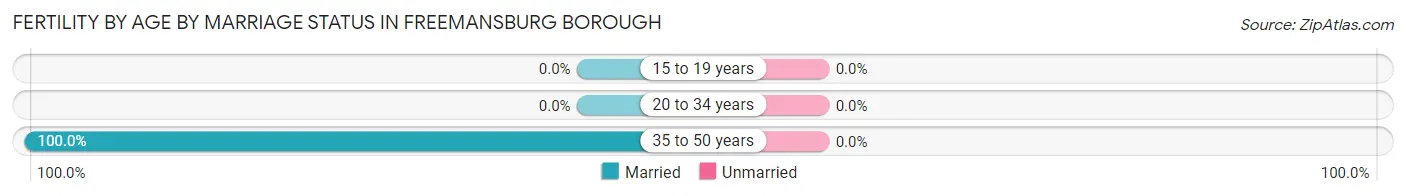
| Age Bracket | Married | Unmarried |
| 15 to 19 years | 0 (0.0%) | 0 (0.0%) |
| 20 to 34 years | 0 (0.0%) | 0 (0.0%) |
| 35 to 50 years | 8 (100.0%) | 0 (0.0%) |
| Total | 8 (100.0%) | 0 (0.0%) |
Fertility by Education in Freemansburg borough
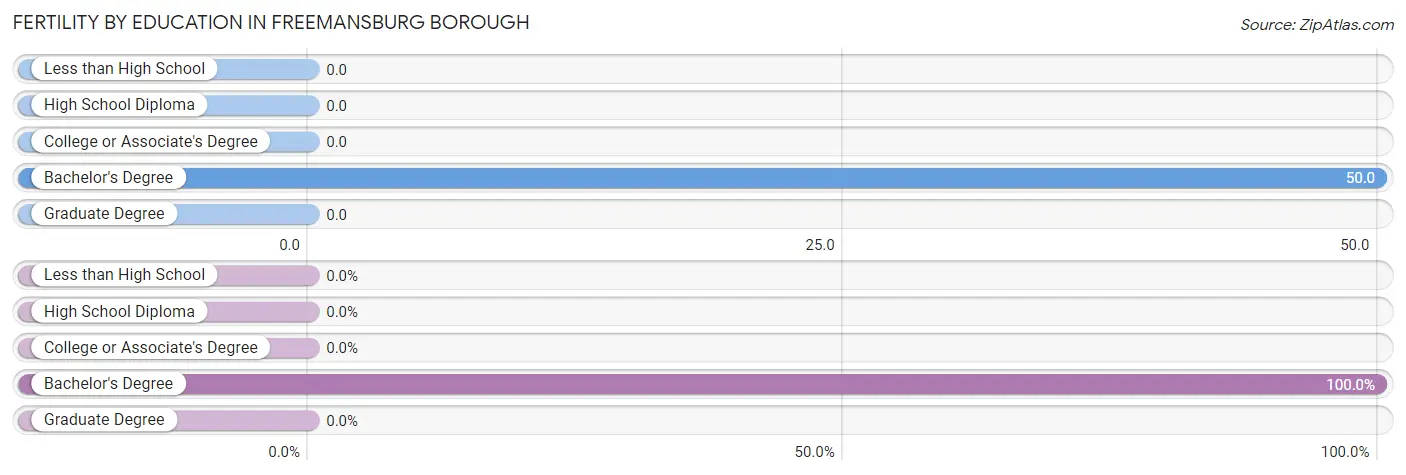
| Educational Attainment | Women with Births | Births / 1,000 Women |
| Less than High School | 0 (0.0%) | 0.0 |
| High School Diploma | 0 (0.0%) | 0.0 |
| College or Associate's Degree | 0 (0.0%) | 0.0 |
| Bachelor's Degree | 8 (100.0%) | 50.0 |
| Graduate Degree | 0 (0.0%) | 0.0 |
| Total | 8 (100.0%) | 12.0 |
Fertility by Education by Marriage Status in Freemansburg borough
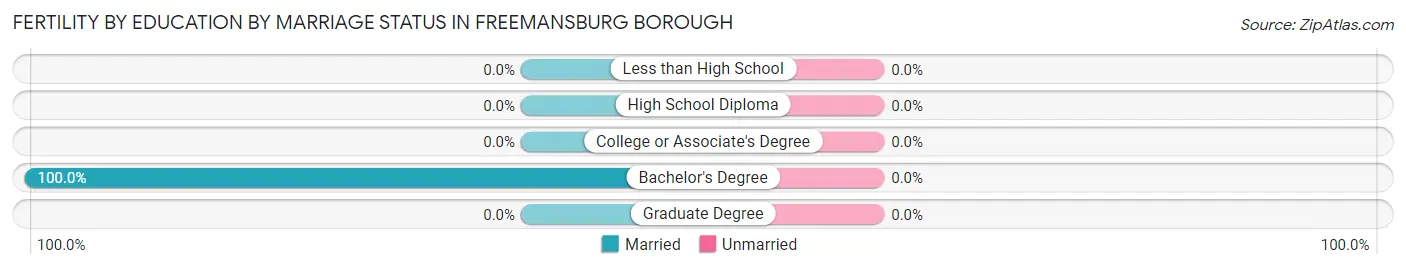
| Educational Attainment | Married | Unmarried |
| Less than High School | 0 (0.0%) | 0 (0.0%) |
| High School Diploma | 0 (0.0%) | 0 (0.0%) |
| College or Associate's Degree | 0 (0.0%) | 0 (0.0%) |
| Bachelor's Degree | 8 (100.0%) | 0 (0.0%) |
| Graduate Degree | 0 (0.0%) | 0 (0.0%) |
| Total | 8 (100.0%) | 0 (0.0%) |
Employment Characteristics in Freemansburg borough
Employment by Class of Employer in Freemansburg borough
Among the 1,456 employed individuals in Freemansburg borough, private company employees (984 | 67.6%), not-for-profit organizations (249 | 17.1%), and self-employed (not incorporated) (88 | 6.0%) make up the most common classes of employment.
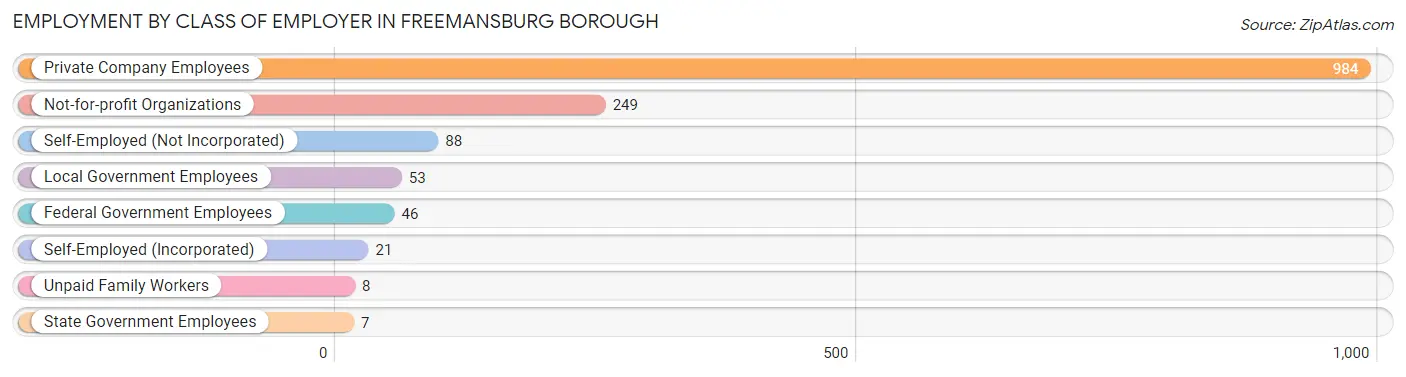
| Employer Class | # Employees | % Employees |
| Private Company Employees | 984 | 67.6% |
| Self-Employed (Incorporated) | 21 | 1.4% |
| Self-Employed (Not Incorporated) | 88 | 6.0% |
| Not-for-profit Organizations | 249 | 17.1% |
| Local Government Employees | 53 | 3.6% |
| State Government Employees | 7 | 0.5% |
| Federal Government Employees | 46 | 3.2% |
| Unpaid Family Workers | 8 | 0.5% |
| Total | 1,456 | 100.0% |
Employment Status by Age in Freemansburg borough
According to the labor force statistics for Freemansburg borough, out of the total population over 16 years of age (2,359), 64.8% or 1,529 individuals are in the labor force, with 4.8% or 73 of them unemployed. The age group with the highest labor force participation rate is 20 to 24 years, with 95.0% or 153 individuals in the labor force. Within the labor force, the 16 to 19 years age range has the highest percentage of unemployed individuals, with 50.0% or 30 of them being unemployed.
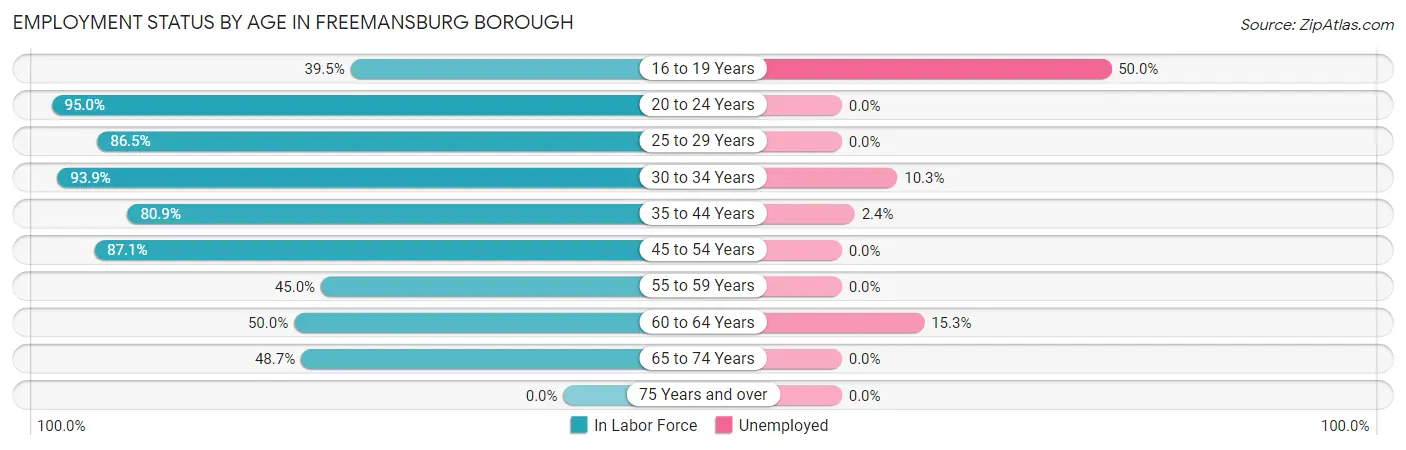
| Age Bracket | In Labor Force | Unemployed |
| 16 to 19 Years | 60 (39.5%) | 30 (50.0%) |
| 20 to 24 Years | 153 (95.0%) | 0 (0.0%) |
| 25 to 29 Years | 83 (86.5%) | 0 (0.0%) |
| 30 to 34 Years | 214 (93.9%) | 22 (10.3%) |
| 35 to 44 Years | 338 (80.9%) | 8 (2.4%) |
| 45 to 54 Years | 296 (87.1%) | 0 (0.0%) |
| 55 to 59 Years | 227 (45.0%) | 0 (0.0%) |
| 60 to 64 Years | 85 (50.0%) | 13 (15.3%) |
| 65 to 74 Years | 73 (48.7%) | 0 (0.0%) |
| 75 Years and over | 0 (0.0%) | 0 (0.0%) |
| Total | 1,529 (64.8%) | 73 (4.8%) |
Employment Status by Educational Attainment in Freemansburg borough
According to labor force statistics for Freemansburg borough, 70.7% of individuals (1,242) out of the total population between 25 and 64 years of age (1,757) are in the labor force, with 3.5% or 43 of them being unemployed. The group with the highest labor force participation rate are those with the educational attainment of college / associate degree, with 89.4% or 438 individuals in the labor force. Within the labor force, individuals with less than high school education have the highest percentage of unemployment, with 7.1% or 10 of them being unemployed.
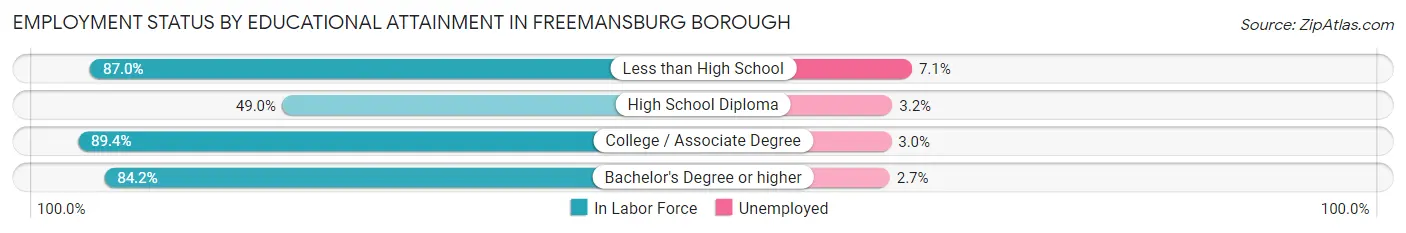
| Educational Attainment | In Labor Force | Unemployed |
| Less than High School | 141 (87.0%) | 12 (7.1%) |
| High School Diploma | 371 (49.0%) | 24 (3.2%) |
| College / Associate Degree | 438 (89.4%) | 15 (3.0%) |
| Bachelor's Degree or higher | 293 (84.2%) | 9 (2.7%) |
| Total | 1,242 (70.7%) | 61 (3.5%) |
Employment Occupations by Sex in Freemansburg borough
Management, Business, Science and Arts Occupations
The most common Management, Business, Science and Arts occupations in Freemansburg borough are Community & Social Service (124 | 8.5%), Health Diagnosing & Treating (80 | 5.5%), Management (70 | 4.8%), Business & Financial (70 | 4.8%), and Education Instruction & Library (67 | 4.6%).
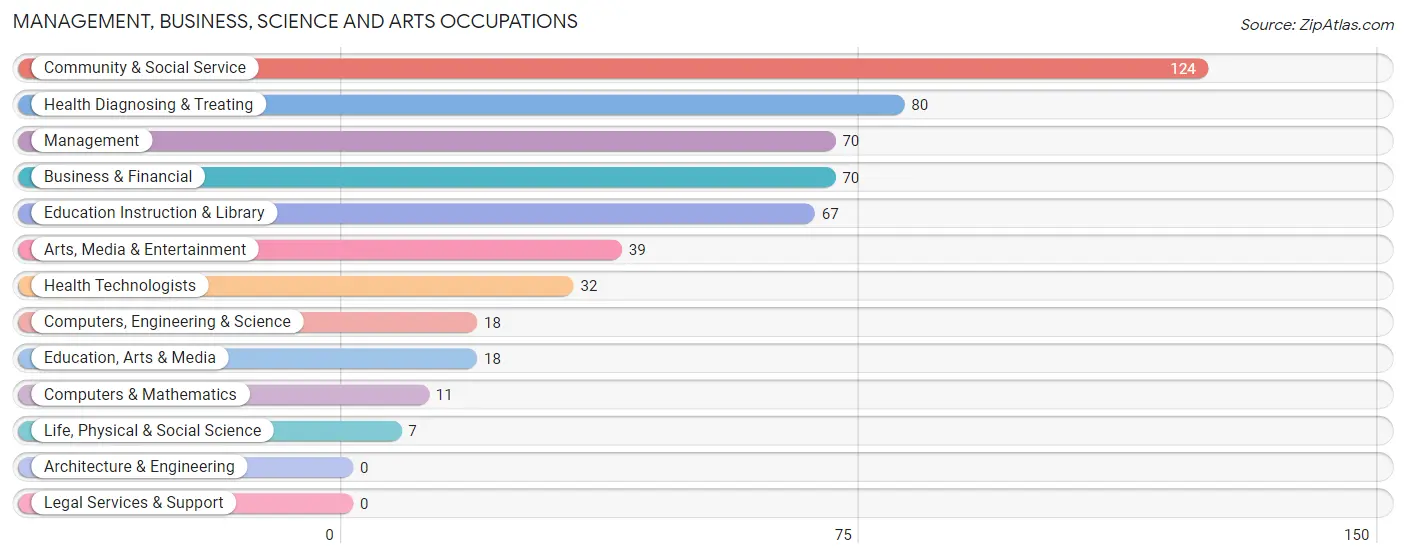
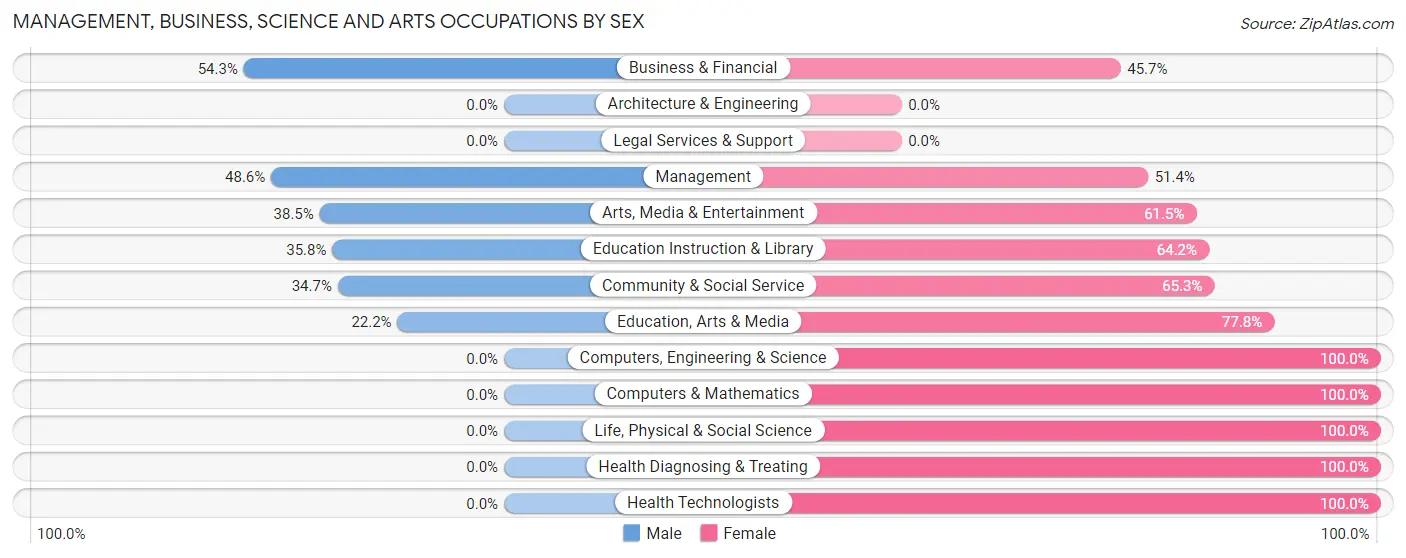
Management, Business, Science and Arts Occupations by Sex
Within the Management, Business, Science and Arts occupations in Freemansburg borough, the most male-oriented occupations are Business & Financial (54.3%), Management (48.6%), and Arts, Media & Entertainment (38.5%), while the most female-oriented occupations are Computers, Engineering & Science (100.0%), Computers & Mathematics (100.0%), and Life, Physical & Social Science (100.0%).
| Occupation | Male | Female |
| Management | 34 (48.6%) | 36 (51.4%) |
| Business & Financial | 38 (54.3%) | 32 (45.7%) |
| Computers, Engineering & Science | 0 (0.0%) | 18 (100.0%) |
| Computers & Mathematics | 0 (0.0%) | 11 (100.0%) |
| Architecture & Engineering | 0 (0.0%) | 0 (0.0%) |
| Life, Physical & Social Science | 0 (0.0%) | 7 (100.0%) |
| Community & Social Service | 43 (34.7%) | 81 (65.3%) |
| Education, Arts & Media | 4 (22.2%) | 14 (77.8%) |
| Legal Services & Support | 0 (0.0%) | 0 (0.0%) |
| Education Instruction & Library | 24 (35.8%) | 43 (64.2%) |
| Arts, Media & Entertainment | 15 (38.5%) | 24 (61.5%) |
| Health Diagnosing & Treating | 0 (0.0%) | 80 (100.0%) |
| Health Technologists | 0 (0.0%) | 32 (100.0%) |
| Total (Category) | 115 (31.8%) | 247 (68.2%) |
| Total (Overall) | 804 (55.2%) | 652 (44.8%) |
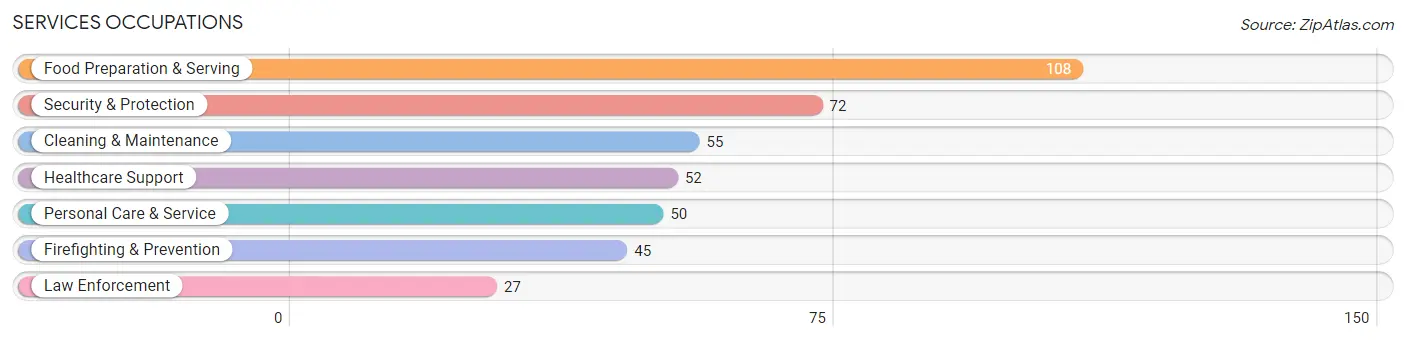
Services Occupations
The most common Services occupations in Freemansburg borough are Food Preparation & Serving (108 | 7.4%), Security & Protection (72 | 5.0%), Cleaning & Maintenance (55 | 3.8%), Healthcare Support (52 | 3.6%), and Personal Care & Service (50 | 3.4%).
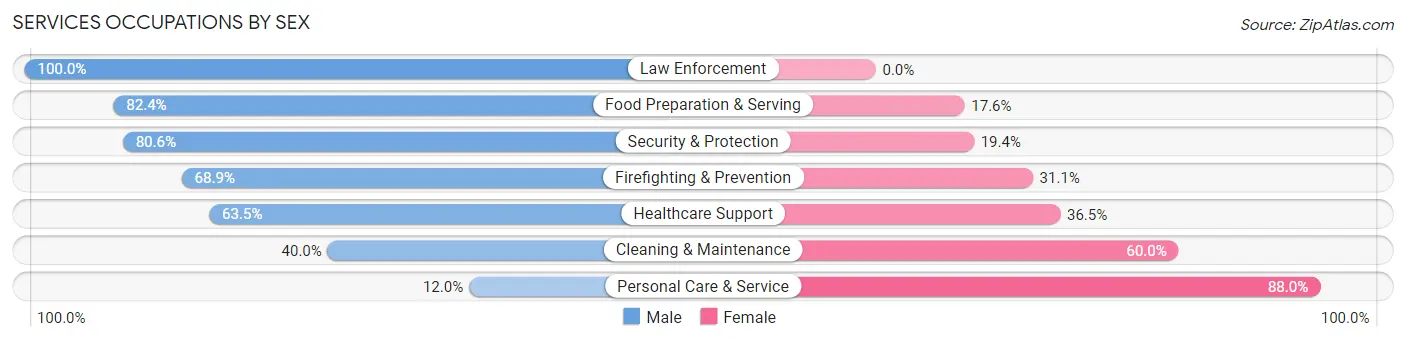
Services Occupations by Sex
Within the Services occupations in Freemansburg borough, the most male-oriented occupations are Law Enforcement (100.0%), Food Preparation & Serving (82.4%), and Security & Protection (80.6%), while the most female-oriented occupations are Personal Care & Service (88.0%), Cleaning & Maintenance (60.0%), and Healthcare Support (36.5%).
| Occupation | Male | Female |
| Healthcare Support | 33 (63.5%) | 19 (36.5%) |
| Security & Protection | 58 (80.6%) | 14 (19.4%) |
| Firefighting & Prevention | 31 (68.9%) | 14 (31.1%) |
| Law Enforcement | 27 (100.0%) | 0 (0.0%) |
| Food Preparation & Serving | 89 (82.4%) | 19 (17.6%) |
| Cleaning & Maintenance | 22 (40.0%) | 33 (60.0%) |
| Personal Care & Service | 6 (12.0%) | 44 (88.0%) |
| Total (Category) | 208 (61.7%) | 129 (38.3%) |
| Total (Overall) | 804 (55.2%) | 652 (44.8%) |
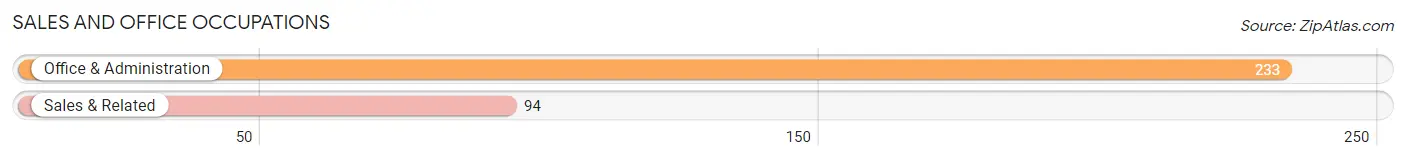
Sales and Office Occupations
The most common Sales and Office occupations in Freemansburg borough are Office & Administration (233 | 16.0%), and Sales & Related (94 | 6.5%).
Sales and Office Occupations by Sex
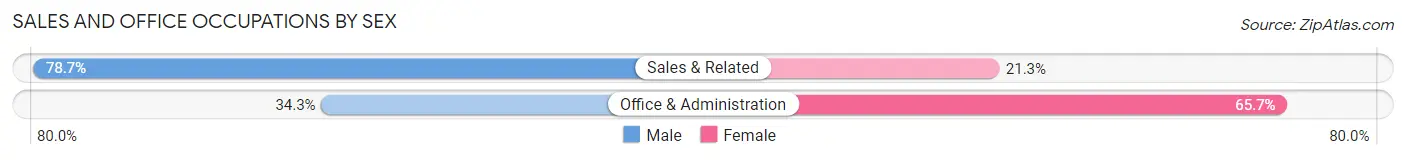
| Occupation | Male | Female |
| Sales & Related | 74 (78.7%) | 20 (21.3%) |
| Office & Administration | 80 (34.3%) | 153 (65.7%) |
| Total (Category) | 154 (47.1%) | 173 (52.9%) |
| Total (Overall) | 804 (55.2%) | 652 (44.8%) |
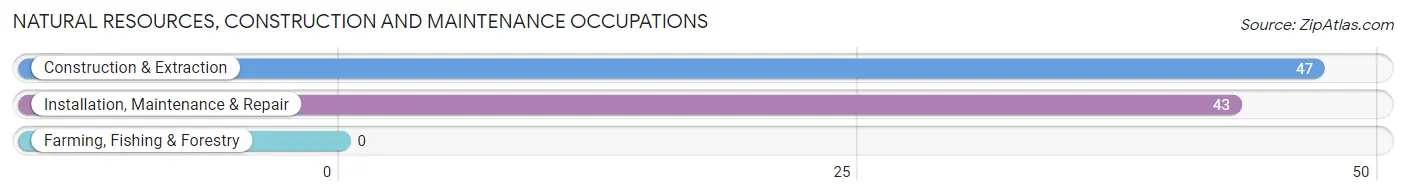
Natural Resources, Construction and Maintenance Occupations
The most common Natural Resources, Construction and Maintenance occupations in Freemansburg borough are Construction & Extraction (47 | 3.2%), and Installation, Maintenance & Repair (43 | 2.9%).
Natural Resources, Construction and Maintenance Occupations by Sex
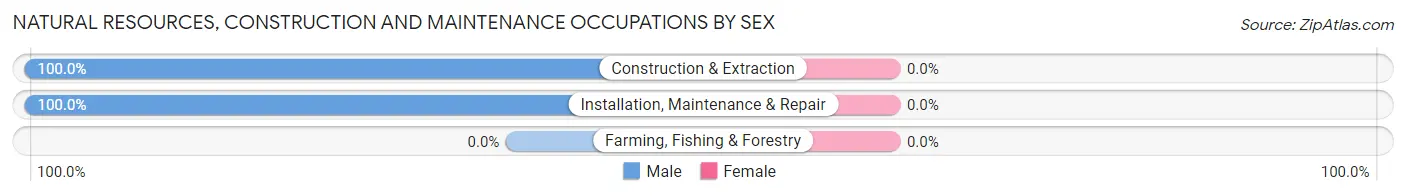
| Occupation | Male | Female |
| Farming, Fishing & Forestry | 0 (0.0%) | 0 (0.0%) |
| Construction & Extraction | 47 (100.0%) | 0 (0.0%) |
| Installation, Maintenance & Repair | 43 (100.0%) | 0 (0.0%) |
| Total (Category) | 90 (100.0%) | 0 (0.0%) |
| Total (Overall) | 804 (55.2%) | 652 (44.8%) |
Production, Transportation and Moving Occupations
The most common Production, Transportation and Moving occupations in Freemansburg borough are Production (137 | 9.4%), Material Moving (114 | 7.8%), and Transportation (89 | 6.1%).
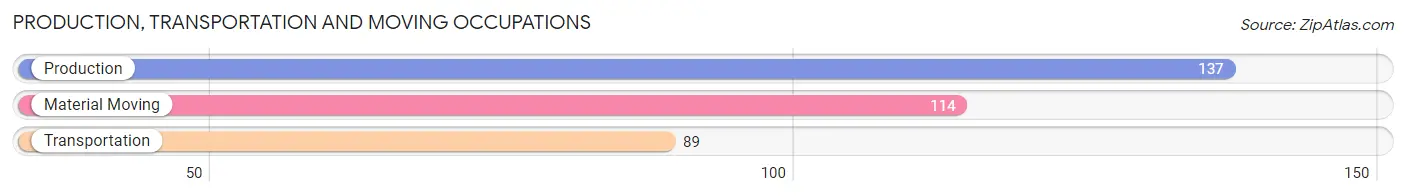
Production, Transportation and Moving Occupations by Sex
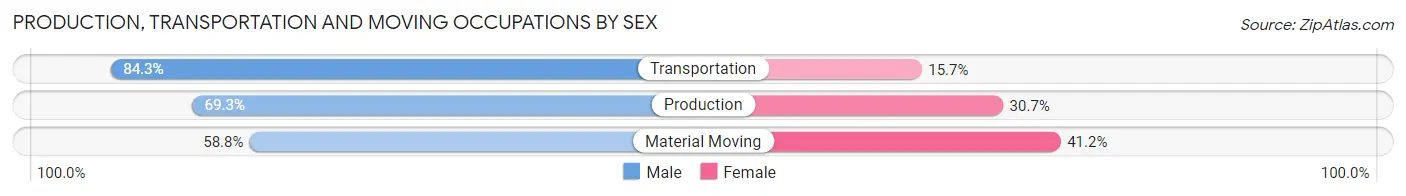
| Occupation | Male | Female |
| Production | 95 (69.3%) | 42 (30.7%) |
| Transportation | 75 (84.3%) | 14 (15.7%) |
| Material Moving | 67 (58.8%) | 47 (41.2%) |
| Total (Category) | 237 (69.7%) | 103 (30.3%) |
| Total (Overall) | 804 (55.2%) | 652 (44.8%) |
Employment Industries by Sex in Freemansburg borough
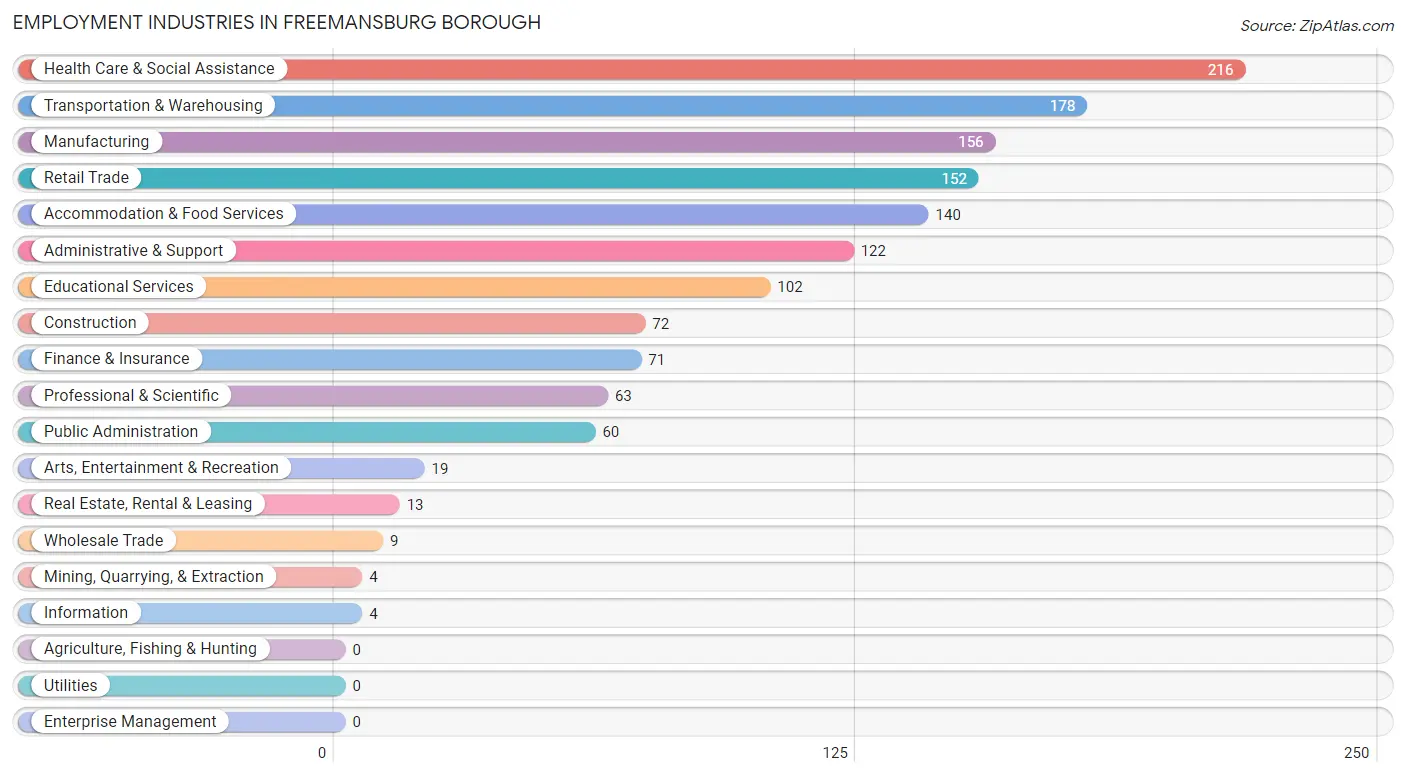
Employment Industries in Freemansburg borough
The major employment industries in Freemansburg borough include Health Care & Social Assistance (216 | 14.8%), Transportation & Warehousing (178 | 12.2%), Manufacturing (156 | 10.7%), Retail Trade (152 | 10.4%), and Accommodation & Food Services (140 | 9.6%).
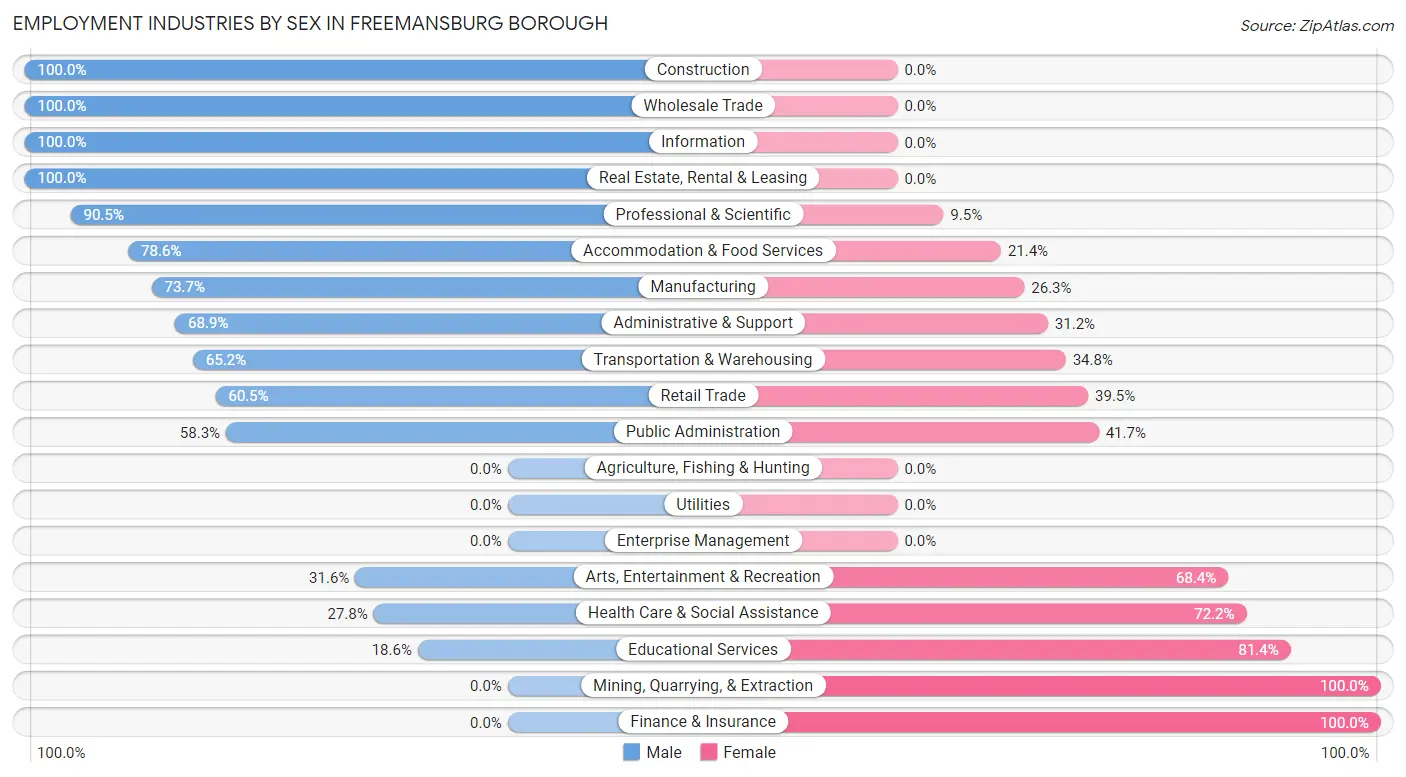
Employment Industries by Sex in Freemansburg borough
The Freemansburg borough industries that see more men than women are Construction (100.0%), Wholesale Trade (100.0%), and Information (100.0%), whereas the industries that tend to have a higher number of women are Mining, Quarrying, & Extraction (100.0%), Finance & Insurance (100.0%), and Educational Services (81.4%).
| Industry | Male | Female |
| Agriculture, Fishing & Hunting | 0 (0.0%) | 0 (0.0%) |
| Mining, Quarrying, & Extraction | 0 (0.0%) | 4 (100.0%) |
| Construction | 72 (100.0%) | 0 (0.0%) |
| Manufacturing | 115 (73.7%) | 41 (26.3%) |
| Wholesale Trade | 9 (100.0%) | 0 (0.0%) |
| Retail Trade | 92 (60.5%) | 60 (39.5%) |
| Transportation & Warehousing | 116 (65.2%) | 62 (34.8%) |
| Utilities | 0 (0.0%) | 0 (0.0%) |
| Information | 4 (100.0%) | 0 (0.0%) |
| Finance & Insurance | 0 (0.0%) | 71 (100.0%) |
| Real Estate, Rental & Leasing | 13 (100.0%) | 0 (0.0%) |
| Professional & Scientific | 57 (90.5%) | 6 (9.5%) |
| Enterprise Management | 0 (0.0%) | 0 (0.0%) |
| Administrative & Support | 84 (68.9%) | 38 (31.1%) |
| Educational Services | 19 (18.6%) | 83 (81.4%) |
| Health Care & Social Assistance | 60 (27.8%) | 156 (72.2%) |
| Arts, Entertainment & Recreation | 6 (31.6%) | 13 (68.4%) |
| Accommodation & Food Services | 110 (78.6%) | 30 (21.4%) |
| Public Administration | 35 (58.3%) | 25 (41.7%) |
| Total | 804 (55.2%) | 652 (44.8%) |
Education in Freemansburg borough
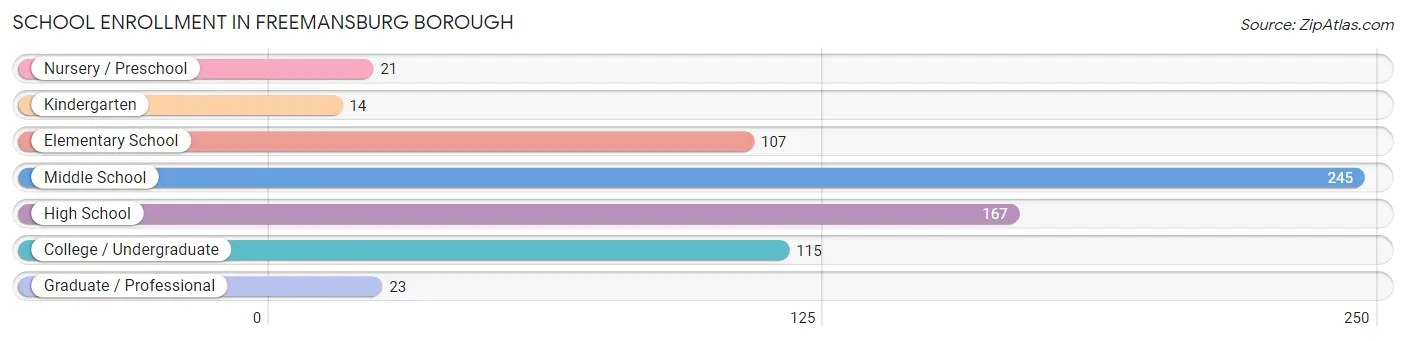
School Enrollment in Freemansburg borough
The most common levels of schooling among the 692 students in Freemansburg borough are middle school (245 | 35.4%), high school (167 | 24.1%), and college / undergraduate (115 | 16.6%).
| School Level | # Students | % Students |
| Nursery / Preschool | 21 | 3.0% |
| Kindergarten | 14 | 2.0% |
| Elementary School | 107 | 15.5% |
| Middle School | 245 | 35.4% |
| High School | 167 | 24.1% |
| College / Undergraduate | 115 | 16.6% |
| Graduate / Professional | 23 | 3.3% |
| Total | 692 | 100.0% |
School Enrollment by Age by Funding Source in Freemansburg borough
Out of a total of 692 students who are enrolled in schools in Freemansburg borough, 89 (12.9%) attend a private institution, while the remaining 603 (87.1%) are enrolled in public schools. The age group of 35 years and over has the highest likelihood of being enrolled in private schools, with 31 (100.0% in the age bracket) enrolled. Conversely, the age group of 10 to 14 year olds has the lowest likelihood of being enrolled in a private school, with 263 (98.1% in the age bracket) attending a public institution.
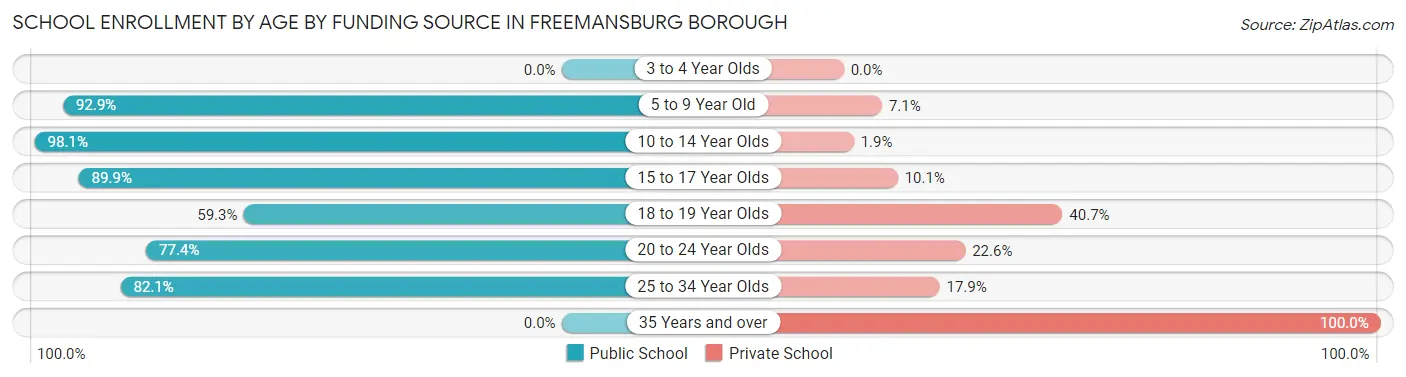
| Age Bracket | Public School | Private School |
| 3 to 4 Year Olds | 0 (0.0%) | 0 (0.0%) |
| 5 to 9 Year Old | 117 (92.9%) | 9 (7.1%) |
| 10 to 14 Year Olds | 263 (98.1%) | 5 (1.9%) |
| 15 to 17 Year Olds | 143 (89.9%) | 16 (10.1%) |
| 18 to 19 Year Olds | 16 (59.3%) | 11 (40.7%) |
| 20 to 24 Year Olds | 41 (77.4%) | 12 (22.6%) |
| 25 to 34 Year Olds | 23 (82.1%) | 5 (17.9%) |
| 35 Years and over | 0 (0.0%) | 31 (100.0%) |
| Total | 603 (87.1%) | 89 (12.9%) |
Educational Attainment by Field of Study in Freemansburg borough
Business (108 | 28.7%), education (76 | 20.2%), bio, nature & agricultural (42 | 11.2%), psychology (41 | 10.9%), and liberal arts & history (22 | 5.9%) are the most common fields of study among 376 individuals in Freemansburg borough who have obtained a bachelor's degree or higher.
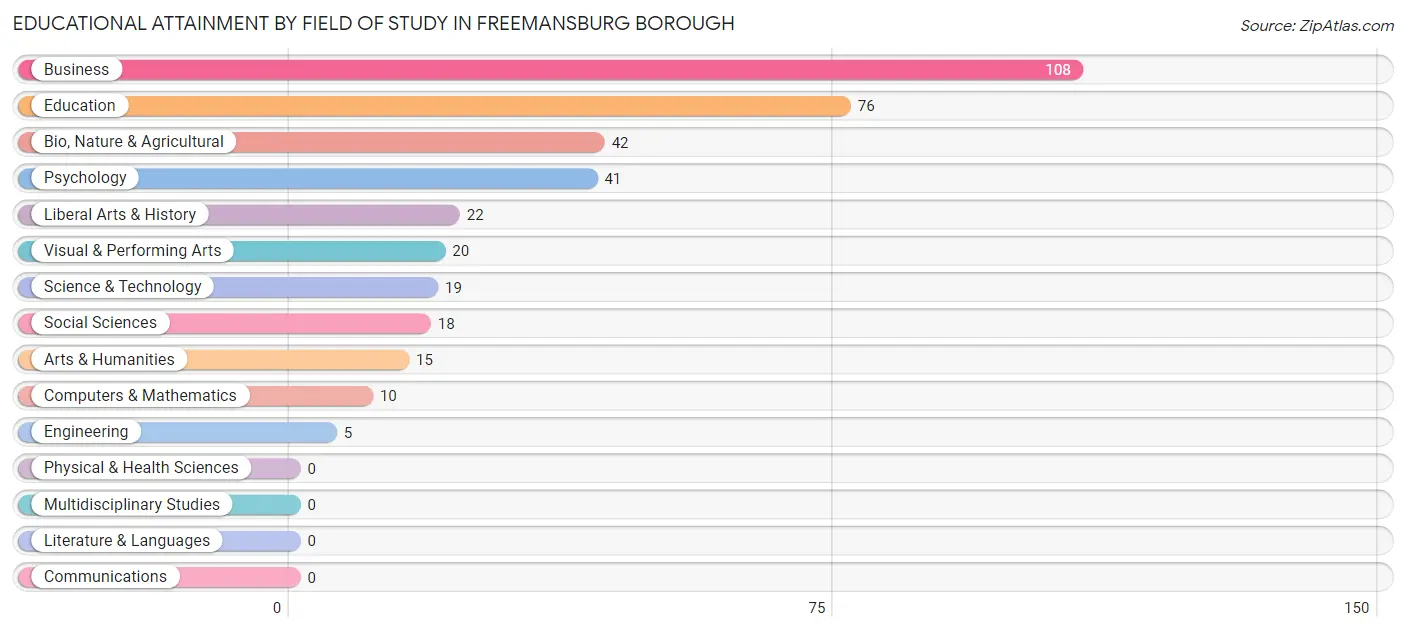
| Field of Study | # Graduates | % Graduates |
| Computers & Mathematics | 10 | 2.7% |
| Bio, Nature & Agricultural | 42 | 11.2% |
| Physical & Health Sciences | 0 | 0.0% |
| Psychology | 41 | 10.9% |
| Social Sciences | 18 | 4.8% |
| Engineering | 5 | 1.3% |
| Multidisciplinary Studies | 0 | 0.0% |
| Science & Technology | 19 | 5.1% |
| Business | 108 | 28.7% |
| Education | 76 | 20.2% |
| Literature & Languages | 0 | 0.0% |
| Liberal Arts & History | 22 | 5.9% |
| Visual & Performing Arts | 20 | 5.3% |
| Communications | 0 | 0.0% |
| Arts & Humanities | 15 | 4.0% |
| Total | 376 | 100.0% |
Transportation & Commute in Freemansburg borough
Vehicle Availability by Sex in Freemansburg borough
The most prevalent vehicle ownership categories in Freemansburg borough are males with 2 vehicles (438, accounting for 54.5%) and females with 2 vehicles (340, making up 67.2%).
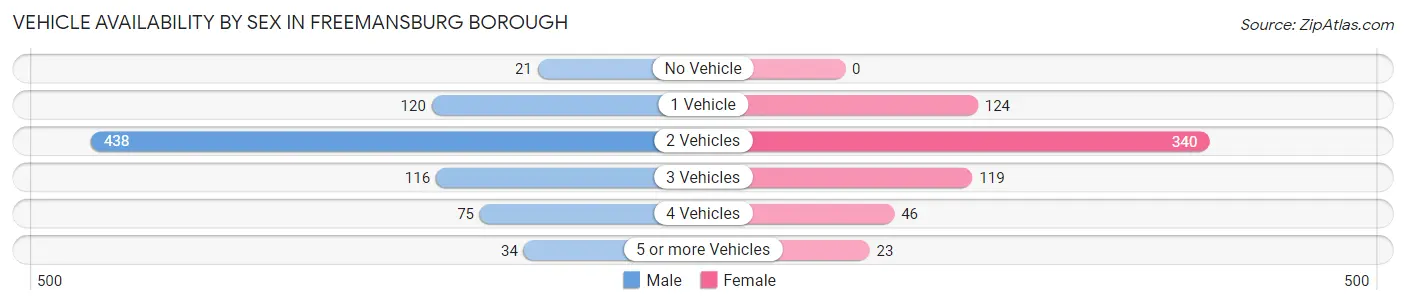
| Vehicles Available | Male | Female |
| No Vehicle | 21 (2.6%) | 0 (0.0%) |
| 1 Vehicle | 120 (14.9%) | 124 (19.0%) |
| 2 Vehicles | 438 (54.5%) | 340 (52.1%) |
| 3 Vehicles | 116 (14.4%) | 119 (18.2%) |
| 4 Vehicles | 75 (9.3%) | 46 (7.1%) |
| 5 or more Vehicles | 34 (4.2%) | 23 (3.5%) |
| Total | 804 (100.0%) | 652 (100.0%) |
Commute Time in Freemansburg borough
The most frequently occuring commute durations in Freemansburg borough are 10 to 14 minutes (292 commuters, 22.3%), 20 to 24 minutes (243 commuters, 18.5%), and 30 to 34 minutes (231 commuters, 17.6%).
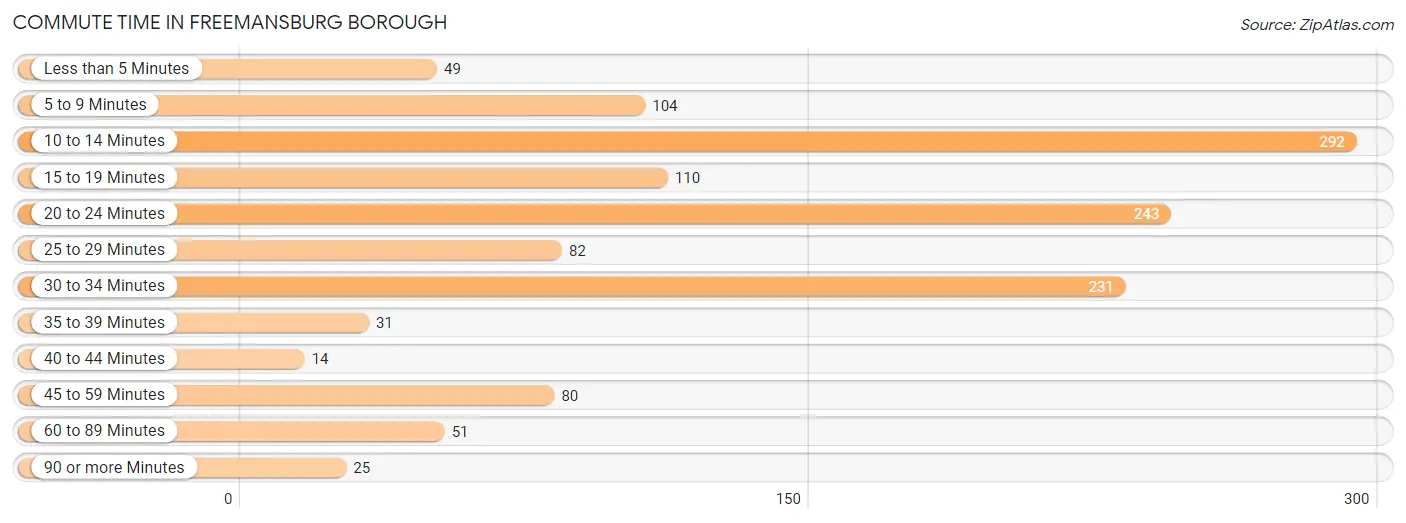
| Commute Time | # Commuters | % Commuters |
| Less than 5 Minutes | 49 | 3.7% |
| 5 to 9 Minutes | 104 | 7.9% |
| 10 to 14 Minutes | 292 | 22.3% |
| 15 to 19 Minutes | 110 | 8.4% |
| 20 to 24 Minutes | 243 | 18.5% |
| 25 to 29 Minutes | 82 | 6.2% |
| 30 to 34 Minutes | 231 | 17.6% |
| 35 to 39 Minutes | 31 | 2.4% |
| 40 to 44 Minutes | 14 | 1.1% |
| 45 to 59 Minutes | 80 | 6.1% |
| 60 to 89 Minutes | 51 | 3.9% |
| 90 or more Minutes | 25 | 1.9% |
Commute Time by Sex in Freemansburg borough
The most common commute times in Freemansburg borough are 20 to 24 minutes (207 commuters, 30.8%) for males and 10 to 14 minutes (203 commuters, 31.7%) for females.
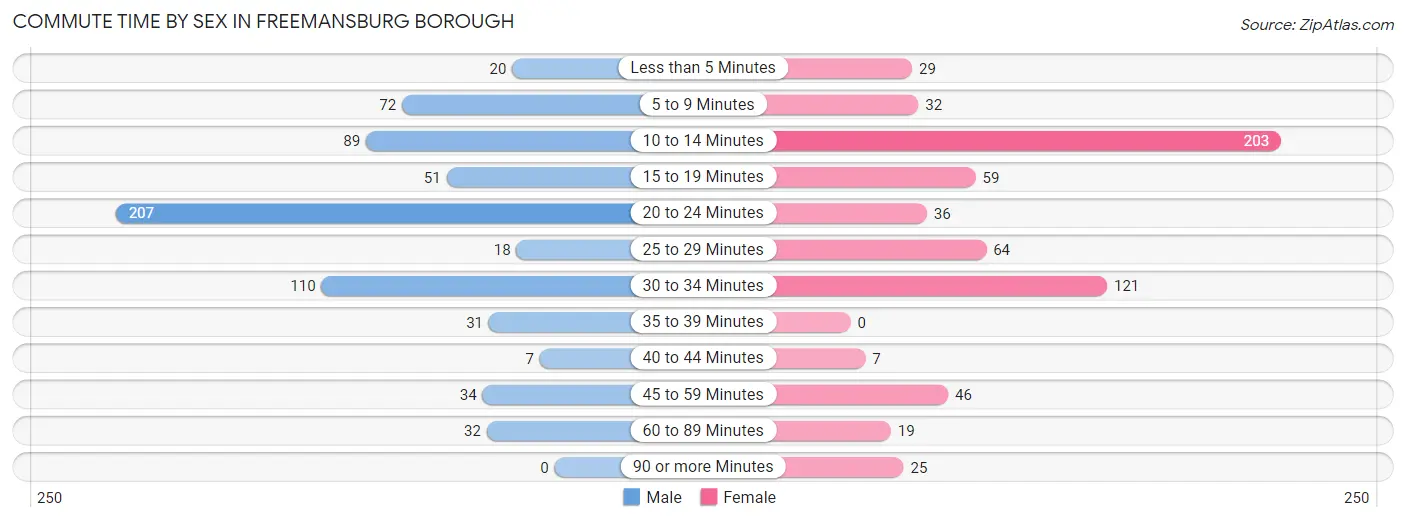
| Commute Time | Male | Female |
| Less than 5 Minutes | 20 (3.0%) | 29 (4.5%) |
| 5 to 9 Minutes | 72 (10.7%) | 32 (5.0%) |
| 10 to 14 Minutes | 89 (13.3%) | 203 (31.7%) |
| 15 to 19 Minutes | 51 (7.6%) | 59 (9.2%) |
| 20 to 24 Minutes | 207 (30.8%) | 36 (5.6%) |
| 25 to 29 Minutes | 18 (2.7%) | 64 (10.0%) |
| 30 to 34 Minutes | 110 (16.4%) | 121 (18.9%) |
| 35 to 39 Minutes | 31 (4.6%) | 0 (0.0%) |
| 40 to 44 Minutes | 7 (1.0%) | 7 (1.1%) |
| 45 to 59 Minutes | 34 (5.1%) | 46 (7.2%) |
| 60 to 89 Minutes | 32 (4.8%) | 19 (3.0%) |
| 90 or more Minutes | 0 (0.0%) | 25 (3.9%) |
Time of Departure to Work by Sex in Freemansburg borough
The most frequent times of departure to work in Freemansburg borough are 12:00 PM to 3:59 PM (121, 18.0%) for males and 7:30 AM to 7:59 AM (162, 25.3%) for females.
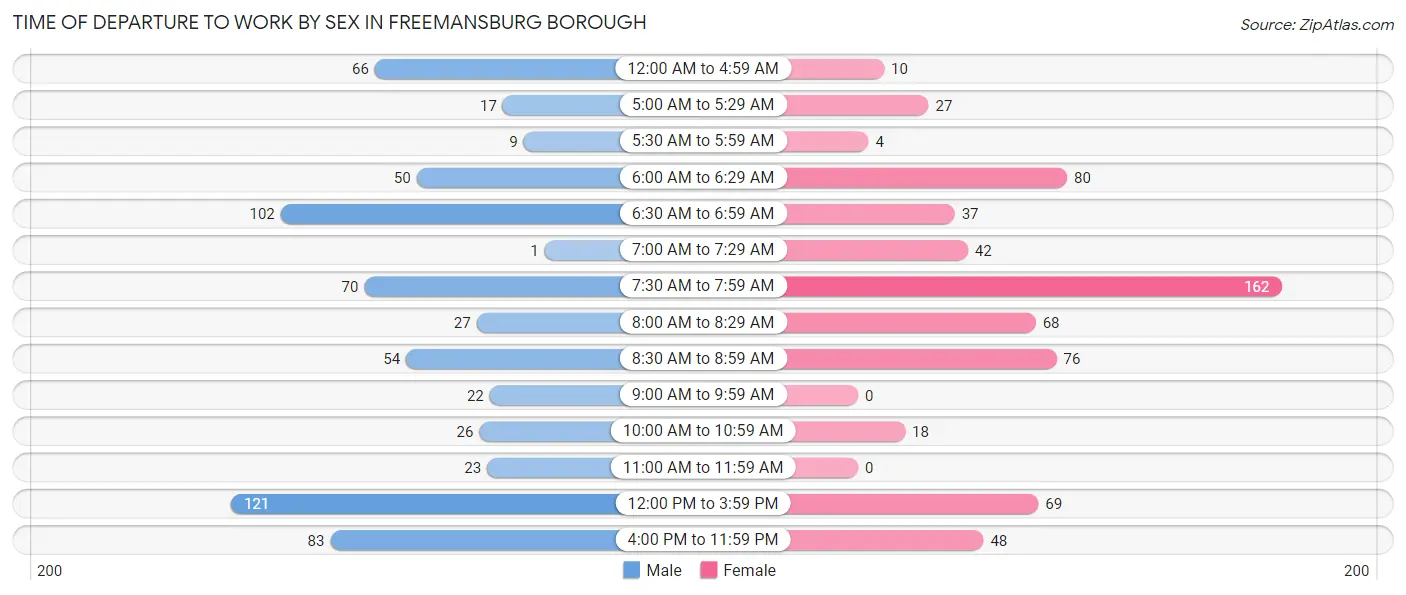
| Time of Departure | Male | Female |
| 12:00 AM to 4:59 AM | 66 (9.8%) | 10 (1.6%) |
| 5:00 AM to 5:29 AM | 17 (2.5%) | 27 (4.2%) |
| 5:30 AM to 5:59 AM | 9 (1.3%) | 4 (0.6%) |
| 6:00 AM to 6:29 AM | 50 (7.4%) | 80 (12.5%) |
| 6:30 AM to 6:59 AM | 102 (15.2%) | 37 (5.8%) |
| 7:00 AM to 7:29 AM | 1 (0.2%) | 42 (6.6%) |
| 7:30 AM to 7:59 AM | 70 (10.4%) | 162 (25.3%) |
| 8:00 AM to 8:29 AM | 27 (4.0%) | 68 (10.6%) |
| 8:30 AM to 8:59 AM | 54 (8.1%) | 76 (11.9%) |
| 9:00 AM to 9:59 AM | 22 (3.3%) | 0 (0.0%) |
| 10:00 AM to 10:59 AM | 26 (3.9%) | 18 (2.8%) |
| 11:00 AM to 11:59 AM | 23 (3.4%) | 0 (0.0%) |
| 12:00 PM to 3:59 PM | 121 (18.0%) | 69 (10.8%) |
| 4:00 PM to 11:59 PM | 83 (12.4%) | 48 (7.5%) |
| Total | 671 (100.0%) | 641 (100.0%) |
Housing Occupancy in Freemansburg borough
Occupancy by Ownership in Freemansburg borough
Of the total 1,224 dwellings in Freemansburg borough, owner-occupied units account for 633 (51.7%), while renter-occupied units make up 591 (48.3%).
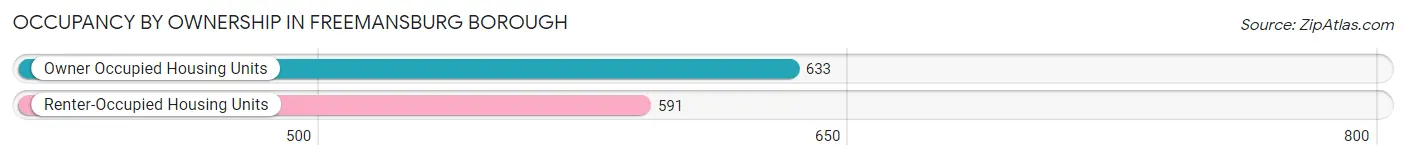
| Occupancy | # Housing Units | % Housing Units |
| Owner Occupied Housing Units | 633 | 51.7% |
| Renter-Occupied Housing Units | 591 | 48.3% |
| Total Occupied Housing Units | 1,224 | 100.0% |
Occupancy by Household Size in Freemansburg borough
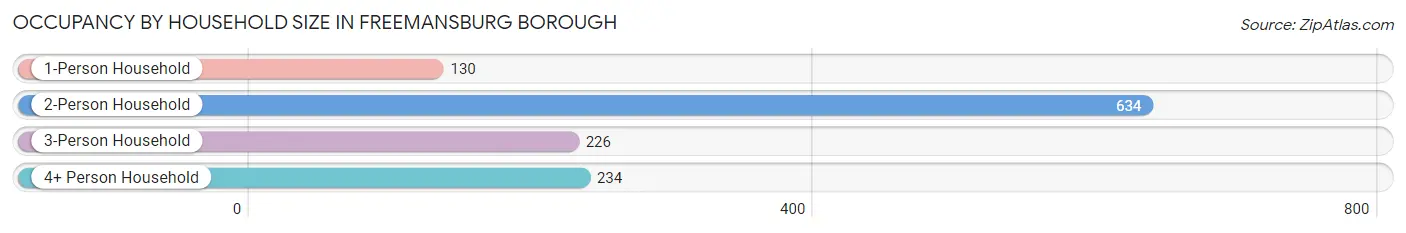
| Household Size | # Housing Units | % Housing Units |
| 1-Person Household | 130 | 10.6% |
| 2-Person Household | 634 | 51.8% |
| 3-Person Household | 226 | 18.5% |
| 4+ Person Household | 234 | 19.1% |
| Total Housing Units | 1,224 | 100.0% |
Occupancy by Ownership by Household Size in Freemansburg borough
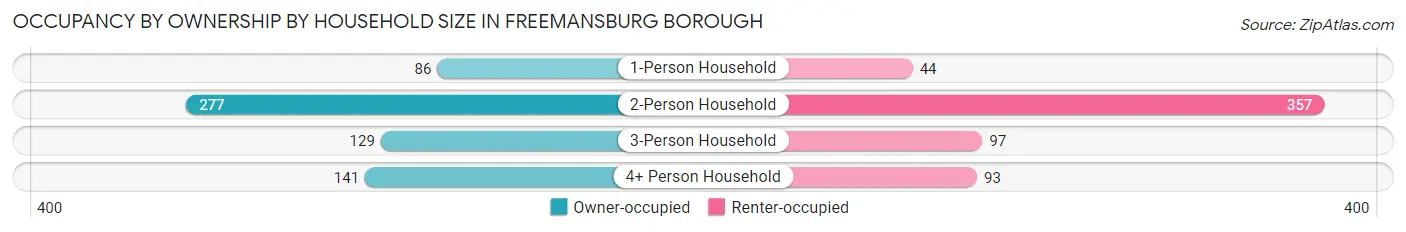
| Household Size | Owner-occupied | Renter-occupied |
| 1-Person Household | 86 (66.1%) | 44 (33.9%) |
| 2-Person Household | 277 (43.7%) | 357 (56.3%) |
| 3-Person Household | 129 (57.1%) | 97 (42.9%) |
| 4+ Person Household | 141 (60.3%) | 93 (39.7%) |
| Total Housing Units | 633 (51.7%) | 591 (48.3%) |
Occupancy by Educational Attainment in Freemansburg borough
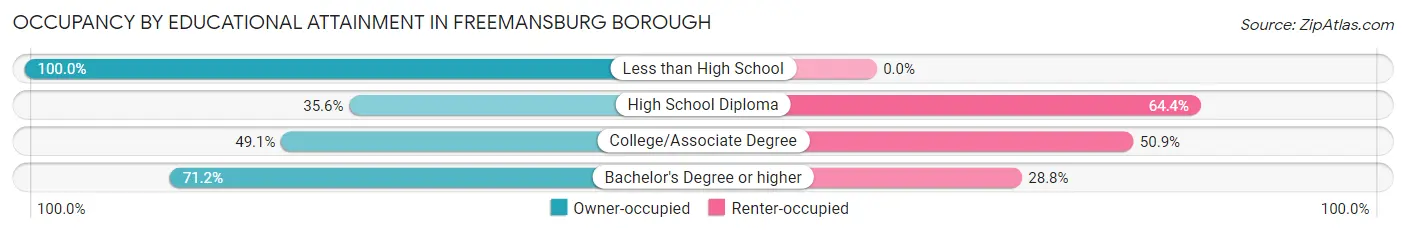
| Household Size | Owner-occupied | Renter-occupied |
| Less than High School | 127 (100.0%) | 0 (0.0%) |
| High School Diploma | 202 (35.6%) | 365 (64.4%) |
| College/Associate Degree | 163 (49.1%) | 169 (50.9%) |
| Bachelor's Degree or higher | 141 (71.2%) | 57 (28.8%) |
Occupancy by Age of Householder in Freemansburg borough
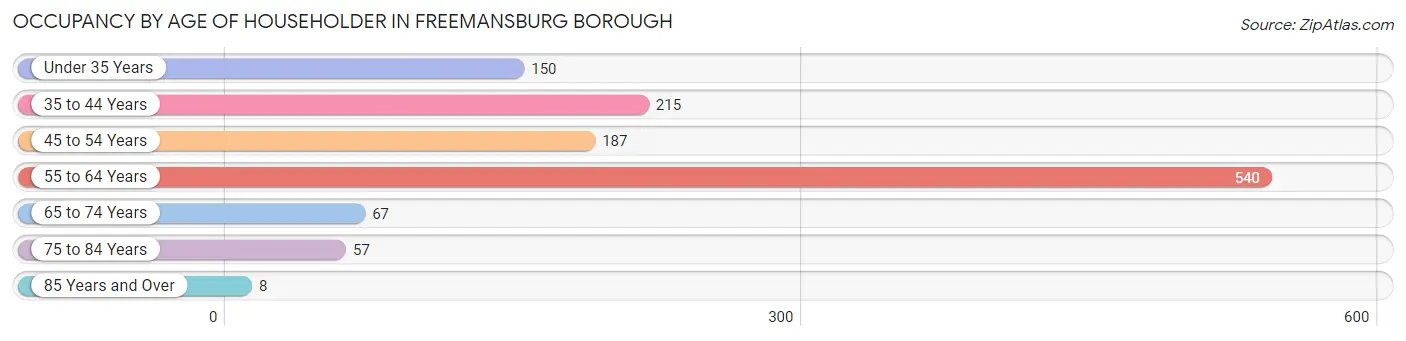
| Age Bracket | # Households | % Households |
| Under 35 Years | 150 | 12.2% |
| 35 to 44 Years | 215 | 17.6% |
| 45 to 54 Years | 187 | 15.3% |
| 55 to 64 Years | 540 | 44.1% |
| 65 to 74 Years | 67 | 5.5% |
| 75 to 84 Years | 57 | 4.7% |
| 85 Years and Over | 8 | 0.6% |
| Total | 1,224 | 100.0% |
Housing Finances in Freemansburg borough
Median Income by Occupancy in Freemansburg borough
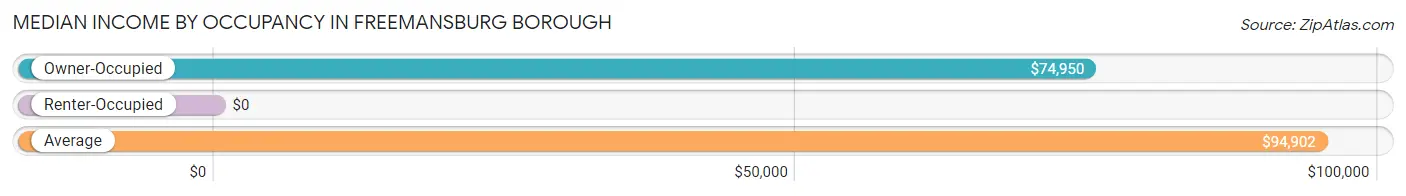
| Occupancy Type | # Households | Median Income |
| Owner-Occupied | 633 (51.7%) | $74,950 |
| Renter-Occupied | 591 (48.3%) | $0 |
| Average | 1,224 (100.0%) | $94,902 |
Occupancy by Householder Income Bracket in Freemansburg borough
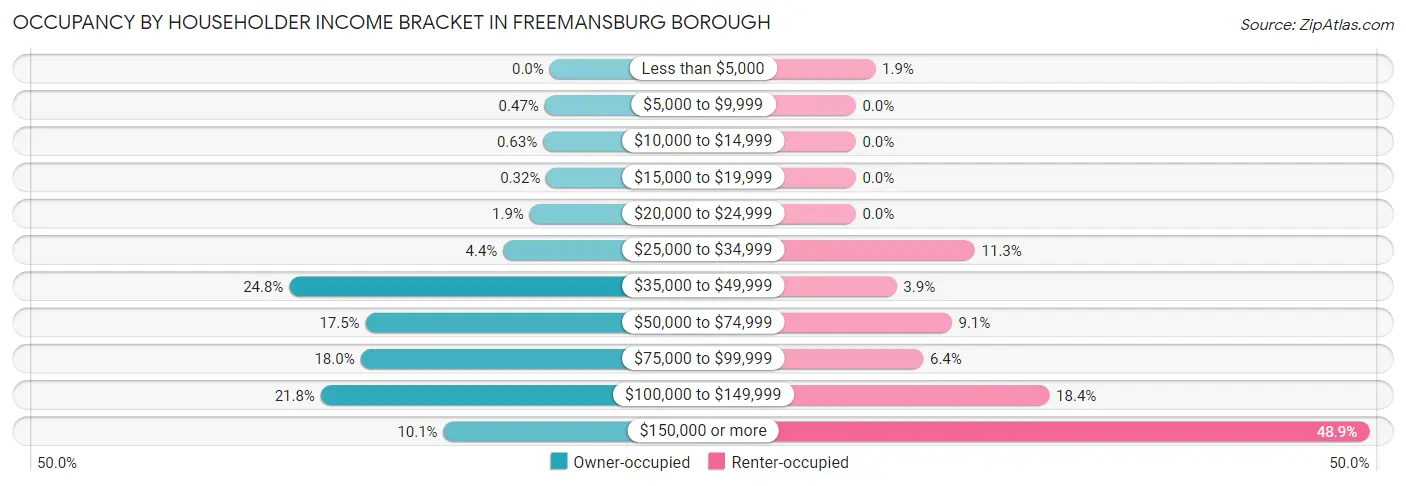
| Income Bracket | Owner-occupied | Renter-occupied |
| Less than $5,000 | 0 (0.0%) | 11 (1.9%) |
| $5,000 to $9,999 | 3 (0.5%) | 0 (0.0%) |
| $10,000 to $14,999 | 4 (0.6%) | 0 (0.0%) |
| $15,000 to $19,999 | 2 (0.3%) | 0 (0.0%) |
| $20,000 to $24,999 | 12 (1.9%) | 0 (0.0%) |
| $25,000 to $34,999 | 28 (4.4%) | 67 (11.3%) |
| $35,000 to $49,999 | 157 (24.8%) | 23 (3.9%) |
| $50,000 to $74,999 | 111 (17.5%) | 54 (9.1%) |
| $75,000 to $99,999 | 114 (18.0%) | 38 (6.4%) |
| $100,000 to $149,999 | 138 (21.8%) | 109 (18.4%) |
| $150,000 or more | 64 (10.1%) | 289 (48.9%) |
| Total | 633 (100.0%) | 591 (100.0%) |
Monthly Housing Cost Tiers in Freemansburg borough
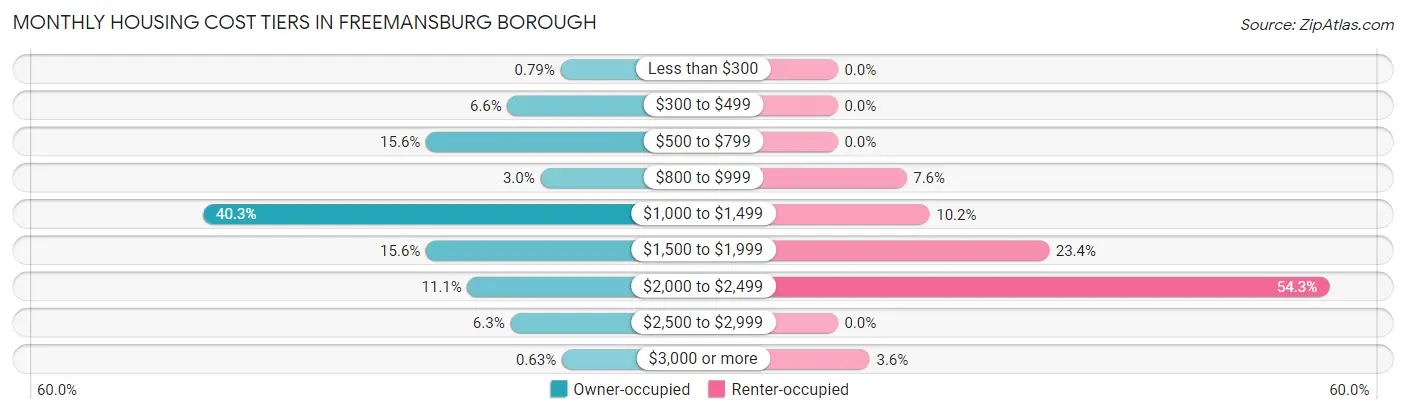
| Monthly Cost | Owner-occupied | Renter-occupied |
| Less than $300 | 5 (0.8%) | 0 (0.0%) |
| $300 to $499 | 42 (6.6%) | 0 (0.0%) |
| $500 to $799 | 99 (15.6%) | 0 (0.0%) |
| $800 to $999 | 19 (3.0%) | 45 (7.6%) |
| $1,000 to $1,499 | 255 (40.3%) | 60 (10.2%) |
| $1,500 to $1,999 | 99 (15.6%) | 138 (23.4%) |
| $2,000 to $2,499 | 70 (11.1%) | 321 (54.3%) |
| $2,500 to $2,999 | 40 (6.3%) | 0 (0.0%) |
| $3,000 or more | 4 (0.6%) | 21 (3.5%) |
| Total | 633 (100.0%) | 591 (100.0%) |
Physical Housing Characteristics in Freemansburg borough
Housing Structures in Freemansburg borough
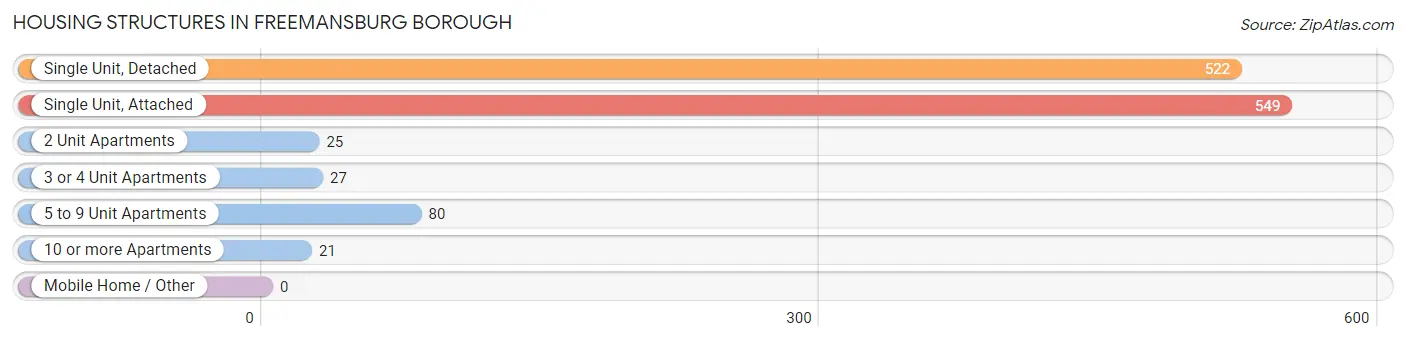
| Structure Type | # Housing Units | % Housing Units |
| Single Unit, Detached | 522 | 42.6% |
| Single Unit, Attached | 549 | 44.9% |
| 2 Unit Apartments | 25 | 2.0% |
| 3 or 4 Unit Apartments | 27 | 2.2% |
| 5 to 9 Unit Apartments | 80 | 6.5% |
| 10 or more Apartments | 21 | 1.7% |
| Mobile Home / Other | 0 | 0.0% |
| Total | 1,224 | 100.0% |
Housing Structures by Occupancy in Freemansburg borough
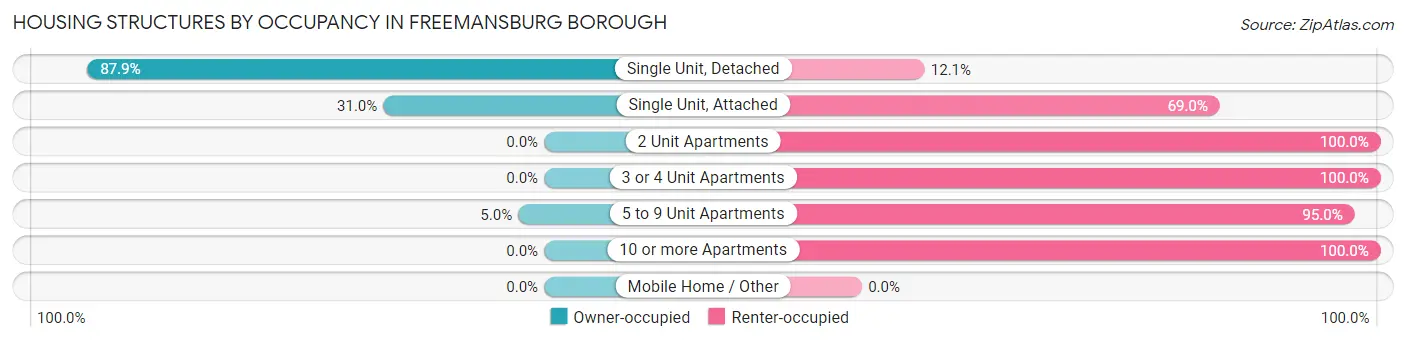
| Structure Type | Owner-occupied | Renter-occupied |
| Single Unit, Detached | 459 (87.9%) | 63 (12.1%) |
| Single Unit, Attached | 170 (31.0%) | 379 (69.0%) |
| 2 Unit Apartments | 0 (0.0%) | 25 (100.0%) |
| 3 or 4 Unit Apartments | 0 (0.0%) | 27 (100.0%) |
| 5 to 9 Unit Apartments | 4 (5.0%) | 76 (95.0%) |
| 10 or more Apartments | 0 (0.0%) | 21 (100.0%) |
| Mobile Home / Other | 0 (0.0%) | 0 (0.0%) |
| Total | 633 (51.7%) | 591 (48.3%) |
Housing Structures by Number of Rooms in Freemansburg borough
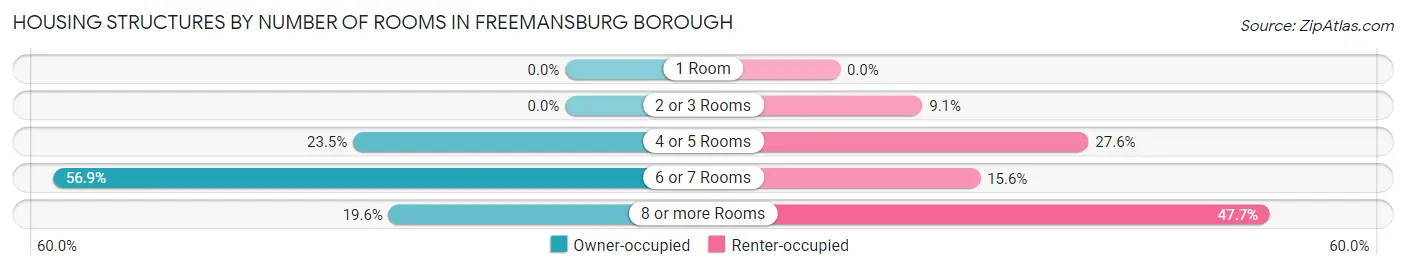
| Number of Rooms | Owner-occupied | Renter-occupied |
| 1 Room | 0 (0.0%) | 0 (0.0%) |
| 2 or 3 Rooms | 0 (0.0%) | 54 (9.1%) |
| 4 or 5 Rooms | 149 (23.5%) | 163 (27.6%) |
| 6 or 7 Rooms | 360 (56.9%) | 92 (15.6%) |
| 8 or more Rooms | 124 (19.6%) | 282 (47.7%) |
| Total | 633 (100.0%) | 591 (100.0%) |
Housing Structure by Heating Type in Freemansburg borough
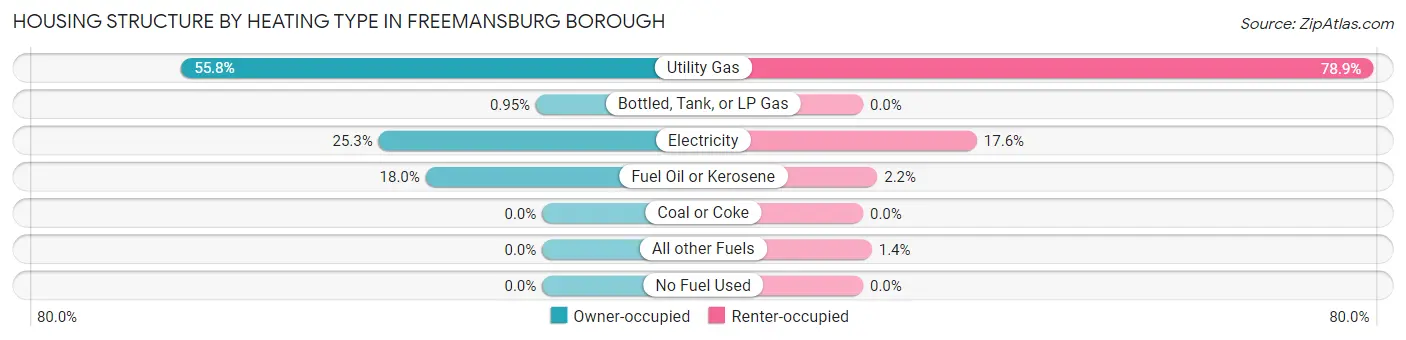
| Heating Type | Owner-occupied | Renter-occupied |
| Utility Gas | 353 (55.8%) | 466 (78.8%) |
| Bottled, Tank, or LP Gas | 6 (0.9%) | 0 (0.0%) |
| Electricity | 160 (25.3%) | 104 (17.6%) |
| Fuel Oil or Kerosene | 114 (18.0%) | 13 (2.2%) |
| Coal or Coke | 0 (0.0%) | 0 (0.0%) |
| All other Fuels | 0 (0.0%) | 8 (1.3%) |
| No Fuel Used | 0 (0.0%) | 0 (0.0%) |
| Total | 633 (100.0%) | 591 (100.0%) |
Household Vehicle Usage in Freemansburg borough
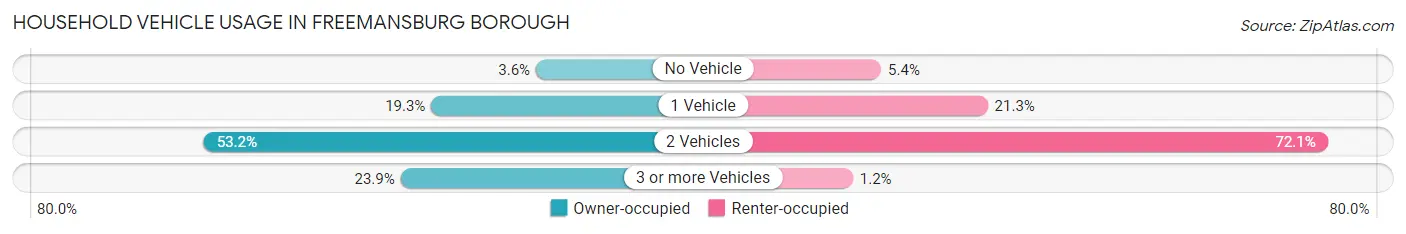
| Vehicles per Household | Owner-occupied | Renter-occupied |
| No Vehicle | 23 (3.6%) | 32 (5.4%) |
| 1 Vehicle | 122 (19.3%) | 126 (21.3%) |
| 2 Vehicles | 337 (53.2%) | 426 (72.1%) |
| 3 or more Vehicles | 151 (23.8%) | 7 (1.2%) |
| Total | 633 (100.0%) | 591 (100.0%) |
Real Estate & Mortgages in Freemansburg borough
Real Estate and Mortgage Overview in Freemansburg borough
| Characteristic | Without Mortgage | With Mortgage |
| Housing Units | 176 | 457 |
| Median Property Value | $145,200 | $210,700 |
| Median Household Income | $51,964 | $37 |
| Monthly Housing Costs | $630 | $4 |
| Real Estate Taxes | $4,170 | $7 |
Property Value by Mortgage Status in Freemansburg borough
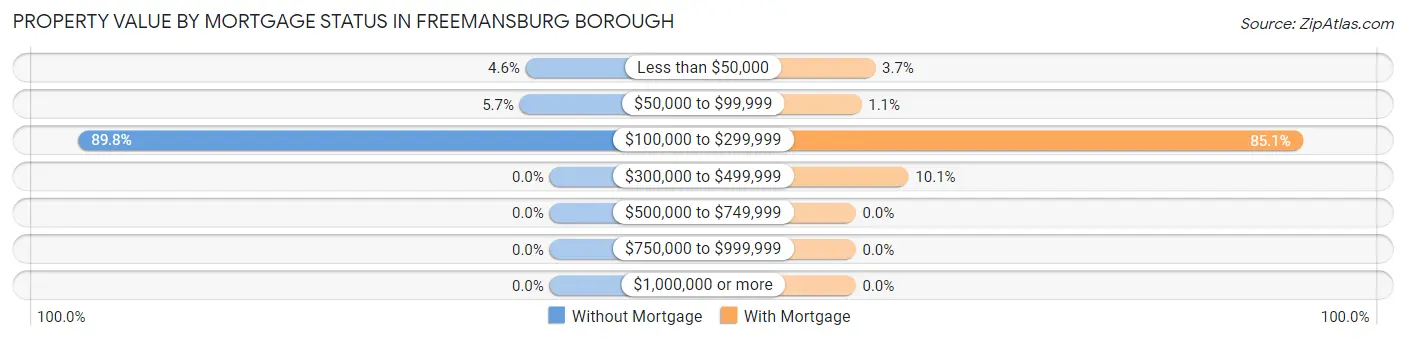
| Property Value | Without Mortgage | With Mortgage |
| Less than $50,000 | 8 (4.5%) | 17 (3.7%) |
| $50,000 to $99,999 | 10 (5.7%) | 5 (1.1%) |
| $100,000 to $299,999 | 158 (89.8%) | 389 (85.1%) |
| $300,000 to $499,999 | 0 (0.0%) | 46 (10.1%) |
| $500,000 to $749,999 | 0 (0.0%) | 0 (0.0%) |
| $750,000 to $999,999 | 0 (0.0%) | 0 (0.0%) |
| $1,000,000 or more | 0 (0.0%) | 0 (0.0%) |
| Total | 176 (100.0%) | 457 (100.0%) |
Household Income by Mortgage Status in Freemansburg borough
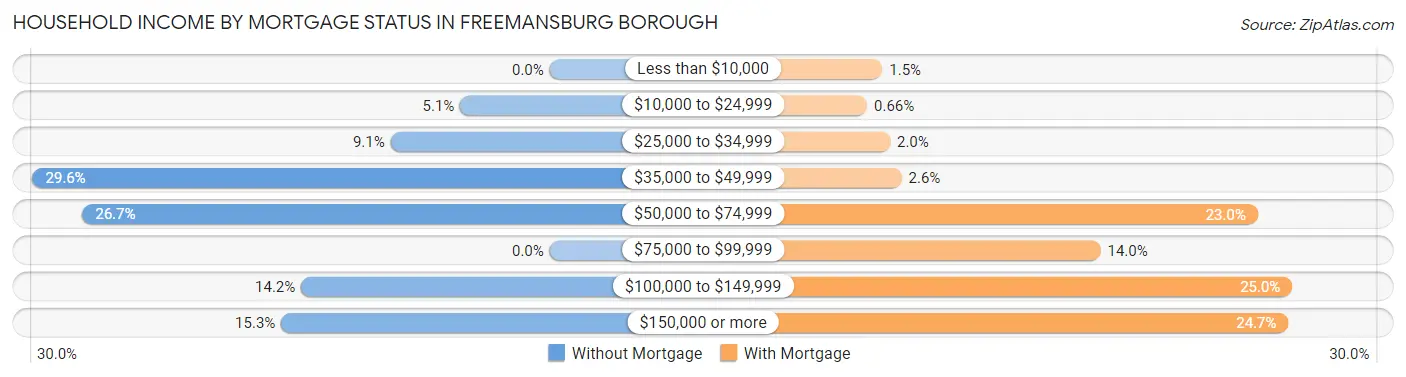
| Household Income | Without Mortgage | With Mortgage |
| Less than $10,000 | 0 (0.0%) | 7 (1.5%) |
| $10,000 to $24,999 | 9 (5.1%) | 3 (0.7%) |
| $25,000 to $34,999 | 16 (9.1%) | 9 (2.0%) |
| $35,000 to $49,999 | 52 (29.5%) | 12 (2.6%) |
| $50,000 to $74,999 | 47 (26.7%) | 105 (23.0%) |
| $75,000 to $99,999 | 0 (0.0%) | 64 (14.0%) |
| $100,000 to $149,999 | 25 (14.2%) | 114 (24.9%) |
| $150,000 or more | 27 (15.3%) | 113 (24.7%) |
| Total | 176 (100.0%) | 457 (100.0%) |
Property Value to Household Income Ratio in Freemansburg borough
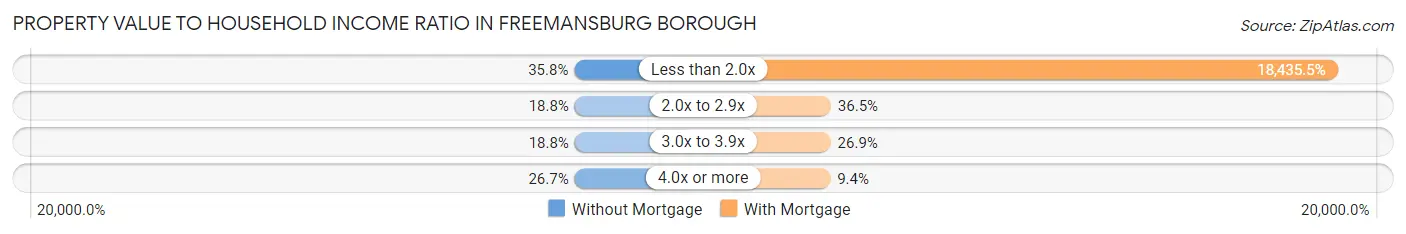
| Value-to-Income Ratio | Without Mortgage | With Mortgage |
| Less than 2.0x | 63 (35.8%) | 84,250 (18,435.5%) |
| 2.0x to 2.9x | 33 (18.8%) | 167 (36.5%) |
| 3.0x to 3.9x | 33 (18.8%) | 123 (26.9%) |
| 4.0x or more | 47 (26.7%) | 43 (9.4%) |
| Total | 176 (100.0%) | 457 (100.0%) |
Real Estate Taxes by Mortgage Status in Freemansburg borough
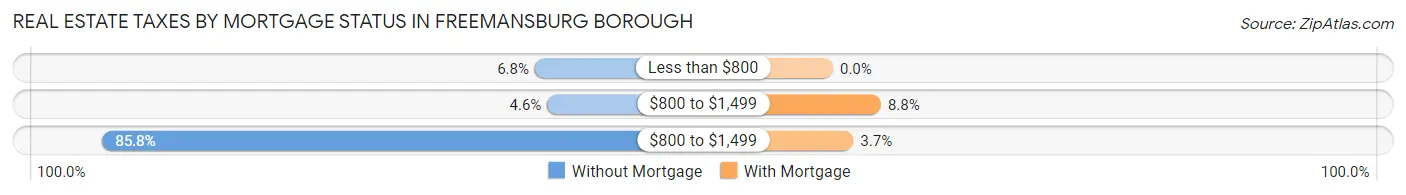
| Property Taxes | Without Mortgage | With Mortgage |
| Less than $800 | 12 (6.8%) | 0 (0.0%) |
| $800 to $1,499 | 8 (4.5%) | 40 (8.7%) |
| $800 to $1,499 | 151 (85.8%) | 17 (3.7%) |
| Total | 176 (100.0%) | 457 (100.0%) |
Health & Disability in Freemansburg borough
Health Insurance Coverage by Age in Freemansburg borough
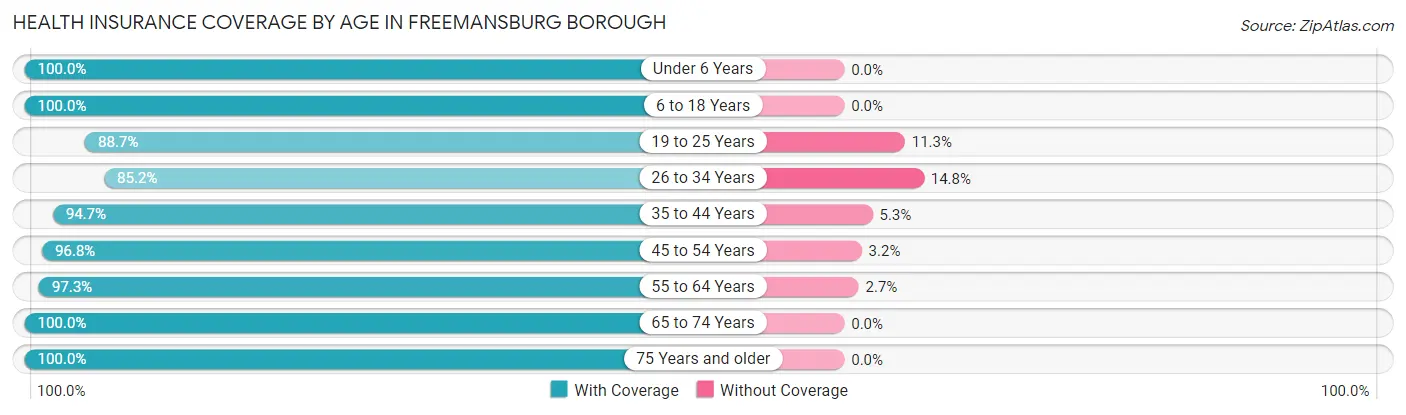
| Age Bracket | With Coverage | Without Coverage |
| Under 6 Years | 109 (100.0%) | 0 (0.0%) |
| 6 to 18 Years | 527 (100.0%) | 0 (0.0%) |
| 19 to 25 Years | 165 (88.7%) | 21 (11.3%) |
| 26 to 34 Years | 270 (85.2%) | 47 (14.8%) |
| 35 to 44 Years | 396 (94.7%) | 22 (5.3%) |
| 45 to 54 Years | 329 (96.8%) | 11 (3.2%) |
| 55 to 64 Years | 657 (97.3%) | 18 (2.7%) |
| 65 to 74 Years | 150 (100.0%) | 0 (0.0%) |
| 75 Years and older | 139 (100.0%) | 0 (0.0%) |
| Total | 2,742 (95.8%) | 119 (4.2%) |
Health Insurance Coverage by Citizenship Status in Freemansburg borough
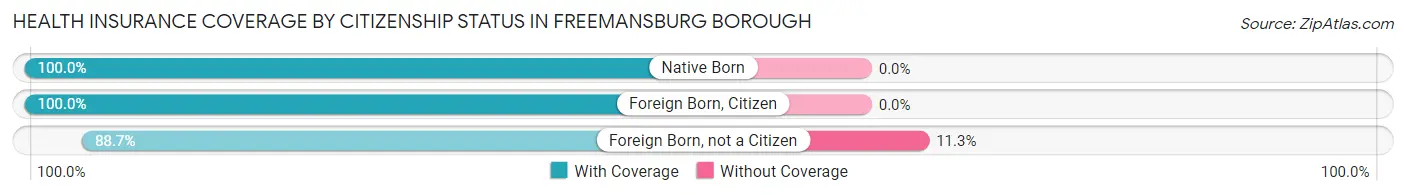
| Citizenship Status | With Coverage | Without Coverage |
| Native Born | 109 (100.0%) | 0 (0.0%) |
| Foreign Born, Citizen | 527 (100.0%) | 0 (0.0%) |
| Foreign Born, not a Citizen | 165 (88.7%) | 21 (11.3%) |
Health Insurance Coverage by Household Income in Freemansburg borough
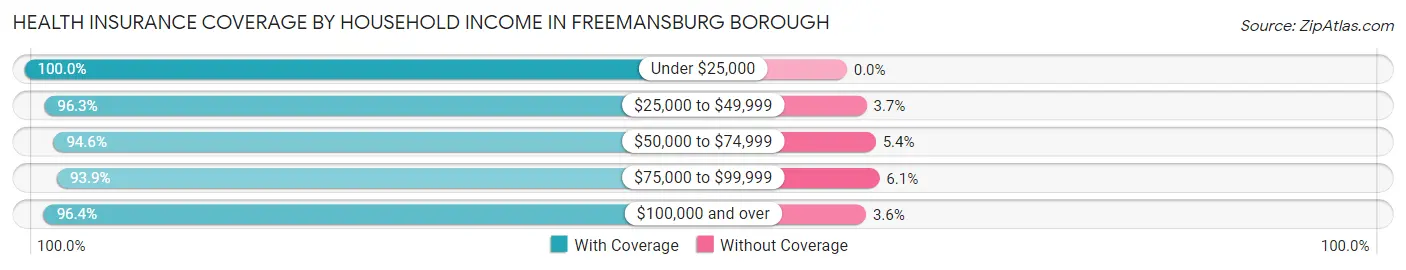
| Household Income | With Coverage | Without Coverage |
| Under $25,000 | 70 (100.0%) | 0 (0.0%) |
| $25,000 to $49,999 | 468 (96.3%) | 18 (3.7%) |
| $50,000 to $74,999 | 314 (94.6%) | 18 (5.4%) |
| $75,000 to $99,999 | 492 (93.9%) | 32 (6.1%) |
| $100,000 and over | 1,369 (96.4%) | 51 (3.6%) |
Public vs Private Health Insurance Coverage by Age in Freemansburg borough
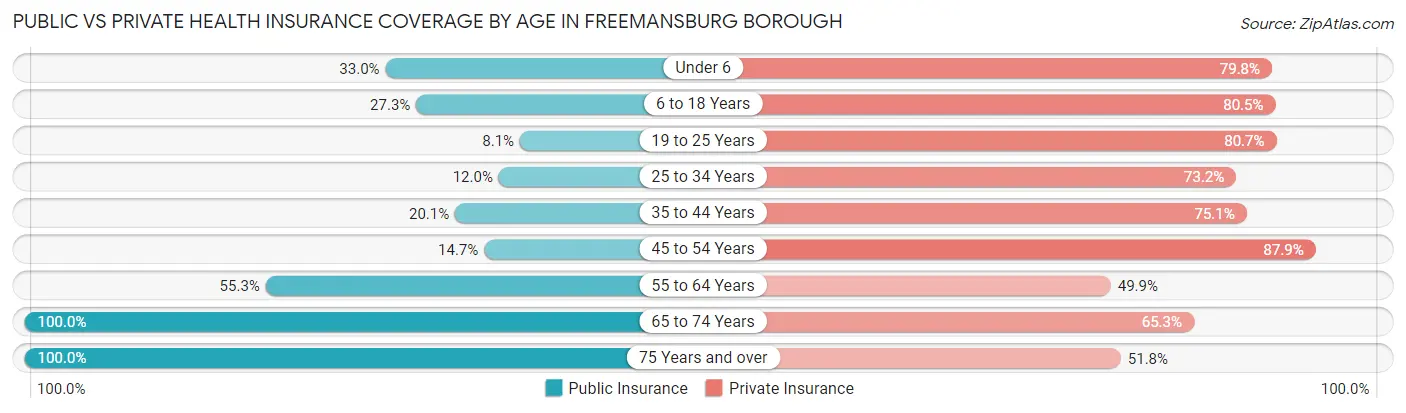
| Age Bracket | Public Insurance | Private Insurance |
| Under 6 | 36 (33.0%) | 87 (79.8%) |
| 6 to 18 Years | 144 (27.3%) | 424 (80.5%) |
| 19 to 25 Years | 15 (8.1%) | 150 (80.6%) |
| 25 to 34 Years | 38 (12.0%) | 232 (73.2%) |
| 35 to 44 Years | 84 (20.1%) | 314 (75.1%) |
| 45 to 54 Years | 50 (14.7%) | 299 (87.9%) |
| 55 to 64 Years | 373 (55.3%) | 337 (49.9%) |
| 65 to 74 Years | 150 (100.0%) | 98 (65.3%) |
| 75 Years and over | 139 (100.0%) | 72 (51.8%) |
| Total | 1,029 (36.0%) | 2,013 (70.4%) |
Disability Status by Sex by Age in Freemansburg borough
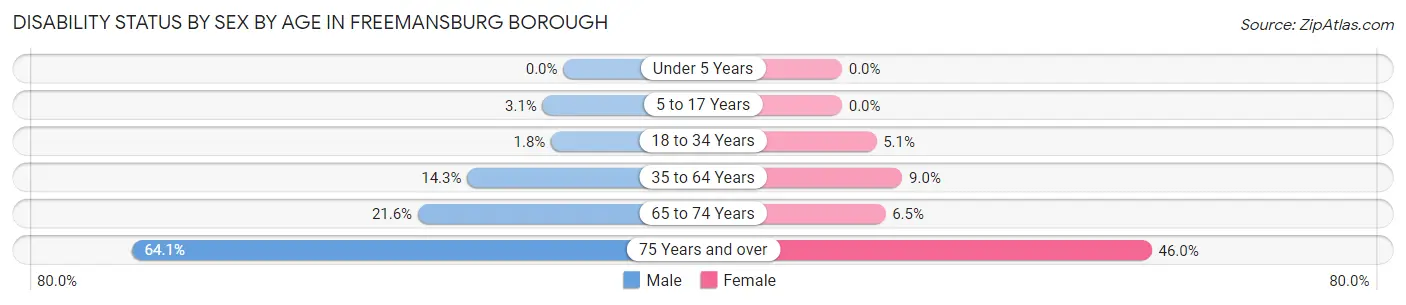
| Age Bracket | Male | Female |
| Under 5 Years | 0 (0.0%) | 0 (0.0%) |
| 5 to 17 Years | 9 (3.1%) | 0 (0.0%) |
| 18 to 34 Years | 5 (1.8%) | 12 (5.1%) |
| 35 to 64 Years | 85 (14.3%) | 75 (9.0%) |
| 65 to 74 Years | 19 (21.6%) | 4 (6.5%) |
| 75 Years and over | 25 (64.1%) | 46 (46.0%) |
Disability Class by Sex by Age in Freemansburg borough
Disability Class: Hearing Difficulty
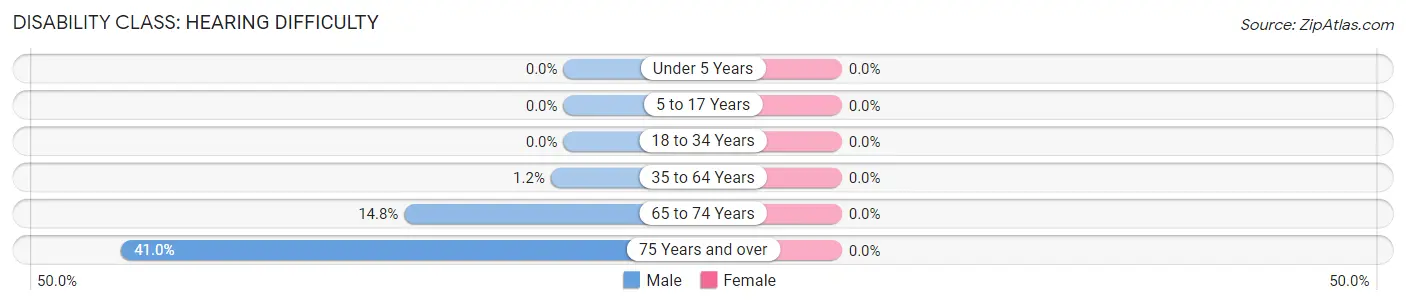
| Age Bracket | Male | Female |
| Under 5 Years | 0 (0.0%) | 0 (0.0%) |
| 5 to 17 Years | 0 (0.0%) | 0 (0.0%) |
| 18 to 34 Years | 0 (0.0%) | 0 (0.0%) |
| 35 to 64 Years | 7 (1.2%) | 0 (0.0%) |
| 65 to 74 Years | 13 (14.8%) | 0 (0.0%) |
| 75 Years and over | 16 (41.0%) | 0 (0.0%) |
Disability Class: Vision Difficulty
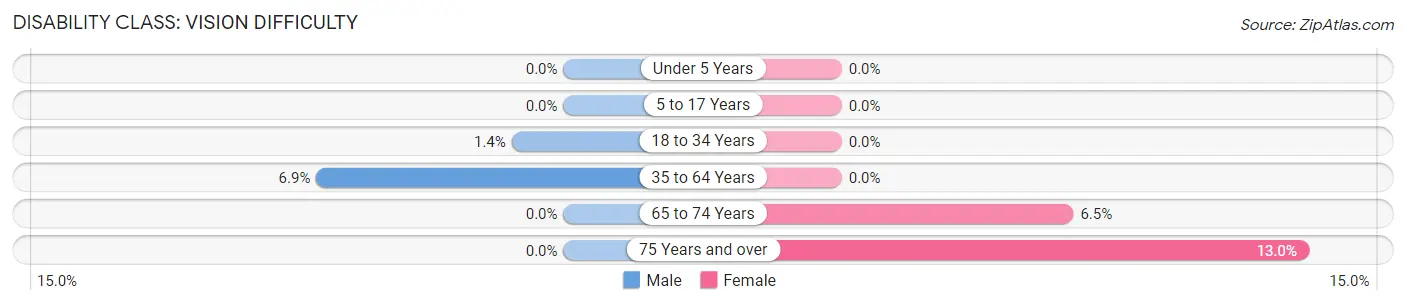
| Age Bracket | Male | Female |
| Under 5 Years | 0 (0.0%) | 0 (0.0%) |
| 5 to 17 Years | 0 (0.0%) | 0 (0.0%) |
| 18 to 34 Years | 4 (1.4%) | 0 (0.0%) |
| 35 to 64 Years | 41 (6.9%) | 0 (0.0%) |
| 65 to 74 Years | 0 (0.0%) | 4 (6.5%) |
| 75 Years and over | 0 (0.0%) | 13 (13.0%) |
Disability Class: Cognitive Difficulty
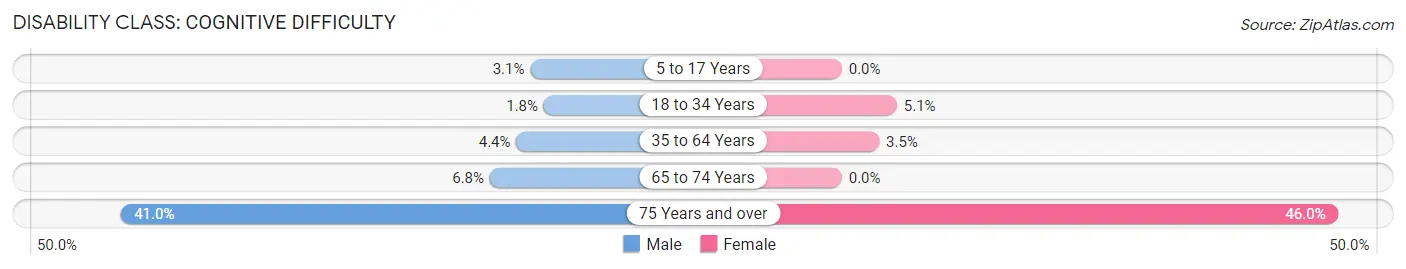
| Age Bracket | Male | Female |
| 5 to 17 Years | 9 (3.1%) | 0 (0.0%) |
| 18 to 34 Years | 5 (1.8%) | 12 (5.1%) |
| 35 to 64 Years | 26 (4.4%) | 29 (3.5%) |
| 65 to 74 Years | 6 (6.8%) | 0 (0.0%) |
| 75 Years and over | 16 (41.0%) | 46 (46.0%) |
Disability Class: Ambulatory Difficulty

| Age Bracket | Male | Female |
| 5 to 17 Years | 0 (0.0%) | 0 (0.0%) |
| 18 to 34 Years | 5 (1.8%) | 0 (0.0%) |
| 35 to 64 Years | 34 (5.7%) | 59 (7.0%) |
| 65 to 74 Years | 0 (0.0%) | 4 (6.5%) |
| 75 Years and over | 25 (64.1%) | 25 (25.0%) |
Disability Class: Self-Care Difficulty
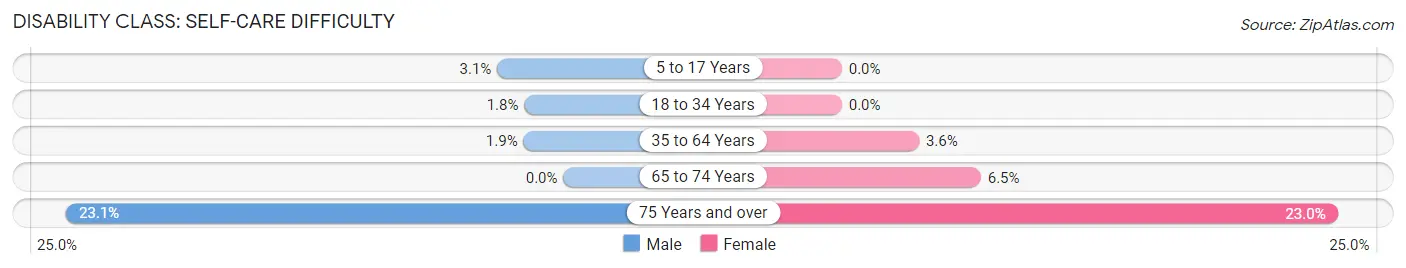
| Age Bracket | Male | Female |
| 5 to 17 Years | 9 (3.1%) | 0 (0.0%) |
| 18 to 34 Years | 5 (1.8%) | 0 (0.0%) |
| 35 to 64 Years | 11 (1.8%) | 30 (3.6%) |
| 65 to 74 Years | 0 (0.0%) | 4 (6.5%) |
| 75 Years and over | 9 (23.1%) | 23 (23.0%) |
Technology Access in Freemansburg borough
Computing Device Access in Freemansburg borough
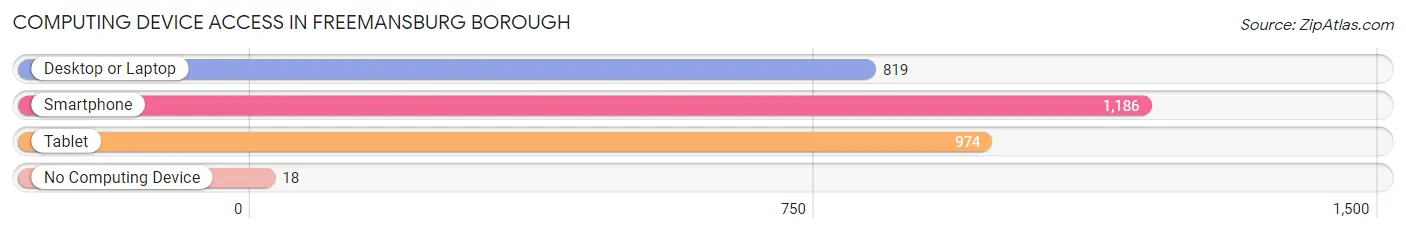
| Device Type | # Households | % Households |
| Desktop or Laptop | 819 | 66.9% |
| Smartphone | 1,186 | 96.9% |
| Tablet | 974 | 79.6% |
| No Computing Device | 18 | 1.5% |
| Total | 1,224 | 100.0% |
Internet Access in Freemansburg borough
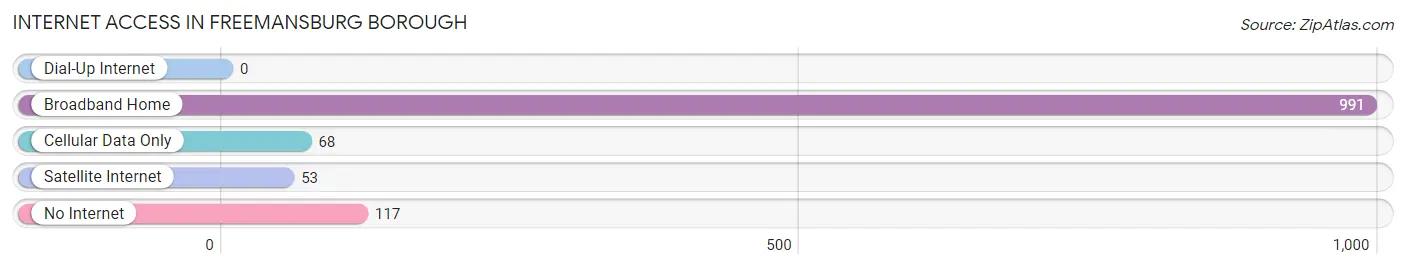
| Internet Type | # Households | % Households |
| Dial-Up Internet | 0 | 0.0% |
| Broadband Home | 991 | 81.0% |
| Cellular Data Only | 68 | 5.6% |
| Satellite Internet | 53 | 4.3% |
| No Internet | 117 | 9.6% |
| Total | 1,224 | 100.0% |
Freemansburg borough Summary
Freemansburg Borough is a small borough located in Northampton County, Pennsylvania. It is situated in the Lehigh Valley region of the state, and is part of the Allentown-Bethlehem-Easton metropolitan area. The borough has a population of 2,717 as of the 2010 census, and covers an area of 0.7 square miles.
History
The area that is now Freemansburg was first settled in 1750 by a group of Moravian missionaries. The area was originally known as “Friedenshütten”, which translates to “Peace Huts” in English. The name was changed to Freemansburg in 1845, after the Freeman family, who were among the first settlers in the area.
The borough was officially incorporated in 1867, and the first mayor was elected in 1868. The first post office was established in 1869, and the first school was built in 1871.
In the late 19th century, Freemansburg was a thriving industrial center, with several factories and mills located in the area. The borough was also home to a number of brickyards, which supplied bricks for many of the buildings in the Lehigh Valley.
Geography
Freemansburg is located in Northampton County, Pennsylvania, in the Lehigh Valley region of the state. It is situated along the Lehigh River, and is bordered by Bethlehem Township to the north, Easton to the east, and Hellertown to the south. The borough covers an area of 0.7 square miles, and has a population of 2,717 as of the 2010 census.
The borough is located in the humid continental climate zone, and has four distinct seasons. Summers are typically hot and humid, with temperatures reaching into the 90s, while winters are cold and snowy, with temperatures dropping into the teens.
Economy
Freemansburg’s economy is largely based on manufacturing and retail. The borough is home to several factories and mills, including a paper mill, a steel mill, and a brickyard. The borough is also home to several retail stores, including a grocery store, a hardware store, and a pharmacy.
The borough is also home to several restaurants, including a pizzeria, a Chinese restaurant, and a Mexican restaurant. The borough also has several banks, a post office, and a library.
Demographics
As of the 2010 census, the population of Freemansburg was 2,717. The racial makeup of the borough was 94.3% White, 2.2% African American, 0.3% Native American, 0.7% Asian, 0.1% Pacific Islander, and 2.4% from other races. Hispanic or Latino of any race were 4.2% of the population.
The median household income in the borough was $45,938, and the median family income was $54,917. The per capita income was $21,945. About 8.3% of the population was below the poverty line.
Freemansburg is served by the Bethlehem Area School District. The borough is home to one elementary school, one middle school, and one high school. The borough also has several private schools, including a Catholic school and a Lutheran school.
Common Questions
What is Per Capita Income in Freemansburg borough?
Per Capita income in Freemansburg borough is $30,557.
What is the Median Family Income in Freemansburg borough?
Median Family Income in Freemansburg borough is $98,214.
What is the Median Household income in Freemansburg borough?
Median Household Income in Freemansburg borough is $94,902.
What is Income or Wage Gap in Freemansburg borough?
Income or Wage Gap in Freemansburg borough is 21.4%.
Women in Freemansburg borough earn 78.6 cents for every dollar earned by a man.
What is Inequality or Gini Index in Freemansburg borough?
Inequality or Gini Index in Freemansburg borough is 0.34.
What is the Total Population of Freemansburg borough?
Total Population of Freemansburg borough is 2,861.
What is the Total Male Population of Freemansburg borough?
Total Male Population of Freemansburg borough is 1,315.
What is the Total Female Population of Freemansburg borough?
Total Female Population of Freemansburg borough is 1,546.
What is the Ratio of Males per 100 Females in Freemansburg borough?
There are 85.06 Males per 100 Females in Freemansburg borough.
What is the Ratio of Females per 100 Males in Freemansburg borough?
There are 117.57 Females per 100 Males in Freemansburg borough.
What is the Median Population Age in Freemansburg borough?
Median Population Age in Freemansburg borough is 41.0 Years.
What is the Average Family Size in Freemansburg borough
Average Family Size in Freemansburg borough is 2.4 People.
What is the Average Household Size in Freemansburg borough
Average Household Size in Freemansburg borough is 2.3 People.
How Large is the Labor Force in Freemansburg borough?
There are 1,529 People in the Labor Forcein in Freemansburg borough.
What is the Percentage of People in the Labor Force in Freemansburg borough?
64.8% of People are in the Labor Force in Freemansburg borough.
What is the Unemployment Rate in Freemansburg borough?
Unemployment Rate in Freemansburg borough is 4.8%.