Stony Creek Mills, PA Map & Demographics
Stony Creek Mills Map
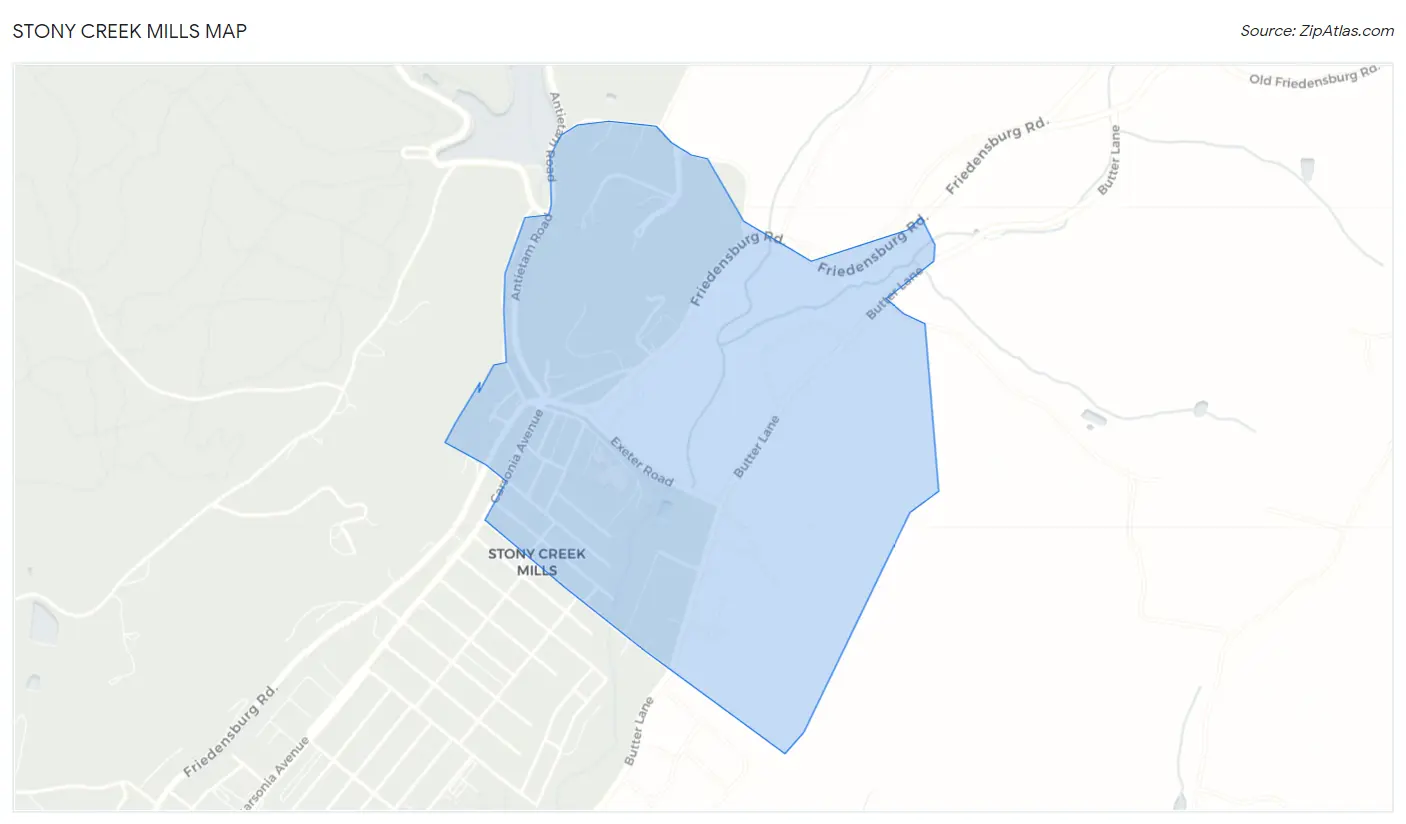
Stony Creek Mills Overview
$21,921
PER CAPITA INCOME
$54,444
AVG FAMILY INCOME
$49,667
AVG HOUSEHOLD INCOME
37.1%
WAGE / INCOME GAP [ % ]
62.9¢/ $1
WAGE / INCOME GAP [ $ ]
0.56
INEQUALITY / GINI INDEX
865
TOTAL POPULATION
508
MALE POPULATION
357
FEMALE POPULATION
142.30
MALES / 100 FEMALES
70.28
FEMALES / 100 MALES
32.5
MEDIAN AGE
3.0
AVG FAMILY SIZE
2.6
AVG HOUSEHOLD SIZE
419
LABOR FORCE [ PEOPLE ]
70.7%
PERCENT IN LABOR FORCE
16.5%
UNEMPLOYMENT RATE
Income in Stony Creek Mills
Income Overview in Stony Creek Mills
Per Capita Income in Stony Creek Mills is $21,921, while median incomes of families and households are $54,444 and $49,667 respectively.
| Characteristic | Number | Measure |
| Per Capita Income | 865 | $21,921 |
| Median Family Income | 262 | $54,444 |
| Mean Family Income | 262 | $64,674 |
| Median Household Income | 336 | $49,667 |
| Mean Household Income | 336 | $55,422 |
| Income Deficit | 262 | $0 |
| Wage / Income Gap (%) | 865 | 37.14% |
| Wage / Income Gap ($) | 865 | 62.86¢ per $1 |
| Gini / Inequality Index | 865 | 0.56 |
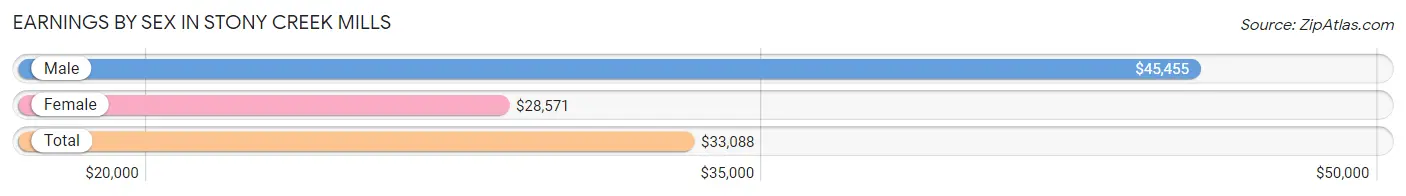
Earnings by Sex in Stony Creek Mills
Average Earnings in Stony Creek Mills are $33,088, $45,455 for men and $28,571 for women, a difference of 37.1%.
| Sex | Number | Average Earnings |
| Male | 180 (48.6%) | $45,455 |
| Female | 190 (51.3%) | $28,571 |
| Total | 370 (100.0%) | $33,088 |
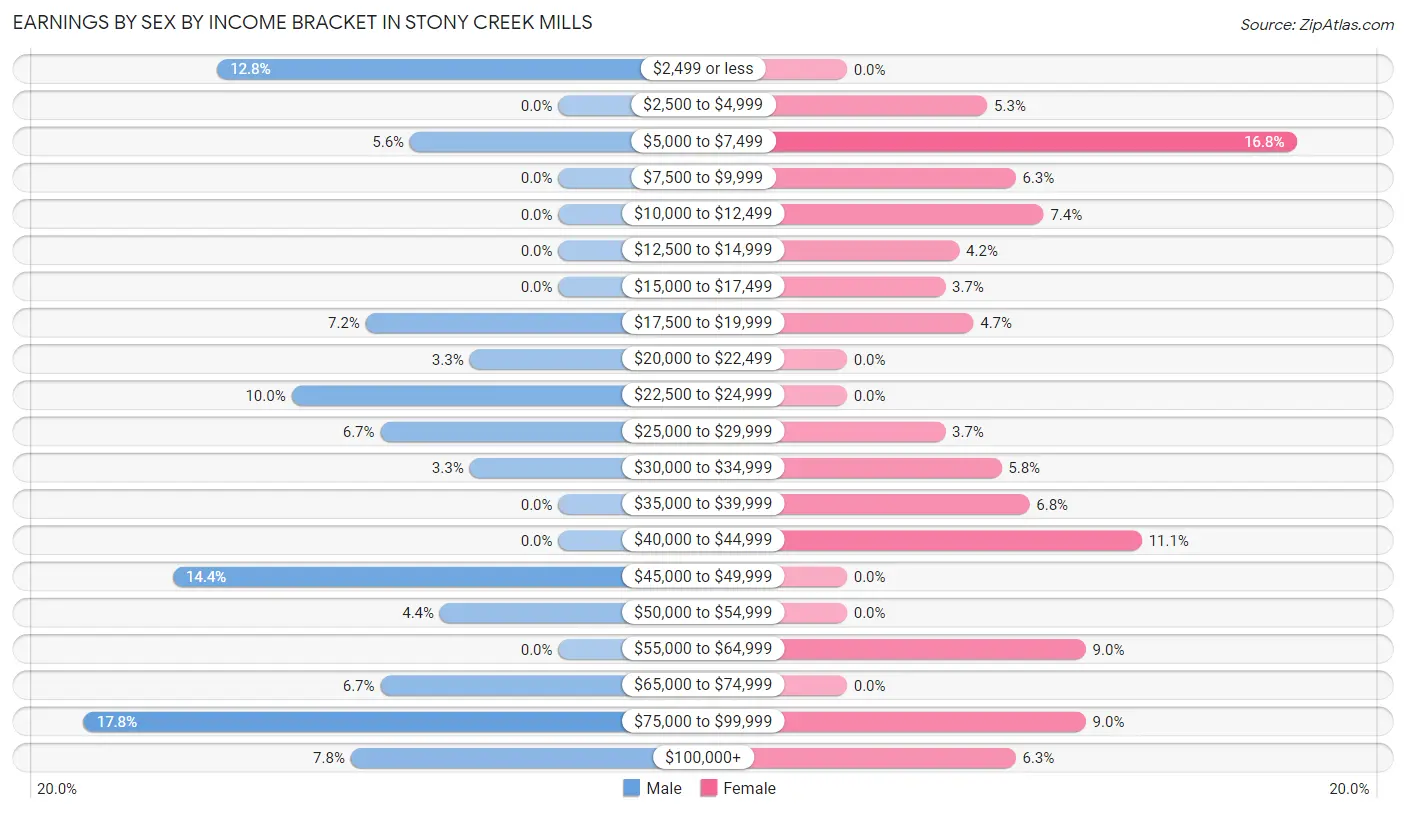
Earnings by Sex by Income Bracket in Stony Creek Mills
The most common earnings brackets in Stony Creek Mills are $75,000 to $99,999 for men (32 | 17.8%) and $5,000 to $7,499 for women (32 | 16.8%).
| Income | Male | Female |
| $2,499 or less | 23 (12.8%) | 0 (0.0%) |
| $2,500 to $4,999 | 0 (0.0%) | 10 (5.3%) |
| $5,000 to $7,499 | 10 (5.6%) | 32 (16.8%) |
| $7,500 to $9,999 | 0 (0.0%) | 12 (6.3%) |
| $10,000 to $12,499 | 0 (0.0%) | 14 (7.4%) |
| $12,500 to $14,999 | 0 (0.0%) | 8 (4.2%) |
| $15,000 to $17,499 | 0 (0.0%) | 7 (3.7%) |
| $17,500 to $19,999 | 13 (7.2%) | 9 (4.7%) |
| $20,000 to $22,499 | 6 (3.3%) | 0 (0.0%) |
| $22,500 to $24,999 | 18 (10.0%) | 0 (0.0%) |
| $25,000 to $29,999 | 12 (6.7%) | 7 (3.7%) |
| $30,000 to $34,999 | 6 (3.3%) | 11 (5.8%) |
| $35,000 to $39,999 | 0 (0.0%) | 13 (6.8%) |
| $40,000 to $44,999 | 0 (0.0%) | 21 (11.1%) |
| $45,000 to $49,999 | 26 (14.4%) | 0 (0.0%) |
| $50,000 to $54,999 | 8 (4.4%) | 0 (0.0%) |
| $55,000 to $64,999 | 0 (0.0%) | 17 (8.9%) |
| $65,000 to $74,999 | 12 (6.7%) | 0 (0.0%) |
| $75,000 to $99,999 | 32 (17.8%) | 17 (8.9%) |
| $100,000+ | 14 (7.8%) | 12 (6.3%) |
| Total | 180 (100.0%) | 190 (100.0%) |
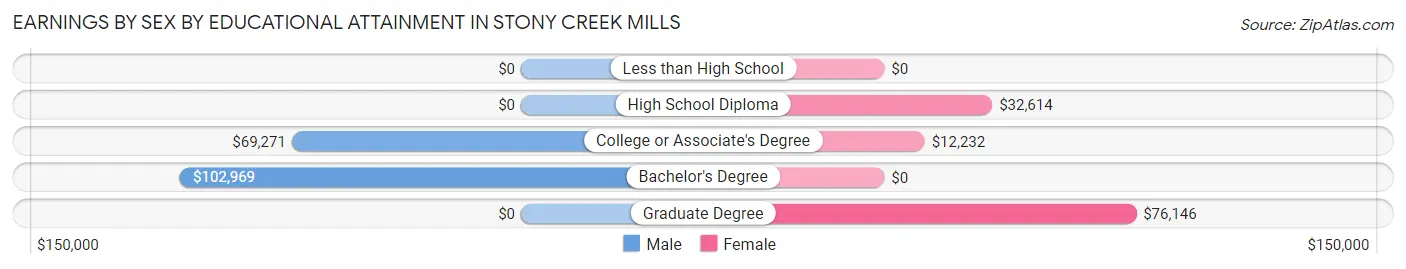
Earnings by Sex by Educational Attainment in Stony Creek Mills
Average earnings in Stony Creek Mills are $46,591 for men and $33,636 for women, a difference of 27.8%. Men with an educational attainment of bachelor's degree enjoy the highest average annual earnings of $102,969, while those with college or associate's degree education earn the least with $69,271. Women with an educational attainment of graduate degree earn the most with the average annual earnings of $76,146, while those with college or associate's degree education have the smallest earnings of $12,232.
| Educational Attainment | Male Income | Female Income |
| Less than High School | - | - |
| High School Diploma | - | - |
| College or Associate's Degree | $69,271 | $12,232 |
| Bachelor's Degree | $102,969 | $0 |
| Graduate Degree | - | - |
| Total | $46,591 | $33,636 |
Family Income in Stony Creek Mills
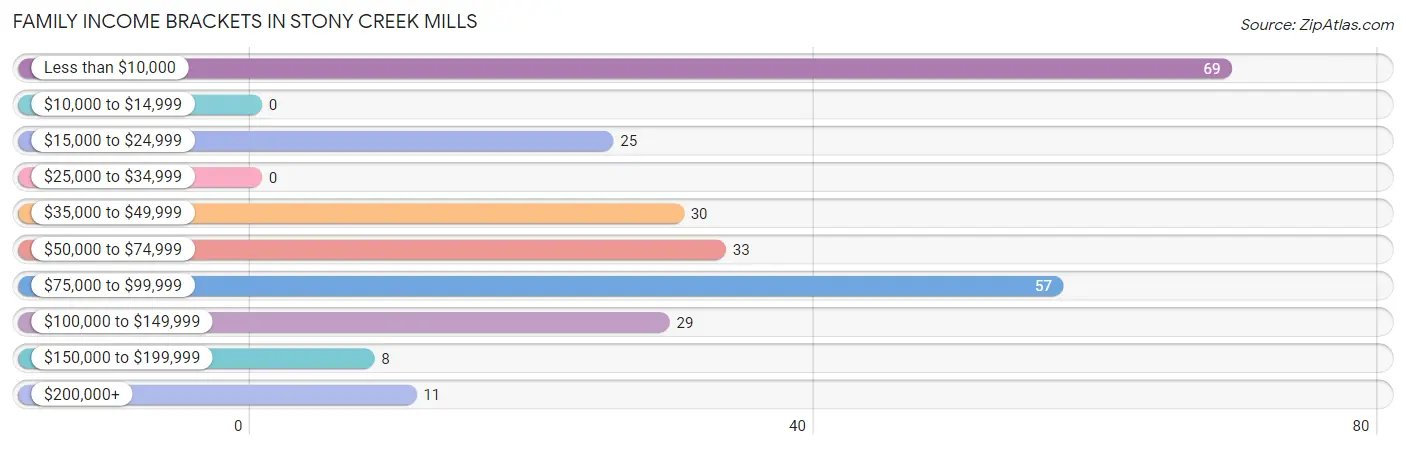
Family Income Brackets in Stony Creek Mills
According to the Stony Creek Mills family income data, there are 69 families falling into the less than $10,000 income range, which is the most common income bracket and makes up 26.3% of all families.
| Income Bracket | # Families | % Families |
| Less than $10,000 | 69 | 26.3% |
| $10,000 to $14,999 | 0 | 0.0% |
| $15,000 to $24,999 | 25 | 9.5% |
| $25,000 to $34,999 | 0 | 0.0% |
| $35,000 to $49,999 | 30 | 11.5% |
| $50,000 to $74,999 | 33 | 12.6% |
| $75,000 to $99,999 | 57 | 21.8% |
| $100,000 to $149,999 | 29 | 11.1% |
| $150,000 to $199,999 | 8 | 3.1% |
| $200,000+ | 11 | 4.2% |
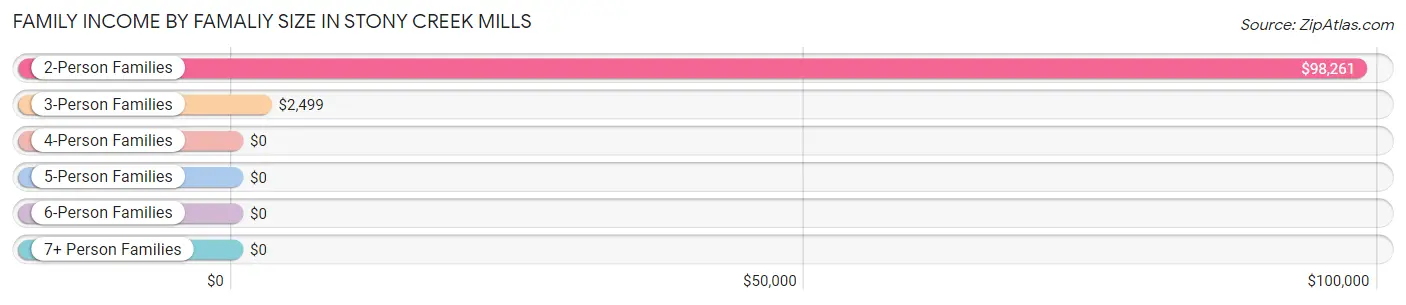
Family Income by Famaliy Size in Stony Creek Mills
2-person families (90 | 34.4%) account for the highest median family income in Stony Creek Mills with $98,261 per family, while 2-person families (90 | 34.4%) have the highest median income of $49,130 per family member.
| Income Bracket | # Families | Median Income |
| 2-Person Families | 90 (34.4%) | $98,261 |
| 3-Person Families | 116 (44.3%) | $2,499 |
| 4-Person Families | 36 (13.7%) | $0 |
| 5-Person Families | 8 (3.0%) | $0 |
| 6-Person Families | 0 (0.0%) | $0 |
| 7+ Person Families | 12 (4.6%) | $0 |
| Total | 262 (100.0%) | $54,444 |
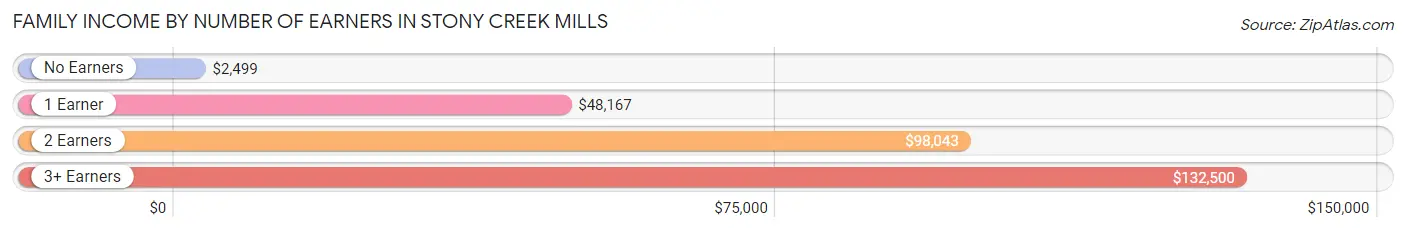
Family Income by Number of Earners in Stony Creek Mills
The median family income in Stony Creek Mills is $54,444, with families comprising 3+ earners (38) having the highest median family income of $132,500, while families with no earners (84) have the lowest median family income of $2,499, accounting for 14.5% and 32.1% of families, respectively.
| Number of Earners | # Families | Median Income |
| No Earners | 84 (32.1%) | $2,499 |
| 1 Earner | 58 (22.1%) | $48,167 |
| 2 Earners | 82 (31.3%) | $98,043 |
| 3+ Earners | 38 (14.5%) | $132,500 |
| Total | 262 (100.0%) | $54,444 |
Household Income in Stony Creek Mills
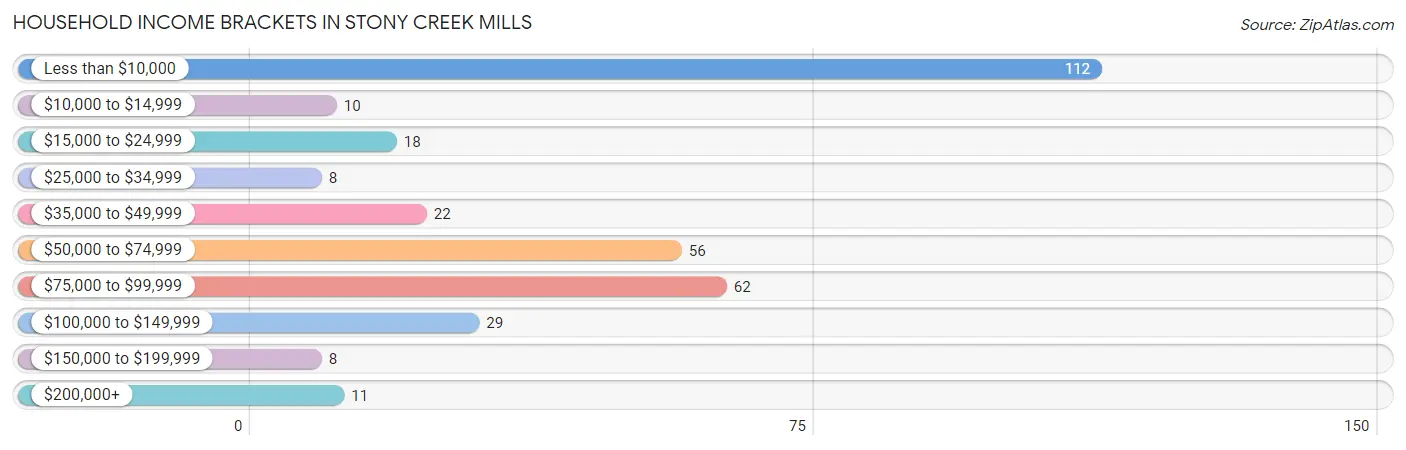
Household Income Brackets in Stony Creek Mills
With 112 households falling in the category, the less than $10,000 income range is the most frequent in Stony Creek Mills, accounting for 33.3% of all households. In contrast, only 8 households (2.4%) fall into the $25,000 to $34,999 income bracket, making it the least populous group.
| Income Bracket | # Households | % Households |
| Less than $10,000 | 112 | 33.3% |
| $10,000 to $14,999 | 10 | 3.0% |
| $15,000 to $24,999 | 18 | 5.4% |
| $25,000 to $34,999 | 8 | 2.4% |
| $35,000 to $49,999 | 22 | 6.5% |
| $50,000 to $74,999 | 56 | 16.7% |
| $75,000 to $99,999 | 62 | 18.5% |
| $100,000 to $149,999 | 29 | 8.6% |
| $150,000 to $199,999 | 8 | 2.4% |
| $200,000+ | 11 | 3.3% |
Household Income by Householder Age in Stony Creek Mills
The median household income in Stony Creek Mills is $49,667, with the highest median household income of $81,500 found in the 45 to 64 years age bracket for the primary householder. A total of 106 households (31.6%) fall into this category. Meanwhile, the 15 to 24 years age bracket for the primary householder has the lowest median household income of $0, with 43 households (12.8%) in this group.
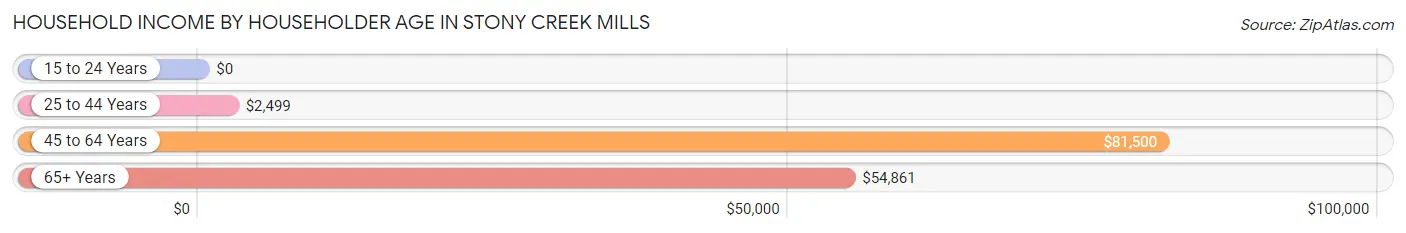
| Income Bracket | # Households | Median Income |
| 15 to 24 Years | 43 (12.8%) | $0 |
| 25 to 44 Years | 134 (39.9%) | $2,499 |
| 45 to 64 Years | 106 (31.6%) | $81,500 |
| 65+ Years | 53 (15.8%) | $54,861 |
| Total | 336 (100.0%) | $49,667 |
Poverty in Stony Creek Mills
Income Below Poverty by Sex and Age in Stony Creek Mills
With 51.8% poverty level for males and 10.9% for females among the residents of Stony Creek Mills, 6 to 11 year old males and 12 to 14 year old females are the most vulnerable to poverty, with 112 males (83.0%) and 7 females (100.0%) in their respective age groups living below the poverty level.
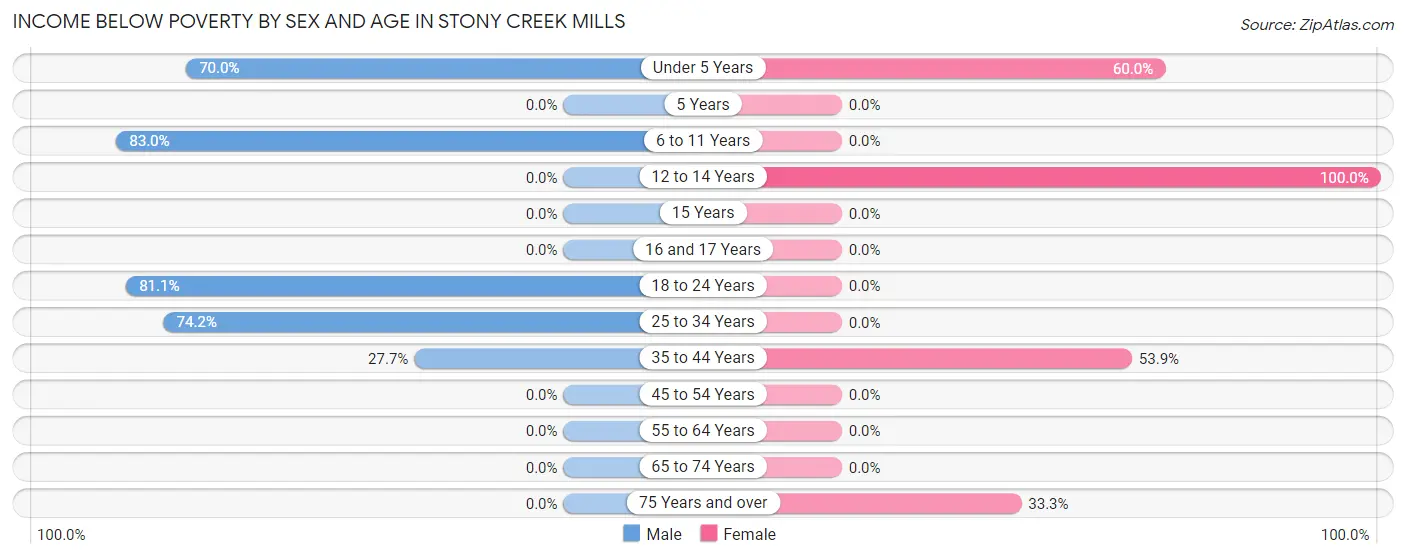
| Age Bracket | Male | Female |
| Under 5 Years | 21 (70.0%) | 15 (60.0%) |
| 5 Years | 0 (0.0%) | 0 (0.0%) |
| 6 to 11 Years | 112 (83.0%) | 0 (0.0%) |
| 12 to 14 Years | 0 (0.0%) | 7 (100.0%) |
| 15 Years | 0 (0.0%) | 0 (0.0%) |
| 16 and 17 Years | 0 (0.0%) | 0 (0.0%) |
| 18 to 24 Years | 43 (81.1%) | 0 (0.0%) |
| 25 to 34 Years | 69 (74.2%) | 0 (0.0%) |
| 35 to 44 Years | 18 (27.7%) | 7 (53.8%) |
| 45 to 54 Years | 0 (0.0%) | 0 (0.0%) |
| 55 to 64 Years | 0 (0.0%) | 0 (0.0%) |
| 65 to 74 Years | 0 (0.0%) | 0 (0.0%) |
| 75 Years and over | 0 (0.0%) | 10 (33.3%) |
| Total | 263 (51.8%) | 39 (10.9%) |
Income Above Poverty by Sex and Age in Stony Creek Mills
According to the poverty statistics in Stony Creek Mills, males aged 12 to 14 years and females aged 6 to 11 years are the age groups that are most secure financially, with 100.0% of males and 100.0% of females in these age groups living above the poverty line.
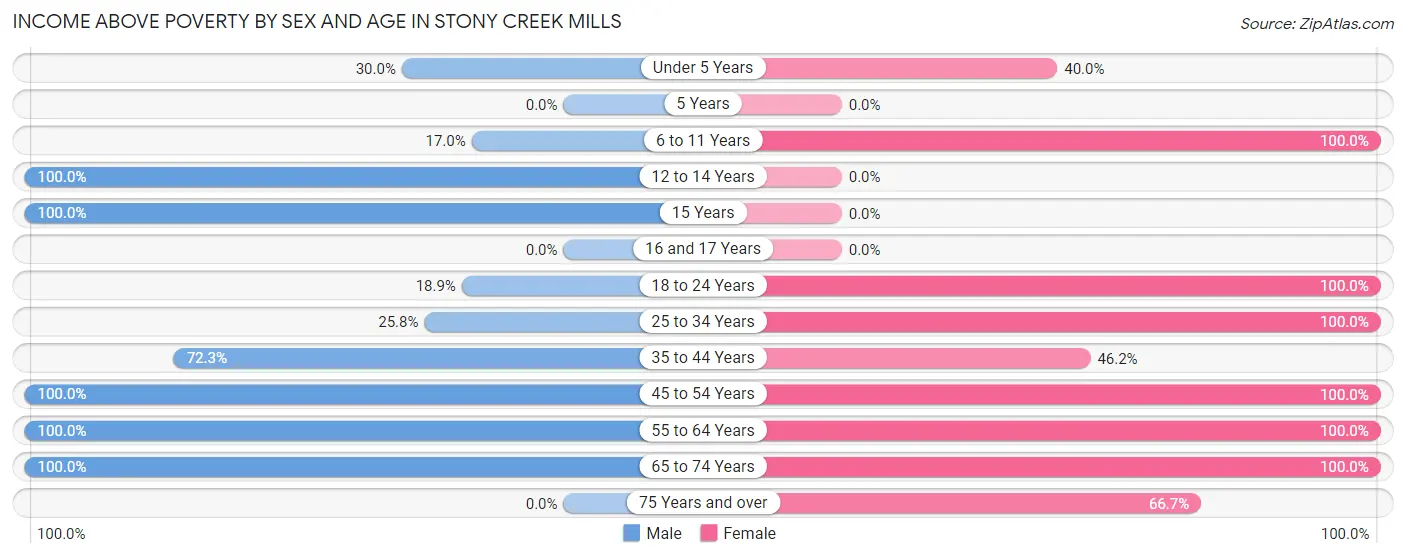
| Age Bracket | Male | Female |
| Under 5 Years | 9 (30.0%) | 10 (40.0%) |
| 5 Years | 0 (0.0%) | 0 (0.0%) |
| 6 to 11 Years | 23 (17.0%) | 59 (100.0%) |
| 12 to 14 Years | 7 (100.0%) | 0 (0.0%) |
| 15 Years | 9 (100.0%) | 0 (0.0%) |
| 16 and 17 Years | 0 (0.0%) | 0 (0.0%) |
| 18 to 24 Years | 10 (18.9%) | 18 (100.0%) |
| 25 to 34 Years | 24 (25.8%) | 58 (100.0%) |
| 35 to 44 Years | 47 (72.3%) | 6 (46.2%) |
| 45 to 54 Years | 25 (100.0%) | 56 (100.0%) |
| 55 to 64 Years | 74 (100.0%) | 35 (100.0%) |
| 65 to 74 Years | 17 (100.0%) | 56 (100.0%) |
| 75 Years and over | 0 (0.0%) | 20 (66.7%) |
| Total | 245 (48.2%) | 318 (89.1%) |
Income Below Poverty Among Married-Couple Families in Stony Creek Mills
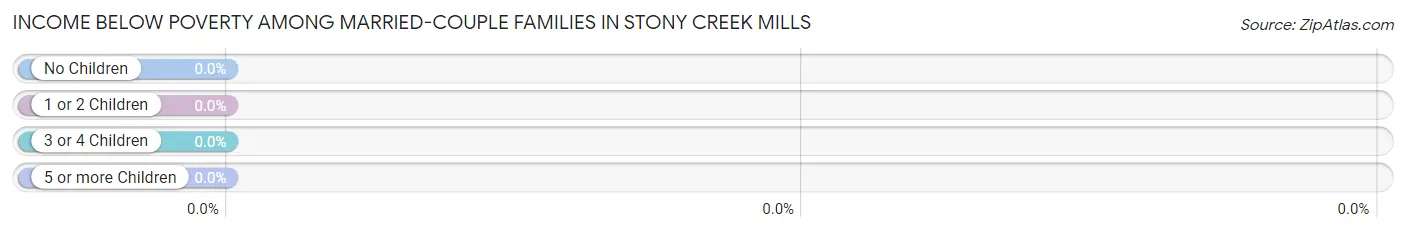
| Children | Above Poverty | Below Poverty |
| No Children | 100 (100.0%) | 0 (0.0%) |
| 1 or 2 Children | 33 (100.0%) | 0 (0.0%) |
| 3 or 4 Children | 0 (0.0%) | 0 (0.0%) |
| 5 or more Children | 0 (0.0%) | 0 (0.0%) |
| Total | 133 (100.0%) | 0 (0.0%) |
Income Below Poverty Among Single-Parent Households in Stony Creek Mills
According to the poverty data in Stony Creek Mills, 100.0% or 87 single-father households and 16.7% or 7 single-mother households are living below the poverty line. Among single-father households, those with 1 or 2 children have the highest poverty rate, with 69 households (100.0%) experiencing poverty. Likewise, among single-mother households, those with 1 or 2 children have the highest poverty rate, with 7 households (53.8%) falling below the poverty line.
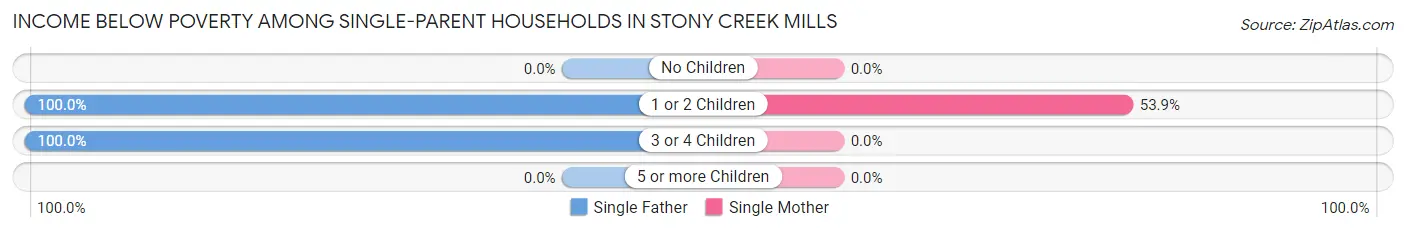
| Children | Single Father | Single Mother |
| No Children | 0 (0.0%) | 0 (0.0%) |
| 1 or 2 Children | 69 (100.0%) | 7 (53.8%) |
| 3 or 4 Children | 18 (100.0%) | 0 (0.0%) |
| 5 or more Children | 0 (0.0%) | 0 (0.0%) |
| Total | 87 (100.0%) | 7 (16.7%) |
Income Below Poverty Among Married-Couple vs Single-Parent Households in Stony Creek Mills
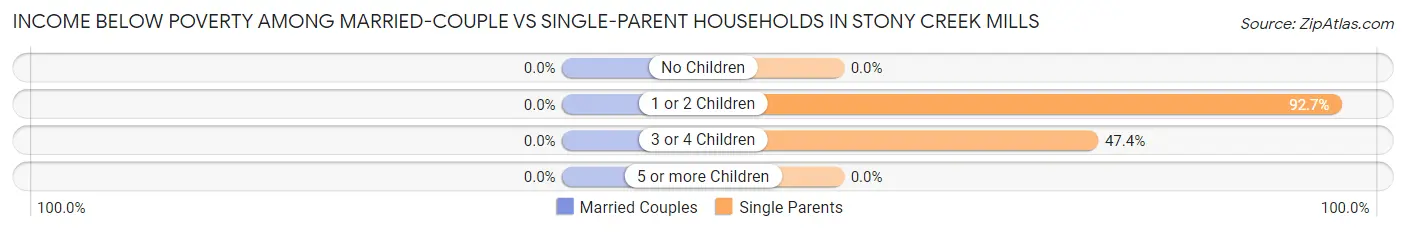
| Children | Married-Couple Families | Single-Parent Households |
| No Children | 0 (0.0%) | 0 (0.0%) |
| 1 or 2 Children | 0 (0.0%) | 76 (92.7%) |
| 3 or 4 Children | 0 (0.0%) | 18 (47.4%) |
| 5 or more Children | 0 (0.0%) | 0 (0.0%) |
| Total | 0 (0.0%) | 94 (72.9%) |
Race in Stony Creek Mills
The most populous races in Stony Creek Mills are White / Caucasian (508 | 58.7%), Hispanic or Latino (327 | 37.8%), and Two or more Races (258 | 29.8%).
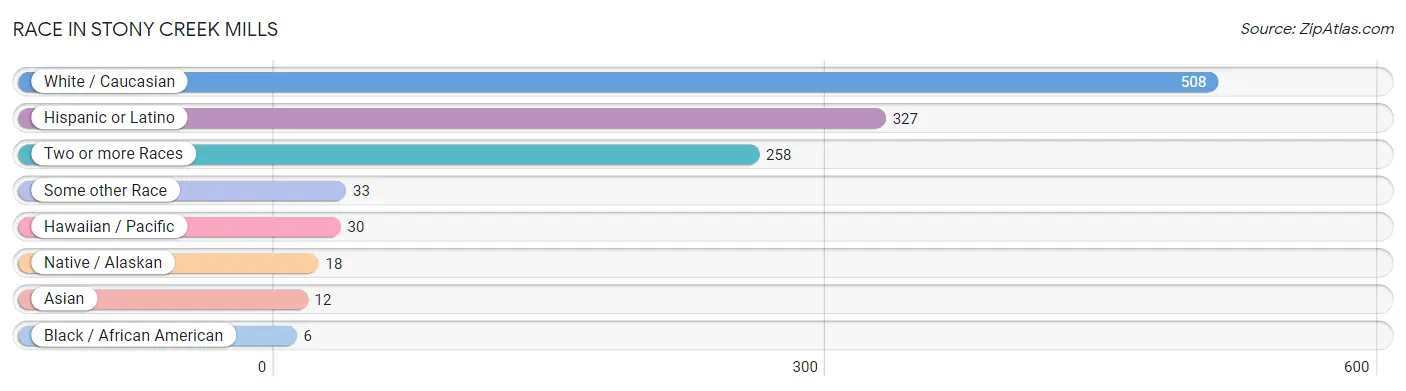
| Race | # Population | % Population |
| Asian | 12 | 1.4% |
| Black / African American | 6 | 0.7% |
| Hawaiian / Pacific | 30 | 3.5% |
| Hispanic or Latino | 327 | 37.8% |
| Native / Alaskan | 18 | 2.1% |
| White / Caucasian | 508 | 58.7% |
| Two or more Races | 258 | 29.8% |
| Some other Race | 33 | 3.8% |
| Total | 865 | 100.0% |
Ancestry in Stony Creek Mills
The most populous ancestries reported in Stony Creek Mills are Dominican (181 | 20.9%), German (136 | 15.7%), Polish (132 | 15.3%), Irish (97 | 11.2%), and English (64 | 7.4%), together accounting for 70.5% of all Stony Creek Mills residents.
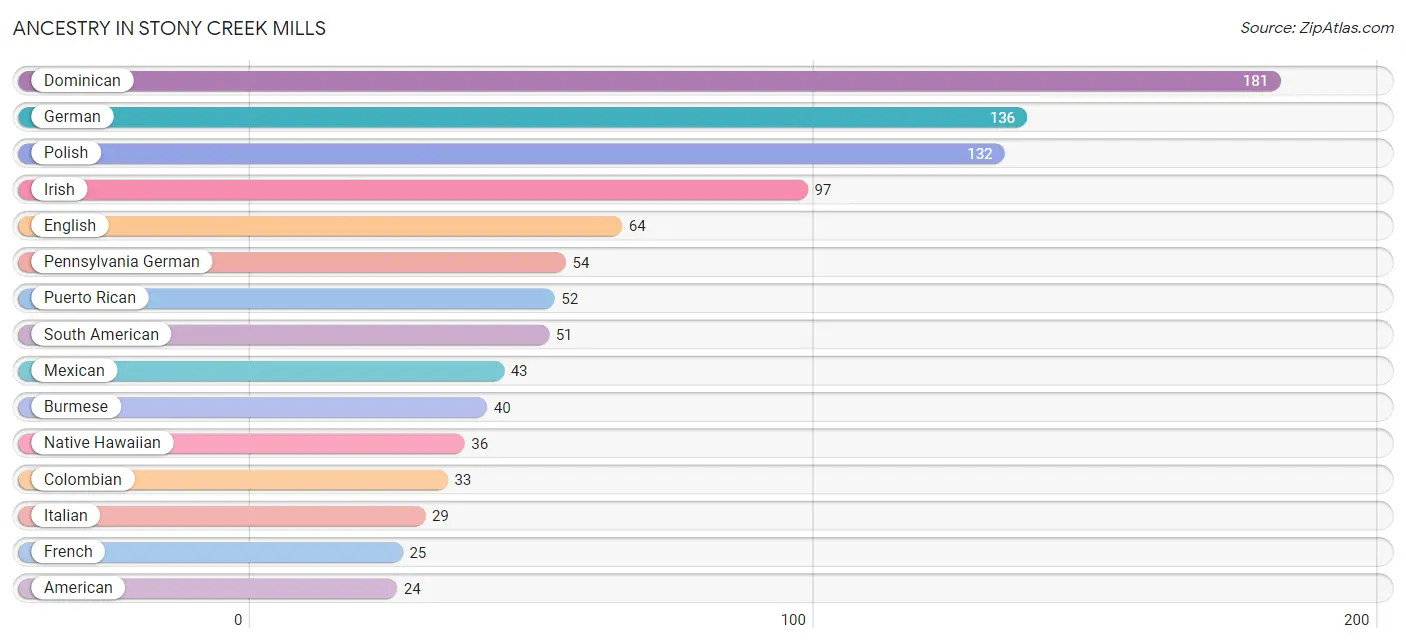
| Ancestry | # Population | % Population |
| American | 24 | 2.8% |
| Burmese | 40 | 4.6% |
| Colombian | 33 | 3.8% |
| Dominican | 181 | 20.9% |
| English | 64 | 7.4% |
| French | 25 | 2.9% |
| German | 136 | 15.7% |
| Greek | 10 | 1.2% |
| Hungarian | 18 | 2.1% |
| Irish | 97 | 11.2% |
| Italian | 29 | 3.4% |
| Mexican | 43 | 5.0% |
| Native Hawaiian | 36 | 4.2% |
| Pennsylvania German | 54 | 6.2% |
| Peruvian | 18 | 2.1% |
| Polish | 132 | 15.3% |
| Puerto Rican | 52 | 6.0% |
| Russian | 15 | 1.7% |
| South American | 51 | 5.9% | View All 19 Rows |
Immigrants in Stony Creek Mills
The most numerous immigrant groups reported in Stony Creek Mills came from Latin America (120 | 13.9%), Caribbean (69 | 8.0%), Dominican Republic (69 | 8.0%), South America (51 | 5.9%), and Colombia (33 | 3.8%), together accounting for 39.5% of all Stony Creek Mills residents.
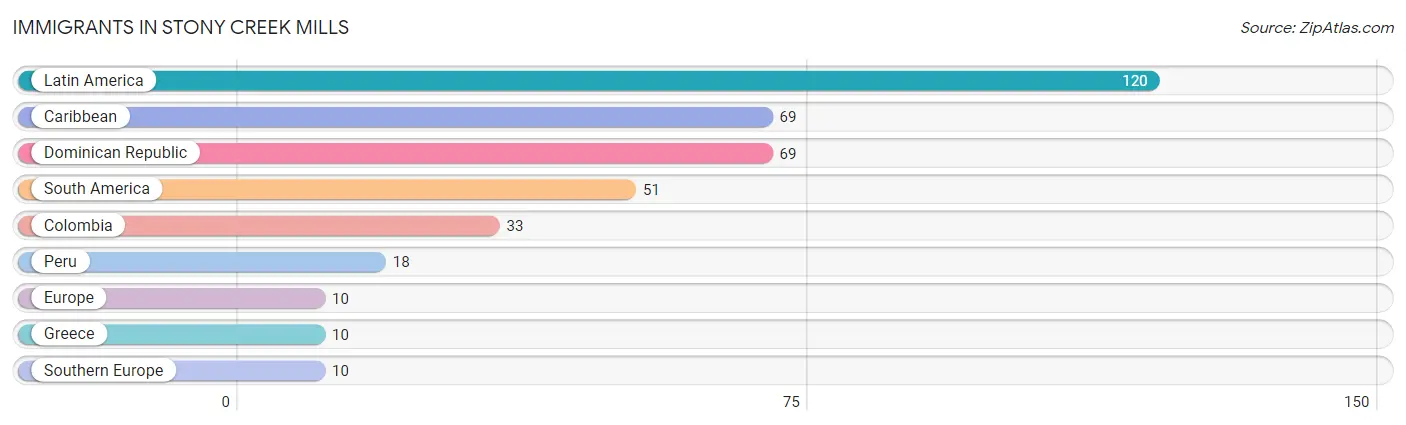
| Immigration Origin | # Population | % Population |
| Caribbean | 69 | 8.0% |
| Colombia | 33 | 3.8% |
| Dominican Republic | 69 | 8.0% |
| Europe | 10 | 1.2% |
| Greece | 10 | 1.2% |
| Latin America | 120 | 13.9% |
| Peru | 18 | 2.1% |
| South America | 51 | 5.9% |
| Southern Europe | 10 | 1.2% | View All 9 Rows |
Sex and Age in Stony Creek Mills
Sex and Age in Stony Creek Mills
The most populous age groups in Stony Creek Mills are 5 to 9 Years (112 | 22.1%) for men and 5 to 9 Years (47 | 13.2%) for women.
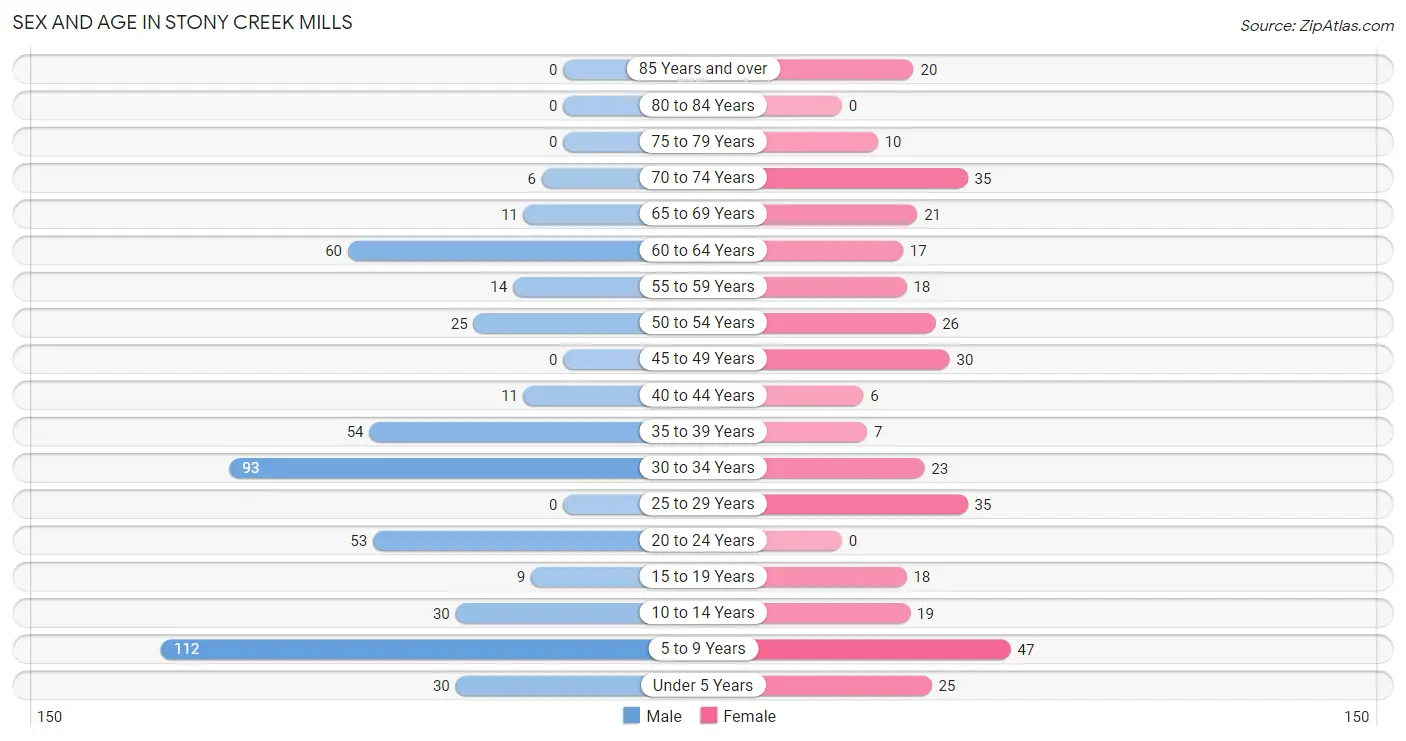
| Age Bracket | Male | Female |
| Under 5 Years | 30 (5.9%) | 25 (7.0%) |
| 5 to 9 Years | 112 (22.1%) | 47 (13.2%) |
| 10 to 14 Years | 30 (5.9%) | 19 (5.3%) |
| 15 to 19 Years | 9 (1.8%) | 18 (5.0%) |
| 20 to 24 Years | 53 (10.4%) | 0 (0.0%) |
| 25 to 29 Years | 0 (0.0%) | 35 (9.8%) |
| 30 to 34 Years | 93 (18.3%) | 23 (6.4%) |
| 35 to 39 Years | 54 (10.6%) | 7 (2.0%) |
| 40 to 44 Years | 11 (2.2%) | 6 (1.7%) |
| 45 to 49 Years | 0 (0.0%) | 30 (8.4%) |
| 50 to 54 Years | 25 (4.9%) | 26 (7.3%) |
| 55 to 59 Years | 14 (2.8%) | 18 (5.0%) |
| 60 to 64 Years | 60 (11.8%) | 17 (4.8%) |
| 65 to 69 Years | 11 (2.2%) | 21 (5.9%) |
| 70 to 74 Years | 6 (1.2%) | 35 (9.8%) |
| 75 to 79 Years | 0 (0.0%) | 10 (2.8%) |
| 80 to 84 Years | 0 (0.0%) | 0 (0.0%) |
| 85 Years and over | 0 (0.0%) | 20 (5.6%) |
| Total | 508 (100.0%) | 357 (100.0%) |
Families and Households in Stony Creek Mills
Median Family Size in Stony Creek Mills
The median family size in Stony Creek Mills is 2.95 persons per family, with single female/mother families (42 | 16.0%) accounting for the largest median family size of 4.38 persons per family. On the other hand, married-couple families (133 | 50.8%) represent the smallest median family size with 2.66 persons per family.
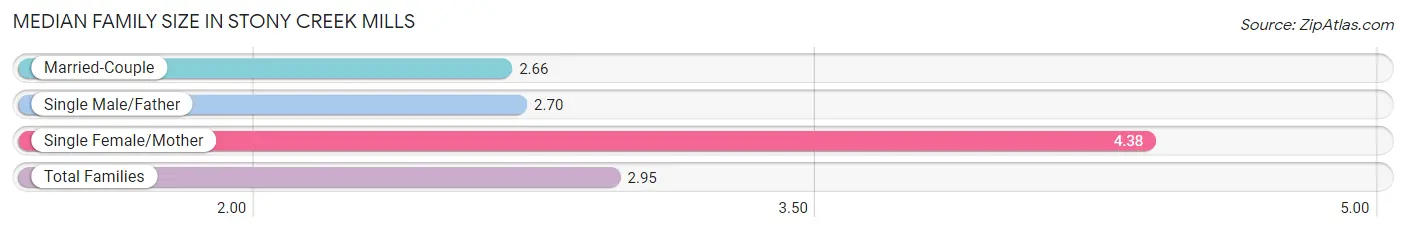
| Family Type | # Families | Family Size |
| Married-Couple | 133 (50.8%) | 2.66 |
| Single Male/Father | 87 (33.2%) | 2.70 |
| Single Female/Mother | 42 (16.0%) | 4.38 |
| Total Families | 262 (100.0%) | 2.95 |
Median Household Size in Stony Creek Mills
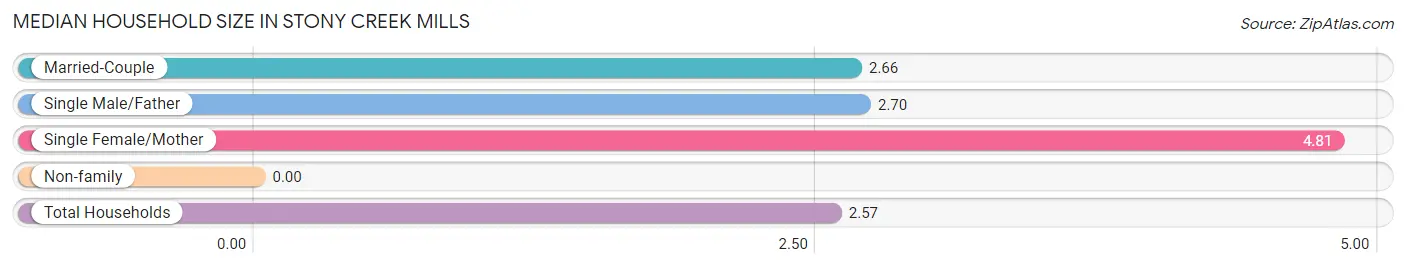
| Household Type | # Households | Household Size |
| Married-Couple | 133 (39.6%) | 2.66 |
| Single Male/Father | 87 (25.9%) | 2.70 |
| Single Female/Mother | 42 (12.5%) | 4.81 |
| Non-family | 74 (22.0%) | - |
| Total Households | 336 (100.0%) | 2.57 |
Household Size by Marriage Status in Stony Creek Mills
Out of a total of 336 households in Stony Creek Mills, 262 (78.0%) are family households, while 74 (22.0%) are nonfamily households. The most numerous type of family households are 3-person households, comprising 123, and the most common type of nonfamily households are 1-person households, comprising 74.
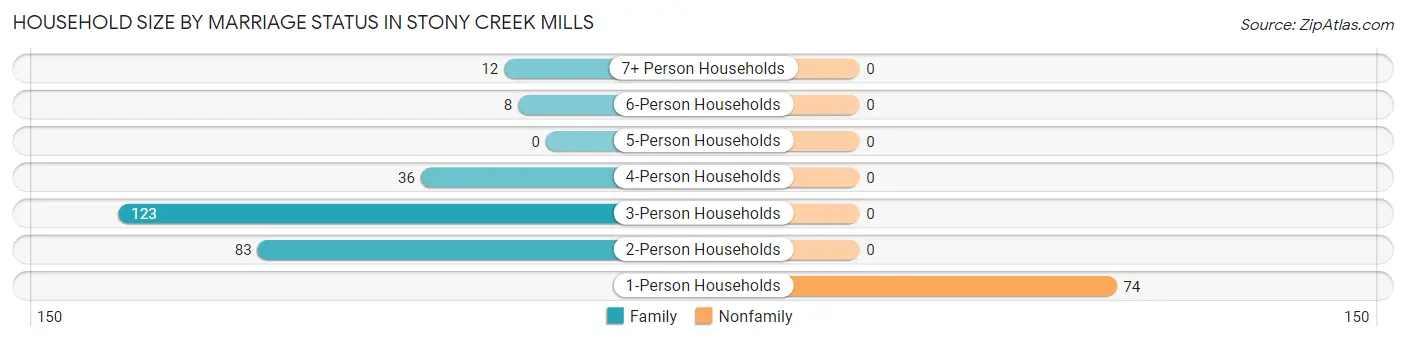
| Household Size | Family Households | Nonfamily Households |
| 1-Person Households | - | 74 (22.0%) |
| 2-Person Households | 83 (24.7%) | 0 (0.0%) |
| 3-Person Households | 123 (36.6%) | 0 (0.0%) |
| 4-Person Households | 36 (10.7%) | 0 (0.0%) |
| 5-Person Households | 0 (0.0%) | 0 (0.0%) |
| 6-Person Households | 8 (2.4%) | 0 (0.0%) |
| 7+ Person Households | 12 (3.6%) | 0 (0.0%) |
| Total | 262 (78.0%) | 74 (22.0%) |
Female Fertility in Stony Creek Mills
Fertility by Age in Stony Creek Mills
| Age Bracket | Women with Births | Births / 1,000 Women |
| 15 to 19 years | 0 (0.0%) | 0.0 |
| 20 to 34 years | 0 (0.0%) | 0.0 |
| 35 to 50 years | 0 (0.0%) | 0.0 |
| Total | 0 (0.0%) | 0.0 |
Fertility by Age by Marriage Status in Stony Creek Mills
| Age Bracket | Married | Unmarried |
| 15 to 19 years | 0 (0.0%) | 0 (0.0%) |
| 20 to 34 years | 0 (0.0%) | 0 (0.0%) |
| 35 to 50 years | 0 (0.0%) | 0 (0.0%) |
| Total | 0 (0.0%) | 0 (0.0%) |
Fertility by Education in Stony Creek Mills
| Educational Attainment | Women with Births | Births / 1,000 Women |
| Less than High School | 0 (0.0%) | 0.0 |
| High School Diploma | 0 (0.0%) | 0.0 |
| College or Associate's Degree | 0 (0.0%) | 0.0 |
| Bachelor's Degree | 0 (0.0%) | 0.0 |
| Graduate Degree | 0 (0.0%) | 0.0 |
| Total | 0 (0.0%) | 0.0 |
Fertility by Education by Marriage Status in Stony Creek Mills
| Educational Attainment | Married | Unmarried |
| Less than High School | 0 (0.0%) | 0 (0.0%) |
| High School Diploma | 0 (0.0%) | 0 (0.0%) |
| College or Associate's Degree | 0 (0.0%) | 0 (0.0%) |
| Bachelor's Degree | 0 (0.0%) | 0 (0.0%) |
| Graduate Degree | 0 (0.0%) | 0 (0.0%) |
| Total | 0 (0.0%) | 0 (0.0%) |
Employment Characteristics in Stony Creek Mills
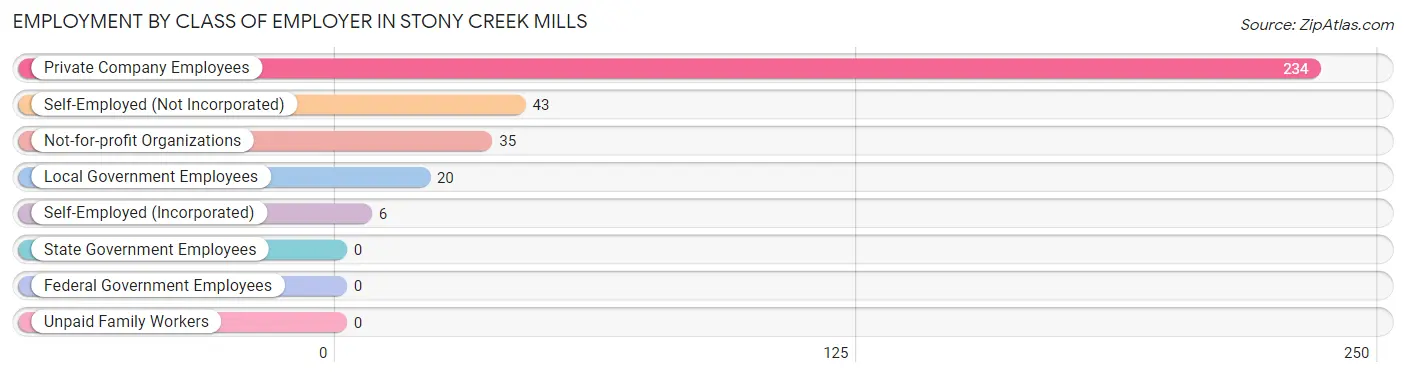
Employment by Class of Employer in Stony Creek Mills
Among the 338 employed individuals in Stony Creek Mills, private company employees (234 | 69.2%), self-employed (not incorporated) (43 | 12.7%), and not-for-profit organizations (35 | 10.4%) make up the most common classes of employment.
| Employer Class | # Employees | % Employees |
| Private Company Employees | 234 | 69.2% |
| Self-Employed (Incorporated) | 6 | 1.8% |
| Self-Employed (Not Incorporated) | 43 | 12.7% |
| Not-for-profit Organizations | 35 | 10.4% |
| Local Government Employees | 20 | 5.9% |
| State Government Employees | 0 | 0.0% |
| Federal Government Employees | 0 | 0.0% |
| Unpaid Family Workers | 0 | 0.0% |
| Total | 338 | 100.0% |
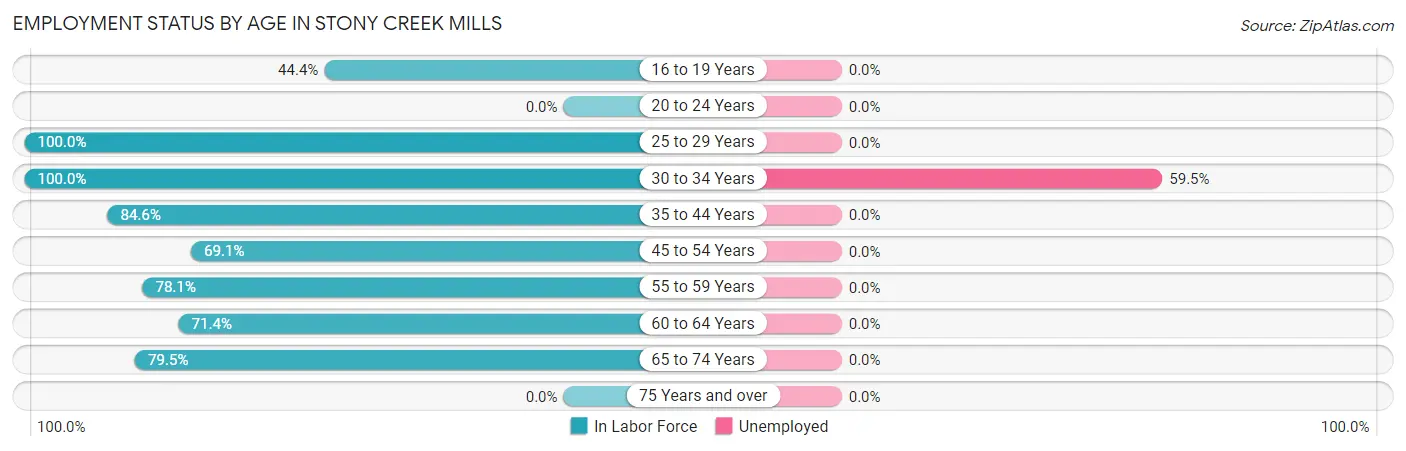
Employment Status by Age in Stony Creek Mills
According to the labor force statistics for Stony Creek Mills, out of the total population over 16 years of age (593), 70.7% or 419 individuals are in the labor force, with 16.5% or 69 of them unemployed. The age group with the highest labor force participation rate is 25 to 29 years, with 100.0% or 35 individuals in the labor force. Within the labor force, the 30 to 34 years age range has the highest percentage of unemployed individuals, with 59.5% or 69 of them being unemployed.
| Age Bracket | In Labor Force | Unemployed |
| 16 to 19 Years | 8 (44.4%) | 0 (0.0%) |
| 20 to 24 Years | 0 (0.0%) | 0 (0.0%) |
| 25 to 29 Years | 35 (100.0%) | 0 (0.0%) |
| 30 to 34 Years | 116 (100.0%) | 69 (59.5%) |
| 35 to 44 Years | 66 (84.6%) | 0 (0.0%) |
| 45 to 54 Years | 56 (69.1%) | 0 (0.0%) |
| 55 to 59 Years | 25 (78.1%) | 0 (0.0%) |
| 60 to 64 Years | 55 (71.4%) | 0 (0.0%) |
| 65 to 74 Years | 58 (79.5%) | 0 (0.0%) |
| 75 Years and over | 0 (0.0%) | 0 (0.0%) |
| Total | 419 (70.7%) | 69 (16.5%) |
Employment Status by Educational Attainment in Stony Creek Mills
According to labor force statistics for Stony Creek Mills, 84.2% of individuals (353) out of the total population between 25 and 64 years of age (419) are in the labor force, with 19.5% or 69 of them being unemployed. The group with the highest labor force participation rate are those with the educational attainment of bachelor's degree or higher, with 100.0% or 71 individuals in the labor force. Within the labor force, individuals with high school diploma education have the highest percentage of unemployment, with 34.8% or 69 of them being unemployed.
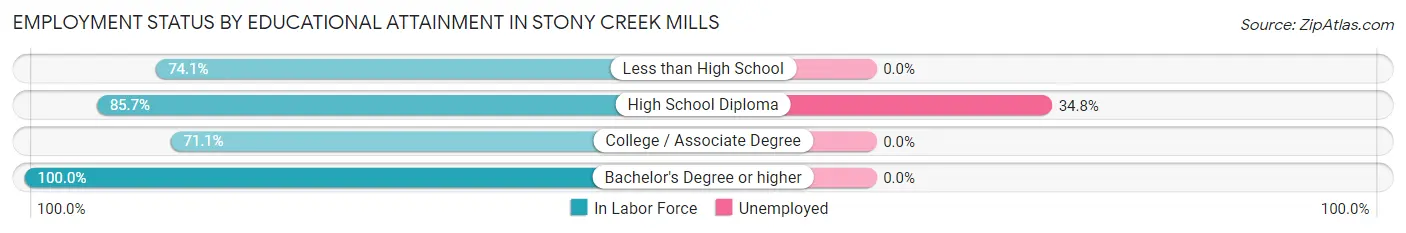
| Educational Attainment | In Labor Force | Unemployed |
| Less than High School | 20 (74.1%) | 0 (0.0%) |
| High School Diploma | 198 (85.7%) | 80 (34.8%) |
| College / Associate Degree | 64 (71.1%) | 0 (0.0%) |
| Bachelor's Degree or higher | 71 (100.0%) | 0 (0.0%) |
| Total | 353 (84.2%) | 82 (19.5%) |
Employment Occupations by Sex in Stony Creek Mills
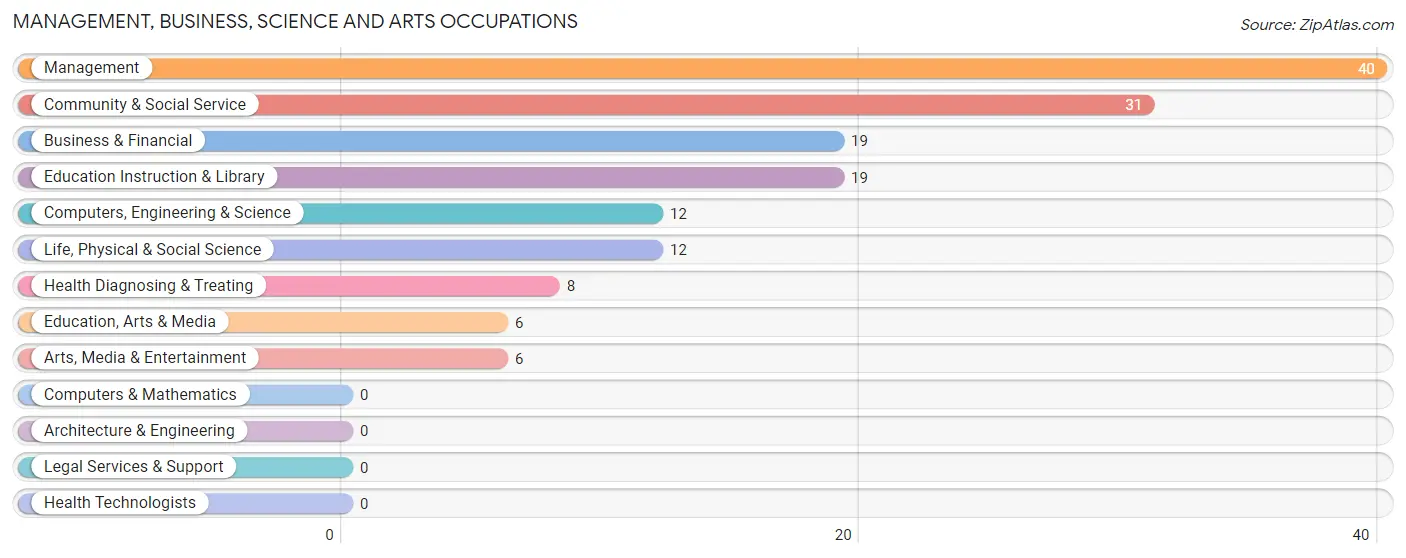
Management, Business, Science and Arts Occupations
The most common Management, Business, Science and Arts occupations in Stony Creek Mills are Management (40 | 11.4%), Community & Social Service (31 | 8.9%), Business & Financial (19 | 5.4%), Education Instruction & Library (19 | 5.4%), and Computers, Engineering & Science (12 | 3.4%).
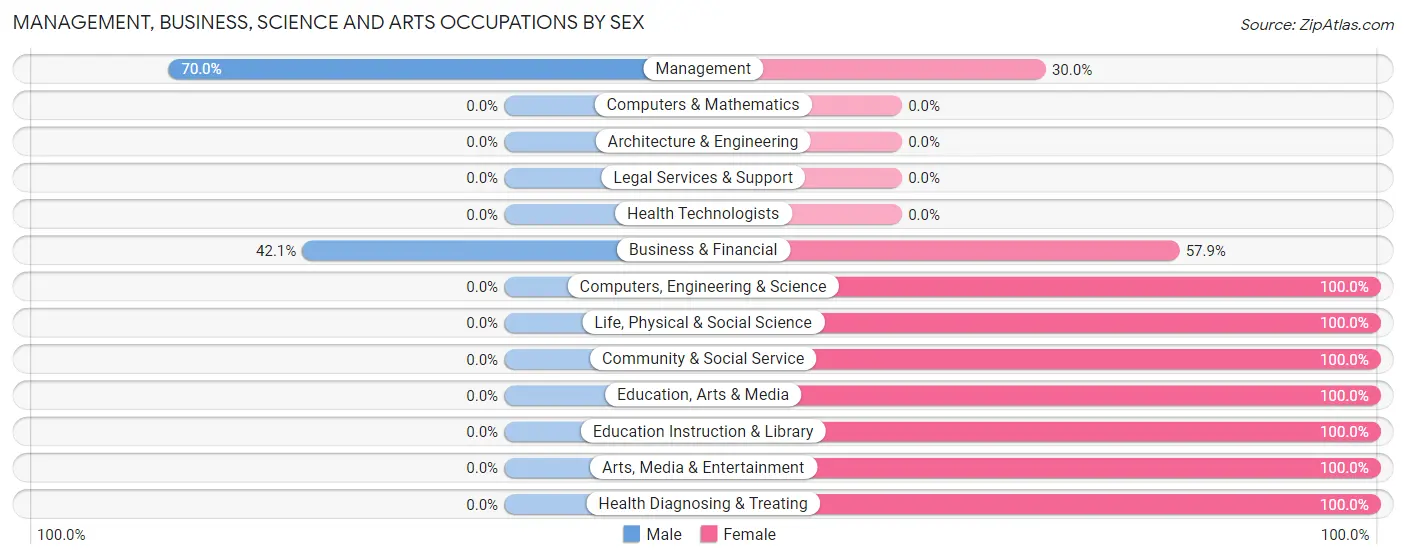
Management, Business, Science and Arts Occupations by Sex
Within the Management, Business, Science and Arts occupations in Stony Creek Mills, the most male-oriented occupations are Management (70.0%), and Business & Financial (42.1%), while the most female-oriented occupations are Computers, Engineering & Science (100.0%), Life, Physical & Social Science (100.0%), and Community & Social Service (100.0%).
| Occupation | Male | Female |
| Management | 28 (70.0%) | 12 (30.0%) |
| Business & Financial | 8 (42.1%) | 11 (57.9%) |
| Computers, Engineering & Science | 0 (0.0%) | 12 (100.0%) |
| Computers & Mathematics | 0 (0.0%) | 0 (0.0%) |
| Architecture & Engineering | 0 (0.0%) | 0 (0.0%) |
| Life, Physical & Social Science | 0 (0.0%) | 12 (100.0%) |
| Community & Social Service | 0 (0.0%) | 31 (100.0%) |
| Education, Arts & Media | 0 (0.0%) | 6 (100.0%) |
| Legal Services & Support | 0 (0.0%) | 0 (0.0%) |
| Education Instruction & Library | 0 (0.0%) | 19 (100.0%) |
| Arts, Media & Entertainment | 0 (0.0%) | 6 (100.0%) |
| Health Diagnosing & Treating | 0 (0.0%) | 8 (100.0%) |
| Health Technologists | 0 (0.0%) | 0 (0.0%) |
| Total (Category) | 36 (32.7%) | 74 (67.3%) |
| Total (Overall) | 170 (48.6%) | 180 (51.4%) |
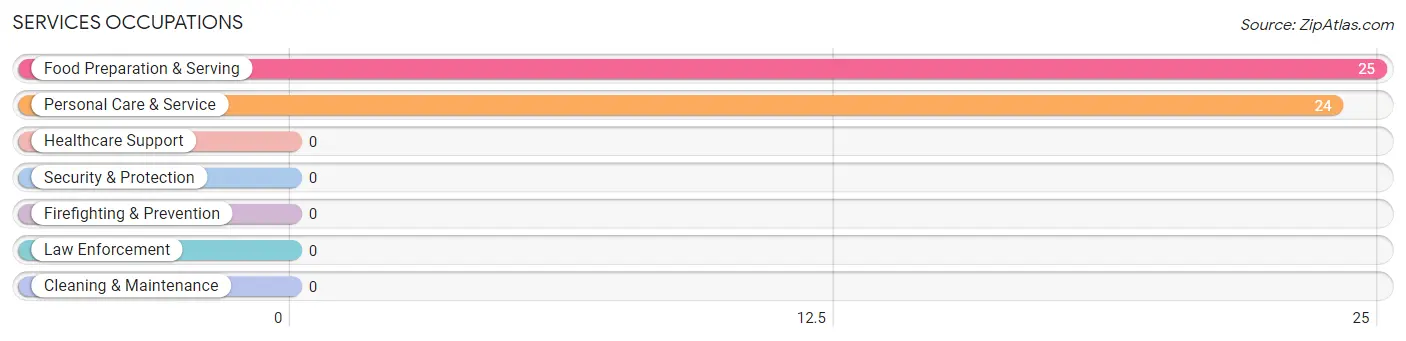
Services Occupations
The most common Services occupations in Stony Creek Mills are Food Preparation & Serving (25 | 7.1%), and Personal Care & Service (24 | 6.9%).
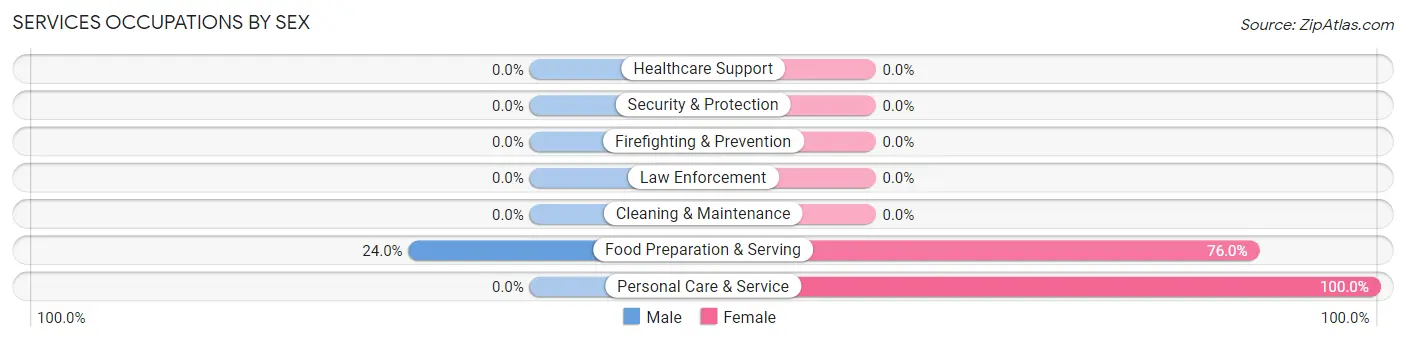
Services Occupations by Sex
| Occupation | Male | Female |
| Healthcare Support | 0 (0.0%) | 0 (0.0%) |
| Security & Protection | 0 (0.0%) | 0 (0.0%) |
| Firefighting & Prevention | 0 (0.0%) | 0 (0.0%) |
| Law Enforcement | 0 (0.0%) | 0 (0.0%) |
| Food Preparation & Serving | 6 (24.0%) | 19 (76.0%) |
| Cleaning & Maintenance | 0 (0.0%) | 0 (0.0%) |
| Personal Care & Service | 0 (0.0%) | 24 (100.0%) |
| Total (Category) | 6 (12.2%) | 43 (87.8%) |
| Total (Overall) | 170 (48.6%) | 180 (51.4%) |
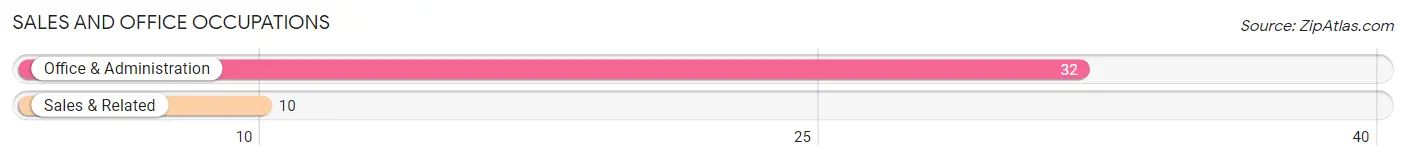
Sales and Office Occupations
The most common Sales and Office occupations in Stony Creek Mills are Office & Administration (32 | 9.1%), and Sales & Related (10 | 2.9%).
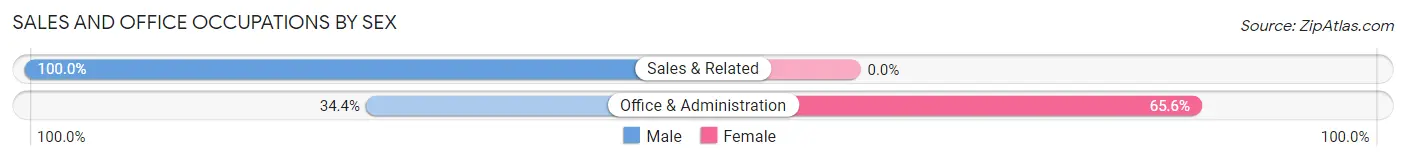
Sales and Office Occupations by Sex
| Occupation | Male | Female |
| Sales & Related | 10 (100.0%) | 0 (0.0%) |
| Office & Administration | 11 (34.4%) | 21 (65.6%) |
| Total (Category) | 21 (50.0%) | 21 (50.0%) |
| Total (Overall) | 170 (48.6%) | 180 (51.4%) |
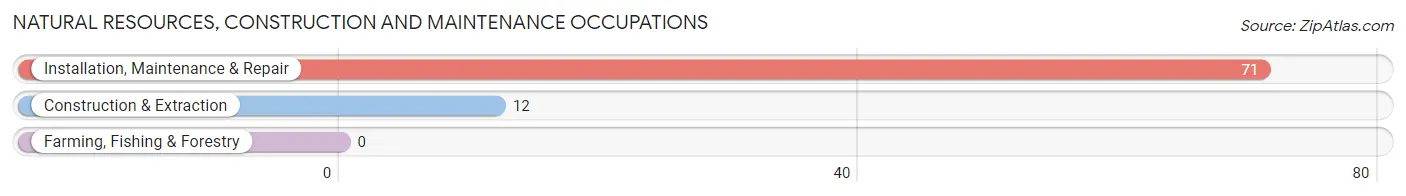
Natural Resources, Construction and Maintenance Occupations
The most common Natural Resources, Construction and Maintenance occupations in Stony Creek Mills are Installation, Maintenance & Repair (71 | 20.3%), and Construction & Extraction (12 | 3.4%).
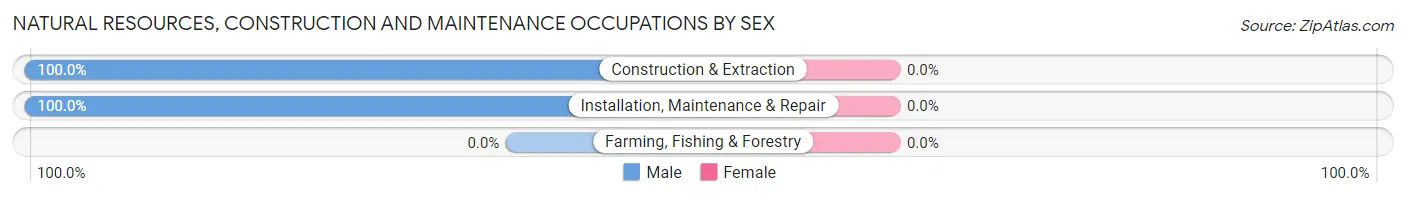
Natural Resources, Construction and Maintenance Occupations by Sex
| Occupation | Male | Female |
| Farming, Fishing & Forestry | 0 (0.0%) | 0 (0.0%) |
| Construction & Extraction | 12 (100.0%) | 0 (0.0%) |
| Installation, Maintenance & Repair | 71 (100.0%) | 0 (0.0%) |
| Total (Category) | 83 (100.0%) | 0 (0.0%) |
| Total (Overall) | 170 (48.6%) | 180 (51.4%) |
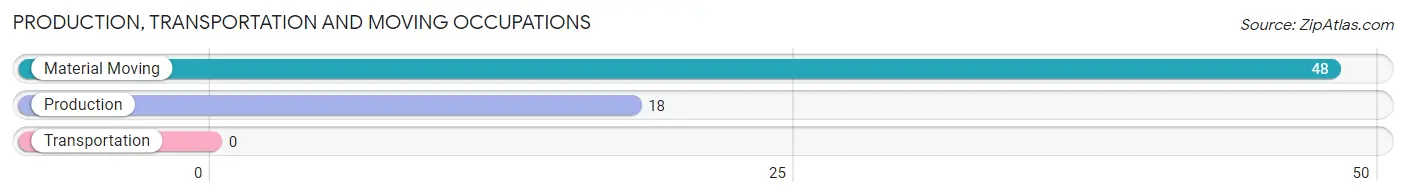
Production, Transportation and Moving Occupations
The most common Production, Transportation and Moving occupations in Stony Creek Mills are Material Moving (48 | 13.7%), and Production (18 | 5.1%).
Production, Transportation and Moving Occupations by Sex
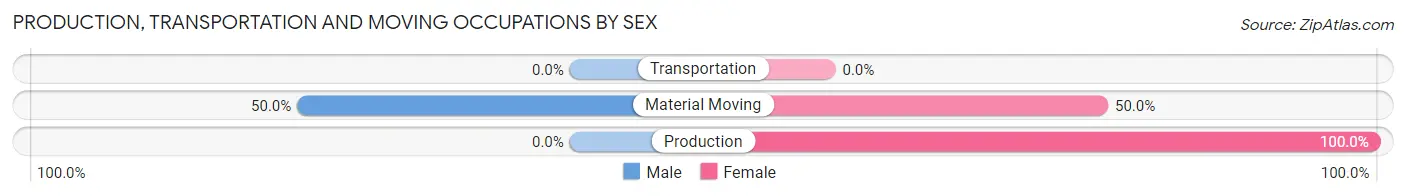
| Occupation | Male | Female |
| Production | 0 (0.0%) | 18 (100.0%) |
| Transportation | 0 (0.0%) | 0 (0.0%) |
| Material Moving | 24 (50.0%) | 24 (50.0%) |
| Total (Category) | 24 (36.4%) | 42 (63.6%) |
| Total (Overall) | 170 (48.6%) | 180 (51.4%) |
Employment Industries by Sex in Stony Creek Mills
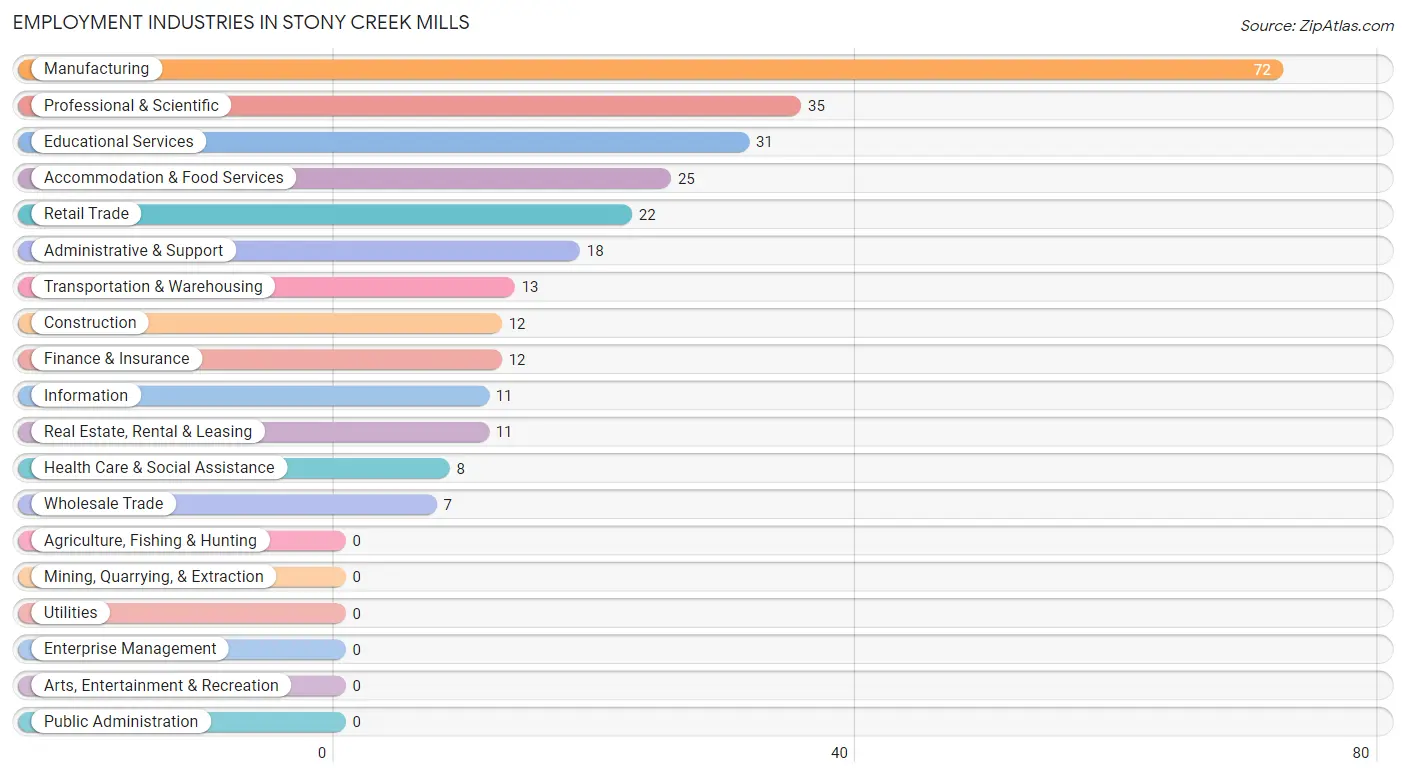
Employment Industries in Stony Creek Mills
The major employment industries in Stony Creek Mills include Manufacturing (72 | 20.6%), Professional & Scientific (35 | 10.0%), Educational Services (31 | 8.9%), Accommodation & Food Services (25 | 7.1%), and Retail Trade (22 | 6.3%).
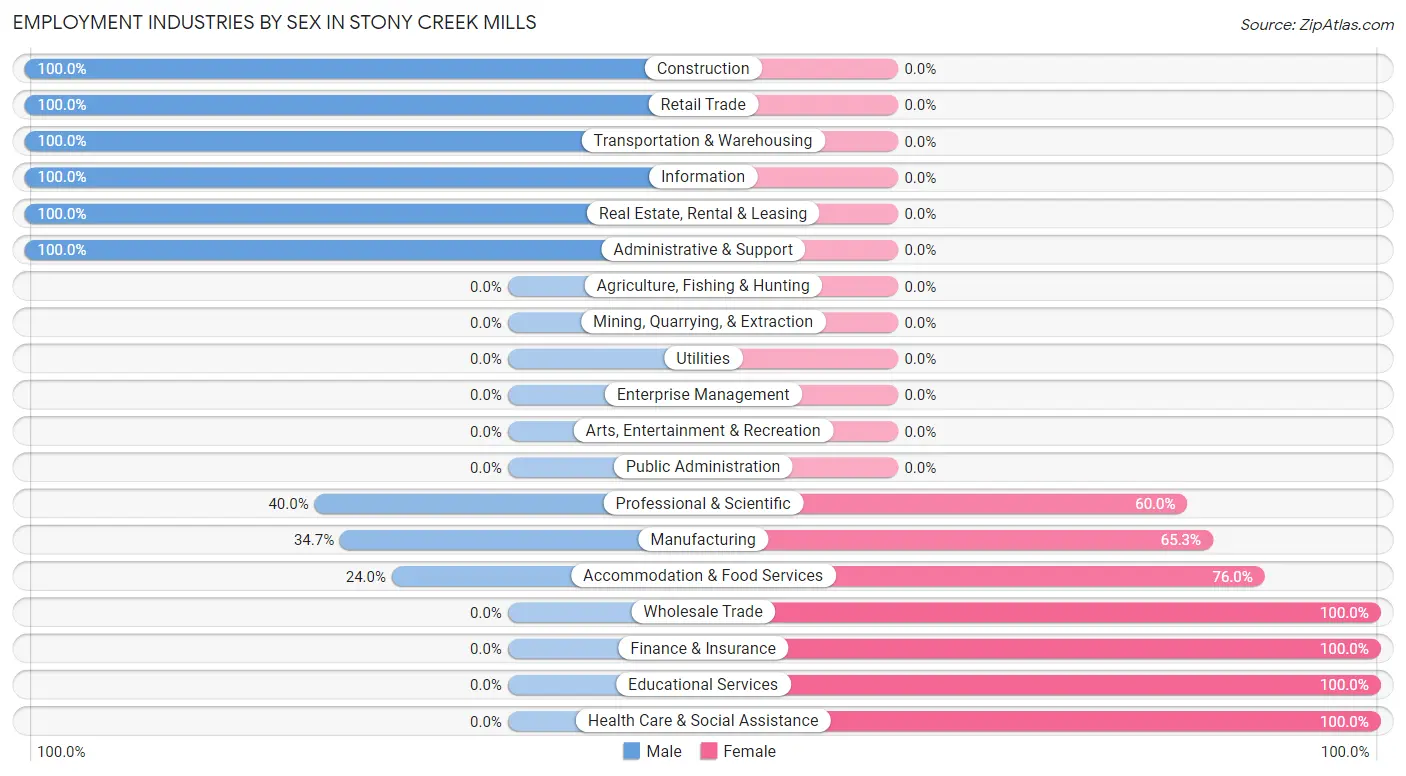
Employment Industries by Sex in Stony Creek Mills
The Stony Creek Mills industries that see more men than women are Construction (100.0%), Retail Trade (100.0%), and Transportation & Warehousing (100.0%), whereas the industries that tend to have a higher number of women are Wholesale Trade (100.0%), Finance & Insurance (100.0%), and Educational Services (100.0%).
| Industry | Male | Female |
| Agriculture, Fishing & Hunting | 0 (0.0%) | 0 (0.0%) |
| Mining, Quarrying, & Extraction | 0 (0.0%) | 0 (0.0%) |
| Construction | 12 (100.0%) | 0 (0.0%) |
| Manufacturing | 25 (34.7%) | 47 (65.3%) |
| Wholesale Trade | 0 (0.0%) | 7 (100.0%) |
| Retail Trade | 22 (100.0%) | 0 (0.0%) |
| Transportation & Warehousing | 13 (100.0%) | 0 (0.0%) |
| Utilities | 0 (0.0%) | 0 (0.0%) |
| Information | 11 (100.0%) | 0 (0.0%) |
| Finance & Insurance | 0 (0.0%) | 12 (100.0%) |
| Real Estate, Rental & Leasing | 11 (100.0%) | 0 (0.0%) |
| Professional & Scientific | 14 (40.0%) | 21 (60.0%) |
| Enterprise Management | 0 (0.0%) | 0 (0.0%) |
| Administrative & Support | 18 (100.0%) | 0 (0.0%) |
| Educational Services | 0 (0.0%) | 31 (100.0%) |
| Health Care & Social Assistance | 0 (0.0%) | 8 (100.0%) |
| Arts, Entertainment & Recreation | 0 (0.0%) | 0 (0.0%) |
| Accommodation & Food Services | 6 (24.0%) | 19 (76.0%) |
| Public Administration | 0 (0.0%) | 0 (0.0%) |
| Total | 170 (48.6%) | 180 (51.4%) |
Education in Stony Creek Mills
School Enrollment in Stony Creek Mills
The most common levels of schooling among the 335 students in Stony Creek Mills are elementary school (153 | 45.7%), graduate / professional (76 | 22.7%), and middle school (49 | 14.6%).
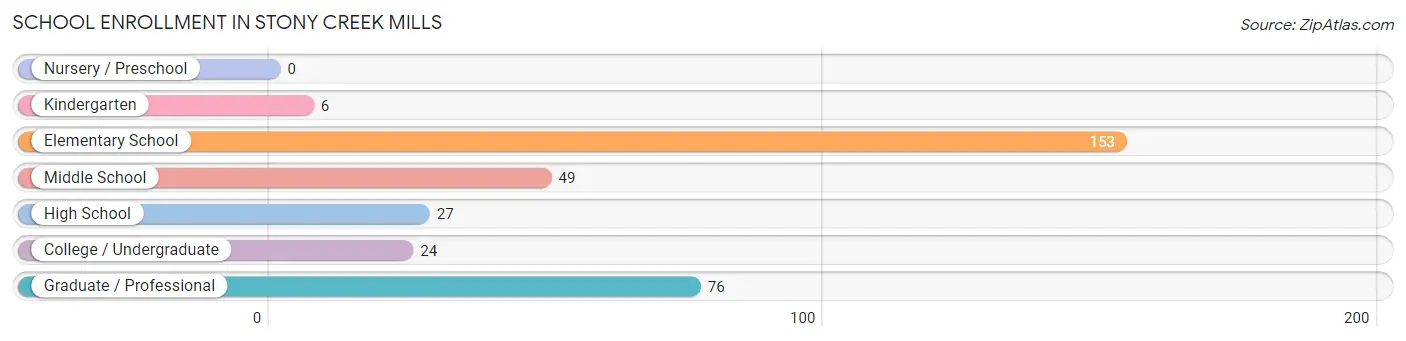
| School Level | # Students | % Students |
| Nursery / Preschool | 0 | 0.0% |
| Kindergarten | 6 | 1.8% |
| Elementary School | 153 | 45.7% |
| Middle School | 49 | 14.6% |
| High School | 27 | 8.1% |
| College / Undergraduate | 24 | 7.2% |
| Graduate / Professional | 76 | 22.7% |
| Total | 335 | 100.0% |
School Enrollment by Age by Funding Source in Stony Creek Mills
Out of a total of 335 students who are enrolled in schools in Stony Creek Mills, 65 (19.4%) attend a private institution, while the remaining 270 (80.6%) are enrolled in public schools. The age group of 25 to 34 year olds has the highest likelihood of being enrolled in private schools, with 21 (60.0% in the age bracket) enrolled. Conversely, the age group of 15 to 17 year olds has the lowest likelihood of being enrolled in a private school, with 9 (100.0% in the age bracket) attending a public institution.
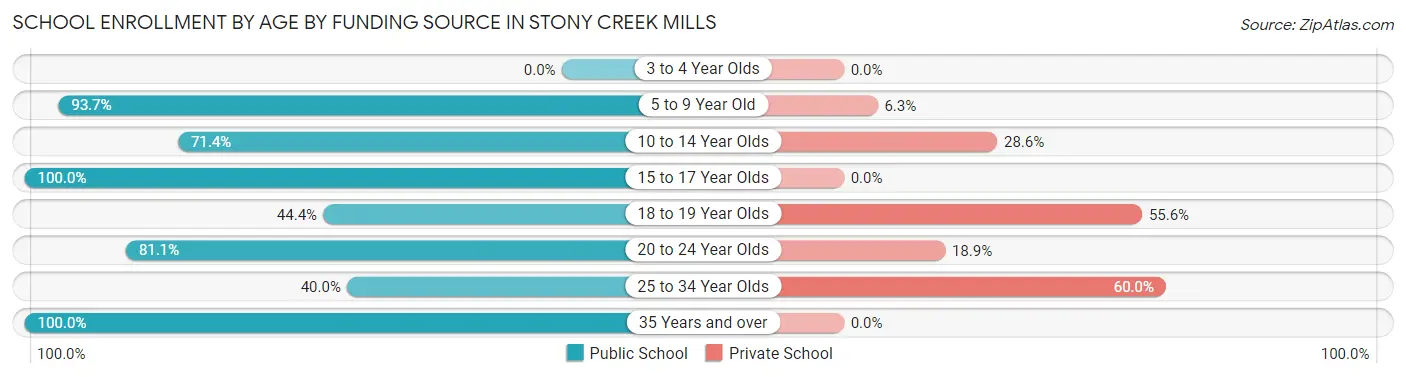
| Age Bracket | Public School | Private School |
| 3 to 4 Year Olds | 0 (0.0%) | 0 (0.0%) |
| 5 to 9 Year Old | 149 (93.7%) | 10 (6.3%) |
| 10 to 14 Year Olds | 35 (71.4%) | 14 (28.6%) |
| 15 to 17 Year Olds | 9 (100.0%) | 0 (0.0%) |
| 18 to 19 Year Olds | 8 (44.4%) | 10 (55.6%) |
| 20 to 24 Year Olds | 43 (81.1%) | 10 (18.9%) |
| 25 to 34 Year Olds | 14 (40.0%) | 21 (60.0%) |
| 35 Years and over | 12 (100.0%) | 0 (0.0%) |
| Total | 270 (80.6%) | 65 (19.4%) |
Educational Attainment by Field of Study in Stony Creek Mills
Bio, nature & agricultural (23 | 32.4%), literature & languages (12 | 16.9%), business (11 | 15.5%), computers & mathematics (8 | 11.3%), and psychology (6 | 8.5%) are the most common fields of study among 71 individuals in Stony Creek Mills who have obtained a bachelor's degree or higher.
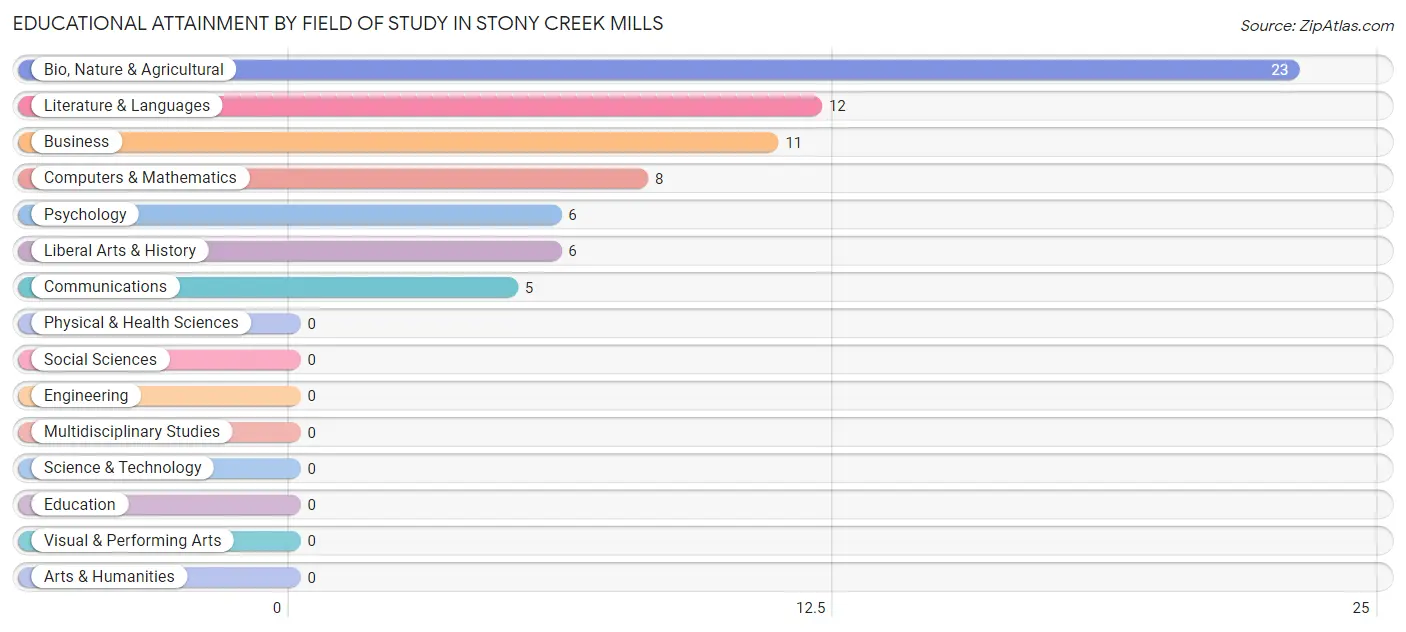
| Field of Study | # Graduates | % Graduates |
| Computers & Mathematics | 8 | 11.3% |
| Bio, Nature & Agricultural | 23 | 32.4% |
| Physical & Health Sciences | 0 | 0.0% |
| Psychology | 6 | 8.5% |
| Social Sciences | 0 | 0.0% |
| Engineering | 0 | 0.0% |
| Multidisciplinary Studies | 0 | 0.0% |
| Science & Technology | 0 | 0.0% |
| Business | 11 | 15.5% |
| Education | 0 | 0.0% |
| Literature & Languages | 12 | 16.9% |
| Liberal Arts & History | 6 | 8.5% |
| Visual & Performing Arts | 0 | 0.0% |
| Communications | 5 | 7.0% |
| Arts & Humanities | 0 | 0.0% |
| Total | 71 | 100.0% |
Transportation & Commute in Stony Creek Mills
Vehicle Availability by Sex in Stony Creek Mills
The most prevalent vehicle ownership categories in Stony Creek Mills are males with 2 vehicles (71, accounting for 44.9%) and females with 2 vehicles (62, making up 39.4%).
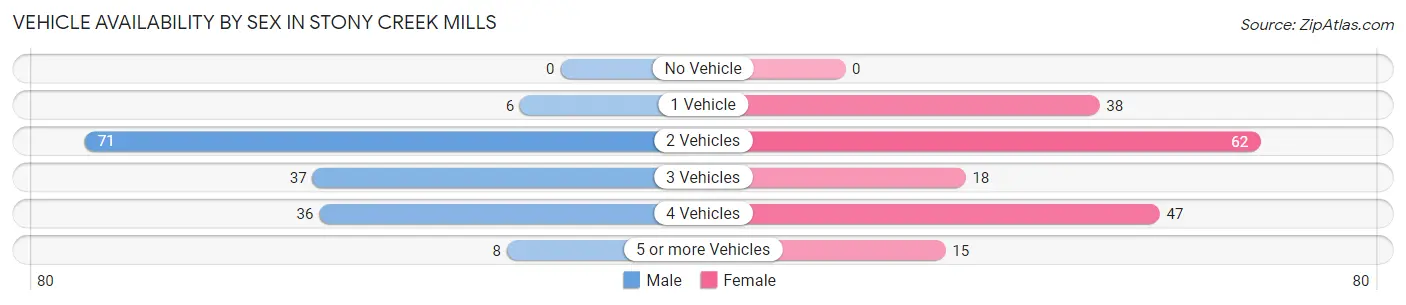
| Vehicles Available | Male | Female |
| No Vehicle | 0 (0.0%) | 0 (0.0%) |
| 1 Vehicle | 6 (3.8%) | 38 (21.1%) |
| 2 Vehicles | 71 (44.9%) | 62 (34.4%) |
| 3 Vehicles | 37 (23.4%) | 18 (10.0%) |
| 4 Vehicles | 36 (22.8%) | 47 (26.1%) |
| 5 or more Vehicles | 8 (5.1%) | 15 (8.3%) |
| Total | 158 (100.0%) | 180 (100.0%) |
Commute Time in Stony Creek Mills
The most frequently occuring commute durations in Stony Creek Mills are 15 to 19 minutes (77 commuters, 24.0%), 25 to 29 minutes (59 commuters, 18.4%), and less than 5 minutes (49 commuters, 15.3%).
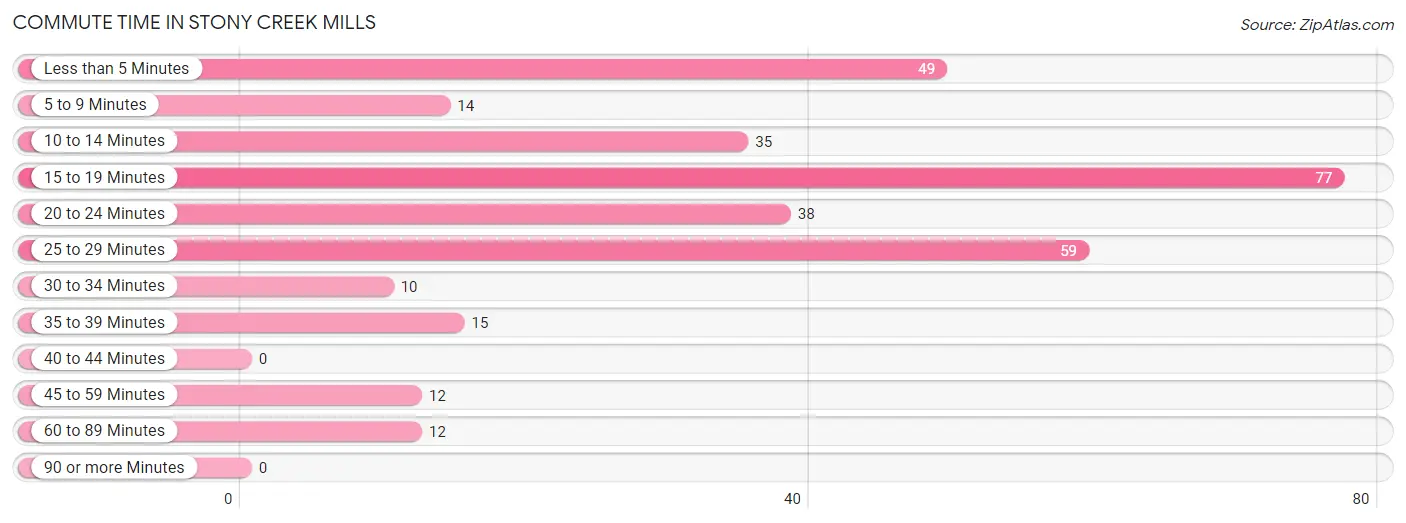
| Commute Time | # Commuters | % Commuters |
| Less than 5 Minutes | 49 | 15.3% |
| 5 to 9 Minutes | 14 | 4.4% |
| 10 to 14 Minutes | 35 | 10.9% |
| 15 to 19 Minutes | 77 | 24.0% |
| 20 to 24 Minutes | 38 | 11.8% |
| 25 to 29 Minutes | 59 | 18.4% |
| 30 to 34 Minutes | 10 | 3.1% |
| 35 to 39 Minutes | 15 | 4.7% |
| 40 to 44 Minutes | 0 | 0.0% |
| 45 to 59 Minutes | 12 | 3.7% |
| 60 to 89 Minutes | 12 | 3.7% |
| 90 or more Minutes | 0 | 0.0% |
Commute Time by Sex in Stony Creek Mills
The most common commute times in Stony Creek Mills are less than 5 minutes (41 commuters, 27.9%) for males and 25 to 29 minutes (59 commuters, 33.9%) for females.
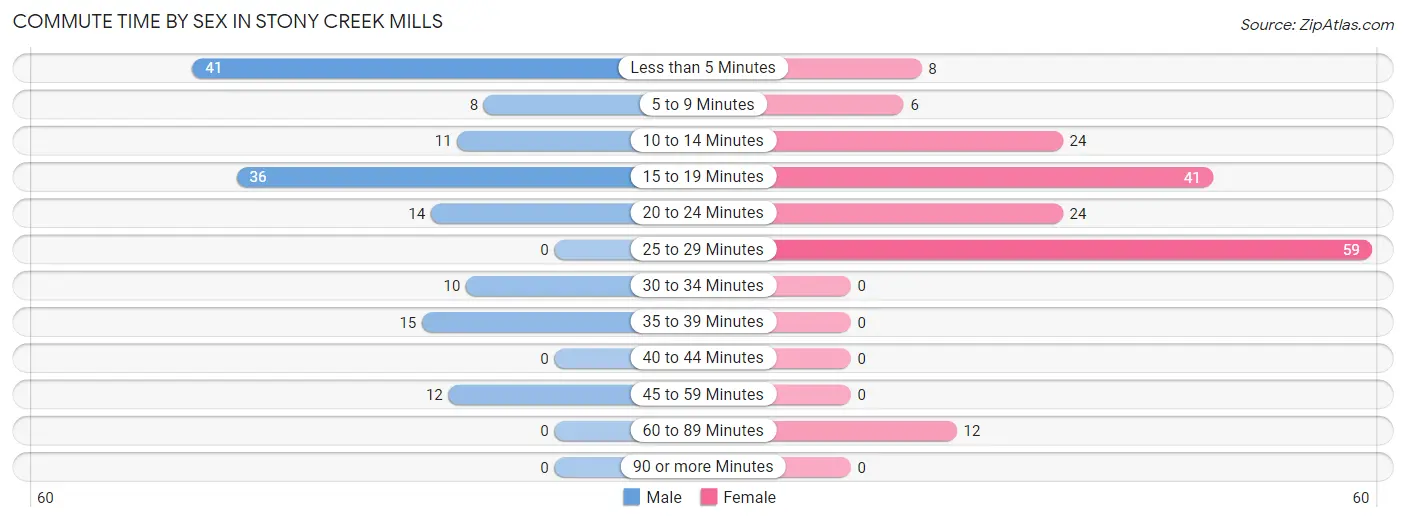
| Commute Time | Male | Female |
| Less than 5 Minutes | 41 (27.9%) | 8 (4.6%) |
| 5 to 9 Minutes | 8 (5.4%) | 6 (3.5%) |
| 10 to 14 Minutes | 11 (7.5%) | 24 (13.8%) |
| 15 to 19 Minutes | 36 (24.5%) | 41 (23.6%) |
| 20 to 24 Minutes | 14 (9.5%) | 24 (13.8%) |
| 25 to 29 Minutes | 0 (0.0%) | 59 (33.9%) |
| 30 to 34 Minutes | 10 (6.8%) | 0 (0.0%) |
| 35 to 39 Minutes | 15 (10.2%) | 0 (0.0%) |
| 40 to 44 Minutes | 0 (0.0%) | 0 (0.0%) |
| 45 to 59 Minutes | 12 (8.2%) | 0 (0.0%) |
| 60 to 89 Minutes | 0 (0.0%) | 12 (6.9%) |
| 90 or more Minutes | 0 (0.0%) | 0 (0.0%) |
Time of Departure to Work by Sex in Stony Creek Mills
The most frequent times of departure to work in Stony Creek Mills are 7:30 AM to 7:59 AM (32, 21.8%) for males and 4:00 PM to 11:59 PM (36, 20.7%) for females.
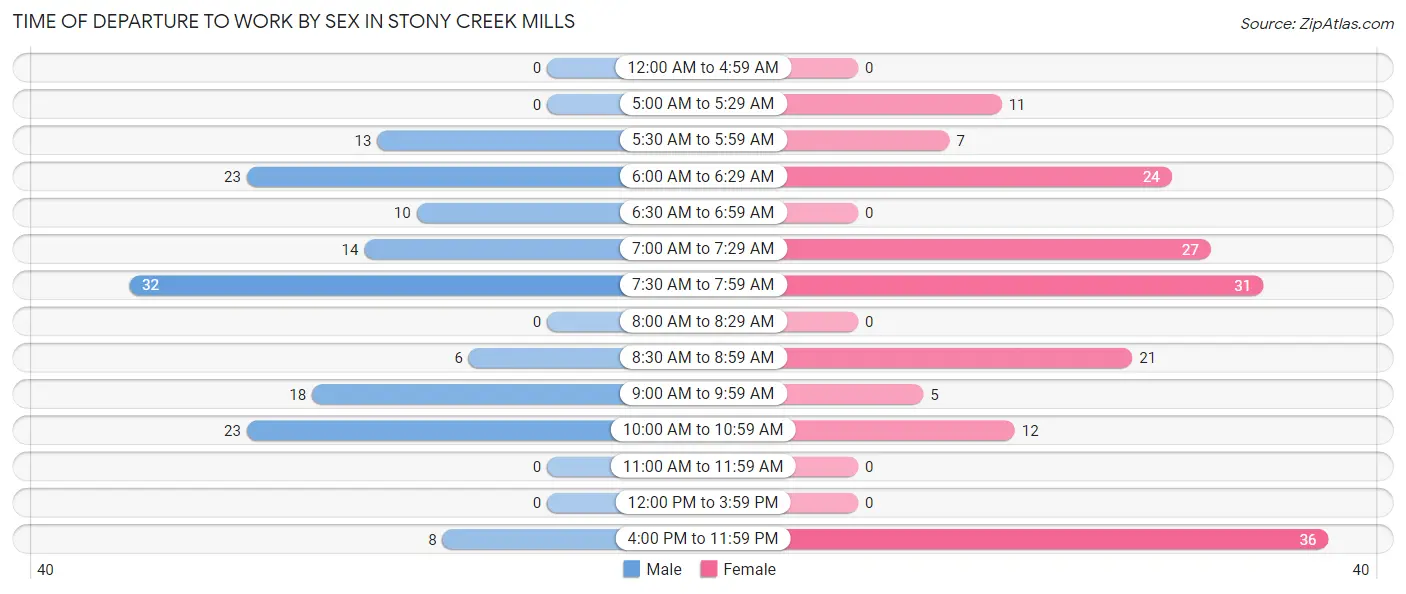
| Time of Departure | Male | Female |
| 12:00 AM to 4:59 AM | 0 (0.0%) | 0 (0.0%) |
| 5:00 AM to 5:29 AM | 0 (0.0%) | 11 (6.3%) |
| 5:30 AM to 5:59 AM | 13 (8.8%) | 7 (4.0%) |
| 6:00 AM to 6:29 AM | 23 (15.7%) | 24 (13.8%) |
| 6:30 AM to 6:59 AM | 10 (6.8%) | 0 (0.0%) |
| 7:00 AM to 7:29 AM | 14 (9.5%) | 27 (15.5%) |
| 7:30 AM to 7:59 AM | 32 (21.8%) | 31 (17.8%) |
| 8:00 AM to 8:29 AM | 0 (0.0%) | 0 (0.0%) |
| 8:30 AM to 8:59 AM | 6 (4.1%) | 21 (12.1%) |
| 9:00 AM to 9:59 AM | 18 (12.2%) | 5 (2.9%) |
| 10:00 AM to 10:59 AM | 23 (15.7%) | 12 (6.9%) |
| 11:00 AM to 11:59 AM | 0 (0.0%) | 0 (0.0%) |
| 12:00 PM to 3:59 PM | 0 (0.0%) | 0 (0.0%) |
| 4:00 PM to 11:59 PM | 8 (5.4%) | 36 (20.7%) |
| Total | 147 (100.0%) | 174 (100.0%) |
Housing Occupancy in Stony Creek Mills
Occupancy by Ownership in Stony Creek Mills
Of the total 336 dwellings in Stony Creek Mills, owner-occupied units account for 268 (79.8%), while renter-occupied units make up 68 (20.2%).
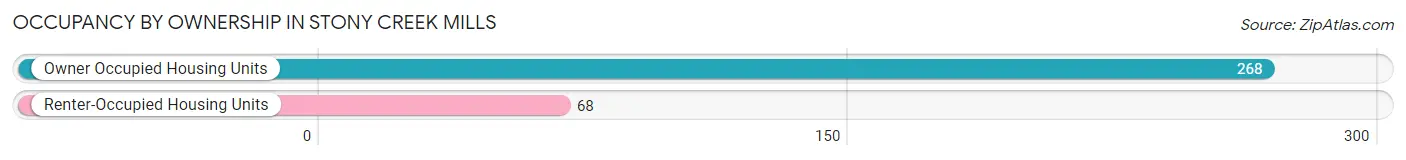
| Occupancy | # Housing Units | % Housing Units |
| Owner Occupied Housing Units | 268 | 79.8% |
| Renter-Occupied Housing Units | 68 | 20.2% |
| Total Occupied Housing Units | 336 | 100.0% |
Occupancy by Household Size in Stony Creek Mills
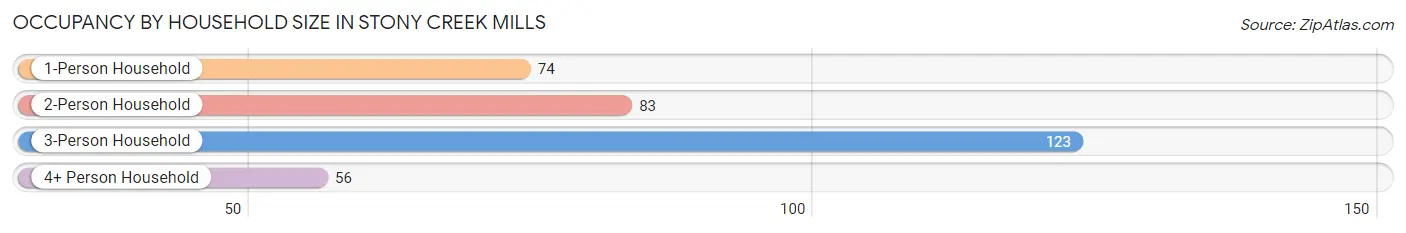
| Household Size | # Housing Units | % Housing Units |
| 1-Person Household | 74 | 22.0% |
| 2-Person Household | 83 | 24.7% |
| 3-Person Household | 123 | 36.6% |
| 4+ Person Household | 56 | 16.7% |
| Total Housing Units | 336 | 100.0% |
Occupancy by Ownership by Household Size in Stony Creek Mills
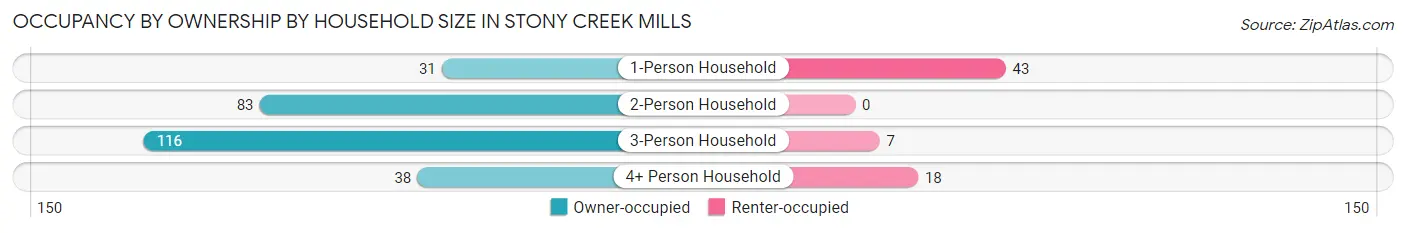
| Household Size | Owner-occupied | Renter-occupied |
| 1-Person Household | 31 (41.9%) | 43 (58.1%) |
| 2-Person Household | 83 (100.0%) | 0 (0.0%) |
| 3-Person Household | 116 (94.3%) | 7 (5.7%) |
| 4+ Person Household | 38 (67.9%) | 18 (32.1%) |
| Total Housing Units | 268 (79.8%) | 68 (20.2%) |
Occupancy by Educational Attainment in Stony Creek Mills
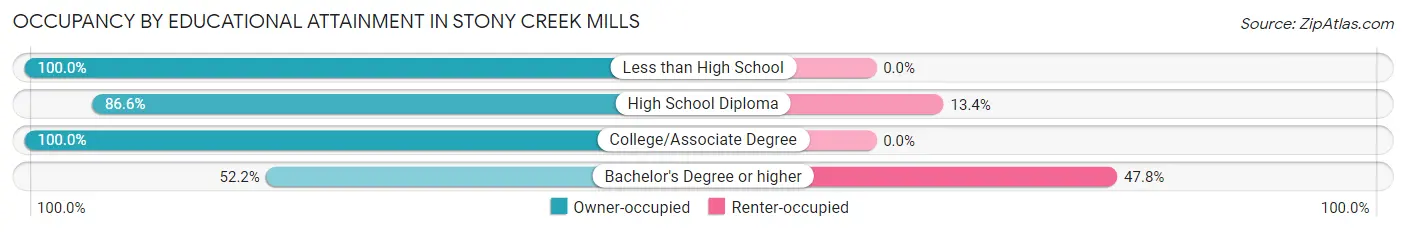
| Household Size | Owner-occupied | Renter-occupied |
| Less than High School | 25 (100.0%) | 0 (0.0%) |
| High School Diploma | 162 (86.6%) | 25 (13.4%) |
| College/Associate Degree | 34 (100.0%) | 0 (0.0%) |
| Bachelor's Degree or higher | 47 (52.2%) | 43 (47.8%) |
Occupancy by Age of Householder in Stony Creek Mills
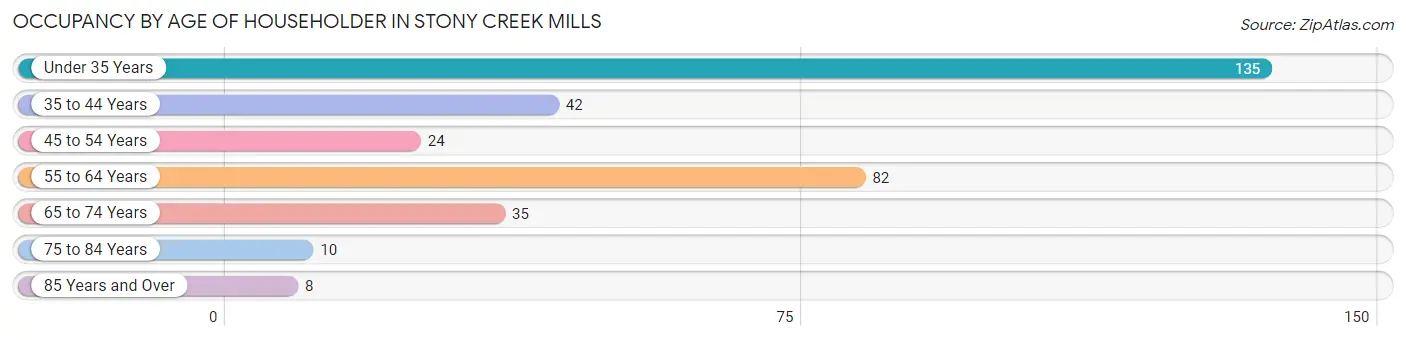
| Age Bracket | # Households | % Households |
| Under 35 Years | 135 | 40.2% |
| 35 to 44 Years | 42 | 12.5% |
| 45 to 54 Years | 24 | 7.1% |
| 55 to 64 Years | 82 | 24.4% |
| 65 to 74 Years | 35 | 10.4% |
| 75 to 84 Years | 10 | 3.0% |
| 85 Years and Over | 8 | 2.4% |
| Total | 336 | 100.0% |
Housing Finances in Stony Creek Mills
Median Income by Occupancy in Stony Creek Mills
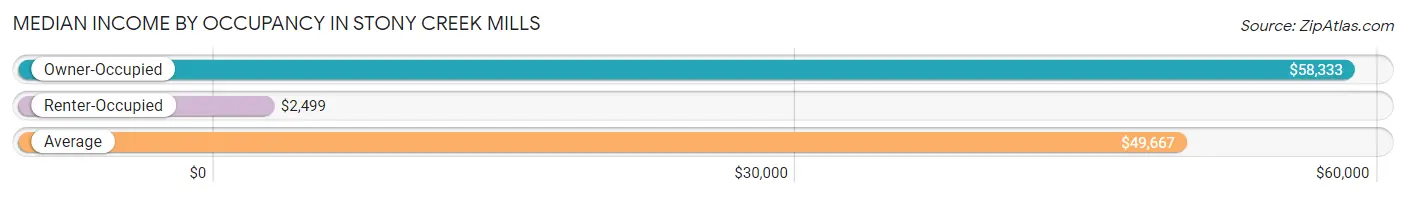
| Occupancy Type | # Households | Median Income |
| Owner-Occupied | 268 (79.8%) | $58,333 |
| Renter-Occupied | 68 (20.2%) | $2,499 |
| Average | 336 (100.0%) | $49,667 |
Occupancy by Householder Income Bracket in Stony Creek Mills
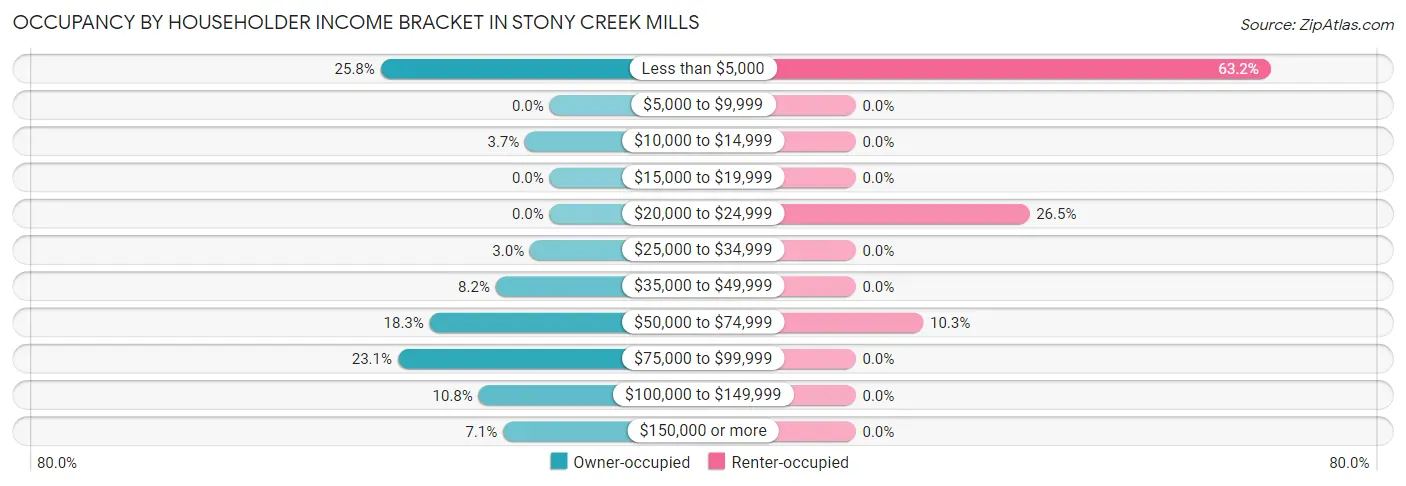
| Income Bracket | Owner-occupied | Renter-occupied |
| Less than $5,000 | 69 (25.8%) | 43 (63.2%) |
| $5,000 to $9,999 | 0 (0.0%) | 0 (0.0%) |
| $10,000 to $14,999 | 10 (3.7%) | 0 (0.0%) |
| $15,000 to $19,999 | 0 (0.0%) | 0 (0.0%) |
| $20,000 to $24,999 | 0 (0.0%) | 18 (26.5%) |
| $25,000 to $34,999 | 8 (3.0%) | 0 (0.0%) |
| $35,000 to $49,999 | 22 (8.2%) | 0 (0.0%) |
| $50,000 to $74,999 | 49 (18.3%) | 7 (10.3%) |
| $75,000 to $99,999 | 62 (23.1%) | 0 (0.0%) |
| $100,000 to $149,999 | 29 (10.8%) | 0 (0.0%) |
| $150,000 or more | 19 (7.1%) | 0 (0.0%) |
| Total | 268 (100.0%) | 68 (100.0%) |
Monthly Housing Cost Tiers in Stony Creek Mills
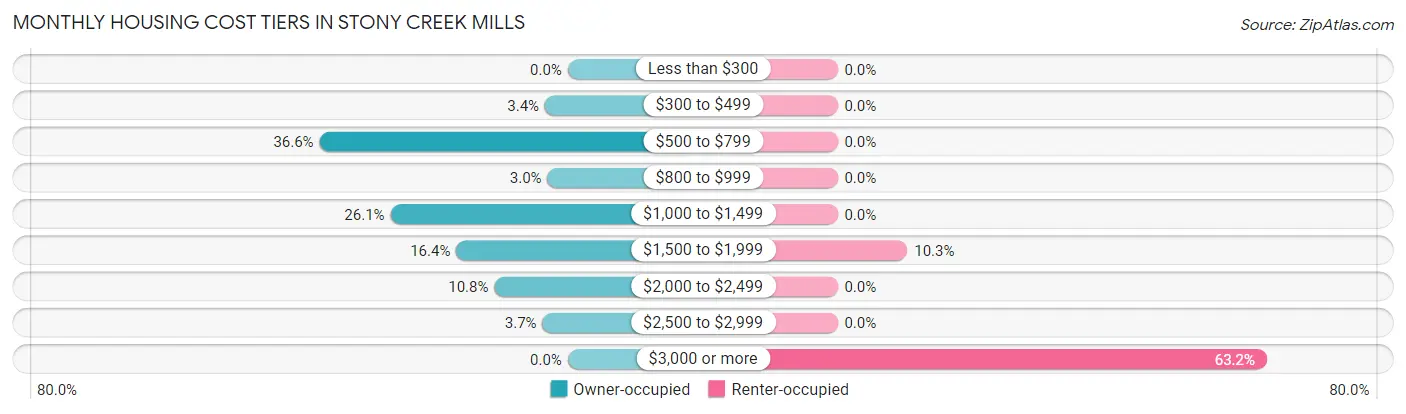
| Monthly Cost | Owner-occupied | Renter-occupied |
| Less than $300 | 0 (0.0%) | 0 (0.0%) |
| $300 to $499 | 9 (3.4%) | 0 (0.0%) |
| $500 to $799 | 98 (36.6%) | 0 (0.0%) |
| $800 to $999 | 8 (3.0%) | 0 (0.0%) |
| $1,000 to $1,499 | 70 (26.1%) | 0 (0.0%) |
| $1,500 to $1,999 | 44 (16.4%) | 7 (10.3%) |
| $2,000 to $2,499 | 29 (10.8%) | 0 (0.0%) |
| $2,500 to $2,999 | 10 (3.7%) | 0 (0.0%) |
| $3,000 or more | 0 (0.0%) | 43 (63.2%) |
| Total | 268 (100.0%) | 68 (100.0%) |
Physical Housing Characteristics in Stony Creek Mills
Housing Structures in Stony Creek Mills
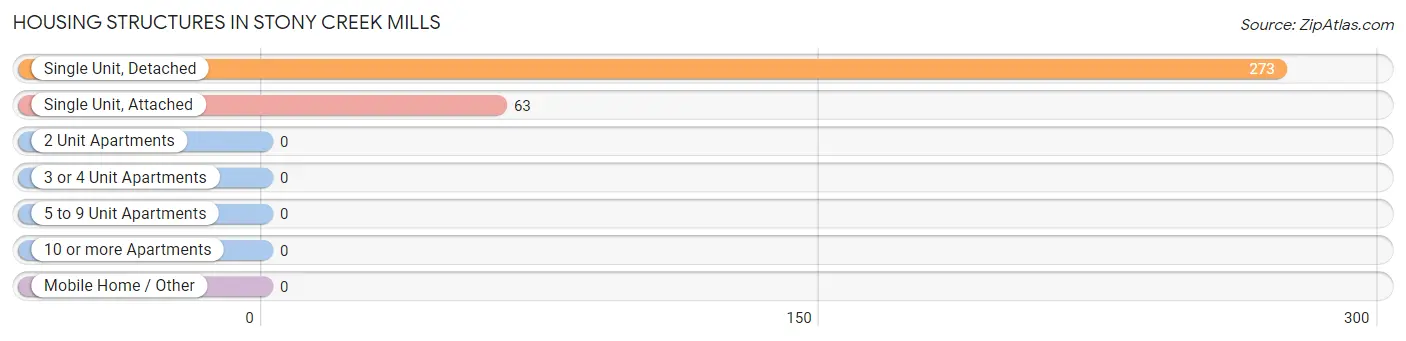
| Structure Type | # Housing Units | % Housing Units |
| Single Unit, Detached | 273 | 81.2% |
| Single Unit, Attached | 63 | 18.8% |
| 2 Unit Apartments | 0 | 0.0% |
| 3 or 4 Unit Apartments | 0 | 0.0% |
| 5 to 9 Unit Apartments | 0 | 0.0% |
| 10 or more Apartments | 0 | 0.0% |
| Mobile Home / Other | 0 | 0.0% |
| Total | 336 | 100.0% |
Housing Structures by Occupancy in Stony Creek Mills
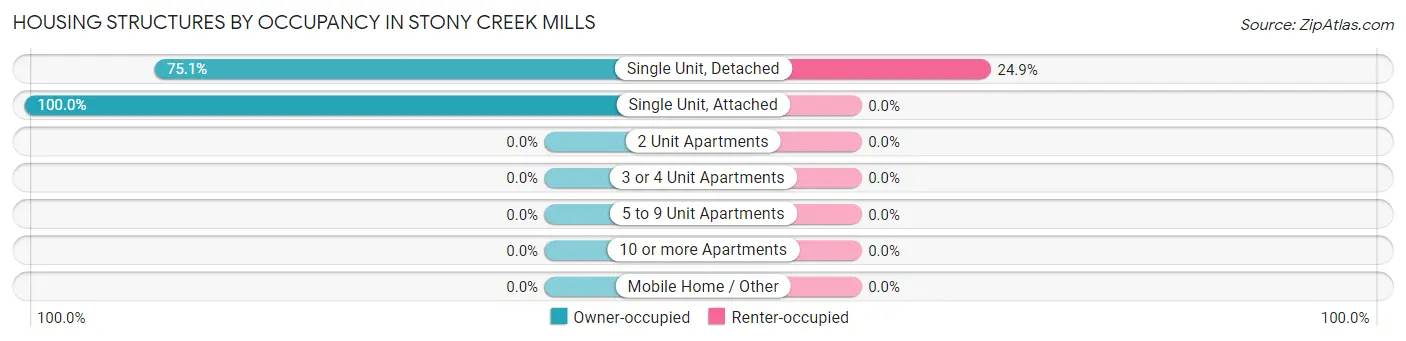
| Structure Type | Owner-occupied | Renter-occupied |
| Single Unit, Detached | 205 (75.1%) | 68 (24.9%) |
| Single Unit, Attached | 63 (100.0%) | 0 (0.0%) |
| 2 Unit Apartments | 0 (0.0%) | 0 (0.0%) |
| 3 or 4 Unit Apartments | 0 (0.0%) | 0 (0.0%) |
| 5 to 9 Unit Apartments | 0 (0.0%) | 0 (0.0%) |
| 10 or more Apartments | 0 (0.0%) | 0 (0.0%) |
| Mobile Home / Other | 0 (0.0%) | 0 (0.0%) |
| Total | 268 (79.8%) | 68 (20.2%) |
Housing Structures by Number of Rooms in Stony Creek Mills
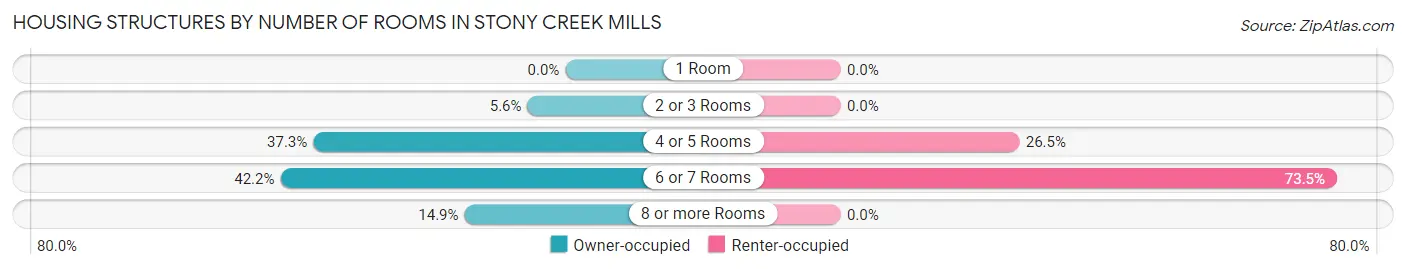
| Number of Rooms | Owner-occupied | Renter-occupied |
| 1 Room | 0 (0.0%) | 0 (0.0%) |
| 2 or 3 Rooms | 15 (5.6%) | 0 (0.0%) |
| 4 or 5 Rooms | 100 (37.3%) | 18 (26.5%) |
| 6 or 7 Rooms | 113 (42.2%) | 50 (73.5%) |
| 8 or more Rooms | 40 (14.9%) | 0 (0.0%) |
| Total | 268 (100.0%) | 68 (100.0%) |
Housing Structure by Heating Type in Stony Creek Mills
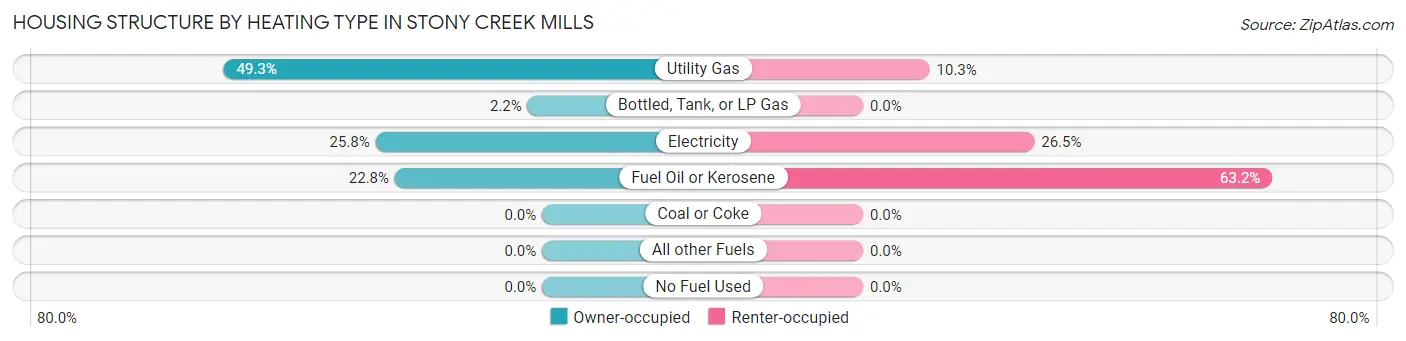
| Heating Type | Owner-occupied | Renter-occupied |
| Utility Gas | 132 (49.2%) | 7 (10.3%) |
| Bottled, Tank, or LP Gas | 6 (2.2%) | 0 (0.0%) |
| Electricity | 69 (25.8%) | 18 (26.5%) |
| Fuel Oil or Kerosene | 61 (22.8%) | 43 (63.2%) |
| Coal or Coke | 0 (0.0%) | 0 (0.0%) |
| All other Fuels | 0 (0.0%) | 0 (0.0%) |
| No Fuel Used | 0 (0.0%) | 0 (0.0%) |
| Total | 268 (100.0%) | 68 (100.0%) |
Household Vehicle Usage in Stony Creek Mills
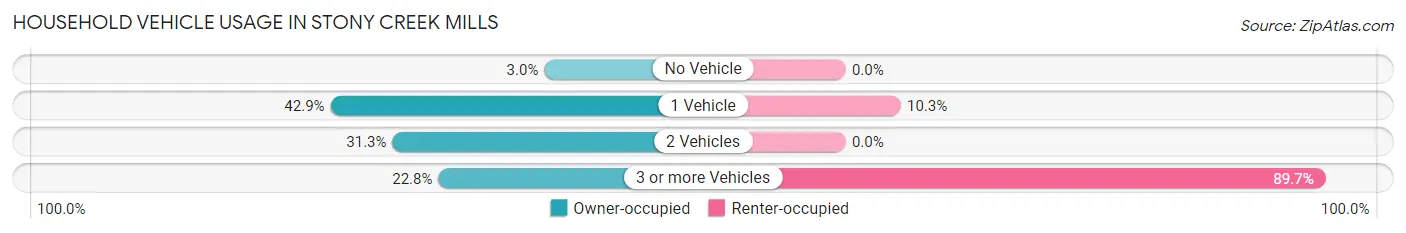
| Vehicles per Household | Owner-occupied | Renter-occupied |
| No Vehicle | 8 (3.0%) | 0 (0.0%) |
| 1 Vehicle | 115 (42.9%) | 7 (10.3%) |
| 2 Vehicles | 84 (31.3%) | 0 (0.0%) |
| 3 or more Vehicles | 61 (22.8%) | 61 (89.7%) |
| Total | 268 (100.0%) | 68 (100.0%) |
Real Estate & Mortgages in Stony Creek Mills
Real Estate and Mortgage Overview in Stony Creek Mills
| Characteristic | Without Mortgage | With Mortgage |
| Housing Units | 121 | 147 |
| Median Property Value | $96,300 | $167,100 |
| Median Household Income | $2,499 | $19 |
| Monthly Housing Costs | $659 | $0 |
| Real Estate Taxes | $3,652 | $0 |
Property Value by Mortgage Status in Stony Creek Mills
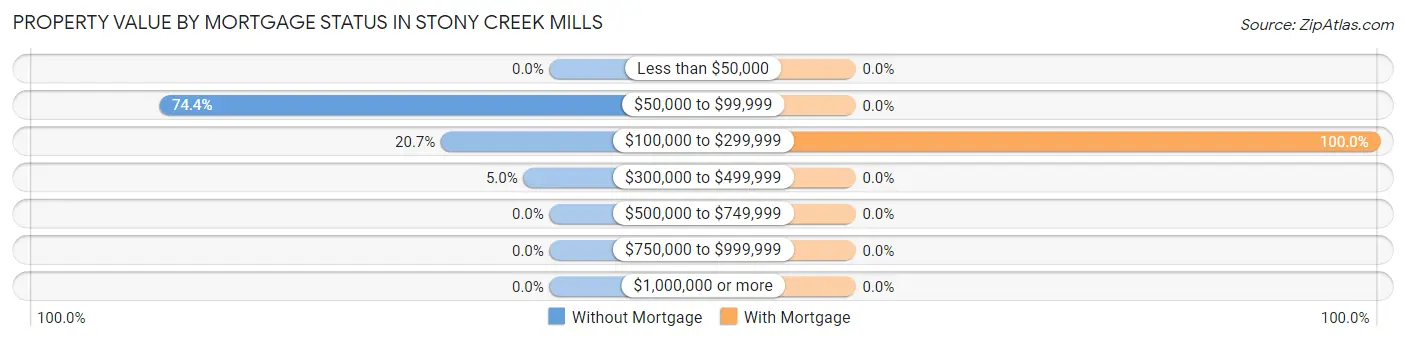
| Property Value | Without Mortgage | With Mortgage |
| Less than $50,000 | 0 (0.0%) | 0 (0.0%) |
| $50,000 to $99,999 | 90 (74.4%) | 0 (0.0%) |
| $100,000 to $299,999 | 25 (20.7%) | 147 (100.0%) |
| $300,000 to $499,999 | 6 (5.0%) | 0 (0.0%) |
| $500,000 to $749,999 | 0 (0.0%) | 0 (0.0%) |
| $750,000 to $999,999 | 0 (0.0%) | 0 (0.0%) |
| $1,000,000 or more | 0 (0.0%) | 0 (0.0%) |
| Total | 121 (100.0%) | 147 (100.0%) |
Household Income by Mortgage Status in Stony Creek Mills
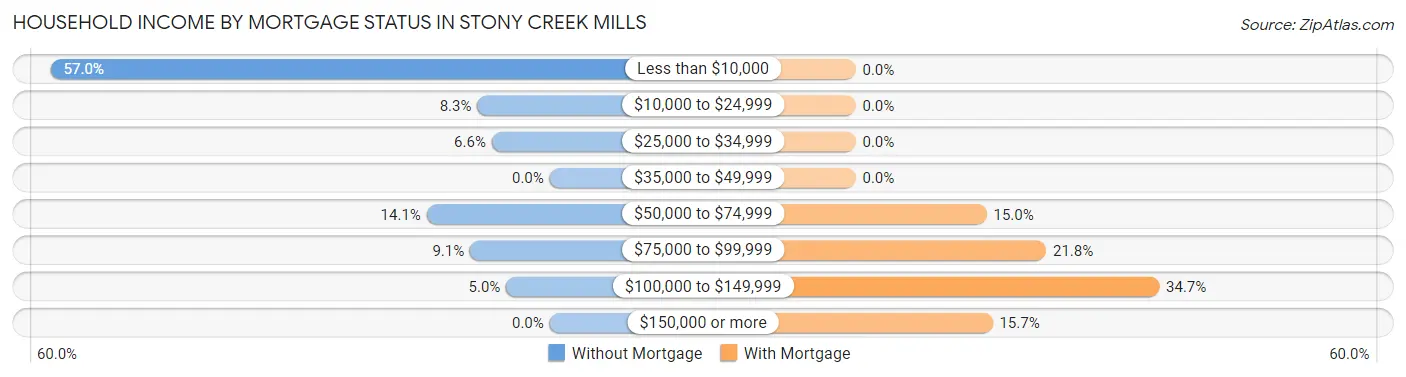
| Household Income | Without Mortgage | With Mortgage |
| Less than $10,000 | 69 (57.0%) | 0 (0.0%) |
| $10,000 to $24,999 | 10 (8.3%) | 0 (0.0%) |
| $25,000 to $34,999 | 8 (6.6%) | 0 (0.0%) |
| $35,000 to $49,999 | 0 (0.0%) | 0 (0.0%) |
| $50,000 to $74,999 | 17 (14.1%) | 22 (15.0%) |
| $75,000 to $99,999 | 11 (9.1%) | 32 (21.8%) |
| $100,000 to $149,999 | 6 (5.0%) | 51 (34.7%) |
| $150,000 or more | 0 (0.0%) | 23 (15.7%) |
| Total | 121 (100.0%) | 147 (100.0%) |
Property Value to Household Income Ratio in Stony Creek Mills
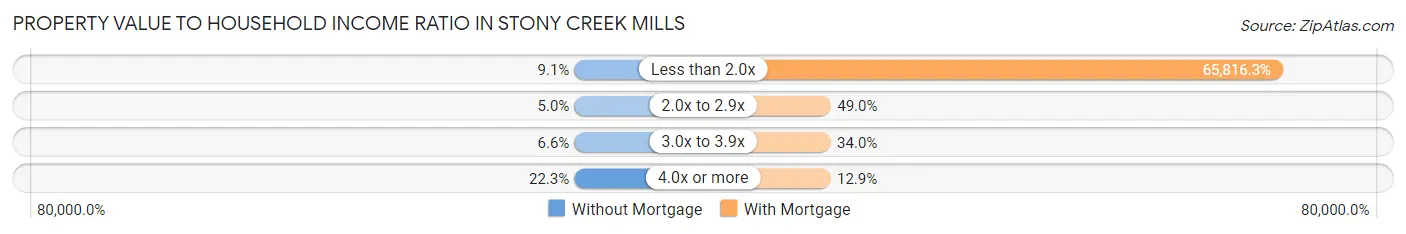
| Value-to-Income Ratio | Without Mortgage | With Mortgage |
| Less than 2.0x | 11 (9.1%) | 96,750 (65,816.3%) |
| 2.0x to 2.9x | 6 (5.0%) | 72 (49.0%) |
| 3.0x to 3.9x | 8 (6.6%) | 50 (34.0%) |
| 4.0x or more | 27 (22.3%) | 19 (12.9%) |
| Total | 121 (100.0%) | 147 (100.0%) |
Real Estate Taxes by Mortgage Status in Stony Creek Mills
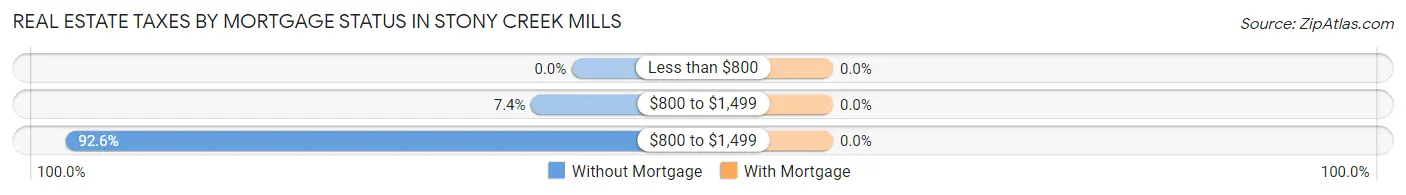
| Property Taxes | Without Mortgage | With Mortgage |
| Less than $800 | 0 (0.0%) | 0 (0.0%) |
| $800 to $1,499 | 9 (7.4%) | 0 (0.0%) |
| $800 to $1,499 | 112 (92.6%) | 0 (0.0%) |
| Total | 121 (100.0%) | 147 (100.0%) |
Health & Disability in Stony Creek Mills
Health Insurance Coverage by Age in Stony Creek Mills
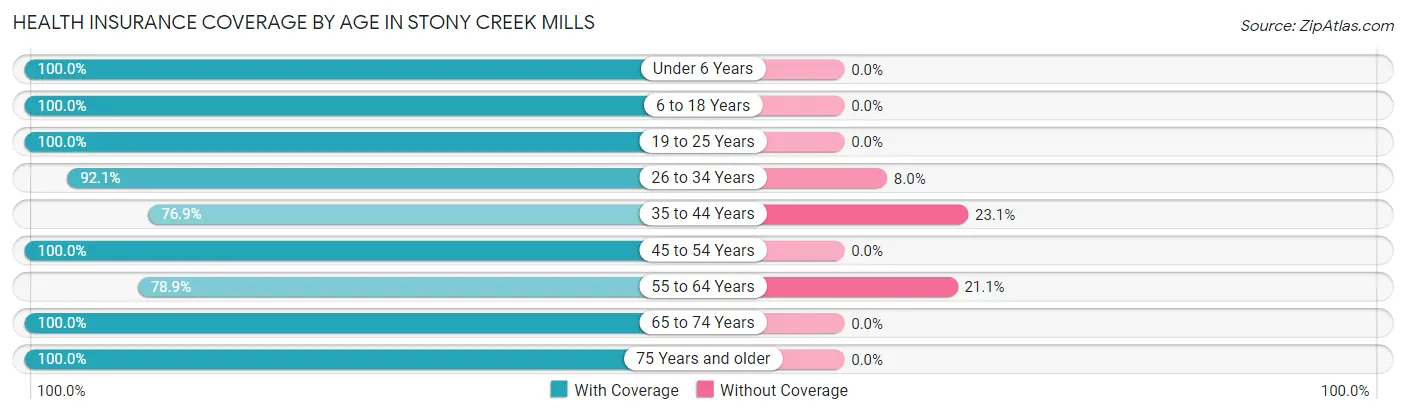
| Age Bracket | With Coverage | Without Coverage |
| Under 6 Years | 55 (100.0%) | 0 (0.0%) |
| 6 to 18 Years | 235 (100.0%) | 0 (0.0%) |
| 19 to 25 Years | 53 (100.0%) | 0 (0.0%) |
| 26 to 34 Years | 139 (92.0%) | 12 (8.0%) |
| 35 to 44 Years | 60 (76.9%) | 18 (23.1%) |
| 45 to 54 Years | 81 (100.0%) | 0 (0.0%) |
| 55 to 64 Years | 86 (78.9%) | 23 (21.1%) |
| 65 to 74 Years | 73 (100.0%) | 0 (0.0%) |
| 75 Years and older | 30 (100.0%) | 0 (0.0%) |
| Total | 812 (93.9%) | 53 (6.1%) |
Health Insurance Coverage by Citizenship Status in Stony Creek Mills
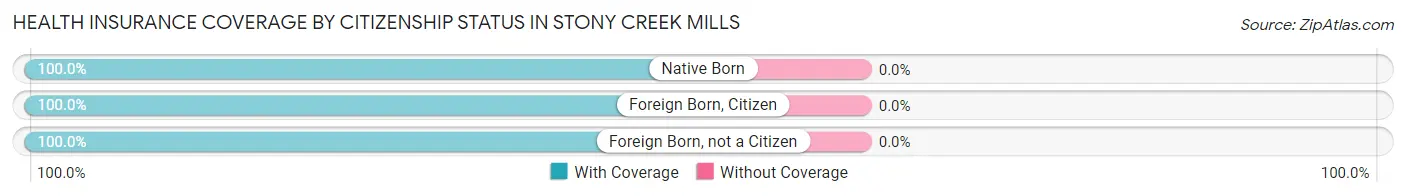
| Citizenship Status | With Coverage | Without Coverage |
| Native Born | 55 (100.0%) | 0 (0.0%) |
| Foreign Born, Citizen | 235 (100.0%) | 0 (0.0%) |
| Foreign Born, not a Citizen | 53 (100.0%) | 0 (0.0%) |
Health Insurance Coverage by Household Income in Stony Creek Mills
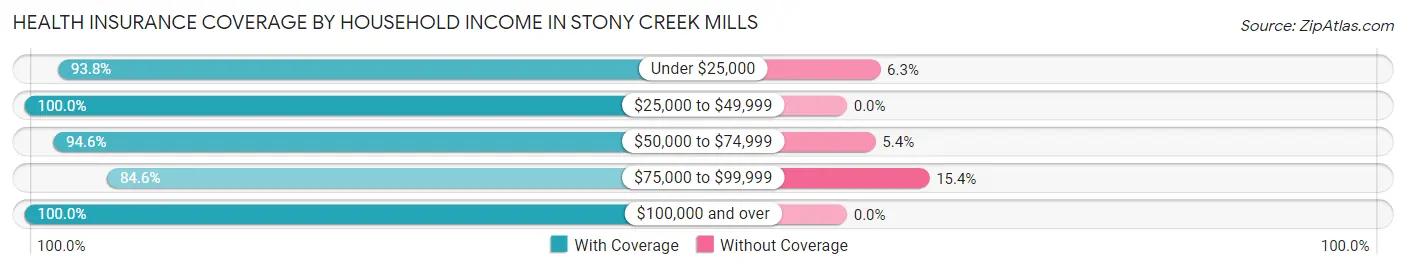
| Household Income | With Coverage | Without Coverage |
| Under $25,000 | 270 (93.8%) | 18 (6.2%) |
| $25,000 to $49,999 | 78 (100.0%) | 0 (0.0%) |
| $50,000 to $74,999 | 212 (94.6%) | 12 (5.4%) |
| $75,000 to $99,999 | 126 (84.6%) | 23 (15.4%) |
| $100,000 and over | 126 (100.0%) | 0 (0.0%) |
Public vs Private Health Insurance Coverage by Age in Stony Creek Mills
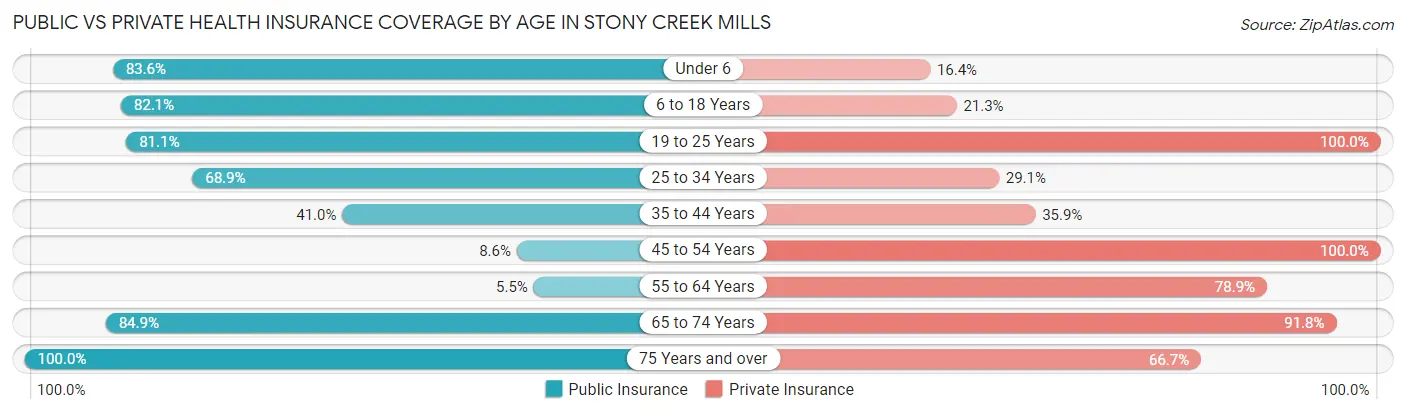
| Age Bracket | Public Insurance | Private Insurance |
| Under 6 | 46 (83.6%) | 9 (16.4%) |
| 6 to 18 Years | 193 (82.1%) | 50 (21.3%) |
| 19 to 25 Years | 43 (81.1%) | 53 (100.0%) |
| 25 to 34 Years | 104 (68.9%) | 44 (29.1%) |
| 35 to 44 Years | 32 (41.0%) | 28 (35.9%) |
| 45 to 54 Years | 7 (8.6%) | 81 (100.0%) |
| 55 to 64 Years | 6 (5.5%) | 86 (78.9%) |
| 65 to 74 Years | 62 (84.9%) | 67 (91.8%) |
| 75 Years and over | 30 (100.0%) | 20 (66.7%) |
| Total | 523 (60.5%) | 438 (50.6%) |
Disability Status by Sex by Age in Stony Creek Mills
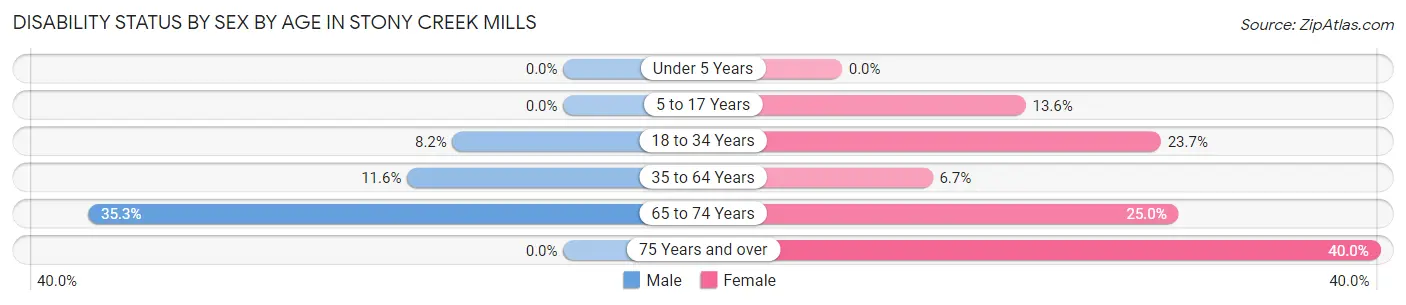
| Age Bracket | Male | Female |
| Under 5 Years | 0 (0.0%) | 0 (0.0%) |
| 5 to 17 Years | 0 (0.0%) | 9 (13.6%) |
| 18 to 34 Years | 12 (8.2%) | 18 (23.7%) |
| 35 to 64 Years | 19 (11.6%) | 7 (6.7%) |
| 65 to 74 Years | 6 (35.3%) | 14 (25.0%) |
| 75 Years and over | 0 (0.0%) | 12 (40.0%) |
Disability Class by Sex by Age in Stony Creek Mills
Disability Class: Hearing Difficulty
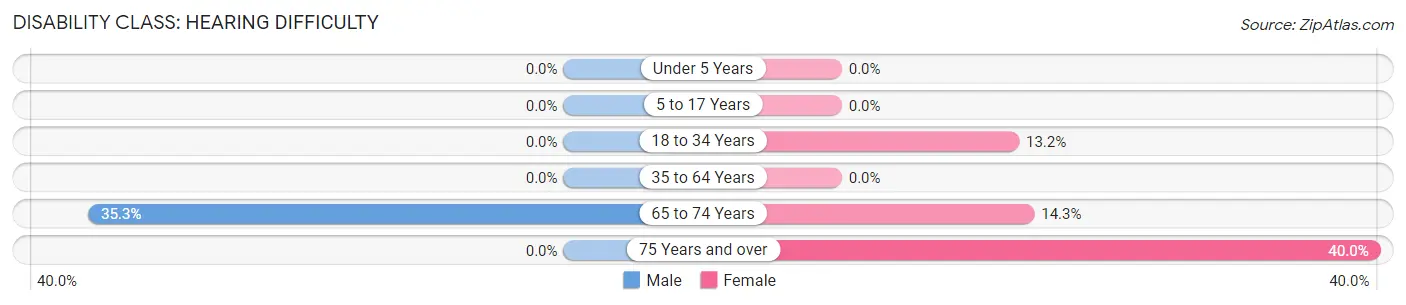
| Age Bracket | Male | Female |
| Under 5 Years | 0 (0.0%) | 0 (0.0%) |
| 5 to 17 Years | 0 (0.0%) | 0 (0.0%) |
| 18 to 34 Years | 0 (0.0%) | 10 (13.2%) |
| 35 to 64 Years | 0 (0.0%) | 0 (0.0%) |
| 65 to 74 Years | 6 (35.3%) | 8 (14.3%) |
| 75 Years and over | 0 (0.0%) | 12 (40.0%) |
Disability Class: Vision Difficulty
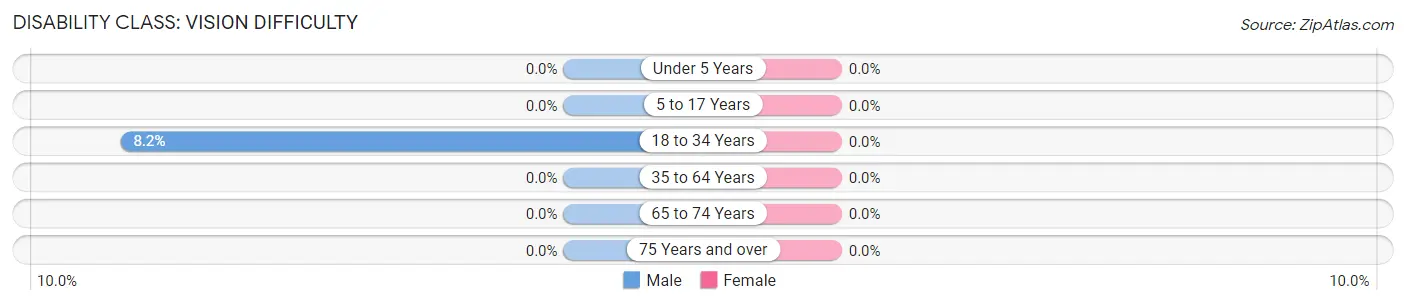
| Age Bracket | Male | Female |
| Under 5 Years | 0 (0.0%) | 0 (0.0%) |
| 5 to 17 Years | 0 (0.0%) | 0 (0.0%) |
| 18 to 34 Years | 12 (8.2%) | 0 (0.0%) |
| 35 to 64 Years | 0 (0.0%) | 0 (0.0%) |
| 65 to 74 Years | 0 (0.0%) | 0 (0.0%) |
| 75 Years and over | 0 (0.0%) | 0 (0.0%) |
Disability Class: Cognitive Difficulty
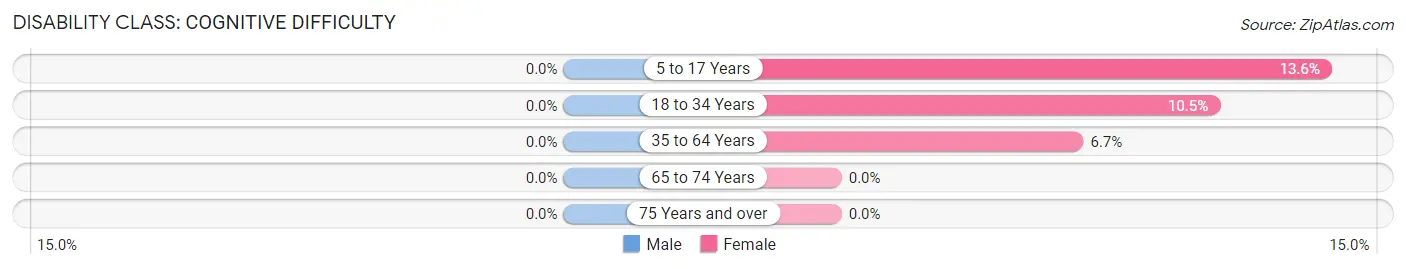
| Age Bracket | Male | Female |
| 5 to 17 Years | 0 (0.0%) | 9 (13.6%) |
| 18 to 34 Years | 0 (0.0%) | 8 (10.5%) |
| 35 to 64 Years | 0 (0.0%) | 7 (6.7%) |
| 65 to 74 Years | 0 (0.0%) | 0 (0.0%) |
| 75 Years and over | 0 (0.0%) | 0 (0.0%) |
Disability Class: Ambulatory Difficulty
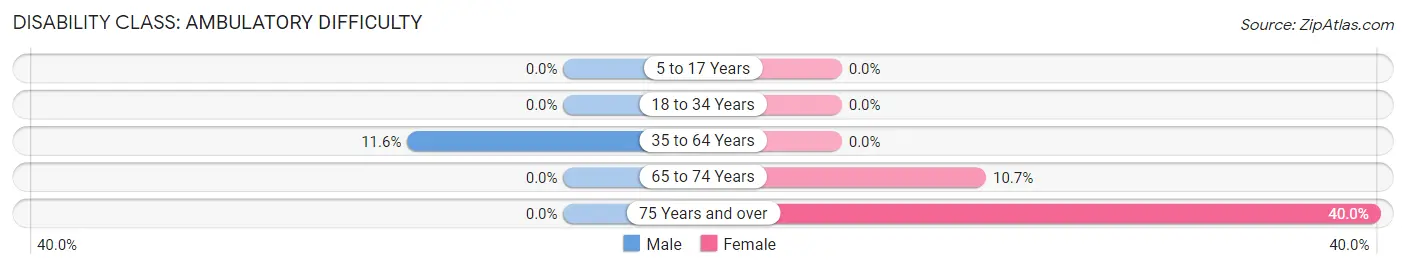
| Age Bracket | Male | Female |
| 5 to 17 Years | 0 (0.0%) | 0 (0.0%) |
| 18 to 34 Years | 0 (0.0%) | 0 (0.0%) |
| 35 to 64 Years | 19 (11.6%) | 0 (0.0%) |
| 65 to 74 Years | 0 (0.0%) | 6 (10.7%) |
| 75 Years and over | 0 (0.0%) | 12 (40.0%) |
Disability Class: Self-Care Difficulty
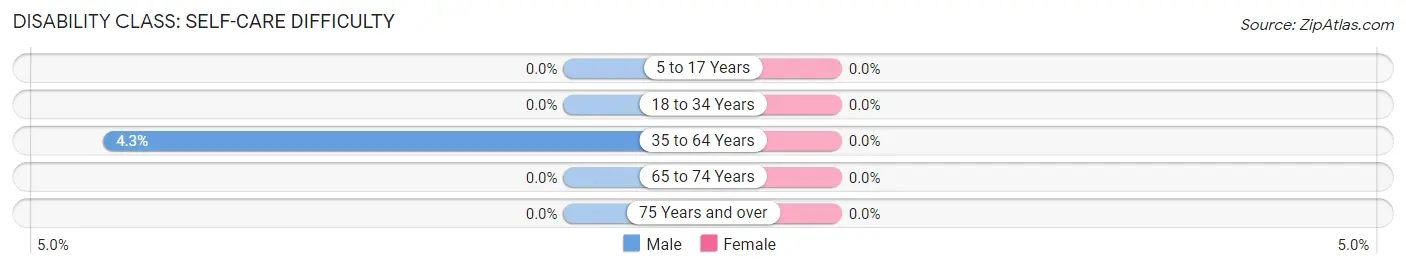
| Age Bracket | Male | Female |
| 5 to 17 Years | 0 (0.0%) | 0 (0.0%) |
| 18 to 34 Years | 0 (0.0%) | 0 (0.0%) |
| 35 to 64 Years | 7 (4.3%) | 0 (0.0%) |
| 65 to 74 Years | 0 (0.0%) | 0 (0.0%) |
| 75 Years and over | 0 (0.0%) | 0 (0.0%) |
Technology Access in Stony Creek Mills
Computing Device Access in Stony Creek Mills
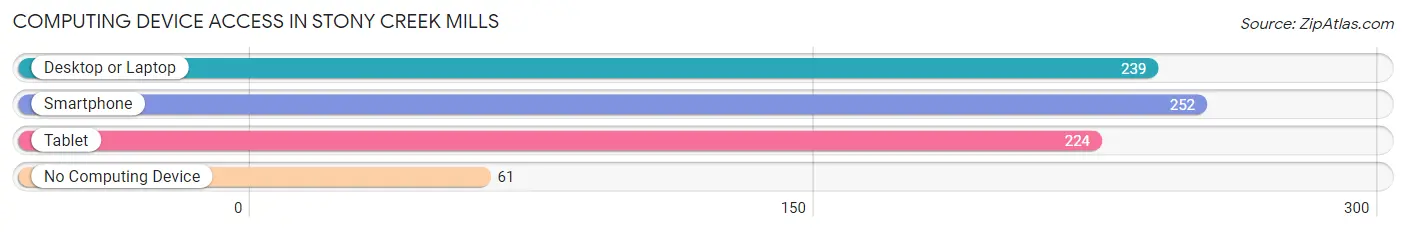
| Device Type | # Households | % Households |
| Desktop or Laptop | 239 | 71.1% |
| Smartphone | 252 | 75.0% |
| Tablet | 224 | 66.7% |
| No Computing Device | 61 | 18.1% |
| Total | 336 | 100.0% |
Internet Access in Stony Creek Mills
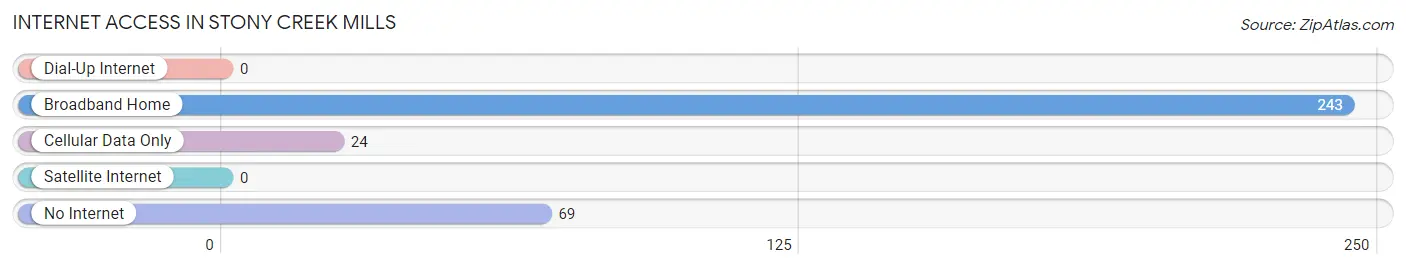
| Internet Type | # Households | % Households |
| Dial-Up Internet | 0 | 0.0% |
| Broadband Home | 243 | 72.3% |
| Cellular Data Only | 24 | 7.1% |
| Satellite Internet | 0 | 0.0% |
| No Internet | 69 | 20.5% |
| Total | 336 | 100.0% |
Stony Creek Mills Summary
Stony Creek Mills is a small unincorporated community located in Northampton County, Pennsylvania. It is situated in the Lehigh Valley region of the state, approximately 10 miles north of Allentown and about 20 miles west of Easton. The community is located along the banks of the Lehigh River and is home to a variety of businesses, including a sawmill, a grist mill, and a paper mill.
History
Stony Creek Mills was first settled in the late 1700s by German immigrants. The area was originally known as “Stoney Creek” and was part of the larger township of Allen. In 1845, the name was changed to Stony Creek Mills. The name was derived from the numerous mills that were located along the banks of the Lehigh River.
The first mill in the area was a sawmill, which was built in 1790 by John and Jacob Miller. The sawmill was used to produce lumber for the construction of homes and other buildings in the area. In 1820, a grist mill was built by Jacob Miller and his son, John. The grist mill was used to grind grain into flour and other products. In 1845, a paper mill was built by John Miller and his son, Jacob. The paper mill was used to produce paper products, such as newspapers and books.
The mills in Stony Creek Mills were very important to the local economy. They provided employment for many of the residents and helped to make the area prosperous. The mills also provided a source of income for the local farmers, who sold their grain to the mills.
Geography
Stony Creek Mills is located in Northampton County, Pennsylvania. It is situated in the Lehigh Valley region of the state, approximately 10 miles north of Allentown and about 20 miles west of Easton. The community is located along the banks of the Lehigh River and is surrounded by rolling hills and farmland.
The climate in Stony Creek Mills is typical of the Lehigh Valley region. Summers are warm and humid, with temperatures reaching into the mid-80s. Winters are cold and snowy, with temperatures dropping into the low 20s.
Economy
The economy of Stony Creek Mills is largely based on the mills that are located along the banks of the Lehigh River. The sawmill, grist mill, and paper mill are all still in operation and provide employment for many of the residents. In addition, the mills provide a source of income for the local farmers, who sell their grain to the mills.
The community also has a few small businesses, including a general store, a hardware store, and a restaurant. There is also a post office located in the community.
Demographics
As of the 2010 census, the population of Stony Creek Mills was 1,093. The racial makeup of the community was 97.3% White, 0.9% African American, 0.2% Native American, 0.2% Asian, and 1.4% from other races. The median household income was $45,938, and the median family income was $51,250.
Conclusion
Stony Creek Mills is a small unincorporated community located in Northampton County, Pennsylvania. It is situated in the Lehigh Valley region of the state, approximately 10 miles north of Allentown and about 20 miles west of Easton. The community is located along the banks of the Lehigh River and is home to a variety of businesses, including a sawmill, a grist mill, and a paper mill. The economy of Stony Creek Mills is largely based on the mills that are located along the banks of the Lehigh River. The community also has a few small businesses, including a general store, a hardware store, and a restaurant. As of the 2010 census, the population of Stony Creek Mills was 1,093. The racial makeup of the community was 97.3% White, 0.9% African American, 0.2% Native American, 0.2% Asian, and 1.4% from other races. The median household income was $45,938, and the median family income was $51,250.
Common Questions
What is Per Capita Income in Stony Creek Mills?
Per Capita income in Stony Creek Mills is $21,921.
What is the Median Family Income in Stony Creek Mills?
Median Family Income in Stony Creek Mills is $54,444.
What is the Median Household income in Stony Creek Mills?
Median Household Income in Stony Creek Mills is $49,667.
What is Income or Wage Gap in Stony Creek Mills?
Income or Wage Gap in Stony Creek Mills is 37.1%.
Women in Stony Creek Mills earn 62.9 cents for every dollar earned by a man.
What is Inequality or Gini Index in Stony Creek Mills?
Inequality or Gini Index in Stony Creek Mills is 0.56.
What is the Total Population of Stony Creek Mills?
Total Population of Stony Creek Mills is 865.
What is the Total Male Population of Stony Creek Mills?
Total Male Population of Stony Creek Mills is 508.
What is the Total Female Population of Stony Creek Mills?
Total Female Population of Stony Creek Mills is 357.
What is the Ratio of Males per 100 Females in Stony Creek Mills?
There are 142.30 Males per 100 Females in Stony Creek Mills.
What is the Ratio of Females per 100 Males in Stony Creek Mills?
There are 70.28 Females per 100 Males in Stony Creek Mills.
What is the Median Population Age in Stony Creek Mills?
Median Population Age in Stony Creek Mills is 32.5 Years.
What is the Average Family Size in Stony Creek Mills
Average Family Size in Stony Creek Mills is 3.0 People.
What is the Average Household Size in Stony Creek Mills
Average Household Size in Stony Creek Mills is 2.6 People.
How Large is the Labor Force in Stony Creek Mills?
There are 419 People in the Labor Forcein in Stony Creek Mills.
What is the Percentage of People in the Labor Force in Stony Creek Mills?
70.7% of People are in the Labor Force in Stony Creek Mills.
What is the Unemployment Rate in Stony Creek Mills?
Unemployment Rate in Stony Creek Mills is 16.5%.