Oneida, PA Map & Demographics
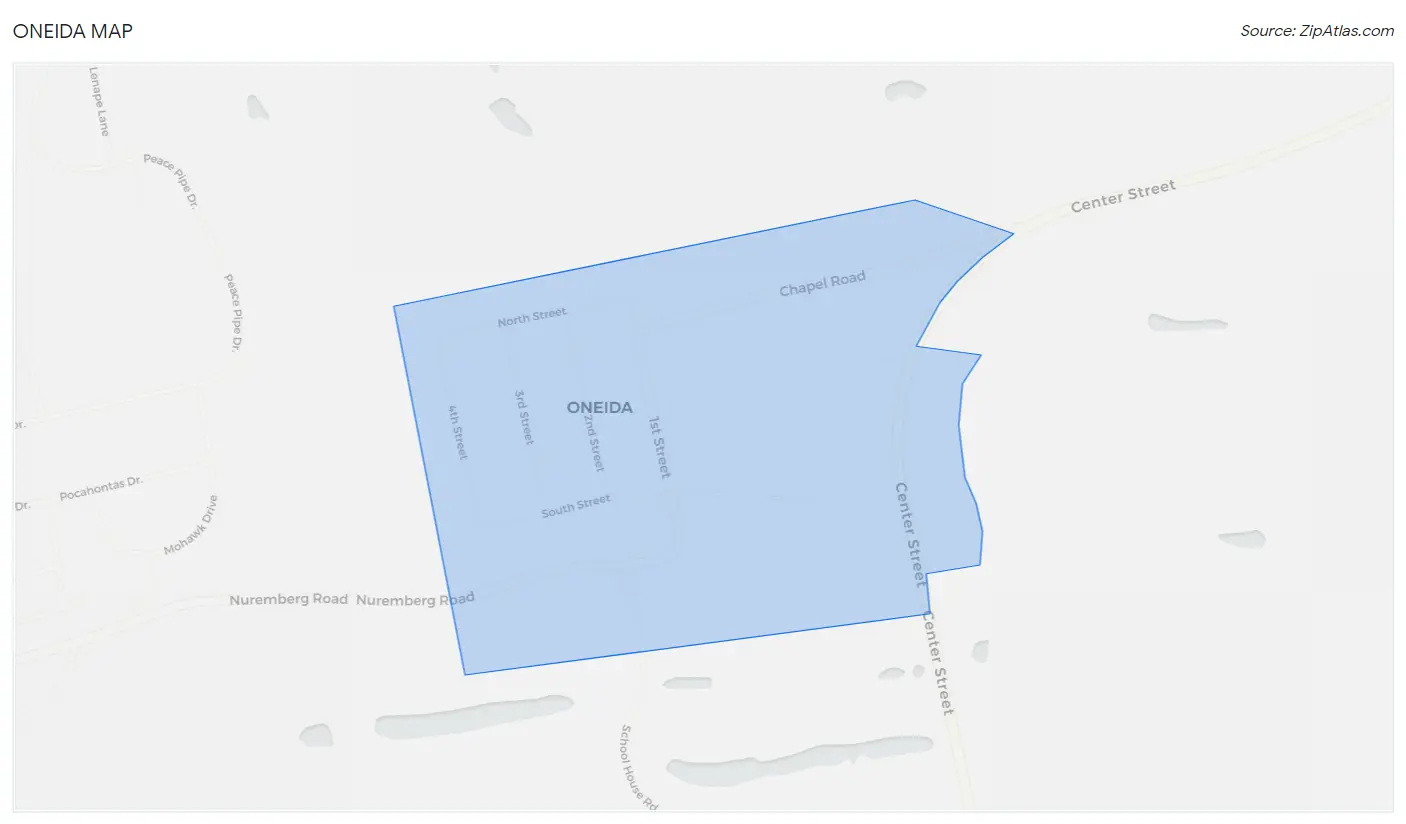
Oneida Map
Oneida Overview
$42,969
PER CAPITA INCOME
$96,092
AVG FAMILY INCOME
$153,099
AVG HOUSEHOLD INCOME
39.5%
WAGE / INCOME GAP [ % ]
60.5¢/ $1
WAGE / INCOME GAP [ $ ]
0.23
INEQUALITY / GINI INDEX
373
TOTAL POPULATION
288
MALE POPULATION
85
FEMALE POPULATION
338.82
MALES / 100 FEMALES
29.51
FEMALES / 100 MALES
36.6
MEDIAN AGE
2.0
AVG FAMILY SIZE
2.1
AVG HOUSEHOLD SIZE
220
LABOR FORCE [ PEOPLE ]
89.4%
PERCENT IN LABOR FORCE
Oneida Zip Codes
Oneida Area Codes
Income in Oneida
Income Overview in Oneida
Per Capita Income in Oneida is $42,969, while median incomes of families and households are $96,092 and $153,099 respectively.
| Characteristic | Number | Measure |
| Per Capita Income | 373 | $42,969 |
| Median Family Income | 156 | $96,092 |
| Mean Family Income | 156 | $86,796 |
| Median Household Income | 181 | $153,099 |
| Mean Household Income | 181 | $117,919 |
| Income Deficit | 156 | $0 |
| Wage / Income Gap (%) | 373 | 39.50% |
| Wage / Income Gap ($) | 373 | 60.50¢ per $1 |
| Gini / Inequality Index | 373 | 0.23 |
Earnings by Sex in Oneida
Average Earnings in Oneida are $95,189, $95,830 for men and $57,978 for women, a difference of 39.5%.
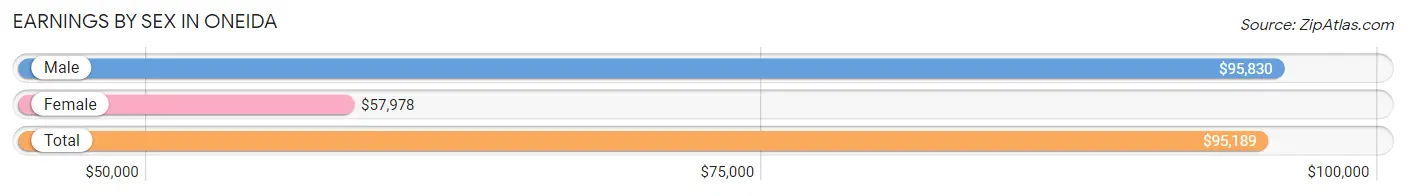
| Sex | Number | Average Earnings |
| Male | 159 (72.3%) | $95,830 |
| Female | 61 (27.7%) | $57,978 |
| Total | 220 (100.0%) | $95,189 |
Earnings by Sex by Income Bracket in Oneida
The most common earnings brackets in Oneida are $75,000 to $99,999 for men (119 | 74.8%) and $55,000 to $64,999 for women (34 | 55.7%).
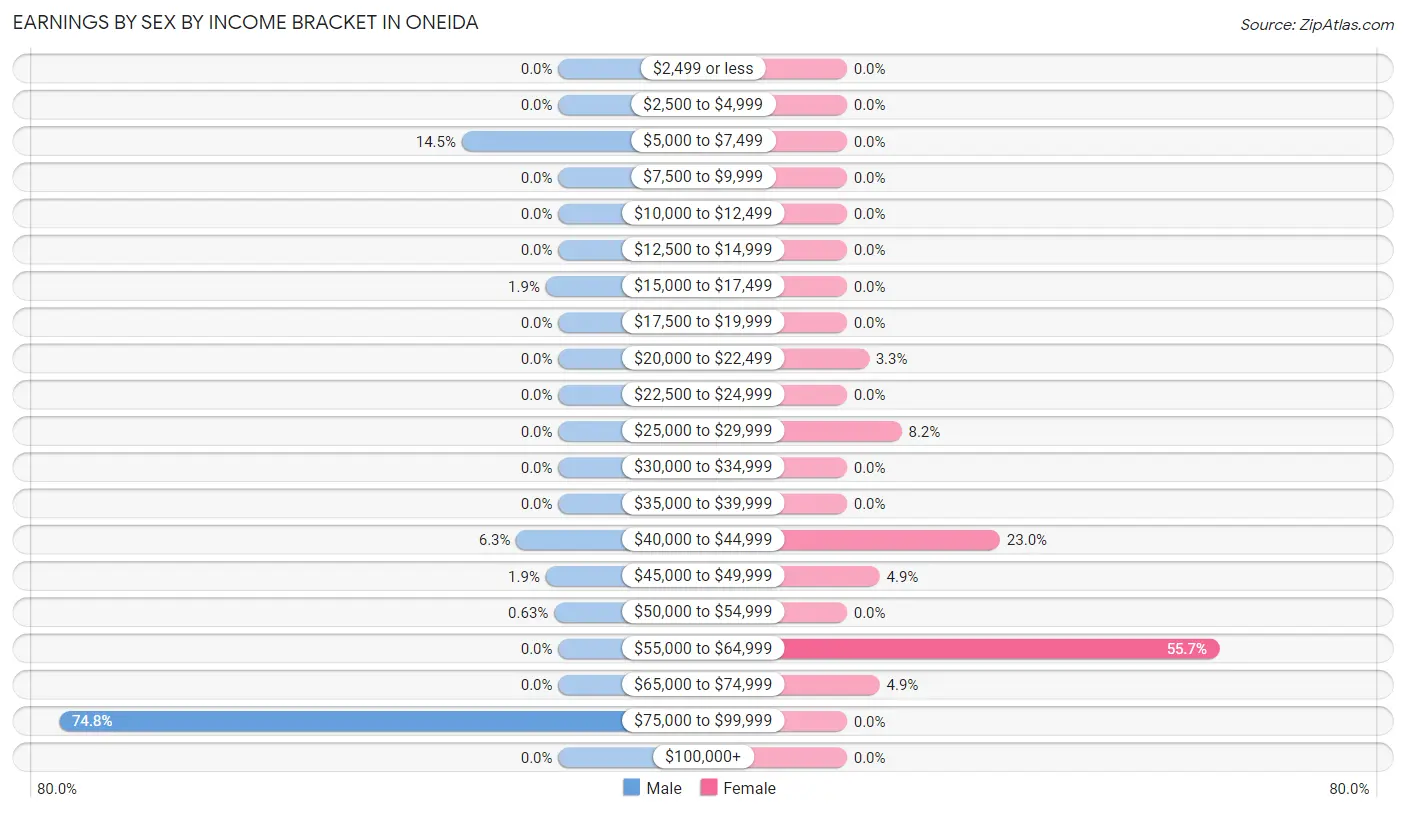
| Income | Male | Female |
| $2,499 or less | 0 (0.0%) | 0 (0.0%) |
| $2,500 to $4,999 | 0 (0.0%) | 0 (0.0%) |
| $5,000 to $7,499 | 23 (14.5%) | 0 (0.0%) |
| $7,500 to $9,999 | 0 (0.0%) | 0 (0.0%) |
| $10,000 to $12,499 | 0 (0.0%) | 0 (0.0%) |
| $12,500 to $14,999 | 0 (0.0%) | 0 (0.0%) |
| $15,000 to $17,499 | 3 (1.9%) | 0 (0.0%) |
| $17,500 to $19,999 | 0 (0.0%) | 0 (0.0%) |
| $20,000 to $22,499 | 0 (0.0%) | 2 (3.3%) |
| $22,500 to $24,999 | 0 (0.0%) | 0 (0.0%) |
| $25,000 to $29,999 | 0 (0.0%) | 5 (8.2%) |
| $30,000 to $34,999 | 0 (0.0%) | 0 (0.0%) |
| $35,000 to $39,999 | 0 (0.0%) | 0 (0.0%) |
| $40,000 to $44,999 | 10 (6.3%) | 14 (23.0%) |
| $45,000 to $49,999 | 3 (1.9%) | 3 (4.9%) |
| $50,000 to $54,999 | 1 (0.6%) | 0 (0.0%) |
| $55,000 to $64,999 | 0 (0.0%) | 34 (55.7%) |
| $65,000 to $74,999 | 0 (0.0%) | 3 (4.9%) |
| $75,000 to $99,999 | 119 (74.8%) | 0 (0.0%) |
| $100,000+ | 0 (0.0%) | 0 (0.0%) |
| Total | 159 (100.0%) | 61 (100.0%) |
Earnings by Sex by Educational Attainment in Oneida
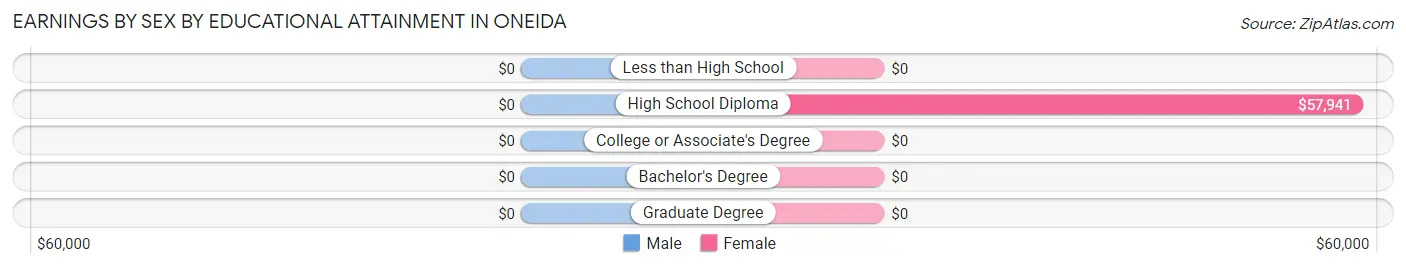
| Educational Attainment | Male Income | Female Income |
| Less than High School | - | - |
| High School Diploma | - | - |
| College or Associate's Degree | - | - |
| Bachelor's Degree | - | - |
| Graduate Degree | - | - |
| Total | $95,830 | $57,978 |
Family Income in Oneida
Family Income Brackets in Oneida
According to the Oneida family income data, there are 119 families falling into the $75,000 to $99,999 income range, which is the most common income bracket and makes up 76.3% of all families.
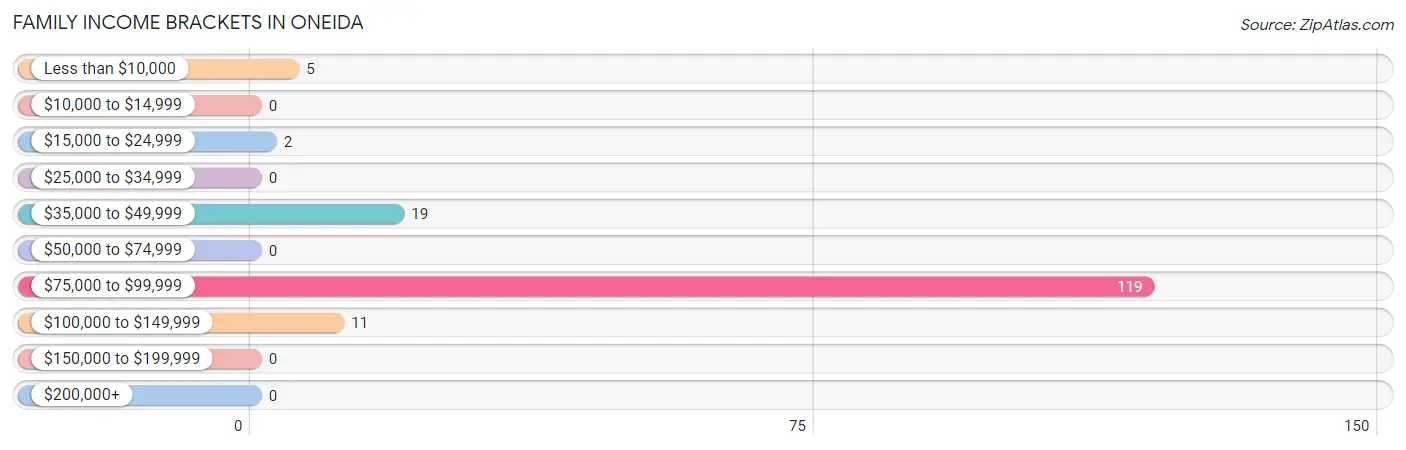
| Income Bracket | # Families | % Families |
| Less than $10,000 | 5 | 3.2% |
| $10,000 to $14,999 | 0 | 0.0% |
| $15,000 to $24,999 | 2 | 1.3% |
| $25,000 to $34,999 | 0 | 0.0% |
| $35,000 to $49,999 | 19 | 12.2% |
| $50,000 to $74,999 | 0 | 0.0% |
| $75,000 to $99,999 | 119 | 76.3% |
| $100,000 to $149,999 | 11 | 7.1% |
| $150,000 to $199,999 | 0 | 0.0% |
| $200,000+ | 0 | 0.0% |
Family Income by Famaliy Size in Oneida
2-person families (32 | 20.5%) account for the highest median family income in Oneida with $41,607 per family, while 2-person families (32 | 20.5%) have the highest median income of $20,804 per family member.
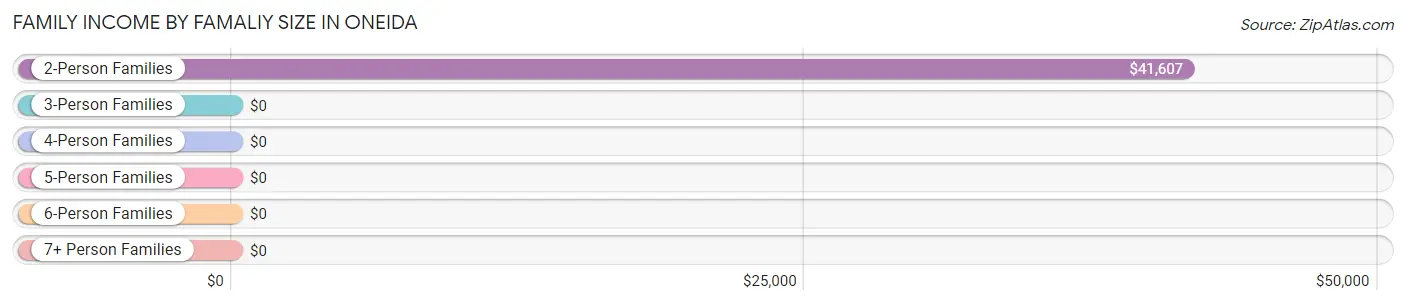
| Income Bracket | # Families | Median Income |
| 2-Person Families | 32 (20.5%) | $41,607 |
| 3-Person Families | 119 (76.3%) | $0 |
| 4-Person Families | 0 (0.0%) | $0 |
| 5-Person Families | 5 (3.2%) | $0 |
| 6-Person Families | 0 (0.0%) | $0 |
| 7+ Person Families | 0 (0.0%) | $0 |
| Total | 156 (100.0%) | $96,092 |
Family Income by Number of Earners in Oneida
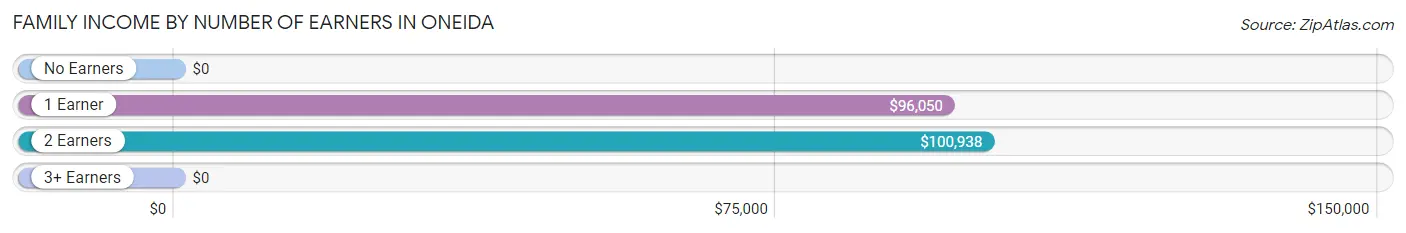
| Number of Earners | # Families | Median Income |
| No Earners | 2 (1.3%) | $0 |
| 1 Earner | 138 (88.5%) | $96,050 |
| 2 Earners | 16 (10.3%) | $100,938 |
| 3+ Earners | 0 (0.0%) | $0 |
| Total | 156 (100.0%) | $96,092 |
Household Income in Oneida
Household Income Brackets in Oneida
With 119 households falling in the category, the $150,000 to $199,999 income range is the most frequent in Oneida, accounting for 65.7% of all households.
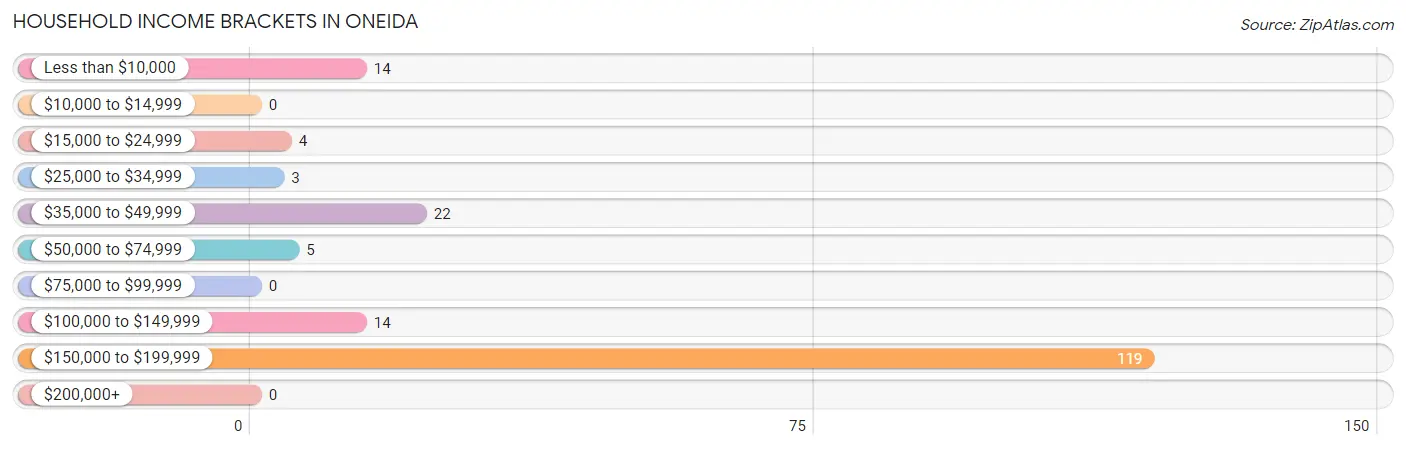
| Income Bracket | # Households | % Households |
| Less than $10,000 | 14 | 7.7% |
| $10,000 to $14,999 | 0 | 0.0% |
| $15,000 to $24,999 | 4 | 2.2% |
| $25,000 to $34,999 | 3 | 1.7% |
| $35,000 to $49,999 | 22 | 12.2% |
| $50,000 to $74,999 | 5 | 2.8% |
| $75,000 to $99,999 | 0 | 0.0% |
| $100,000 to $149,999 | 14 | 7.7% |
| $150,000 to $199,999 | 119 | 65.7% |
| $200,000+ | 0 | 0.0% |
Household Income by Householder Age in Oneida
The median household income in Oneida is $153,099, with the highest median household income of $153,540 found in the 25 to 44 years age bracket for the primary householder. A total of 139 households (76.8%) fall into this category.
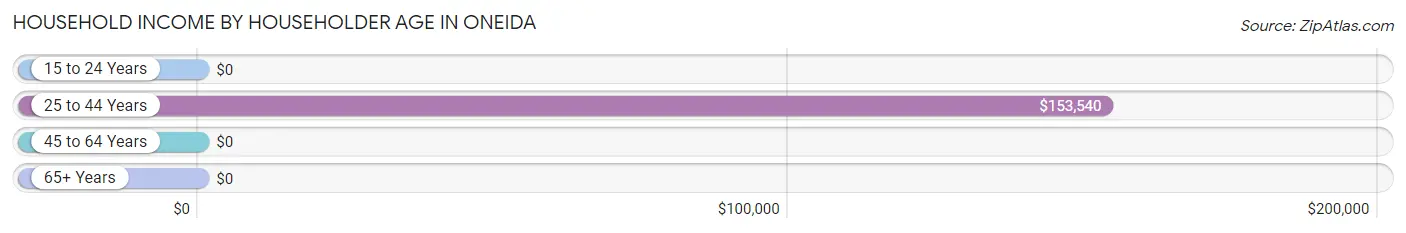
| Income Bracket | # Households | Median Income |
| 15 to 24 Years | 0 (0.0%) | $0 |
| 25 to 44 Years | 139 (76.8%) | $153,540 |
| 45 to 64 Years | 32 (17.7%) | $0 |
| 65+ Years | 10 (5.5%) | $0 |
| Total | 181 (100.0%) | $153,099 |
Poverty in Oneida
Income Below Poverty by Sex and Age in Oneida
With 7.6% poverty level for males and 5.9% for females among the residents of Oneida, 45 to 54 year old males and 65 to 74 year old females are the most vulnerable to poverty, with 9 males (100.0%) and 5 females (71.4%) in their respective age groups living below the poverty level.
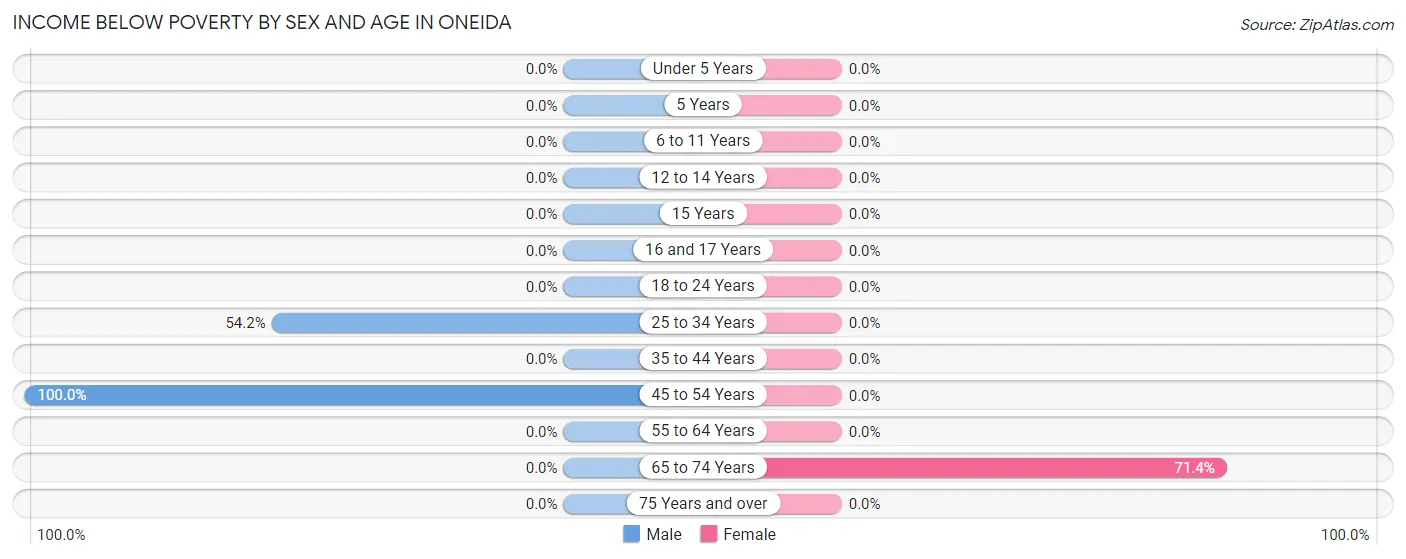
| Age Bracket | Male | Female |
| Under 5 Years | 0 (0.0%) | 0 (0.0%) |
| 5 Years | 0 (0.0%) | 0 (0.0%) |
| 6 to 11 Years | 0 (0.0%) | 0 (0.0%) |
| 12 to 14 Years | 0 (0.0%) | 0 (0.0%) |
| 15 Years | 0 (0.0%) | 0 (0.0%) |
| 16 and 17 Years | 0 (0.0%) | 0 (0.0%) |
| 18 to 24 Years | 0 (0.0%) | 0 (0.0%) |
| 25 to 34 Years | 13 (54.2%) | 0 (0.0%) |
| 35 to 44 Years | 0 (0.0%) | 0 (0.0%) |
| 45 to 54 Years | 9 (100.0%) | 0 (0.0%) |
| 55 to 64 Years | 0 (0.0%) | 0 (0.0%) |
| 65 to 74 Years | 0 (0.0%) | 5 (71.4%) |
| 75 Years and over | 0 (0.0%) | 0 (0.0%) |
| Total | 22 (7.6%) | 5 (5.9%) |
Income Above Poverty by Sex and Age in Oneida
According to the poverty statistics in Oneida, males aged under 5 years and females aged 5 years are the age groups that are most secure financially, with 100.0% of males and 100.0% of females in these age groups living above the poverty line.
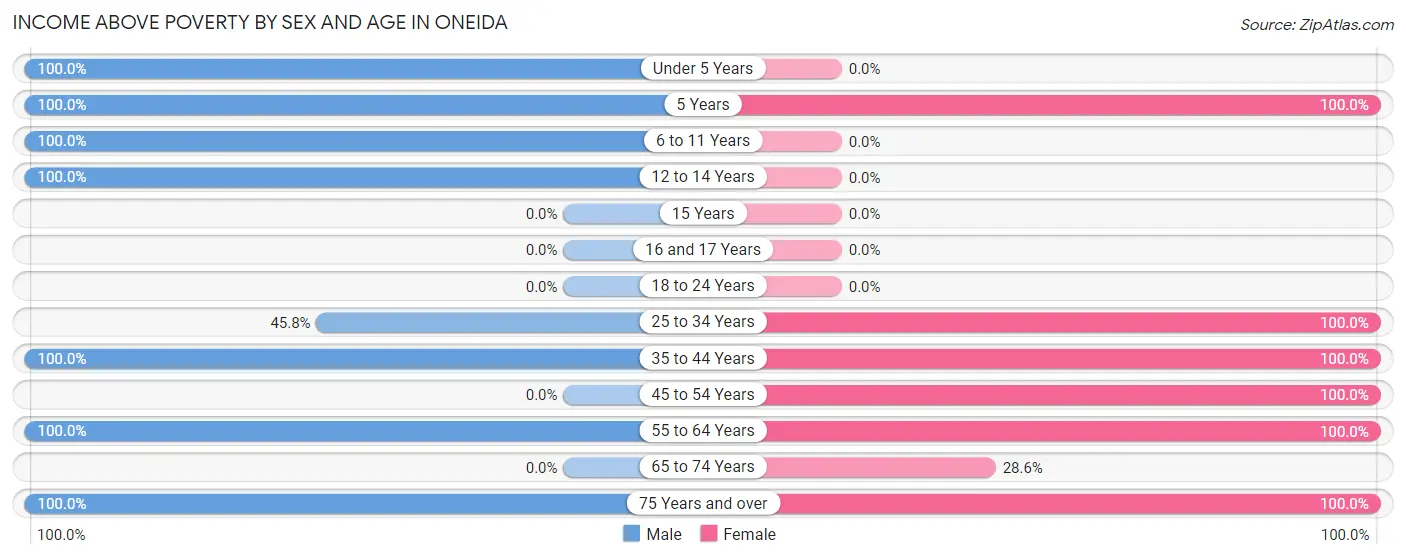
| Age Bracket | Male | Female |
| Under 5 Years | 29 (100.0%) | 0 (0.0%) |
| 5 Years | 52 (100.0%) | 10 (100.0%) |
| 6 to 11 Years | 29 (100.0%) | 0 (0.0%) |
| 12 to 14 Years | 7 (100.0%) | 0 (0.0%) |
| 15 Years | 0 (0.0%) | 0 (0.0%) |
| 16 and 17 Years | 0 (0.0%) | 0 (0.0%) |
| 18 to 24 Years | 0 (0.0%) | 0 (0.0%) |
| 25 to 34 Years | 11 (45.8%) | 19 (100.0%) |
| 35 to 44 Years | 122 (100.0%) | 26 (100.0%) |
| 45 to 54 Years | 0 (0.0%) | 8 (100.0%) |
| 55 to 64 Years | 13 (100.0%) | 12 (100.0%) |
| 65 to 74 Years | 0 (0.0%) | 2 (28.6%) |
| 75 Years and over | 3 (100.0%) | 3 (100.0%) |
| Total | 266 (92.4%) | 80 (94.1%) |
Income Below Poverty Among Married-Couple Families in Oneida
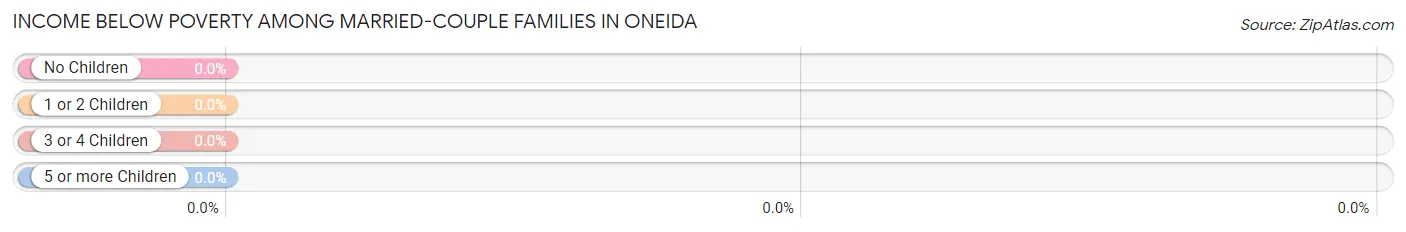
| Children | Above Poverty | Below Poverty |
| No Children | 13 (100.0%) | 0 (0.0%) |
| 1 or 2 Children | 0 (0.0%) | 0 (0.0%) |
| 3 or 4 Children | 0 (0.0%) | 0 (0.0%) |
| 5 or more Children | 0 (0.0%) | 0 (0.0%) |
| Total | 13 (100.0%) | 0 (0.0%) |
Income Below Poverty Among Single-Parent Households in Oneida
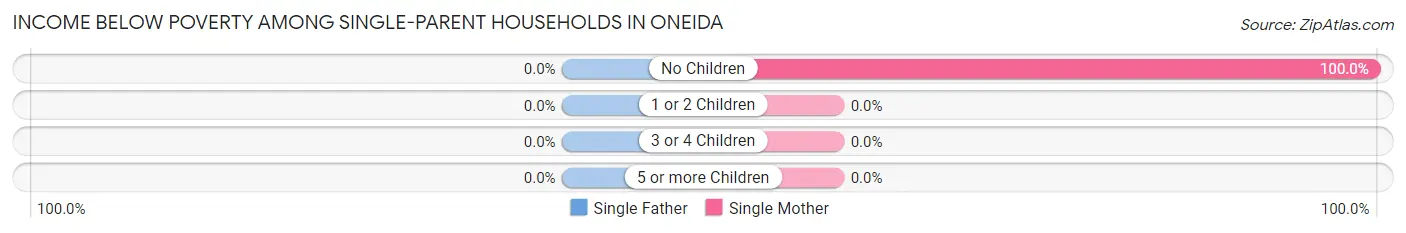
| Children | Single Father | Single Mother |
| No Children | 0 (0.0%) | 5 (100.0%) |
| 1 or 2 Children | 0 (0.0%) | 0 (0.0%) |
| 3 or 4 Children | 0 (0.0%) | 0 (0.0%) |
| 5 or more Children | 0 (0.0%) | 0 (0.0%) |
| Total | 0 (0.0%) | 5 (20.8%) |
Income Below Poverty Among Married-Couple vs Single-Parent Households in Oneida
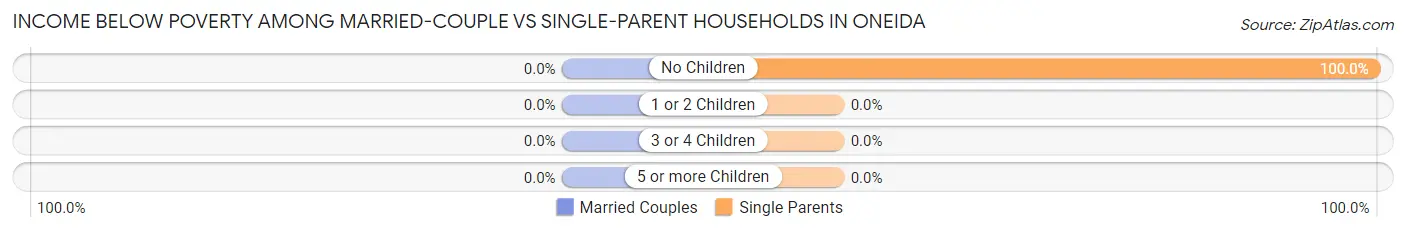
| Children | Married-Couple Families | Single-Parent Households |
| No Children | 0 (0.0%) | 5 (100.0%) |
| 1 or 2 Children | 0 (0.0%) | 0 (0.0%) |
| 3 or 4 Children | 0 (0.0%) | 0 (0.0%) |
| 5 or more Children | 0 (0.0%) | 0 (0.0%) |
| Total | 0 (0.0%) | 5 (3.5%) |
Race in Oneida
The most populous races in Oneida are White / Caucasian (202 | 54.2%), Hispanic or Latino (187 | 50.1%), and Two or more Races (171 | 45.8%).
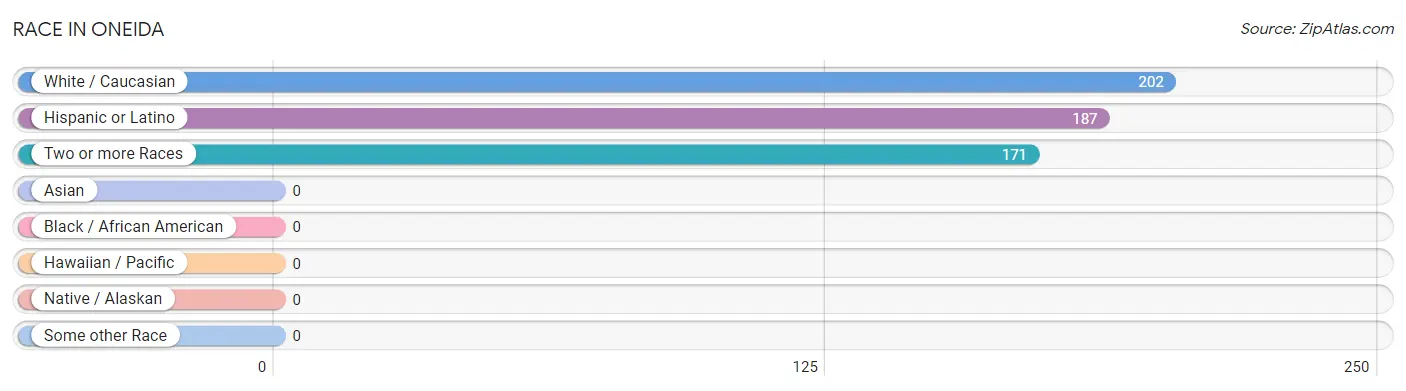
| Race | # Population | % Population |
| Asian | 0 | 0.0% |
| Black / African American | 0 | 0.0% |
| Hawaiian / Pacific | 0 | 0.0% |
| Hispanic or Latino | 187 | 50.1% |
| Native / Alaskan | 0 | 0.0% |
| White / Caucasian | 202 | 54.2% |
| Two or more Races | 171 | 45.8% |
| Some other Race | 0 | 0.0% |
| Total | 373 | 100.0% |
Ancestry in Oneida
The most populous ancestries reported in Oneida are Irish (187 | 50.1%), Puerto Rican (173 | 46.4%), German (72 | 19.3%), English (55 | 14.7%), and Italian (54 | 14.5%), together accounting for 145.0% of all Oneida residents.
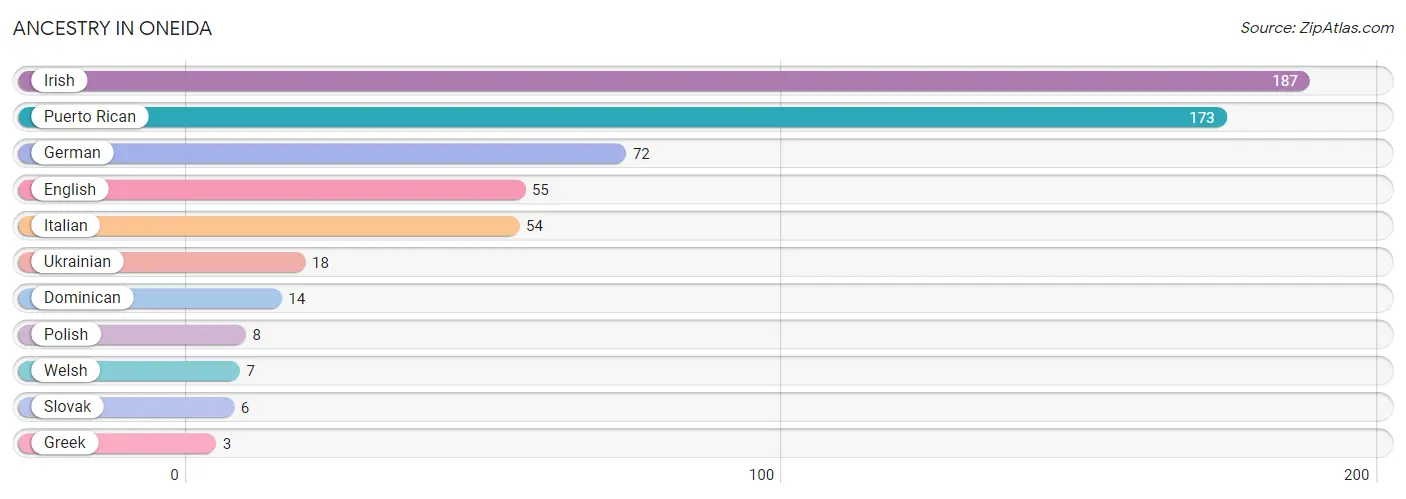
| Ancestry | # Population | % Population |
| Dominican | 14 | 3.7% |
| English | 55 | 14.7% |
| German | 72 | 19.3% |
| Greek | 3 | 0.8% |
| Irish | 187 | 50.1% |
| Italian | 54 | 14.5% |
| Polish | 8 | 2.1% |
| Puerto Rican | 173 | 46.4% |
| Slovak | 6 | 1.6% |
| Ukrainian | 18 | 4.8% |
| Welsh | 7 | 1.9% | View All 11 Rows |
Immigrants in Oneida
The most numerous immigrant groups reported in Oneida came from Caribbean (14 | 3.7%), Dominican Republic (14 | 3.7%), and Latin America (14 | 3.7%), together accounting for 11.2% of all Oneida residents.
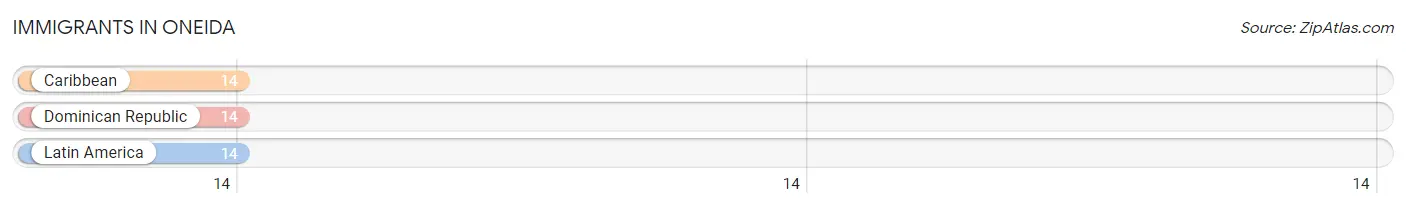
| Immigration Origin | # Population | % Population |
| Caribbean | 14 | 3.7% |
| Dominican Republic | 14 | 3.7% |
| Latin America | 14 | 3.7% | View All 3 Rows |
Sex and Age in Oneida
Sex and Age in Oneida
The most populous age groups in Oneida are 35 to 39 Years (119 | 41.3%) for men and 35 to 39 Years (26 | 30.6%) for women.
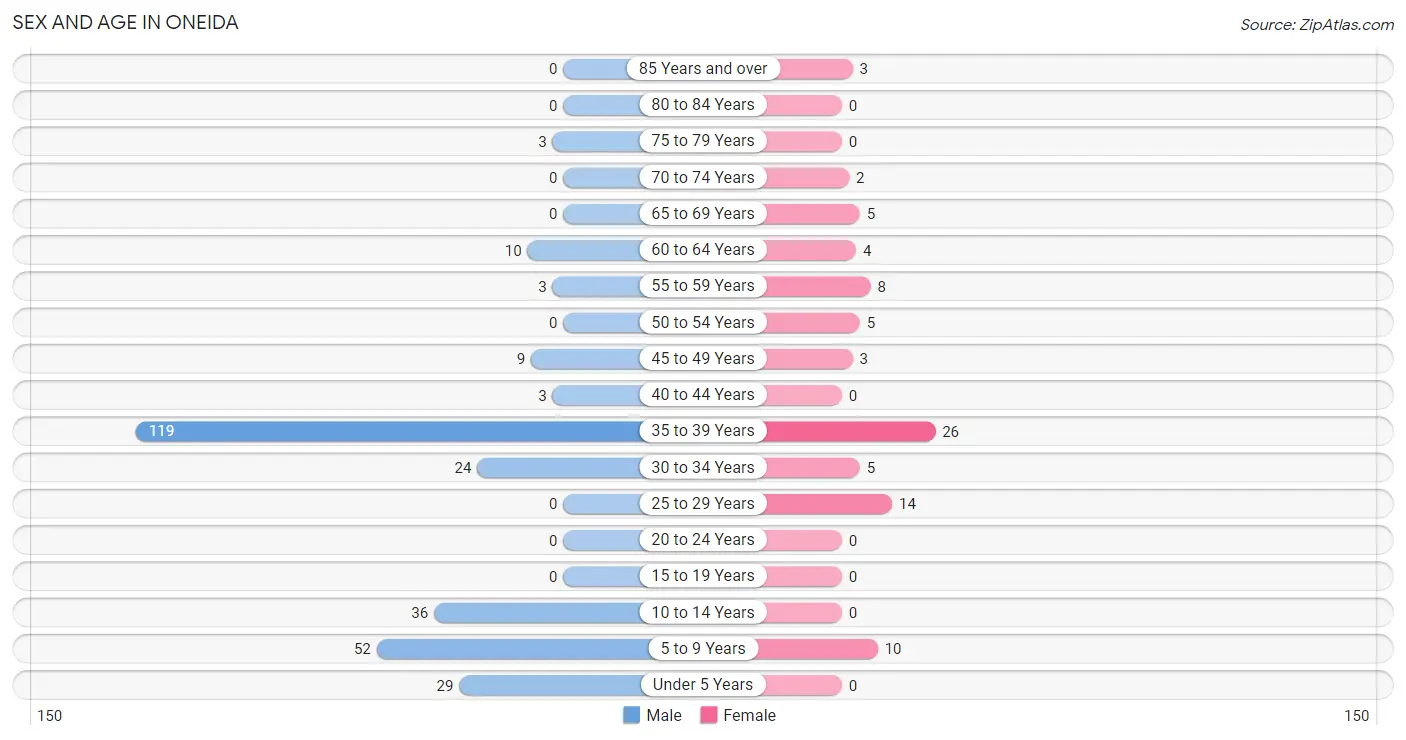
| Age Bracket | Male | Female |
| Under 5 Years | 29 (10.1%) | 0 (0.0%) |
| 5 to 9 Years | 52 (18.1%) | 10 (11.8%) |
| 10 to 14 Years | 36 (12.5%) | 0 (0.0%) |
| 15 to 19 Years | 0 (0.0%) | 0 (0.0%) |
| 20 to 24 Years | 0 (0.0%) | 0 (0.0%) |
| 25 to 29 Years | 0 (0.0%) | 14 (16.5%) |
| 30 to 34 Years | 24 (8.3%) | 5 (5.9%) |
| 35 to 39 Years | 119 (41.3%) | 26 (30.6%) |
| 40 to 44 Years | 3 (1.0%) | 0 (0.0%) |
| 45 to 49 Years | 9 (3.1%) | 3 (3.5%) |
| 50 to 54 Years | 0 (0.0%) | 5 (5.9%) |
| 55 to 59 Years | 3 (1.0%) | 8 (9.4%) |
| 60 to 64 Years | 10 (3.5%) | 4 (4.7%) |
| 65 to 69 Years | 0 (0.0%) | 5 (5.9%) |
| 70 to 74 Years | 0 (0.0%) | 2 (2.4%) |
| 75 to 79 Years | 3 (1.0%) | 0 (0.0%) |
| 80 to 84 Years | 0 (0.0%) | 0 (0.0%) |
| 85 Years and over | 0 (0.0%) | 3 (3.5%) |
| Total | 288 (100.0%) | 85 (100.0%) |
Families and Households in Oneida
Median Family Size in Oneida
The median family size in Oneida is 2.04 persons per family, with single female/mother families (24 | 15.4%) accounting for the largest median family size of 3.88 persons per family. On the other hand, single male/father families (119 | 76.3%) represent the smallest median family size with 1.68 persons per family.
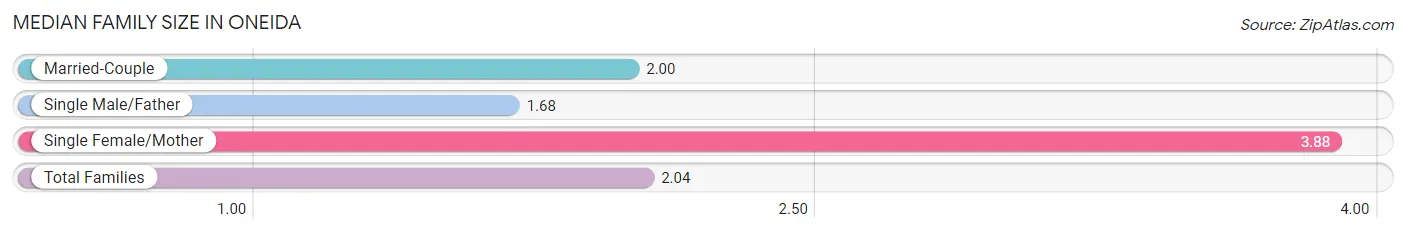
| Family Type | # Families | Family Size |
| Married-Couple | 13 (8.3%) | 2.00 |
| Single Male/Father | 119 (76.3%) | 1.68 |
| Single Female/Mother | 24 (15.4%) | 3.88 |
| Total Families | 156 (100.0%) | 2.04 |
Median Household Size in Oneida
The median household size in Oneida is 2.06 persons per household, with single female/mother households (24 | 13.3%) accounting for the largest median household size of 3.88 persons per household. non-family households (25 | 13.8%) represent the smallest median household size with 1.12 persons per household.
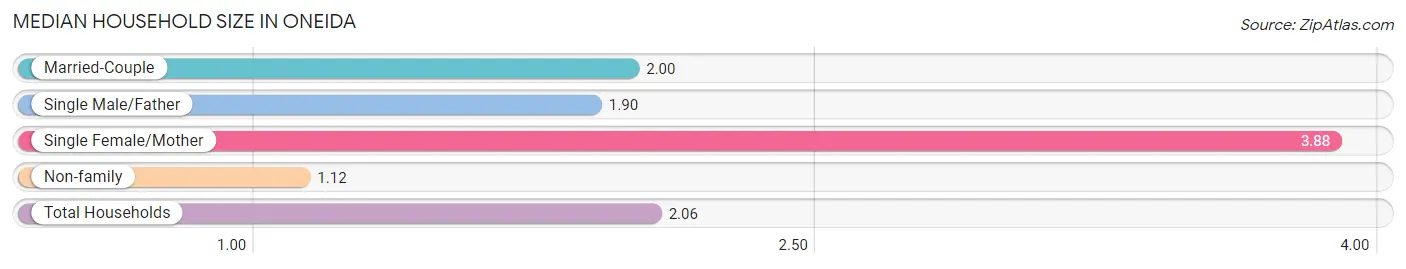
| Household Type | # Households | Household Size |
| Married-Couple | 13 (7.2%) | 2.00 |
| Single Male/Father | 119 (65.7%) | 1.90 |
| Single Female/Mother | 24 (13.3%) | 3.88 |
| Non-family | 25 (13.8%) | 1.12 |
| Total Households | 181 (100.0%) | 2.06 |
Household Size by Marriage Status in Oneida
Out of a total of 181 households in Oneida, 156 (86.2%) are family households, while 25 (13.8%) are nonfamily households. The most numerous type of family households are 4-person households, comprising 119, and the most common type of nonfamily households are 1-person households, comprising 22.
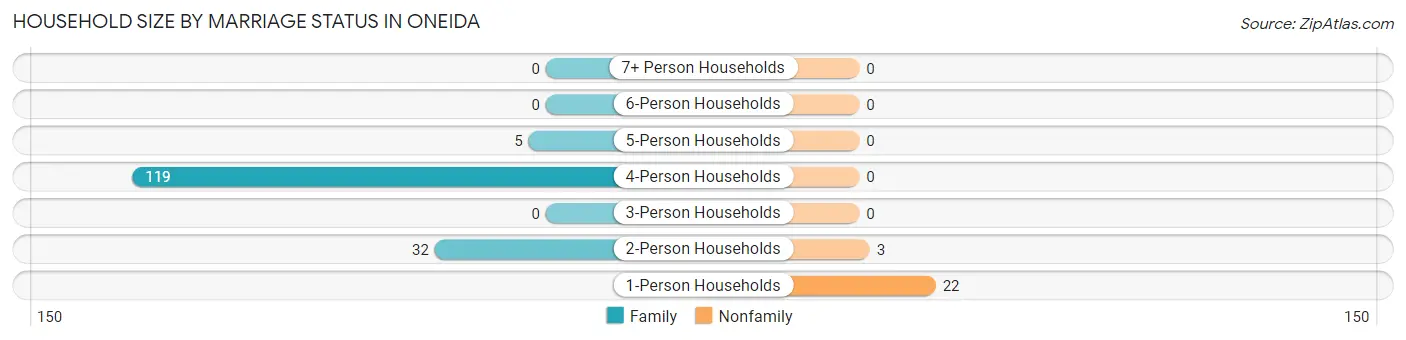
| Household Size | Family Households | Nonfamily Households |
| 1-Person Households | - | 22 (12.1%) |
| 2-Person Households | 32 (17.7%) | 3 (1.7%) |
| 3-Person Households | 0 (0.0%) | 0 (0.0%) |
| 4-Person Households | 119 (65.7%) | 0 (0.0%) |
| 5-Person Households | 5 (2.8%) | 0 (0.0%) |
| 6-Person Households | 0 (0.0%) | 0 (0.0%) |
| 7+ Person Households | 0 (0.0%) | 0 (0.0%) |
| Total | 156 (86.2%) | 25 (13.8%) |
Female Fertility in Oneida
Fertility by Age in Oneida
Average fertility rate in Oneida is 292.0 births per 1,000 women. Women in the age bracket of 20 to 34 years have the highest fertility rate with 737.0 births per 1,000 women. Women in the age bracket of 20 to 34 years acount for 100.0% of all women with births.
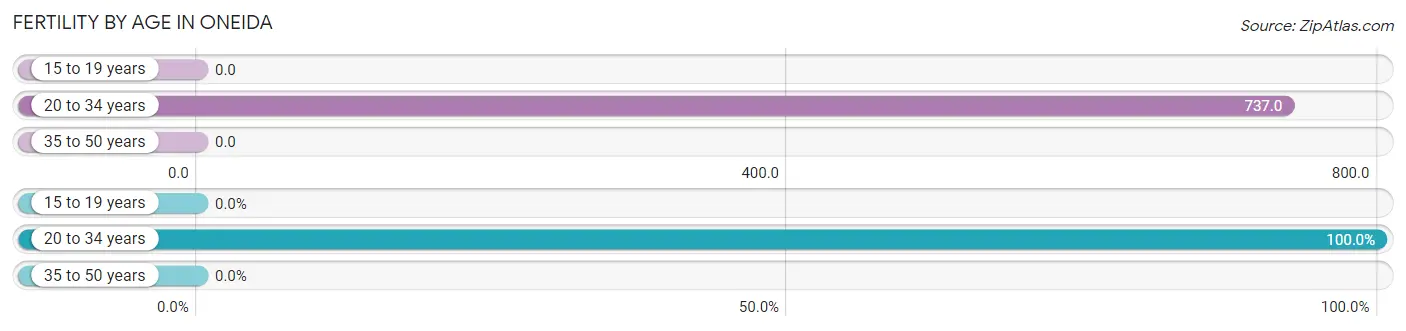
| Age Bracket | Women with Births | Births / 1,000 Women |
| 15 to 19 years | 0 (0.0%) | 0.0 |
| 20 to 34 years | 14 (100.0%) | 737.0 |
| 35 to 50 years | 0 (0.0%) | 0.0 |
| Total | 14 (100.0%) | 292.0 |
Fertility by Age by Marriage Status in Oneida
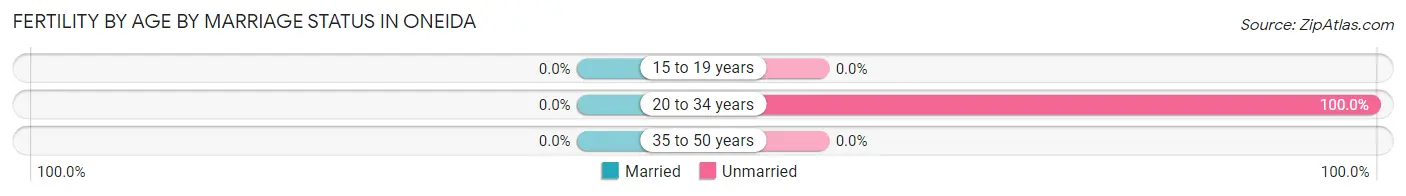
| Age Bracket | Married | Unmarried |
| 15 to 19 years | 0 (0.0%) | 0 (0.0%) |
| 20 to 34 years | 0 (0.0%) | 14 (100.0%) |
| 35 to 50 years | 0 (0.0%) | 0 (0.0%) |
| Total | 0 (0.0%) | 14 (100.0%) |
Fertility by Education in Oneida
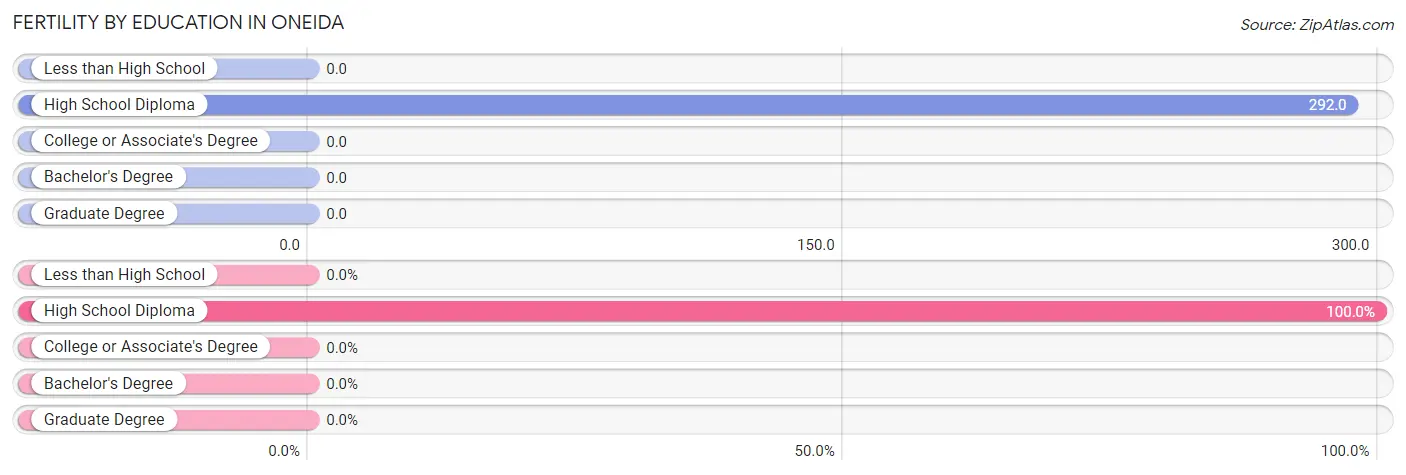
| Educational Attainment | Women with Births | Births / 1,000 Women |
| Less than High School | 0 (0.0%) | 0.0 |
| High School Diploma | 14 (100.0%) | 292.0 |
| College or Associate's Degree | 0 (0.0%) | 0.0 |
| Bachelor's Degree | 0 (0.0%) | 0.0 |
| Graduate Degree | 0 (0.0%) | 0.0 |
| Total | 14 (100.0%) | 292.0 |
Fertility by Education by Marriage Status in Oneida
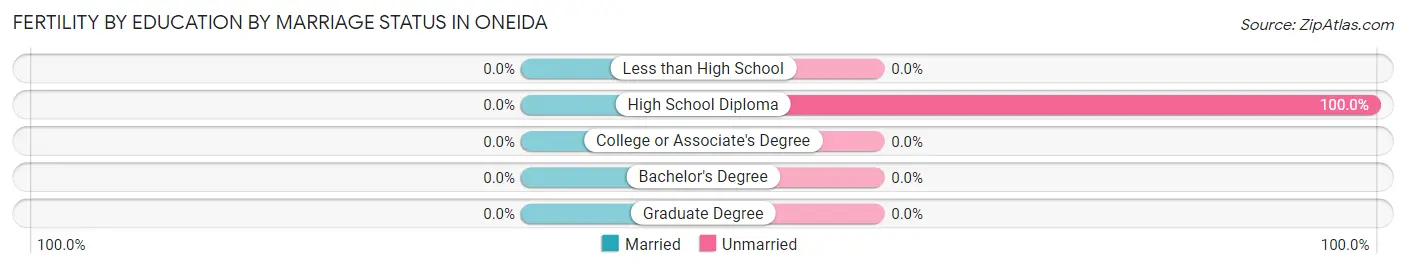
| Educational Attainment | Married | Unmarried |
| Less than High School | 0 (0.0%) | 0 (0.0%) |
| High School Diploma | 0 (0.0%) | 14 (100.0%) |
| College or Associate's Degree | 0 (0.0%) | 0 (0.0%) |
| Bachelor's Degree | 0 (0.0%) | 0 (0.0%) |
| Graduate Degree | 0 (0.0%) | 0 (0.0%) |
| Total | 0 (0.0%) | 14 (100.0%) |
Employment Characteristics in Oneida
Employment by Class of Employer in Oneida
Among the 197 employed individuals in Oneida, , and private company employees (197 | 100.0%) make up the most common classes of employment.
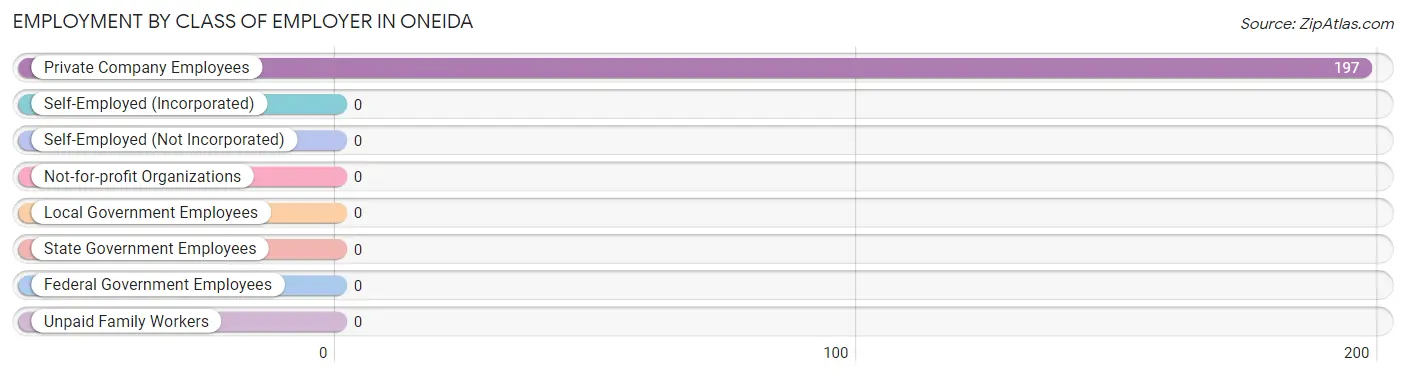
| Employer Class | # Employees | % Employees |
| Private Company Employees | 197 | 100.0% |
| Self-Employed (Incorporated) | 0 | 0.0% |
| Self-Employed (Not Incorporated) | 0 | 0.0% |
| Not-for-profit Organizations | 0 | 0.0% |
| Local Government Employees | 0 | 0.0% |
| State Government Employees | 0 | 0.0% |
| Federal Government Employees | 0 | 0.0% |
| Unpaid Family Workers | 0 | 0.0% |
| Total | 197 | 100.0% |
Employment Status by Age in Oneida
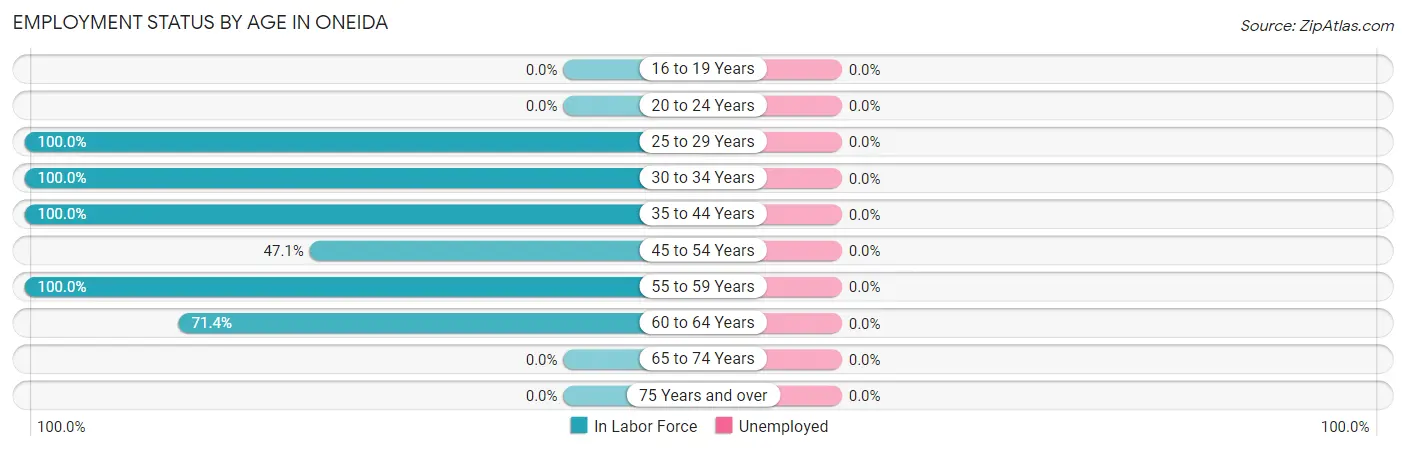
| Age Bracket | In Labor Force | Unemployed |
| 16 to 19 Years | 0 (0.0%) | 0 (0.0%) |
| 20 to 24 Years | 0 (0.0%) | 0 (0.0%) |
| 25 to 29 Years | 14 (100.0%) | 0 (0.0%) |
| 30 to 34 Years | 29 (100.0%) | 0 (0.0%) |
| 35 to 44 Years | 148 (100.0%) | 0 (0.0%) |
| 45 to 54 Years | 8 (47.1%) | 0 (0.0%) |
| 55 to 59 Years | 11 (100.0%) | 0 (0.0%) |
| 60 to 64 Years | 10 (71.4%) | 0 (0.0%) |
| 65 to 74 Years | 0 (0.0%) | 0 (0.0%) |
| 75 Years and over | 0 (0.0%) | 0 (0.0%) |
| Total | 220 (89.4%) | 0 (0.0%) |
Employment Status by Educational Attainment in Oneida
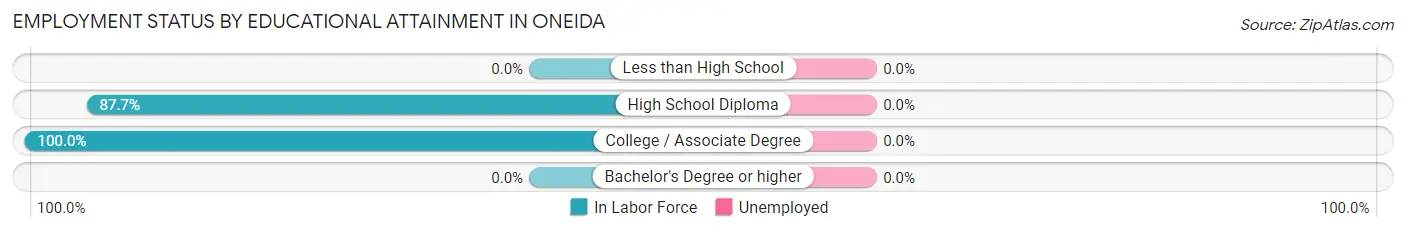
| Educational Attainment | In Labor Force | Unemployed |
| Less than High School | 0 (0.0%) | 0 (0.0%) |
| High School Diploma | 93 (87.7%) | 0 (0.0%) |
| College / Associate Degree | 127 (100.0%) | 0 (0.0%) |
| Bachelor's Degree or higher | 0 (0.0%) | 0 (0.0%) |
| Total | 220 (94.4%) | 0 (0.0%) |
Employment Occupations by Sex in Oneida
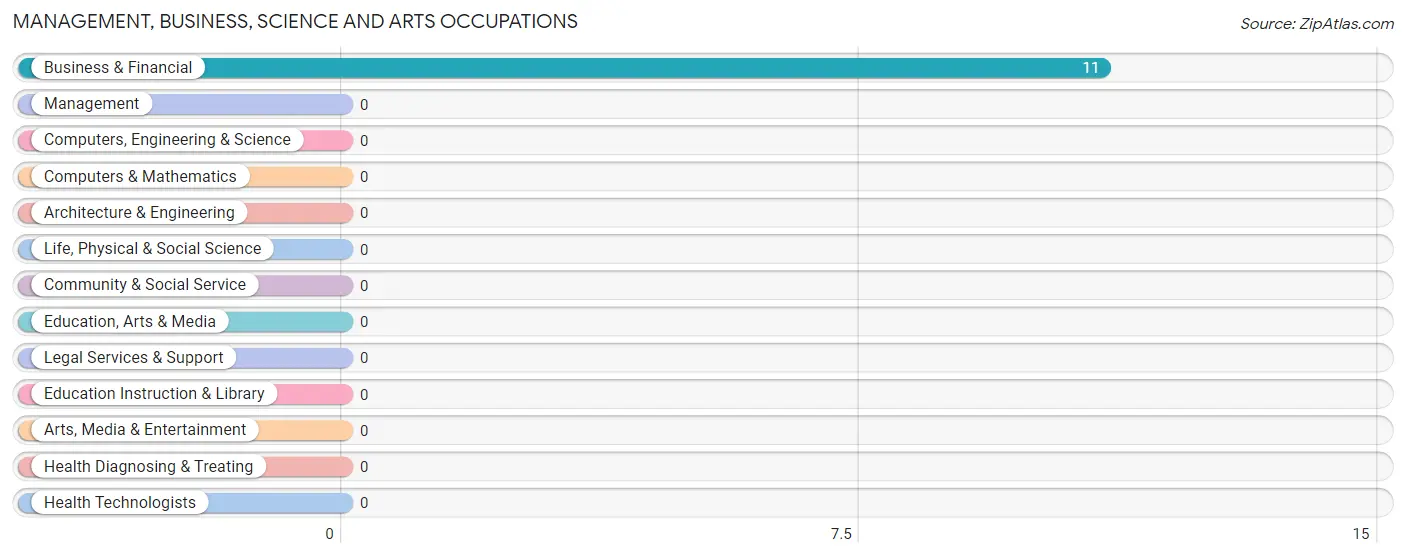
Management, Business, Science and Arts Occupations
The most common Management, Business, Science and Arts occupations in Oneida are , and Business & Financial (11 | 5.0%).
Management, Business, Science and Arts Occupations by Sex
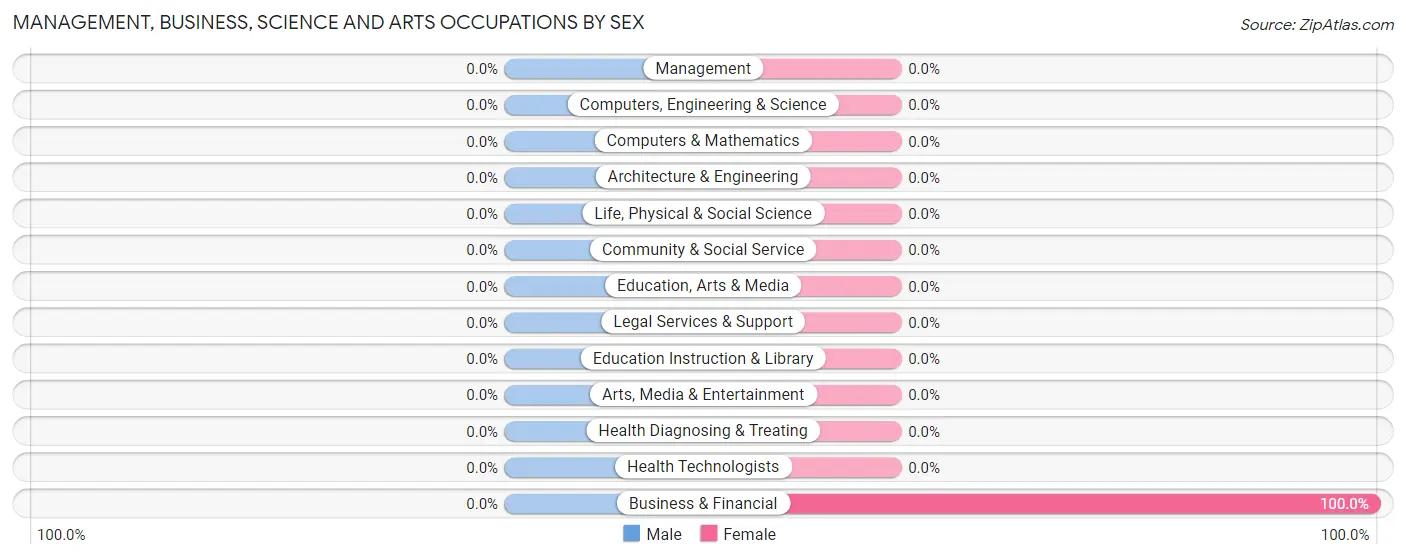
| Occupation | Male | Female |
| Management | 0 (0.0%) | 0 (0.0%) |
| Business & Financial | 0 (0.0%) | 11 (100.0%) |
| Computers, Engineering & Science | 0 (0.0%) | 0 (0.0%) |
| Computers & Mathematics | 0 (0.0%) | 0 (0.0%) |
| Architecture & Engineering | 0 (0.0%) | 0 (0.0%) |
| Life, Physical & Social Science | 0 (0.0%) | 0 (0.0%) |
| Community & Social Service | 0 (0.0%) | 0 (0.0%) |
| Education, Arts & Media | 0 (0.0%) | 0 (0.0%) |
| Legal Services & Support | 0 (0.0%) | 0 (0.0%) |
| Education Instruction & Library | 0 (0.0%) | 0 (0.0%) |
| Arts, Media & Entertainment | 0 (0.0%) | 0 (0.0%) |
| Health Diagnosing & Treating | 0 (0.0%) | 0 (0.0%) |
| Health Technologists | 0 (0.0%) | 0 (0.0%) |
| Total (Category) | 0 (0.0%) | 11 (100.0%) |
| Total (Overall) | 159 (72.3%) | 61 (27.7%) |
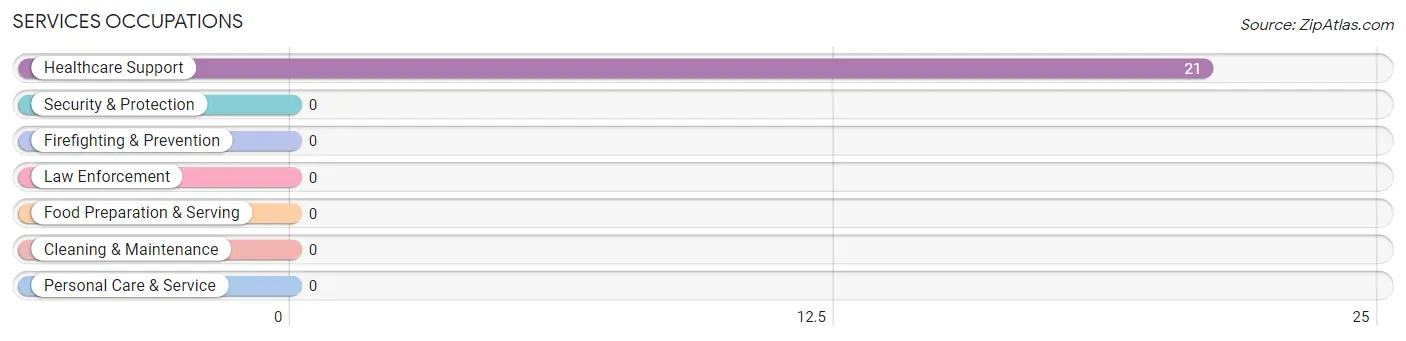
Services Occupations
The most common Services occupations in Oneida are , and Healthcare Support (21 | 9.6%).
Services Occupations by Sex
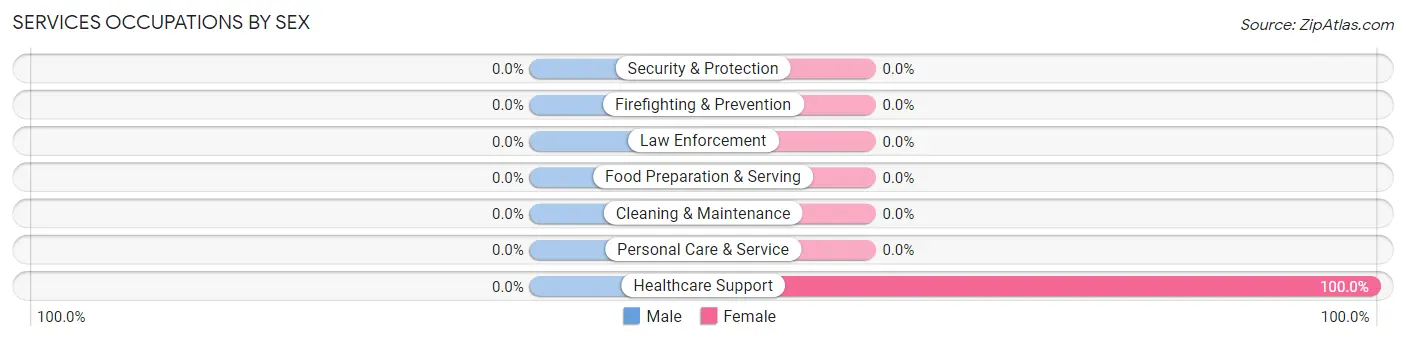
| Occupation | Male | Female |
| Healthcare Support | 0 (0.0%) | 21 (100.0%) |
| Security & Protection | 0 (0.0%) | 0 (0.0%) |
| Firefighting & Prevention | 0 (0.0%) | 0 (0.0%) |
| Law Enforcement | 0 (0.0%) | 0 (0.0%) |
| Food Preparation & Serving | 0 (0.0%) | 0 (0.0%) |
| Cleaning & Maintenance | 0 (0.0%) | 0 (0.0%) |
| Personal Care & Service | 0 (0.0%) | 0 (0.0%) |
| Total (Category) | 0 (0.0%) | 21 (100.0%) |
| Total (Overall) | 159 (72.3%) | 61 (27.7%) |
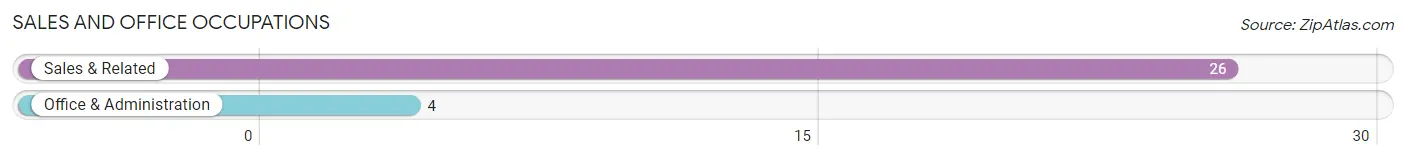
Sales and Office Occupations
The most common Sales and Office occupations in Oneida are Sales & Related (26 | 11.8%), and Office & Administration (4 | 1.8%).
Sales and Office Occupations by Sex
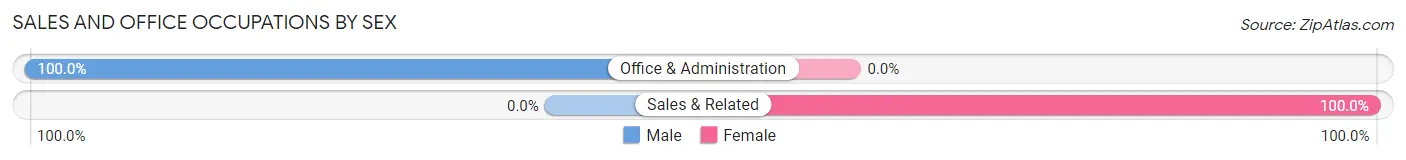
| Occupation | Male | Female |
| Sales & Related | 0 (0.0%) | 26 (100.0%) |
| Office & Administration | 4 (100.0%) | 0 (0.0%) |
| Total (Category) | 4 (13.3%) | 26 (86.7%) |
| Total (Overall) | 159 (72.3%) | 61 (27.7%) |
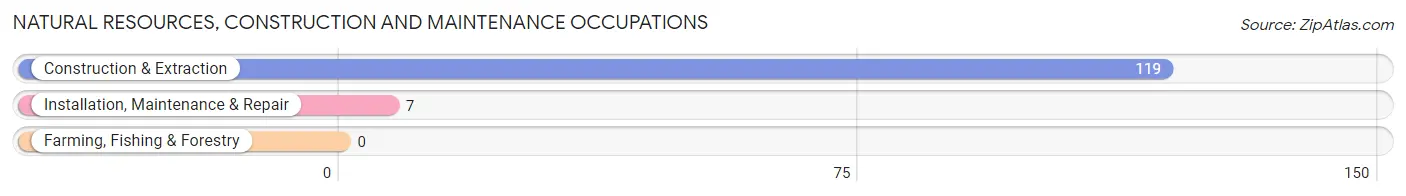
Natural Resources, Construction and Maintenance Occupations
The most common Natural Resources, Construction and Maintenance occupations in Oneida are Construction & Extraction (119 | 54.1%), and Installation, Maintenance & Repair (7 | 3.2%).
Natural Resources, Construction and Maintenance Occupations by Sex
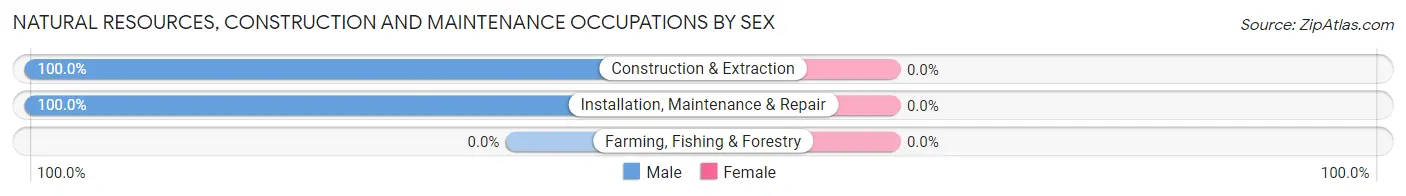
| Occupation | Male | Female |
| Farming, Fishing & Forestry | 0 (0.0%) | 0 (0.0%) |
| Construction & Extraction | 119 (100.0%) | 0 (0.0%) |
| Installation, Maintenance & Repair | 7 (100.0%) | 0 (0.0%) |
| Total (Category) | 126 (100.0%) | 0 (0.0%) |
| Total (Overall) | 159 (72.3%) | 61 (27.7%) |
Production, Transportation and Moving Occupations
The most common Production, Transportation and Moving occupations in Oneida are Material Moving (26 | 11.8%), and Production (6 | 2.7%).
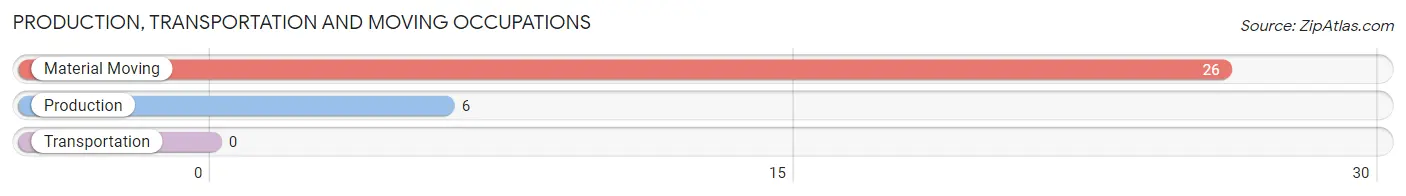
Production, Transportation and Moving Occupations by Sex
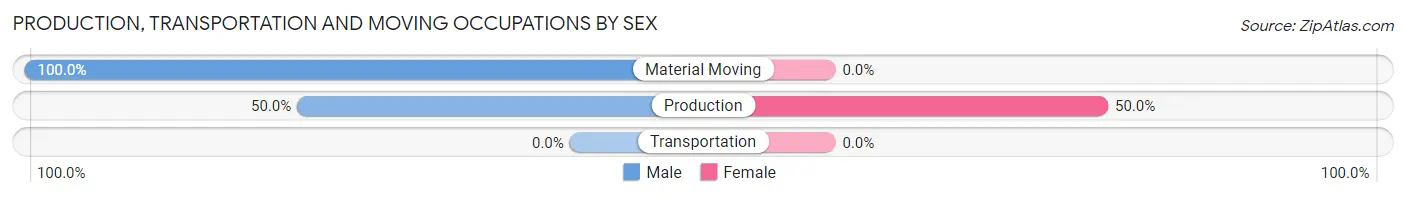
| Occupation | Male | Female |
| Production | 3 (50.0%) | 3 (50.0%) |
| Transportation | 0 (0.0%) | 0 (0.0%) |
| Material Moving | 26 (100.0%) | 0 (0.0%) |
| Total (Category) | 29 (90.6%) | 3 (9.4%) |
| Total (Overall) | 159 (72.3%) | 61 (27.7%) |
Employment Industries by Sex in Oneida
Employment Industries in Oneida
The major employment industries in Oneida include Manufacturing (130 | 59.1%), Retail Trade (43 | 19.6%), Health Care & Social Assistance (21 | 9.6%), Administrative & Support (17 | 7.7%), and Transportation & Warehousing (3 | 1.4%).
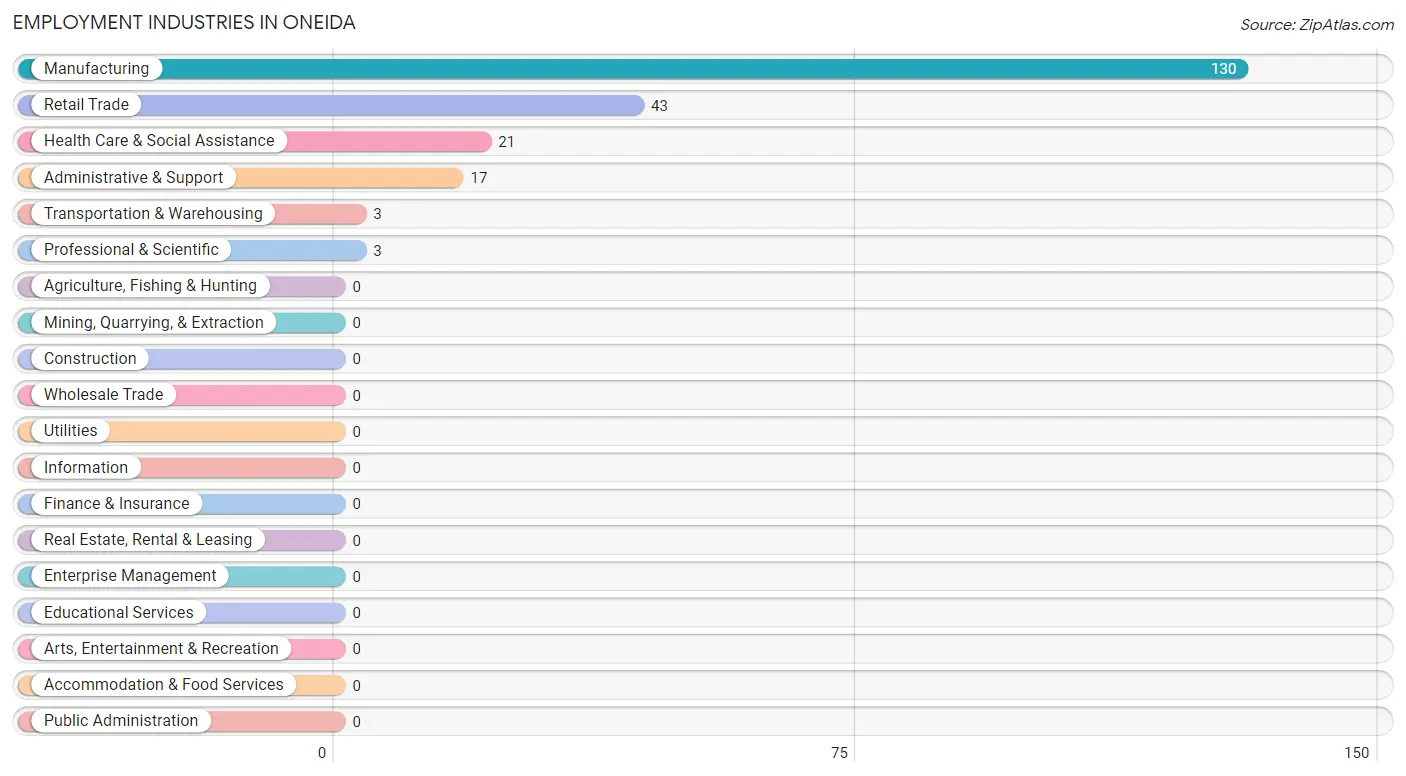
Employment Industries by Sex in Oneida
The Oneida industries that see more men than women are Transportation & Warehousing (100.0%), Administrative & Support (100.0%), and Manufacturing (91.5%), whereas the industries that tend to have a higher number of women are Professional & Scientific (100.0%), Health Care & Social Assistance (100.0%), and Retail Trade (60.5%).
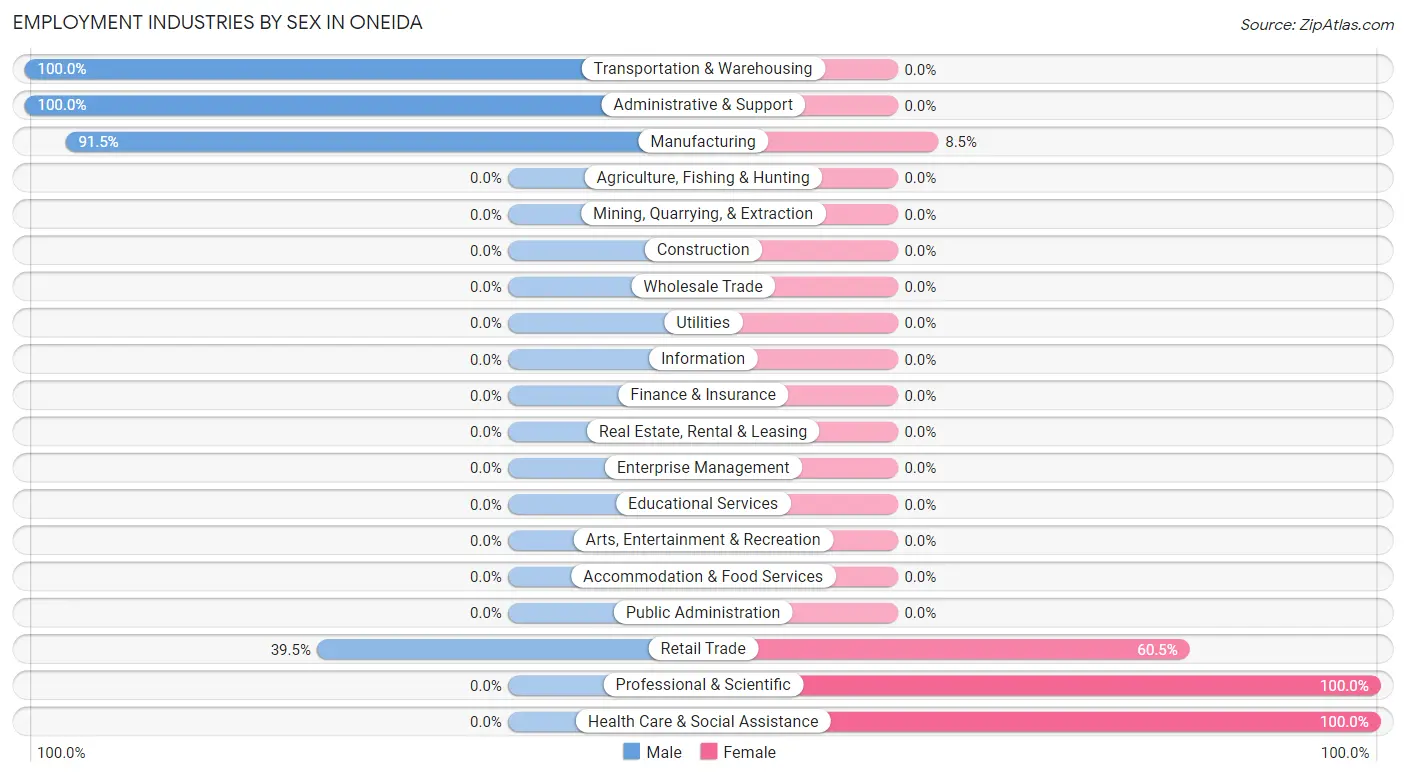
| Industry | Male | Female |
| Agriculture, Fishing & Hunting | 0 (0.0%) | 0 (0.0%) |
| Mining, Quarrying, & Extraction | 0 (0.0%) | 0 (0.0%) |
| Construction | 0 (0.0%) | 0 (0.0%) |
| Manufacturing | 119 (91.5%) | 11 (8.5%) |
| Wholesale Trade | 0 (0.0%) | 0 (0.0%) |
| Retail Trade | 17 (39.5%) | 26 (60.5%) |
| Transportation & Warehousing | 3 (100.0%) | 0 (0.0%) |
| Utilities | 0 (0.0%) | 0 (0.0%) |
| Information | 0 (0.0%) | 0 (0.0%) |
| Finance & Insurance | 0 (0.0%) | 0 (0.0%) |
| Real Estate, Rental & Leasing | 0 (0.0%) | 0 (0.0%) |
| Professional & Scientific | 0 (0.0%) | 3 (100.0%) |
| Enterprise Management | 0 (0.0%) | 0 (0.0%) |
| Administrative & Support | 17 (100.0%) | 0 (0.0%) |
| Educational Services | 0 (0.0%) | 0 (0.0%) |
| Health Care & Social Assistance | 0 (0.0%) | 21 (100.0%) |
| Arts, Entertainment & Recreation | 0 (0.0%) | 0 (0.0%) |
| Accommodation & Food Services | 0 (0.0%) | 0 (0.0%) |
| Public Administration | 0 (0.0%) | 0 (0.0%) |
| Total | 159 (72.3%) | 61 (27.7%) |
Education in Oneida
School Enrollment in Oneida
The most common levels of schooling among the 17 students in Oneida are kindergarten (10 | 58.8%), and middle school (7 | 41.2%).
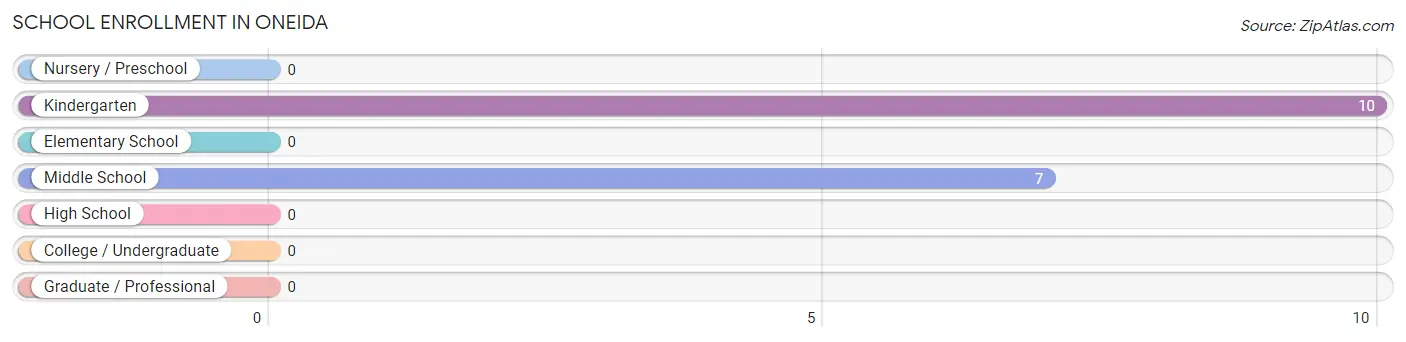
| School Level | # Students | % Students |
| Nursery / Preschool | 0 | 0.0% |
| Kindergarten | 10 | 58.8% |
| Elementary School | 0 | 0.0% |
| Middle School | 7 | 41.2% |
| High School | 0 | 0.0% |
| College / Undergraduate | 0 | 0.0% |
| Graduate / Professional | 0 | 0.0% |
| Total | 17 | 100.0% |
School Enrollment by Age by Funding Source in Oneida
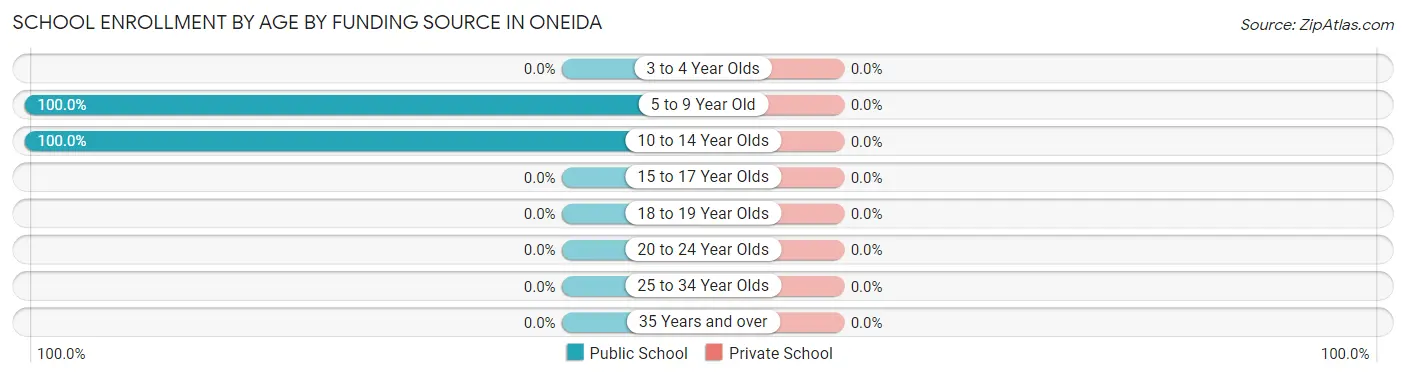
| Age Bracket | Public School | Private School |
| 3 to 4 Year Olds | 0 (0.0%) | 0 (0.0%) |
| 5 to 9 Year Old | 10 (100.0%) | 0 (0.0%) |
| 10 to 14 Year Olds | 7 (100.0%) | 0 (0.0%) |
| 15 to 17 Year Olds | 0 (0.0%) | 0 (0.0%) |
| 18 to 19 Year Olds | 0 (0.0%) | 0 (0.0%) |
| 20 to 24 Year Olds | 0 (0.0%) | 0 (0.0%) |
| 25 to 34 Year Olds | 0 (0.0%) | 0 (0.0%) |
| 35 Years and over | 0 (0.0%) | 0 (0.0%) |
| Total | 17 (100.0%) | 0 (0.0%) |
Educational Attainment by Field of Study in Oneida
| Field of Study | # Graduates | % Graduates |
| Computers & Mathematics | 0 | 0.0% |
| Bio, Nature & Agricultural | 0 | 0.0% |
| Physical & Health Sciences | 0 | 0.0% |
| Psychology | 0 | 0.0% |
| Social Sciences | 0 | 0.0% |
| Engineering | 0 | 0.0% |
| Multidisciplinary Studies | 0 | 0.0% |
| Science & Technology | 0 | 0.0% |
| Business | 0 | 0.0% |
| Education | 0 | 0.0% |
| Literature & Languages | 0 | 0.0% |
| Liberal Arts & History | 0 | 0.0% |
| Visual & Performing Arts | 0 | 0.0% |
| Communications | 0 | 0.0% |
| Arts & Humanities | 0 | 0.0% |
| Total | 0 | 0.0% |
Transportation & Commute in Oneida
Vehicle Availability by Sex in Oneida
The most prevalent vehicle ownership categories in Oneida are males with 3 vehicles (129, accounting for 94.9%) and females with 3 vehicles (37, making up 211.5%).
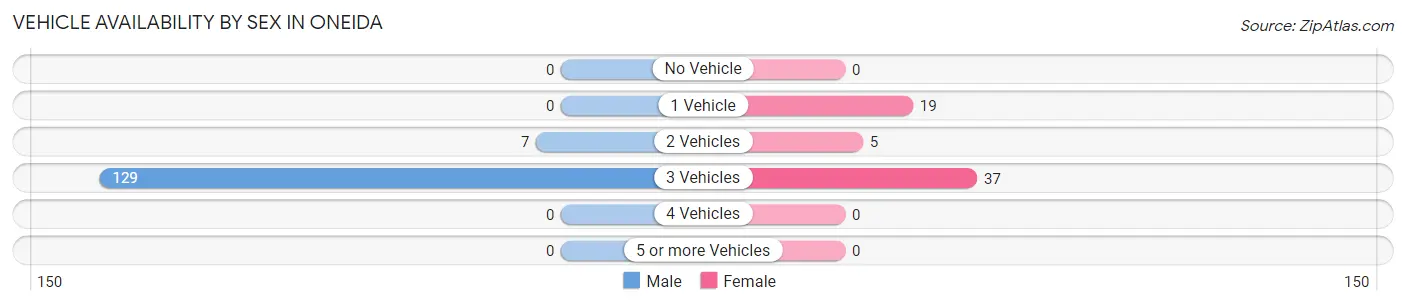
| Vehicles Available | Male | Female |
| No Vehicle | 0 (0.0%) | 0 (0.0%) |
| 1 Vehicle | 0 (0.0%) | 19 (31.1%) |
| 2 Vehicles | 7 (5.1%) | 5 (8.2%) |
| 3 Vehicles | 129 (94.9%) | 37 (60.7%) |
| 4 Vehicles | 0 (0.0%) | 0 (0.0%) |
| 5 or more Vehicles | 0 (0.0%) | 0 (0.0%) |
| Total | 136 (100.0%) | 61 (100.0%) |
Commute Time in Oneida
The most frequently occuring commute durations in Oneida are 45 to 59 minutes (119 commuters, 61.3%), 5 to 9 minutes (38 commuters, 19.6%), and 60 to 89 minutes (14 commuters, 7.2%).
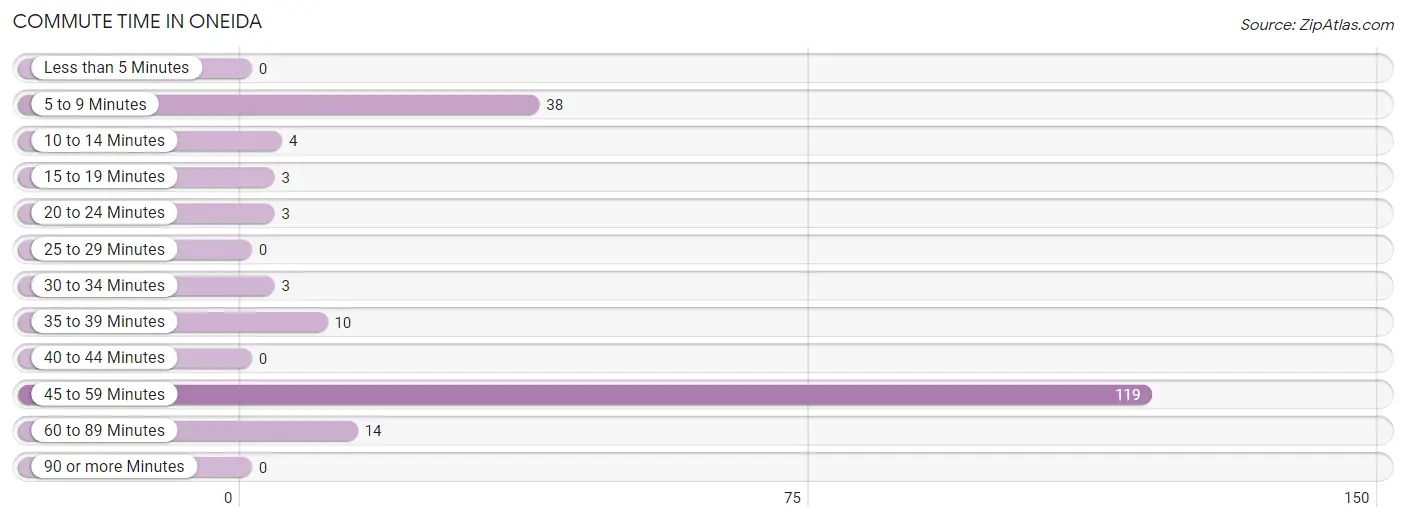
| Commute Time | # Commuters | % Commuters |
| Less than 5 Minutes | 0 | 0.0% |
| 5 to 9 Minutes | 38 | 19.6% |
| 10 to 14 Minutes | 4 | 2.1% |
| 15 to 19 Minutes | 3 | 1.5% |
| 20 to 24 Minutes | 3 | 1.5% |
| 25 to 29 Minutes | 0 | 0.0% |
| 30 to 34 Minutes | 3 | 1.5% |
| 35 to 39 Minutes | 10 | 5.1% |
| 40 to 44 Minutes | 0 | 0.0% |
| 45 to 59 Minutes | 119 | 61.3% |
| 60 to 89 Minutes | 14 | 7.2% |
| 90 or more Minutes | 0 | 0.0% |
Commute Time by Sex in Oneida
The most common commute times in Oneida are 45 to 59 minutes (119 commuters, 87.5%) for males and 5 to 9 minutes (31 commuters, 53.4%) for females.
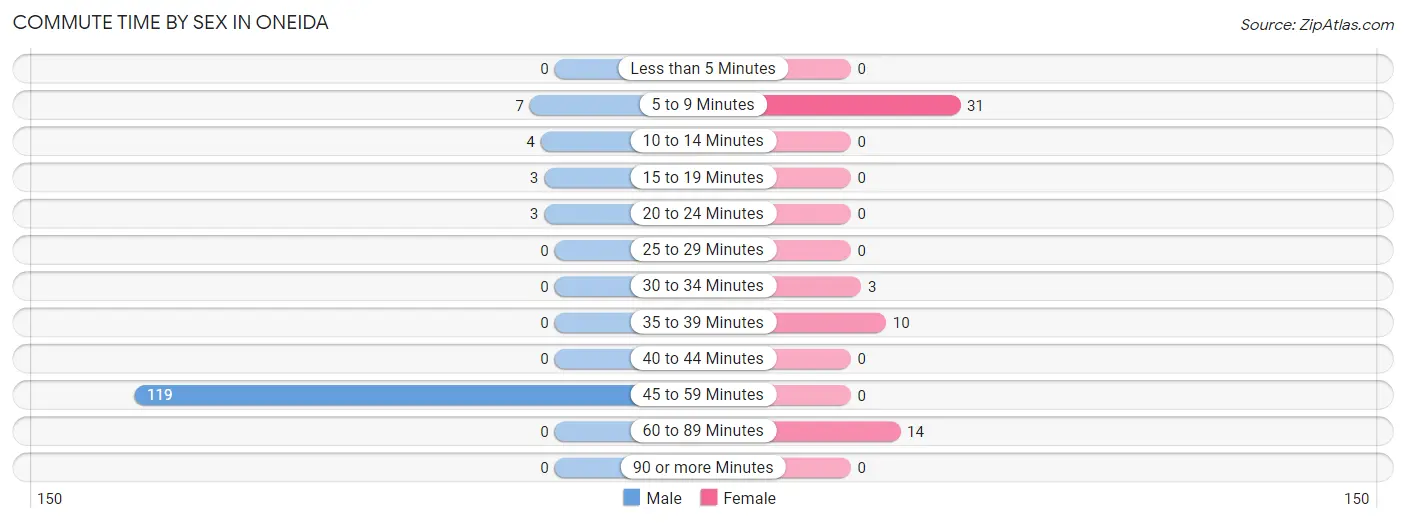
| Commute Time | Male | Female |
| Less than 5 Minutes | 0 (0.0%) | 0 (0.0%) |
| 5 to 9 Minutes | 7 (5.1%) | 31 (53.4%) |
| 10 to 14 Minutes | 4 (2.9%) | 0 (0.0%) |
| 15 to 19 Minutes | 3 (2.2%) | 0 (0.0%) |
| 20 to 24 Minutes | 3 (2.2%) | 0 (0.0%) |
| 25 to 29 Minutes | 0 (0.0%) | 0 (0.0%) |
| 30 to 34 Minutes | 0 (0.0%) | 3 (5.2%) |
| 35 to 39 Minutes | 0 (0.0%) | 10 (17.2%) |
| 40 to 44 Minutes | 0 (0.0%) | 0 (0.0%) |
| 45 to 59 Minutes | 119 (87.5%) | 0 (0.0%) |
| 60 to 89 Minutes | 0 (0.0%) | 14 (24.1%) |
| 90 or more Minutes | 0 (0.0%) | 0 (0.0%) |
Time of Departure to Work by Sex in Oneida
The most frequent times of departure to work in Oneida are 4:00 PM to 11:59 PM (122, 89.7%) for males and 8:30 AM to 8:59 AM (26, 44.8%) for females.
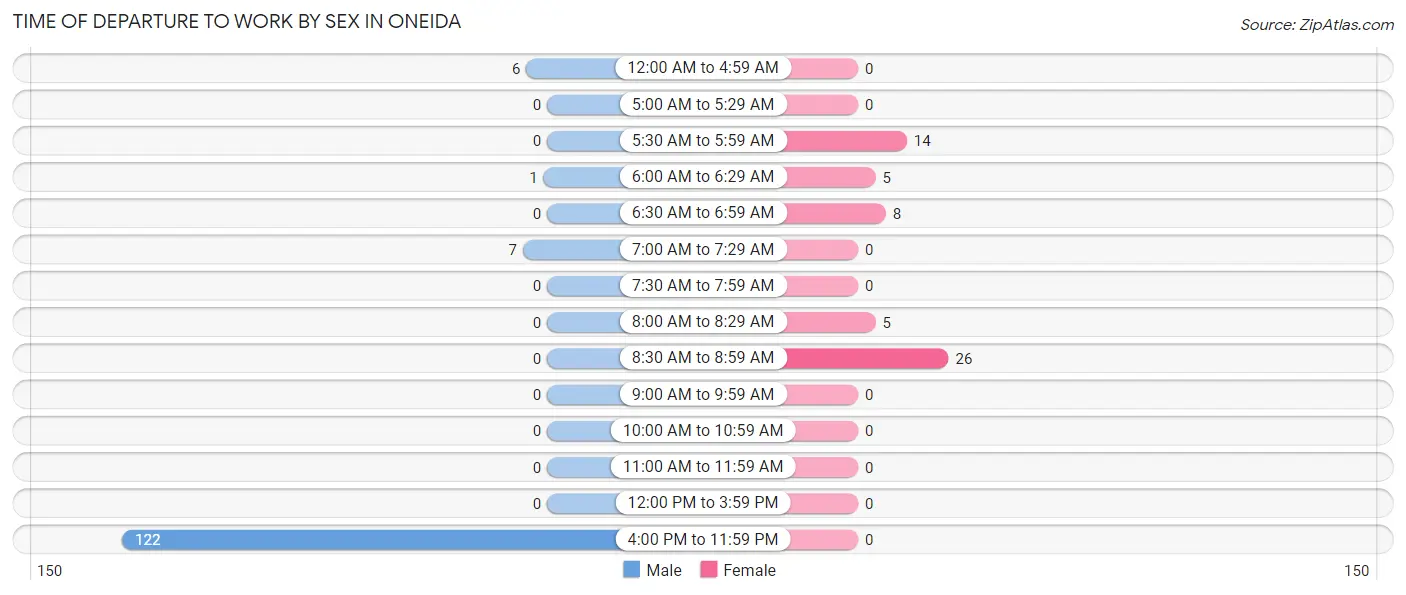
| Time of Departure | Male | Female |
| 12:00 AM to 4:59 AM | 6 (4.4%) | 0 (0.0%) |
| 5:00 AM to 5:29 AM | 0 (0.0%) | 0 (0.0%) |
| 5:30 AM to 5:59 AM | 0 (0.0%) | 14 (24.1%) |
| 6:00 AM to 6:29 AM | 1 (0.7%) | 5 (8.6%) |
| 6:30 AM to 6:59 AM | 0 (0.0%) | 8 (13.8%) |
| 7:00 AM to 7:29 AM | 7 (5.1%) | 0 (0.0%) |
| 7:30 AM to 7:59 AM | 0 (0.0%) | 0 (0.0%) |
| 8:00 AM to 8:29 AM | 0 (0.0%) | 5 (8.6%) |
| 8:30 AM to 8:59 AM | 0 (0.0%) | 26 (44.8%) |
| 9:00 AM to 9:59 AM | 0 (0.0%) | 0 (0.0%) |
| 10:00 AM to 10:59 AM | 0 (0.0%) | 0 (0.0%) |
| 11:00 AM to 11:59 AM | 0 (0.0%) | 0 (0.0%) |
| 12:00 PM to 3:59 PM | 0 (0.0%) | 0 (0.0%) |
| 4:00 PM to 11:59 PM | 122 (89.7%) | 0 (0.0%) |
| Total | 136 (100.0%) | 58 (100.0%) |
Housing Occupancy in Oneida
Occupancy by Ownership in Oneida
Of the total 181 dwellings in Oneida, owner-occupied units account for 158 (87.3%), while renter-occupied units make up 23 (12.7%).
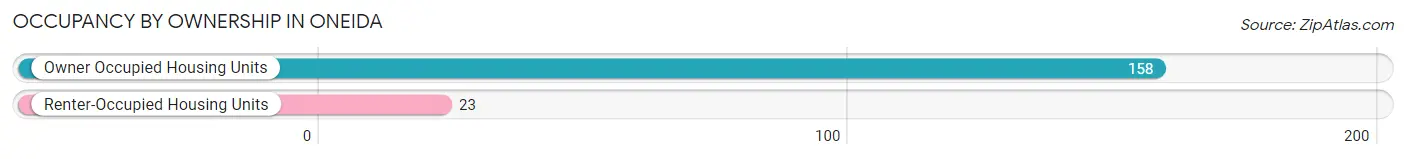
| Occupancy | # Housing Units | % Housing Units |
| Owner Occupied Housing Units | 158 | 87.3% |
| Renter-Occupied Housing Units | 23 | 12.7% |
| Total Occupied Housing Units | 181 | 100.0% |
Occupancy by Household Size in Oneida
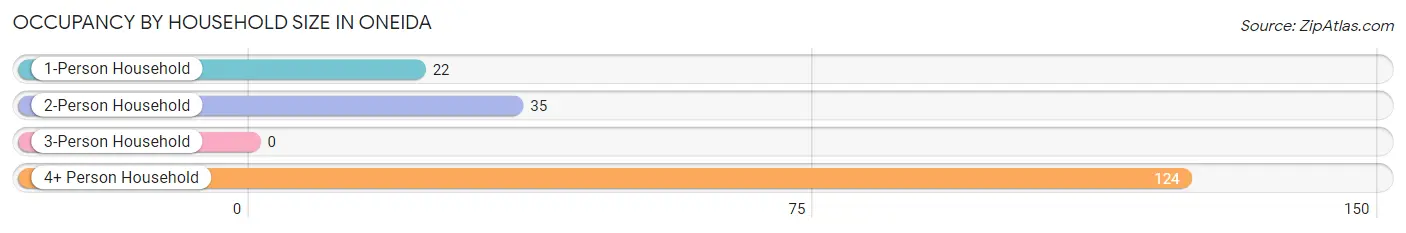
| Household Size | # Housing Units | % Housing Units |
| 1-Person Household | 22 | 12.1% |
| 2-Person Household | 35 | 19.3% |
| 3-Person Household | 0 | 0.0% |
| 4+ Person Household | 124 | 68.5% |
| Total Housing Units | 181 | 100.0% |
Occupancy by Ownership by Household Size in Oneida
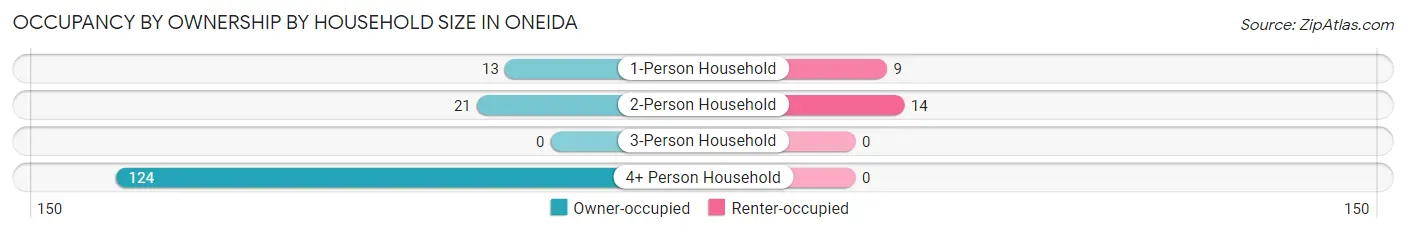
| Household Size | Owner-occupied | Renter-occupied |
| 1-Person Household | 13 (59.1%) | 9 (40.9%) |
| 2-Person Household | 21 (60.0%) | 14 (40.0%) |
| 3-Person Household | 0 (0.0%) | 0 (0.0%) |
| 4+ Person Household | 124 (100.0%) | 0 (0.0%) |
| Total Housing Units | 158 (87.3%) | 23 (12.7%) |
Occupancy by Educational Attainment in Oneida
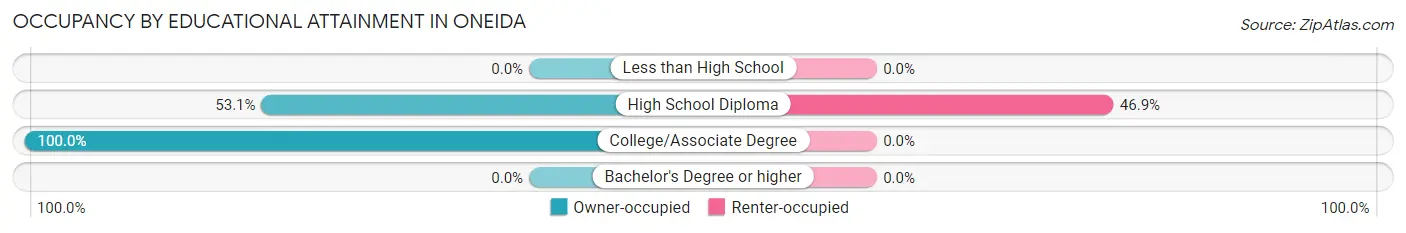
| Household Size | Owner-occupied | Renter-occupied |
| Less than High School | 0 (0.0%) | 0 (0.0%) |
| High School Diploma | 26 (53.1%) | 23 (46.9%) |
| College/Associate Degree | 132 (100.0%) | 0 (0.0%) |
| Bachelor's Degree or higher | 0 (0.0%) | 0 (0.0%) |
Occupancy by Age of Householder in Oneida
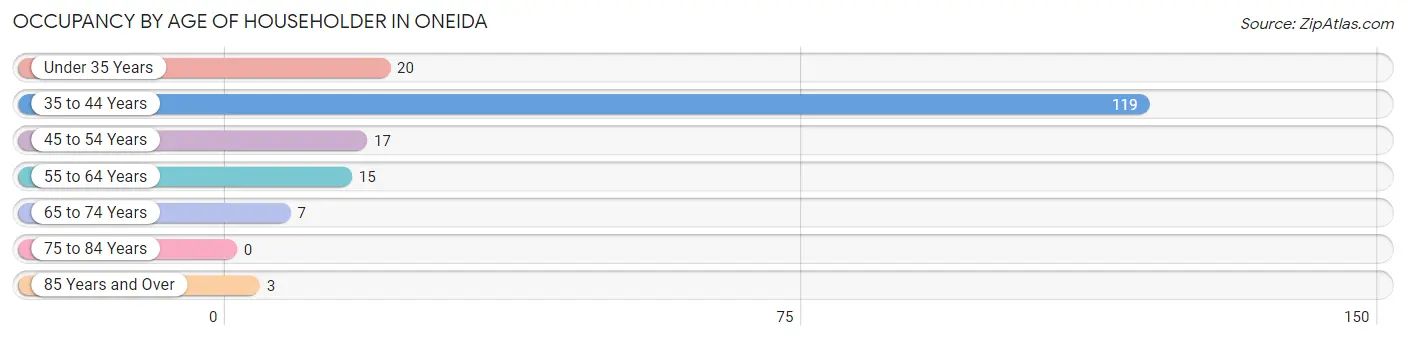
| Age Bracket | # Households | % Households |
| Under 35 Years | 20 | 11.1% |
| 35 to 44 Years | 119 | 65.7% |
| 45 to 54 Years | 17 | 9.4% |
| 55 to 64 Years | 15 | 8.3% |
| 65 to 74 Years | 7 | 3.9% |
| 75 to 84 Years | 0 | 0.0% |
| 85 Years and Over | 3 | 1.7% |
| Total | 181 | 100.0% |
Housing Finances in Oneida
Median Income by Occupancy in Oneida
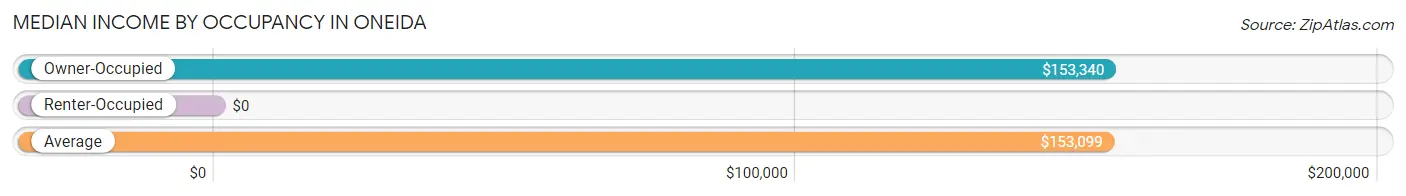
| Occupancy Type | # Households | Median Income |
| Owner-Occupied | 158 (87.3%) | $153,340 |
| Renter-Occupied | 23 (12.7%) | $0 |
| Average | 181 (100.0%) | $153,099 |
Occupancy by Householder Income Bracket in Oneida
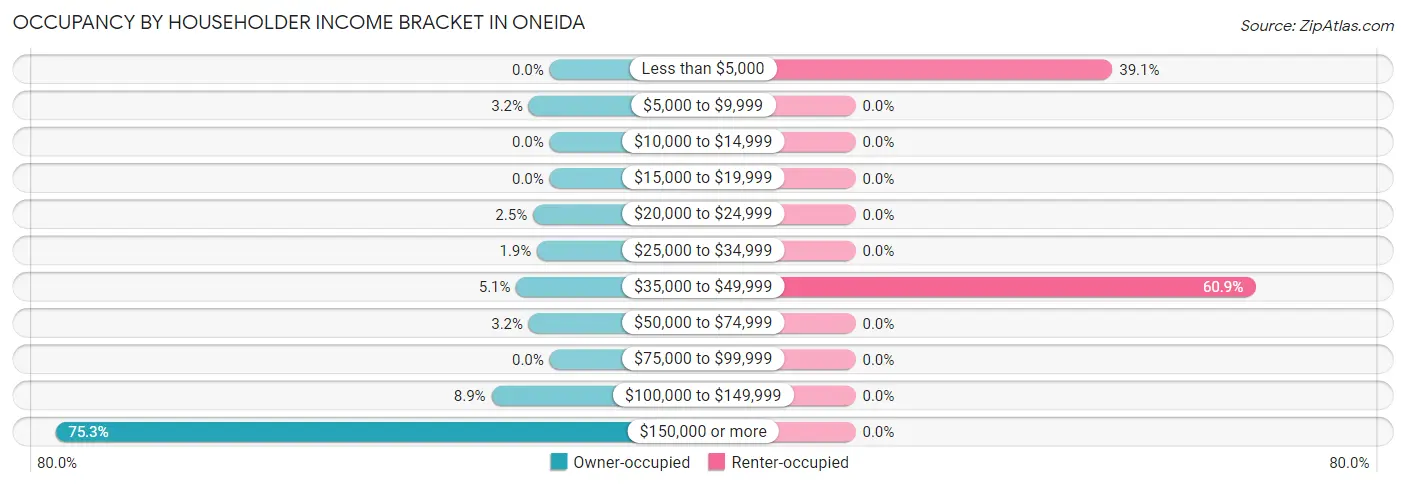
| Income Bracket | Owner-occupied | Renter-occupied |
| Less than $5,000 | 0 (0.0%) | 9 (39.1%) |
| $5,000 to $9,999 | 5 (3.2%) | 0 (0.0%) |
| $10,000 to $14,999 | 0 (0.0%) | 0 (0.0%) |
| $15,000 to $19,999 | 0 (0.0%) | 0 (0.0%) |
| $20,000 to $24,999 | 4 (2.5%) | 0 (0.0%) |
| $25,000 to $34,999 | 3 (1.9%) | 0 (0.0%) |
| $35,000 to $49,999 | 8 (5.1%) | 14 (60.9%) |
| $50,000 to $74,999 | 5 (3.2%) | 0 (0.0%) |
| $75,000 to $99,999 | 0 (0.0%) | 0 (0.0%) |
| $100,000 to $149,999 | 14 (8.9%) | 0 (0.0%) |
| $150,000 or more | 119 (75.3%) | 0 (0.0%) |
| Total | 158 (100.0%) | 23 (100.0%) |
Monthly Housing Cost Tiers in Oneida
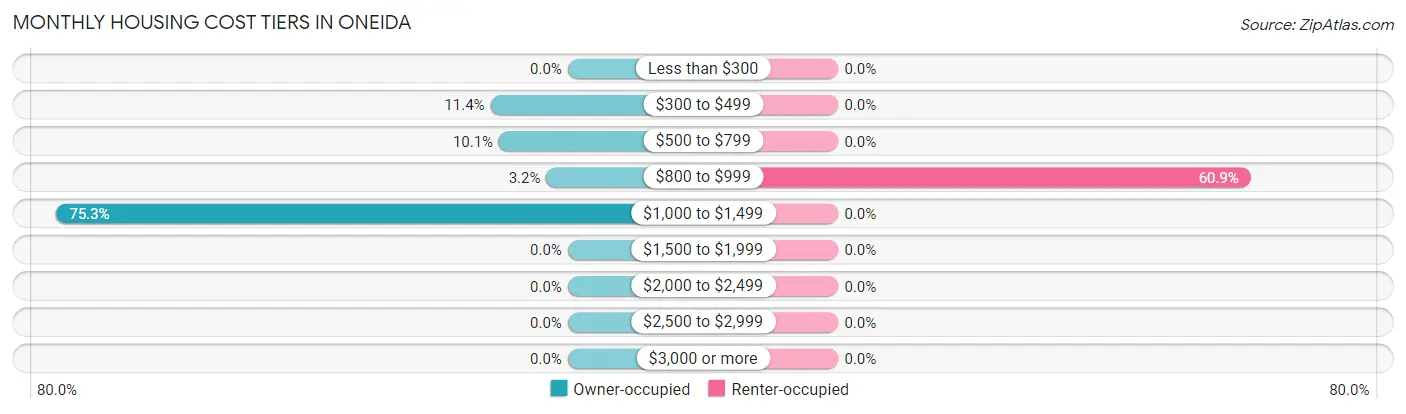
| Monthly Cost | Owner-occupied | Renter-occupied |
| Less than $300 | 0 (0.0%) | 0 (0.0%) |
| $300 to $499 | 18 (11.4%) | 0 (0.0%) |
| $500 to $799 | 16 (10.1%) | 0 (0.0%) |
| $800 to $999 | 5 (3.2%) | 14 (60.9%) |
| $1,000 to $1,499 | 119 (75.3%) | 0 (0.0%) |
| $1,500 to $1,999 | 0 (0.0%) | 0 (0.0%) |
| $2,000 to $2,499 | 0 (0.0%) | 0 (0.0%) |
| $2,500 to $2,999 | 0 (0.0%) | 0 (0.0%) |
| $3,000 or more | 0 (0.0%) | 0 (0.0%) |
| Total | 158 (100.0%) | 23 (100.0%) |
Physical Housing Characteristics in Oneida
Housing Structures in Oneida
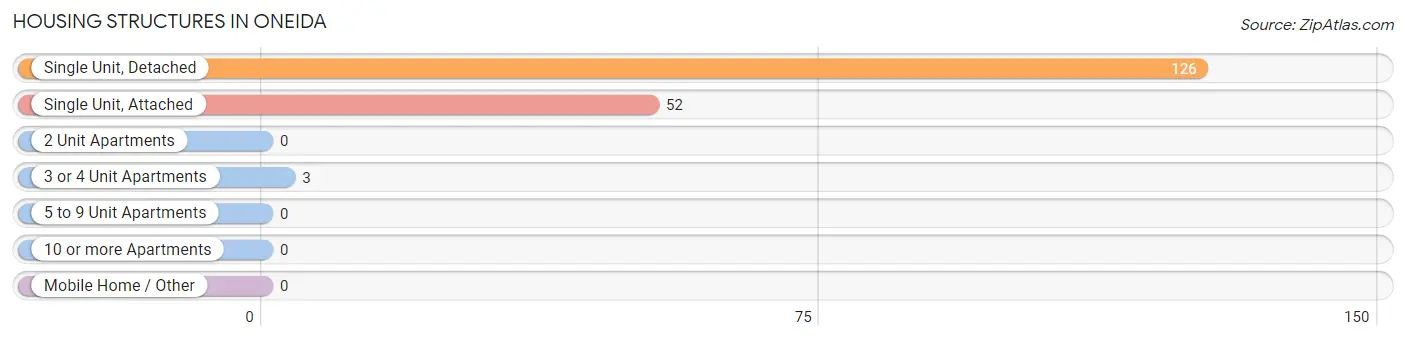
| Structure Type | # Housing Units | % Housing Units |
| Single Unit, Detached | 126 | 69.6% |
| Single Unit, Attached | 52 | 28.7% |
| 2 Unit Apartments | 0 | 0.0% |
| 3 or 4 Unit Apartments | 3 | 1.7% |
| 5 to 9 Unit Apartments | 0 | 0.0% |
| 10 or more Apartments | 0 | 0.0% |
| Mobile Home / Other | 0 | 0.0% |
| Total | 181 | 100.0% |
Housing Structures by Occupancy in Oneida
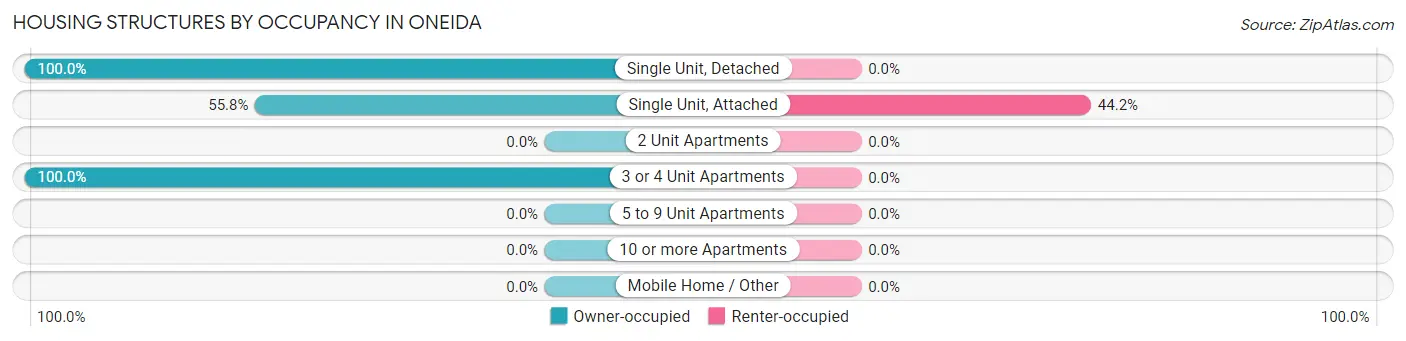
| Structure Type | Owner-occupied | Renter-occupied |
| Single Unit, Detached | 126 (100.0%) | 0 (0.0%) |
| Single Unit, Attached | 29 (55.8%) | 23 (44.2%) |
| 2 Unit Apartments | 0 (0.0%) | 0 (0.0%) |
| 3 or 4 Unit Apartments | 3 (100.0%) | 0 (0.0%) |
| 5 to 9 Unit Apartments | 0 (0.0%) | 0 (0.0%) |
| 10 or more Apartments | 0 (0.0%) | 0 (0.0%) |
| Mobile Home / Other | 0 (0.0%) | 0 (0.0%) |
| Total | 158 (87.3%) | 23 (12.7%) |
Housing Structures by Number of Rooms in Oneida
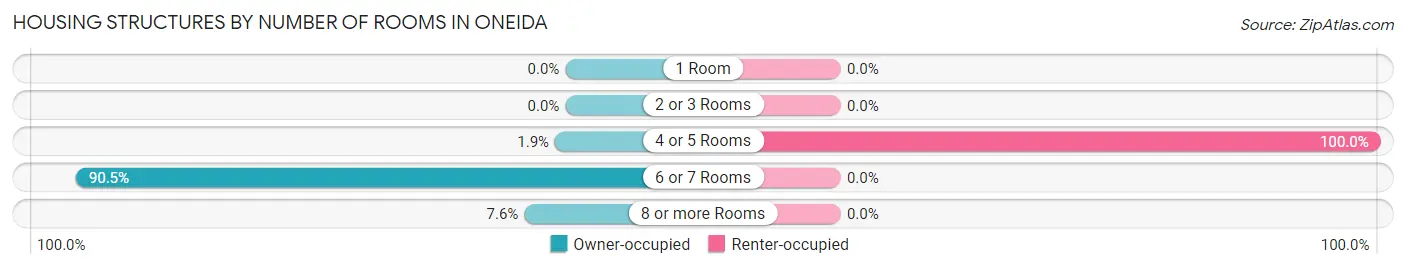
| Number of Rooms | Owner-occupied | Renter-occupied |
| 1 Room | 0 (0.0%) | 0 (0.0%) |
| 2 or 3 Rooms | 0 (0.0%) | 0 (0.0%) |
| 4 or 5 Rooms | 3 (1.9%) | 23 (100.0%) |
| 6 or 7 Rooms | 143 (90.5%) | 0 (0.0%) |
| 8 or more Rooms | 12 (7.6%) | 0 (0.0%) |
| Total | 158 (100.0%) | 23 (100.0%) |
Housing Structure by Heating Type in Oneida
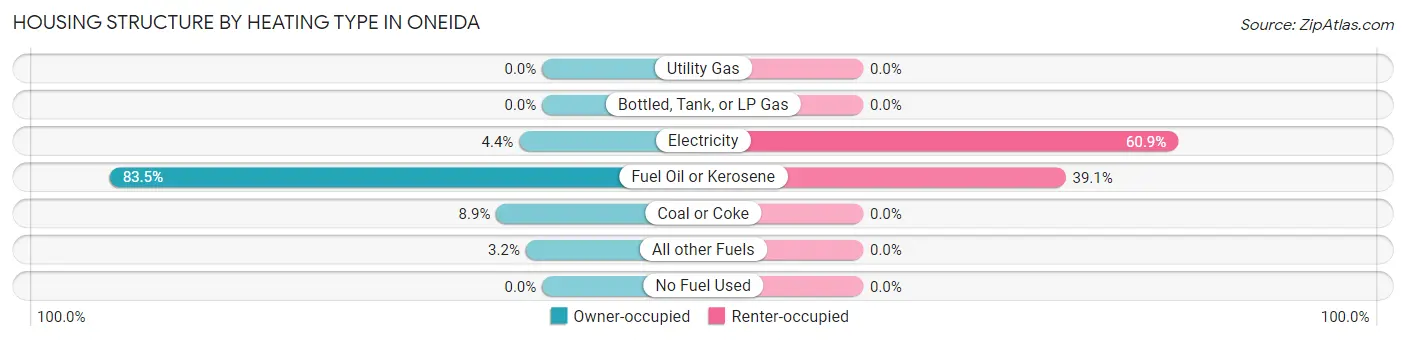
| Heating Type | Owner-occupied | Renter-occupied |
| Utility Gas | 0 (0.0%) | 0 (0.0%) |
| Bottled, Tank, or LP Gas | 0 (0.0%) | 0 (0.0%) |
| Electricity | 7 (4.4%) | 14 (60.9%) |
| Fuel Oil or Kerosene | 132 (83.5%) | 9 (39.1%) |
| Coal or Coke | 14 (8.9%) | 0 (0.0%) |
| All other Fuels | 5 (3.2%) | 0 (0.0%) |
| No Fuel Used | 0 (0.0%) | 0 (0.0%) |
| Total | 158 (100.0%) | 23 (100.0%) |
Household Vehicle Usage in Oneida
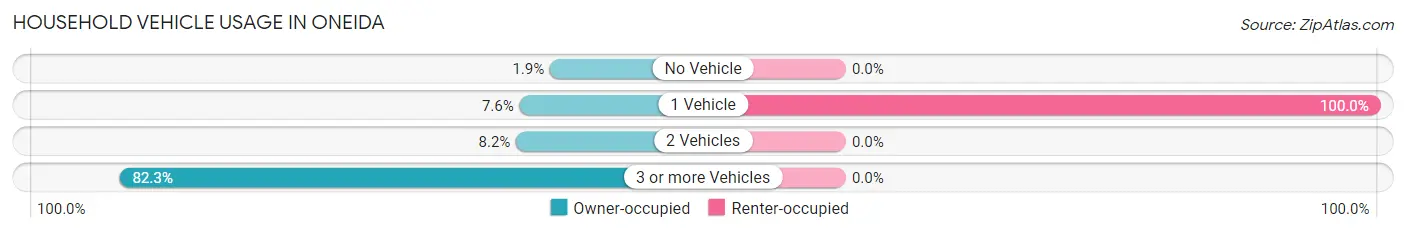
| Vehicles per Household | Owner-occupied | Renter-occupied |
| No Vehicle | 3 (1.9%) | 0 (0.0%) |
| 1 Vehicle | 12 (7.6%) | 23 (100.0%) |
| 2 Vehicles | 13 (8.2%) | 0 (0.0%) |
| 3 or more Vehicles | 130 (82.3%) | 0 (0.0%) |
| Total | 158 (100.0%) | 23 (100.0%) |
Real Estate & Mortgages in Oneida
Real Estate and Mortgage Overview in Oneida
| Characteristic | Without Mortgage | With Mortgage |
| Housing Units | 30 | 128 |
| Median Property Value | $76,300 | $111,600 |
| Median Household Income | - | - |
| Monthly Housing Costs | $379 | $0 |
| Real Estate Taxes | $700 | $0 |
Property Value by Mortgage Status in Oneida
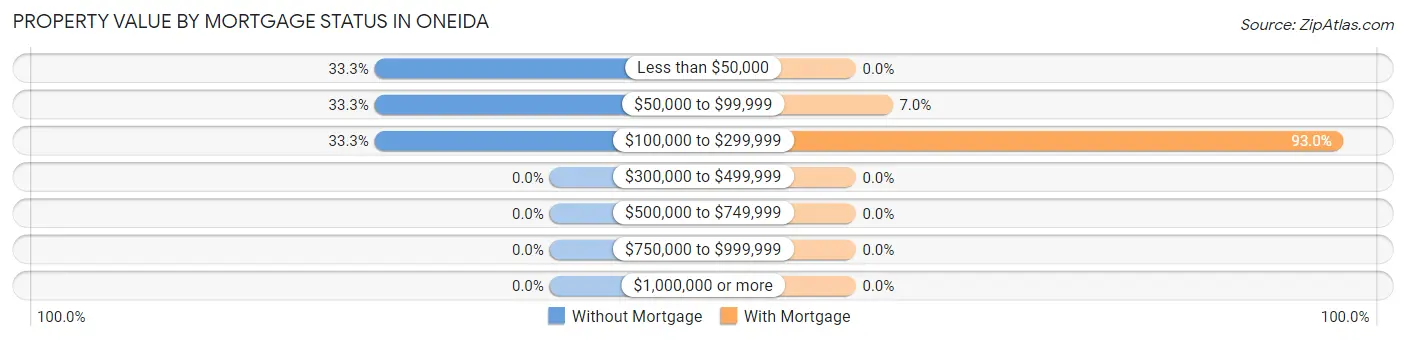
| Property Value | Without Mortgage | With Mortgage |
| Less than $50,000 | 10 (33.3%) | 0 (0.0%) |
| $50,000 to $99,999 | 10 (33.3%) | 9 (7.0%) |
| $100,000 to $299,999 | 10 (33.3%) | 119 (93.0%) |
| $300,000 to $499,999 | 0 (0.0%) | 0 (0.0%) |
| $500,000 to $749,999 | 0 (0.0%) | 0 (0.0%) |
| $750,000 to $999,999 | 0 (0.0%) | 0 (0.0%) |
| $1,000,000 or more | 0 (0.0%) | 0 (0.0%) |
| Total | 30 (100.0%) | 128 (100.0%) |
Household Income by Mortgage Status in Oneida
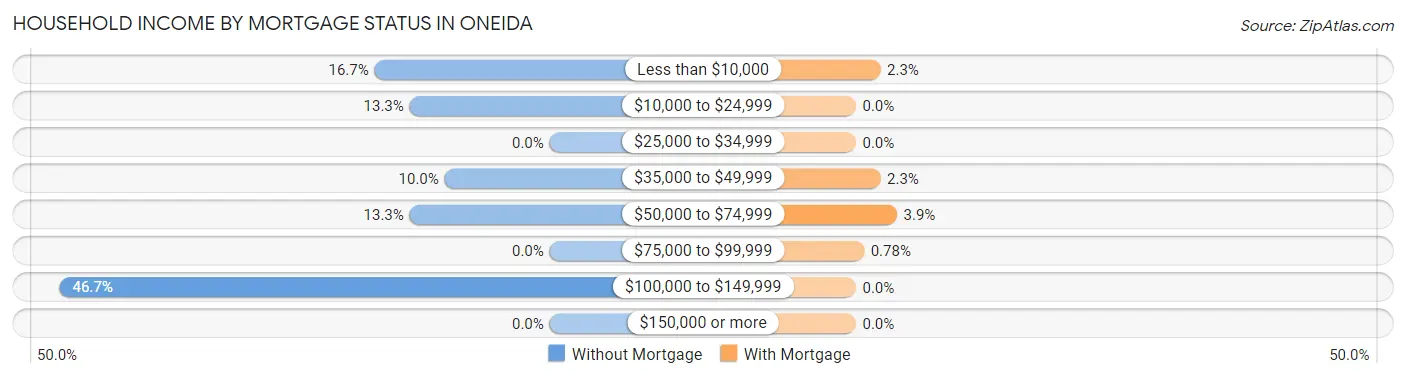
| Household Income | Without Mortgage | With Mortgage |
| Less than $10,000 | 5 (16.7%) | 3 (2.3%) |
| $10,000 to $24,999 | 4 (13.3%) | 0 (0.0%) |
| $25,000 to $34,999 | 0 (0.0%) | 0 (0.0%) |
| $35,000 to $49,999 | 3 (10.0%) | 3 (2.3%) |
| $50,000 to $74,999 | 4 (13.3%) | 5 (3.9%) |
| $75,000 to $99,999 | 0 (0.0%) | 1 (0.8%) |
| $100,000 to $149,999 | 14 (46.7%) | 0 (0.0%) |
| $150,000 or more | 0 (0.0%) | 0 (0.0%) |
| Total | 30 (100.0%) | 128 (100.0%) |
Property Value to Household Income Ratio in Oneida
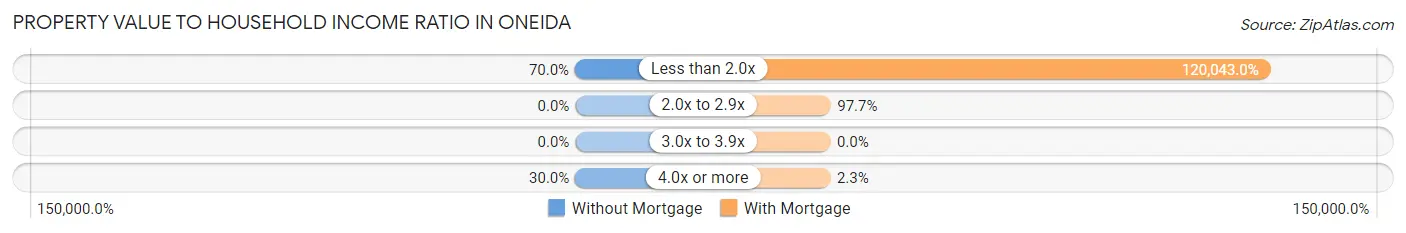
| Value-to-Income Ratio | Without Mortgage | With Mortgage |
| Less than 2.0x | 21 (70.0%) | 153,655 (120,043.0%) |
| 2.0x to 2.9x | 0 (0.0%) | 125 (97.7%) |
| 3.0x to 3.9x | 0 (0.0%) | 0 (0.0%) |
| 4.0x or more | 9 (30.0%) | 3 (2.3%) |
| Total | 30 (100.0%) | 128 (100.0%) |
Real Estate Taxes by Mortgage Status in Oneida
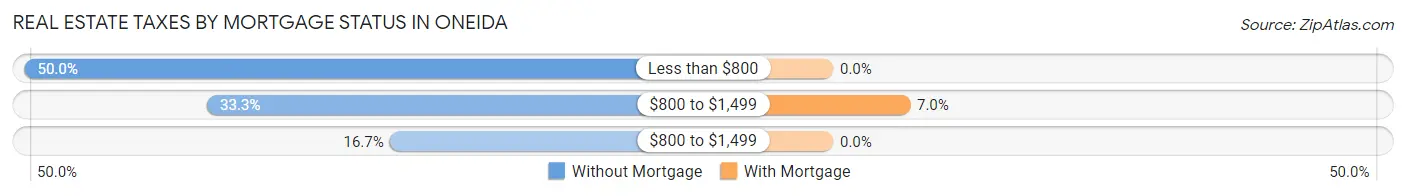
| Property Taxes | Without Mortgage | With Mortgage |
| Less than $800 | 15 (50.0%) | 0 (0.0%) |
| $800 to $1,499 | 10 (33.3%) | 9 (7.0%) |
| $800 to $1,499 | 5 (16.7%) | 0 (0.0%) |
| Total | 30 (100.0%) | 128 (100.0%) |
Health & Disability in Oneida
Health Insurance Coverage by Age in Oneida
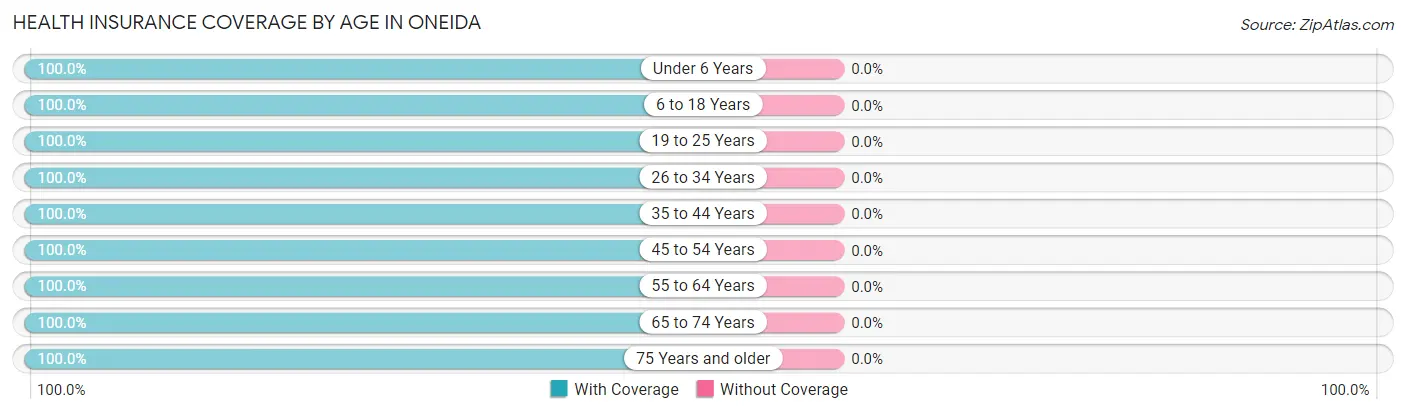
| Age Bracket | With Coverage | Without Coverage |
| Under 6 Years | 91 (100.0%) | 0 (0.0%) |
| 6 to 18 Years | 36 (100.0%) | 0 (0.0%) |
| 19 to 25 Years | 14 (100.0%) | 0 (0.0%) |
| 26 to 34 Years | 29 (100.0%) | 0 (0.0%) |
| 35 to 44 Years | 148 (100.0%) | 0 (0.0%) |
| 45 to 54 Years | 17 (100.0%) | 0 (0.0%) |
| 55 to 64 Years | 25 (100.0%) | 0 (0.0%) |
| 65 to 74 Years | 7 (100.0%) | 0 (0.0%) |
| 75 Years and older | 6 (100.0%) | 0 (0.0%) |
| Total | 373 (100.0%) | 0 (0.0%) |
Health Insurance Coverage by Citizenship Status in Oneida
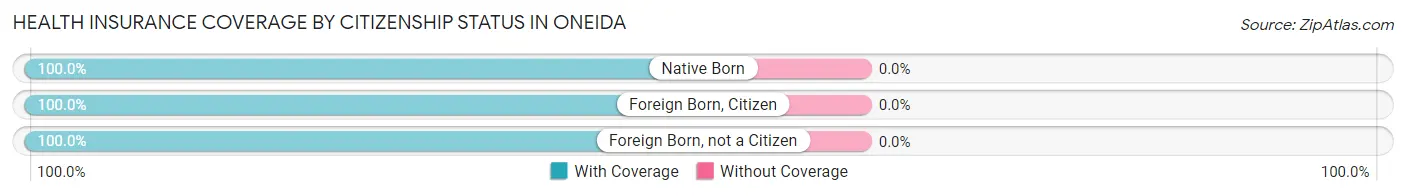
| Citizenship Status | With Coverage | Without Coverage |
| Native Born | 91 (100.0%) | 0 (0.0%) |
| Foreign Born, Citizen | 36 (100.0%) | 0 (0.0%) |
| Foreign Born, not a Citizen | 14 (100.0%) | 0 (0.0%) |
Health Insurance Coverage by Household Income in Oneida
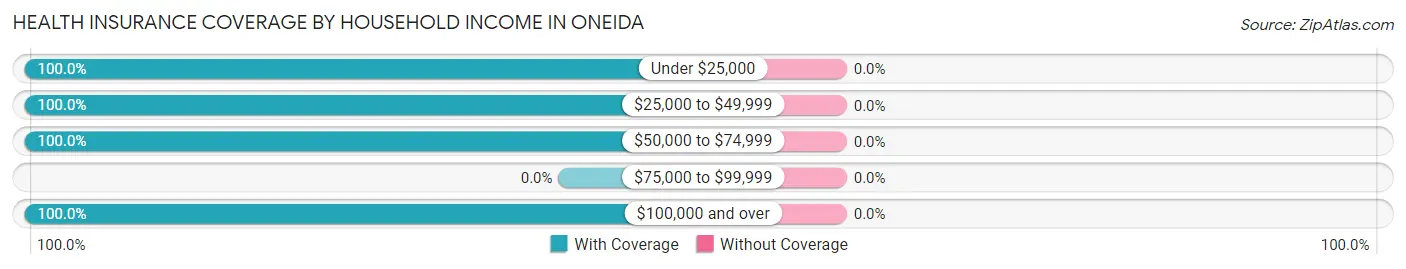
| Household Income | With Coverage | Without Coverage |
| Under $25,000 | 34 (100.0%) | 0 (0.0%) |
| $25,000 to $49,999 | 81 (100.0%) | 0 (0.0%) |
| $50,000 to $74,999 | 5 (100.0%) | 0 (0.0%) |
| $75,000 to $99,999 | 0 (0.0%) | 0 (0.0%) |
| $100,000 and over | 253 (100.0%) | 0 (0.0%) |
Public vs Private Health Insurance Coverage by Age in Oneida
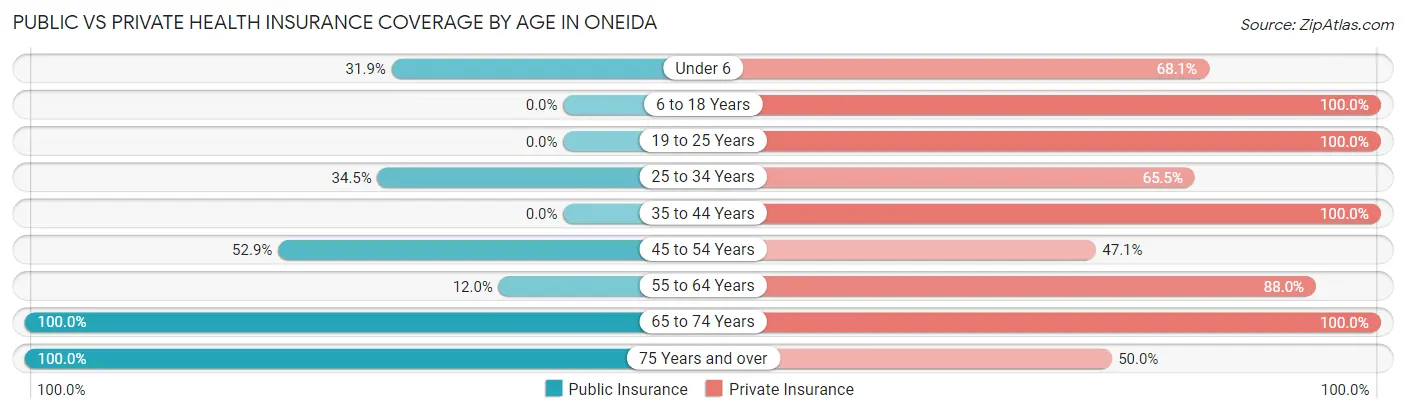
| Age Bracket | Public Insurance | Private Insurance |
| Under 6 | 29 (31.9%) | 62 (68.1%) |
| 6 to 18 Years | 0 (0.0%) | 36 (100.0%) |
| 19 to 25 Years | 0 (0.0%) | 14 (100.0%) |
| 25 to 34 Years | 10 (34.5%) | 19 (65.5%) |
| 35 to 44 Years | 0 (0.0%) | 148 (100.0%) |
| 45 to 54 Years | 9 (52.9%) | 8 (47.1%) |
| 55 to 64 Years | 3 (12.0%) | 22 (88.0%) |
| 65 to 74 Years | 7 (100.0%) | 7 (100.0%) |
| 75 Years and over | 6 (100.0%) | 3 (50.0%) |
| Total | 64 (17.2%) | 319 (85.5%) |
Disability Status by Sex by Age in Oneida
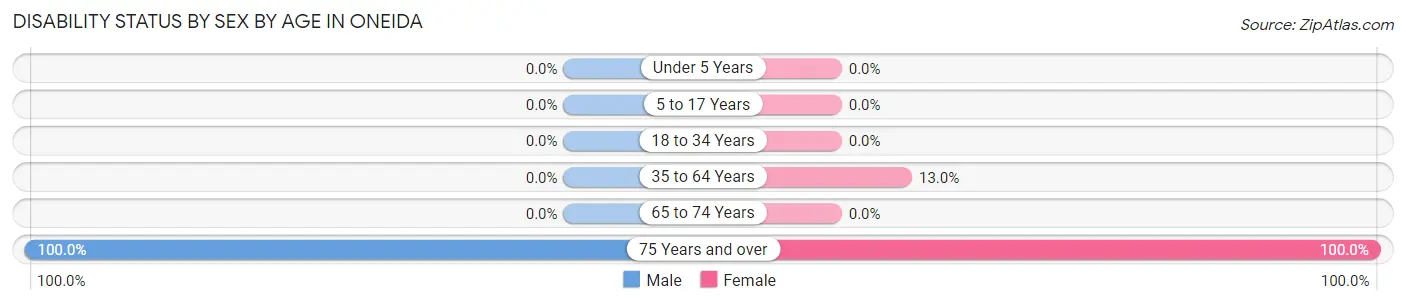
| Age Bracket | Male | Female |
| Under 5 Years | 0 (0.0%) | 0 (0.0%) |
| 5 to 17 Years | 0 (0.0%) | 0 (0.0%) |
| 18 to 34 Years | 0 (0.0%) | 0 (0.0%) |
| 35 to 64 Years | 0 (0.0%) | 6 (13.0%) |
| 65 to 74 Years | 0 (0.0%) | 0 (0.0%) |
| 75 Years and over | 3 (100.0%) | 3 (100.0%) |
Disability Class by Sex by Age in Oneida
Disability Class: Hearing Difficulty
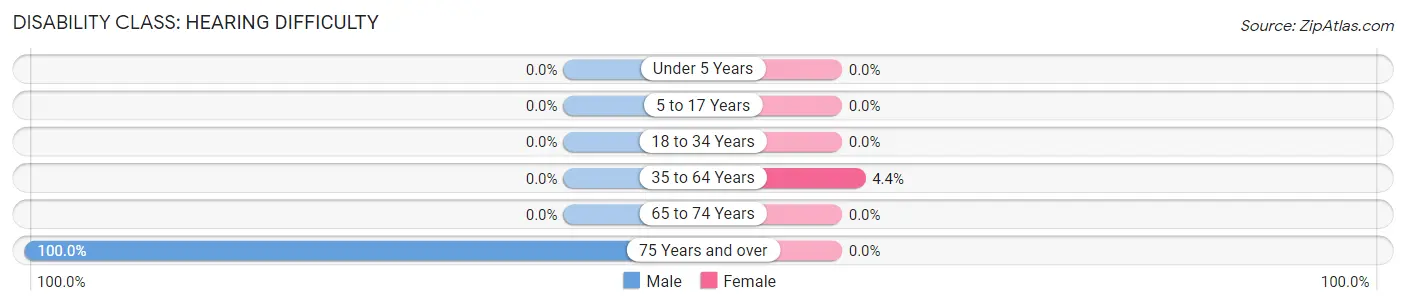
| Age Bracket | Male | Female |
| Under 5 Years | 0 (0.0%) | 0 (0.0%) |
| 5 to 17 Years | 0 (0.0%) | 0 (0.0%) |
| 18 to 34 Years | 0 (0.0%) | 0 (0.0%) |
| 35 to 64 Years | 0 (0.0%) | 2 (4.3%) |
| 65 to 74 Years | 0 (0.0%) | 0 (0.0%) |
| 75 Years and over | 3 (100.0%) | 0 (0.0%) |
Disability Class: Vision Difficulty
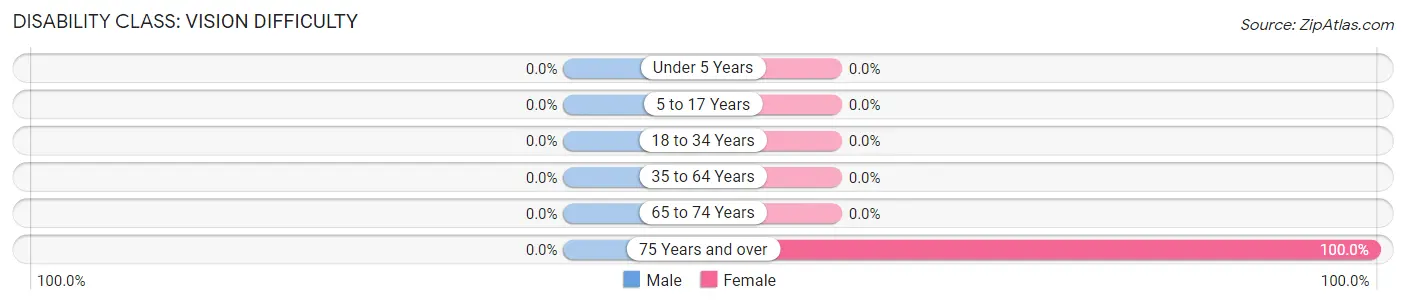
| Age Bracket | Male | Female |
| Under 5 Years | 0 (0.0%) | 0 (0.0%) |
| 5 to 17 Years | 0 (0.0%) | 0 (0.0%) |
| 18 to 34 Years | 0 (0.0%) | 0 (0.0%) |
| 35 to 64 Years | 0 (0.0%) | 0 (0.0%) |
| 65 to 74 Years | 0 (0.0%) | 0 (0.0%) |
| 75 Years and over | 0 (0.0%) | 3 (100.0%) |
Disability Class: Cognitive Difficulty
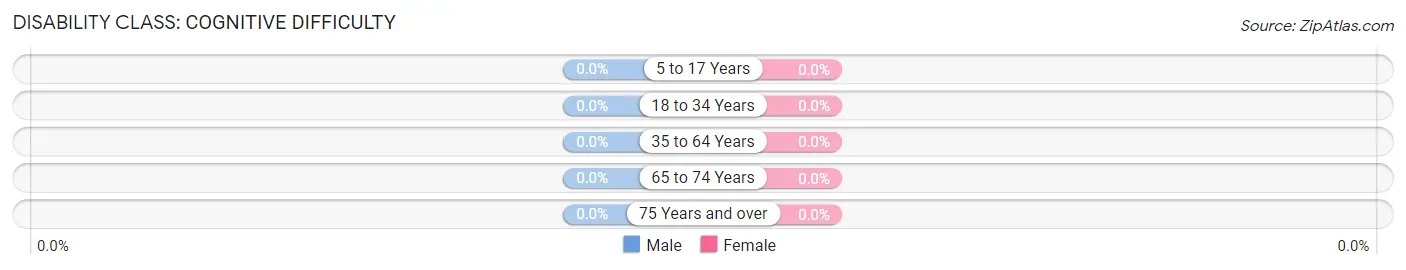
| Age Bracket | Male | Female |
| 5 to 17 Years | 0 (0.0%) | 0 (0.0%) |
| 18 to 34 Years | 0 (0.0%) | 0 (0.0%) |
| 35 to 64 Years | 0 (0.0%) | 0 (0.0%) |
| 65 to 74 Years | 0 (0.0%) | 0 (0.0%) |
| 75 Years and over | 0 (0.0%) | 0 (0.0%) |
Disability Class: Ambulatory Difficulty
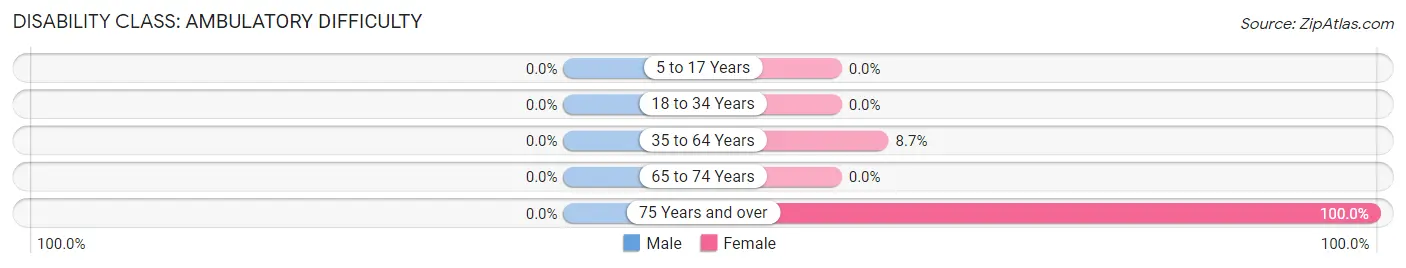
| Age Bracket | Male | Female |
| 5 to 17 Years | 0 (0.0%) | 0 (0.0%) |
| 18 to 34 Years | 0 (0.0%) | 0 (0.0%) |
| 35 to 64 Years | 0 (0.0%) | 4 (8.7%) |
| 65 to 74 Years | 0 (0.0%) | 0 (0.0%) |
| 75 Years and over | 0 (0.0%) | 3 (100.0%) |
Disability Class: Self-Care Difficulty
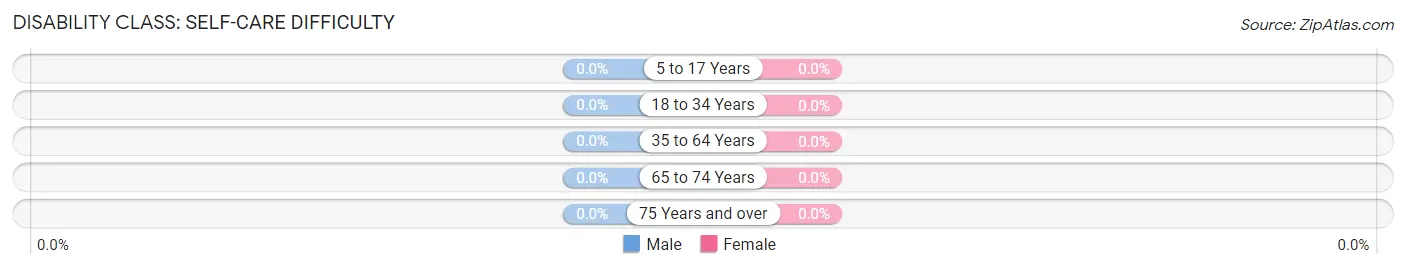
| Age Bracket | Male | Female |
| 5 to 17 Years | 0 (0.0%) | 0 (0.0%) |
| 18 to 34 Years | 0 (0.0%) | 0 (0.0%) |
| 35 to 64 Years | 0 (0.0%) | 0 (0.0%) |
| 65 to 74 Years | 0 (0.0%) | 0 (0.0%) |
| 75 Years and over | 0 (0.0%) | 0 (0.0%) |
Technology Access in Oneida
Computing Device Access in Oneida
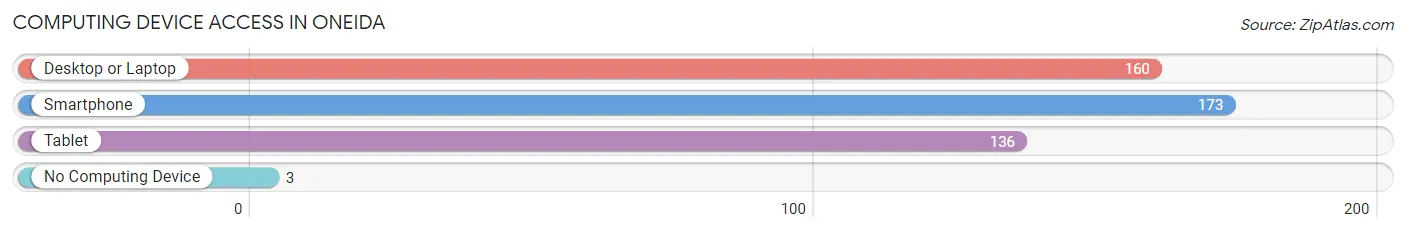
| Device Type | # Households | % Households |
| Desktop or Laptop | 160 | 88.4% |
| Smartphone | 173 | 95.6% |
| Tablet | 136 | 75.1% |
| No Computing Device | 3 | 1.7% |
| Total | 181 | 100.0% |
Internet Access in Oneida
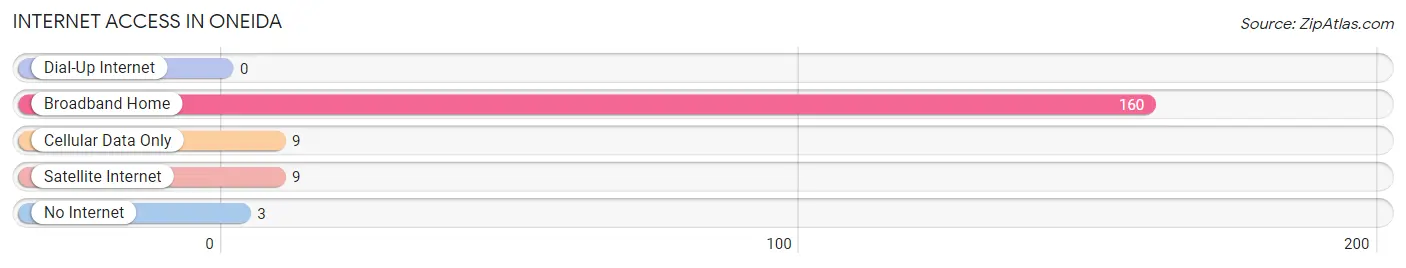
| Internet Type | # Households | % Households |
| Dial-Up Internet | 0 | 0.0% |
| Broadband Home | 160 | 88.4% |
| Cellular Data Only | 9 | 5.0% |
| Satellite Internet | 9 | 5.0% |
| No Internet | 3 | 1.7% |
| Total | 181 | 100.0% |
Oneida Summary
Oneida is a small borough located in the southwestern corner of Butler County, Pennsylvania. It is situated along the banks of the Connoquenessing Creek, approximately 25 miles north of Pittsburgh. The population of Oneida was 1,093 at the 2010 census.
History
Oneida was founded in 1832 by a group of settlers from New England. The town was named after the Oneida Indians, who had lived in the area prior to the arrival of the settlers. The first post office was established in 1833, and the first school was built in 1835.
In 1845, the Pennsylvania Railroad was built through the town, connecting it to Pittsburgh and other nearby towns. This allowed for the growth of the town, as it became a popular stop for travelers.
In the late 19th century, Oneida was a thriving industrial center, with several factories and mills located in the town. The most prominent of these was the Oneida Iron Works, which was established in 1872 and produced a variety of products, including nails, bolts, and other hardware.
Geography
Oneida is located at 40°51'N, 79°59'W (40.851, -79.983). According to the United States Census Bureau, the borough has a total area of 0.6 square miles (1.6 km2), all of it land.
Economy
Oneida’s economy is largely based on agriculture and light industry. The town is home to several small businesses, including a grocery store, a hardware store, and a few restaurants.
The town is also home to the Oneida Iron Works, which produces a variety of products, including nails, bolts, and other hardware. The company has been in operation since 1872 and is one of the oldest businesses in the area.
Demographics
As of the 2010 census, there were 1,093 people, 441 households, and 287 families residing in the borough. The population density was 1,817.5 people per square mile (700.3/km2). There were 471 housing units at an average density of 781.7 per square mile (301.7/km2). The racial makeup of the borough was 97.7% White, 0.7% African American, 0.2% Native American, 0.2% Asian, 0.1% from other races, and 1.1% from two or more races. Hispanic or Latino of any race were 0.7% of the population.
There were 441 households, out of which 28.2% had children under the age of 18 living with them, 48.2% were married couples living together, 11.3% had a female householder with no husband present, and 35.3% were non-families. 30.2% of all households were made up of individuals, and 14.3% had someone living alone who was 65 years of age or older. The average household size was 2.47 and the average family size was 3.09.
In the borough, the population was spread out, with 24.2% under the age of 18, 7.2% from 18 to 24, 28.2% from 25 to 44, 24.2% from 45 to 64, and 16.2% who were 65 years of age or older. The median age was 38 years. For every 100 females, there were 94.2 males. For every 100 females age 18 and over, there were 91.2 males.
The median income for a household in the borough was $37,500, and the median income for a family was $45,000. Males had a median income of $32,500 versus $25,000 for females. The per capita income for the borough was $17,945. About 6.2% of families and 8.2% of the population were below the poverty line, including 10.2% of those under age 18 and 8.2% of those age 65 or over.
Common Questions
What is Per Capita Income in Oneida?
Per Capita income in Oneida is $42,969.
What is the Median Family Income in Oneida?
Median Family Income in Oneida is $96,092.
What is the Median Household income in Oneida?
Median Household Income in Oneida is $153,099.
What is Income or Wage Gap in Oneida?
Income or Wage Gap in Oneida is 39.5%.
Women in Oneida earn 60.5 cents for every dollar earned by a man.
What is Inequality or Gini Index in Oneida?
Inequality or Gini Index in Oneida is 0.23.
What is the Total Population of Oneida?
Total Population of Oneida is 373.
What is the Total Male Population of Oneida?
Total Male Population of Oneida is 288.
What is the Total Female Population of Oneida?
Total Female Population of Oneida is 85.
What is the Ratio of Males per 100 Females in Oneida?
There are 338.82 Males per 100 Females in Oneida.
What is the Ratio of Females per 100 Males in Oneida?
There are 29.51 Females per 100 Males in Oneida.
What is the Median Population Age in Oneida?
Median Population Age in Oneida is 36.6 Years.
What is the Average Family Size in Oneida
Average Family Size in Oneida is 2.0 People.
What is the Average Household Size in Oneida
Average Household Size in Oneida is 2.1 People.
How Large is the Labor Force in Oneida?
There are 220 People in the Labor Forcein in Oneida.
What is the Percentage of People in the Labor Force in Oneida?
89.4% of People are in the Labor Force in Oneida.