Zip Codes with the Highest Percentage of Hispanic or Latino Population in Reading, PA
RELATED REPORTS & OPTIONS
Hispanic or Latino
Reading
Compare Zip Codes
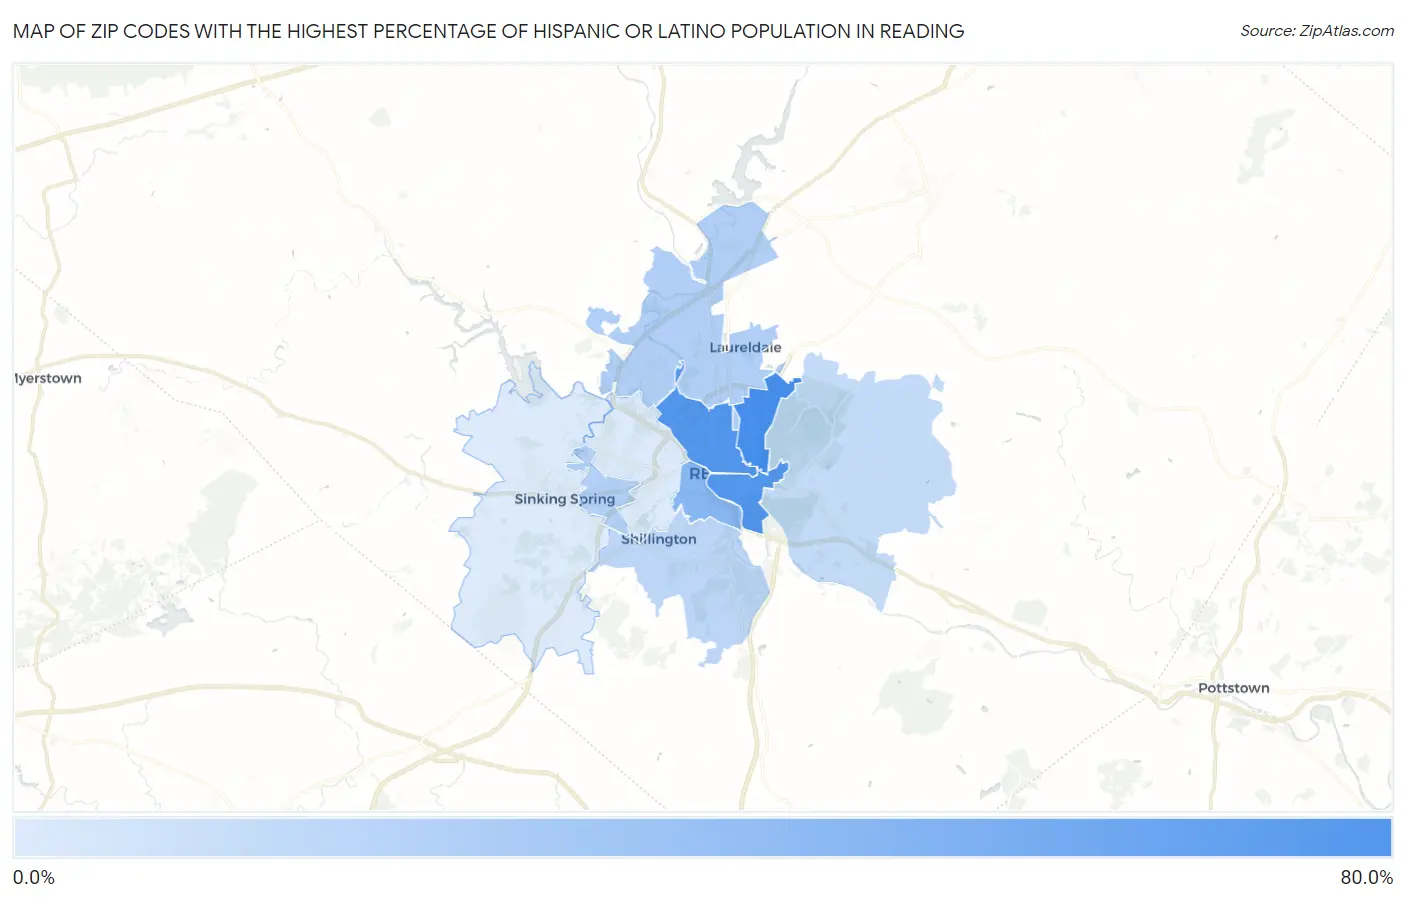
Map of Zip Codes with the Highest Percentage of Hispanic or Latino Population in Reading
9.9%
73.3%
Zip Codes with the Highest Percentage of Hispanic or Latino Population in Reading, PA
| Zip Code | Hispanic or Latino | vs State | vs National | |
| 1. | 19604 | 73.3% | 8.1%(+65.2)#2 | 18.7%(+54.7)#698 |
| 2. | 19601 | 67.4% | 8.1%(+59.3)#4 | 18.7%(+48.7)#872 |
| 3. | 19602 | 66.7% | 8.1%(+58.6)#5 | 18.7%(+48.1)#890 |
| 4. | 19611 | 42.8% | 8.1%(+34.6)#18 | 18.7%(+24.1)#1,987 |
| 5. | 19605 | 25.4% | 8.1%(+17.2)#46 | 18.7%(+6.70)#3,759 |
| 6. | 19609 | 24.6% | 8.1%(+16.5)#47 | 18.7%(+5.95)#3,877 |
| 7. | 19607 | 20.9% | 8.1%(+12.8)#64 | 18.7%(+2.23)#4,581 |
| 8. | 19606 | 19.0% | 8.1%(+10.8)#77 | 18.7%(+0.312)#5,062 |
| 9. | 19608 | 10.0% | 8.1%(+1.89)#166 | 18.7%(-8.64)#8,895 |
| 10. | 19610 | 9.9% | 8.1%(+1.74)#173 | 18.7%(-8.79)#9,012 |
1
Common Questions
What are the Top 5 Zip Codes with the Highest Percentage of Hispanic or Latino Population in Reading, PA?
Top 5 Zip Codes with the Highest Percentage of Hispanic or Latino Population in Reading, PA are:
What zip code has the Highest Percentage of Hispanic or Latino Population in Reading, PA?
19604 has the Highest Percentage of Hispanic or Latino Population in Reading, PA with 73.3%.
What is the Percentage of Hispanic or Latino Population in Reading, PA?
Percentage of Hispanic or Latino Population in Reading is 67.2%.
What is the Percentage of Hispanic or Latino Population in Pennsylvania?
Percentage of Hispanic or Latino Population in Pennsylvania is 8.1%.
What is the Percentage of Hispanic or Latino Population in the United States?
Percentage of Hispanic or Latino Population in the United States is 18.7%.