Shillington borough, PA Map & Demographics
Shillington borough Overview
$36,433
PER CAPITA INCOME
$94,875
AVG FAMILY INCOME
$74,583
AVG HOUSEHOLD INCOME
46.4%
WAGE / INCOME GAP [ % ]
53.6¢/ $1
WAGE / INCOME GAP [ $ ]
0.37
INEQUALITY / GINI INDEX
5,458
TOTAL POPULATION
2,827
MALE POPULATION
2,631
FEMALE POPULATION
107.45
MALES / 100 FEMALES
93.07
FEMALES / 100 MALES
36.3
MEDIAN AGE
3.1
AVG FAMILY SIZE
2.4
AVG HOUSEHOLD SIZE
3,184
LABOR FORCE [ PEOPLE ]
75.4%
PERCENT IN LABOR FORCE
8.2%
UNEMPLOYMENT RATE
Income in Shillington borough
Income Overview in Shillington borough
Per Capita Income in Shillington borough is $36,433, while median incomes of families and households are $94,875 and $74,583 respectively.
| Characteristic | Number | Measure |
| Per Capita Income | 5,458 | $36,433 |
| Median Family Income | 1,385 | $94,875 |
| Mean Family Income | 1,385 | $100,388 |
| Median Household Income | 2,303 | $74,583 |
| Mean Household Income | 2,303 | $83,076 |
| Income Deficit | 1,385 | $0 |
| Wage / Income Gap (%) | 5,458 | 46.40% |
| Wage / Income Gap ($) | 5,458 | 53.60¢ per $1 |
| Gini / Inequality Index | 5,458 | 0.37 |
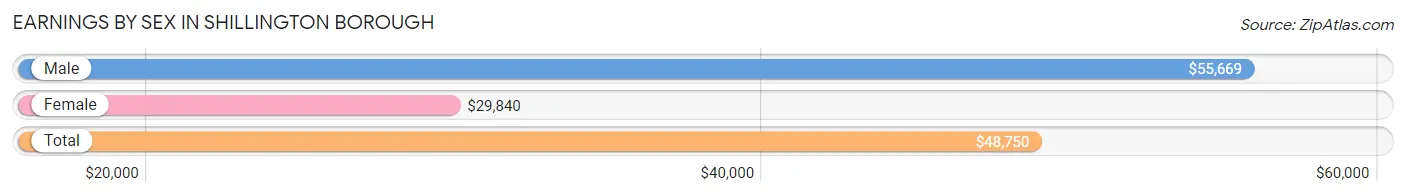
Earnings by Sex in Shillington borough
Average Earnings in Shillington borough are $48,750, $55,669 for men and $29,840 for women, a difference of 46.4%.
| Sex | Number | Average Earnings |
| Male | 1,690 (53.5%) | $55,669 |
| Female | 1,468 (46.5%) | $29,840 |
| Total | 3,158 (100.0%) | $48,750 |
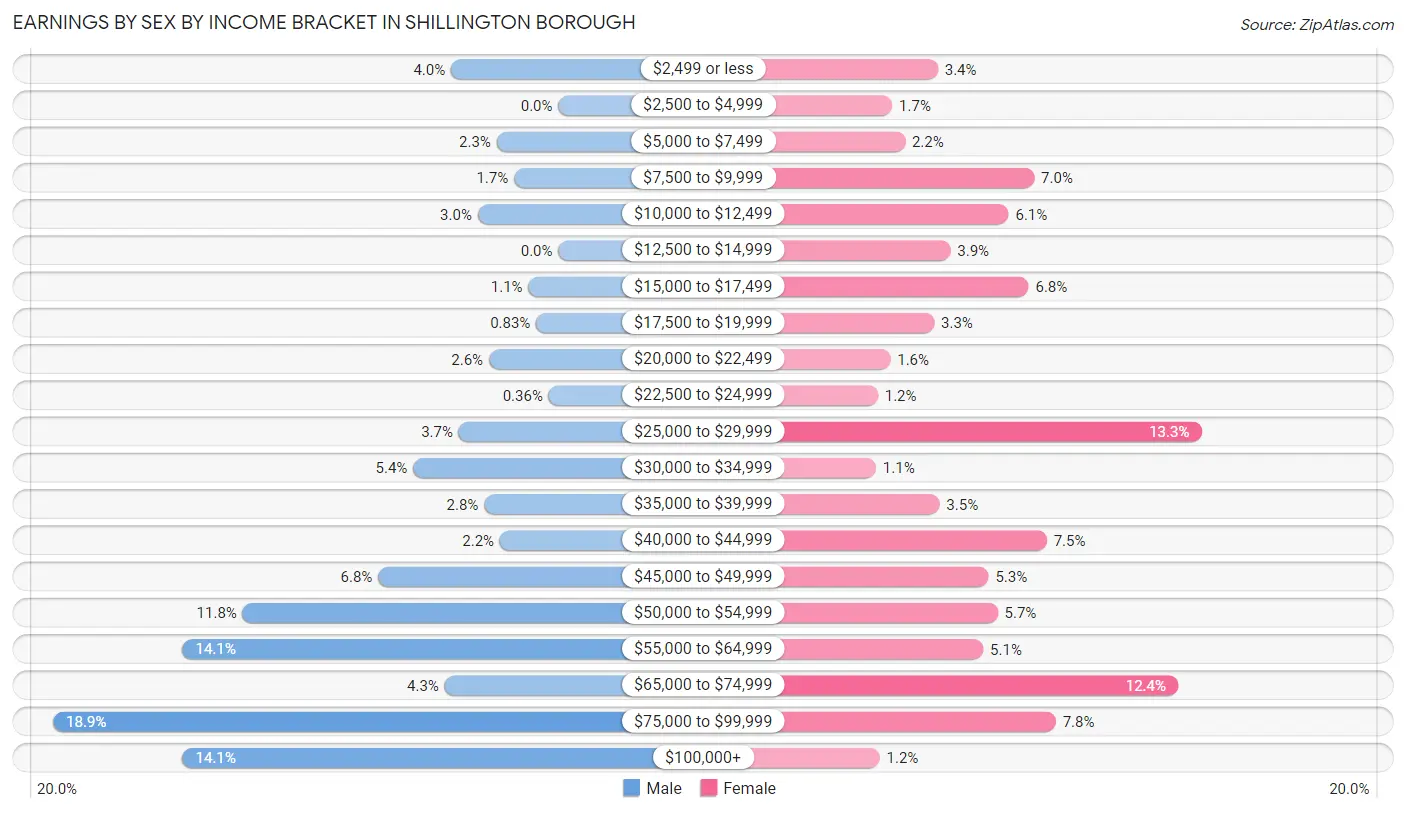
Earnings by Sex by Income Bracket in Shillington borough
The most common earnings brackets in Shillington borough are $75,000 to $99,999 for men (320 | 18.9%) and $25,000 to $29,999 for women (195 | 13.3%).
| Income | Male | Female |
| $2,499 or less | 68 (4.0%) | 50 (3.4%) |
| $2,500 to $4,999 | 0 (0.0%) | 25 (1.7%) |
| $5,000 to $7,499 | 39 (2.3%) | 32 (2.2%) |
| $7,500 to $9,999 | 28 (1.7%) | 103 (7.0%) |
| $10,000 to $12,499 | 51 (3.0%) | 89 (6.1%) |
| $12,500 to $14,999 | 0 (0.0%) | 57 (3.9%) |
| $15,000 to $17,499 | 19 (1.1%) | 100 (6.8%) |
| $17,500 to $19,999 | 14 (0.8%) | 48 (3.3%) |
| $20,000 to $22,499 | 44 (2.6%) | 24 (1.6%) |
| $22,500 to $24,999 | 6 (0.4%) | 17 (1.2%) |
| $25,000 to $29,999 | 63 (3.7%) | 195 (13.3%) |
| $30,000 to $34,999 | 92 (5.4%) | 16 (1.1%) |
| $35,000 to $39,999 | 47 (2.8%) | 51 (3.5%) |
| $40,000 to $44,999 | 37 (2.2%) | 110 (7.5%) |
| $45,000 to $49,999 | 114 (6.8%) | 78 (5.3%) |
| $50,000 to $54,999 | 200 (11.8%) | 83 (5.7%) |
| $55,000 to $64,999 | 238 (14.1%) | 75 (5.1%) |
| $65,000 to $74,999 | 72 (4.3%) | 182 (12.4%) |
| $75,000 to $99,999 | 320 (18.9%) | 115 (7.8%) |
| $100,000+ | 238 (14.1%) | 18 (1.2%) |
| Total | 1,690 (100.0%) | 1,468 (100.0%) |
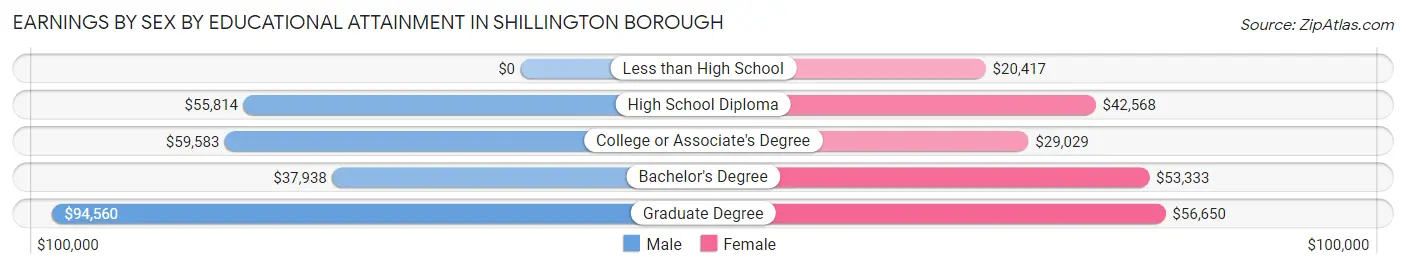
Earnings by Sex by Educational Attainment in Shillington borough
Average earnings in Shillington borough are $58,397 for men and $40,888 for women, a difference of 30.0%. Men with an educational attainment of graduate degree enjoy the highest average annual earnings of $94,560, while those with bachelor's degree education earn the least with $37,938. Women with an educational attainment of graduate degree earn the most with the average annual earnings of $56,650, while those with less than high school education have the smallest earnings of $20,417.
| Educational Attainment | Male Income | Female Income |
| Less than High School | - | - |
| High School Diploma | $55,814 | $42,568 |
| College or Associate's Degree | $59,583 | $29,029 |
| Bachelor's Degree | $37,938 | $53,333 |
| Graduate Degree | $94,560 | $56,650 |
| Total | $58,397 | $40,888 |
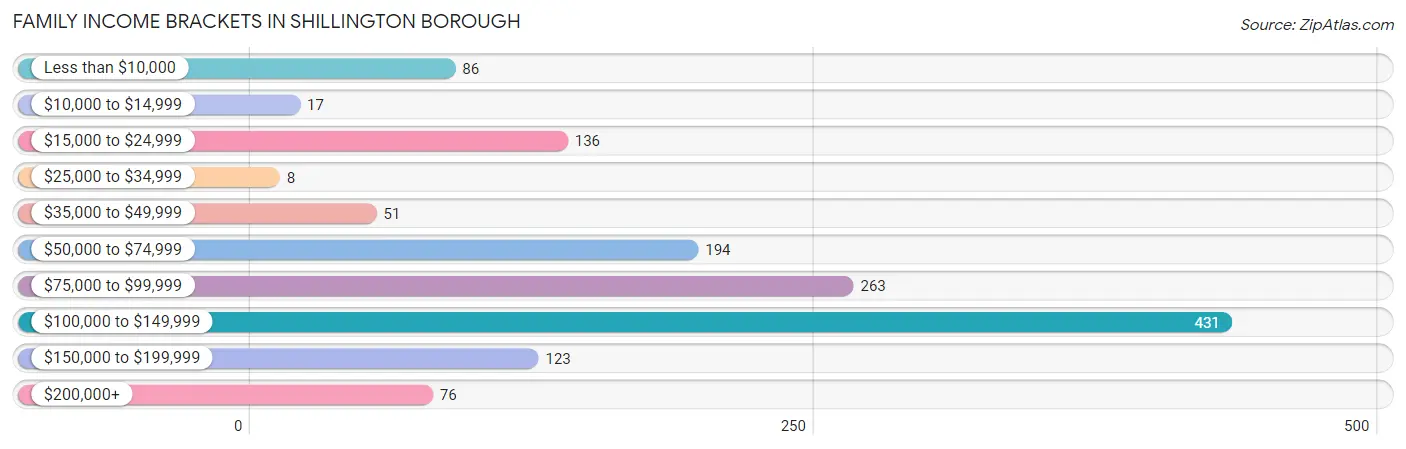
Family Income in Shillington borough
Family Income Brackets in Shillington borough
According to the Shillington borough family income data, there are 431 families falling into the $100,000 to $149,999 income range, which is the most common income bracket and makes up 31.1% of all families. Conversely, the $25,000 to $34,999 income bracket is the least frequent group with only 8 families (0.6%) belonging to this category.
| Income Bracket | # Families | % Families |
| Less than $10,000 | 86 | 6.2% |
| $10,000 to $14,999 | 17 | 1.2% |
| $15,000 to $24,999 | 136 | 9.8% |
| $25,000 to $34,999 | 8 | 0.6% |
| $35,000 to $49,999 | 51 | 3.7% |
| $50,000 to $74,999 | 194 | 14.0% |
| $75,000 to $99,999 | 263 | 19.0% |
| $100,000 to $149,999 | 431 | 31.1% |
| $150,000 to $199,999 | 123 | 8.9% |
| $200,000+ | 76 | 5.5% |
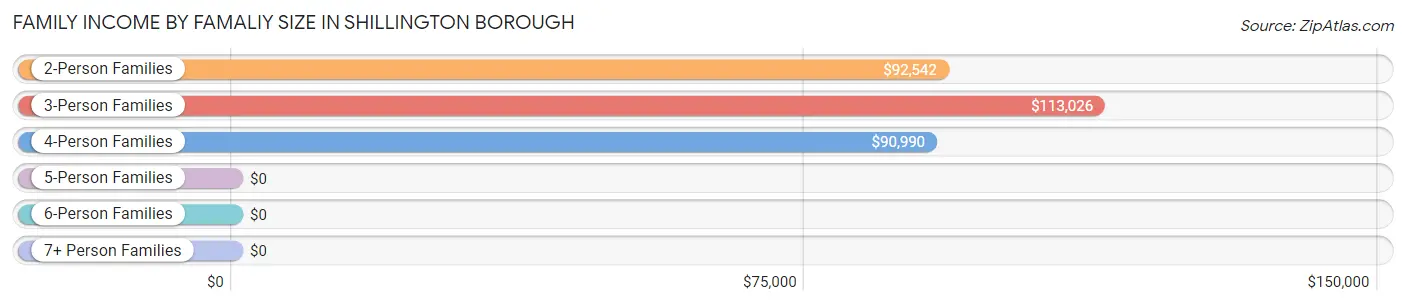
Family Income by Famaliy Size in Shillington borough
3-person families (364 | 26.3%) account for the highest median family income in Shillington borough with $113,026 per family, while 2-person families (569 | 41.1%) have the highest median income of $46,271 per family member.
| Income Bracket | # Families | Median Income |
| 2-Person Families | 569 (41.1%) | $92,542 |
| 3-Person Families | 364 (26.3%) | $113,026 |
| 4-Person Families | 435 (31.4%) | $90,990 |
| 5-Person Families | 17 (1.2%) | $0 |
| 6-Person Families | 0 (0.0%) | $0 |
| 7+ Person Families | 0 (0.0%) | $0 |
| Total | 1,385 (100.0%) | $94,875 |
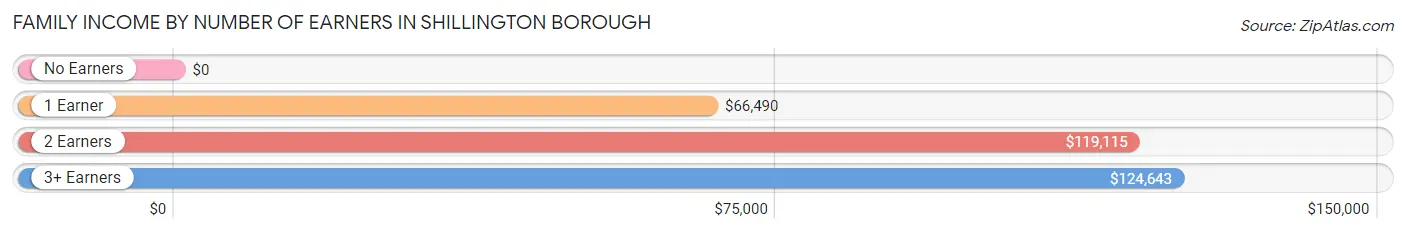
Family Income by Number of Earners in Shillington borough
| Number of Earners | # Families | Median Income |
| No Earners | 144 (10.4%) | $0 |
| 1 Earner | 463 (33.4%) | $66,490 |
| 2 Earners | 618 (44.6%) | $119,115 |
| 3+ Earners | 160 (11.6%) | $124,643 |
| Total | 1,385 (100.0%) | $94,875 |
Household Income in Shillington borough
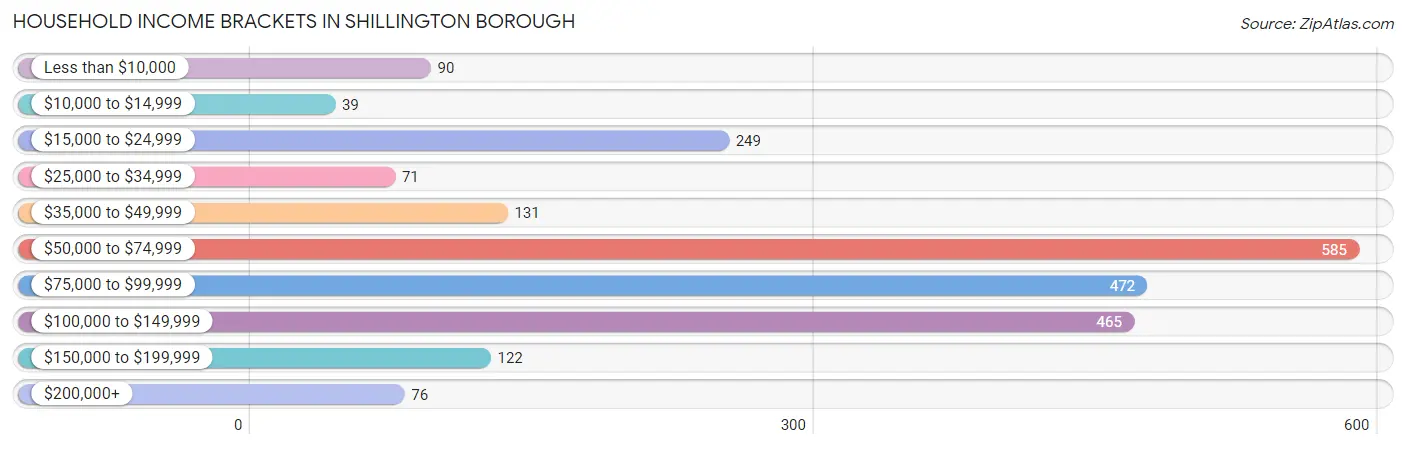
Household Income Brackets in Shillington borough
With 585 households falling in the category, the $50,000 to $74,999 income range is the most frequent in Shillington borough, accounting for 25.4% of all households. In contrast, only 39 households (1.7%) fall into the $10,000 to $14,999 income bracket, making it the least populous group.
| Income Bracket | # Households | % Households |
| Less than $10,000 | 90 | 3.9% |
| $10,000 to $14,999 | 39 | 1.7% |
| $15,000 to $24,999 | 249 | 10.8% |
| $25,000 to $34,999 | 71 | 3.1% |
| $35,000 to $49,999 | 131 | 5.7% |
| $50,000 to $74,999 | 585 | 25.4% |
| $75,000 to $99,999 | 472 | 20.5% |
| $100,000 to $149,999 | 465 | 20.2% |
| $150,000 to $199,999 | 122 | 5.3% |
| $200,000+ | 76 | 3.3% |
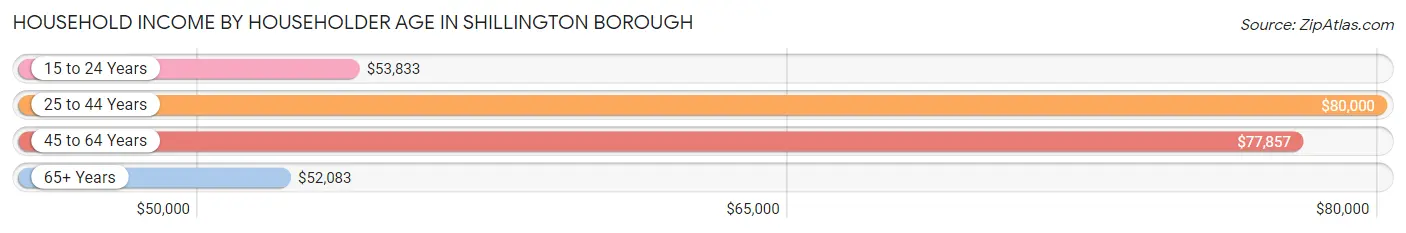
Household Income by Householder Age in Shillington borough
The median household income in Shillington borough is $74,583, with the highest median household income of $80,000 found in the 25 to 44 years age bracket for the primary householder. A total of 914 households (39.7%) fall into this category. Meanwhile, the 65+ years age bracket for the primary householder has the lowest median household income of $52,083, with 493 households (21.4%) in this group.
| Income Bracket | # Households | Median Income |
| 15 to 24 Years | 78 (3.4%) | $53,833 |
| 25 to 44 Years | 914 (39.7%) | $80,000 |
| 45 to 64 Years | 818 (35.5%) | $77,857 |
| 65+ Years | 493 (21.4%) | $52,083 |
| Total | 2,303 (100.0%) | $74,583 |
Poverty in Shillington borough
Income Below Poverty by Sex and Age in Shillington borough
With 16.1% poverty level for males and 21.0% for females among the residents of Shillington borough, 5 year old males and under 5 year old females are the most vulnerable to poverty, with 71 males (100.0%) and 133 females (66.8%) in their respective age groups living below the poverty level.
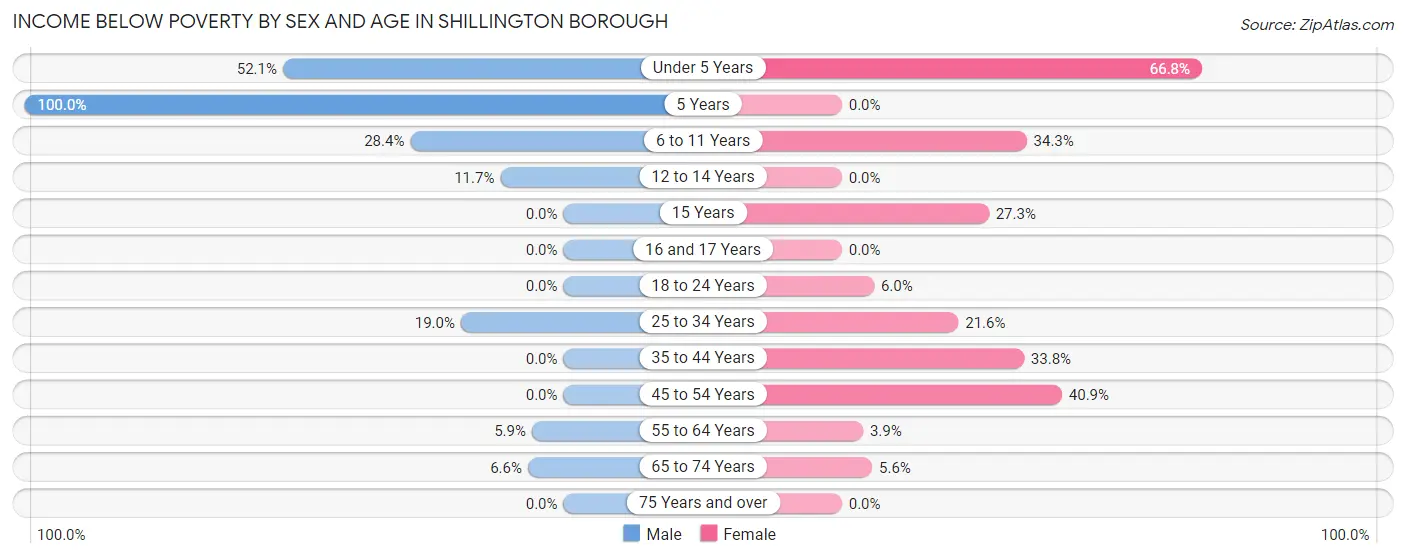
| Age Bracket | Male | Female |
| Under 5 Years | 176 (52.1%) | 133 (66.8%) |
| 5 Years | 71 (100.0%) | 0 (0.0%) |
| 6 to 11 Years | 52 (28.4%) | 71 (34.3%) |
| 12 to 14 Years | 17 (11.7%) | 0 (0.0%) |
| 15 Years | 0 (0.0%) | 18 (27.3%) |
| 16 and 17 Years | 0 (0.0%) | 0 (0.0%) |
| 18 to 24 Years | 0 (0.0%) | 8 (6.0%) |
| 25 to 34 Years | 103 (19.0%) | 112 (21.6%) |
| 35 to 44 Years | 0 (0.0%) | 121 (33.8%) |
| 45 to 54 Years | 0 (0.0%) | 58 (40.8%) |
| 55 to 64 Years | 23 (5.9%) | 17 (3.9%) |
| 65 to 74 Years | 14 (6.6%) | 13 (5.6%) |
| 75 Years and over | 0 (0.0%) | 0 (0.0%) |
| Total | 456 (16.1%) | 551 (21.0%) |
Income Above Poverty by Sex and Age in Shillington borough
According to the poverty statistics in Shillington borough, males aged 18 to 24 years and females aged 12 to 14 years are the age groups that are most secure financially, with 100.0% of males and 100.0% of females in these age groups living above the poverty line.
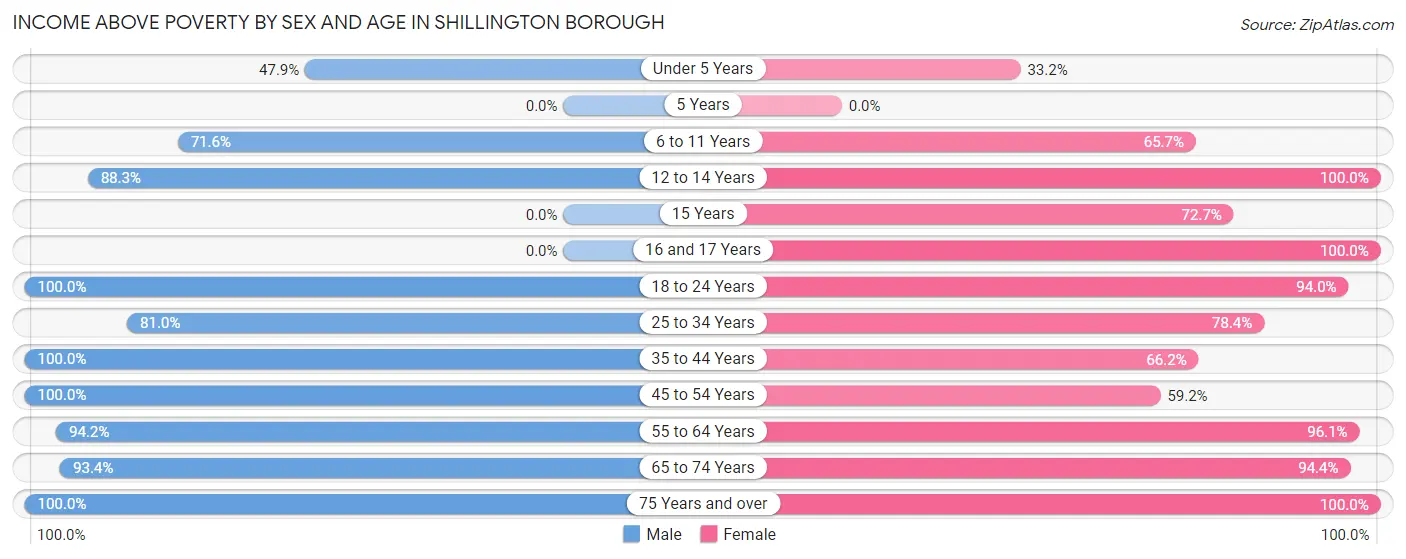
| Age Bracket | Male | Female |
| Under 5 Years | 162 (47.9%) | 66 (33.2%) |
| 5 Years | 0 (0.0%) | 0 (0.0%) |
| 6 to 11 Years | 131 (71.6%) | 136 (65.7%) |
| 12 to 14 Years | 128 (88.3%) | 24 (100.0%) |
| 15 Years | 0 (0.0%) | 48 (72.7%) |
| 16 and 17 Years | 0 (0.0%) | 61 (100.0%) |
| 18 to 24 Years | 197 (100.0%) | 126 (94.0%) |
| 25 to 34 Years | 438 (81.0%) | 406 (78.4%) |
| 35 to 44 Years | 414 (100.0%) | 237 (66.2%) |
| 45 to 54 Years | 215 (100.0%) | 84 (59.2%) |
| 55 to 64 Years | 370 (94.2%) | 416 (96.1%) |
| 65 to 74 Years | 198 (93.4%) | 218 (94.4%) |
| 75 Years and over | 118 (100.0%) | 253 (100.0%) |
| Total | 2,371 (83.9%) | 2,075 (79.0%) |
Income Below Poverty Among Married-Couple Families in Shillington borough
The poverty statistics for married-couple families in Shillington borough show that 4.3% or 39 of the total 911 families live below the poverty line. Families with 1 or 2 children have the highest poverty rate of 6.2%, comprising of 25 families. On the other hand, families with no children have the lowest poverty rate of 2.8%, which includes 14 families.
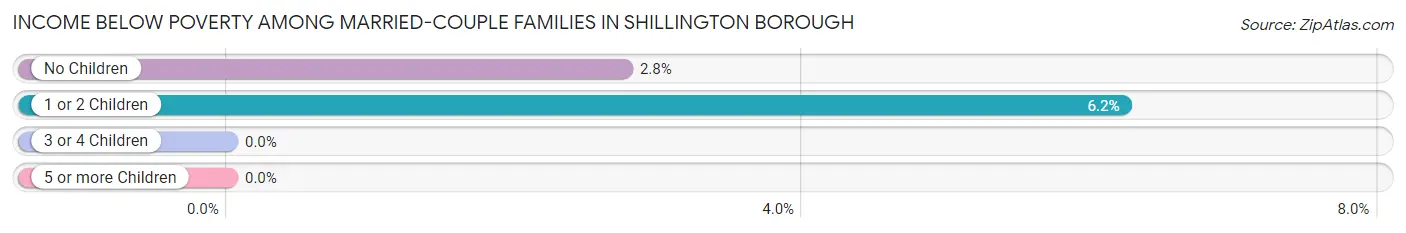
| Children | Above Poverty | Below Poverty |
| No Children | 495 (97.3%) | 14 (2.8%) |
| 1 or 2 Children | 377 (93.8%) | 25 (6.2%) |
| 3 or 4 Children | 0 (0.0%) | 0 (0.0%) |
| 5 or more Children | 0 (0.0%) | 0 (0.0%) |
| Total | 872 (95.7%) | 39 (4.3%) |
Income Below Poverty Among Single-Parent Households in Shillington borough
According to the poverty data in Shillington borough, 47.8% or 75 single-father households and 39.4% or 125 single-mother households are living below the poverty line. Among single-father households, those with 1 or 2 children have the highest poverty rate, with 75 households (70.8%) experiencing poverty. Likewise, among single-mother households, those with 3 or 4 children have the highest poverty rate, with 68 households (100.0%) falling below the poverty line.
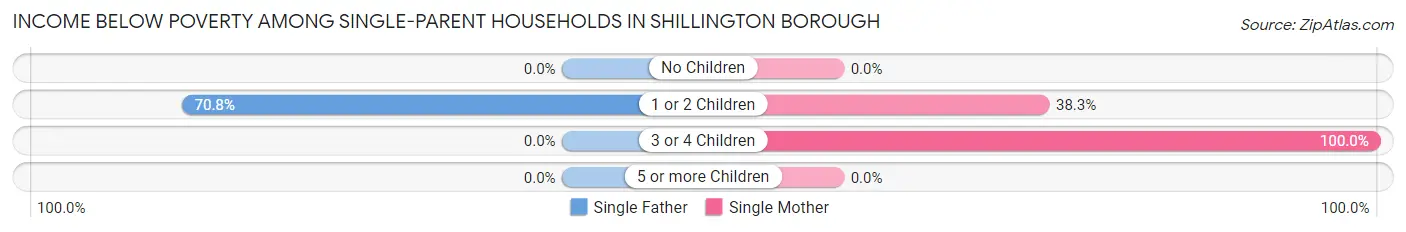
| Children | Single Father | Single Mother |
| No Children | 0 (0.0%) | 0 (0.0%) |
| 1 or 2 Children | 75 (70.8%) | 57 (38.3%) |
| 3 or 4 Children | 0 (0.0%) | 68 (100.0%) |
| 5 or more Children | 0 (0.0%) | 0 (0.0%) |
| Total | 75 (47.8%) | 125 (39.4%) |
Income Below Poverty Among Married-Couple vs Single-Parent Households in Shillington borough
The poverty data for Shillington borough shows that 39 of the married-couple family households (4.3%) and 200 of the single-parent households (42.2%) are living below the poverty level. Within the married-couple family households, those with 1 or 2 children have the highest poverty rate, with 25 households (6.2%) falling below the poverty line. Among the single-parent households, those with 3 or 4 children have the highest poverty rate, with 68 household (100.0%) living below poverty.
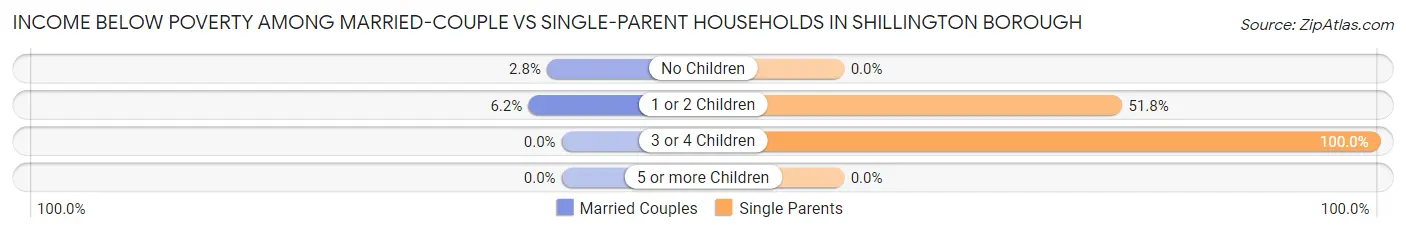
| Children | Married-Couple Families | Single-Parent Households |
| No Children | 14 (2.8%) | 0 (0.0%) |
| 1 or 2 Children | 25 (6.2%) | 132 (51.8%) |
| 3 or 4 Children | 0 (0.0%) | 68 (100.0%) |
| 5 or more Children | 0 (0.0%) | 0 (0.0%) |
| Total | 39 (4.3%) | 200 (42.2%) |
Race in Shillington borough
The most populous races in Shillington borough are White / Caucasian (4,529 | 83.0%), Hispanic or Latino (1,172 | 21.5%), and Two or more Races (690 | 12.6%).
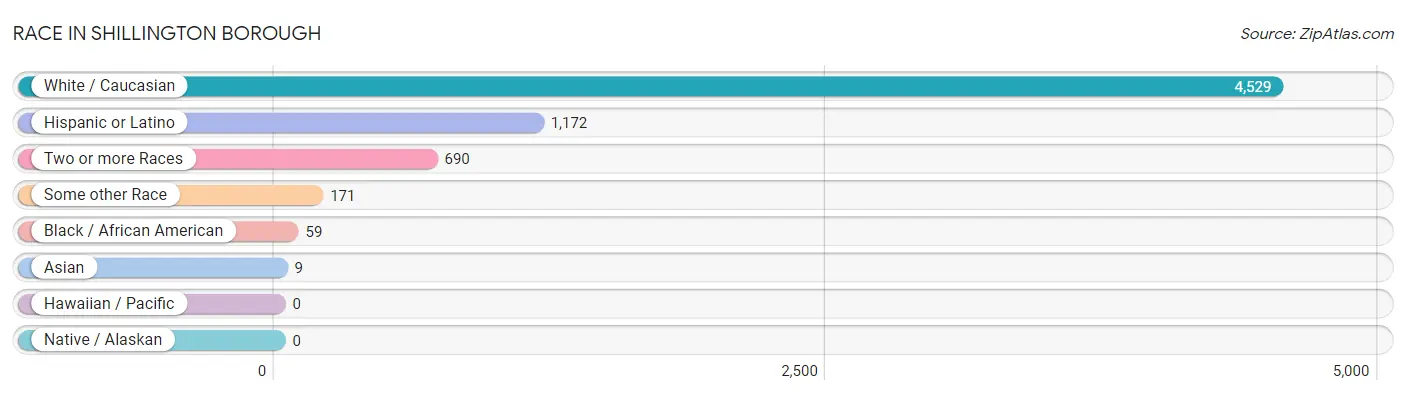
| Race | # Population | % Population |
| Asian | 9 | 0.2% |
| Black / African American | 59 | 1.1% |
| Hawaiian / Pacific | 0 | 0.0% |
| Hispanic or Latino | 1,172 | 21.5% |
| Native / Alaskan | 0 | 0.0% |
| White / Caucasian | 4,529 | 83.0% |
| Two or more Races | 690 | 12.6% |
| Some other Race | 171 | 3.1% |
| Total | 5,458 | 100.0% |
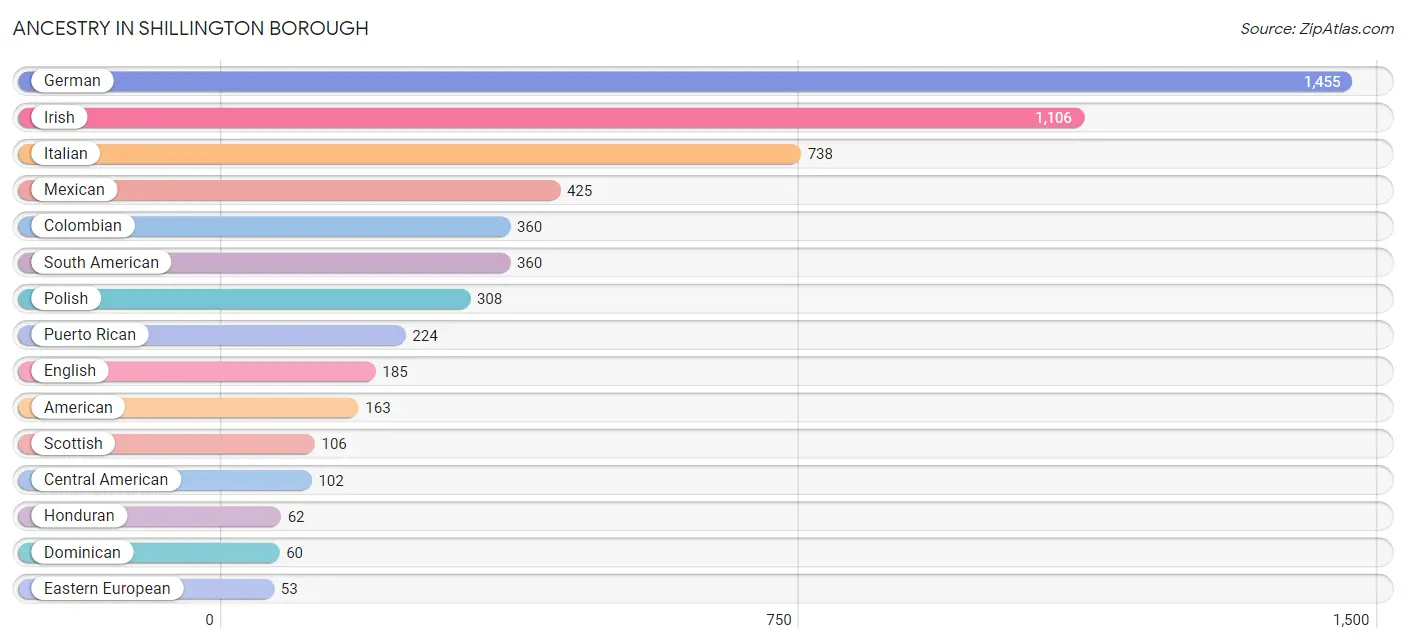
Ancestry in Shillington borough
The most populous ancestries reported in Shillington borough are German (1,455 | 26.7%), Irish (1,106 | 20.3%), Italian (738 | 13.5%), Mexican (425 | 7.8%), and Colombian (360 | 6.6%), together accounting for 74.8% of all Shillington borough residents.
| Ancestry | # Population | % Population |
| African | 1 | 0.0% |
| American | 163 | 3.0% |
| Arab | 14 | 0.3% |
| Burmese | 8 | 0.2% |
| Central American | 102 | 1.9% |
| Colombian | 360 | 6.6% |
| Croatian | 5 | 0.1% |
| Czech | 28 | 0.5% |
| Danish | 5 | 0.1% |
| Dominican | 60 | 1.1% |
| Eastern European | 53 | 1.0% |
| English | 185 | 3.4% |
| Finnish | 36 | 0.7% |
| French | 43 | 0.8% |
| French Canadian | 27 | 0.5% |
| German | 1,455 | 26.7% |
| Greek | 19 | 0.4% |
| Honduran | 62 | 1.1% |
| Hungarian | 11 | 0.2% |
| Indian (Asian) | 1 | 0.0% |
| Irish | 1,106 | 20.3% |
| Italian | 738 | 13.5% |
| Latvian | 43 | 0.8% |
| Mexican | 425 | 7.8% |
| Norwegian | 14 | 0.3% |
| Polish | 308 | 5.6% |
| Puerto Rican | 224 | 4.1% |
| Salvadoran | 40 | 0.7% |
| Scottish | 106 | 1.9% |
| Slovak | 12 | 0.2% |
| South American | 360 | 6.6% |
| Subsaharan African | 1 | 0.0% |
| Swedish | 4 | 0.1% |
| Swiss | 15 | 0.3% |
| Syrian | 14 | 0.3% |
| Ukrainian | 16 | 0.3% |
| Welsh | 32 | 0.6% | View All 37 Rows |
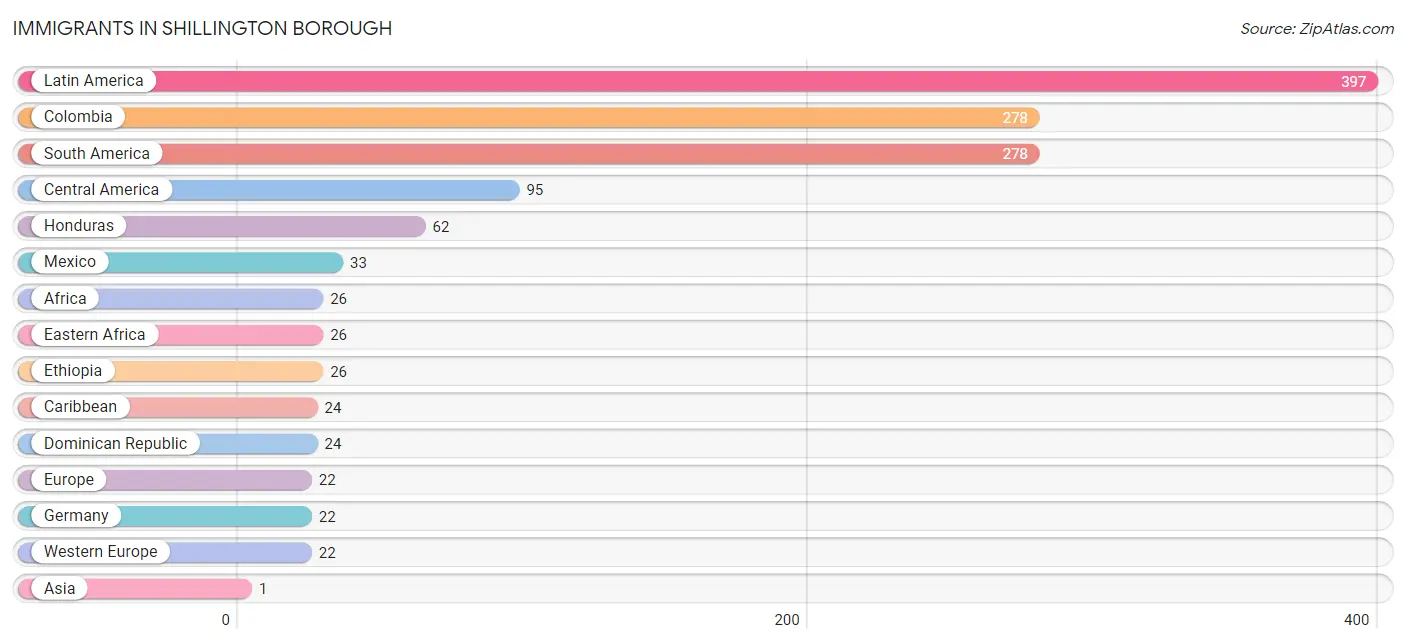
Immigrants in Shillington borough
The most numerous immigrant groups reported in Shillington borough came from Latin America (397 | 7.3%), Colombia (278 | 5.1%), South America (278 | 5.1%), Central America (95 | 1.7%), and Honduras (62 | 1.1%), together accounting for 20.3% of all Shillington borough residents.
| Immigration Origin | # Population | % Population |
| Africa | 26 | 0.5% |
| Asia | 1 | 0.0% |
| Caribbean | 24 | 0.4% |
| Central America | 95 | 1.7% |
| China | 1 | 0.0% |
| Colombia | 278 | 5.1% |
| Dominican Republic | 24 | 0.4% |
| Eastern Africa | 26 | 0.5% |
| Eastern Asia | 1 | 0.0% |
| Ethiopia | 26 | 0.5% |
| Europe | 22 | 0.4% |
| Germany | 22 | 0.4% |
| Honduras | 62 | 1.1% |
| Latin America | 397 | 7.3% |
| Mexico | 33 | 0.6% |
| South America | 278 | 5.1% |
| Western Europe | 22 | 0.4% | View All 17 Rows |
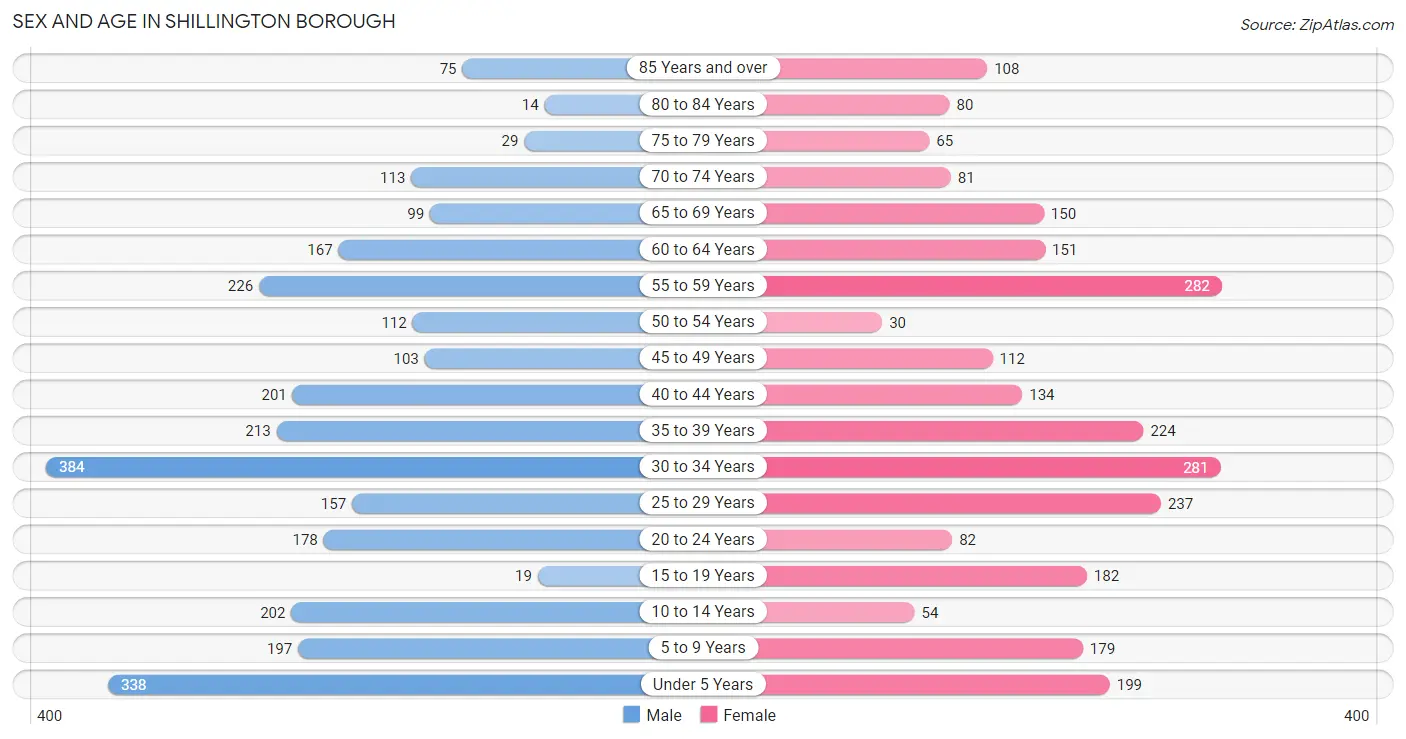
Sex and Age in Shillington borough
Sex and Age in Shillington borough
The most populous age groups in Shillington borough are 30 to 34 Years (384 | 13.6%) for men and 55 to 59 Years (282 | 10.7%) for women.
| Age Bracket | Male | Female |
| Under 5 Years | 338 (12.0%) | 199 (7.6%) |
| 5 to 9 Years | 197 (7.0%) | 179 (6.8%) |
| 10 to 14 Years | 202 (7.1%) | 54 (2.1%) |
| 15 to 19 Years | 19 (0.7%) | 182 (6.9%) |
| 20 to 24 Years | 178 (6.3%) | 82 (3.1%) |
| 25 to 29 Years | 157 (5.6%) | 237 (9.0%) |
| 30 to 34 Years | 384 (13.6%) | 281 (10.7%) |
| 35 to 39 Years | 213 (7.5%) | 224 (8.5%) |
| 40 to 44 Years | 201 (7.1%) | 134 (5.1%) |
| 45 to 49 Years | 103 (3.6%) | 112 (4.3%) |
| 50 to 54 Years | 112 (4.0%) | 30 (1.1%) |
| 55 to 59 Years | 226 (8.0%) | 282 (10.7%) |
| 60 to 64 Years | 167 (5.9%) | 151 (5.7%) |
| 65 to 69 Years | 99 (3.5%) | 150 (5.7%) |
| 70 to 74 Years | 113 (4.0%) | 81 (3.1%) |
| 75 to 79 Years | 29 (1.0%) | 65 (2.5%) |
| 80 to 84 Years | 14 (0.5%) | 80 (3.0%) |
| 85 Years and over | 75 (2.6%) | 108 (4.1%) |
| Total | 2,827 (100.0%) | 2,631 (100.0%) |
Families and Households in Shillington borough
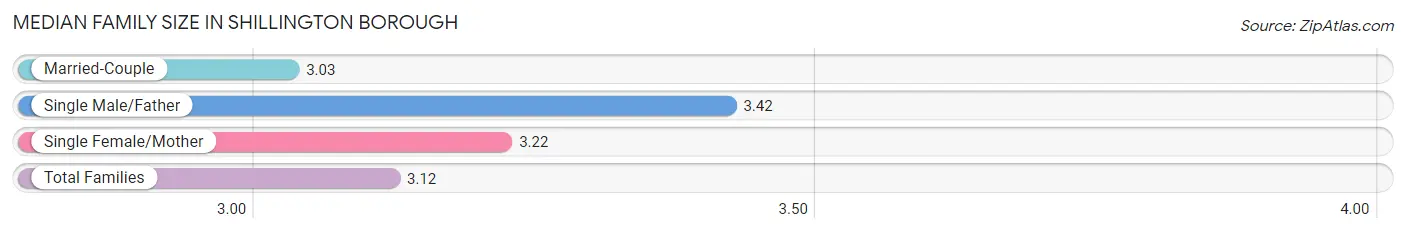
Median Family Size in Shillington borough
The median family size in Shillington borough is 3.12 persons per family, with single male/father families (157 | 11.3%) accounting for the largest median family size of 3.42 persons per family. On the other hand, married-couple families (911 | 65.8%) represent the smallest median family size with 3.03 persons per family.
| Family Type | # Families | Family Size |
| Married-Couple | 911 (65.8%) | 3.03 |
| Single Male/Father | 157 (11.3%) | 3.42 |
| Single Female/Mother | 317 (22.9%) | 3.22 |
| Total Families | 1,385 (100.0%) | 3.12 |
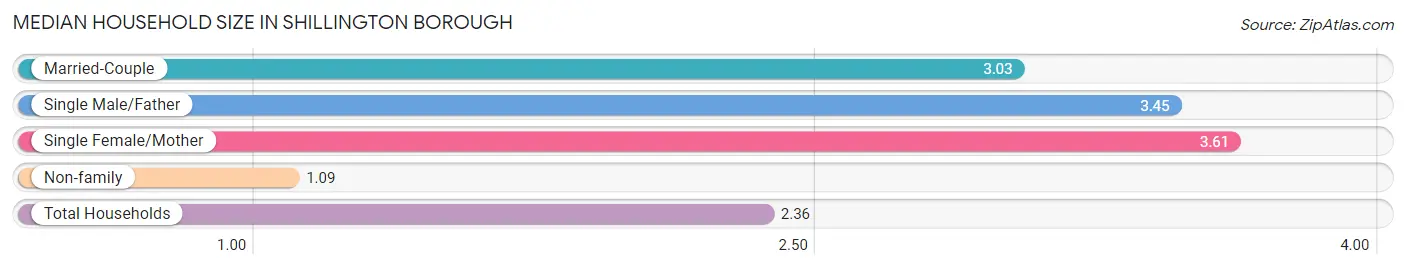
Median Household Size in Shillington borough
The median household size in Shillington borough is 2.36 persons per household, with single female/mother households (317 | 13.8%) accounting for the largest median household size of 3.61 persons per household. non-family households (918 | 39.9%) represent the smallest median household size with 1.09 persons per household.
| Household Type | # Households | Household Size |
| Married-Couple | 911 (39.6%) | 3.03 |
| Single Male/Father | 157 (6.8%) | 3.45 |
| Single Female/Mother | 317 (13.8%) | 3.61 |
| Non-family | 918 (39.9%) | 1.09 |
| Total Households | 2,303 (100.0%) | 2.36 |
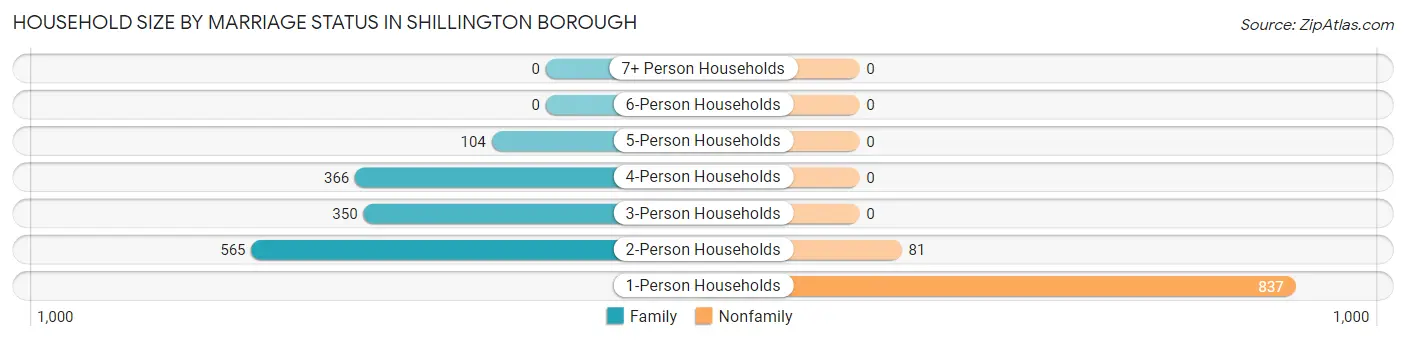
Household Size by Marriage Status in Shillington borough
Out of a total of 2,303 households in Shillington borough, 1,385 (60.1%) are family households, while 918 (39.9%) are nonfamily households. The most numerous type of family households are 2-person households, comprising 565, and the most common type of nonfamily households are 1-person households, comprising 837.
| Household Size | Family Households | Nonfamily Households |
| 1-Person Households | - | 837 (36.3%) |
| 2-Person Households | 565 (24.5%) | 81 (3.5%) |
| 3-Person Households | 350 (15.2%) | 0 (0.0%) |
| 4-Person Households | 366 (15.9%) | 0 (0.0%) |
| 5-Person Households | 104 (4.5%) | 0 (0.0%) |
| 6-Person Households | 0 (0.0%) | 0 (0.0%) |
| 7+ Person Households | 0 (0.0%) | 0 (0.0%) |
| Total | 1,385 (60.1%) | 918 (39.9%) |
Female Fertility in Shillington borough
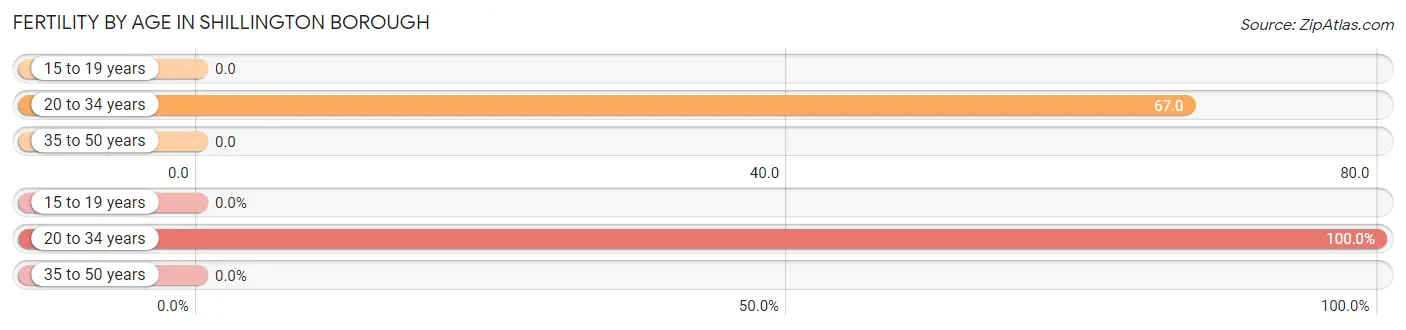
Fertility by Age in Shillington borough
Average fertility rate in Shillington borough is 32.0 births per 1,000 women. Women in the age bracket of 20 to 34 years have the highest fertility rate with 67.0 births per 1,000 women. Women in the age bracket of 20 to 34 years acount for 100.0% of all women with births.
| Age Bracket | Women with Births | Births / 1,000 Women |
| 15 to 19 years | 0 (0.0%) | 0.0 |
| 20 to 34 years | 40 (100.0%) | 67.0 |
| 35 to 50 years | 0 (0.0%) | 0.0 |
| Total | 40 (100.0%) | 32.0 |
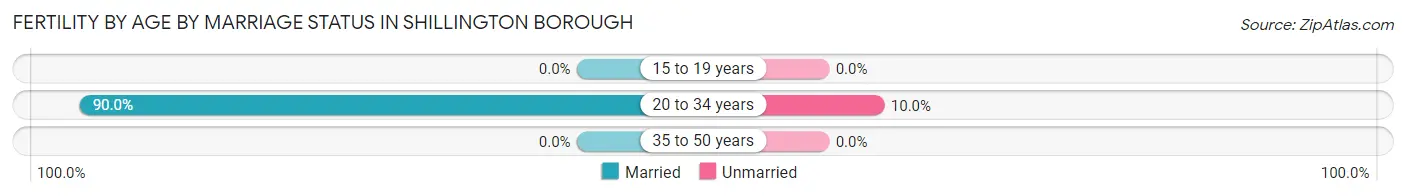
Fertility by Age by Marriage Status in Shillington borough
90.0% of women with births (40) in Shillington borough are married. The highest percentage of unmarried women with births falls into 20 to 34 years age bracket with 10.0% of them unmarried at the time of birth, while the lowest percentage of unmarried women with births belong to 20 to 34 years age bracket with 10.0% of them unmarried.
| Age Bracket | Married | Unmarried |
| 15 to 19 years | 0 (0.0%) | 0 (0.0%) |
| 20 to 34 years | 36 (90.0%) | 4 (10.0%) |
| 35 to 50 years | 0 (0.0%) | 0 (0.0%) |
| Total | 36 (90.0%) | 4 (10.0%) |
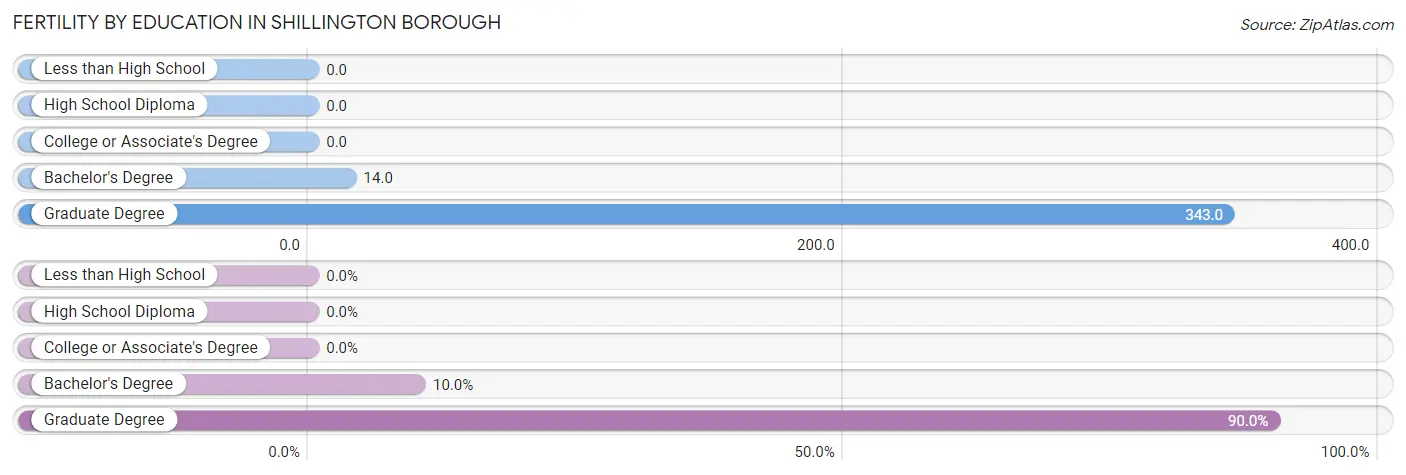
Fertility by Education in Shillington borough
| Educational Attainment | Women with Births | Births / 1,000 Women |
| Less than High School | 0 (0.0%) | 0.0 |
| High School Diploma | 0 (0.0%) | 0.0 |
| College or Associate's Degree | 0 (0.0%) | 0.0 |
| Bachelor's Degree | 4 (10.0%) | 14.0 |
| Graduate Degree | 36 (90.0%) | 343.0 |
| Total | 40 (100.0%) | 32.0 |
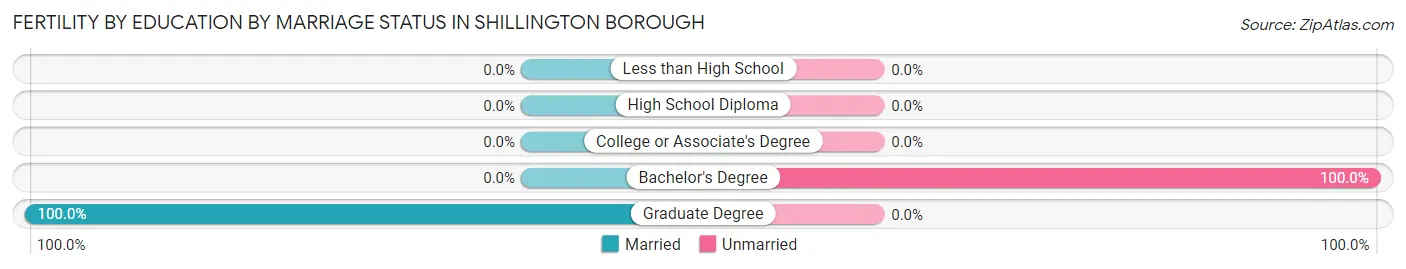
Fertility by Education by Marriage Status in Shillington borough
10.0% of women with births in Shillington borough are unmarried. Women with the educational attainment of graduate degree are most likely to be married with 100.0% of them married at childbirth, while women with the educational attainment of bachelor's degree are least likely to be married with 100.0% of them unmarried at childbirth.
| Educational Attainment | Married | Unmarried |
| Less than High School | 0 (0.0%) | 0 (0.0%) |
| High School Diploma | 0 (0.0%) | 0 (0.0%) |
| College or Associate's Degree | 0 (0.0%) | 0 (0.0%) |
| Bachelor's Degree | 0 (0.0%) | 4 (100.0%) |
| Graduate Degree | 36 (100.0%) | 0 (0.0%) |
| Total | 36 (90.0%) | 4 (10.0%) |
Employment Characteristics in Shillington borough
Employment by Class of Employer in Shillington borough
Among the 2,813 employed individuals in Shillington borough, private company employees (2,158 | 76.7%), local government employees (281 | 10.0%), and not-for-profit organizations (228 | 8.1%) make up the most common classes of employment.
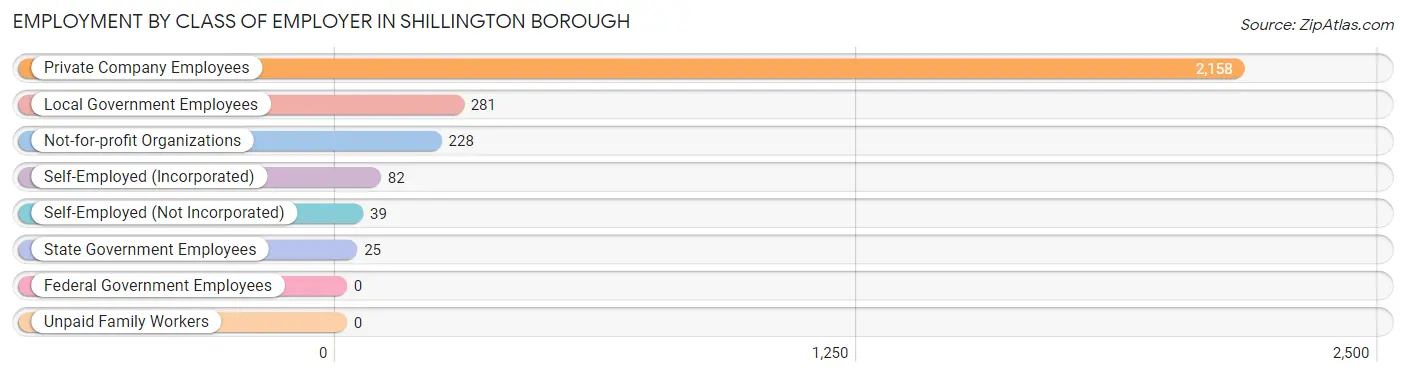
| Employer Class | # Employees | % Employees |
| Private Company Employees | 2,158 | 76.7% |
| Self-Employed (Incorporated) | 82 | 2.9% |
| Self-Employed (Not Incorporated) | 39 | 1.4% |
| Not-for-profit Organizations | 228 | 8.1% |
| Local Government Employees | 281 | 10.0% |
| State Government Employees | 25 | 0.9% |
| Federal Government Employees | 0 | 0.0% |
| Unpaid Family Workers | 0 | 0.0% |
| Total | 2,813 | 100.0% |
Employment Status by Age in Shillington borough
According to the labor force statistics for Shillington borough, out of the total population over 16 years of age (4,223), 75.4% or 3,184 individuals are in the labor force, with 8.2% or 261 of them unemployed. The age group with the highest labor force participation rate is 20 to 24 years, with 100.0% or 260 individuals in the labor force. Within the labor force, the 25 to 29 years age range has the highest percentage of unemployed individuals, with 44.7% or 176 of them being unemployed.
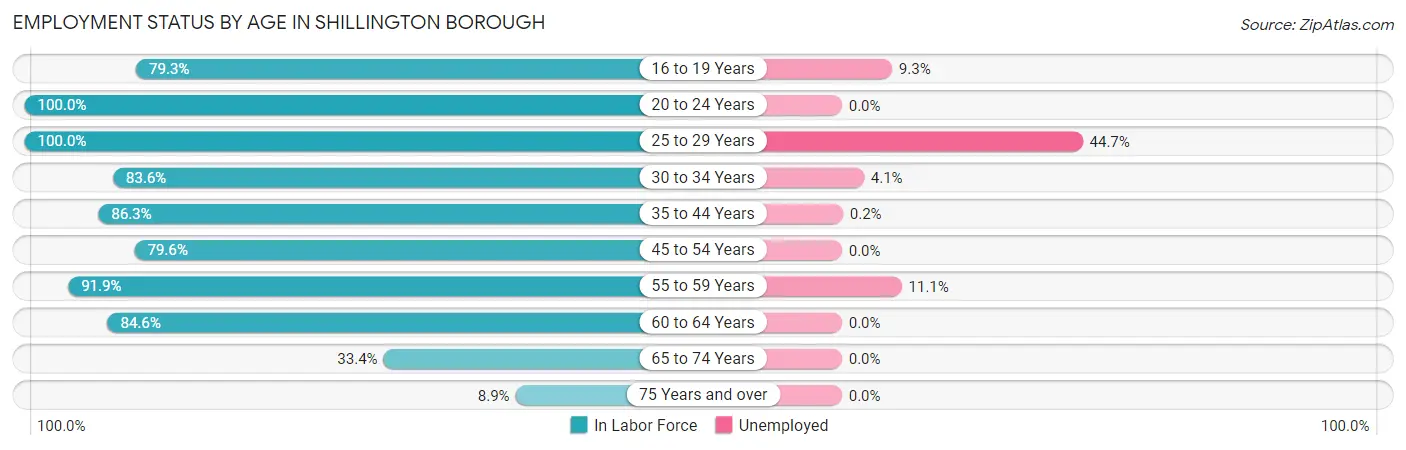
| Age Bracket | In Labor Force | Unemployed |
| 16 to 19 Years | 107 (79.3%) | 10 (9.3%) |
| 20 to 24 Years | 260 (100.0%) | 0 (0.0%) |
| 25 to 29 Years | 394 (100.0%) | 176 (44.7%) |
| 30 to 34 Years | 556 (83.6%) | 23 (4.1%) |
| 35 to 44 Years | 666 (86.3%) | 1 (0.2%) |
| 45 to 54 Years | 284 (79.6%) | 0 (0.0%) |
| 55 to 59 Years | 467 (91.9%) | 52 (11.1%) |
| 60 to 64 Years | 269 (84.6%) | 0 (0.0%) |
| 65 to 74 Years | 148 (33.4%) | 0 (0.0%) |
| 75 Years and over | 33 (8.9%) | 0 (0.0%) |
| Total | 3,184 (75.4%) | 261 (8.2%) |
Employment Status by Educational Attainment in Shillington borough
According to labor force statistics for Shillington borough, 87.5% of individuals (2,637) out of the total population between 25 and 64 years of age (3,014) are in the labor force, with 9.6% or 253 of them being unemployed. The group with the highest labor force participation rate are those with the educational attainment of bachelor's degree or higher, with 93.5% or 733 individuals in the labor force. Within the labor force, individuals with less than high school education have the highest percentage of unemployment, with 23.5% or 23 of them being unemployed.
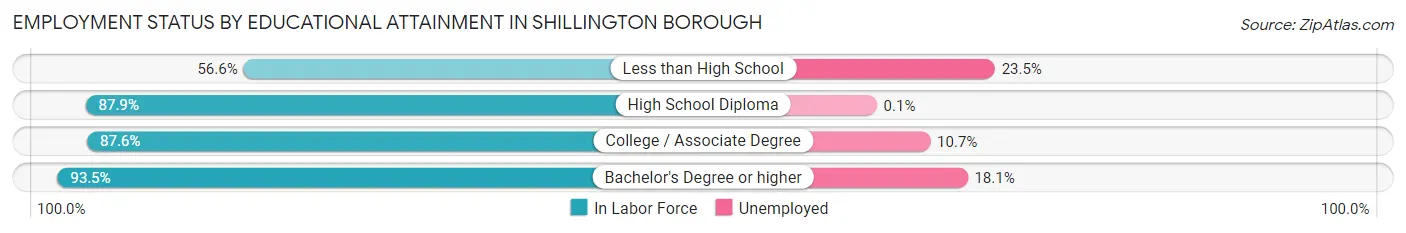
| Educational Attainment | In Labor Force | Unemployed |
| Less than High School | 98 (56.6%) | 41 (23.5%) |
| High School Diploma | 918 (87.9%) | 1 (0.1%) |
| College / Associate Degree | 887 (87.6%) | 108 (10.7%) |
| Bachelor's Degree or higher | 733 (93.5%) | 142 (18.1%) |
| Total | 2,637 (87.5%) | 289 (9.6%) |
Employment Occupations by Sex in Shillington borough
Management, Business, Science and Arts Occupations
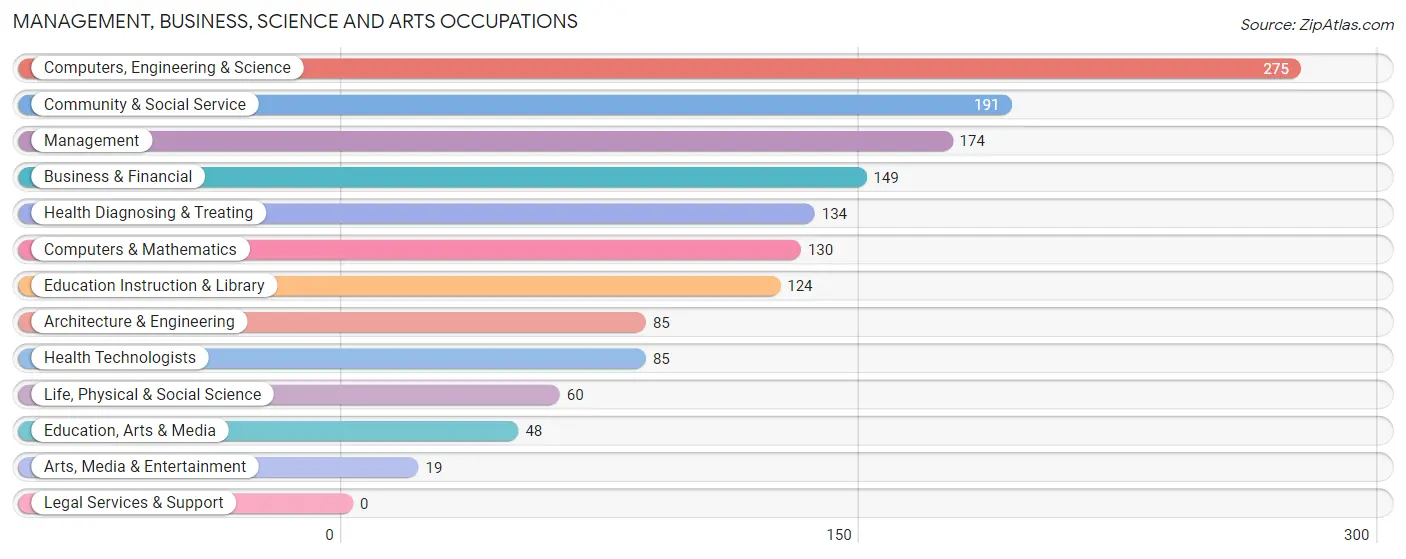
The most common Management, Business, Science and Arts occupations in Shillington borough are Computers, Engineering & Science (275 | 9.4%), Community & Social Service (191 | 6.5%), Management (174 | 5.9%), Business & Financial (149 | 5.1%), and Health Diagnosing & Treating (134 | 4.6%).
Management, Business, Science and Arts Occupations by Sex
Within the Management, Business, Science and Arts occupations in Shillington borough, the most male-oriented occupations are Computers & Mathematics (100.0%), Life, Physical & Social Science (100.0%), and Computers, Engineering & Science (86.9%), while the most female-oriented occupations are Education, Arts & Media (100.0%), Arts, Media & Entertainment (100.0%), and Health Diagnosing & Treating (100.0%).
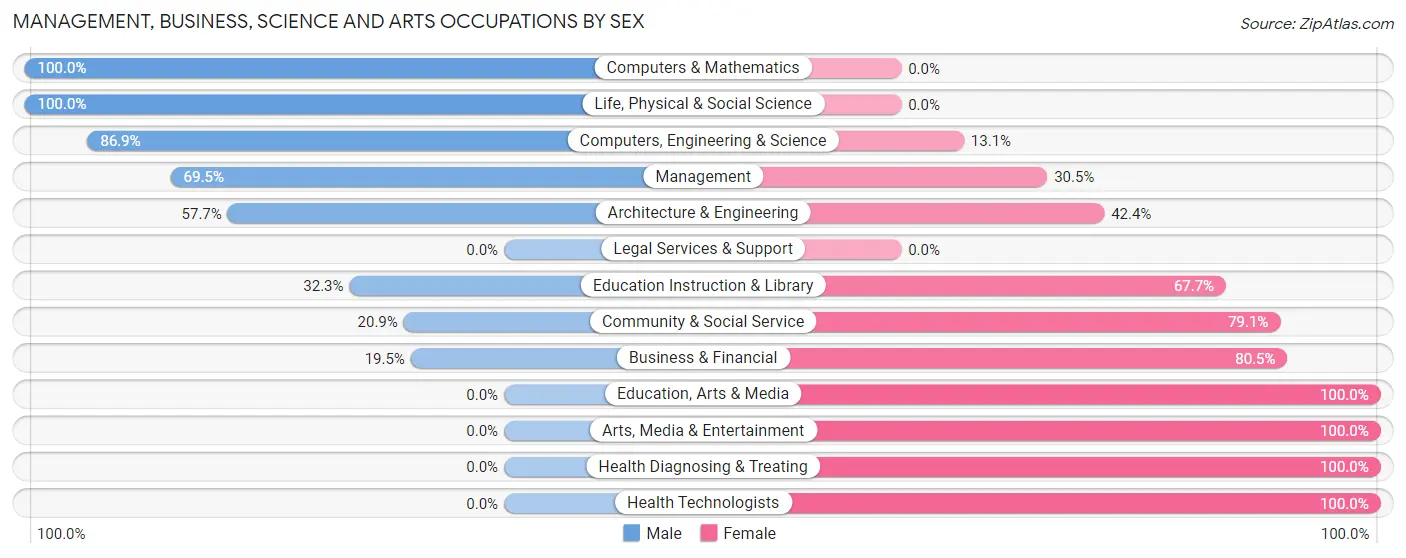
| Occupation | Male | Female |
| Management | 121 (69.5%) | 53 (30.5%) |
| Business & Financial | 29 (19.5%) | 120 (80.5%) |
| Computers, Engineering & Science | 239 (86.9%) | 36 (13.1%) |
| Computers & Mathematics | 130 (100.0%) | 0 (0.0%) |
| Architecture & Engineering | 49 (57.7%) | 36 (42.3%) |
| Life, Physical & Social Science | 60 (100.0%) | 0 (0.0%) |
| Community & Social Service | 40 (20.9%) | 151 (79.1%) |
| Education, Arts & Media | 0 (0.0%) | 48 (100.0%) |
| Legal Services & Support | 0 (0.0%) | 0 (0.0%) |
| Education Instruction & Library | 40 (32.3%) | 84 (67.7%) |
| Arts, Media & Entertainment | 0 (0.0%) | 19 (100.0%) |
| Health Diagnosing & Treating | 0 (0.0%) | 134 (100.0%) |
| Health Technologists | 0 (0.0%) | 85 (100.0%) |
| Total (Category) | 429 (46.5%) | 494 (53.5%) |
| Total (Overall) | 1,654 (56.6%) | 1,268 (43.4%) |
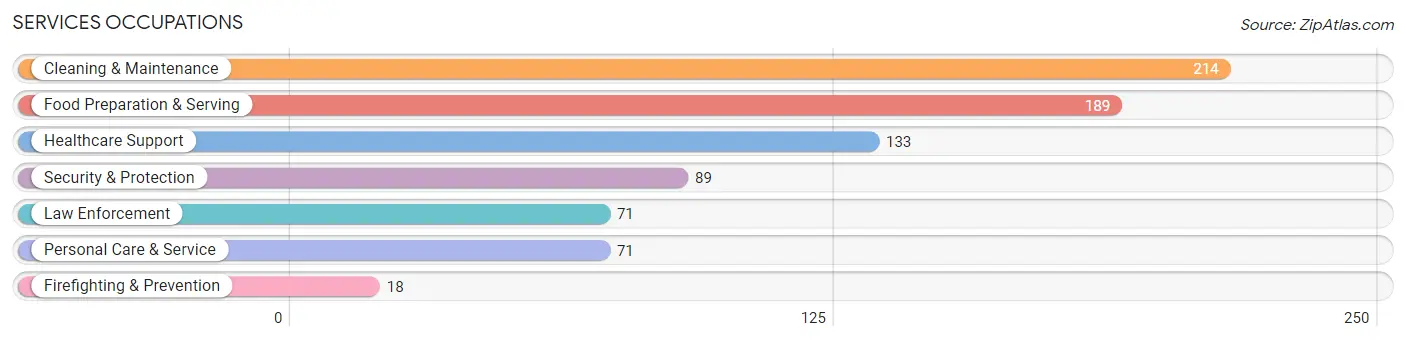
Services Occupations
The most common Services occupations in Shillington borough are Cleaning & Maintenance (214 | 7.3%), Food Preparation & Serving (189 | 6.5%), Healthcare Support (133 | 4.5%), Security & Protection (89 | 3.0%), and Law Enforcement (71 | 2.4%).
Services Occupations by Sex
Within the Services occupations in Shillington borough, the most male-oriented occupations are Security & Protection (100.0%), Firefighting & Prevention (100.0%), and Law Enforcement (100.0%), while the most female-oriented occupations are Personal Care & Service (100.0%), Healthcare Support (88.0%), and Food Preparation & Serving (56.1%).
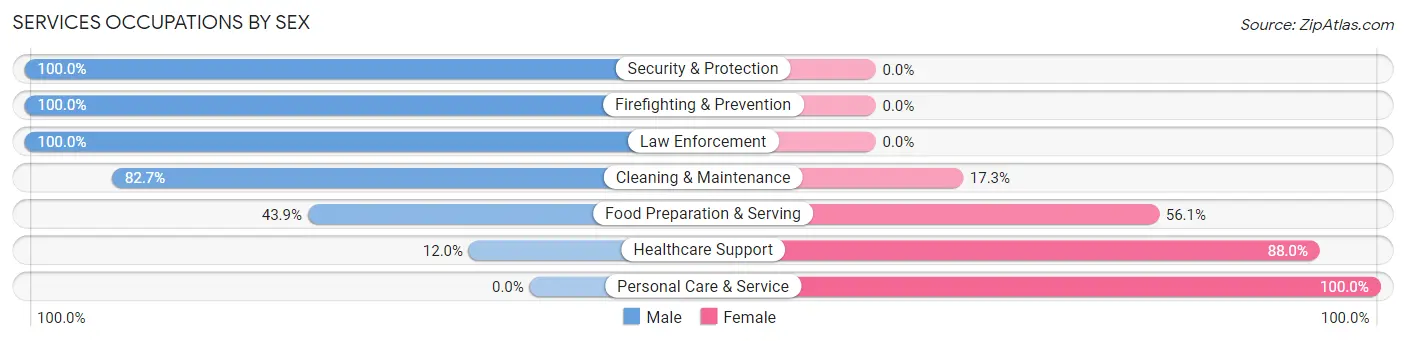
| Occupation | Male | Female |
| Healthcare Support | 16 (12.0%) | 117 (88.0%) |
| Security & Protection | 89 (100.0%) | 0 (0.0%) |
| Firefighting & Prevention | 18 (100.0%) | 0 (0.0%) |
| Law Enforcement | 71 (100.0%) | 0 (0.0%) |
| Food Preparation & Serving | 83 (43.9%) | 106 (56.1%) |
| Cleaning & Maintenance | 177 (82.7%) | 37 (17.3%) |
| Personal Care & Service | 0 (0.0%) | 71 (100.0%) |
| Total (Category) | 365 (52.4%) | 331 (47.6%) |
| Total (Overall) | 1,654 (56.6%) | 1,268 (43.4%) |
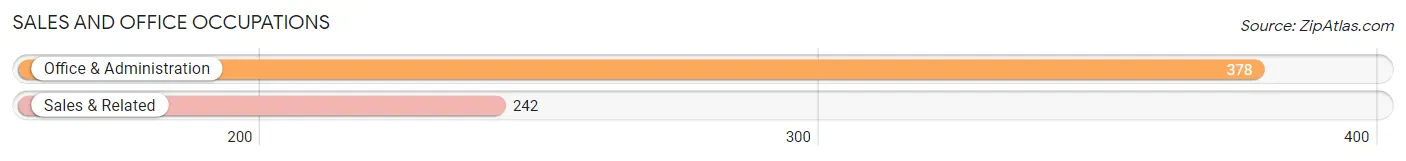
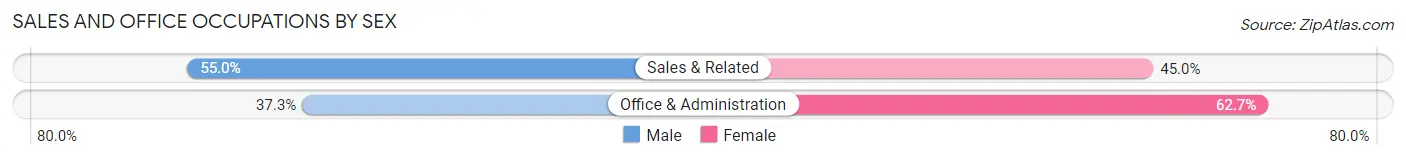
Sales and Office Occupations
The most common Sales and Office occupations in Shillington borough are Office & Administration (378 | 12.9%), and Sales & Related (242 | 8.3%).
Sales and Office Occupations by Sex
| Occupation | Male | Female |
| Sales & Related | 133 (55.0%) | 109 (45.0%) |
| Office & Administration | 141 (37.3%) | 237 (62.7%) |
| Total (Category) | 274 (44.2%) | 346 (55.8%) |
| Total (Overall) | 1,654 (56.6%) | 1,268 (43.4%) |
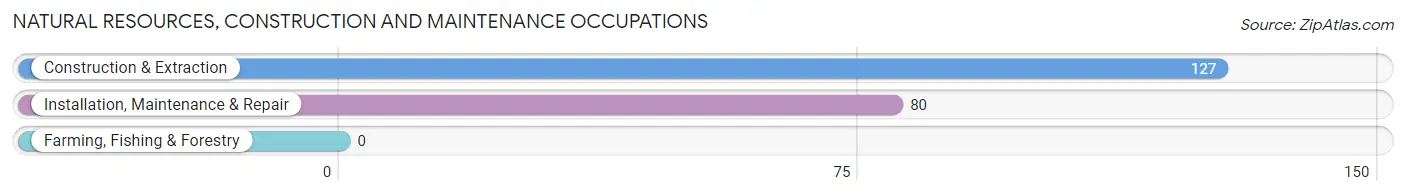
Natural Resources, Construction and Maintenance Occupations
The most common Natural Resources, Construction and Maintenance occupations in Shillington borough are Construction & Extraction (127 | 4.3%), and Installation, Maintenance & Repair (80 | 2.7%).
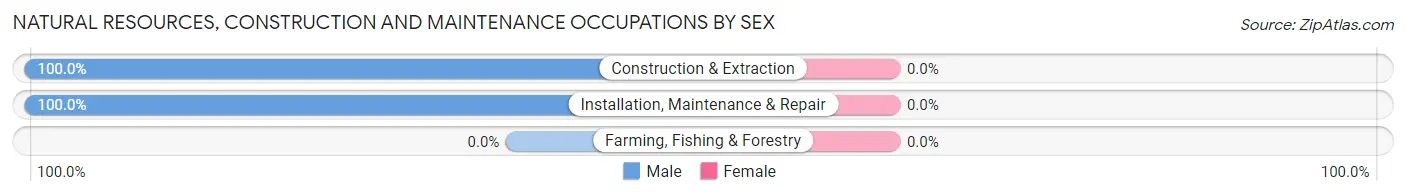
Natural Resources, Construction and Maintenance Occupations by Sex
| Occupation | Male | Female |
| Farming, Fishing & Forestry | 0 (0.0%) | 0 (0.0%) |
| Construction & Extraction | 127 (100.0%) | 0 (0.0%) |
| Installation, Maintenance & Repair | 80 (100.0%) | 0 (0.0%) |
| Total (Category) | 207 (100.0%) | 0 (0.0%) |
| Total (Overall) | 1,654 (56.6%) | 1,268 (43.4%) |
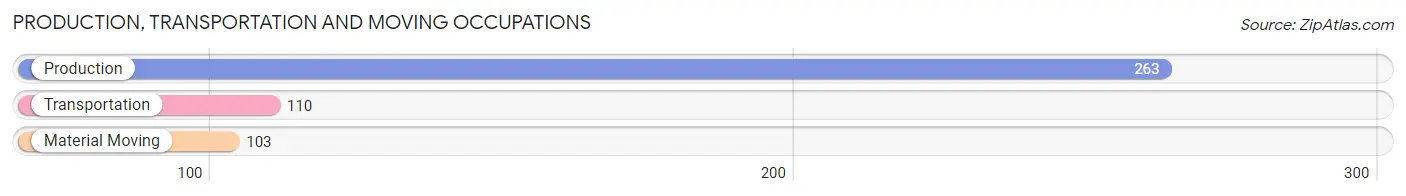
Production, Transportation and Moving Occupations
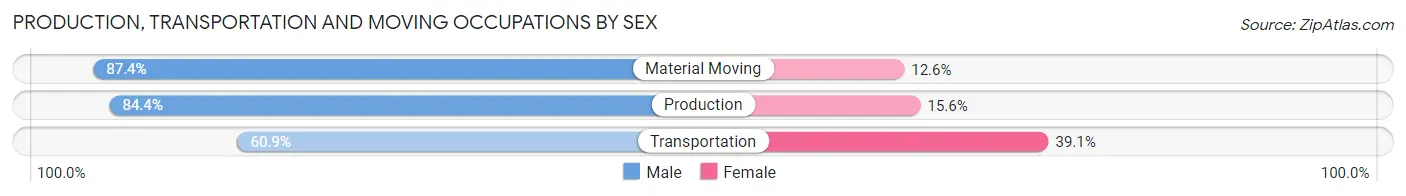
The most common Production, Transportation and Moving occupations in Shillington borough are Production (263 | 9.0%), Transportation (110 | 3.8%), and Material Moving (103 | 3.5%).
Production, Transportation and Moving Occupations by Sex
| Occupation | Male | Female |
| Production | 222 (84.4%) | 41 (15.6%) |
| Transportation | 67 (60.9%) | 43 (39.1%) |
| Material Moving | 90 (87.4%) | 13 (12.6%) |
| Total (Category) | 379 (79.6%) | 97 (20.4%) |
| Total (Overall) | 1,654 (56.6%) | 1,268 (43.4%) |
Employment Industries by Sex in Shillington borough
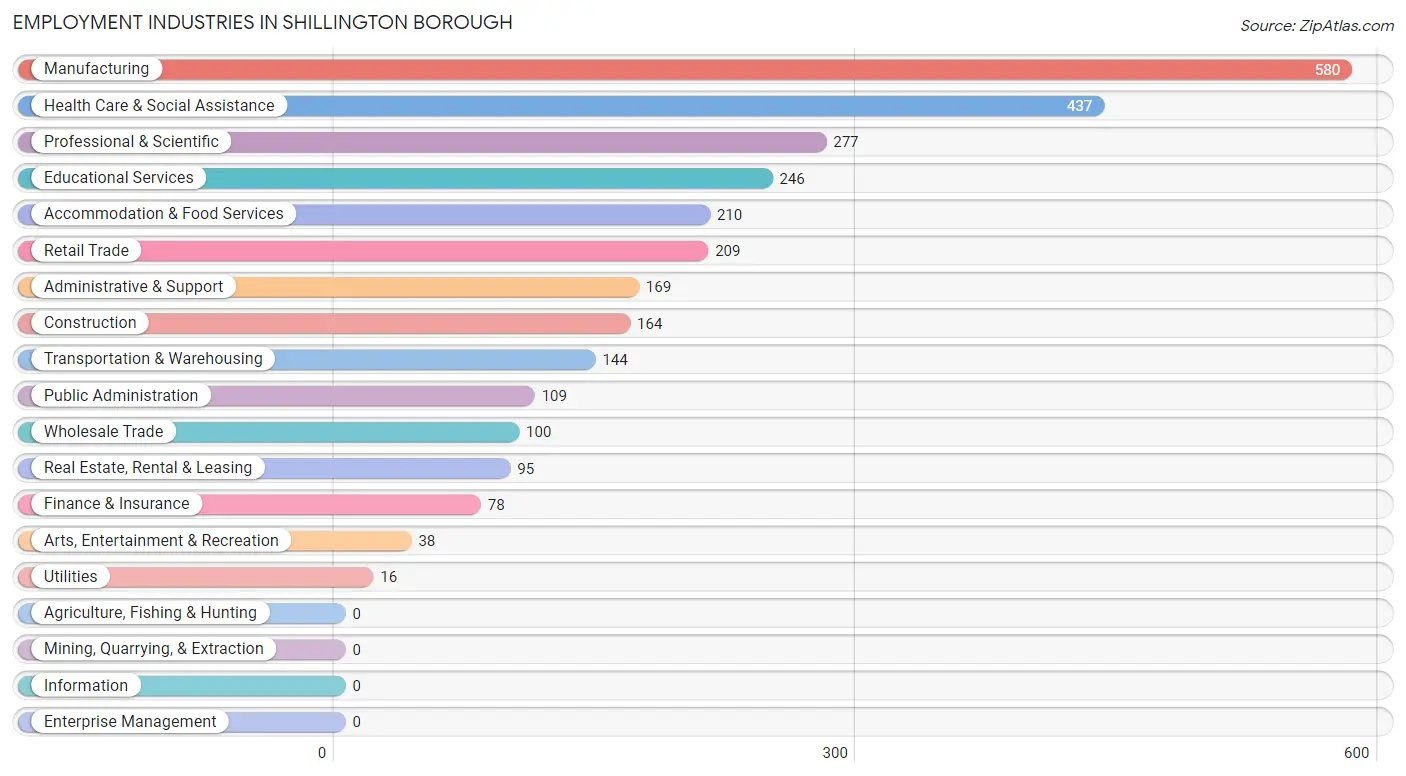
Employment Industries in Shillington borough
The major employment industries in Shillington borough include Manufacturing (580 | 19.9%), Health Care & Social Assistance (437 | 15.0%), Professional & Scientific (277 | 9.5%), Educational Services (246 | 8.4%), and Accommodation & Food Services (210 | 7.2%).
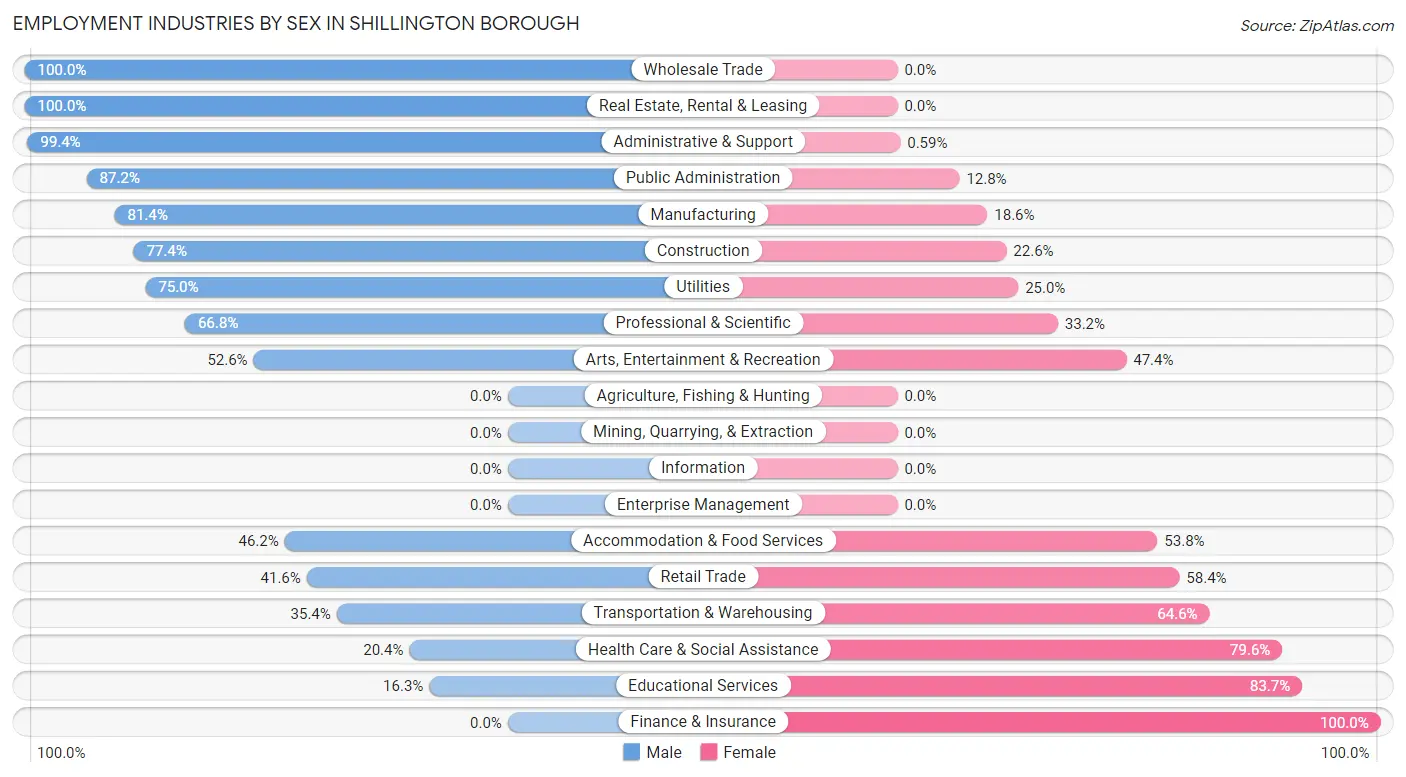
Employment Industries by Sex in Shillington borough
The Shillington borough industries that see more men than women are Wholesale Trade (100.0%), Real Estate, Rental & Leasing (100.0%), and Administrative & Support (99.4%), whereas the industries that tend to have a higher number of women are Finance & Insurance (100.0%), Educational Services (83.7%), and Health Care & Social Assistance (79.6%).
| Industry | Male | Female |
| Agriculture, Fishing & Hunting | 0 (0.0%) | 0 (0.0%) |
| Mining, Quarrying, & Extraction | 0 (0.0%) | 0 (0.0%) |
| Construction | 127 (77.4%) | 37 (22.6%) |
| Manufacturing | 472 (81.4%) | 108 (18.6%) |
| Wholesale Trade | 100 (100.0%) | 0 (0.0%) |
| Retail Trade | 87 (41.6%) | 122 (58.4%) |
| Transportation & Warehousing | 51 (35.4%) | 93 (64.6%) |
| Utilities | 12 (75.0%) | 4 (25.0%) |
| Information | 0 (0.0%) | 0 (0.0%) |
| Finance & Insurance | 0 (0.0%) | 78 (100.0%) |
| Real Estate, Rental & Leasing | 95 (100.0%) | 0 (0.0%) |
| Professional & Scientific | 185 (66.8%) | 92 (33.2%) |
| Enterprise Management | 0 (0.0%) | 0 (0.0%) |
| Administrative & Support | 168 (99.4%) | 1 (0.6%) |
| Educational Services | 40 (16.3%) | 206 (83.7%) |
| Health Care & Social Assistance | 89 (20.4%) | 348 (79.6%) |
| Arts, Entertainment & Recreation | 20 (52.6%) | 18 (47.4%) |
| Accommodation & Food Services | 97 (46.2%) | 113 (53.8%) |
| Public Administration | 95 (87.2%) | 14 (12.8%) |
| Total | 1,654 (56.6%) | 1,268 (43.4%) |
Education in Shillington borough
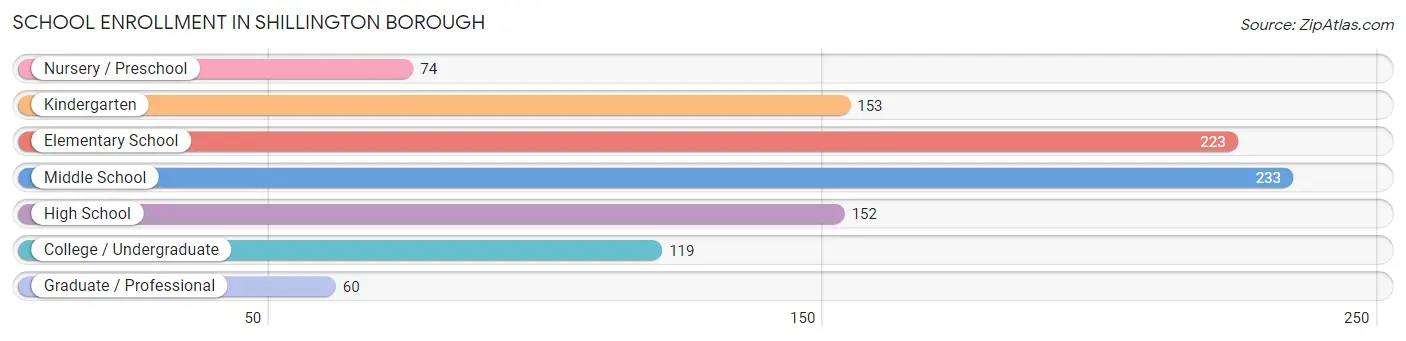
School Enrollment in Shillington borough
The most common levels of schooling among the 1,014 students in Shillington borough are middle school (233 | 23.0%), elementary school (223 | 22.0%), and kindergarten (153 | 15.1%).
| School Level | # Students | % Students |
| Nursery / Preschool | 74 | 7.3% |
| Kindergarten | 153 | 15.1% |
| Elementary School | 223 | 22.0% |
| Middle School | 233 | 23.0% |
| High School | 152 | 15.0% |
| College / Undergraduate | 119 | 11.7% |
| Graduate / Professional | 60 | 5.9% |
| Total | 1,014 | 100.0% |
School Enrollment by Age by Funding Source in Shillington borough
Out of a total of 1,014 students who are enrolled in schools in Shillington borough, 190 (18.7%) attend a private institution, while the remaining 824 (81.3%) are enrolled in public schools. The age group of 3 to 4 year olds has the highest likelihood of being enrolled in private schools, with 74 (100.0% in the age bracket) enrolled. Conversely, the age group of 15 to 17 year olds has the lowest likelihood of being enrolled in a private school, with 128 (100.0% in the age bracket) attending a public institution.
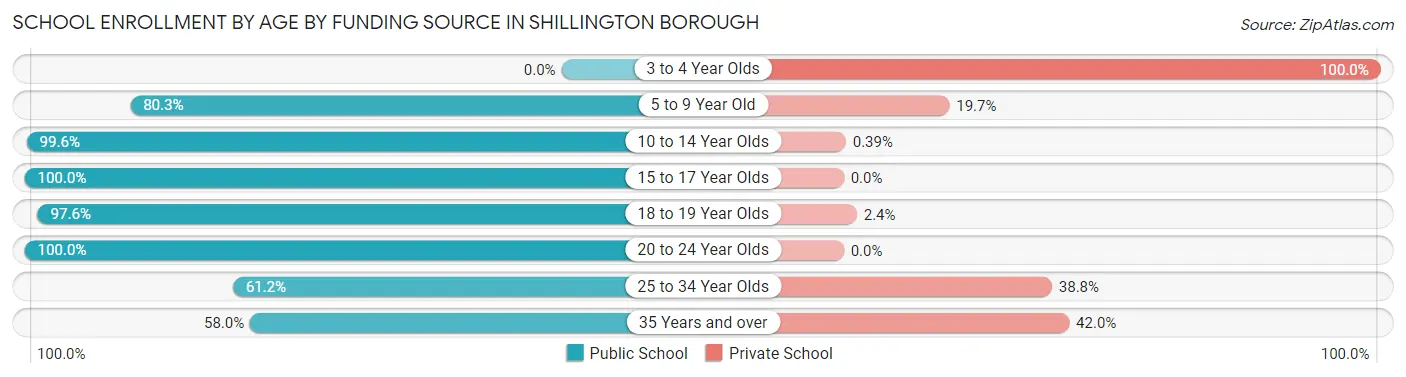
| Age Bracket | Public School | Private School |
| 3 to 4 Year Olds | 0 (0.0%) | 74 (100.0%) |
| 5 to 9 Year Old | 302 (80.3%) | 74 (19.7%) |
| 10 to 14 Year Olds | 255 (99.6%) | 1 (0.4%) |
| 15 to 17 Year Olds | 128 (100.0%) | 0 (0.0%) |
| 18 to 19 Year Olds | 40 (97.6%) | 1 (2.4%) |
| 20 to 24 Year Olds | 40 (100.0%) | 0 (0.0%) |
| 25 to 34 Year Olds | 30 (61.2%) | 19 (38.8%) |
| 35 Years and over | 29 (58.0%) | 21 (42.0%) |
| Total | 824 (81.3%) | 190 (18.7%) |
Educational Attainment by Field of Study in Shillington borough
Arts & humanities (179 | 18.3%), engineering (141 | 14.4%), education (137 | 14.0%), science & technology (131 | 13.4%), and business (122 | 12.5%) are the most common fields of study among 977 individuals in Shillington borough who have obtained a bachelor's degree or higher.
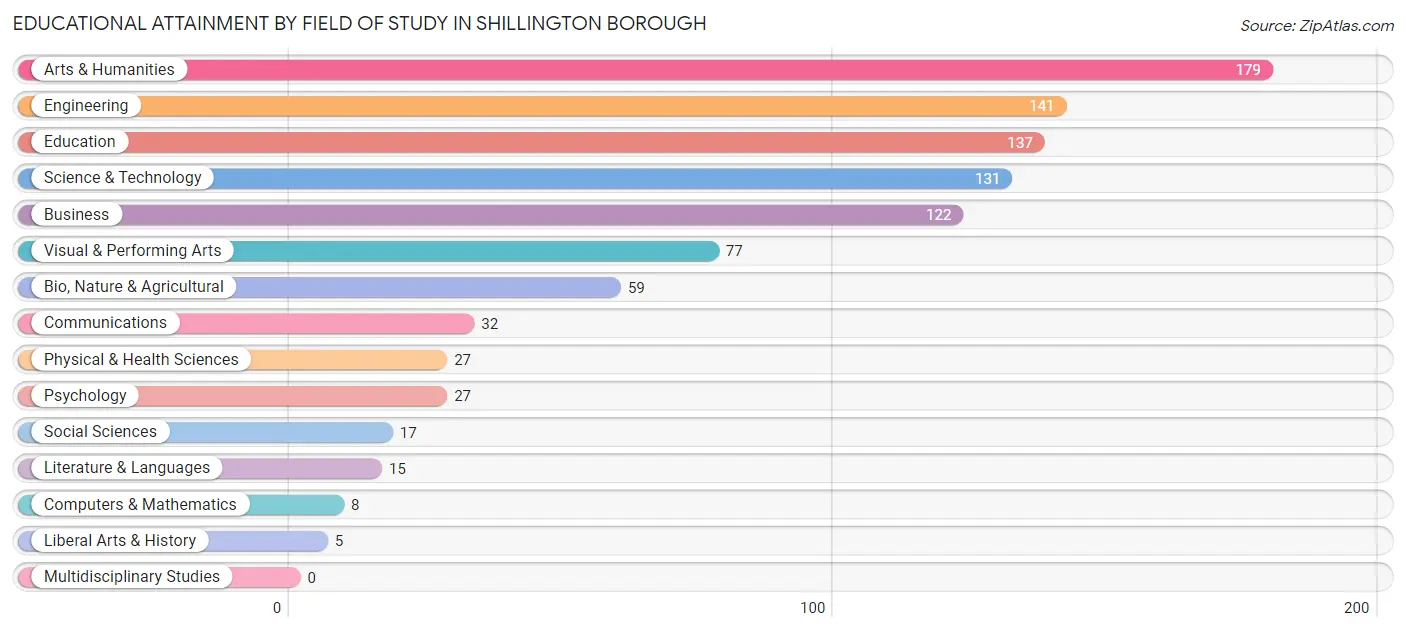
| Field of Study | # Graduates | % Graduates |
| Computers & Mathematics | 8 | 0.8% |
| Bio, Nature & Agricultural | 59 | 6.0% |
| Physical & Health Sciences | 27 | 2.8% |
| Psychology | 27 | 2.8% |
| Social Sciences | 17 | 1.7% |
| Engineering | 141 | 14.4% |
| Multidisciplinary Studies | 0 | 0.0% |
| Science & Technology | 131 | 13.4% |
| Business | 122 | 12.5% |
| Education | 137 | 14.0% |
| Literature & Languages | 15 | 1.5% |
| Liberal Arts & History | 5 | 0.5% |
| Visual & Performing Arts | 77 | 7.9% |
| Communications | 32 | 3.3% |
| Arts & Humanities | 179 | 18.3% |
| Total | 977 | 100.0% |
Transportation & Commute in Shillington borough
Vehicle Availability by Sex in Shillington borough
The most prevalent vehicle ownership categories in Shillington borough are males with 2 vehicles (928, accounting for 57.9%) and females with 2 vehicles (600, making up 76.9%).
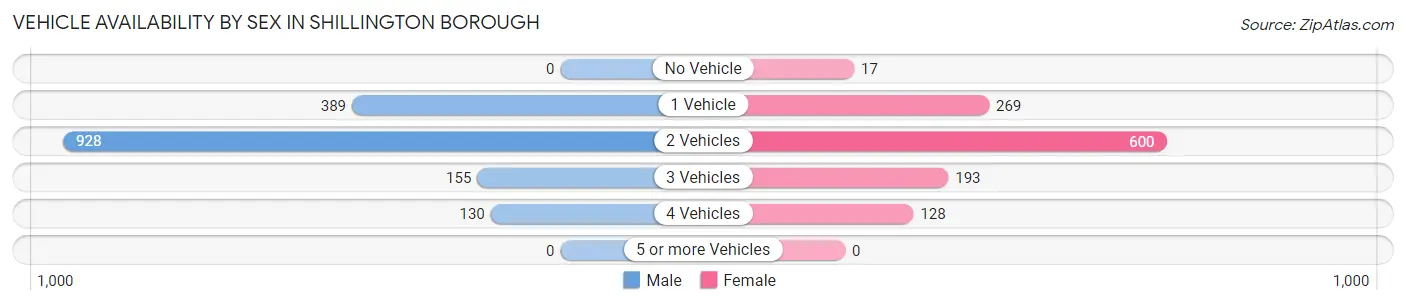
| Vehicles Available | Male | Female |
| No Vehicle | 0 (0.0%) | 17 (1.4%) |
| 1 Vehicle | 389 (24.3%) | 269 (22.3%) |
| 2 Vehicles | 928 (57.9%) | 600 (49.7%) |
| 3 Vehicles | 155 (9.7%) | 193 (16.0%) |
| 4 Vehicles | 130 (8.1%) | 128 (10.6%) |
| 5 or more Vehicles | 0 (0.0%) | 0 (0.0%) |
| Total | 1,602 (100.0%) | 1,207 (100.0%) |
Commute Time in Shillington borough
The most frequently occuring commute durations in Shillington borough are 15 to 19 minutes (593 commuters, 25.1%), 10 to 14 minutes (488 commuters, 20.7%), and 5 to 9 minutes (347 commuters, 14.7%).
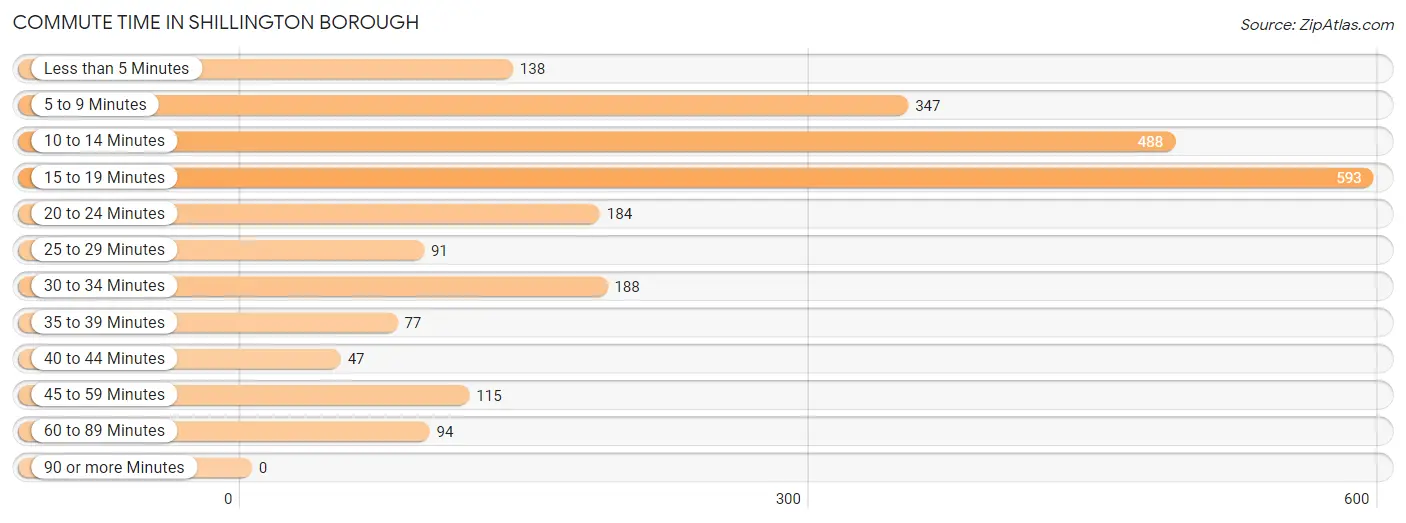
| Commute Time | # Commuters | % Commuters |
| Less than 5 Minutes | 138 | 5.8% |
| 5 to 9 Minutes | 347 | 14.7% |
| 10 to 14 Minutes | 488 | 20.7% |
| 15 to 19 Minutes | 593 | 25.1% |
| 20 to 24 Minutes | 184 | 7.8% |
| 25 to 29 Minutes | 91 | 3.8% |
| 30 to 34 Minutes | 188 | 8.0% |
| 35 to 39 Minutes | 77 | 3.3% |
| 40 to 44 Minutes | 47 | 2.0% |
| 45 to 59 Minutes | 115 | 4.9% |
| 60 to 89 Minutes | 94 | 4.0% |
| 90 or more Minutes | 0 | 0.0% |
Commute Time by Sex in Shillington borough
The most common commute times in Shillington borough are 15 to 19 minutes (335 commuters, 26.5%) for males and 10 to 14 minutes (282 commuters, 25.7%) for females.
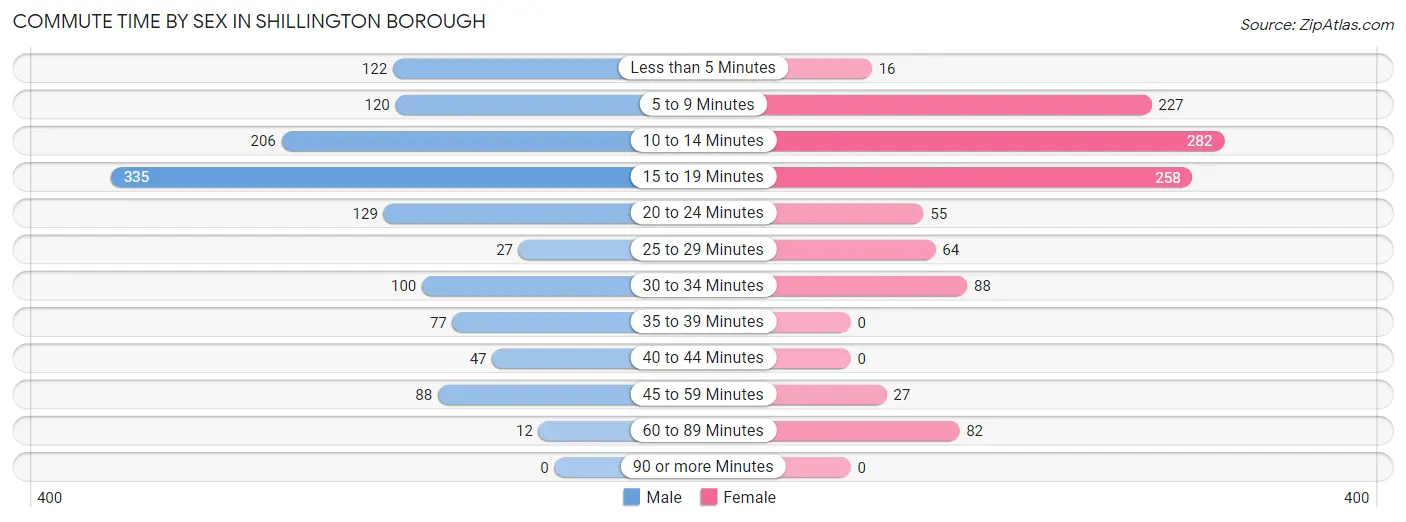
| Commute Time | Male | Female |
| Less than 5 Minutes | 122 (9.7%) | 16 (1.5%) |
| 5 to 9 Minutes | 120 (9.5%) | 227 (20.7%) |
| 10 to 14 Minutes | 206 (16.3%) | 282 (25.7%) |
| 15 to 19 Minutes | 335 (26.5%) | 258 (23.5%) |
| 20 to 24 Minutes | 129 (10.2%) | 55 (5.0%) |
| 25 to 29 Minutes | 27 (2.1%) | 64 (5.8%) |
| 30 to 34 Minutes | 100 (7.9%) | 88 (8.0%) |
| 35 to 39 Minutes | 77 (6.1%) | 0 (0.0%) |
| 40 to 44 Minutes | 47 (3.7%) | 0 (0.0%) |
| 45 to 59 Minutes | 88 (7.0%) | 27 (2.5%) |
| 60 to 89 Minutes | 12 (0.9%) | 82 (7.5%) |
| 90 or more Minutes | 0 (0.0%) | 0 (0.0%) |
Time of Departure to Work by Sex in Shillington borough
The most frequent times of departure to work in Shillington borough are 6:30 AM to 6:59 AM (285, 22.6%) for males and 8:00 AM to 8:29 AM (252, 22.9%) for females.
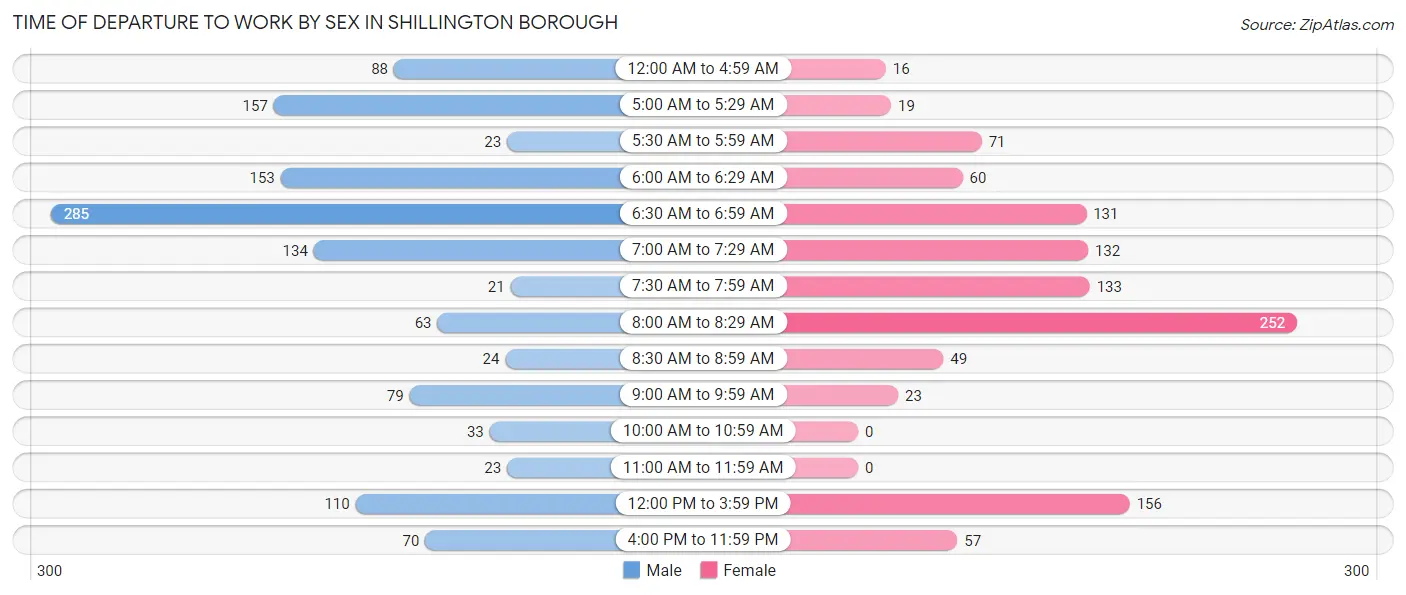
| Time of Departure | Male | Female |
| 12:00 AM to 4:59 AM | 88 (7.0%) | 16 (1.5%) |
| 5:00 AM to 5:29 AM | 157 (12.4%) | 19 (1.7%) |
| 5:30 AM to 5:59 AM | 23 (1.8%) | 71 (6.5%) |
| 6:00 AM to 6:29 AM | 153 (12.1%) | 60 (5.5%) |
| 6:30 AM to 6:59 AM | 285 (22.6%) | 131 (11.9%) |
| 7:00 AM to 7:29 AM | 134 (10.6%) | 132 (12.0%) |
| 7:30 AM to 7:59 AM | 21 (1.7%) | 133 (12.1%) |
| 8:00 AM to 8:29 AM | 63 (5.0%) | 252 (22.9%) |
| 8:30 AM to 8:59 AM | 24 (1.9%) | 49 (4.5%) |
| 9:00 AM to 9:59 AM | 79 (6.2%) | 23 (2.1%) |
| 10:00 AM to 10:59 AM | 33 (2.6%) | 0 (0.0%) |
| 11:00 AM to 11:59 AM | 23 (1.8%) | 0 (0.0%) |
| 12:00 PM to 3:59 PM | 110 (8.7%) | 156 (14.2%) |
| 4:00 PM to 11:59 PM | 70 (5.5%) | 57 (5.2%) |
| Total | 1,263 (100.0%) | 1,099 (100.0%) |
Housing Occupancy in Shillington borough
Occupancy by Ownership in Shillington borough
Of the total 2,303 dwellings in Shillington borough, owner-occupied units account for 1,543 (67.0%), while renter-occupied units make up 760 (33.0%).
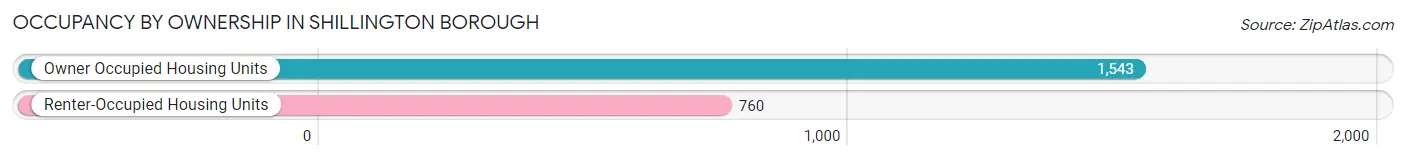
| Occupancy | # Housing Units | % Housing Units |
| Owner Occupied Housing Units | 1,543 | 67.0% |
| Renter-Occupied Housing Units | 760 | 33.0% |
| Total Occupied Housing Units | 2,303 | 100.0% |
Occupancy by Household Size in Shillington borough
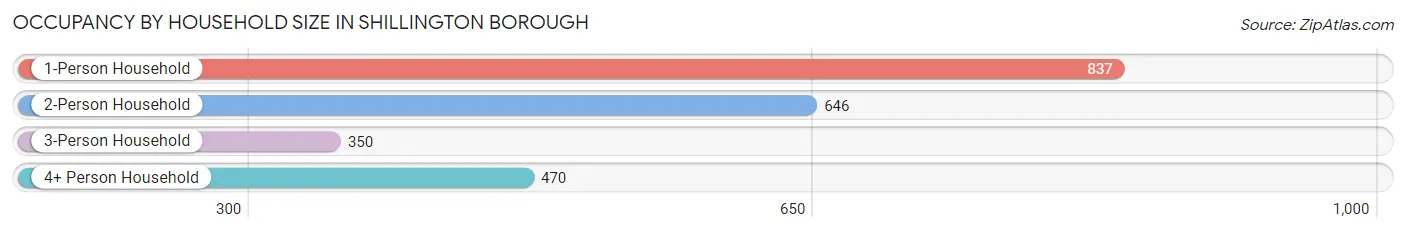
| Household Size | # Housing Units | % Housing Units |
| 1-Person Household | 837 | 36.3% |
| 2-Person Household | 646 | 28.1% |
| 3-Person Household | 350 | 15.2% |
| 4+ Person Household | 470 | 20.4% |
| Total Housing Units | 2,303 | 100.0% |
Occupancy by Ownership by Household Size in Shillington borough
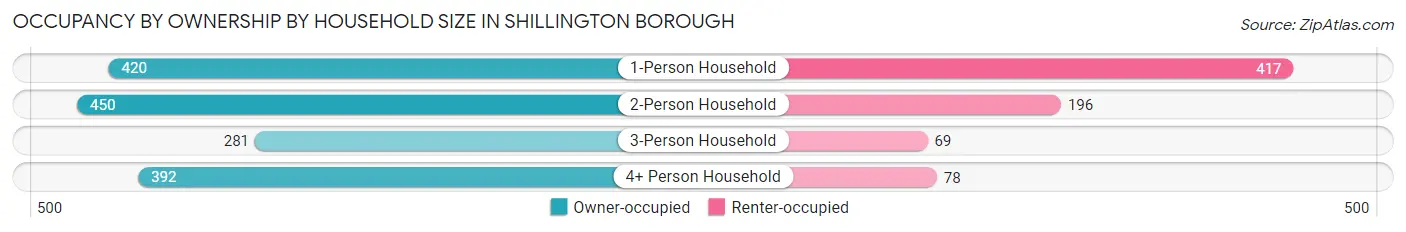
| Household Size | Owner-occupied | Renter-occupied |
| 1-Person Household | 420 (50.2%) | 417 (49.8%) |
| 2-Person Household | 450 (69.7%) | 196 (30.3%) |
| 3-Person Household | 281 (80.3%) | 69 (19.7%) |
| 4+ Person Household | 392 (83.4%) | 78 (16.6%) |
| Total Housing Units | 1,543 (67.0%) | 760 (33.0%) |
Occupancy by Educational Attainment in Shillington borough
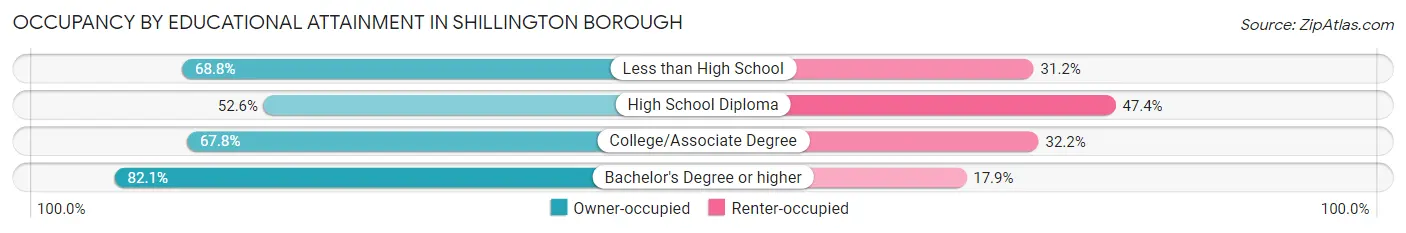
| Household Size | Owner-occupied | Renter-occupied |
| Less than High School | 141 (68.8%) | 64 (31.2%) |
| High School Diploma | 339 (52.6%) | 306 (47.4%) |
| College/Associate Degree | 617 (67.8%) | 293 (32.2%) |
| Bachelor's Degree or higher | 446 (82.1%) | 97 (17.9%) |
Occupancy by Age of Householder in Shillington borough
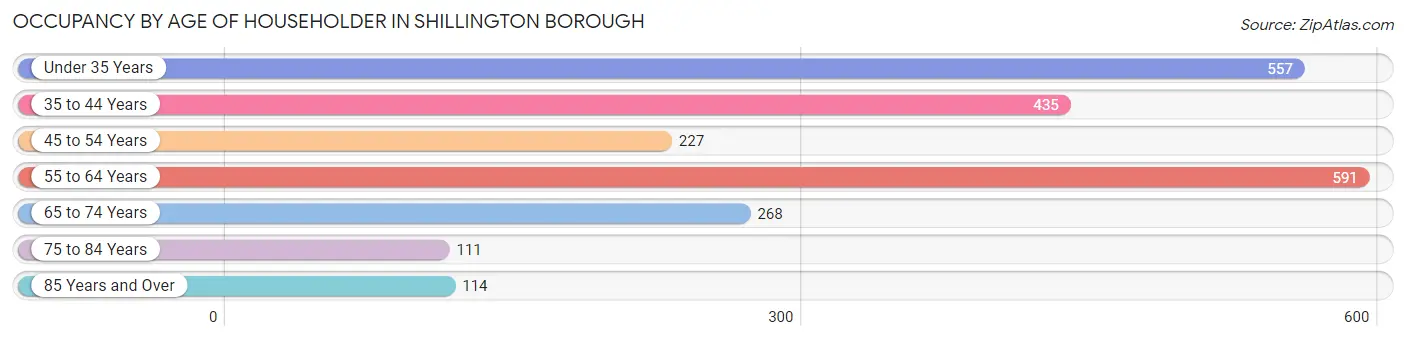
| Age Bracket | # Households | % Households |
| Under 35 Years | 557 | 24.2% |
| 35 to 44 Years | 435 | 18.9% |
| 45 to 54 Years | 227 | 9.9% |
| 55 to 64 Years | 591 | 25.7% |
| 65 to 74 Years | 268 | 11.6% |
| 75 to 84 Years | 111 | 4.8% |
| 85 Years and Over | 114 | 5.0% |
| Total | 2,303 | 100.0% |
Housing Finances in Shillington borough
Median Income by Occupancy in Shillington borough
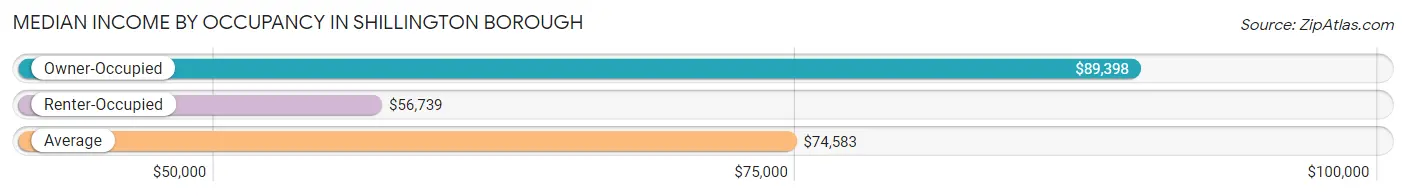
| Occupancy Type | # Households | Median Income |
| Owner-Occupied | 1,543 (67.0%) | $89,398 |
| Renter-Occupied | 760 (33.0%) | $56,739 |
| Average | 2,303 (100.0%) | $74,583 |
Occupancy by Householder Income Bracket in Shillington borough
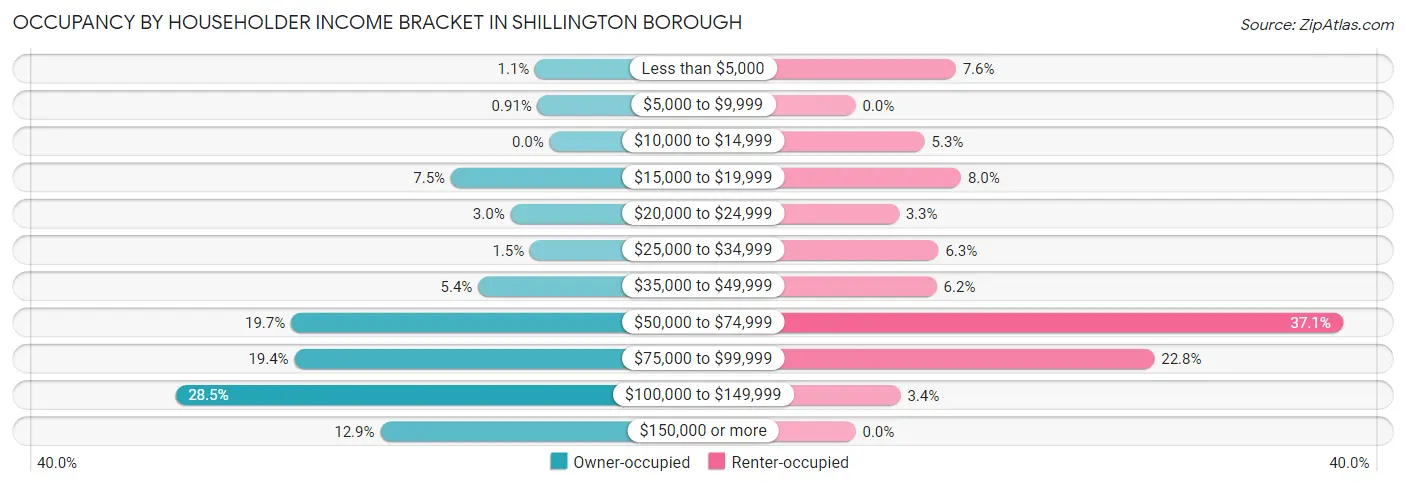
| Income Bracket | Owner-occupied | Renter-occupied |
| Less than $5,000 | 17 (1.1%) | 58 (7.6%) |
| $5,000 to $9,999 | 14 (0.9%) | 0 (0.0%) |
| $10,000 to $14,999 | 0 (0.0%) | 40 (5.3%) |
| $15,000 to $19,999 | 116 (7.5%) | 61 (8.0%) |
| $20,000 to $24,999 | 46 (3.0%) | 25 (3.3%) |
| $25,000 to $34,999 | 23 (1.5%) | 48 (6.3%) |
| $35,000 to $49,999 | 84 (5.4%) | 47 (6.2%) |
| $50,000 to $74,999 | 304 (19.7%) | 282 (37.1%) |
| $75,000 to $99,999 | 300 (19.4%) | 173 (22.8%) |
| $100,000 to $149,999 | 440 (28.5%) | 26 (3.4%) |
| $150,000 or more | 199 (12.9%) | 0 (0.0%) |
| Total | 1,543 (100.0%) | 760 (100.0%) |
Monthly Housing Cost Tiers in Shillington borough
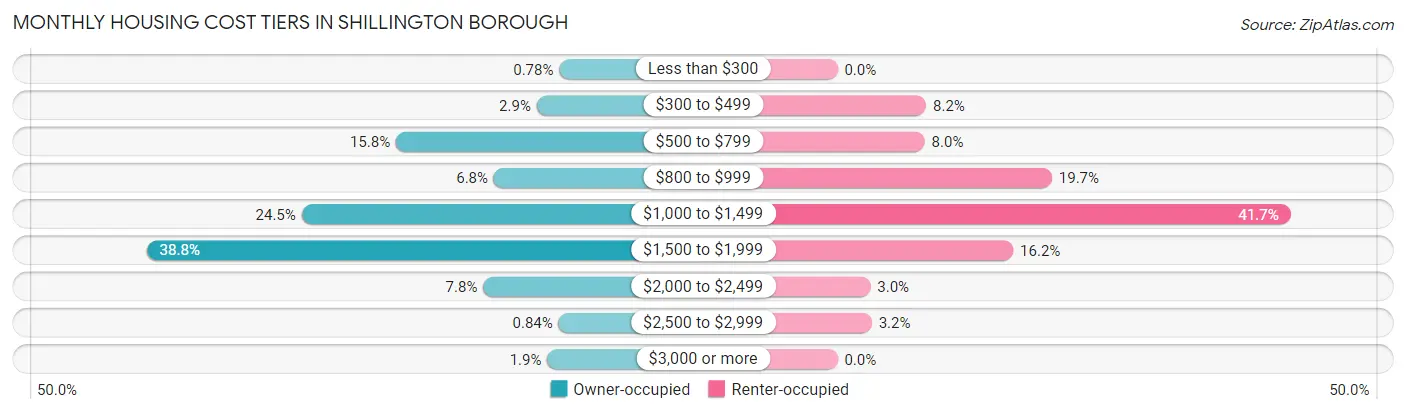
| Monthly Cost | Owner-occupied | Renter-occupied |
| Less than $300 | 12 (0.8%) | 0 (0.0%) |
| $300 to $499 | 44 (2.9%) | 62 (8.2%) |
| $500 to $799 | 244 (15.8%) | 61 (8.0%) |
| $800 to $999 | 105 (6.8%) | 150 (19.7%) |
| $1,000 to $1,499 | 378 (24.5%) | 317 (41.7%) |
| $1,500 to $1,999 | 598 (38.8%) | 123 (16.2%) |
| $2,000 to $2,499 | 120 (7.8%) | 23 (3.0%) |
| $2,500 to $2,999 | 13 (0.8%) | 24 (3.2%) |
| $3,000 or more | 29 (1.9%) | 0 (0.0%) |
| Total | 1,543 (100.0%) | 760 (100.0%) |
Physical Housing Characteristics in Shillington borough
Housing Structures in Shillington borough
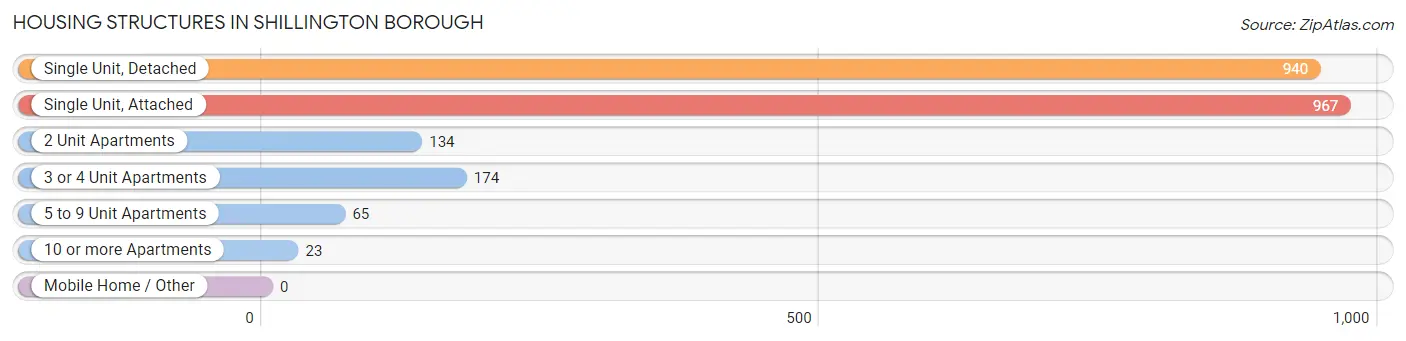
| Structure Type | # Housing Units | % Housing Units |
| Single Unit, Detached | 940 | 40.8% |
| Single Unit, Attached | 967 | 42.0% |
| 2 Unit Apartments | 134 | 5.8% |
| 3 or 4 Unit Apartments | 174 | 7.6% |
| 5 to 9 Unit Apartments | 65 | 2.8% |
| 10 or more Apartments | 23 | 1.0% |
| Mobile Home / Other | 0 | 0.0% |
| Total | 2,303 | 100.0% |
Housing Structures by Occupancy in Shillington borough
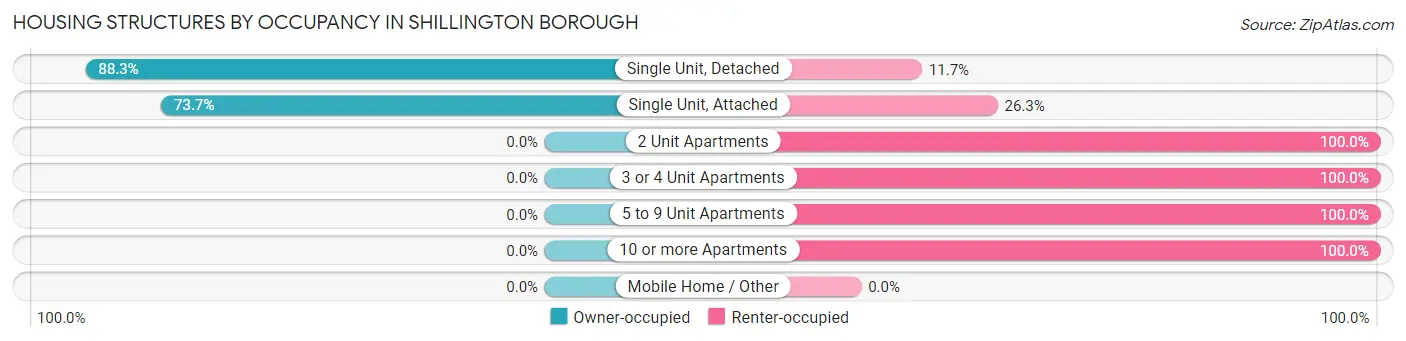
| Structure Type | Owner-occupied | Renter-occupied |
| Single Unit, Detached | 830 (88.3%) | 110 (11.7%) |
| Single Unit, Attached | 713 (73.7%) | 254 (26.3%) |
| 2 Unit Apartments | 0 (0.0%) | 134 (100.0%) |
| 3 or 4 Unit Apartments | 0 (0.0%) | 174 (100.0%) |
| 5 to 9 Unit Apartments | 0 (0.0%) | 65 (100.0%) |
| 10 or more Apartments | 0 (0.0%) | 23 (100.0%) |
| Mobile Home / Other | 0 (0.0%) | 0 (0.0%) |
| Total | 1,543 (67.0%) | 760 (33.0%) |
Housing Structures by Number of Rooms in Shillington borough
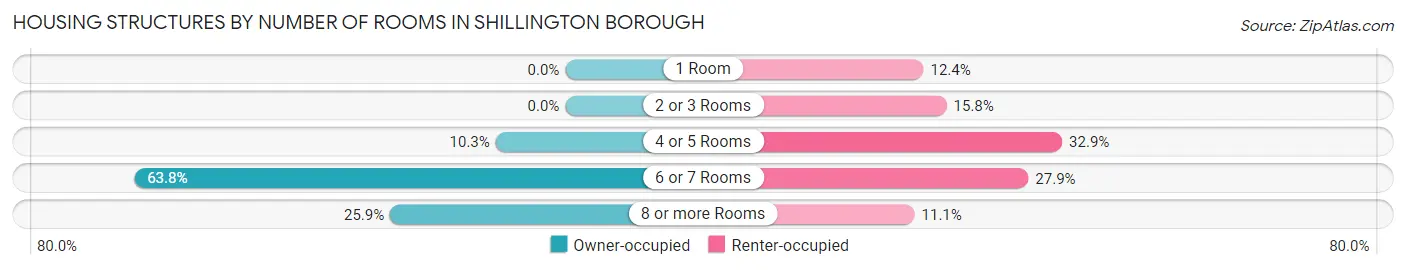
| Number of Rooms | Owner-occupied | Renter-occupied |
| 1 Room | 0 (0.0%) | 94 (12.4%) |
| 2 or 3 Rooms | 0 (0.0%) | 120 (15.8%) |
| 4 or 5 Rooms | 159 (10.3%) | 250 (32.9%) |
| 6 or 7 Rooms | 984 (63.8%) | 212 (27.9%) |
| 8 or more Rooms | 400 (25.9%) | 84 (11.1%) |
| Total | 1,543 (100.0%) | 760 (100.0%) |
Housing Structure by Heating Type in Shillington borough
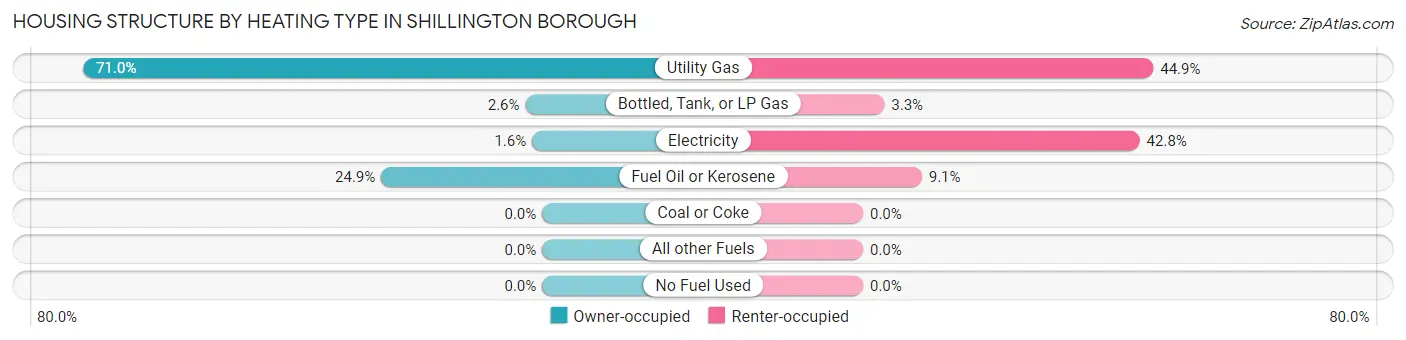
| Heating Type | Owner-occupied | Renter-occupied |
| Utility Gas | 1,095 (71.0%) | 341 (44.9%) |
| Bottled, Tank, or LP Gas | 40 (2.6%) | 25 (3.3%) |
| Electricity | 24 (1.6%) | 325 (42.8%) |
| Fuel Oil or Kerosene | 384 (24.9%) | 69 (9.1%) |
| Coal or Coke | 0 (0.0%) | 0 (0.0%) |
| All other Fuels | 0 (0.0%) | 0 (0.0%) |
| No Fuel Used | 0 (0.0%) | 0 (0.0%) |
| Total | 1,543 (100.0%) | 760 (100.0%) |
Household Vehicle Usage in Shillington borough
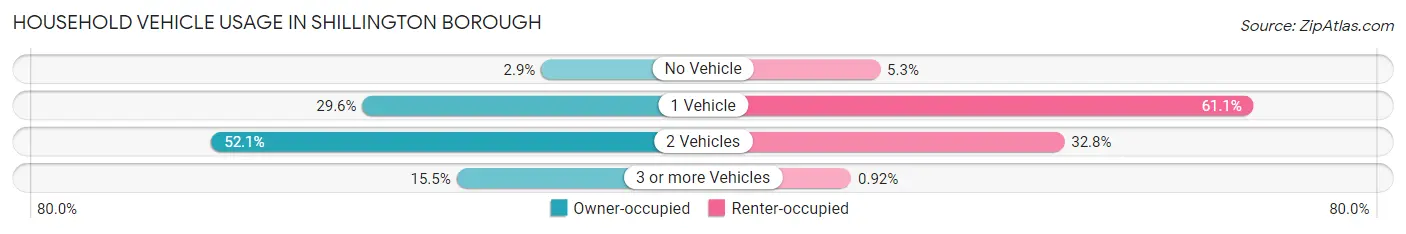
| Vehicles per Household | Owner-occupied | Renter-occupied |
| No Vehicle | 44 (2.9%) | 40 (5.3%) |
| 1 Vehicle | 456 (29.5%) | 464 (61.1%) |
| 2 Vehicles | 804 (52.1%) | 249 (32.8%) |
| 3 or more Vehicles | 239 (15.5%) | 7 (0.9%) |
| Total | 1,543 (100.0%) | 760 (100.0%) |
Real Estate & Mortgages in Shillington borough
Real Estate and Mortgage Overview in Shillington borough
| Characteristic | Without Mortgage | With Mortgage |
| Housing Units | 338 | 1,205 |
| Median Property Value | $170,100 | $177,900 |
| Median Household Income | $81,389 | $135 |
| Monthly Housing Costs | $598 | $29 |
| Real Estate Taxes | $3,776 | $8 |
Property Value by Mortgage Status in Shillington borough
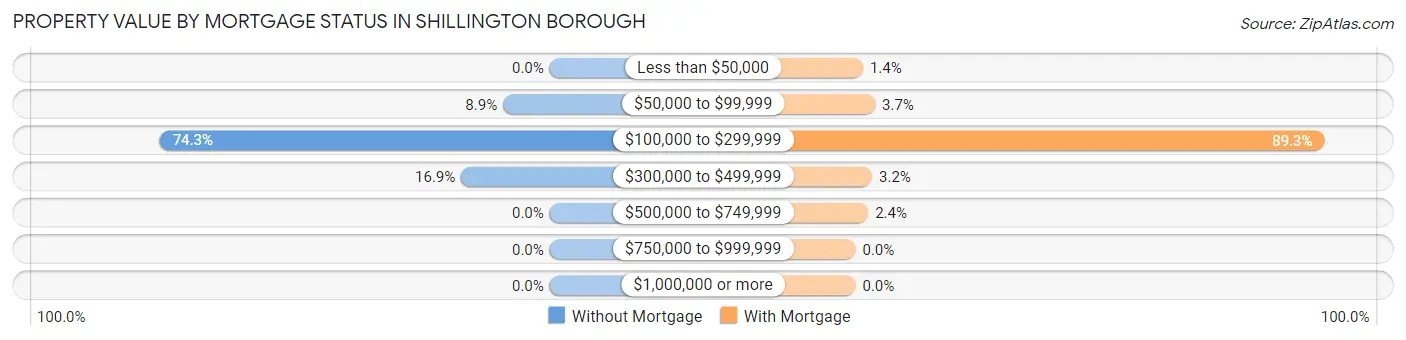
| Property Value | Without Mortgage | With Mortgage |
| Less than $50,000 | 0 (0.0%) | 17 (1.4%) |
| $50,000 to $99,999 | 30 (8.9%) | 45 (3.7%) |
| $100,000 to $299,999 | 251 (74.3%) | 1,076 (89.3%) |
| $300,000 to $499,999 | 57 (16.9%) | 38 (3.2%) |
| $500,000 to $749,999 | 0 (0.0%) | 29 (2.4%) |
| $750,000 to $999,999 | 0 (0.0%) | 0 (0.0%) |
| $1,000,000 or more | 0 (0.0%) | 0 (0.0%) |
| Total | 338 (100.0%) | 1,205 (100.0%) |
Household Income by Mortgage Status in Shillington borough
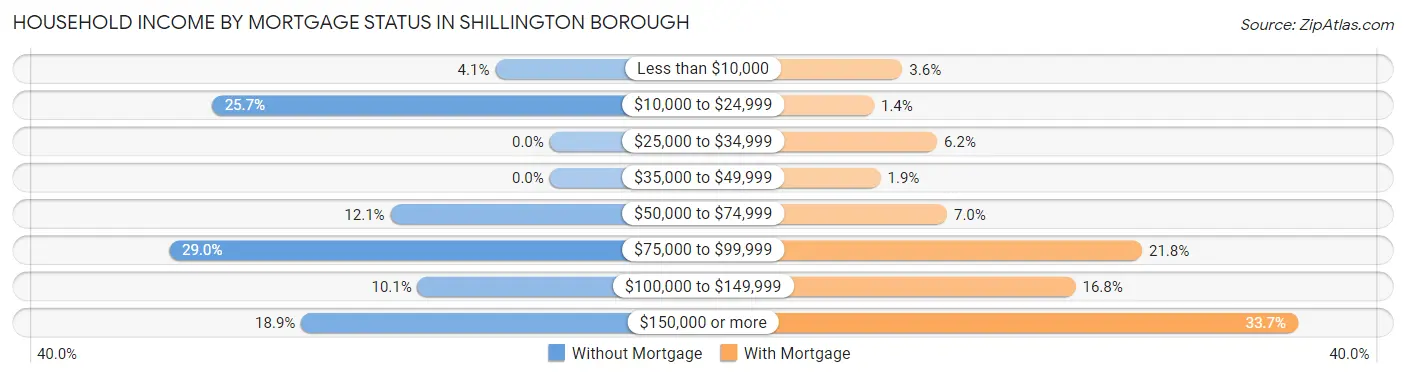
| Household Income | Without Mortgage | With Mortgage |
| Less than $10,000 | 14 (4.1%) | 43 (3.6%) |
| $10,000 to $24,999 | 87 (25.7%) | 17 (1.4%) |
| $25,000 to $34,999 | 0 (0.0%) | 75 (6.2%) |
| $35,000 to $49,999 | 0 (0.0%) | 23 (1.9%) |
| $50,000 to $74,999 | 41 (12.1%) | 84 (7.0%) |
| $75,000 to $99,999 | 98 (29.0%) | 263 (21.8%) |
| $100,000 to $149,999 | 34 (10.1%) | 202 (16.8%) |
| $150,000 or more | 64 (18.9%) | 406 (33.7%) |
| Total | 338 (100.0%) | 1,205 (100.0%) |
Property Value to Household Income Ratio in Shillington borough
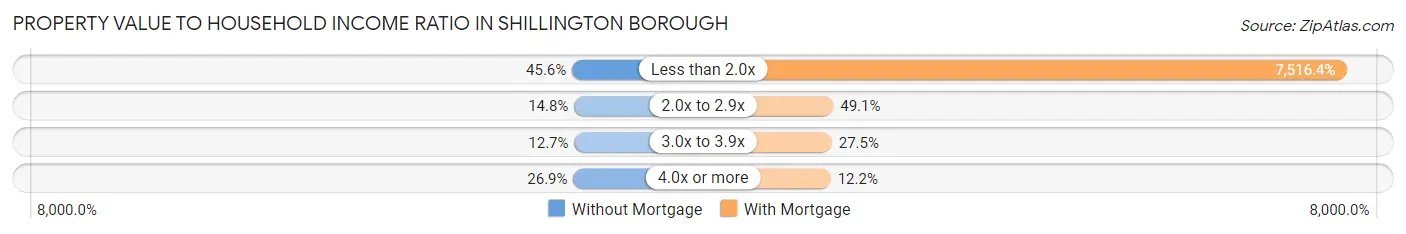
| Value-to-Income Ratio | Without Mortgage | With Mortgage |
| Less than 2.0x | 154 (45.6%) | 90,573 (7,516.4%) |
| 2.0x to 2.9x | 50 (14.8%) | 592 (49.1%) |
| 3.0x to 3.9x | 43 (12.7%) | 331 (27.5%) |
| 4.0x or more | 91 (26.9%) | 147 (12.2%) |
| Total | 338 (100.0%) | 1,205 (100.0%) |
Real Estate Taxes by Mortgage Status in Shillington borough
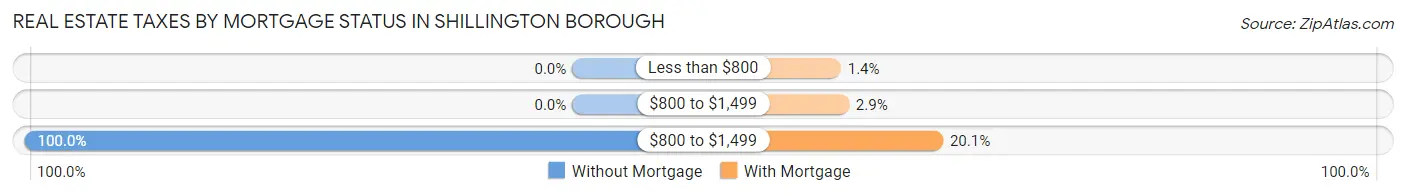
| Property Taxes | Without Mortgage | With Mortgage |
| Less than $800 | 0 (0.0%) | 17 (1.4%) |
| $800 to $1,499 | 0 (0.0%) | 35 (2.9%) |
| $800 to $1,499 | 338 (100.0%) | 242 (20.1%) |
| Total | 338 (100.0%) | 1,205 (100.0%) |
Health & Disability in Shillington borough
Health Insurance Coverage by Age in Shillington borough
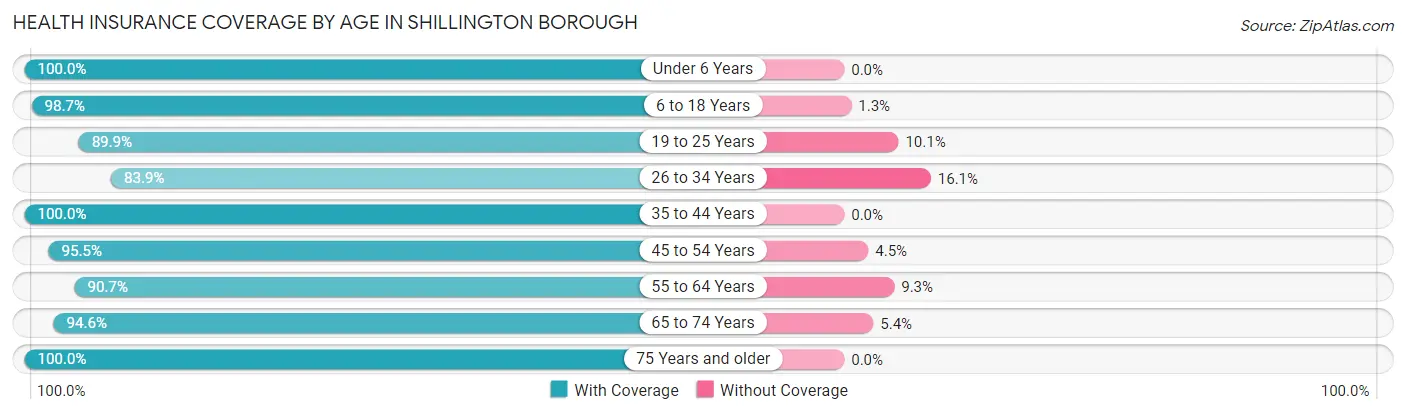
| Age Bracket | With Coverage | Without Coverage |
| Under 6 Years | 608 (100.0%) | 0 (0.0%) |
| 6 to 18 Years | 677 (98.7%) | 9 (1.3%) |
| 19 to 25 Years | 347 (89.9%) | 39 (10.1%) |
| 26 to 34 Years | 842 (83.9%) | 162 (16.1%) |
| 35 to 44 Years | 772 (100.0%) | 0 (0.0%) |
| 45 to 54 Years | 341 (95.5%) | 16 (4.5%) |
| 55 to 64 Years | 749 (90.7%) | 77 (9.3%) |
| 65 to 74 Years | 419 (94.6%) | 24 (5.4%) |
| 75 Years and older | 371 (100.0%) | 0 (0.0%) |
| Total | 5,126 (94.0%) | 327 (6.0%) |
Health Insurance Coverage by Citizenship Status in Shillington borough
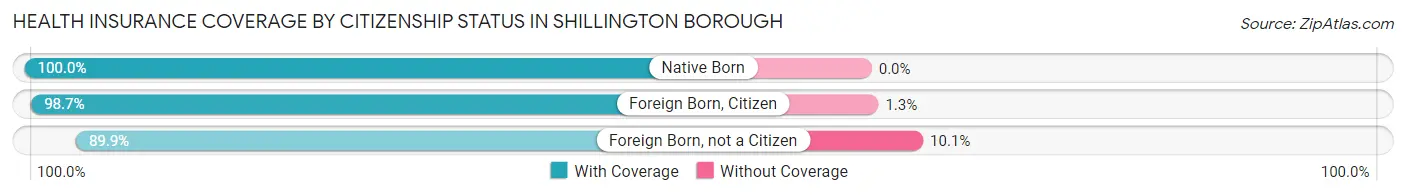
| Citizenship Status | With Coverage | Without Coverage |
| Native Born | 608 (100.0%) | 0 (0.0%) |
| Foreign Born, Citizen | 677 (98.7%) | 9 (1.3%) |
| Foreign Born, not a Citizen | 347 (89.9%) | 39 (10.1%) |
Health Insurance Coverage by Household Income in Shillington borough
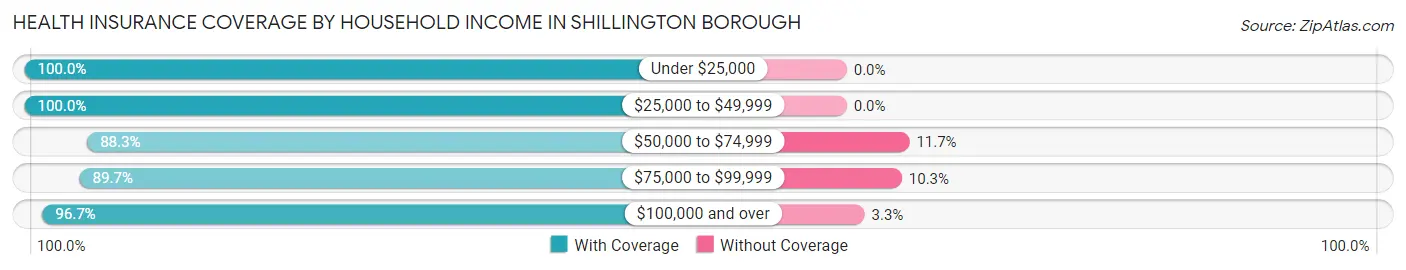
| Household Income | With Coverage | Without Coverage |
| Under $25,000 | 829 (100.0%) | 0 (0.0%) |
| $25,000 to $49,999 | 257 (100.0%) | 0 (0.0%) |
| $50,000 to $74,999 | 1,007 (88.3%) | 134 (11.7%) |
| $75,000 to $99,999 | 1,086 (89.7%) | 125 (10.3%) |
| $100,000 and over | 1,941 (96.7%) | 67 (3.3%) |
Public vs Private Health Insurance Coverage by Age in Shillington borough
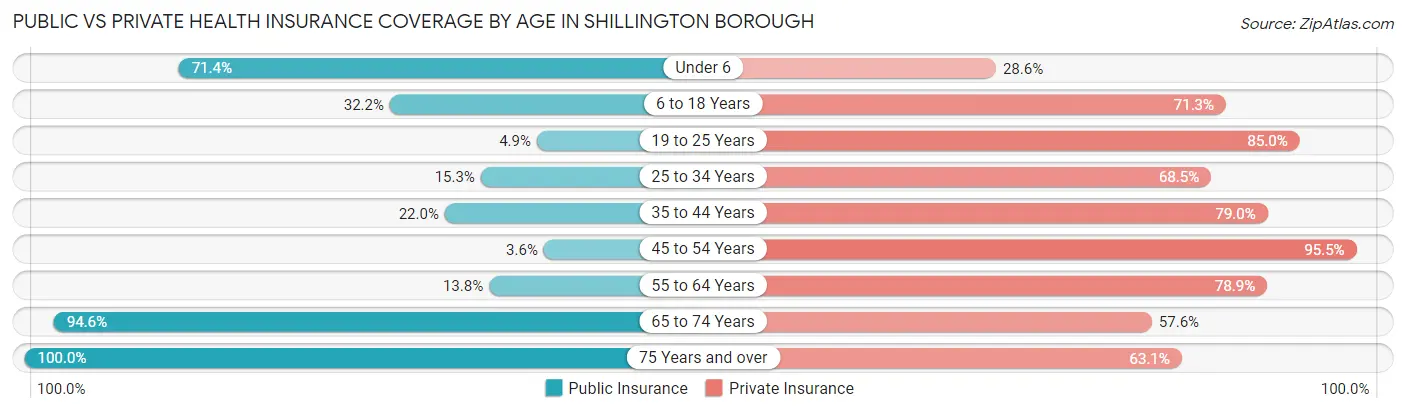
| Age Bracket | Public Insurance | Private Insurance |
| Under 6 | 434 (71.4%) | 174 (28.6%) |
| 6 to 18 Years | 221 (32.2%) | 489 (71.3%) |
| 19 to 25 Years | 19 (4.9%) | 328 (85.0%) |
| 25 to 34 Years | 154 (15.3%) | 688 (68.5%) |
| 35 to 44 Years | 170 (22.0%) | 610 (79.0%) |
| 45 to 54 Years | 13 (3.6%) | 341 (95.5%) |
| 55 to 64 Years | 114 (13.8%) | 652 (78.9%) |
| 65 to 74 Years | 419 (94.6%) | 255 (57.6%) |
| 75 Years and over | 371 (100.0%) | 234 (63.1%) |
| Total | 1,915 (35.1%) | 3,771 (69.2%) |
Disability Status by Sex by Age in Shillington borough
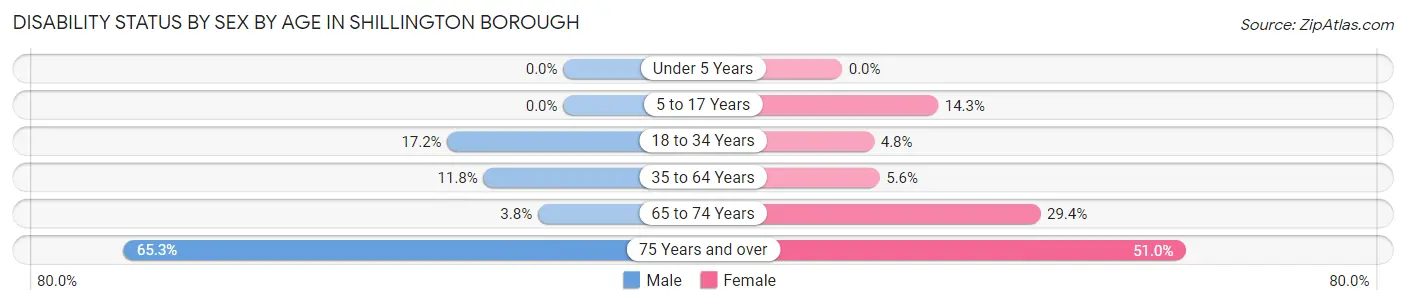
| Age Bracket | Male | Female |
| Under 5 Years | 0 (0.0%) | 0 (0.0%) |
| 5 to 17 Years | 0 (0.0%) | 51 (14.2%) |
| 18 to 34 Years | 127 (17.2%) | 31 (4.8%) |
| 35 to 64 Years | 121 (11.8%) | 52 (5.6%) |
| 65 to 74 Years | 8 (3.8%) | 68 (29.4%) |
| 75 Years and over | 77 (65.2%) | 129 (51.0%) |
Disability Class by Sex by Age in Shillington borough
Disability Class: Hearing Difficulty
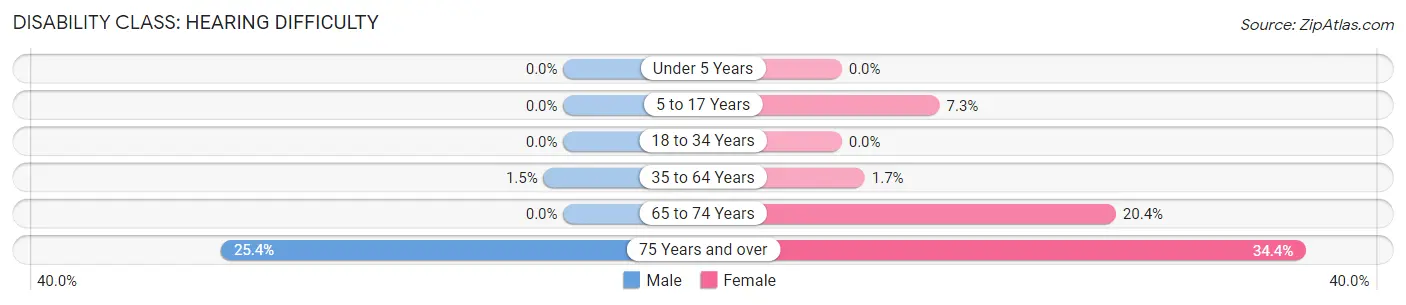
| Age Bracket | Male | Female |
| Under 5 Years | 0 (0.0%) | 0 (0.0%) |
| 5 to 17 Years | 0 (0.0%) | 26 (7.3%) |
| 18 to 34 Years | 0 (0.0%) | 0 (0.0%) |
| 35 to 64 Years | 15 (1.5%) | 16 (1.7%) |
| 65 to 74 Years | 0 (0.0%) | 47 (20.3%) |
| 75 Years and over | 30 (25.4%) | 87 (34.4%) |
Disability Class: Vision Difficulty
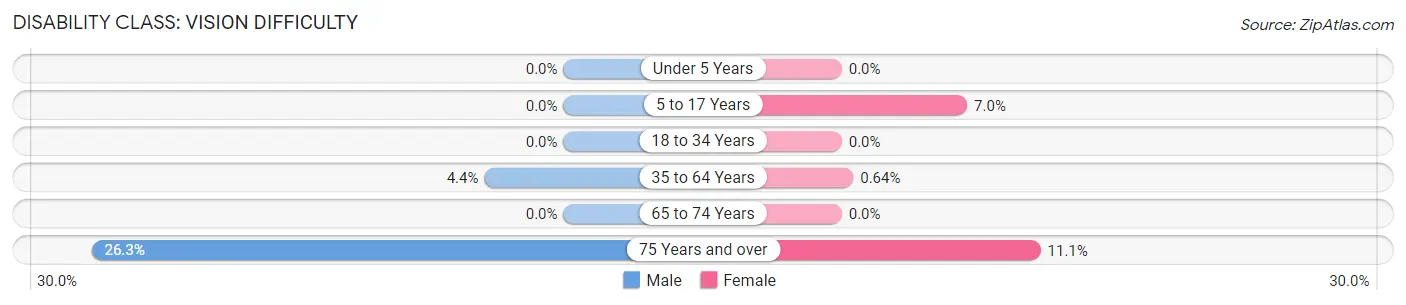
| Age Bracket | Male | Female |
| Under 5 Years | 0 (0.0%) | 0 (0.0%) |
| 5 to 17 Years | 0 (0.0%) | 25 (7.0%) |
| 18 to 34 Years | 0 (0.0%) | 0 (0.0%) |
| 35 to 64 Years | 45 (4.4%) | 6 (0.6%) |
| 65 to 74 Years | 0 (0.0%) | 0 (0.0%) |
| 75 Years and over | 31 (26.3%) | 28 (11.1%) |
Disability Class: Cognitive Difficulty
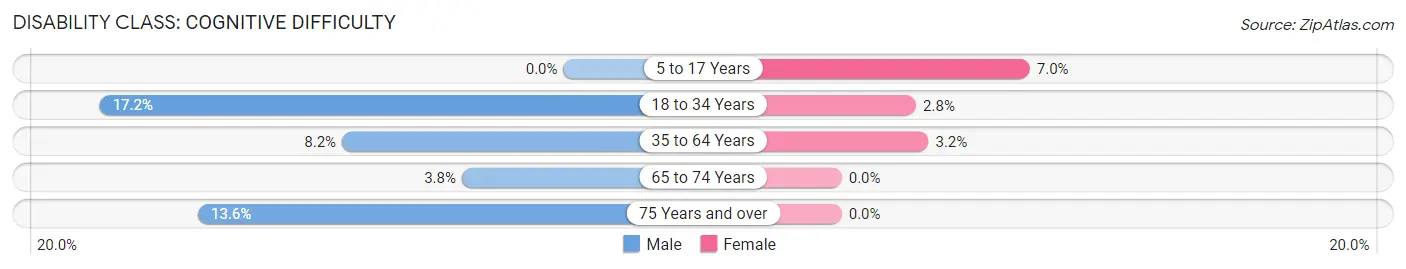
| Age Bracket | Male | Female |
| 5 to 17 Years | 0 (0.0%) | 25 (7.0%) |
| 18 to 34 Years | 127 (17.2%) | 18 (2.8%) |
| 35 to 64 Years | 84 (8.2%) | 30 (3.2%) |
| 65 to 74 Years | 8 (3.8%) | 0 (0.0%) |
| 75 Years and over | 16 (13.6%) | 0 (0.0%) |
Disability Class: Ambulatory Difficulty
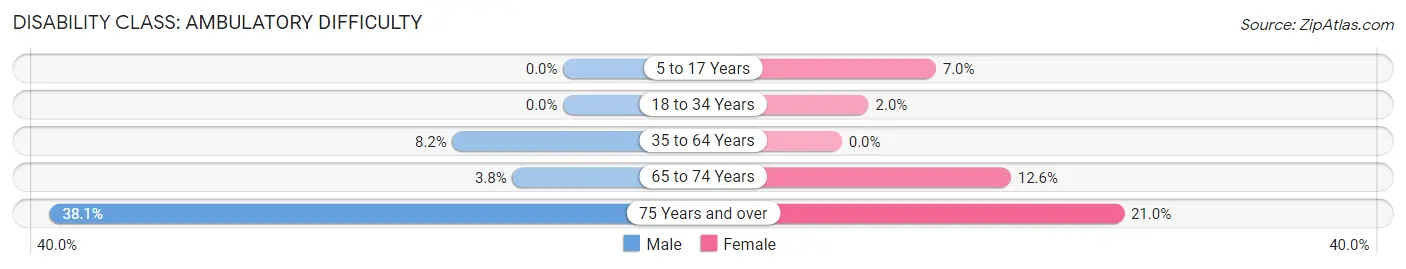
| Age Bracket | Male | Female |
| 5 to 17 Years | 0 (0.0%) | 25 (7.0%) |
| 18 to 34 Years | 0 (0.0%) | 13 (2.0%) |
| 35 to 64 Years | 84 (8.2%) | 0 (0.0%) |
| 65 to 74 Years | 8 (3.8%) | 29 (12.6%) |
| 75 Years and over | 45 (38.1%) | 53 (20.9%) |
Disability Class: Self-Care Difficulty
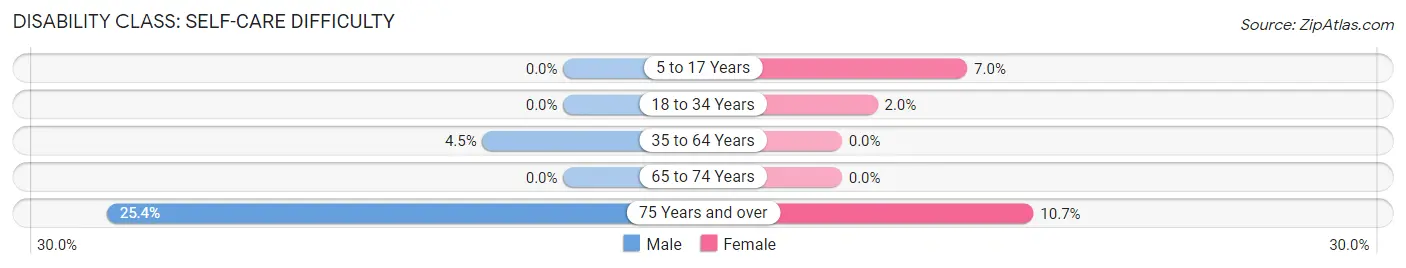
| Age Bracket | Male | Female |
| 5 to 17 Years | 0 (0.0%) | 25 (7.0%) |
| 18 to 34 Years | 0 (0.0%) | 13 (2.0%) |
| 35 to 64 Years | 46 (4.5%) | 0 (0.0%) |
| 65 to 74 Years | 0 (0.0%) | 0 (0.0%) |
| 75 Years and over | 30 (25.4%) | 27 (10.7%) |
Technology Access in Shillington borough
Computing Device Access in Shillington borough
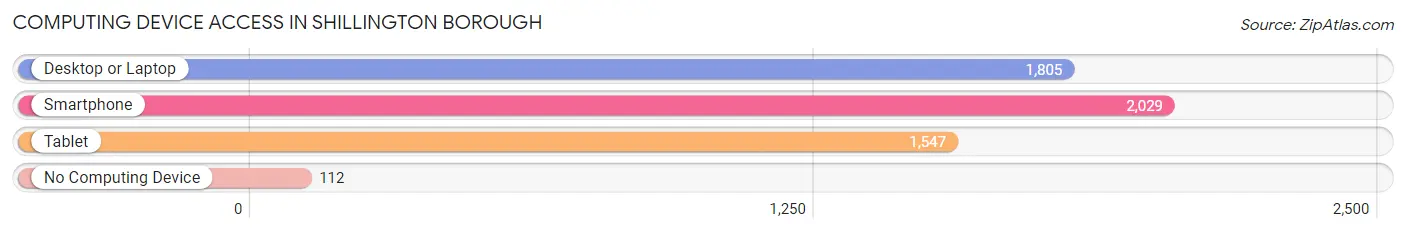
| Device Type | # Households | % Households |
| Desktop or Laptop | 1,805 | 78.4% |
| Smartphone | 2,029 | 88.1% |
| Tablet | 1,547 | 67.2% |
| No Computing Device | 112 | 4.9% |
| Total | 2,303 | 100.0% |
Internet Access in Shillington borough
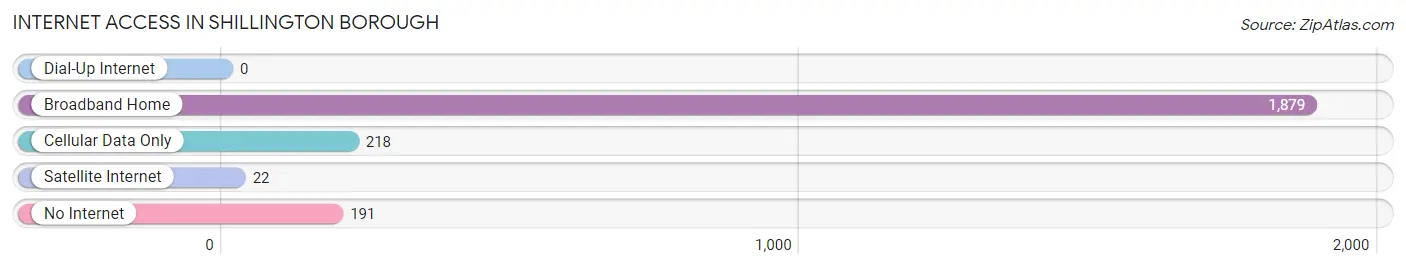
| Internet Type | # Households | % Households |
| Dial-Up Internet | 0 | 0.0% |
| Broadband Home | 1,879 | 81.6% |
| Cellular Data Only | 218 | 9.5% |
| Satellite Internet | 22 | 1.0% |
| No Internet | 191 | 8.3% |
| Total | 2,303 | 100.0% |
Shillington borough Summary
Shillington Borough is a small borough located in Berks County, Pennsylvania. It is situated in the southeastern corner of the county, just north of the city of Reading. The borough is home to a population of approximately 4,000 people, and is part of the Greater Reading Metropolitan Statistical Area.
History
Shillington Borough was founded in 1876 by a group of settlers from the nearby town of Shillington. The settlers were looking for a place to call home and found the area to be ideal for their needs. The borough was officially incorporated in 1877 and was named after the original settlers.
The borough was originally a farming community, but as the years passed, it began to develop into a more industrial area. In the early 1900s, the Reading Railroad began to expand its operations in the area, and the borough began to experience a period of growth. By the mid-1900s, the borough had become a thriving industrial center, with a variety of factories and businesses.
Geography
Shillington Borough is located in southeastern Berks County, Pennsylvania. It is situated just north of the city of Reading, and is bordered by the boroughs of West Reading, Wyomissing, and Sinking Spring. The borough is situated in the Schuylkill River Valley, and is surrounded by rolling hills and farmland.
The borough covers an area of 1.2 square miles, and is home to a population of approximately 4,000 people. The borough is served by the Reading School District, and is home to several parks and recreational areas.
Economy
Shillington Borough has a diverse economy, with a variety of businesses and industries. The borough is home to a number of manufacturing and industrial businesses, including a paper mill, a printing company, and a metal fabrication plant. The borough is also home to a number of retail stores, restaurants, and other businesses.
The borough is served by the Reading School District, and is home to several parks and recreational areas. The borough is also home to a number of churches, and is served by the Reading Public Library.
Demographics
As of the 2010 census, the population of Shillington Borough was 4,039. The racial makeup of the borough was 94.3% White, 1.7% African American, 0.2% Native American, 1.2% Asian, 0.1% Pacific Islander, 1.2% from other races, and 1.5% from two or more races. Hispanic or Latino of any race were 3.2% of the population.
The median household income in the borough was $45,938, and the median family income was $54,938. The per capita income in the borough was $21,945. About 8.2% of families and 10.2% of the population were below the poverty line, including 14.2% of those under age 18 and 6.2% of those age 65 or over.
Common Questions
What is Per Capita Income in Shillington borough?
Per Capita income in Shillington borough is $36,433.
What is the Median Family Income in Shillington borough?
Median Family Income in Shillington borough is $94,875.
What is the Median Household income in Shillington borough?
Median Household Income in Shillington borough is $74,583.
What is Income or Wage Gap in Shillington borough?
Income or Wage Gap in Shillington borough is 46.4%.
Women in Shillington borough earn 53.6 cents for every dollar earned by a man.
What is Inequality or Gini Index in Shillington borough?
Inequality or Gini Index in Shillington borough is 0.37.
What is the Total Population of Shillington borough?
Total Population of Shillington borough is 5,458.
What is the Total Male Population of Shillington borough?
Total Male Population of Shillington borough is 2,827.
What is the Total Female Population of Shillington borough?
Total Female Population of Shillington borough is 2,631.
What is the Ratio of Males per 100 Females in Shillington borough?
There are 107.45 Males per 100 Females in Shillington borough.
What is the Ratio of Females per 100 Males in Shillington borough?
There are 93.07 Females per 100 Males in Shillington borough.
What is the Median Population Age in Shillington borough?
Median Population Age in Shillington borough is 36.3 Years.
What is the Average Family Size in Shillington borough
Average Family Size in Shillington borough is 3.1 People.
What is the Average Household Size in Shillington borough
Average Household Size in Shillington borough is 2.4 People.
How Large is the Labor Force in Shillington borough?
There are 3,184 People in the Labor Forcein in Shillington borough.
What is the Percentage of People in the Labor Force in Shillington borough?
75.4% of People are in the Labor Force in Shillington borough.
What is the Unemployment Rate in Shillington borough?
Unemployment Rate in Shillington borough is 8.2%.