Springmont, PA Map & Demographics
Springmont Map
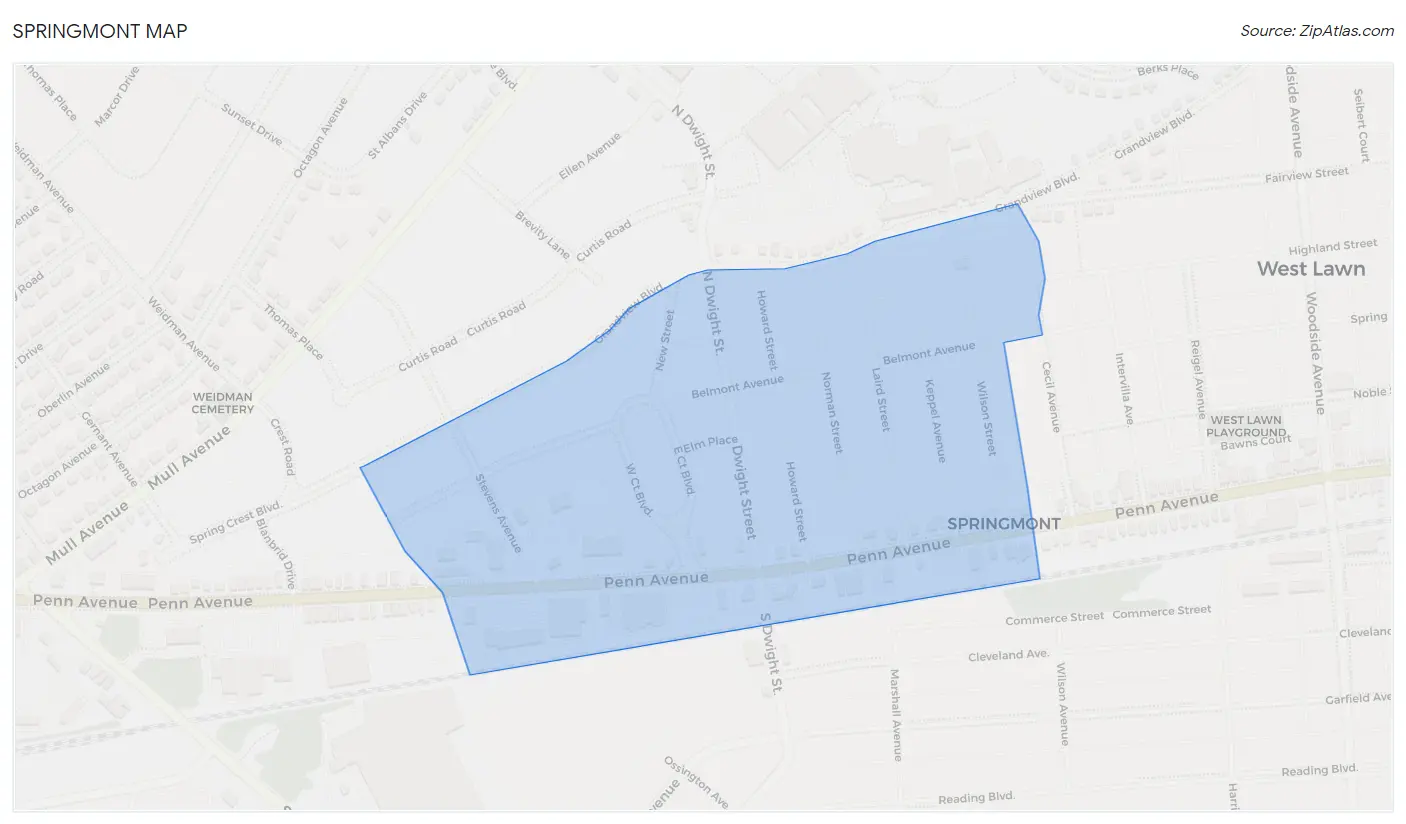
Springmont Overview
$48,121
PER CAPITA INCOME
$154,583
AVG FAMILY INCOME
44.2%
WAGE / INCOME GAP [ % ]
55.8¢/ $1
WAGE / INCOME GAP [ $ ]
0.38
INEQUALITY / GINI INDEX
1,424
TOTAL POPULATION
706
MALE POPULATION
718
FEMALE POPULATION
98.33
MALES / 100 FEMALES
101.70
FEMALES / 100 MALES
29.6
MEDIAN AGE
4.0
AVG FAMILY SIZE
2.7
AVG HOUSEHOLD SIZE
832
LABOR FORCE [ PEOPLE ]
79.4%
PERCENT IN LABOR FORCE
Income in Springmont
Income Overview in Springmont
| Characteristic | Number | Measure |
| Per Capita Income | 1,424 | $48,121 |
| Median Family Income | 300 | $154,583 |
| Mean Family Income | 300 | $159,953 |
| Median Household Income | 521 | $0 |
| Mean Household Income | 521 | $129,769 |
| Income Deficit | 300 | $0 |
| Wage / Income Gap (%) | 1,424 | 44.17% |
| Wage / Income Gap ($) | 1,424 | 55.83¢ per $1 |
| Gini / Inequality Index | 1,424 | 0.38 |
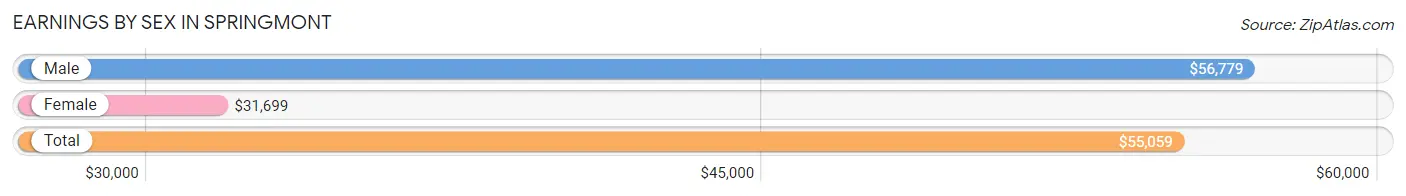
Earnings by Sex in Springmont
Average Earnings in Springmont are $55,059, $56,779 for men and $31,699 for women, a difference of 44.2%.
| Sex | Number | Average Earnings |
| Male | 499 (58.0%) | $56,779 |
| Female | 361 (42.0%) | $31,699 |
| Total | 860 (100.0%) | $55,059 |
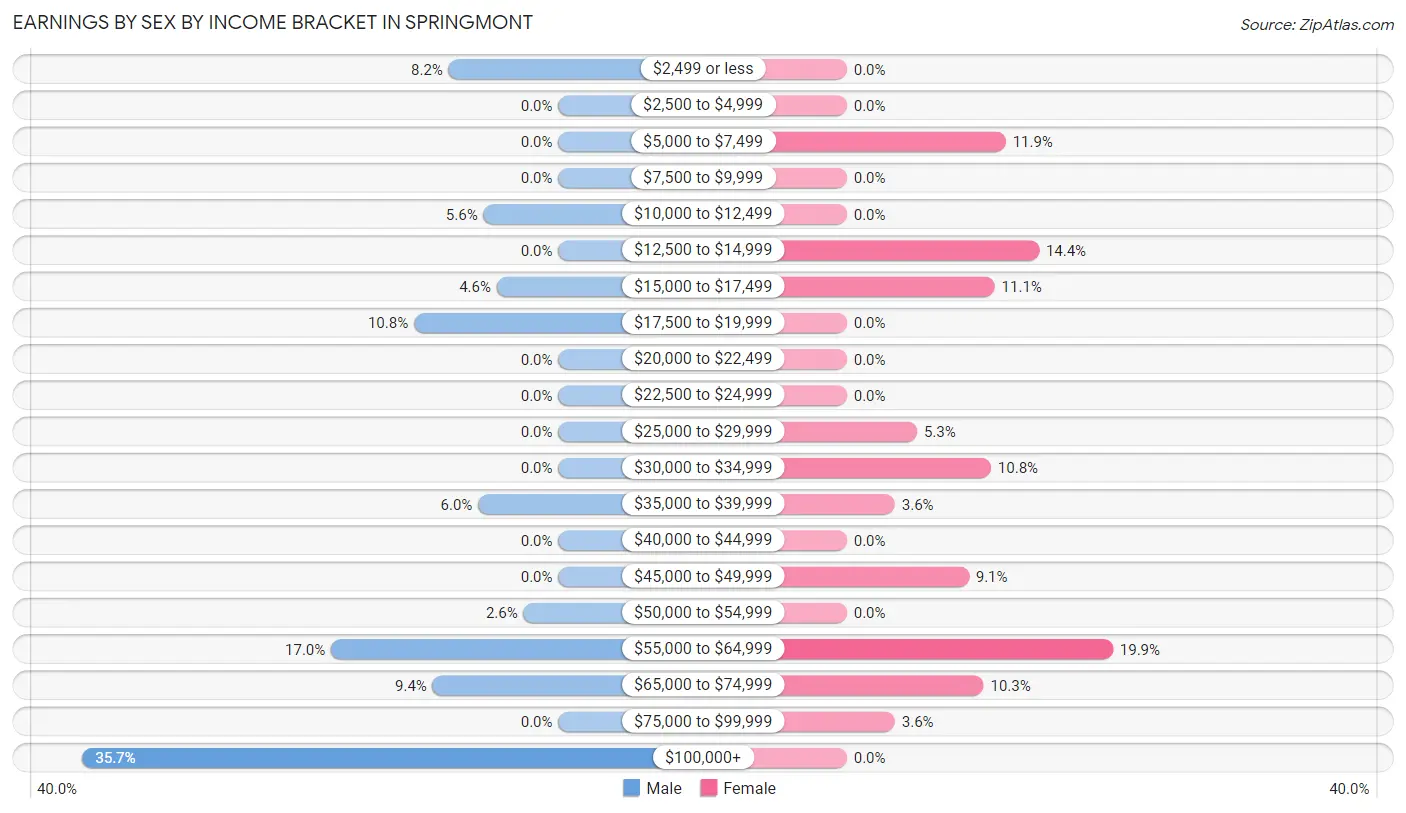
Earnings by Sex by Income Bracket in Springmont
The most common earnings brackets in Springmont are $100,000+ for men (178 | 35.7%) and $55,000 to $64,999 for women (72 | 19.9%).
| Income | Male | Female |
| $2,499 or less | 41 (8.2%) | 0 (0.0%) |
| $2,500 to $4,999 | 0 (0.0%) | 0 (0.0%) |
| $5,000 to $7,499 | 0 (0.0%) | 43 (11.9%) |
| $7,500 to $9,999 | 0 (0.0%) | 0 (0.0%) |
| $10,000 to $12,499 | 28 (5.6%) | 0 (0.0%) |
| $12,500 to $14,999 | 0 (0.0%) | 52 (14.4%) |
| $15,000 to $17,499 | 23 (4.6%) | 40 (11.1%) |
| $17,500 to $19,999 | 54 (10.8%) | 0 (0.0%) |
| $20,000 to $22,499 | 0 (0.0%) | 0 (0.0%) |
| $22,500 to $24,999 | 0 (0.0%) | 0 (0.0%) |
| $25,000 to $29,999 | 0 (0.0%) | 19 (5.3%) |
| $30,000 to $34,999 | 0 (0.0%) | 39 (10.8%) |
| $35,000 to $39,999 | 30 (6.0%) | 13 (3.6%) |
| $40,000 to $44,999 | 0 (0.0%) | 0 (0.0%) |
| $45,000 to $49,999 | 0 (0.0%) | 33 (9.1%) |
| $50,000 to $54,999 | 13 (2.6%) | 0 (0.0%) |
| $55,000 to $64,999 | 85 (17.0%) | 72 (19.9%) |
| $65,000 to $74,999 | 47 (9.4%) | 37 (10.2%) |
| $75,000 to $99,999 | 0 (0.0%) | 13 (3.6%) |
| $100,000+ | 178 (35.7%) | 0 (0.0%) |
| Total | 499 (100.0%) | 361 (100.0%) |
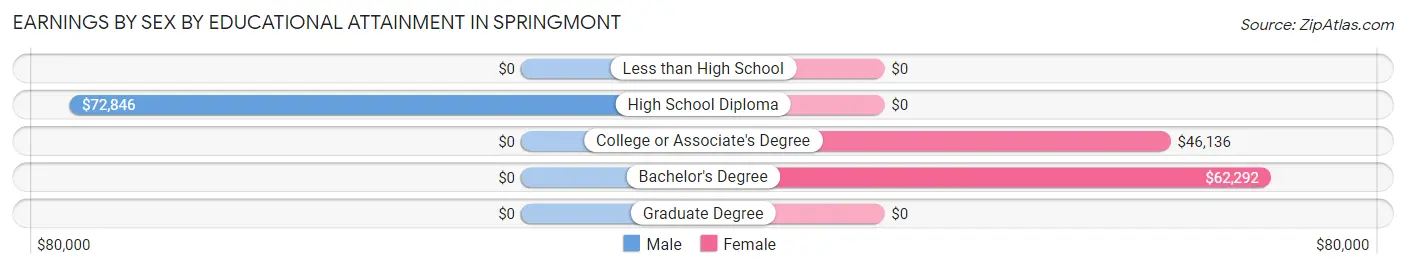
Earnings by Sex by Educational Attainment in Springmont
| Educational Attainment | Male Income | Female Income |
| Less than High School | - | - |
| High School Diploma | $72,846 | $0 |
| College or Associate's Degree | - | - |
| Bachelor's Degree | - | - |
| Graduate Degree | - | - |
| Total | - | - |
Family Income in Springmont
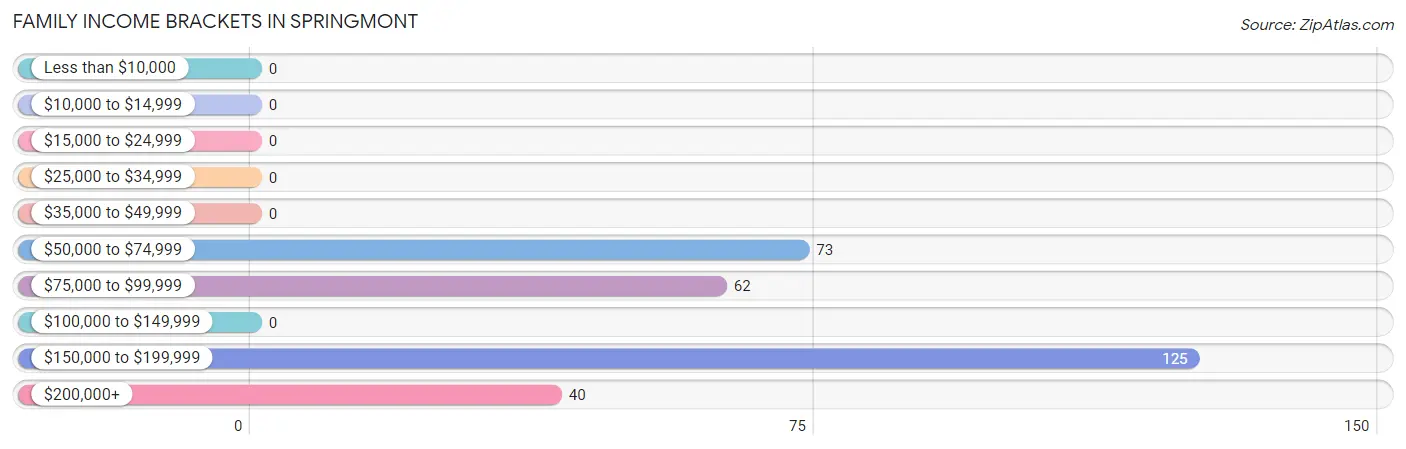
Family Income Brackets in Springmont
According to the Springmont family income data, there are 125 families falling into the $150,000 to $199,999 income range, which is the most common income bracket and makes up 41.7% of all families.
| Income Bracket | # Families | % Families |
| Less than $10,000 | 0 | 0.0% |
| $10,000 to $14,999 | 0 | 0.0% |
| $15,000 to $24,999 | 0 | 0.0% |
| $25,000 to $34,999 | 0 | 0.0% |
| $35,000 to $49,999 | 0 | 0.0% |
| $50,000 to $74,999 | 73 | 24.3% |
| $75,000 to $99,999 | 62 | 20.7% |
| $100,000 to $149,999 | 0 | 0.0% |
| $150,000 to $199,999 | 125 | 41.7% |
| $200,000+ | 40 | 13.3% |
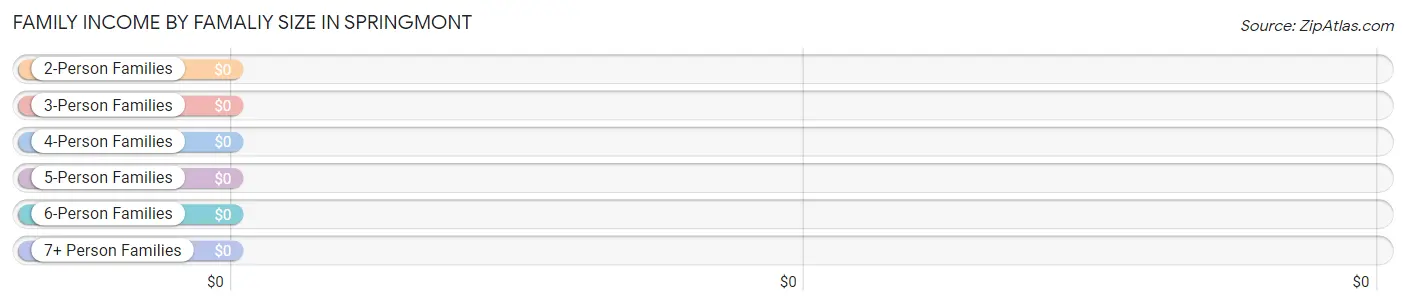
Family Income by Famaliy Size in Springmont
| Income Bracket | # Families | Median Income |
| 2-Person Families | 119 (39.7%) | $0 |
| 3-Person Families | 33 (11.0%) | $0 |
| 4-Person Families | 15 (5.0%) | $0 |
| 5-Person Families | 101 (33.7%) | $0 |
| 6-Person Families | 0 (0.0%) | $0 |
| 7+ Person Families | 32 (10.7%) | $0 |
| Total | 300 (100.0%) | $154,583 |
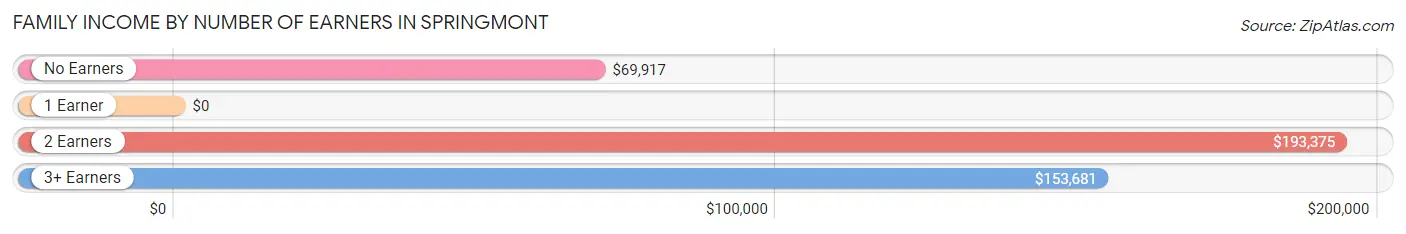
Family Income by Number of Earners in Springmont
| Number of Earners | # Families | Median Income |
| No Earners | 59 (19.7%) | $69,917 |
| 1 Earner | 0 (0.0%) | $0 |
| 2 Earners | 158 (52.7%) | $193,375 |
| 3+ Earners | 83 (27.7%) | $153,681 |
| Total | 300 (100.0%) | $154,583 |
Household Income in Springmont
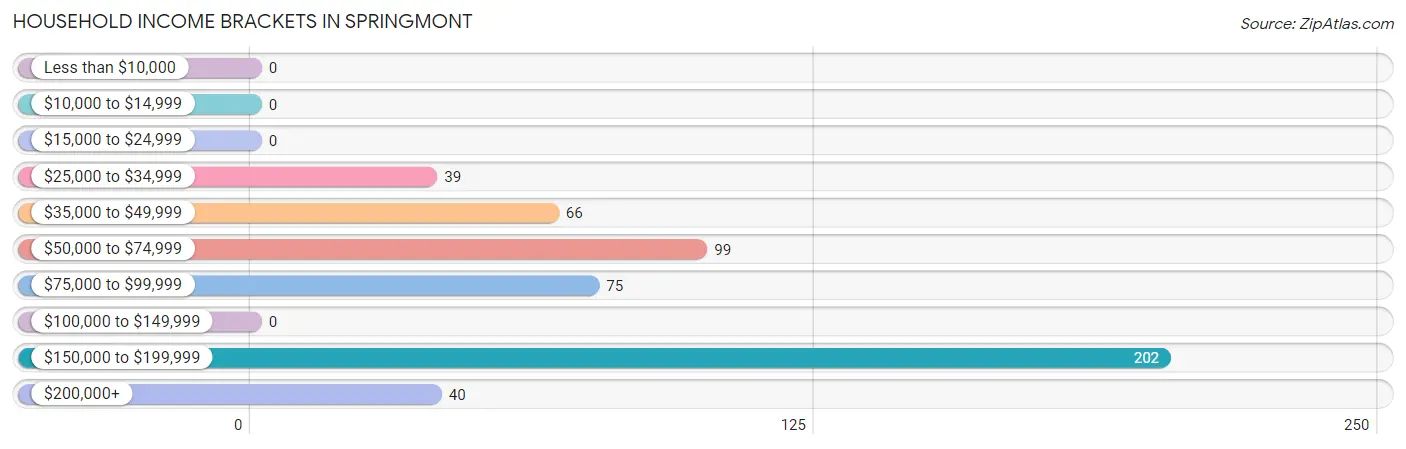
Household Income Brackets in Springmont
With 202 households falling in the category, the $150,000 to $199,999 income range is the most frequent in Springmont, accounting for 38.8% of all households.
| Income Bracket | # Households | % Households |
| Less than $10,000 | 0 | 0.0% |
| $10,000 to $14,999 | 0 | 0.0% |
| $15,000 to $24,999 | 0 | 0.0% |
| $25,000 to $34,999 | 39 | 7.5% |
| $35,000 to $49,999 | 66 | 12.7% |
| $50,000 to $74,999 | 99 | 19.0% |
| $75,000 to $99,999 | 75 | 14.4% |
| $100,000 to $149,999 | 0 | 0.0% |
| $150,000 to $199,999 | 202 | 38.8% |
| $200,000+ | 40 | 7.7% |
Household Income by Householder Age in Springmont
The median household income in Springmont is $0, with the highest median household income of $172,029 found in the 25 to 44 years age bracket for the primary householder. A total of 229 households (44.0%) fall into this category. Meanwhile, the 15 to 24 years age bracket for the primary householder has the lowest median household income of $0, with 43 households (8.3%) in this group.
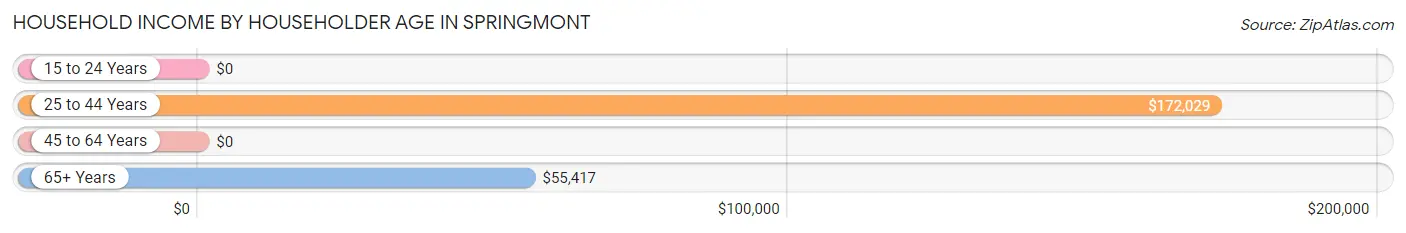
| Income Bracket | # Households | Median Income |
| 15 to 24 Years | 43 (8.3%) | $0 |
| 25 to 44 Years | 229 (44.0%) | $172,029 |
| 45 to 64 Years | 136 (26.1%) | $0 |
| 65+ Years | 113 (21.7%) | $55,417 |
| Total | 521 (100.0%) | $0 |
Poverty in Springmont
Income Below Poverty by Sex and Age in Springmont
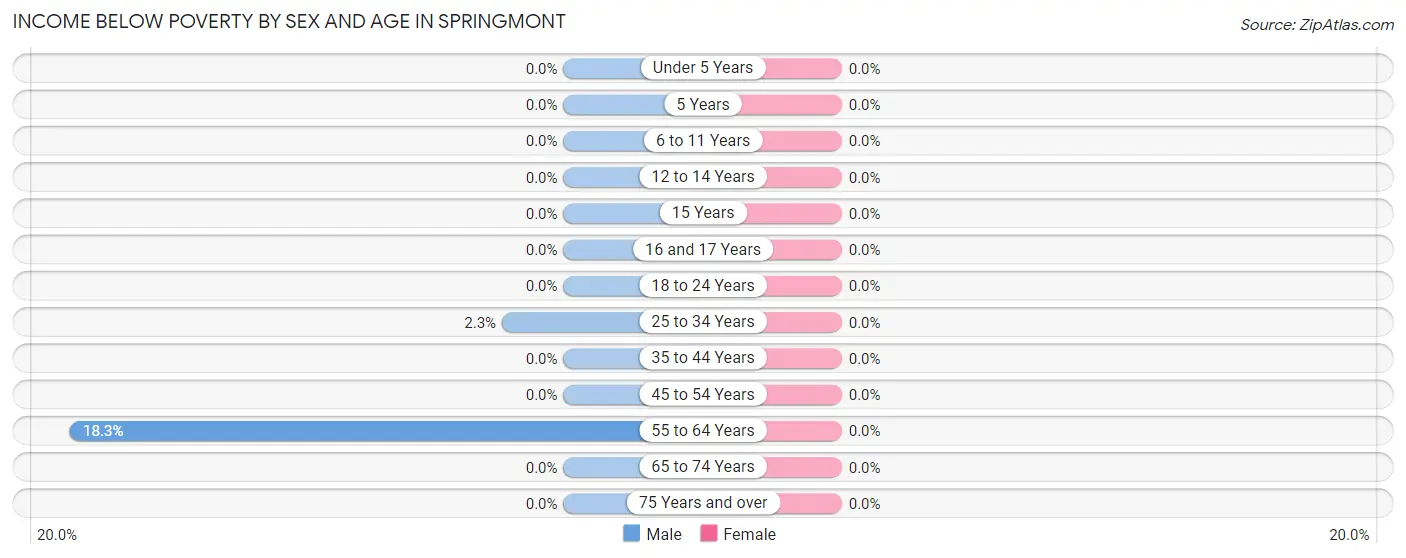
| Age Bracket | Male | Female |
| Under 5 Years | 0 (0.0%) | 0 (0.0%) |
| 5 Years | 0 (0.0%) | 0 (0.0%) |
| 6 to 11 Years | 0 (0.0%) | 0 (0.0%) |
| 12 to 14 Years | 0 (0.0%) | 0 (0.0%) |
| 15 Years | 0 (0.0%) | 0 (0.0%) |
| 16 and 17 Years | 0 (0.0%) | 0 (0.0%) |
| 18 to 24 Years | 0 (0.0%) | 0 (0.0%) |
| 25 to 34 Years | 5 (2.3%) | 0 (0.0%) |
| 35 to 44 Years | 0 (0.0%) | 0 (0.0%) |
| 45 to 54 Years | 0 (0.0%) | 0 (0.0%) |
| 55 to 64 Years | 13 (18.3%) | 0 (0.0%) |
| 65 to 74 Years | 0 (0.0%) | 0 (0.0%) |
| 75 Years and over | 0 (0.0%) | 0 (0.0%) |
| Total | 18 (2.5%) | 0 (0.0%) |
Income Above Poverty by Sex and Age in Springmont
According to the poverty statistics in Springmont, males aged under 5 years and females aged under 5 years are the age groups that are most secure financially, with 100.0% of males and 100.0% of females in these age groups living above the poverty line.
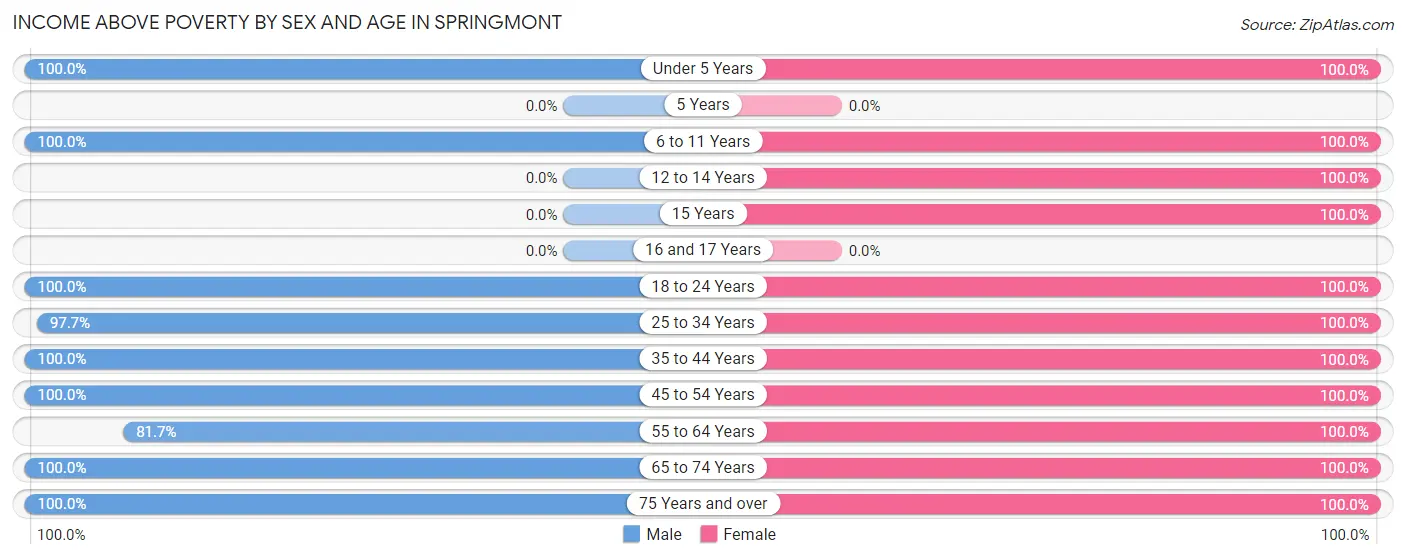
| Age Bracket | Male | Female |
| Under 5 Years | 98 (100.0%) | 101 (100.0%) |
| 5 Years | 0 (0.0%) | 0 (0.0%) |
| 6 to 11 Years | 31 (100.0%) | 91 (100.0%) |
| 12 to 14 Years | 0 (0.0%) | 41 (100.0%) |
| 15 Years | 0 (0.0%) | 14 (100.0%) |
| 16 and 17 Years | 0 (0.0%) | 0 (0.0%) |
| 18 to 24 Years | 56 (100.0%) | 115 (100.0%) |
| 25 to 34 Years | 214 (97.7%) | 54 (100.0%) |
| 35 to 44 Years | 54 (100.0%) | 92 (100.0%) |
| 45 to 54 Years | 63 (100.0%) | 66 (100.0%) |
| 55 to 64 Years | 58 (81.7%) | 68 (100.0%) |
| 65 to 74 Years | 86 (100.0%) | 44 (100.0%) |
| 75 Years and over | 28 (100.0%) | 32 (100.0%) |
| Total | 688 (97.5%) | 718 (100.0%) |
Income Below Poverty Among Married-Couple Families in Springmont
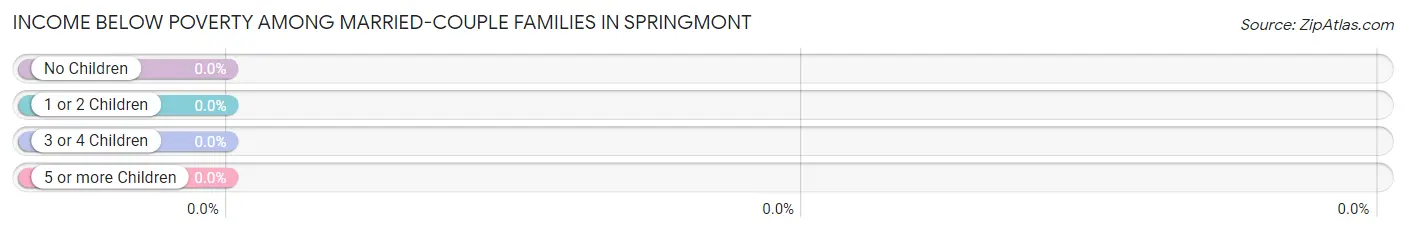
| Children | Above Poverty | Below Poverty |
| No Children | 170 (100.0%) | 0 (0.0%) |
| 1 or 2 Children | 47 (100.0%) | 0 (0.0%) |
| 3 or 4 Children | 83 (100.0%) | 0 (0.0%) |
| 5 or more Children | 0 (0.0%) | 0 (0.0%) |
| Total | 300 (100.0%) | 0 (0.0%) |
Income Below Poverty Among Single-Parent Households in Springmont
| Children | Single Father | Single Mother |
| No Children | 0 (0.0%) | 0 (0.0%) |
| 1 or 2 Children | 0 (0.0%) | 0 (0.0%) |
| 3 or 4 Children | 0 (0.0%) | 0 (0.0%) |
| 5 or more Children | 0 (0.0%) | 0 (0.0%) |
| Total | 0 (0.0%) | 0 (0.0%) |
Income Below Poverty Among Married-Couple vs Single-Parent Households in Springmont
| Children | Married-Couple Families | Single-Parent Households |
| No Children | 0 (0.0%) | 0 (0.0%) |
| 1 or 2 Children | 0 (0.0%) | 0 (0.0%) |
| 3 or 4 Children | 0 (0.0%) | 0 (0.0%) |
| 5 or more Children | 0 (0.0%) | 0 (0.0%) |
| Total | 0 (0.0%) | 0 (0.0%) |
Race in Springmont
The most populous races in Springmont are White / Caucasian (1,027 | 72.1%), Hispanic or Latino (493 | 34.6%), and Black / African American (266 | 18.7%).
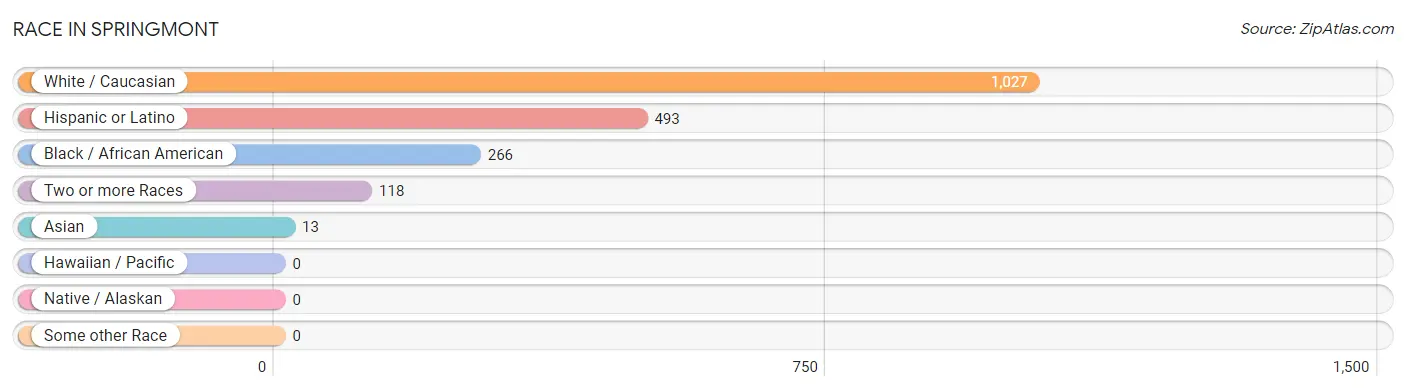
| Race | # Population | % Population |
| Asian | 13 | 0.9% |
| Black / African American | 266 | 18.7% |
| Hawaiian / Pacific | 0 | 0.0% |
| Hispanic or Latino | 493 | 34.6% |
| Native / Alaskan | 0 | 0.0% |
| White / Caucasian | 1,027 | 72.1% |
| Two or more Races | 118 | 8.3% |
| Some other Race | 0 | 0.0% |
| Total | 1,424 | 100.0% |
Ancestry in Springmont
The most populous ancestries reported in Springmont are Mexican (375 | 26.3%), German (319 | 22.4%), Irish (138 | 9.7%), Puerto Rican (118 | 8.3%), and Polish (92 | 6.5%), together accounting for 73.2% of all Springmont residents.
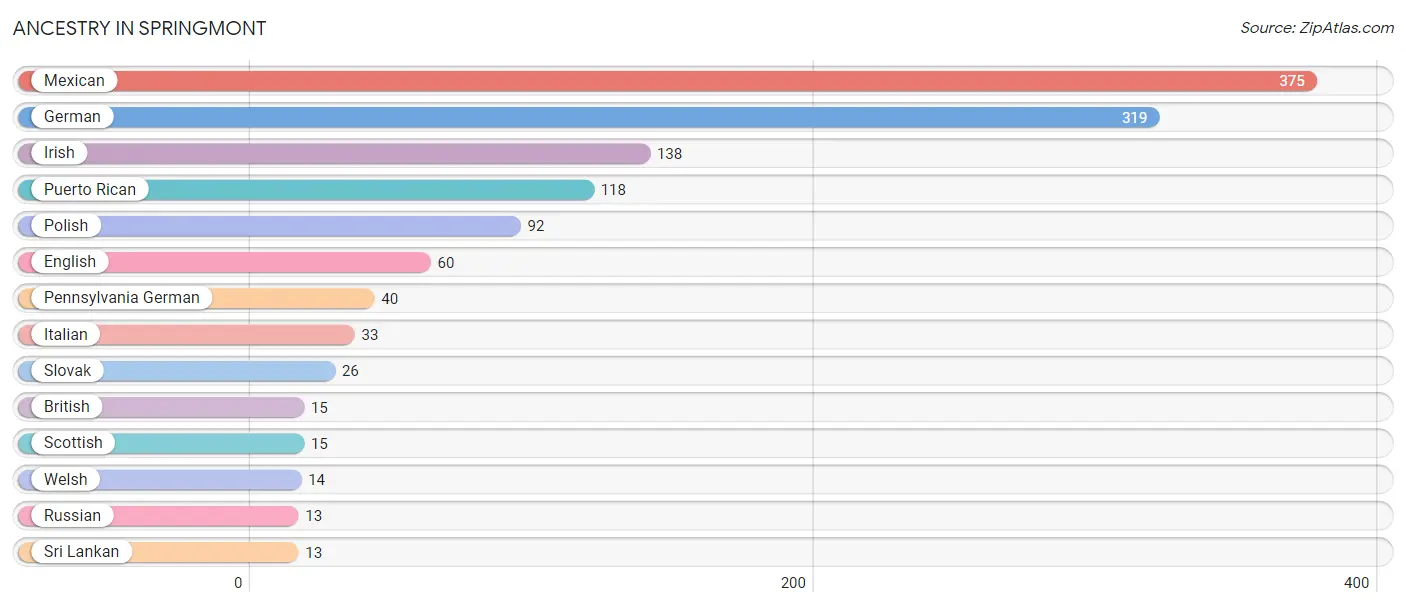
| Ancestry | # Population | % Population |
| British | 15 | 1.1% |
| English | 60 | 4.2% |
| German | 319 | 22.4% |
| Irish | 138 | 9.7% |
| Italian | 33 | 2.3% |
| Mexican | 375 | 26.3% |
| Pennsylvania German | 40 | 2.8% |
| Polish | 92 | 6.5% |
| Puerto Rican | 118 | 8.3% |
| Russian | 13 | 0.9% |
| Scottish | 15 | 1.1% |
| Slovak | 26 | 1.8% |
| Sri Lankan | 13 | 0.9% |
| Welsh | 14 | 1.0% | View All 14 Rows |
Immigrants in Springmont
The most numerous immigrant groups reported in Springmont came from Central America (103 | 7.2%), Latin America (103 | 7.2%), Mexico (103 | 7.2%), Asia (13 | 0.9%), and South Eastern Asia (13 | 0.9%), together accounting for 23.5% of all Springmont residents.
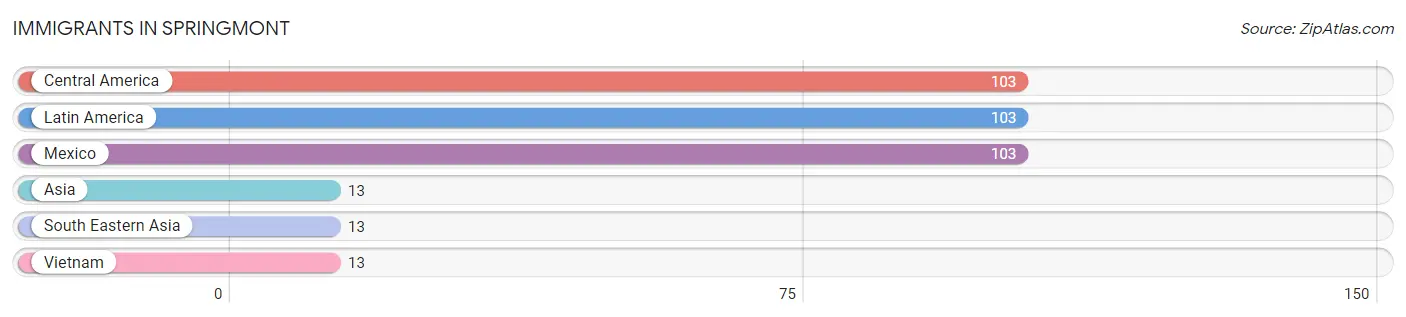
| Immigration Origin | # Population | % Population |
| Asia | 13 | 0.9% |
| Central America | 103 | 7.2% |
| Latin America | 103 | 7.2% |
| Mexico | 103 | 7.2% |
| South Eastern Asia | 13 | 0.9% |
| Vietnam | 13 | 0.9% | View All 6 Rows |
Sex and Age in Springmont
Sex and Age in Springmont
The most populous age groups in Springmont are 25 to 29 Years (137 | 19.4%) for men and 20 to 24 Years (115 | 16.0%) for women.
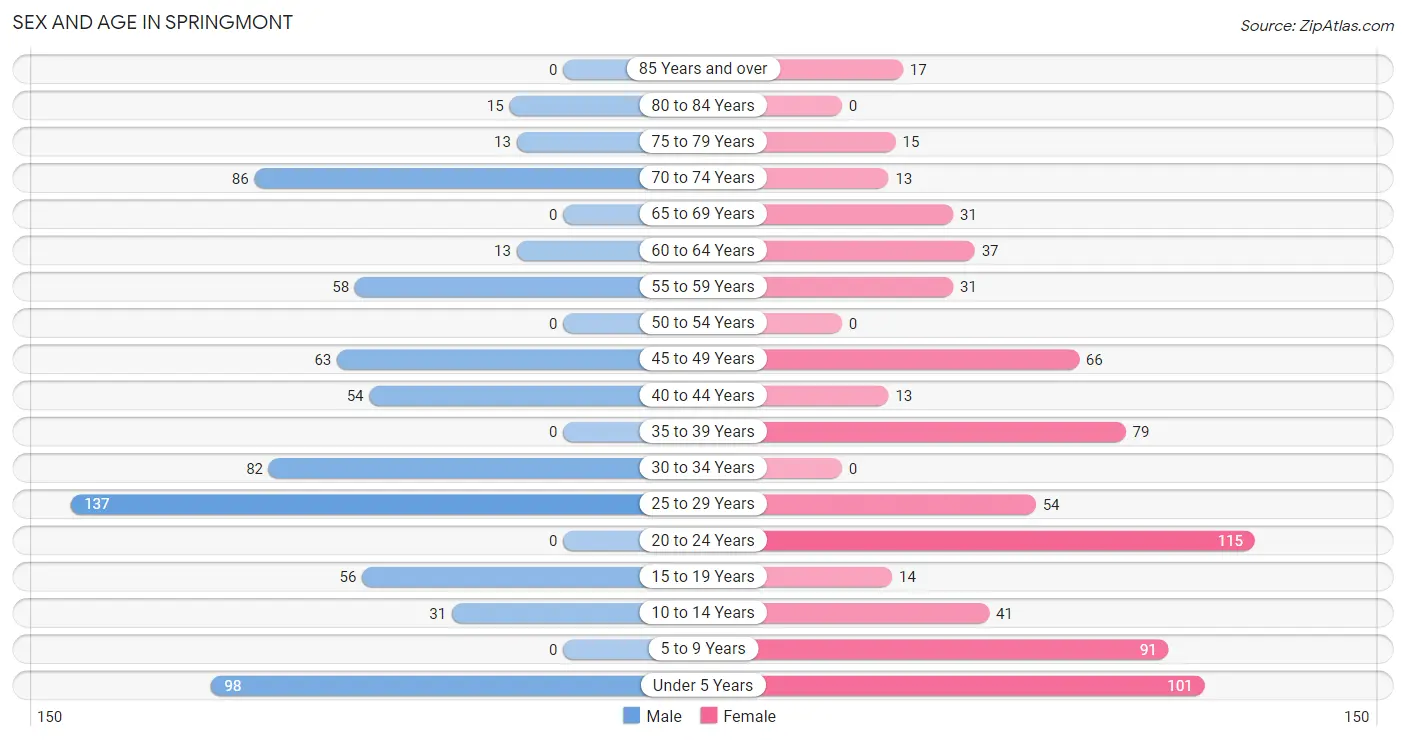
| Age Bracket | Male | Female |
| Under 5 Years | 98 (13.9%) | 101 (14.1%) |
| 5 to 9 Years | 0 (0.0%) | 91 (12.7%) |
| 10 to 14 Years | 31 (4.4%) | 41 (5.7%) |
| 15 to 19 Years | 56 (7.9%) | 14 (1.9%) |
| 20 to 24 Years | 0 (0.0%) | 115 (16.0%) |
| 25 to 29 Years | 137 (19.4%) | 54 (7.5%) |
| 30 to 34 Years | 82 (11.6%) | 0 (0.0%) |
| 35 to 39 Years | 0 (0.0%) | 79 (11.0%) |
| 40 to 44 Years | 54 (7.6%) | 13 (1.8%) |
| 45 to 49 Years | 63 (8.9%) | 66 (9.2%) |
| 50 to 54 Years | 0 (0.0%) | 0 (0.0%) |
| 55 to 59 Years | 58 (8.2%) | 31 (4.3%) |
| 60 to 64 Years | 13 (1.8%) | 37 (5.1%) |
| 65 to 69 Years | 0 (0.0%) | 31 (4.3%) |
| 70 to 74 Years | 86 (12.2%) | 13 (1.8%) |
| 75 to 79 Years | 13 (1.8%) | 15 (2.1%) |
| 80 to 84 Years | 15 (2.1%) | 0 (0.0%) |
| 85 Years and over | 0 (0.0%) | 17 (2.4%) |
| Total | 706 (100.0%) | 718 (100.0%) |
Families and Households in Springmont
Median Family Size in Springmont
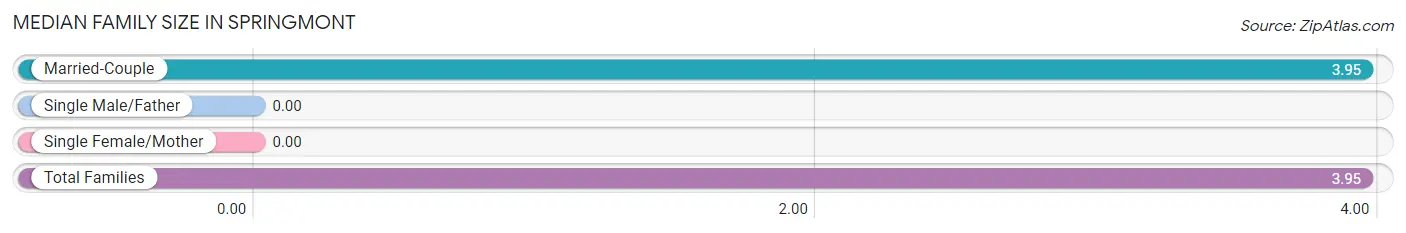
| Family Type | # Families | Family Size |
| Married-Couple | 300 (100.0%) | 3.95 |
| Single Male/Father | 0 (0.0%) | - |
| Single Female/Mother | 0 (0.0%) | - |
| Total Families | 300 (100.0%) | 3.95 |
Median Household Size in Springmont
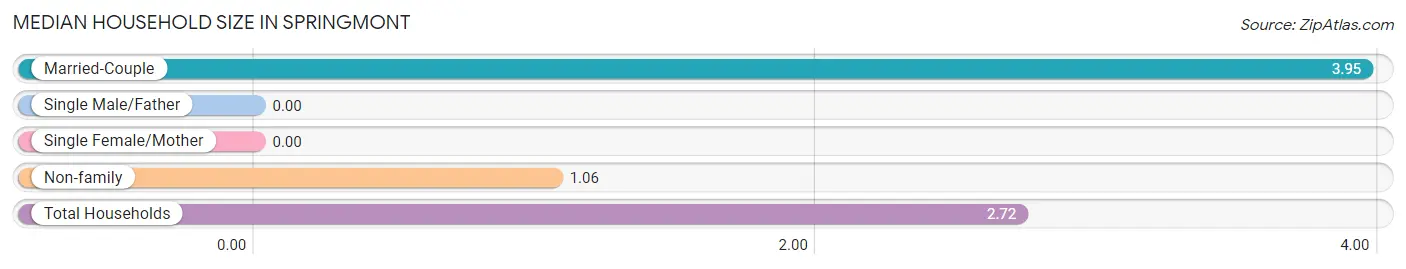
| Household Type | # Households | Household Size |
| Married-Couple | 300 (57.6%) | 3.95 |
| Single Male/Father | 0 (0.0%) | - |
| Single Female/Mother | 0 (0.0%) | - |
| Non-family | 221 (42.4%) | 1.06 |
| Total Households | 521 (100.0%) | 2.72 |
Household Size by Marriage Status in Springmont
Out of a total of 521 households in Springmont, 300 (57.6%) are family households, while 221 (42.4%) are nonfamily households. The most numerous type of family households are 2-person households, comprising 119, and the most common type of nonfamily households are 1-person households, comprising 208.
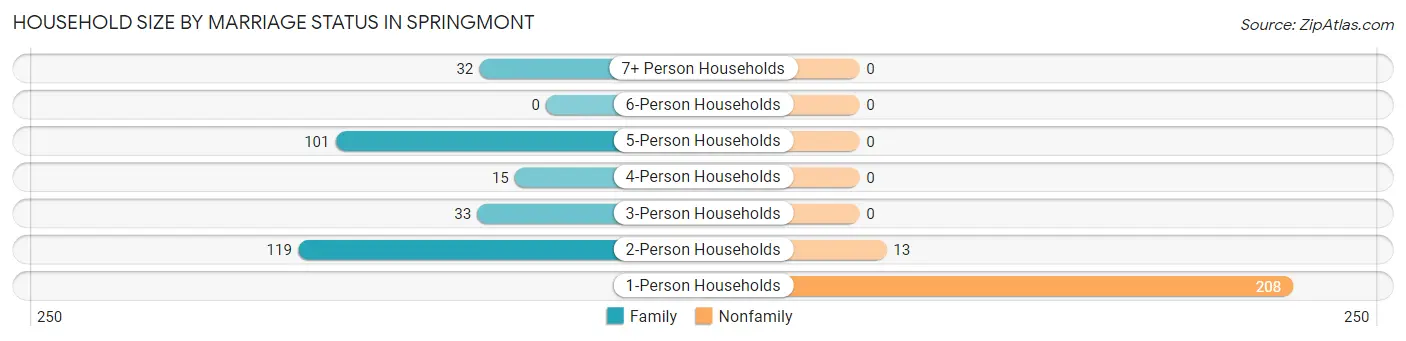
| Household Size | Family Households | Nonfamily Households |
| 1-Person Households | - | 208 (39.9%) |
| 2-Person Households | 119 (22.8%) | 13 (2.5%) |
| 3-Person Households | 33 (6.3%) | 0 (0.0%) |
| 4-Person Households | 15 (2.9%) | 0 (0.0%) |
| 5-Person Households | 101 (19.4%) | 0 (0.0%) |
| 6-Person Households | 0 (0.0%) | 0 (0.0%) |
| 7+ Person Households | 32 (6.1%) | 0 (0.0%) |
| Total | 300 (57.6%) | 221 (42.4%) |
Female Fertility in Springmont
Fertility by Age in Springmont
Average fertility rate in Springmont is 217.0 births per 1,000 women. Women in the age bracket of 35 to 50 years have the highest fertility rate with 253.0 births per 1,000 women. Women in the age bracket of 35 to 50 years acount for 54.0% of all women with births.
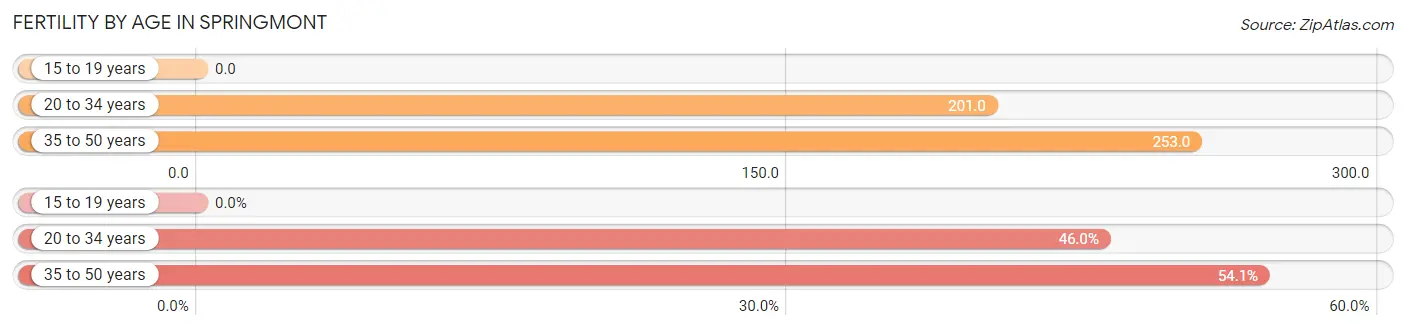
| Age Bracket | Women with Births | Births / 1,000 Women |
| 15 to 19 years | 0 (0.0%) | 0.0 |
| 20 to 34 years | 34 (46.0%) | 201.0 |
| 35 to 50 years | 40 (54.0%) | 253.0 |
| Total | 74 (100.0%) | 217.0 |
Fertility by Age by Marriage Status in Springmont
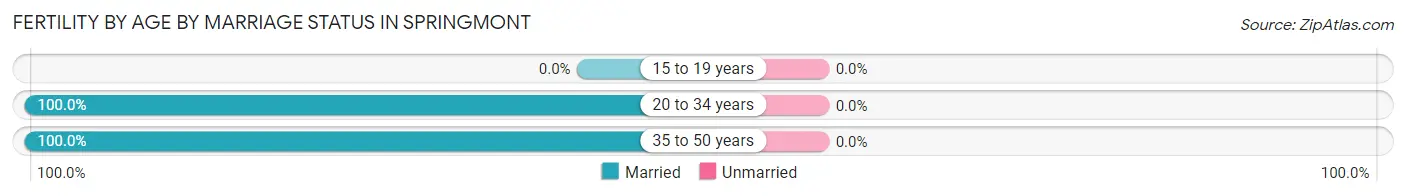
| Age Bracket | Married | Unmarried |
| 15 to 19 years | 0 (0.0%) | 0 (0.0%) |
| 20 to 34 years | 34 (100.0%) | 0 (0.0%) |
| 35 to 50 years | 40 (100.0%) | 0 (0.0%) |
| Total | 74 (100.0%) | 0 (0.0%) |
Fertility by Education in Springmont
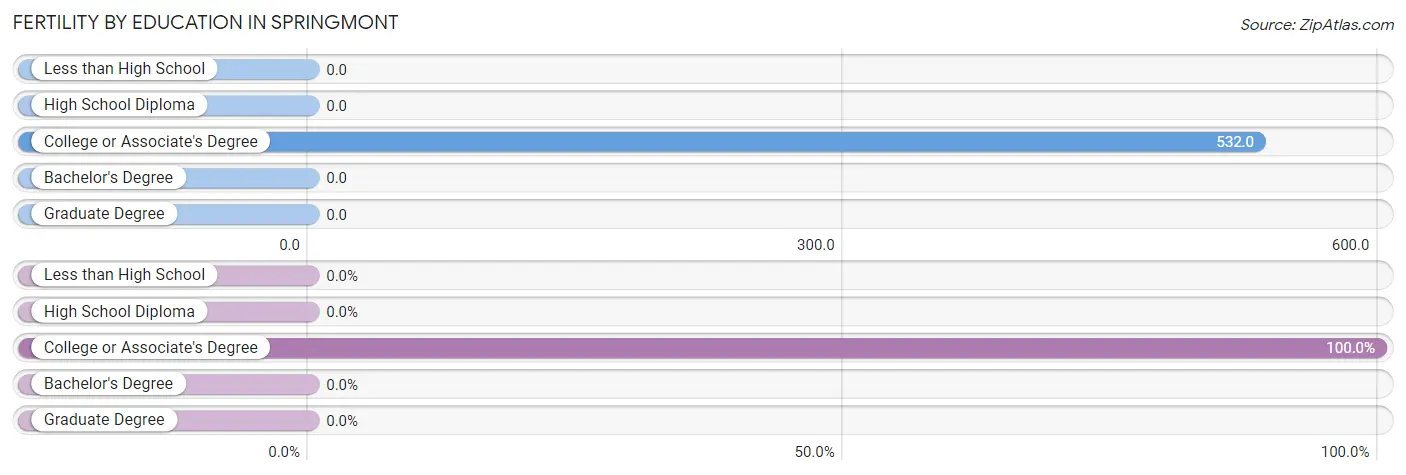
| Educational Attainment | Women with Births | Births / 1,000 Women |
| Less than High School | 0 (0.0%) | 0.0 |
| High School Diploma | 0 (0.0%) | 0.0 |
| College or Associate's Degree | 74 (100.0%) | 532.0 |
| Bachelor's Degree | 0 (0.0%) | 0.0 |
| Graduate Degree | 0 (0.0%) | 0.0 |
| Total | 74 (100.0%) | 217.0 |
Fertility by Education by Marriage Status in Springmont
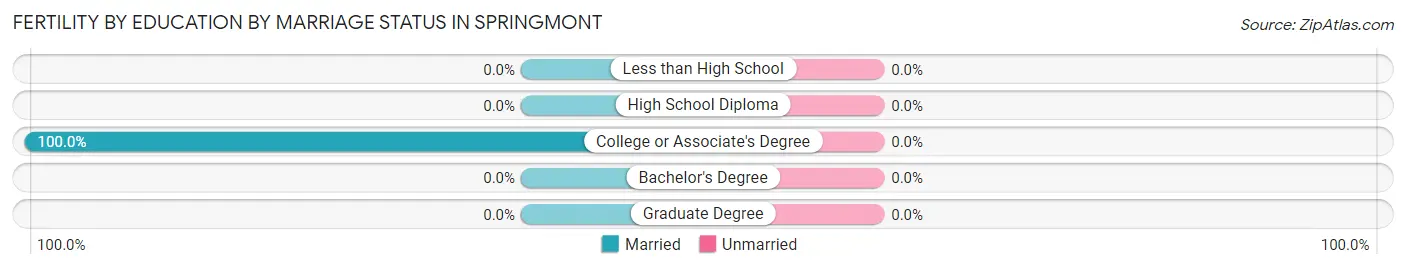
| Educational Attainment | Married | Unmarried |
| Less than High School | 0 (0.0%) | 0 (0.0%) |
| High School Diploma | 0 (0.0%) | 0 (0.0%) |
| College or Associate's Degree | 74 (100.0%) | 0 (0.0%) |
| Bachelor's Degree | 0 (0.0%) | 0 (0.0%) |
| Graduate Degree | 0 (0.0%) | 0 (0.0%) |
| Total | 74 (100.0%) | 0 (0.0%) |
Employment Characteristics in Springmont
Employment by Class of Employer in Springmont
Among the 832 employed individuals in Springmont, private company employees (577 | 69.4%), local government employees (97 | 11.7%), and not-for-profit organizations (85 | 10.2%) make up the most common classes of employment.
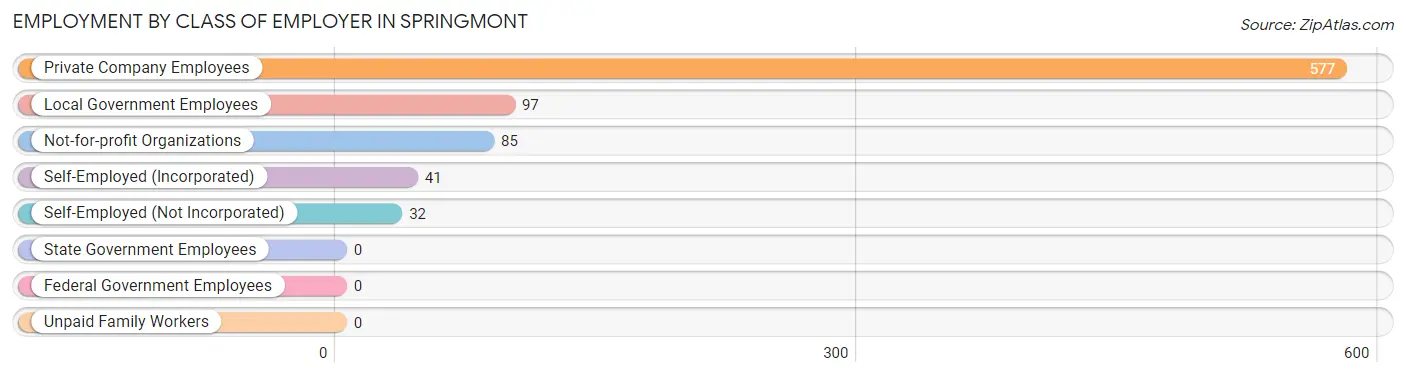
| Employer Class | # Employees | % Employees |
| Private Company Employees | 577 | 69.4% |
| Self-Employed (Incorporated) | 41 | 4.9% |
| Self-Employed (Not Incorporated) | 32 | 3.8% |
| Not-for-profit Organizations | 85 | 10.2% |
| Local Government Employees | 97 | 11.7% |
| State Government Employees | 0 | 0.0% |
| Federal Government Employees | 0 | 0.0% |
| Unpaid Family Workers | 0 | 0.0% |
| Total | 832 | 100.0% |
Employment Status by Age in Springmont
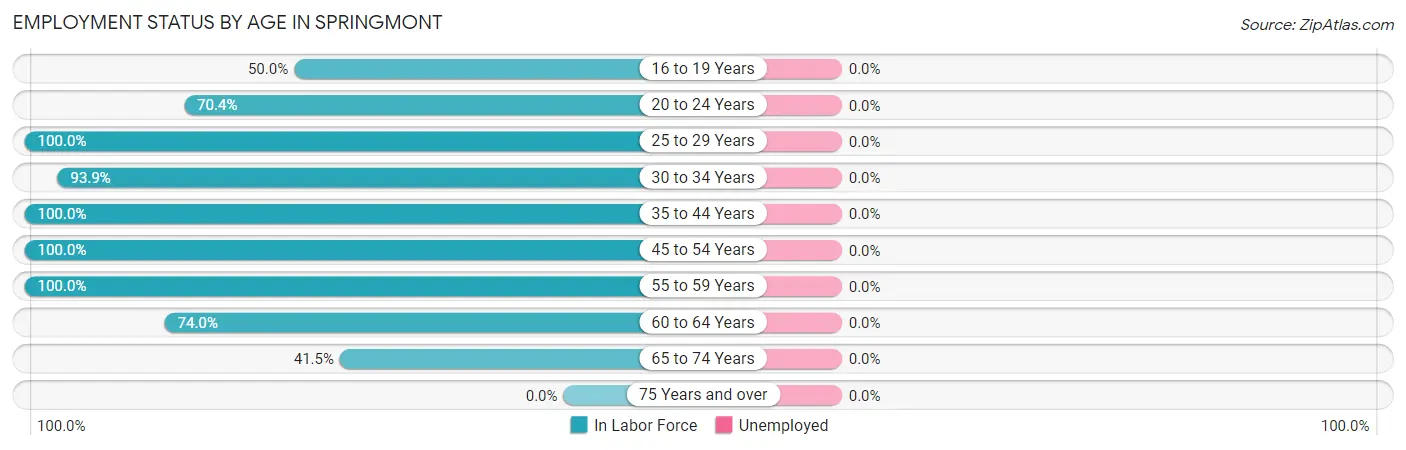
| Age Bracket | In Labor Force | Unemployed |
| 16 to 19 Years | 28 (50.0%) | 0 (0.0%) |
| 20 to 24 Years | 81 (70.4%) | 0 (0.0%) |
| 25 to 29 Years | 191 (100.0%) | 0 (0.0%) |
| 30 to 34 Years | 77 (93.9%) | 0 (0.0%) |
| 35 to 44 Years | 146 (100.0%) | 0 (0.0%) |
| 45 to 54 Years | 129 (100.0%) | 0 (0.0%) |
| 55 to 59 Years | 89 (100.0%) | 0 (0.0%) |
| 60 to 64 Years | 37 (74.0%) | 0 (0.0%) |
| 65 to 74 Years | 54 (41.5%) | 0 (0.0%) |
| 75 Years and over | 0 (0.0%) | 0 (0.0%) |
| Total | 832 (79.4%) | 0 (0.0%) |
Employment Status by Educational Attainment in Springmont
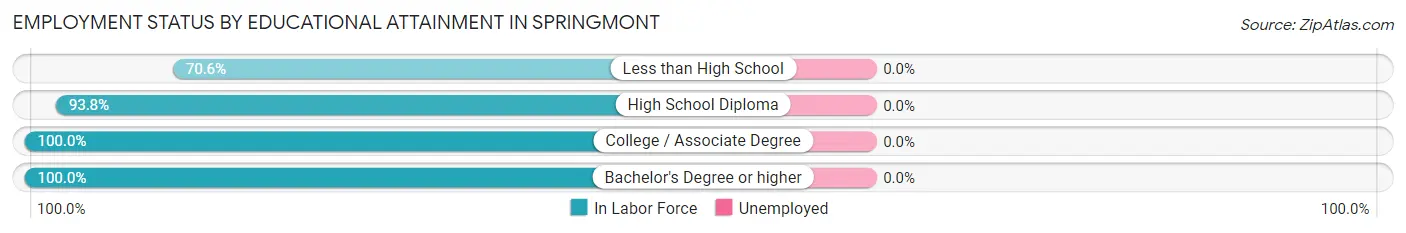
| Educational Attainment | In Labor Force | Unemployed |
| Less than High School | 12 (70.6%) | 0 (0.0%) |
| High School Diploma | 196 (93.8%) | 0 (0.0%) |
| College / Associate Degree | 273 (100.0%) | 0 (0.0%) |
| Bachelor's Degree or higher | 188 (100.0%) | 0 (0.0%) |
| Total | 669 (97.4%) | 0 (0.0%) |
Employment Occupations by Sex in Springmont
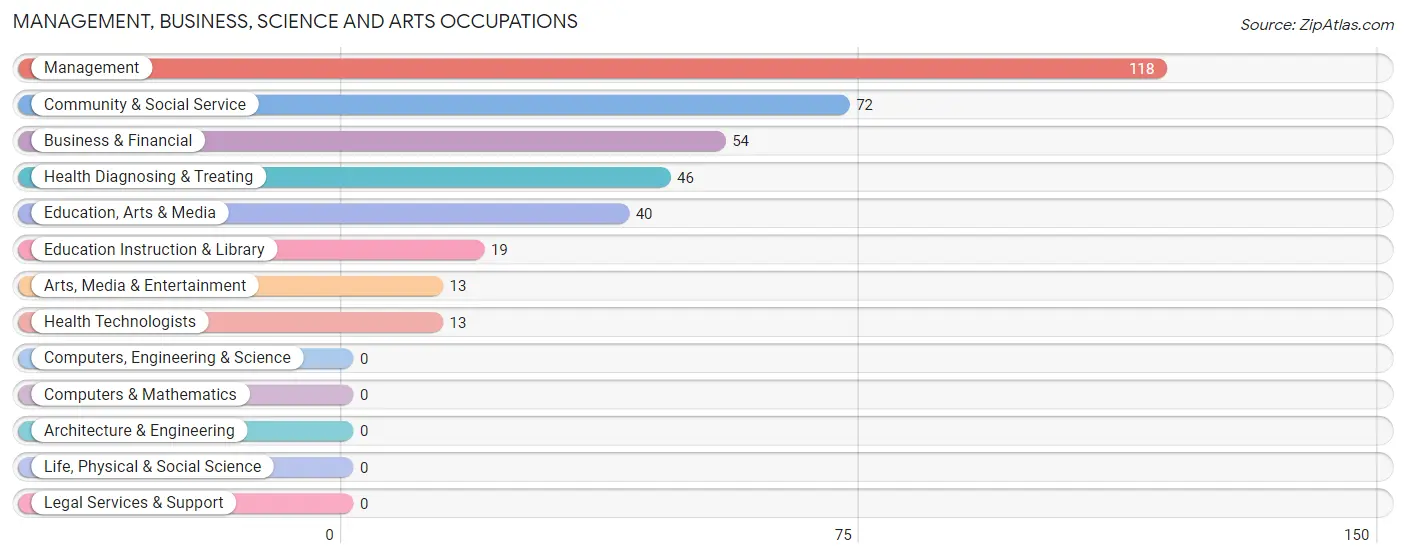
Management, Business, Science and Arts Occupations
The most common Management, Business, Science and Arts occupations in Springmont are Management (118 | 14.2%), Community & Social Service (72 | 8.6%), Business & Financial (54 | 6.5%), Health Diagnosing & Treating (46 | 5.5%), and Education, Arts & Media (40 | 4.8%).
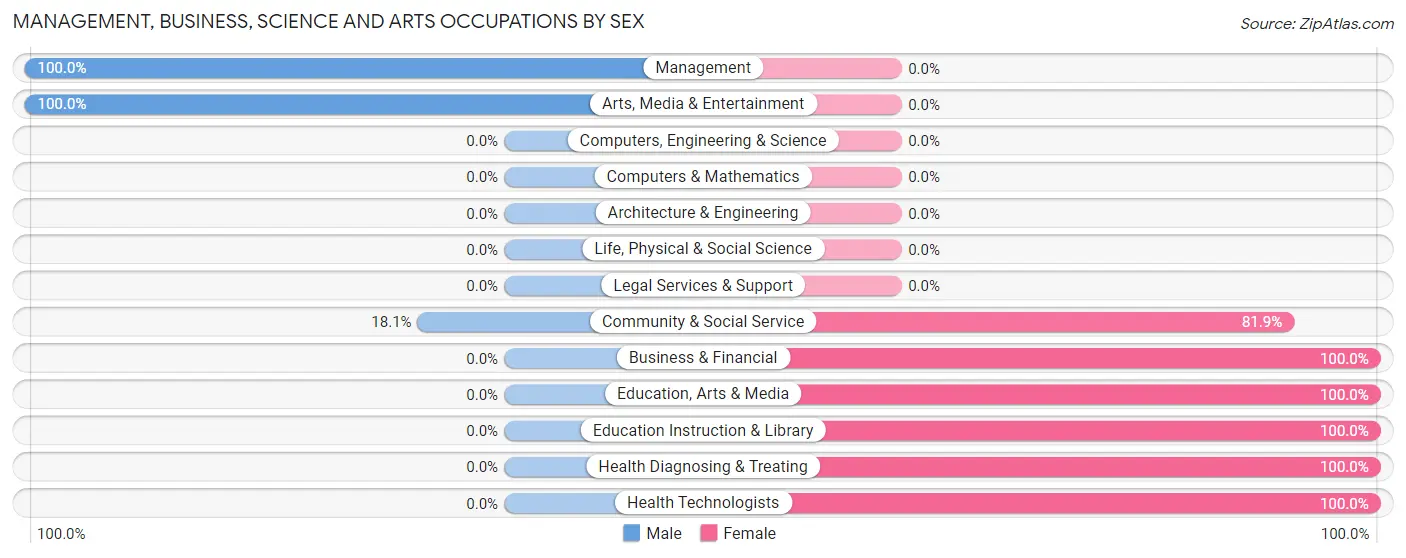
Management, Business, Science and Arts Occupations by Sex
Within the Management, Business, Science and Arts occupations in Springmont, the most male-oriented occupations are Management (100.0%), Arts, Media & Entertainment (100.0%), and Community & Social Service (18.1%), while the most female-oriented occupations are Business & Financial (100.0%), Education, Arts & Media (100.0%), and Education Instruction & Library (100.0%).
| Occupation | Male | Female |
| Management | 118 (100.0%) | 0 (0.0%) |
| Business & Financial | 0 (0.0%) | 54 (100.0%) |
| Computers, Engineering & Science | 0 (0.0%) | 0 (0.0%) |
| Computers & Mathematics | 0 (0.0%) | 0 (0.0%) |
| Architecture & Engineering | 0 (0.0%) | 0 (0.0%) |
| Life, Physical & Social Science | 0 (0.0%) | 0 (0.0%) |
| Community & Social Service | 13 (18.1%) | 59 (81.9%) |
| Education, Arts & Media | 0 (0.0%) | 40 (100.0%) |
| Legal Services & Support | 0 (0.0%) | 0 (0.0%) |
| Education Instruction & Library | 0 (0.0%) | 19 (100.0%) |
| Arts, Media & Entertainment | 13 (100.0%) | 0 (0.0%) |
| Health Diagnosing & Treating | 0 (0.0%) | 46 (100.0%) |
| Health Technologists | 0 (0.0%) | 13 (100.0%) |
| Total (Category) | 131 (45.2%) | 159 (54.8%) |
| Total (Overall) | 471 (56.6%) | 361 (43.4%) |
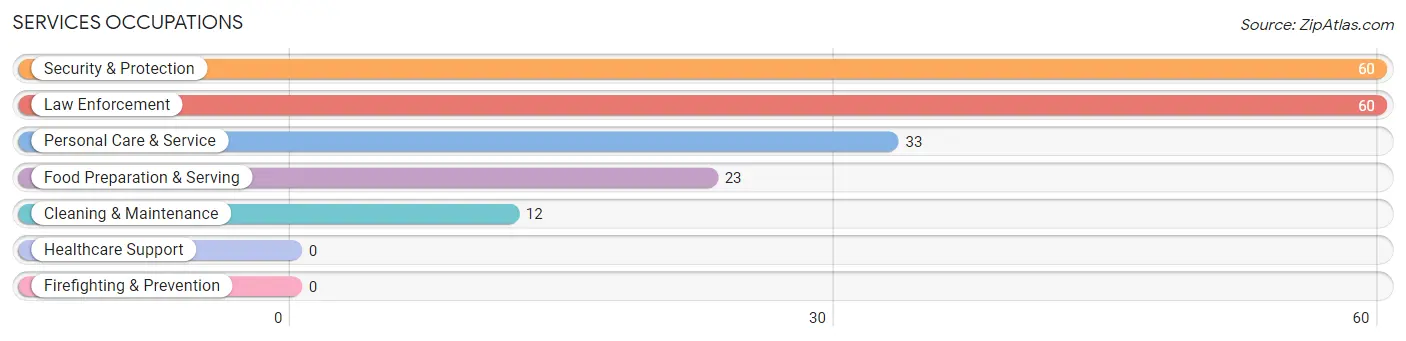
Services Occupations
The most common Services occupations in Springmont are Security & Protection (60 | 7.2%), Law Enforcement (60 | 7.2%), Personal Care & Service (33 | 4.0%), Food Preparation & Serving (23 | 2.8%), and Cleaning & Maintenance (12 | 1.4%).
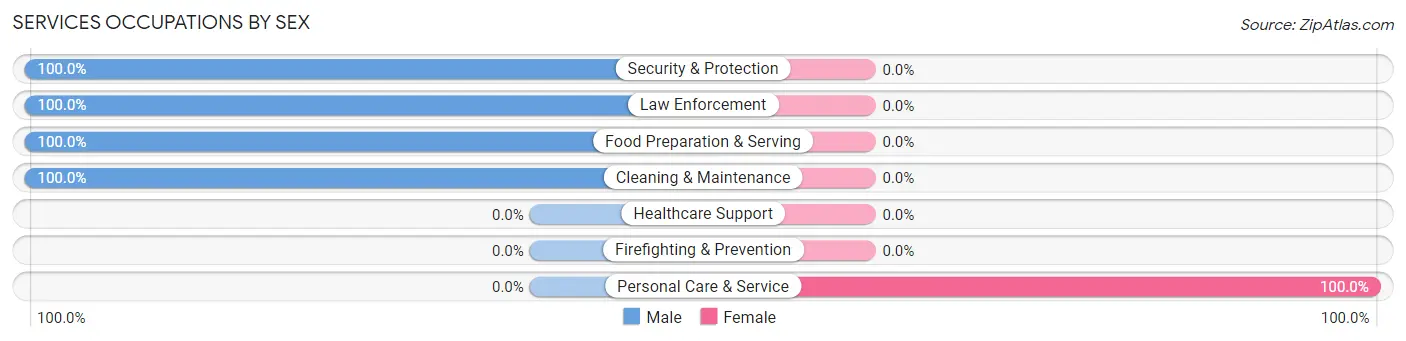
Services Occupations by Sex
| Occupation | Male | Female |
| Healthcare Support | 0 (0.0%) | 0 (0.0%) |
| Security & Protection | 60 (100.0%) | 0 (0.0%) |
| Firefighting & Prevention | 0 (0.0%) | 0 (0.0%) |
| Law Enforcement | 60 (100.0%) | 0 (0.0%) |
| Food Preparation & Serving | 23 (100.0%) | 0 (0.0%) |
| Cleaning & Maintenance | 12 (100.0%) | 0 (0.0%) |
| Personal Care & Service | 0 (0.0%) | 33 (100.0%) |
| Total (Category) | 95 (74.2%) | 33 (25.8%) |
| Total (Overall) | 471 (56.6%) | 361 (43.4%) |
Sales and Office Occupations
The most common Sales and Office occupations in Springmont are Office & Administration (137 | 16.5%), and Sales & Related (54 | 6.5%).
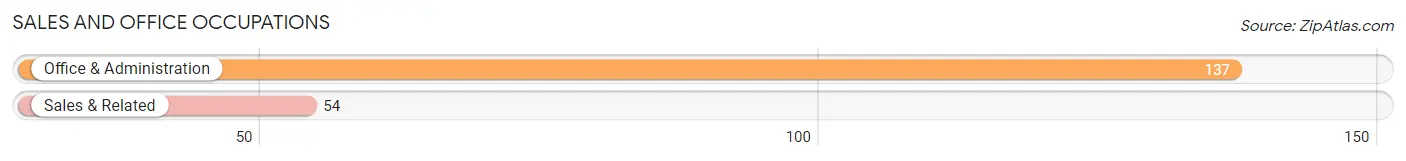
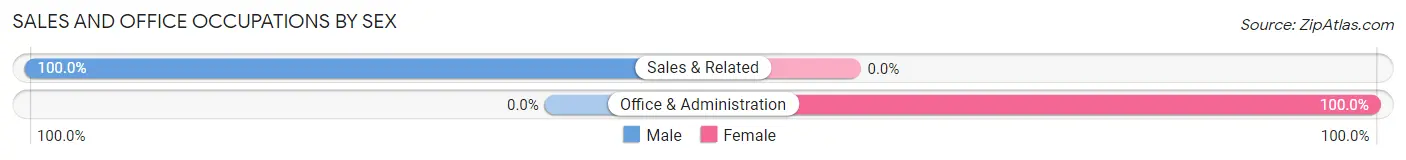
Sales and Office Occupations by Sex
| Occupation | Male | Female |
| Sales & Related | 54 (100.0%) | 0 (0.0%) |
| Office & Administration | 0 (0.0%) | 137 (100.0%) |
| Total (Category) | 54 (28.3%) | 137 (71.7%) |
| Total (Overall) | 471 (56.6%) | 361 (43.4%) |
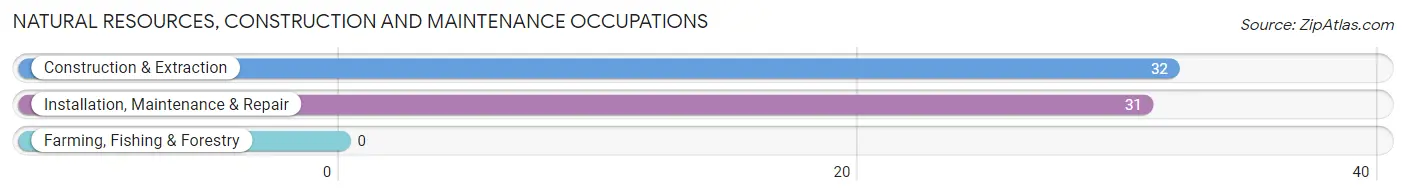
Natural Resources, Construction and Maintenance Occupations
The most common Natural Resources, Construction and Maintenance occupations in Springmont are Construction & Extraction (32 | 3.8%), and Installation, Maintenance & Repair (31 | 3.7%).
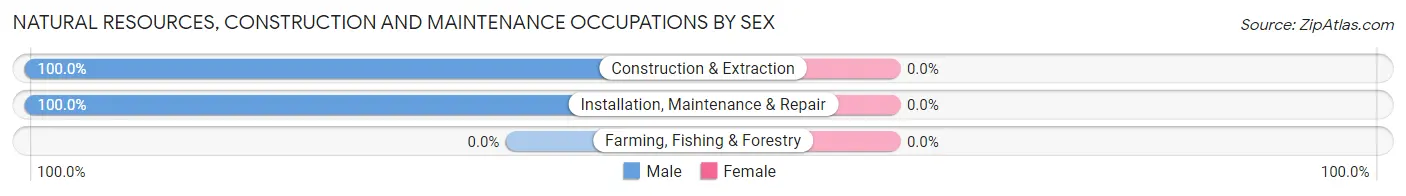
Natural Resources, Construction and Maintenance Occupations by Sex
| Occupation | Male | Female |
| Farming, Fishing & Forestry | 0 (0.0%) | 0 (0.0%) |
| Construction & Extraction | 32 (100.0%) | 0 (0.0%) |
| Installation, Maintenance & Repair | 31 (100.0%) | 0 (0.0%) |
| Total (Category) | 63 (100.0%) | 0 (0.0%) |
| Total (Overall) | 471 (56.6%) | 361 (43.4%) |
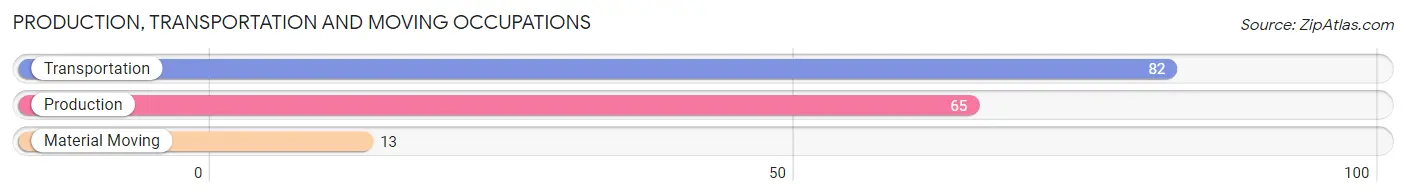
Production, Transportation and Moving Occupations
The most common Production, Transportation and Moving occupations in Springmont are Transportation (82 | 9.9%), Production (65 | 7.8%), and Material Moving (13 | 1.6%).
Production, Transportation and Moving Occupations by Sex
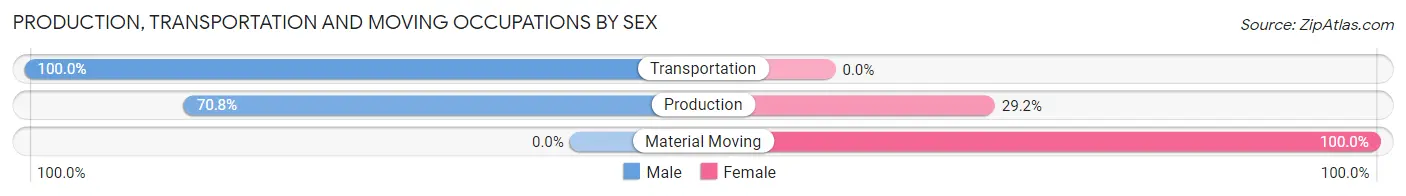
| Occupation | Male | Female |
| Production | 46 (70.8%) | 19 (29.2%) |
| Transportation | 82 (100.0%) | 0 (0.0%) |
| Material Moving | 0 (0.0%) | 13 (100.0%) |
| Total (Category) | 128 (80.0%) | 32 (20.0%) |
| Total (Overall) | 471 (56.6%) | 361 (43.4%) |
Employment Industries by Sex in Springmont
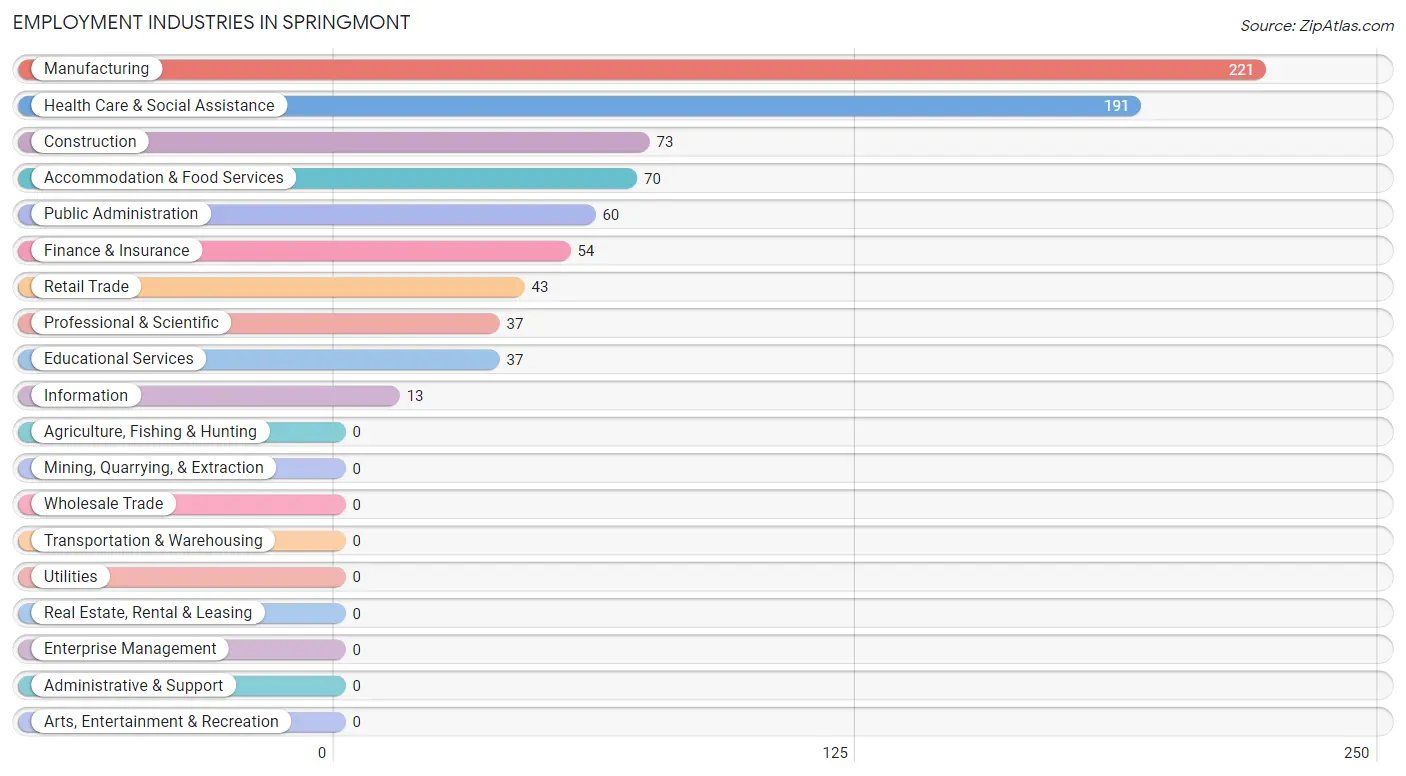
Employment Industries in Springmont
The major employment industries in Springmont include Manufacturing (221 | 26.6%), Health Care & Social Assistance (191 | 23.0%), Construction (73 | 8.8%), Accommodation & Food Services (70 | 8.4%), and Public Administration (60 | 7.2%).
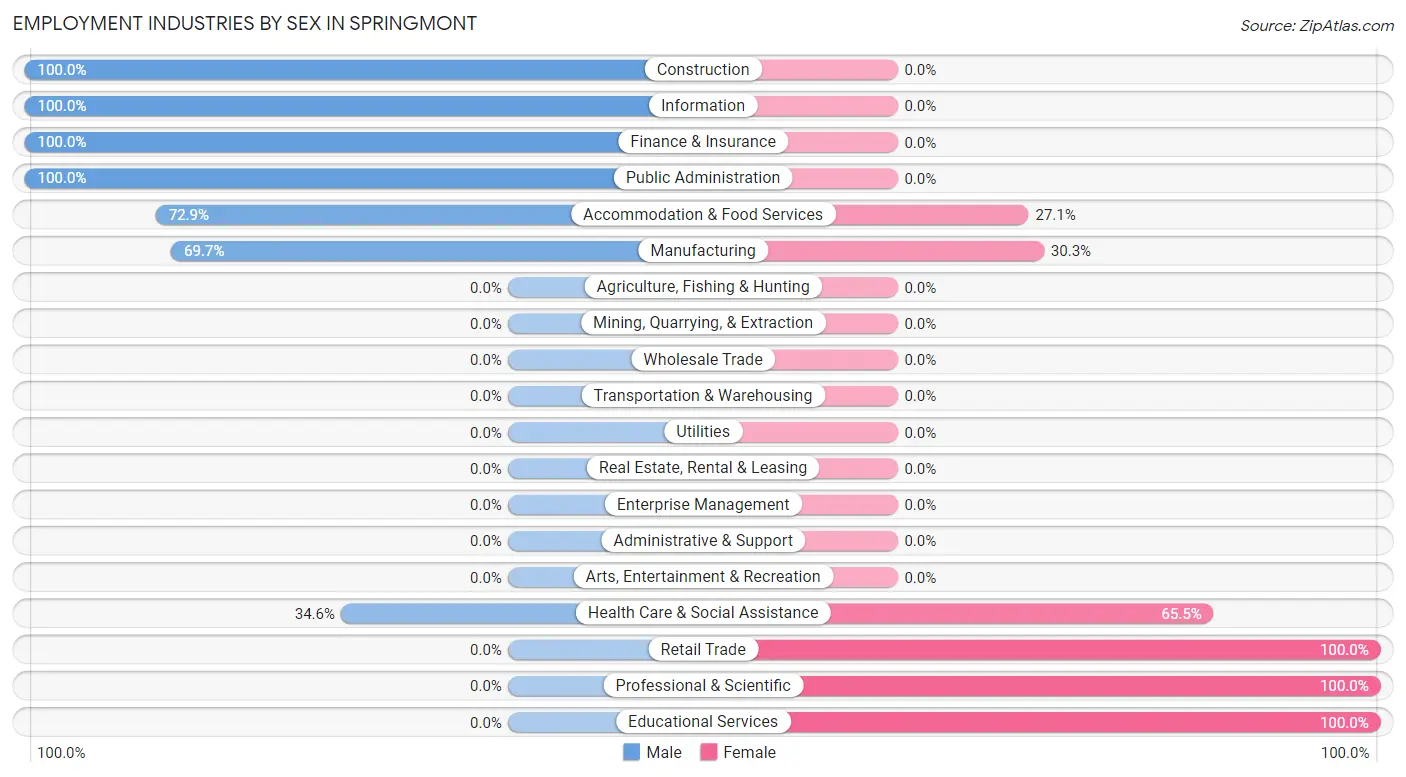
Employment Industries by Sex in Springmont
The Springmont industries that see more men than women are Construction (100.0%), Information (100.0%), and Finance & Insurance (100.0%), whereas the industries that tend to have a higher number of women are Retail Trade (100.0%), Professional & Scientific (100.0%), and Educational Services (100.0%).
| Industry | Male | Female |
| Agriculture, Fishing & Hunting | 0 (0.0%) | 0 (0.0%) |
| Mining, Quarrying, & Extraction | 0 (0.0%) | 0 (0.0%) |
| Construction | 73 (100.0%) | 0 (0.0%) |
| Manufacturing | 154 (69.7%) | 67 (30.3%) |
| Wholesale Trade | 0 (0.0%) | 0 (0.0%) |
| Retail Trade | 0 (0.0%) | 43 (100.0%) |
| Transportation & Warehousing | 0 (0.0%) | 0 (0.0%) |
| Utilities | 0 (0.0%) | 0 (0.0%) |
| Information | 13 (100.0%) | 0 (0.0%) |
| Finance & Insurance | 54 (100.0%) | 0 (0.0%) |
| Real Estate, Rental & Leasing | 0 (0.0%) | 0 (0.0%) |
| Professional & Scientific | 0 (0.0%) | 37 (100.0%) |
| Enterprise Management | 0 (0.0%) | 0 (0.0%) |
| Administrative & Support | 0 (0.0%) | 0 (0.0%) |
| Educational Services | 0 (0.0%) | 37 (100.0%) |
| Health Care & Social Assistance | 66 (34.5%) | 125 (65.4%) |
| Arts, Entertainment & Recreation | 0 (0.0%) | 0 (0.0%) |
| Accommodation & Food Services | 51 (72.9%) | 19 (27.1%) |
| Public Administration | 60 (100.0%) | 0 (0.0%) |
| Total | 471 (56.6%) | 361 (43.4%) |
Education in Springmont
School Enrollment in Springmont
The most common levels of schooling among the 367 students in Springmont are elementary school (91 | 24.8%), college / undergraduate (86 | 23.4%), and middle school (72 | 19.6%).
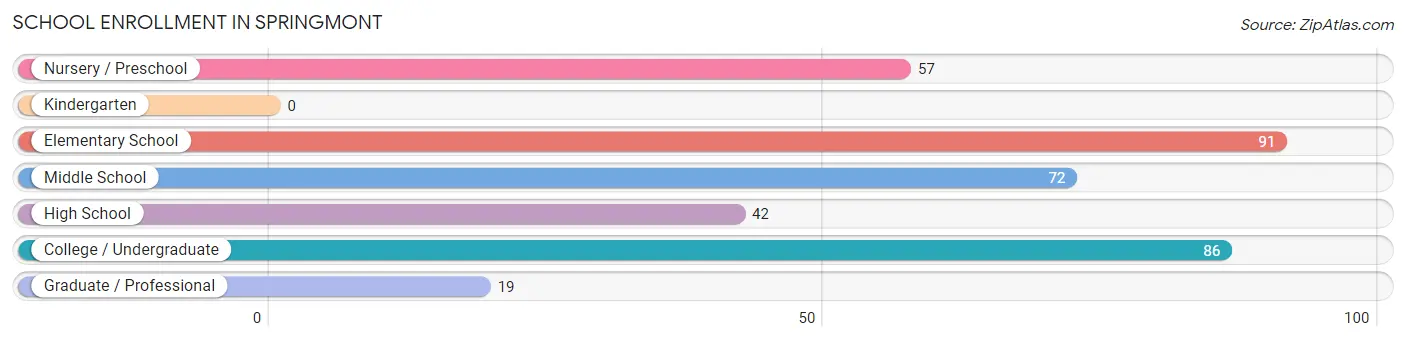
| School Level | # Students | % Students |
| Nursery / Preschool | 57 | 15.5% |
| Kindergarten | 0 | 0.0% |
| Elementary School | 91 | 24.8% |
| Middle School | 72 | 19.6% |
| High School | 42 | 11.4% |
| College / Undergraduate | 86 | 23.4% |
| Graduate / Professional | 19 | 5.2% |
| Total | 367 | 100.0% |
School Enrollment by Age by Funding Source in Springmont
Out of a total of 367 students who are enrolled in schools in Springmont, 86 (23.4%) attend a private institution, while the remaining 281 (76.6%) are enrolled in public schools. The age group of 35 years and over has the highest likelihood of being enrolled in private schools, with 33 (100.0% in the age bracket) enrolled. Conversely, the age group of 3 to 4 year olds has the lowest likelihood of being enrolled in a private school, with 57 (100.0% in the age bracket) attending a public institution.
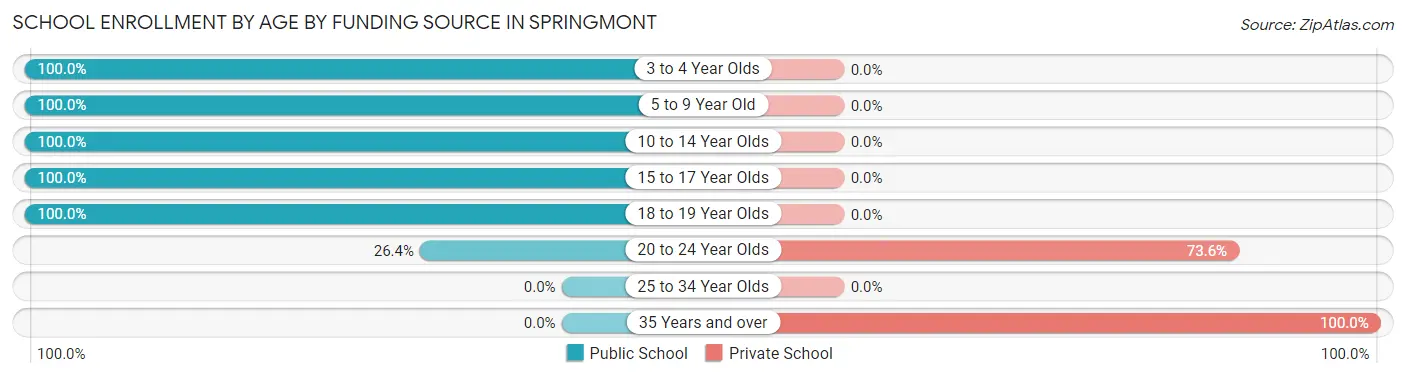
| Age Bracket | Public School | Private School |
| 3 to 4 Year Olds | 57 (100.0%) | 0 (0.0%) |
| 5 to 9 Year Old | 91 (100.0%) | 0 (0.0%) |
| 10 to 14 Year Olds | 72 (100.0%) | 0 (0.0%) |
| 15 to 17 Year Olds | 14 (100.0%) | 0 (0.0%) |
| 18 to 19 Year Olds | 28 (100.0%) | 0 (0.0%) |
| 20 to 24 Year Olds | 19 (26.4%) | 53 (73.6%) |
| 25 to 34 Year Olds | 0 (0.0%) | 0 (0.0%) |
| 35 Years and over | 0 (0.0%) | 33 (100.0%) |
| Total | 281 (76.6%) | 86 (23.4%) |
Educational Attainment by Field of Study in Springmont
Education (111 | 40.5%), computers & mathematics (77 | 28.1%), business (54 | 19.7%), physical & health sciences (16 | 5.8%), and science & technology (16 | 5.8%) are the most common fields of study among 274 individuals in Springmont who have obtained a bachelor's degree or higher.
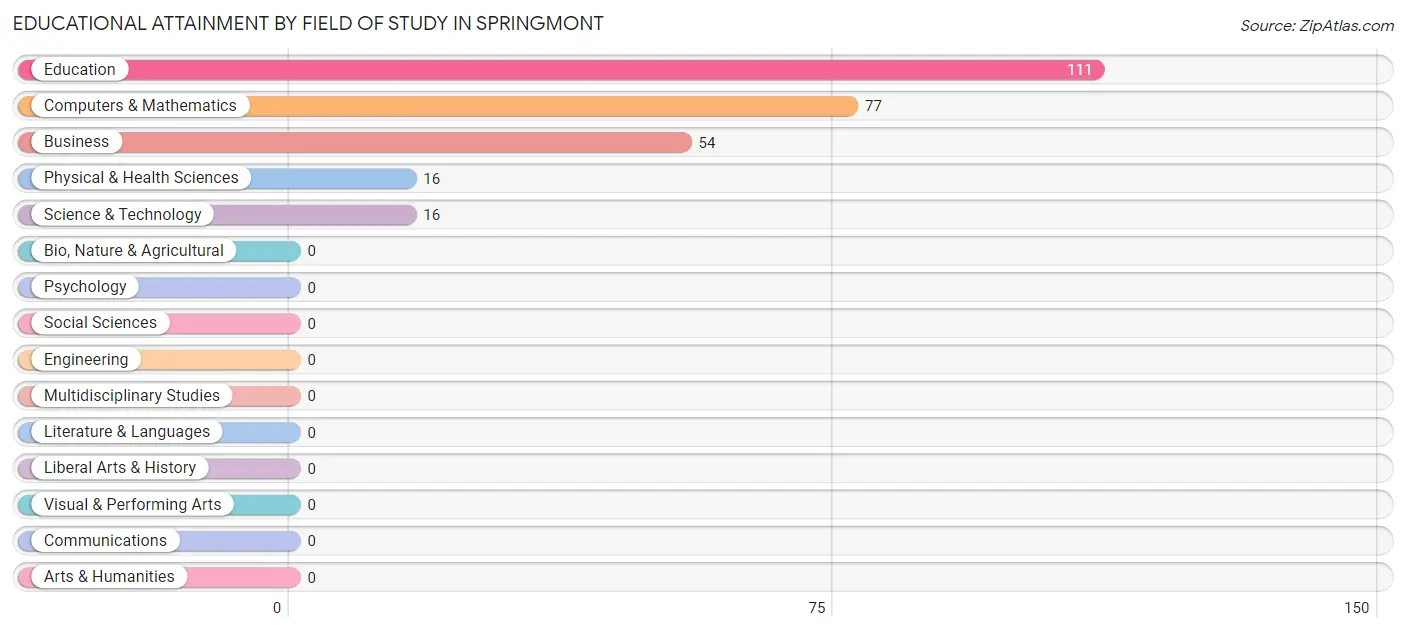
| Field of Study | # Graduates | % Graduates |
| Computers & Mathematics | 77 | 28.1% |
| Bio, Nature & Agricultural | 0 | 0.0% |
| Physical & Health Sciences | 16 | 5.8% |
| Psychology | 0 | 0.0% |
| Social Sciences | 0 | 0.0% |
| Engineering | 0 | 0.0% |
| Multidisciplinary Studies | 0 | 0.0% |
| Science & Technology | 16 | 5.8% |
| Business | 54 | 19.7% |
| Education | 111 | 40.5% |
| Literature & Languages | 0 | 0.0% |
| Liberal Arts & History | 0 | 0.0% |
| Visual & Performing Arts | 0 | 0.0% |
| Communications | 0 | 0.0% |
| Arts & Humanities | 0 | 0.0% |
| Total | 274 | 100.0% |
Transportation & Commute in Springmont
Vehicle Availability by Sex in Springmont
The most prevalent vehicle ownership categories in Springmont are males with 1 vehicle (156, accounting for 33.1%) and females with 1 vehicle (0, making up 43.2%).
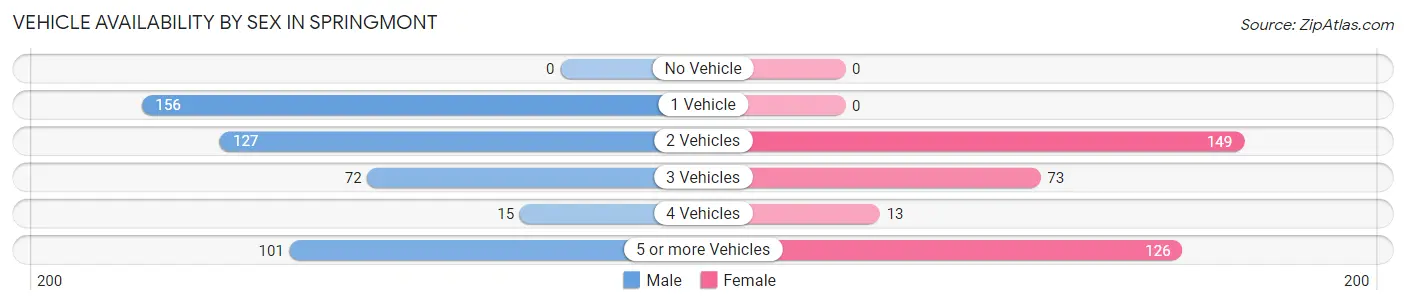
| Vehicles Available | Male | Female |
| No Vehicle | 0 (0.0%) | 0 (0.0%) |
| 1 Vehicle | 156 (33.1%) | 0 (0.0%) |
| 2 Vehicles | 127 (27.0%) | 149 (41.3%) |
| 3 Vehicles | 72 (15.3%) | 73 (20.2%) |
| 4 Vehicles | 15 (3.2%) | 13 (3.6%) |
| 5 or more Vehicles | 101 (21.4%) | 126 (34.9%) |
| Total | 471 (100.0%) | 361 (100.0%) |
Commute Time in Springmont
The most frequently occuring commute durations in Springmont are 10 to 14 minutes (237 commuters, 28.5%), 30 to 34 minutes (143 commuters, 17.2%), and 20 to 24 minutes (115 commuters, 13.8%).
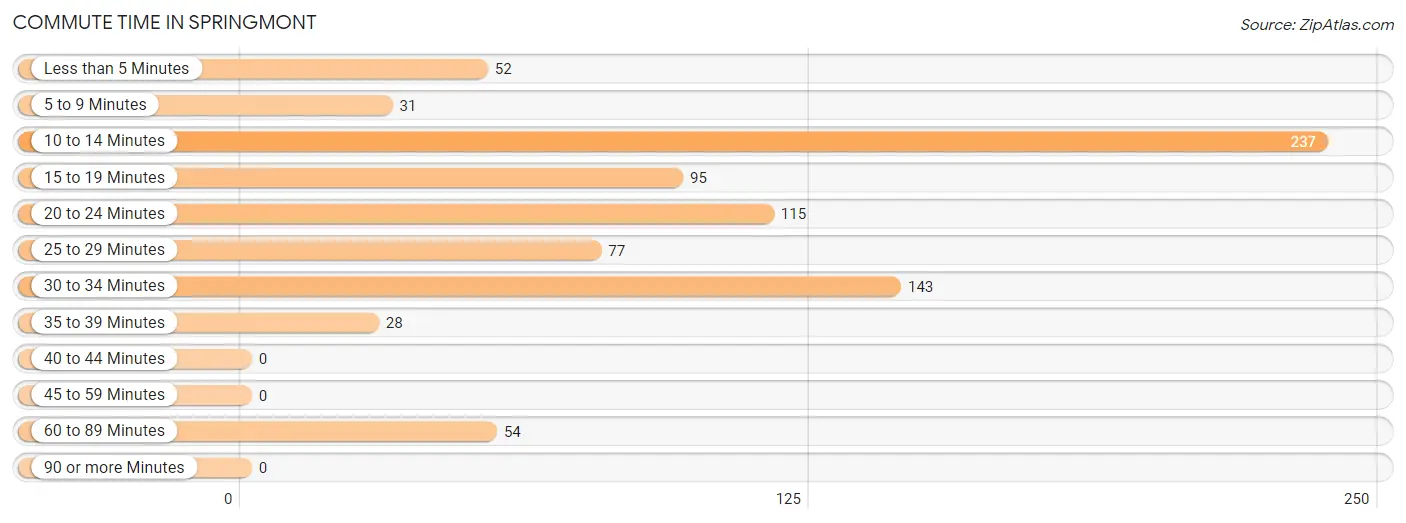
| Commute Time | # Commuters | % Commuters |
| Less than 5 Minutes | 52 | 6.2% |
| 5 to 9 Minutes | 31 | 3.7% |
| 10 to 14 Minutes | 237 | 28.5% |
| 15 to 19 Minutes | 95 | 11.4% |
| 20 to 24 Minutes | 115 | 13.8% |
| 25 to 29 Minutes | 77 | 9.2% |
| 30 to 34 Minutes | 143 | 17.2% |
| 35 to 39 Minutes | 28 | 3.4% |
| 40 to 44 Minutes | 0 | 0.0% |
| 45 to 59 Minutes | 0 | 0.0% |
| 60 to 89 Minutes | 54 | 6.5% |
| 90 or more Minutes | 0 | 0.0% |
Commute Time by Sex in Springmont
The most common commute times in Springmont are 10 to 14 minutes (127 commuters, 27.0%) for males and 10 to 14 minutes (110 commuters, 30.5%) for females.
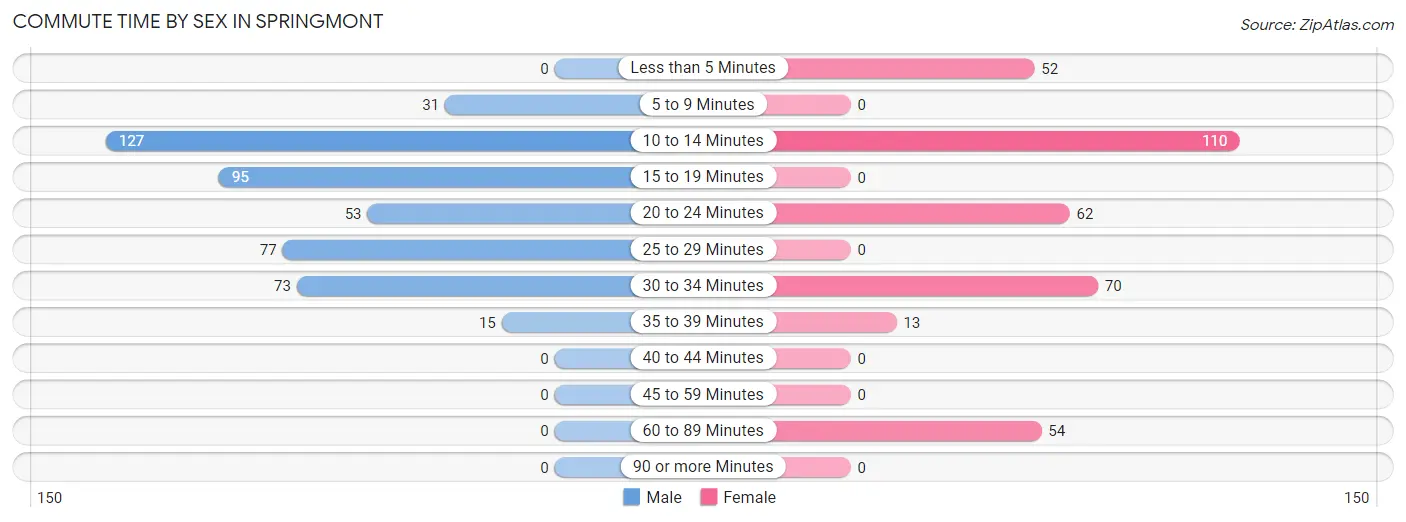
| Commute Time | Male | Female |
| Less than 5 Minutes | 0 (0.0%) | 52 (14.4%) |
| 5 to 9 Minutes | 31 (6.6%) | 0 (0.0%) |
| 10 to 14 Minutes | 127 (27.0%) | 110 (30.5%) |
| 15 to 19 Minutes | 95 (20.2%) | 0 (0.0%) |
| 20 to 24 Minutes | 53 (11.3%) | 62 (17.2%) |
| 25 to 29 Minutes | 77 (16.4%) | 0 (0.0%) |
| 30 to 34 Minutes | 73 (15.5%) | 70 (19.4%) |
| 35 to 39 Minutes | 15 (3.2%) | 13 (3.6%) |
| 40 to 44 Minutes | 0 (0.0%) | 0 (0.0%) |
| 45 to 59 Minutes | 0 (0.0%) | 0 (0.0%) |
| 60 to 89 Minutes | 0 (0.0%) | 54 (15.0%) |
| 90 or more Minutes | 0 (0.0%) | 0 (0.0%) |
Time of Departure to Work by Sex in Springmont
The most frequent times of departure to work in Springmont are 12:00 PM to 3:59 PM (164, 34.8%) for males and 8:30 AM to 8:59 AM (118, 32.7%) for females.
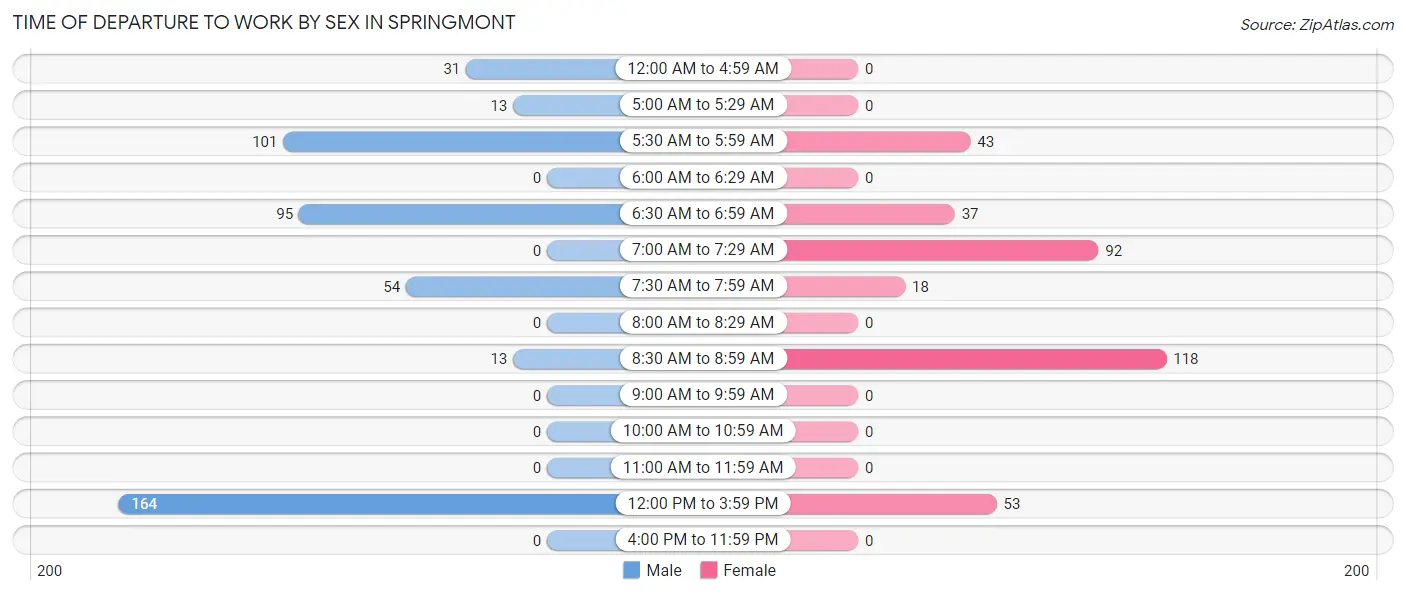
| Time of Departure | Male | Female |
| 12:00 AM to 4:59 AM | 31 (6.6%) | 0 (0.0%) |
| 5:00 AM to 5:29 AM | 13 (2.8%) | 0 (0.0%) |
| 5:30 AM to 5:59 AM | 101 (21.4%) | 43 (11.9%) |
| 6:00 AM to 6:29 AM | 0 (0.0%) | 0 (0.0%) |
| 6:30 AM to 6:59 AM | 95 (20.2%) | 37 (10.2%) |
| 7:00 AM to 7:29 AM | 0 (0.0%) | 92 (25.5%) |
| 7:30 AM to 7:59 AM | 54 (11.5%) | 18 (5.0%) |
| 8:00 AM to 8:29 AM | 0 (0.0%) | 0 (0.0%) |
| 8:30 AM to 8:59 AM | 13 (2.8%) | 118 (32.7%) |
| 9:00 AM to 9:59 AM | 0 (0.0%) | 0 (0.0%) |
| 10:00 AM to 10:59 AM | 0 (0.0%) | 0 (0.0%) |
| 11:00 AM to 11:59 AM | 0 (0.0%) | 0 (0.0%) |
| 12:00 PM to 3:59 PM | 164 (34.8%) | 53 (14.7%) |
| 4:00 PM to 11:59 PM | 0 (0.0%) | 0 (0.0%) |
| Total | 471 (100.0%) | 361 (100.0%) |
Housing Occupancy in Springmont
Occupancy by Ownership in Springmont
Of the total 521 dwellings in Springmont, owner-occupied units account for 521 (100.0%), while renter-occupied units make up 0 (0.0%).
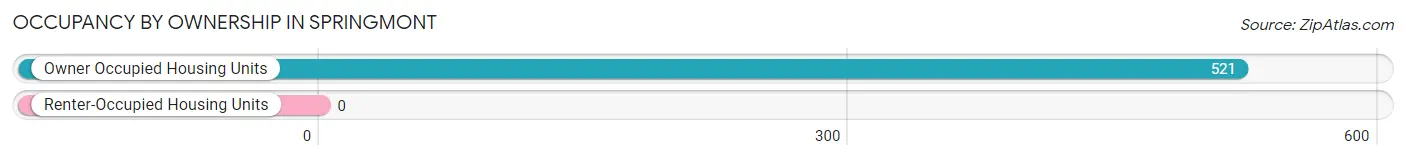
| Occupancy | # Housing Units | % Housing Units |
| Owner Occupied Housing Units | 521 | 100.0% |
| Renter-Occupied Housing Units | 0 | 0.0% |
| Total Occupied Housing Units | 521 | 100.0% |
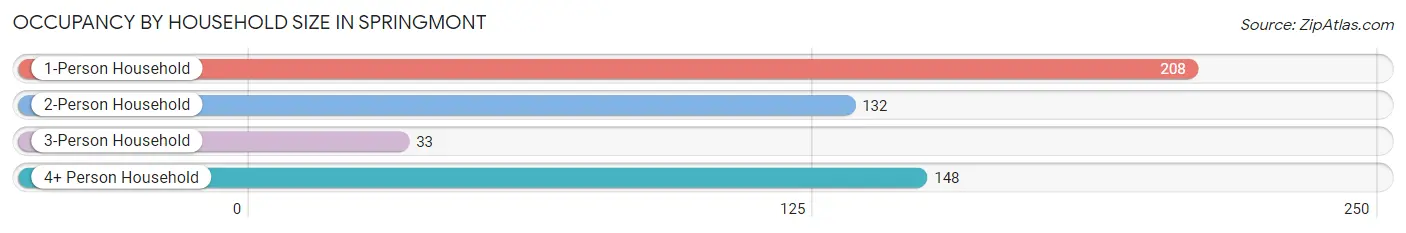
Occupancy by Household Size in Springmont
| Household Size | # Housing Units | % Housing Units |
| 1-Person Household | 208 | 39.9% |
| 2-Person Household | 132 | 25.3% |
| 3-Person Household | 33 | 6.3% |
| 4+ Person Household | 148 | 28.4% |
| Total Housing Units | 521 | 100.0% |
Occupancy by Ownership by Household Size in Springmont
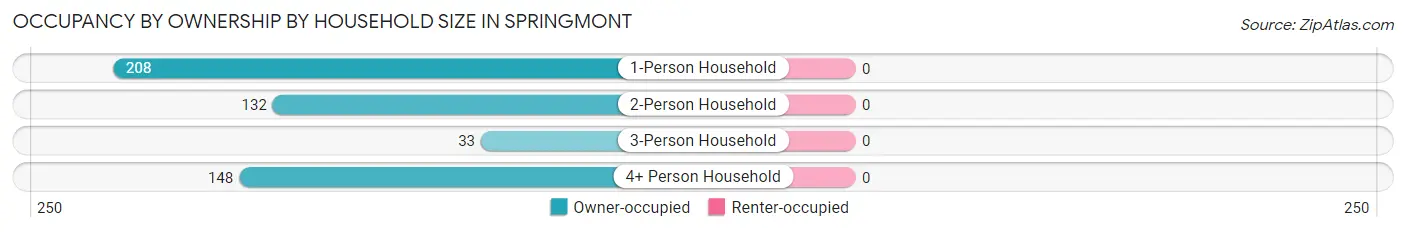
| Household Size | Owner-occupied | Renter-occupied |
| 1-Person Household | 208 (100.0%) | 0 (0.0%) |
| 2-Person Household | 132 (100.0%) | 0 (0.0%) |
| 3-Person Household | 33 (100.0%) | 0 (0.0%) |
| 4+ Person Household | 148 (100.0%) | 0 (0.0%) |
| Total Housing Units | 521 (100.0%) | 0 (0.0%) |
Occupancy by Educational Attainment in Springmont
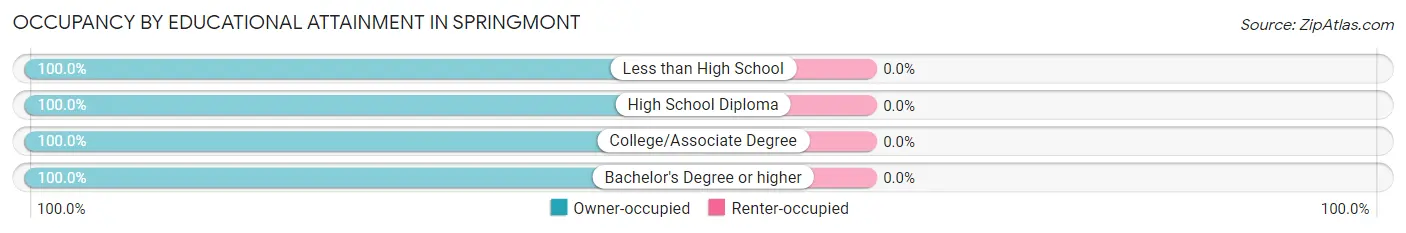
| Household Size | Owner-occupied | Renter-occupied |
| Less than High School | 27 (100.0%) | 0 (0.0%) |
| High School Diploma | 208 (100.0%) | 0 (0.0%) |
| College/Associate Degree | 100 (100.0%) | 0 (0.0%) |
| Bachelor's Degree or higher | 186 (100.0%) | 0 (0.0%) |
Occupancy by Age of Householder in Springmont
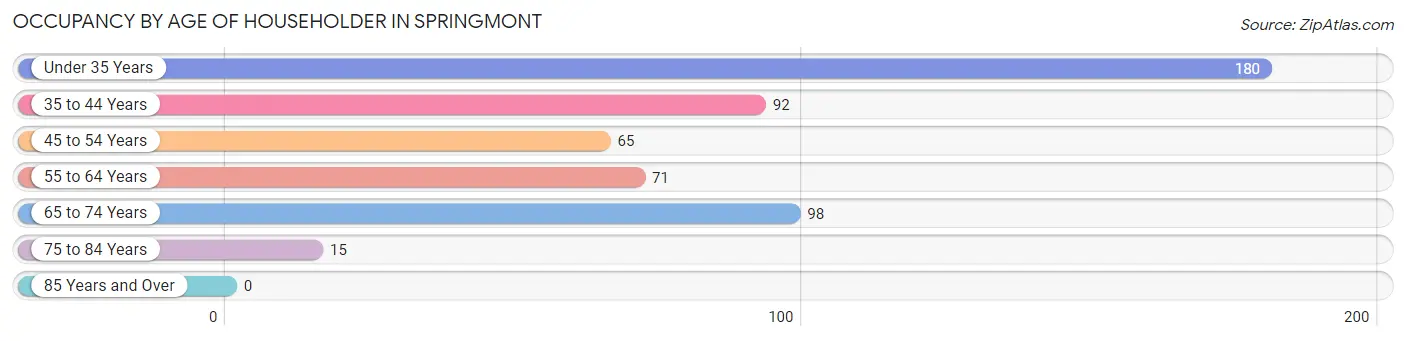
| Age Bracket | # Households | % Households |
| Under 35 Years | 180 | 34.5% |
| 35 to 44 Years | 92 | 17.7% |
| 45 to 54 Years | 65 | 12.5% |
| 55 to 64 Years | 71 | 13.6% |
| 65 to 74 Years | 98 | 18.8% |
| 75 to 84 Years | 15 | 2.9% |
| 85 Years and Over | 0 | 0.0% |
| Total | 521 | 100.0% |
Housing Finances in Springmont
Median Income by Occupancy in Springmont
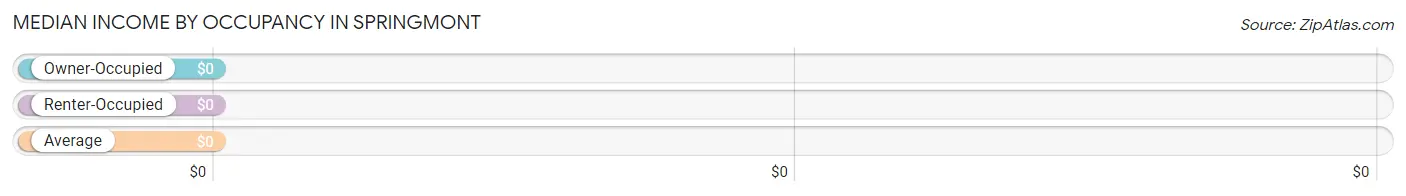
| Occupancy Type | # Households | Median Income |
| Owner-Occupied | 521 (100.0%) | $0 |
| Renter-Occupied | 0 (0.0%) | $0 |
| Average | 521 (100.0%) | $0 |
Occupancy by Householder Income Bracket in Springmont
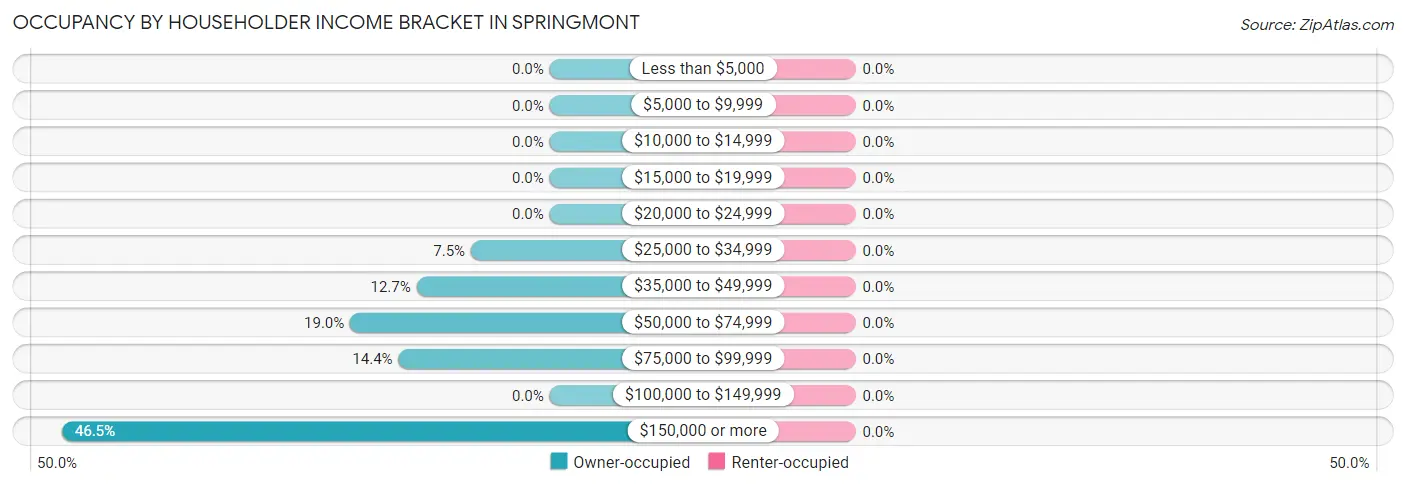
| Income Bracket | Owner-occupied | Renter-occupied |
| Less than $5,000 | 0 (0.0%) | 0 (0.0%) |
| $5,000 to $9,999 | 0 (0.0%) | 0 (0.0%) |
| $10,000 to $14,999 | 0 (0.0%) | 0 (0.0%) |
| $15,000 to $19,999 | 0 (0.0%) | 0 (0.0%) |
| $20,000 to $24,999 | 0 (0.0%) | 0 (0.0%) |
| $25,000 to $34,999 | 39 (7.5%) | 0 (0.0%) |
| $35,000 to $49,999 | 66 (12.7%) | 0 (0.0%) |
| $50,000 to $74,999 | 99 (19.0%) | 0 (0.0%) |
| $75,000 to $99,999 | 75 (14.4%) | 0 (0.0%) |
| $100,000 to $149,999 | 0 (0.0%) | 0 (0.0%) |
| $150,000 or more | 242 (46.5%) | 0 (0.0%) |
| Total | 521 (100.0%) | 0 (0.0%) |
Monthly Housing Cost Tiers in Springmont
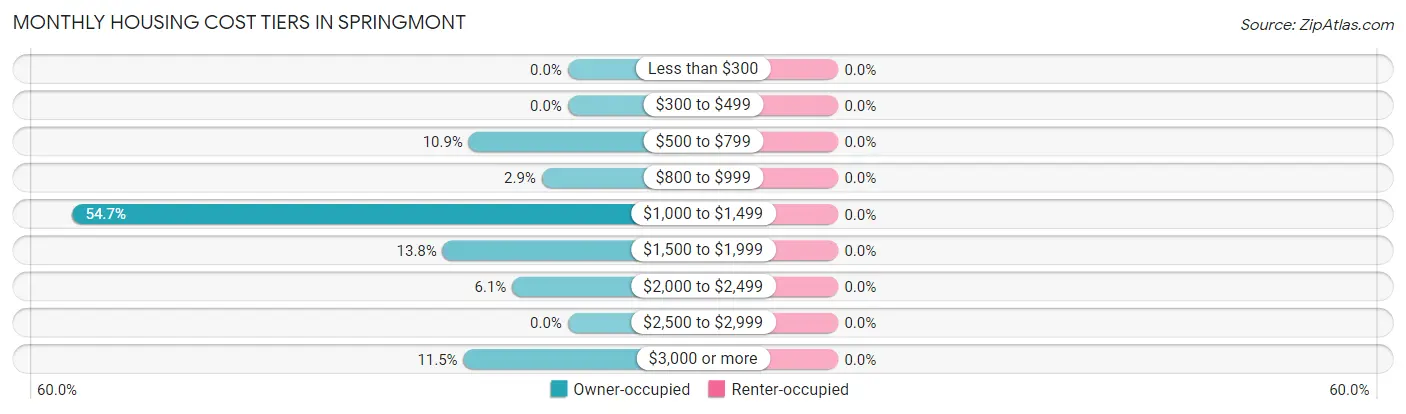
| Monthly Cost | Owner-occupied | Renter-occupied |
| Less than $300 | 0 (0.0%) | 0 (0.0%) |
| $300 to $499 | 0 (0.0%) | 0 (0.0%) |
| $500 to $799 | 57 (10.9%) | 0 (0.0%) |
| $800 to $999 | 15 (2.9%) | 0 (0.0%) |
| $1,000 to $1,499 | 285 (54.7%) | 0 (0.0%) |
| $1,500 to $1,999 | 72 (13.8%) | 0 (0.0%) |
| $2,000 to $2,499 | 32 (6.1%) | 0 (0.0%) |
| $2,500 to $2,999 | 0 (0.0%) | 0 (0.0%) |
| $3,000 or more | 60 (11.5%) | 0 (0.0%) |
| Total | 521 (100.0%) | 0 (0.0%) |
Physical Housing Characteristics in Springmont
Housing Structures in Springmont
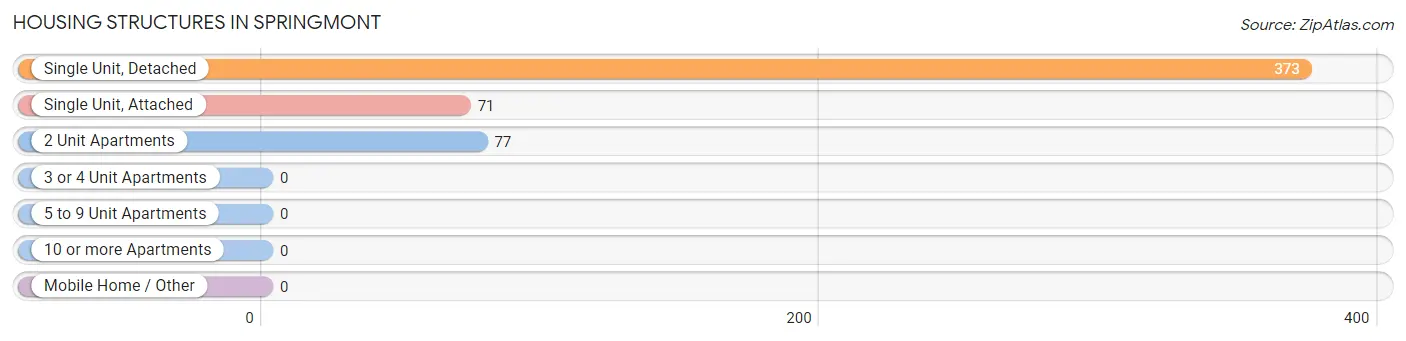
| Structure Type | # Housing Units | % Housing Units |
| Single Unit, Detached | 373 | 71.6% |
| Single Unit, Attached | 71 | 13.6% |
| 2 Unit Apartments | 77 | 14.8% |
| 3 or 4 Unit Apartments | 0 | 0.0% |
| 5 to 9 Unit Apartments | 0 | 0.0% |
| 10 or more Apartments | 0 | 0.0% |
| Mobile Home / Other | 0 | 0.0% |
| Total | 521 | 100.0% |
Housing Structures by Occupancy in Springmont
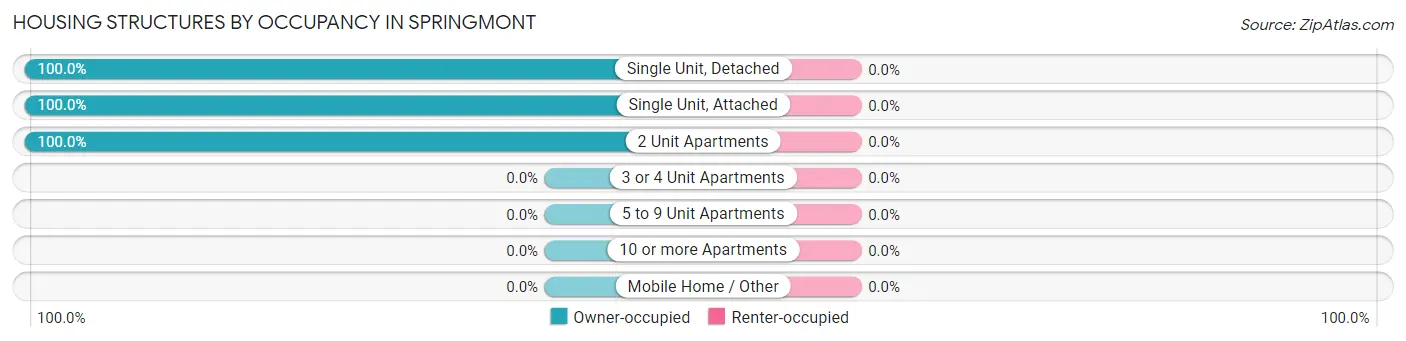
| Structure Type | Owner-occupied | Renter-occupied |
| Single Unit, Detached | 373 (100.0%) | 0 (0.0%) |
| Single Unit, Attached | 71 (100.0%) | 0 (0.0%) |
| 2 Unit Apartments | 77 (100.0%) | 0 (0.0%) |
| 3 or 4 Unit Apartments | 0 (0.0%) | 0 (0.0%) |
| 5 to 9 Unit Apartments | 0 (0.0%) | 0 (0.0%) |
| 10 or more Apartments | 0 (0.0%) | 0 (0.0%) |
| Mobile Home / Other | 0 (0.0%) | 0 (0.0%) |
| Total | 521 (100.0%) | 0 (0.0%) |
Housing Structures by Number of Rooms in Springmont
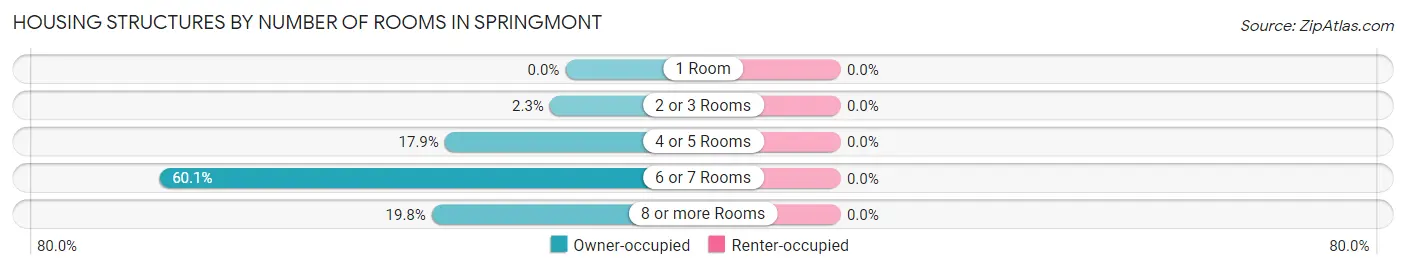
| Number of Rooms | Owner-occupied | Renter-occupied |
| 1 Room | 0 (0.0%) | 0 (0.0%) |
| 2 or 3 Rooms | 12 (2.3%) | 0 (0.0%) |
| 4 or 5 Rooms | 93 (17.8%) | 0 (0.0%) |
| 6 or 7 Rooms | 313 (60.1%) | 0 (0.0%) |
| 8 or more Rooms | 103 (19.8%) | 0 (0.0%) |
| Total | 521 (100.0%) | 0 (0.0%) |
Housing Structure by Heating Type in Springmont
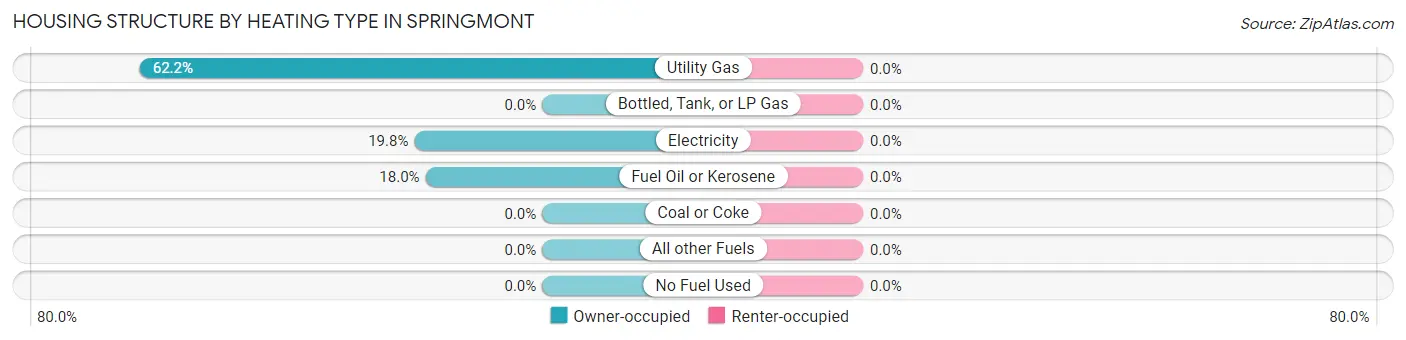
| Heating Type | Owner-occupied | Renter-occupied |
| Utility Gas | 324 (62.2%) | 0 (0.0%) |
| Bottled, Tank, or LP Gas | 0 (0.0%) | 0 (0.0%) |
| Electricity | 103 (19.8%) | 0 (0.0%) |
| Fuel Oil or Kerosene | 94 (18.0%) | 0 (0.0%) |
| Coal or Coke | 0 (0.0%) | 0 (0.0%) |
| All other Fuels | 0 (0.0%) | 0 (0.0%) |
| No Fuel Used | 0 (0.0%) | 0 (0.0%) |
| Total | 521 (100.0%) | 0 (0.0%) |
Household Vehicle Usage in Springmont
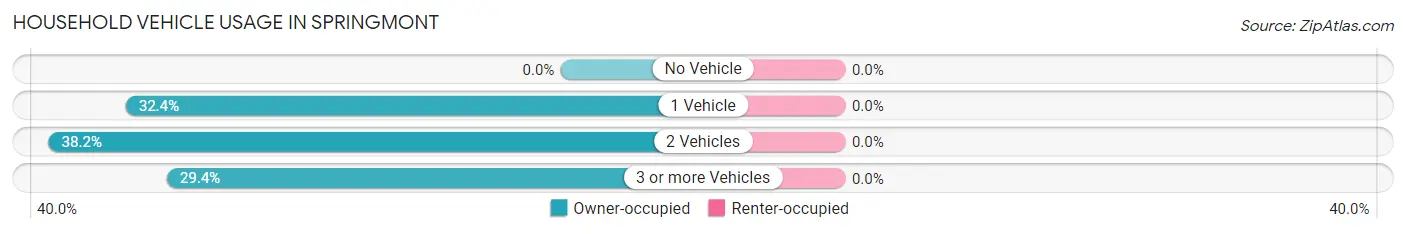
| Vehicles per Household | Owner-occupied | Renter-occupied |
| No Vehicle | 0 (0.0%) | 0 (0.0%) |
| 1 Vehicle | 169 (32.4%) | 0 (0.0%) |
| 2 Vehicles | 199 (38.2%) | 0 (0.0%) |
| 3 or more Vehicles | 153 (29.4%) | 0 (0.0%) |
| Total | 521 (100.0%) | 0 (0.0%) |
Real Estate & Mortgages in Springmont
Real Estate and Mortgage Overview in Springmont
| Characteristic | Without Mortgage | With Mortgage |
| Housing Units | 72 | 449 |
| Median Property Value | $184,600 | $196,100 |
| Median Household Income | $66,538 | $242 |
| Monthly Housing Costs | $649 | $60 |
| Real Estate Taxes | $4,250 | $0 |
Property Value by Mortgage Status in Springmont
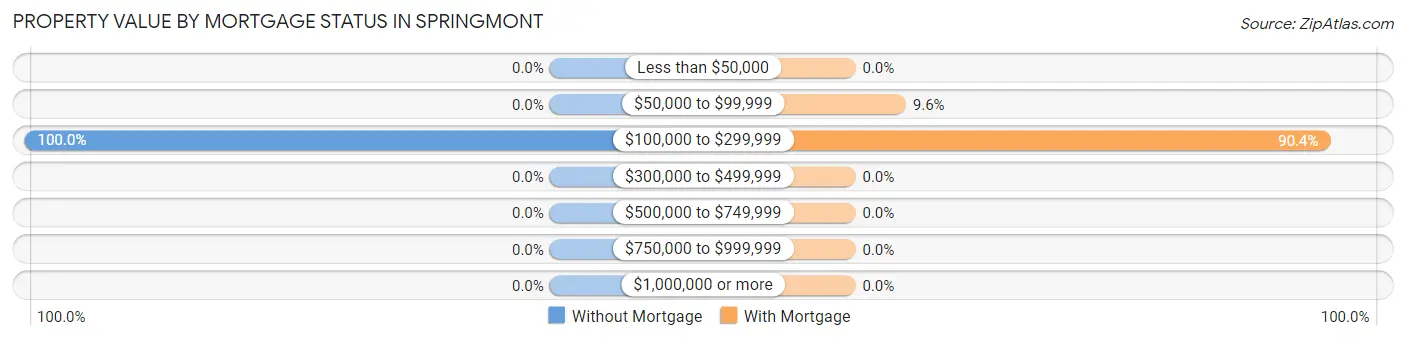
| Property Value | Without Mortgage | With Mortgage |
| Less than $50,000 | 0 (0.0%) | 0 (0.0%) |
| $50,000 to $99,999 | 0 (0.0%) | 43 (9.6%) |
| $100,000 to $299,999 | 72 (100.0%) | 406 (90.4%) |
| $300,000 to $499,999 | 0 (0.0%) | 0 (0.0%) |
| $500,000 to $749,999 | 0 (0.0%) | 0 (0.0%) |
| $750,000 to $999,999 | 0 (0.0%) | 0 (0.0%) |
| $1,000,000 or more | 0 (0.0%) | 0 (0.0%) |
| Total | 72 (100.0%) | 449 (100.0%) |
Household Income by Mortgage Status in Springmont
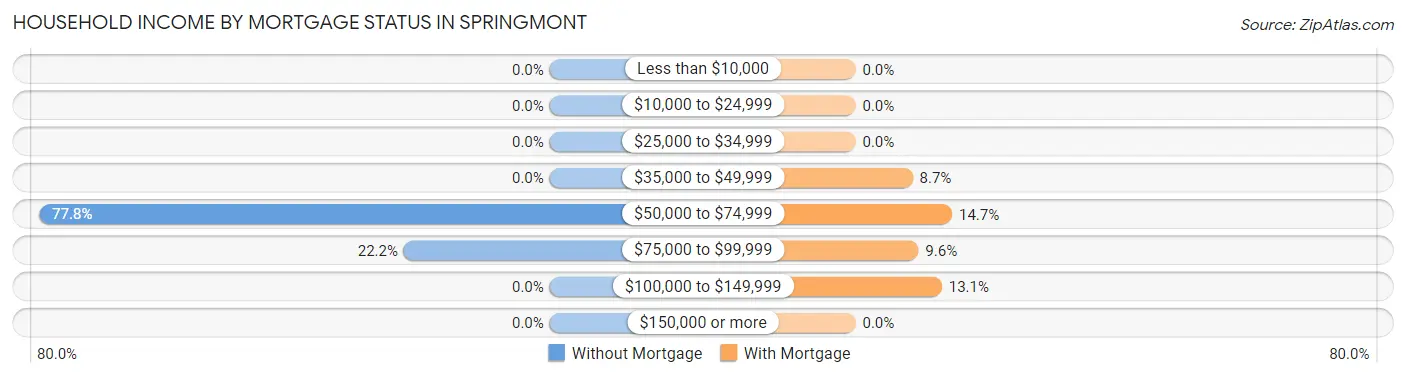
| Household Income | Without Mortgage | With Mortgage |
| Less than $10,000 | 0 (0.0%) | 0 (0.0%) |
| $10,000 to $24,999 | 0 (0.0%) | 0 (0.0%) |
| $25,000 to $34,999 | 0 (0.0%) | 0 (0.0%) |
| $35,000 to $49,999 | 0 (0.0%) | 39 (8.7%) |
| $50,000 to $74,999 | 56 (77.8%) | 66 (14.7%) |
| $75,000 to $99,999 | 16 (22.2%) | 43 (9.6%) |
| $100,000 to $149,999 | 0 (0.0%) | 59 (13.1%) |
| $150,000 or more | 0 (0.0%) | 0 (0.0%) |
| Total | 72 (100.0%) | 449 (100.0%) |
Property Value to Household Income Ratio in Springmont
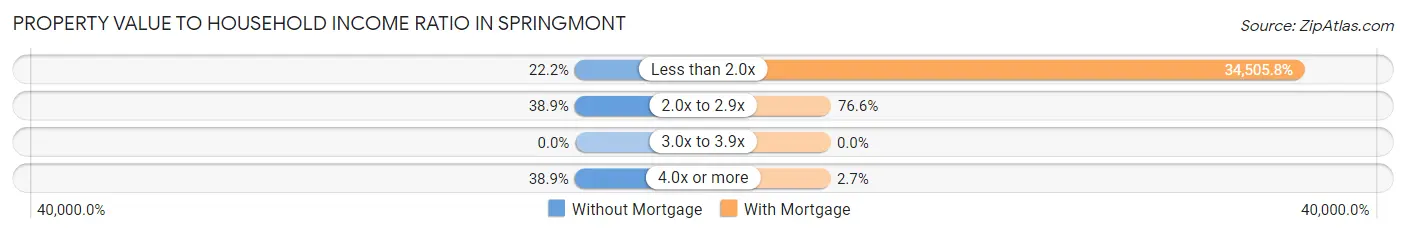
| Value-to-Income Ratio | Without Mortgage | With Mortgage |
| Less than 2.0x | 16 (22.2%) | 154,931 (34,505.8%) |
| 2.0x to 2.9x | 28 (38.9%) | 344 (76.6%) |
| 3.0x to 3.9x | 0 (0.0%) | 0 (0.0%) |
| 4.0x or more | 28 (38.9%) | 12 (2.7%) |
| Total | 72 (100.0%) | 449 (100.0%) |
Real Estate Taxes by Mortgage Status in Springmont
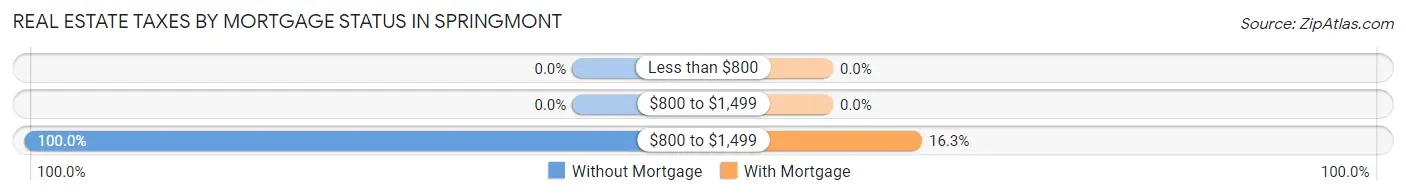
| Property Taxes | Without Mortgage | With Mortgage |
| Less than $800 | 0 (0.0%) | 0 (0.0%) |
| $800 to $1,499 | 0 (0.0%) | 0 (0.0%) |
| $800 to $1,499 | 72 (100.0%) | 73 (16.3%) |
| Total | 72 (100.0%) | 449 (100.0%) |
Health & Disability in Springmont
Health Insurance Coverage by Age in Springmont
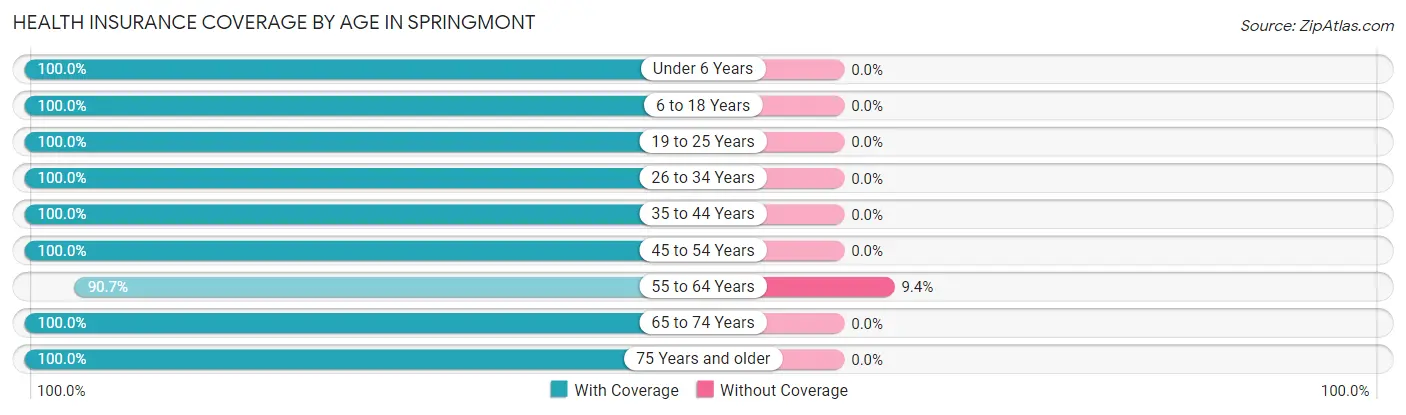
| Age Bracket | With Coverage | Without Coverage |
| Under 6 Years | 199 (100.0%) | 0 (0.0%) |
| 6 to 18 Years | 233 (100.0%) | 0 (0.0%) |
| 19 to 25 Years | 115 (100.0%) | 0 (0.0%) |
| 26 to 34 Years | 273 (100.0%) | 0 (0.0%) |
| 35 to 44 Years | 146 (100.0%) | 0 (0.0%) |
| 45 to 54 Years | 129 (100.0%) | 0 (0.0%) |
| 55 to 64 Years | 126 (90.6%) | 13 (9.3%) |
| 65 to 74 Years | 130 (100.0%) | 0 (0.0%) |
| 75 Years and older | 60 (100.0%) | 0 (0.0%) |
| Total | 1,411 (99.1%) | 13 (0.9%) |
Health Insurance Coverage by Citizenship Status in Springmont
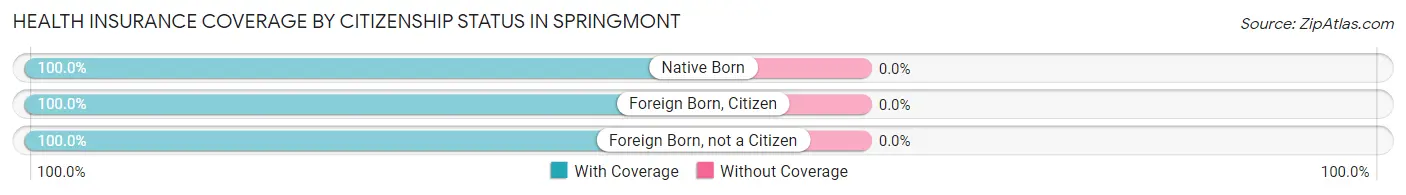
| Citizenship Status | With Coverage | Without Coverage |
| Native Born | 199 (100.0%) | 0 (0.0%) |
| Foreign Born, Citizen | 233 (100.0%) | 0 (0.0%) |
| Foreign Born, not a Citizen | 115 (100.0%) | 0 (0.0%) |
Health Insurance Coverage by Household Income in Springmont
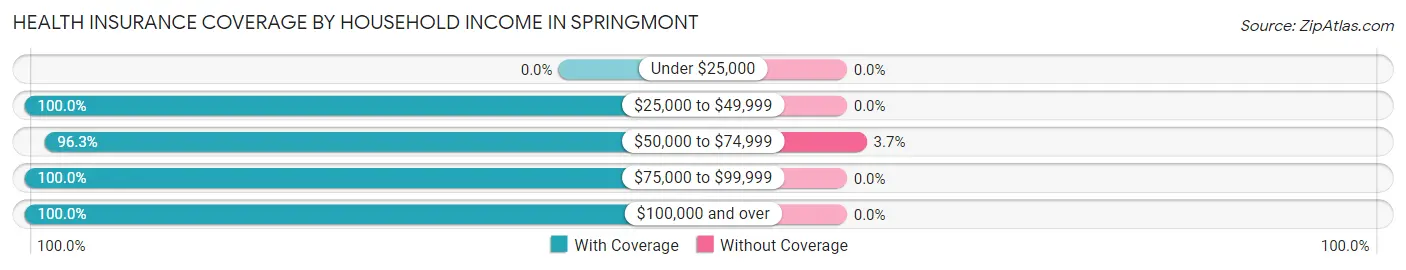
| Household Income | With Coverage | Without Coverage |
| Under $25,000 | 0 (0.0%) | 0 (0.0%) |
| $25,000 to $49,999 | 105 (100.0%) | 0 (0.0%) |
| $50,000 to $74,999 | 336 (96.3%) | 13 (3.7%) |
| $75,000 to $99,999 | 177 (100.0%) | 0 (0.0%) |
| $100,000 and over | 788 (100.0%) | 0 (0.0%) |
Public vs Private Health Insurance Coverage by Age in Springmont
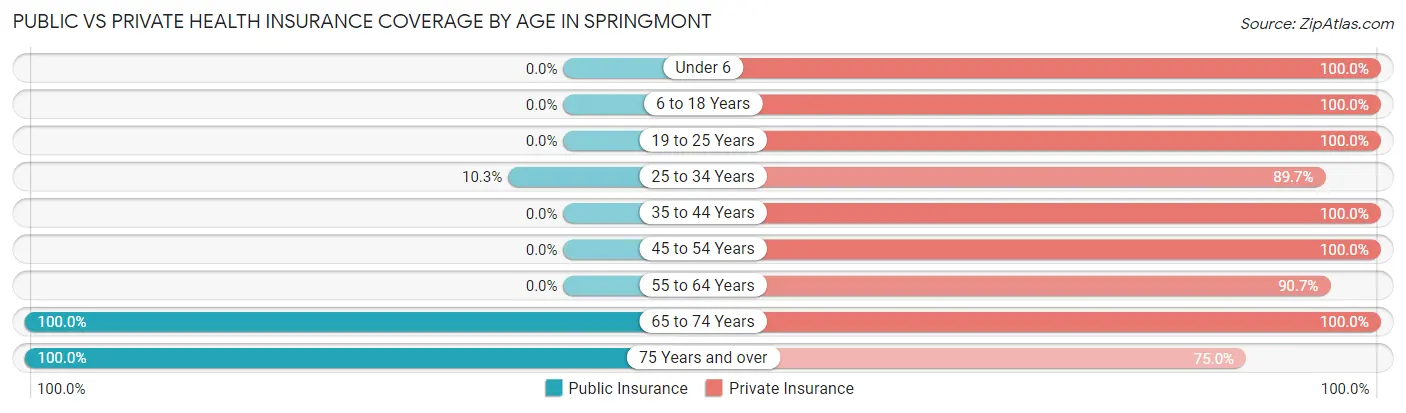
| Age Bracket | Public Insurance | Private Insurance |
| Under 6 | 0 (0.0%) | 199 (100.0%) |
| 6 to 18 Years | 0 (0.0%) | 233 (100.0%) |
| 19 to 25 Years | 0 (0.0%) | 115 (100.0%) |
| 25 to 34 Years | 28 (10.3%) | 245 (89.7%) |
| 35 to 44 Years | 0 (0.0%) | 146 (100.0%) |
| 45 to 54 Years | 0 (0.0%) | 129 (100.0%) |
| 55 to 64 Years | 0 (0.0%) | 126 (90.6%) |
| 65 to 74 Years | 130 (100.0%) | 130 (100.0%) |
| 75 Years and over | 60 (100.0%) | 45 (75.0%) |
| Total | 218 (15.3%) | 1,368 (96.1%) |
Disability Status by Sex by Age in Springmont
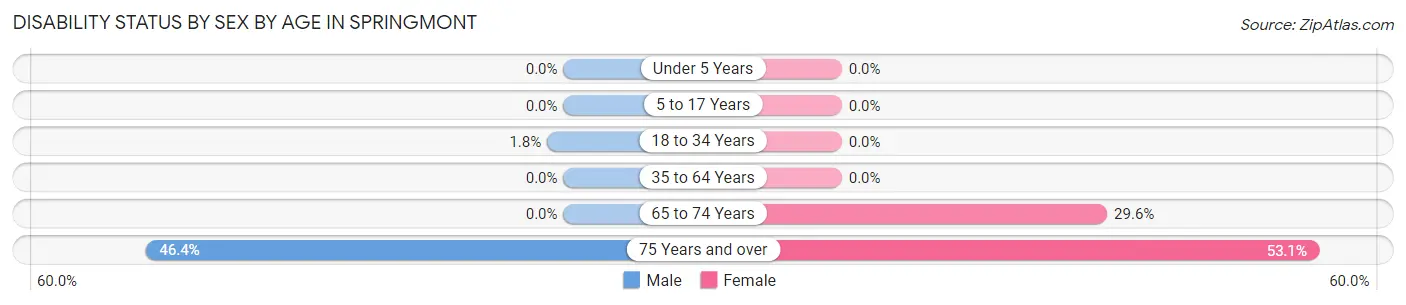
| Age Bracket | Male | Female |
| Under 5 Years | 0 (0.0%) | 0 (0.0%) |
| 5 to 17 Years | 0 (0.0%) | 0 (0.0%) |
| 18 to 34 Years | 5 (1.8%) | 0 (0.0%) |
| 35 to 64 Years | 0 (0.0%) | 0 (0.0%) |
| 65 to 74 Years | 0 (0.0%) | 13 (29.5%) |
| 75 Years and over | 13 (46.4%) | 17 (53.1%) |
Disability Class by Sex by Age in Springmont
Disability Class: Hearing Difficulty
| Age Bracket | Male | Female |
| Under 5 Years | 0 (0.0%) | 0 (0.0%) |
| 5 to 17 Years | 0 (0.0%) | 0 (0.0%) |
| 18 to 34 Years | 0 (0.0%) | 0 (0.0%) |
| 35 to 64 Years | 0 (0.0%) | 0 (0.0%) |
| 65 to 74 Years | 0 (0.0%) | 0 (0.0%) |
| 75 Years and over | 0 (0.0%) | 0 (0.0%) |
Disability Class: Vision Difficulty
| Age Bracket | Male | Female |
| Under 5 Years | 0 (0.0%) | 0 (0.0%) |
| 5 to 17 Years | 0 (0.0%) | 0 (0.0%) |
| 18 to 34 Years | 0 (0.0%) | 0 (0.0%) |
| 35 to 64 Years | 0 (0.0%) | 0 (0.0%) |
| 65 to 74 Years | 0 (0.0%) | 0 (0.0%) |
| 75 Years and over | 0 (0.0%) | 0 (0.0%) |
Disability Class: Cognitive Difficulty
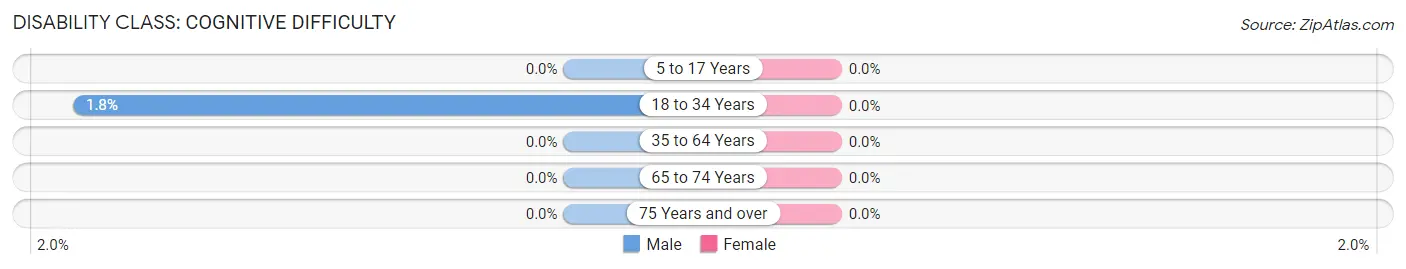
| Age Bracket | Male | Female |
| 5 to 17 Years | 0 (0.0%) | 0 (0.0%) |
| 18 to 34 Years | 5 (1.8%) | 0 (0.0%) |
| 35 to 64 Years | 0 (0.0%) | 0 (0.0%) |
| 65 to 74 Years | 0 (0.0%) | 0 (0.0%) |
| 75 Years and over | 0 (0.0%) | 0 (0.0%) |
Disability Class: Ambulatory Difficulty
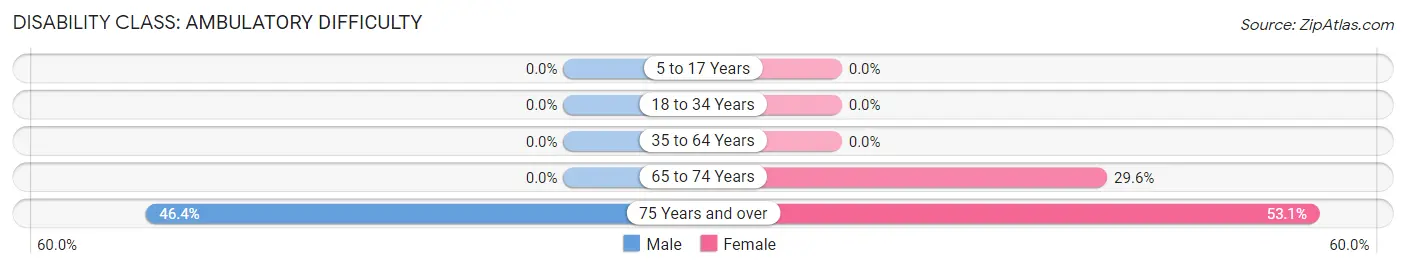
| Age Bracket | Male | Female |
| 5 to 17 Years | 0 (0.0%) | 0 (0.0%) |
| 18 to 34 Years | 0 (0.0%) | 0 (0.0%) |
| 35 to 64 Years | 0 (0.0%) | 0 (0.0%) |
| 65 to 74 Years | 0 (0.0%) | 13 (29.5%) |
| 75 Years and over | 13 (46.4%) | 17 (53.1%) |
Disability Class: Self-Care Difficulty
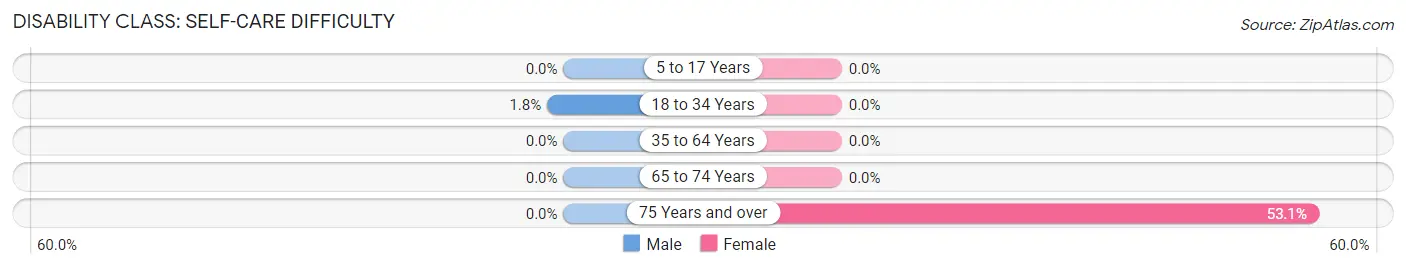
| Age Bracket | Male | Female |
| 5 to 17 Years | 0 (0.0%) | 0 (0.0%) |
| 18 to 34 Years | 5 (1.8%) | 0 (0.0%) |
| 35 to 64 Years | 0 (0.0%) | 0 (0.0%) |
| 65 to 74 Years | 0 (0.0%) | 0 (0.0%) |
| 75 Years and over | 0 (0.0%) | 17 (53.1%) |
Technology Access in Springmont
Computing Device Access in Springmont
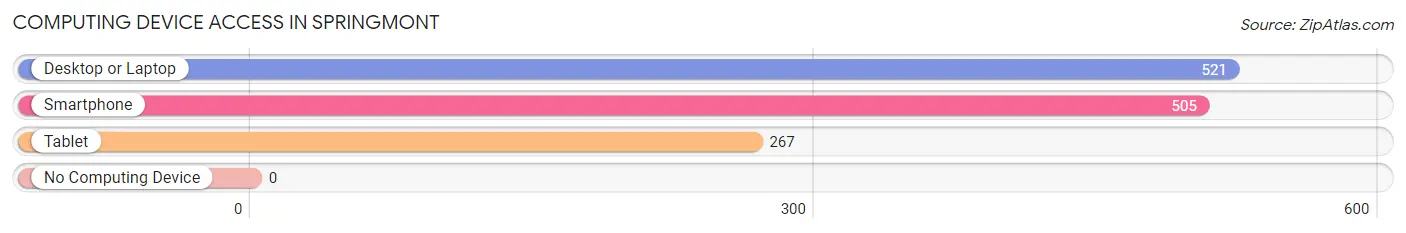
| Device Type | # Households | % Households |
| Desktop or Laptop | 521 | 100.0% |
| Smartphone | 505 | 96.9% |
| Tablet | 267 | 51.2% |
| No Computing Device | 0 | 0.0% |
| Total | 521 | 100.0% |
Internet Access in Springmont
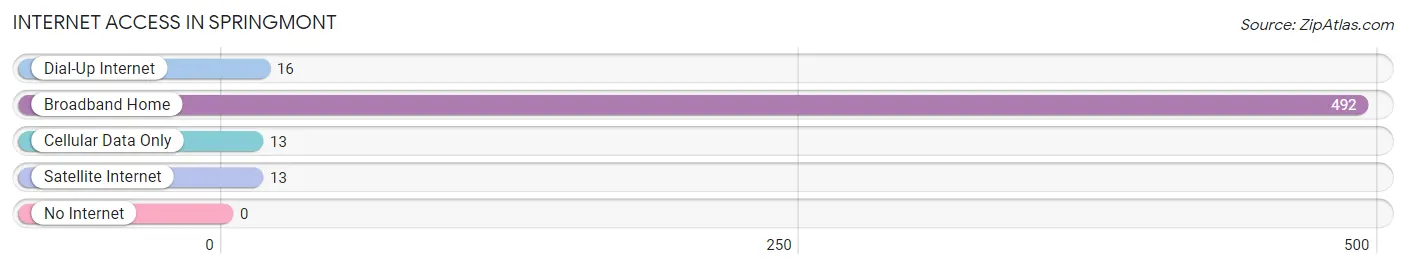
| Internet Type | # Households | % Households |
| Dial-Up Internet | 16 | 3.1% |
| Broadband Home | 492 | 94.4% |
| Cellular Data Only | 13 | 2.5% |
| Satellite Internet | 13 | 2.5% |
| No Internet | 0 | 0.0% |
| Total | 521 | 100.0% |
Springmont Summary
Montgomery County, Pennsylvania is home to the small borough of Springmont, located in the southeastern corner of the county. The borough is situated in the Perkiomen Valley, a region of rolling hills and lush farmland. Springmont is a small, rural community with a population of just over 1,000 people.
History
The area that is now Springmont was first settled in the late 1700s by German immigrants. The first settlers were members of the Mennonite Church, and the area was known as Mennonite Settlement. The settlement was later renamed Springmont, after the nearby spring. The spring was a popular spot for locals to gather and socialize, and it was also used to power a grist mill.
In 1845, the first post office was established in Springmont. The town was officially incorporated in 1876, and the first mayor was elected in 1877. The town grew slowly over the years, and by the early 1900s, it had a population of around 500 people.
Geography
Springmont is located in southeastern Montgomery County, Pennsylvania. It is situated in the Perkiomen Valley, a region of rolling hills and lush farmland. The borough is bordered by Upper Hanover Township to the north, Lower Salford Township to the east, Upper Salford Township to the south, and Upper Frederick Township to the west.
The borough covers an area of 1.2 square miles, and is home to a population of 1,072 people, as of the 2010 census. The town is located approximately 25 miles northwest of Philadelphia, and is accessible via Route 73.
Economy
The economy of Springmont is largely based on agriculture. The town is home to several farms, which produce a variety of crops, including corn, soybeans, wheat, and hay. The town also has a few small businesses, including a hardware store, a grocery store, and a few restaurants.
Demographics
As of the 2010 census, the population of Springmont was 1,072 people. The racial makeup of the town was 97.2% White, 0.9% African American, 0.4% Asian, 0.2% Native American, and 1.3% from other races. The median household income was $50,938, and the median family income was $60,000.
The town is home to a variety of religious denominations, including Catholic, Lutheran, Methodist, and Mennonite. The town also has a small Jewish population.
Conclusion
Springmont is a small, rural borough located in southeastern Montgomery County, Pennsylvania. The town has a population of just over 1,000 people, and is largely based on agriculture. The town is home to a variety of religious denominations, and has a median household income of $50,938. Springmont is a peaceful, quiet community, and is a great place to live and raise a family.
Common Questions
What is Per Capita Income in Springmont?
Per Capita income in Springmont is $48,121.
What is the Median Family Income in Springmont?
Median Family Income in Springmont is $154,583.
What is Income or Wage Gap in Springmont?
Income or Wage Gap in Springmont is 44.2%.
Women in Springmont earn 55.8 cents for every dollar earned by a man.
What is Inequality or Gini Index in Springmont?
Inequality or Gini Index in Springmont is 0.38.
What is the Total Population of Springmont?
Total Population of Springmont is 1,424.
What is the Total Male Population of Springmont?
Total Male Population of Springmont is 706.
What is the Total Female Population of Springmont?
Total Female Population of Springmont is 718.
What is the Ratio of Males per 100 Females in Springmont?
There are 98.33 Males per 100 Females in Springmont.
What is the Ratio of Females per 100 Males in Springmont?
There are 101.70 Females per 100 Males in Springmont.
What is the Median Population Age in Springmont?
Median Population Age in Springmont is 29.6 Years.
What is the Average Family Size in Springmont
Average Family Size in Springmont is 4.0 People.
What is the Average Household Size in Springmont
Average Household Size in Springmont is 2.7 People.
How Large is the Labor Force in Springmont?
There are 832 People in the Labor Forcein in Springmont.
What is the Percentage of People in the Labor Force in Springmont?
79.4% of People are in the Labor Force in Springmont.