Kenhorst borough, PA Map & Demographics
Kenhorst borough Overview
$35,754
PER CAPITA INCOME
$86,964
AVG FAMILY INCOME
$80,800
AVG HOUSEHOLD INCOME
22.3%
WAGE / INCOME GAP [ % ]
77.7¢/ $1
WAGE / INCOME GAP [ $ ]
0.31
INEQUALITY / GINI INDEX
2,984
TOTAL POPULATION
1,517
MALE POPULATION
1,467
FEMALE POPULATION
103.41
MALES / 100 FEMALES
96.70
FEMALES / 100 MALES
30.9
MEDIAN AGE
3.0
AVG FAMILY SIZE
2.5
AVG HOUSEHOLD SIZE
1,828
LABOR FORCE [ PEOPLE ]
76.3%
PERCENT IN LABOR FORCE
5.9%
UNEMPLOYMENT RATE
Income in Kenhorst borough
Income Overview in Kenhorst borough
Per Capita Income in Kenhorst borough is $35,754, while median incomes of families and households are $86,964 and $80,800 respectively.
| Characteristic | Number | Measure |
| Per Capita Income | 2,984 | $35,754 |
| Median Family Income | 725 | $86,964 |
| Mean Family Income | 725 | $94,703 |
| Median Household Income | 1,204 | $80,800 |
| Mean Household Income | 1,204 | $87,592 |
| Income Deficit | 725 | $0 |
| Wage / Income Gap (%) | 2,984 | 22.25% |
| Wage / Income Gap ($) | 2,984 | 77.75¢ per $1 |
| Gini / Inequality Index | 2,984 | 0.31 |
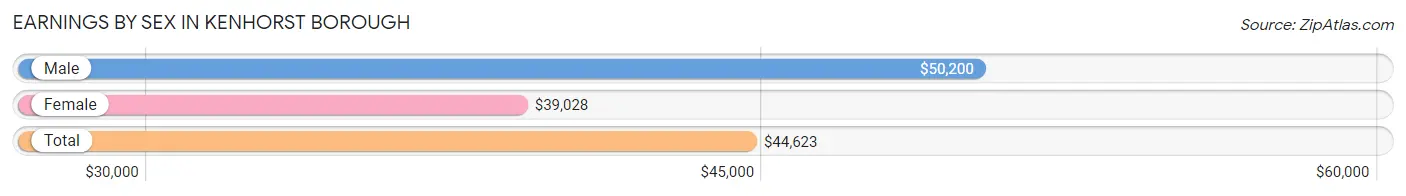
Earnings by Sex in Kenhorst borough
Average Earnings in Kenhorst borough are $44,623, $50,200 for men and $39,028 for women, a difference of 22.3%.
| Sex | Number | Average Earnings |
| Male | 1,016 (55.9%) | $50,200 |
| Female | 800 (44.1%) | $39,028 |
| Total | 1,816 (100.0%) | $44,623 |
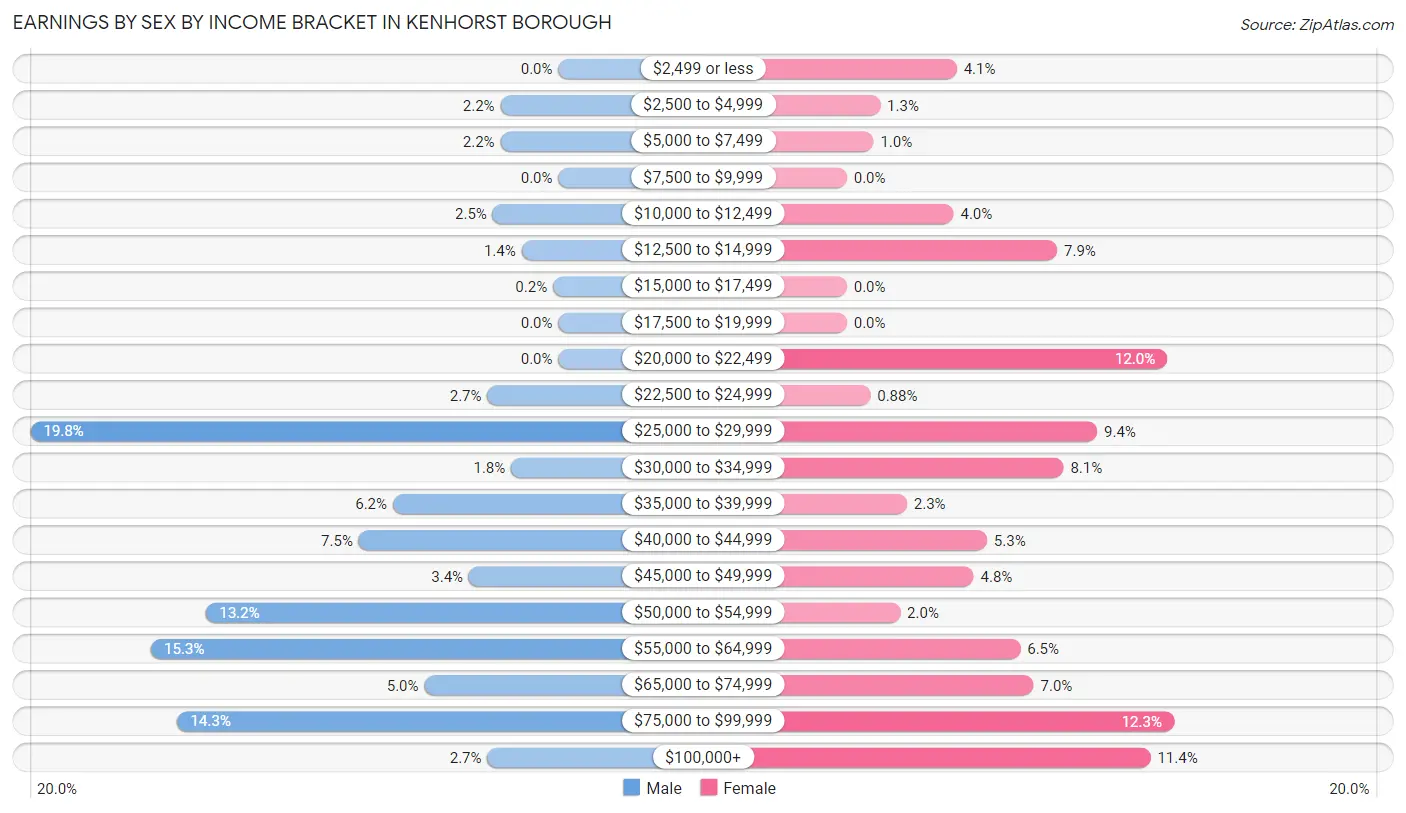
Earnings by Sex by Income Bracket in Kenhorst borough
The most common earnings brackets in Kenhorst borough are $25,000 to $29,999 for men (201 | 19.8%) and $75,000 to $99,999 for women (98 | 12.2%).
| Income | Male | Female |
| $2,499 or less | 0 (0.0%) | 33 (4.1%) |
| $2,500 to $4,999 | 22 (2.2%) | 10 (1.3%) |
| $5,000 to $7,499 | 22 (2.2%) | 8 (1.0%) |
| $7,500 to $9,999 | 0 (0.0%) | 0 (0.0%) |
| $10,000 to $12,499 | 25 (2.5%) | 32 (4.0%) |
| $12,500 to $14,999 | 14 (1.4%) | 63 (7.9%) |
| $15,000 to $17,499 | 2 (0.2%) | 0 (0.0%) |
| $17,500 to $19,999 | 0 (0.0%) | 0 (0.0%) |
| $20,000 to $22,499 | 0 (0.0%) | 96 (12.0%) |
| $22,500 to $24,999 | 27 (2.7%) | 7 (0.9%) |
| $25,000 to $29,999 | 201 (19.8%) | 75 (9.4%) |
| $30,000 to $34,999 | 18 (1.8%) | 65 (8.1%) |
| $35,000 to $39,999 | 63 (6.2%) | 18 (2.2%) |
| $40,000 to $44,999 | 76 (7.5%) | 42 (5.2%) |
| $45,000 to $49,999 | 34 (3.4%) | 38 (4.8%) |
| $50,000 to $54,999 | 134 (13.2%) | 16 (2.0%) |
| $55,000 to $64,999 | 155 (15.3%) | 52 (6.5%) |
| $65,000 to $74,999 | 51 (5.0%) | 56 (7.0%) |
| $75,000 to $99,999 | 145 (14.3%) | 98 (12.2%) |
| $100,000+ | 27 (2.7%) | 91 (11.4%) |
| Total | 1,016 (100.0%) | 800 (100.0%) |
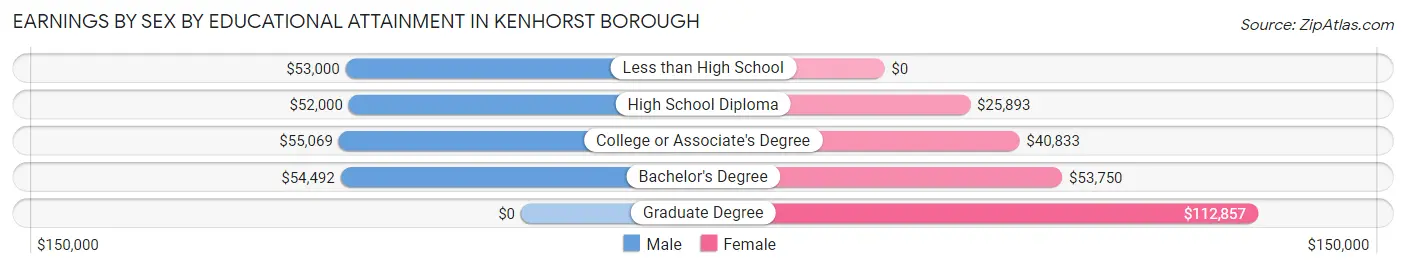
Earnings by Sex by Educational Attainment in Kenhorst borough
Average earnings in Kenhorst borough are $52,545 for men and $42,315 for women, a difference of 19.5%. Men with an educational attainment of college or associate's degree enjoy the highest average annual earnings of $55,069, while those with high school diploma education earn the least with $52,000. Women with an educational attainment of graduate degree earn the most with the average annual earnings of $112,857, while those with high school diploma education have the smallest earnings of $25,893.
| Educational Attainment | Male Income | Female Income |
| Less than High School | $53,000 | $0 |
| High School Diploma | $52,000 | $25,893 |
| College or Associate's Degree | $55,069 | $40,833 |
| Bachelor's Degree | $54,492 | $53,750 |
| Graduate Degree | - | - |
| Total | $52,545 | $42,315 |
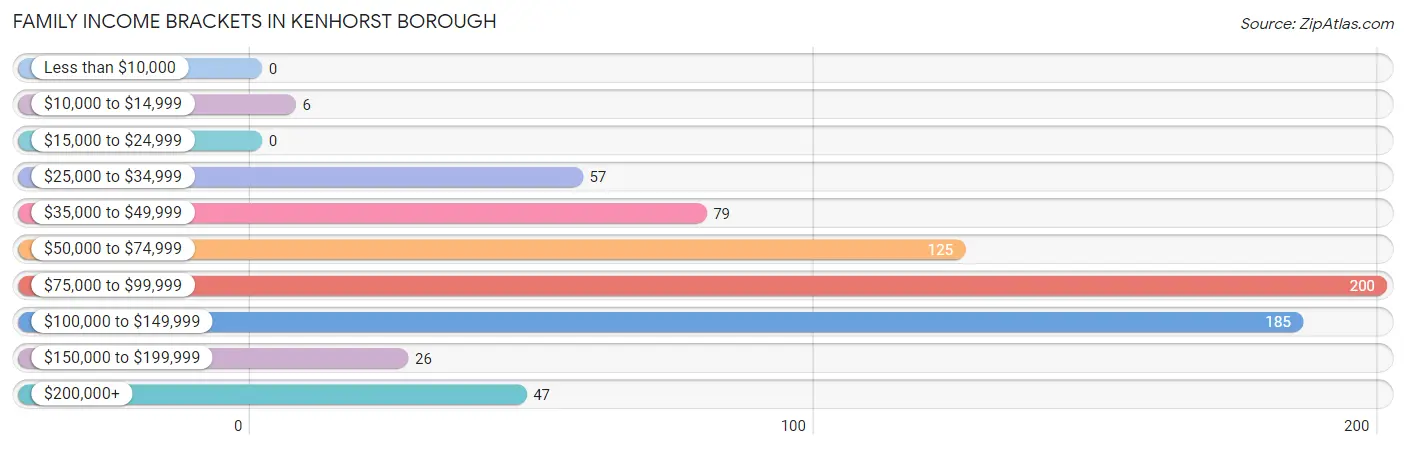
Family Income in Kenhorst borough
Family Income Brackets in Kenhorst borough
According to the Kenhorst borough family income data, there are 200 families falling into the $75,000 to $99,999 income range, which is the most common income bracket and makes up 27.6% of all families.
| Income Bracket | # Families | % Families |
| Less than $10,000 | 0 | 0.0% |
| $10,000 to $14,999 | 6 | 0.8% |
| $15,000 to $24,999 | 0 | 0.0% |
| $25,000 to $34,999 | 57 | 7.9% |
| $35,000 to $49,999 | 79 | 10.9% |
| $50,000 to $74,999 | 125 | 17.2% |
| $75,000 to $99,999 | 200 | 27.6% |
| $100,000 to $149,999 | 185 | 25.5% |
| $150,000 to $199,999 | 26 | 3.6% |
| $200,000+ | 47 | 6.5% |
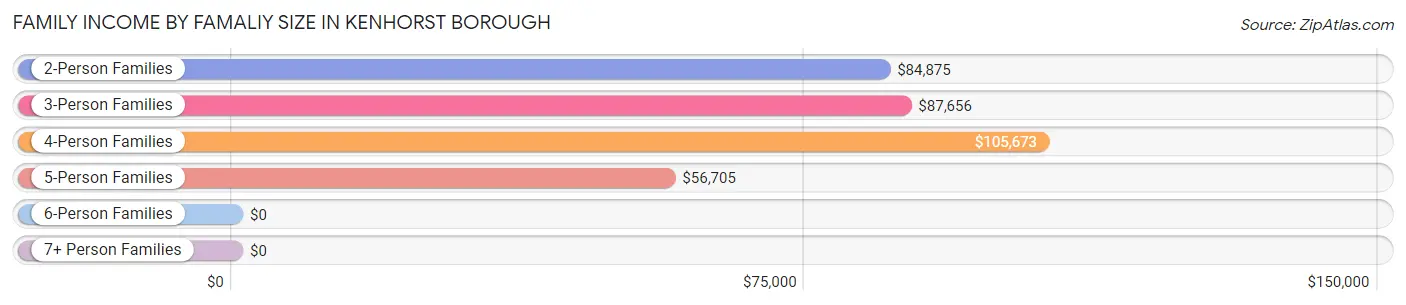
Family Income by Famaliy Size in Kenhorst borough
4-person families (107 | 14.8%) account for the highest median family income in Kenhorst borough with $105,673 per family, while 2-person families (296 | 40.8%) have the highest median income of $42,438 per family member.
| Income Bracket | # Families | Median Income |
| 2-Person Families | 296 (40.8%) | $84,875 |
| 3-Person Families | 214 (29.5%) | $87,656 |
| 4-Person Families | 107 (14.8%) | $105,673 |
| 5-Person Families | 108 (14.9%) | $56,705 |
| 6-Person Families | 0 (0.0%) | $0 |
| 7+ Person Families | 0 (0.0%) | $0 |
| Total | 725 (100.0%) | $86,964 |
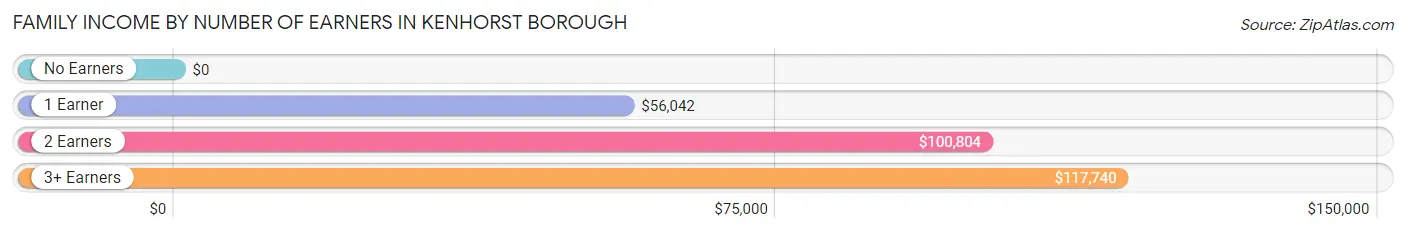
Family Income by Number of Earners in Kenhorst borough
| Number of Earners | # Families | Median Income |
| No Earners | 55 (7.6%) | $0 |
| 1 Earner | 247 (34.1%) | $56,042 |
| 2 Earners | 356 (49.1%) | $100,804 |
| 3+ Earners | 67 (9.2%) | $117,740 |
| Total | 725 (100.0%) | $86,964 |
Household Income in Kenhorst borough
Household Income Brackets in Kenhorst borough
With 347 households falling in the category, the $75,000 to $99,999 income range is the most frequent in Kenhorst borough, accounting for 28.8% of all households. In contrast, only 6 households (0.5%) fall into the $10,000 to $14,999 income bracket, making it the least populous group.

| Income Bracket | # Households | % Households |
| Less than $10,000 | 29 | 2.4% |
| $10,000 to $14,999 | 6 | 0.5% |
| $15,000 to $24,999 | 53 | 4.4% |
| $25,000 to $34,999 | 59 | 4.9% |
| $35,000 to $49,999 | 153 | 12.7% |
| $50,000 to $74,999 | 150 | 12.5% |
| $75,000 to $99,999 | 347 | 28.8% |
| $100,000 to $149,999 | 315 | 26.2% |
| $150,000 to $199,999 | 35 | 2.9% |
| $200,000+ | 57 | 4.7% |
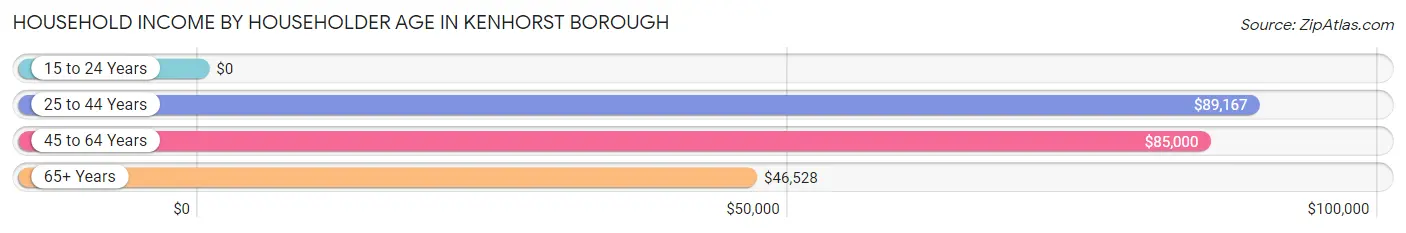
Household Income by Householder Age in Kenhorst borough
The median household income in Kenhorst borough is $80,800, with the highest median household income of $89,167 found in the 25 to 44 years age bracket for the primary householder. A total of 512 households (42.5%) fall into this category. Meanwhile, the 15 to 24 years age bracket for the primary householder has the lowest median household income of $0, with 5 households (0.4%) in this group.
| Income Bracket | # Households | Median Income |
| 15 to 24 Years | 5 (0.4%) | $0 |
| 25 to 44 Years | 512 (42.5%) | $89,167 |
| 45 to 64 Years | 472 (39.2%) | $85,000 |
| 65+ Years | 215 (17.9%) | $46,528 |
| Total | 1,204 (100.0%) | $80,800 |
Poverty in Kenhorst borough
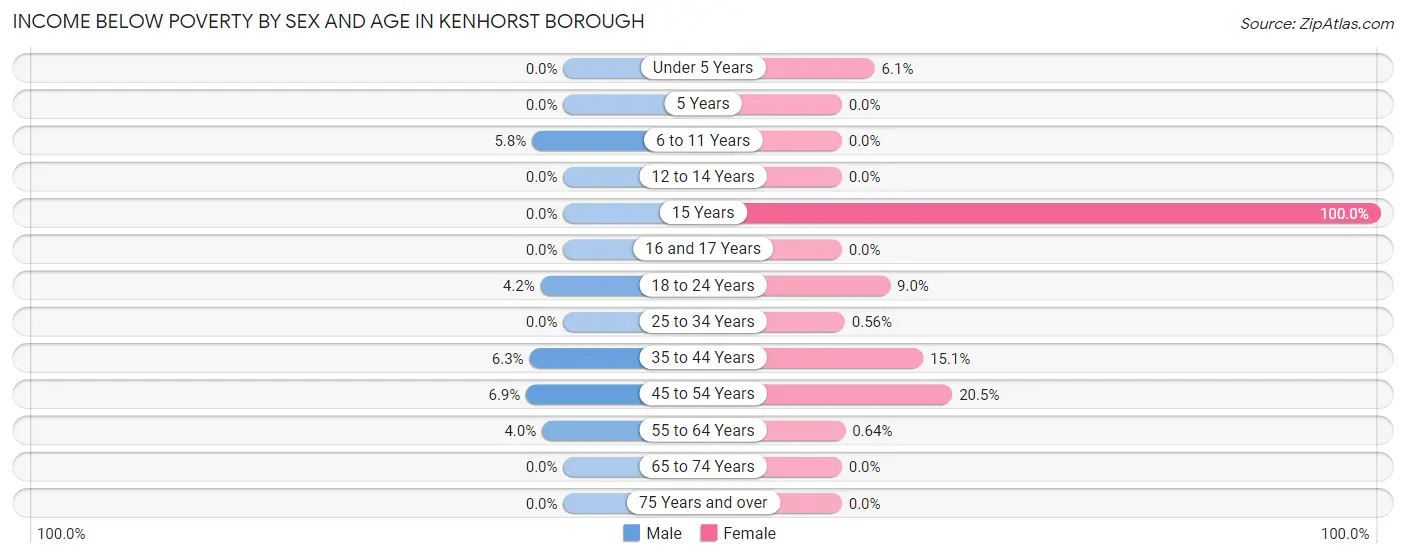
Income Below Poverty by Sex and Age in Kenhorst borough
With 3.0% poverty level for males and 6.4% for females among the residents of Kenhorst borough, 45 to 54 year old males and 15 year old females are the most vulnerable to poverty, with 13 males (6.9%) and 9 females (100.0%) in their respective age groups living below the poverty level.
| Age Bracket | Male | Female |
| Under 5 Years | 0 (0.0%) | 10 (6.1%) |
| 5 Years | 0 (0.0%) | 0 (0.0%) |
| 6 to 11 Years | 9 (5.8%) | 0 (0.0%) |
| 12 to 14 Years | 0 (0.0%) | 0 (0.0%) |
| 15 Years | 0 (0.0%) | 9 (100.0%) |
| 16 and 17 Years | 0 (0.0%) | 0 (0.0%) |
| 18 to 24 Years | 7 (4.2%) | 7 (9.0%) |
| 25 to 34 Years | 0 (0.0%) | 2 (0.6%) |
| 35 to 44 Years | 10 (6.3%) | 24 (15.1%) |
| 45 to 54 Years | 13 (6.9%) | 41 (20.5%) |
| 55 to 64 Years | 7 (4.0%) | 1 (0.6%) |
| 65 to 74 Years | 0 (0.0%) | 0 (0.0%) |
| 75 Years and over | 0 (0.0%) | 0 (0.0%) |
| Total | 46 (3.0%) | 94 (6.4%) |
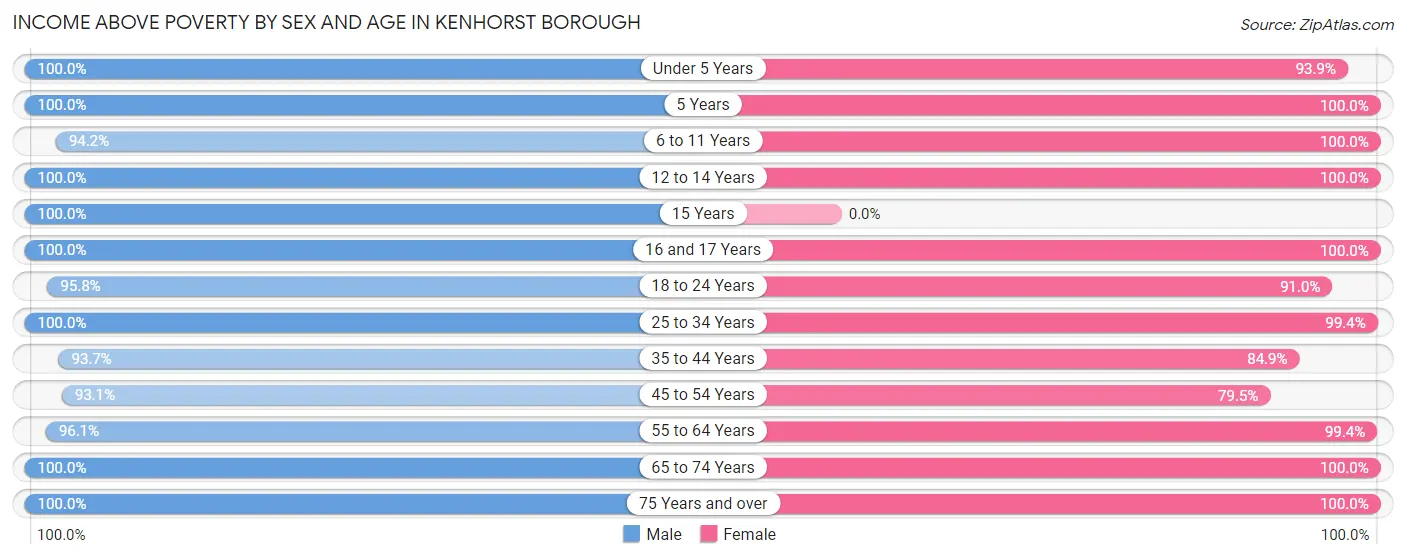
Income Above Poverty by Sex and Age in Kenhorst borough
According to the poverty statistics in Kenhorst borough, males aged under 5 years and females aged 5 years are the age groups that are most secure financially, with 100.0% of males and 100.0% of females in these age groups living above the poverty line.
| Age Bracket | Male | Female |
| Under 5 Years | 51 (100.0%) | 154 (93.9%) |
| 5 Years | 8 (100.0%) | 26 (100.0%) |
| 6 to 11 Years | 146 (94.2%) | 100 (100.0%) |
| 12 to 14 Years | 14 (100.0%) | 16 (100.0%) |
| 15 Years | 35 (100.0%) | 0 (0.0%) |
| 16 and 17 Years | 21 (100.0%) | 20 (100.0%) |
| 18 to 24 Years | 158 (95.8%) | 71 (91.0%) |
| 25 to 34 Years | 369 (100.0%) | 356 (99.4%) |
| 35 to 44 Years | 149 (93.7%) | 135 (84.9%) |
| 45 to 54 Years | 175 (93.1%) | 159 (79.5%) |
| 55 to 64 Years | 170 (96.1%) | 156 (99.4%) |
| 65 to 74 Years | 114 (100.0%) | 114 (100.0%) |
| 75 Years and over | 51 (100.0%) | 66 (100.0%) |
| Total | 1,461 (97.0%) | 1,373 (93.6%) |
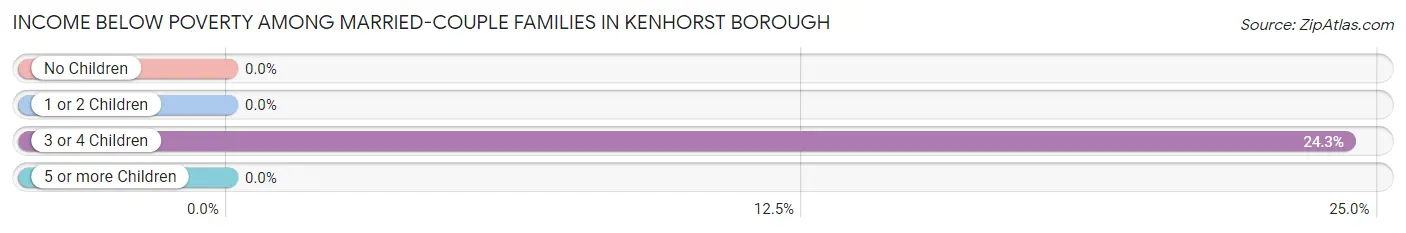
Income Below Poverty Among Married-Couple Families in Kenhorst borough
The poverty statistics for married-couple families in Kenhorst borough show that 1.8% or 9 of the total 487 families live below the poverty line. Families with 3 or 4 children have the highest poverty rate of 24.3%, comprising of 9 families. On the other hand, families with no children have the lowest poverty rate of 0.0%, which includes 0 families.
| Children | Above Poverty | Below Poverty |
| No Children | 303 (100.0%) | 0 (0.0%) |
| 1 or 2 Children | 147 (100.0%) | 0 (0.0%) |
| 3 or 4 Children | 28 (75.7%) | 9 (24.3%) |
| 5 or more Children | 0 (0.0%) | 0 (0.0%) |
| Total | 478 (98.2%) | 9 (1.8%) |
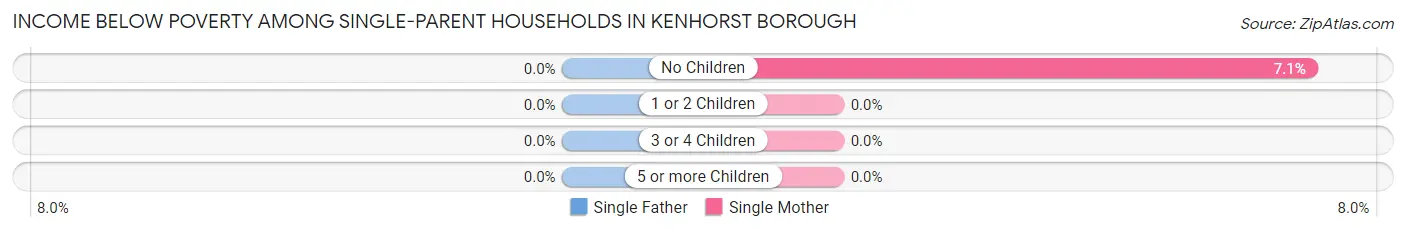
Income Below Poverty Among Single-Parent Households in Kenhorst borough
| Children | Single Father | Single Mother |
| No Children | 0 (0.0%) | 6 (7.1%) |
| 1 or 2 Children | 0 (0.0%) | 0 (0.0%) |
| 3 or 4 Children | 0 (0.0%) | 0 (0.0%) |
| 5 or more Children | 0 (0.0%) | 0 (0.0%) |
| Total | 0 (0.0%) | 6 (4.4%) |
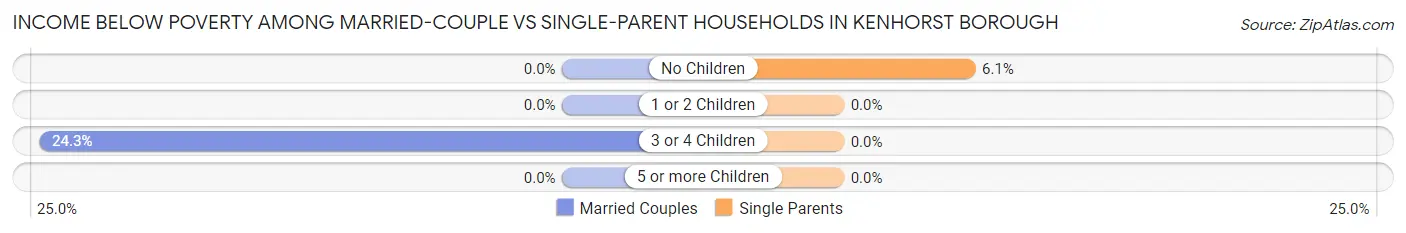
Income Below Poverty Among Married-Couple vs Single-Parent Households in Kenhorst borough
The poverty data for Kenhorst borough shows that 9 of the married-couple family households (1.8%) and 6 of the single-parent households (2.5%) are living below the poverty level. Within the married-couple family households, those with 3 or 4 children have the highest poverty rate, with 9 households (24.3%) falling below the poverty line. Among the single-parent households, those with no children have the highest poverty rate, with 6 household (6.1%) living below poverty.
| Children | Married-Couple Families | Single-Parent Households |
| No Children | 0 (0.0%) | 6 (6.1%) |
| 1 or 2 Children | 0 (0.0%) | 0 (0.0%) |
| 3 or 4 Children | 9 (24.3%) | 0 (0.0%) |
| 5 or more Children | 0 (0.0%) | 0 (0.0%) |
| Total | 9 (1.8%) | 6 (2.5%) |
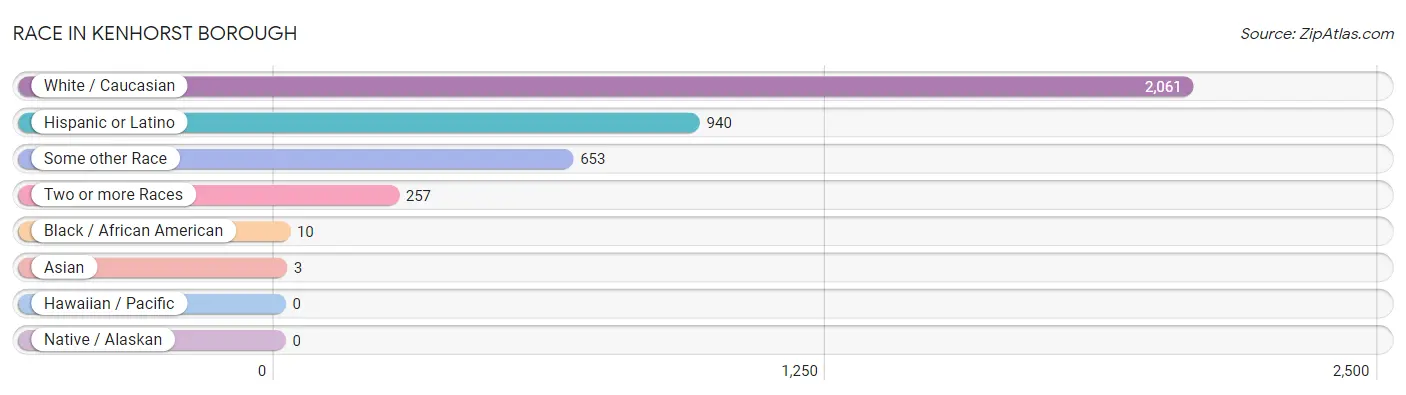
Race in Kenhorst borough
The most populous races in Kenhorst borough are White / Caucasian (2,061 | 69.1%), Hispanic or Latino (940 | 31.5%), and Some other Race (653 | 21.9%).
| Race | # Population | % Population |
| Asian | 3 | 0.1% |
| Black / African American | 10 | 0.3% |
| Hawaiian / Pacific | 0 | 0.0% |
| Hispanic or Latino | 940 | 31.5% |
| Native / Alaskan | 0 | 0.0% |
| White / Caucasian | 2,061 | 69.1% |
| Two or more Races | 257 | 8.6% |
| Some other Race | 653 | 21.9% |
| Total | 2,984 | 100.0% |
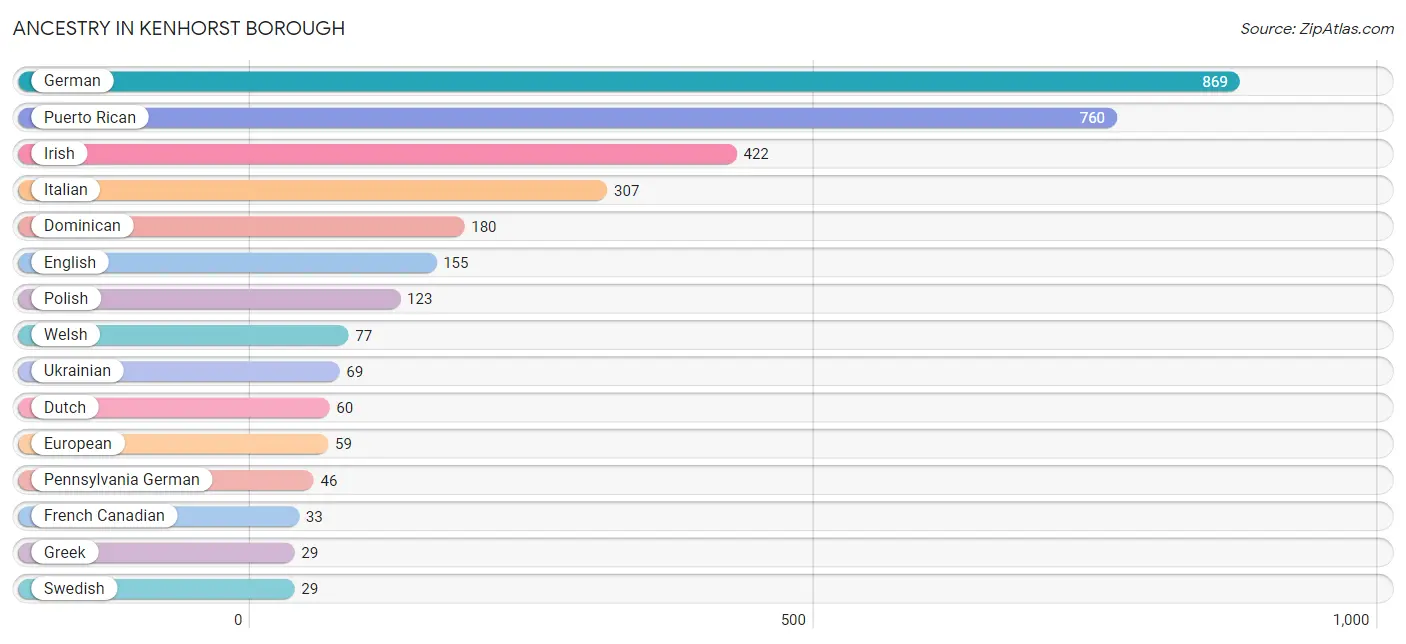
Ancestry in Kenhorst borough
The most populous ancestries reported in Kenhorst borough are German (869 | 29.1%), Puerto Rican (760 | 25.5%), Irish (422 | 14.1%), Italian (307 | 10.3%), and Dominican (180 | 6.0%), together accounting for 85.1% of all Kenhorst borough residents.
| Ancestry | # Population | % Population |
| Arab | 17 | 0.6% |
| Brazilian | 18 | 0.6% |
| British | 6 | 0.2% |
| Croatian | 7 | 0.2% |
| Czech | 7 | 0.2% |
| Danish | 6 | 0.2% |
| Dominican | 180 | 6.0% |
| Dutch | 60 | 2.0% |
| Eastern European | 2 | 0.1% |
| English | 155 | 5.2% |
| European | 59 | 2.0% |
| French | 18 | 0.6% |
| French Canadian | 33 | 1.1% |
| German | 869 | 29.1% |
| Greek | 29 | 1.0% |
| Hungarian | 5 | 0.2% |
| Irish | 422 | 14.1% |
| Italian | 307 | 10.3% |
| Malaysian | 18 | 0.6% |
| Moroccan | 17 | 0.6% |
| Pennsylvania German | 46 | 1.5% |
| Polish | 123 | 4.1% |
| Puerto Rican | 760 | 25.5% |
| Russian | 16 | 0.5% |
| Scandinavian | 6 | 0.2% |
| Scotch-Irish | 7 | 0.2% |
| Swedish | 29 | 1.0% |
| Swiss | 6 | 0.2% |
| Ukrainian | 69 | 2.3% |
| Welsh | 77 | 2.6% | View All 30 Rows |
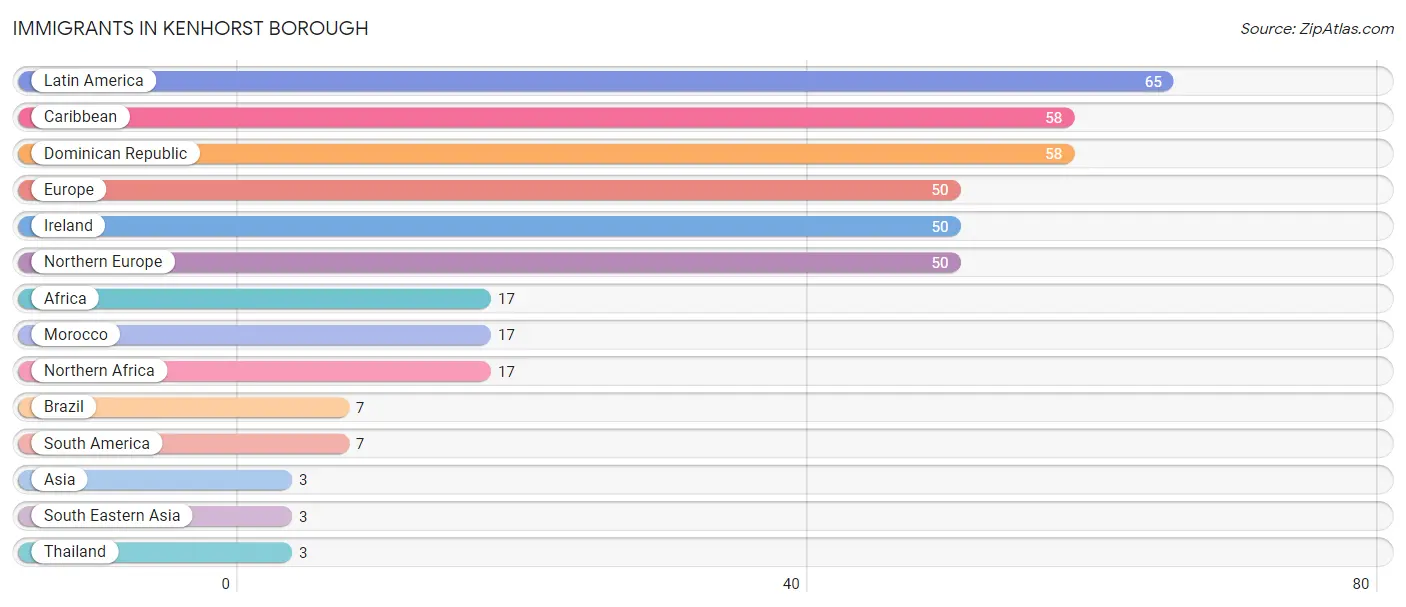
Immigrants in Kenhorst borough
The most numerous immigrant groups reported in Kenhorst borough came from Latin America (65 | 2.2%), Caribbean (58 | 1.9%), Dominican Republic (58 | 1.9%), Europe (50 | 1.7%), and Ireland (50 | 1.7%), together accounting for 9.4% of all Kenhorst borough residents.
| Immigration Origin | # Population | % Population |
| Africa | 17 | 0.6% |
| Asia | 3 | 0.1% |
| Brazil | 7 | 0.2% |
| Caribbean | 58 | 1.9% |
| Dominican Republic | 58 | 1.9% |
| Europe | 50 | 1.7% |
| Ireland | 50 | 1.7% |
| Latin America | 65 | 2.2% |
| Morocco | 17 | 0.6% |
| Northern Africa | 17 | 0.6% |
| Northern Europe | 50 | 1.7% |
| South America | 7 | 0.2% |
| South Eastern Asia | 3 | 0.1% |
| Thailand | 3 | 0.1% | View All 14 Rows |
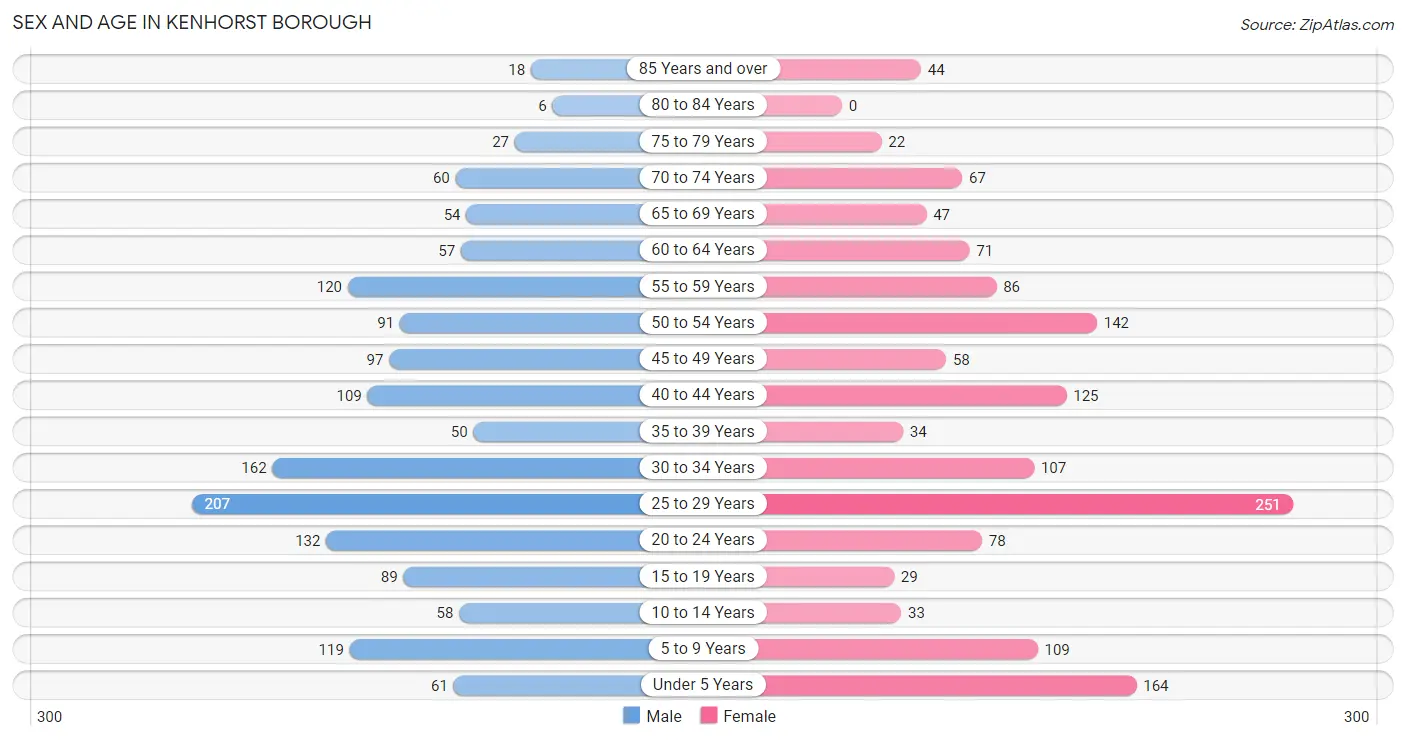
Sex and Age in Kenhorst borough
Sex and Age in Kenhorst borough
The most populous age groups in Kenhorst borough are 25 to 29 Years (207 | 13.7%) for men and 25 to 29 Years (251 | 17.1%) for women.
| Age Bracket | Male | Female |
| Under 5 Years | 61 (4.0%) | 164 (11.2%) |
| 5 to 9 Years | 119 (7.8%) | 109 (7.4%) |
| 10 to 14 Years | 58 (3.8%) | 33 (2.2%) |
| 15 to 19 Years | 89 (5.9%) | 29 (2.0%) |
| 20 to 24 Years | 132 (8.7%) | 78 (5.3%) |
| 25 to 29 Years | 207 (13.7%) | 251 (17.1%) |
| 30 to 34 Years | 162 (10.7%) | 107 (7.3%) |
| 35 to 39 Years | 50 (3.3%) | 34 (2.3%) |
| 40 to 44 Years | 109 (7.2%) | 125 (8.5%) |
| 45 to 49 Years | 97 (6.4%) | 58 (4.0%) |
| 50 to 54 Years | 91 (6.0%) | 142 (9.7%) |
| 55 to 59 Years | 120 (7.9%) | 86 (5.9%) |
| 60 to 64 Years | 57 (3.8%) | 71 (4.8%) |
| 65 to 69 Years | 54 (3.6%) | 47 (3.2%) |
| 70 to 74 Years | 60 (4.0%) | 67 (4.6%) |
| 75 to 79 Years | 27 (1.8%) | 22 (1.5%) |
| 80 to 84 Years | 6 (0.4%) | 0 (0.0%) |
| 85 Years and over | 18 (1.2%) | 44 (3.0%) |
| Total | 1,517 (100.0%) | 1,467 (100.0%) |
Families and Households in Kenhorst borough
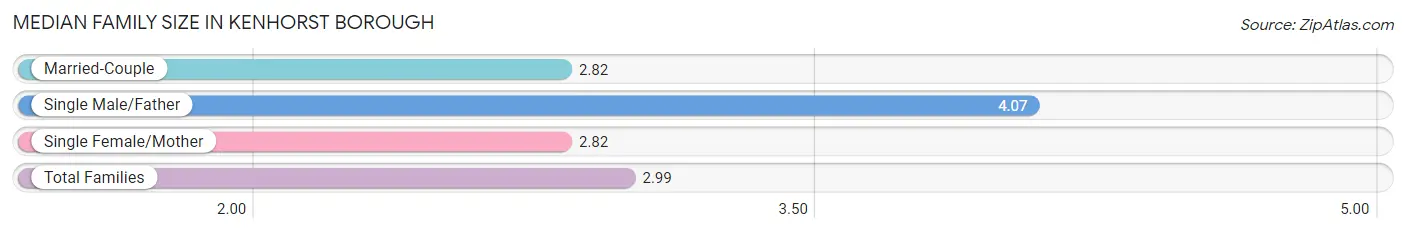
Median Family Size in Kenhorst borough
The median family size in Kenhorst borough is 2.99 persons per family, with single male/father families (102 | 14.1%) accounting for the largest median family size of 4.07 persons per family. On the other hand, married-couple families (487 | 67.2%) represent the smallest median family size with 2.82 persons per family.
| Family Type | # Families | Family Size |
| Married-Couple | 487 (67.2%) | 2.82 |
| Single Male/Father | 102 (14.1%) | 4.07 |
| Single Female/Mother | 136 (18.8%) | 2.82 |
| Total Families | 725 (100.0%) | 2.99 |
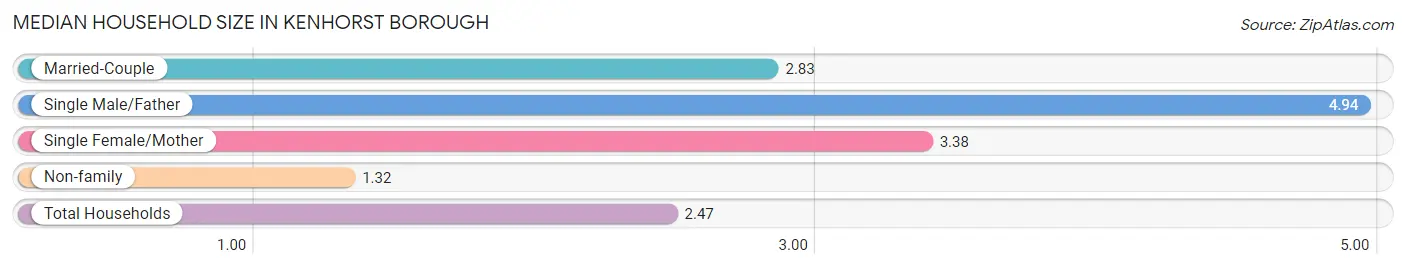
Median Household Size in Kenhorst borough
The median household size in Kenhorst borough is 2.47 persons per household, with single male/father households (102 | 8.5%) accounting for the largest median household size of 4.94 persons per household. non-family households (479 | 39.8%) represent the smallest median household size with 1.32 persons per household.
| Household Type | # Households | Household Size |
| Married-Couple | 487 (40.5%) | 2.83 |
| Single Male/Father | 102 (8.5%) | 4.94 |
| Single Female/Mother | 136 (11.3%) | 3.38 |
| Non-family | 479 (39.8%) | 1.32 |
| Total Households | 1,204 (100.0%) | 2.47 |
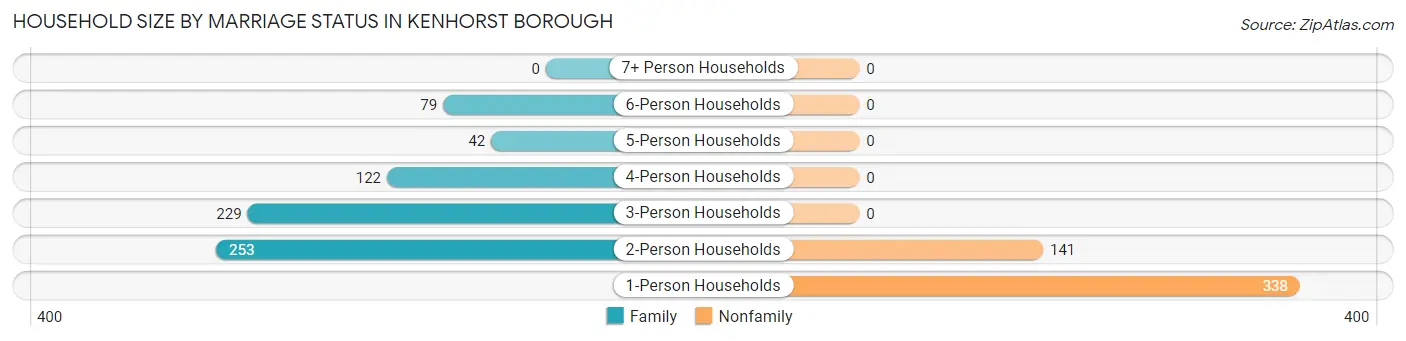
Household Size by Marriage Status in Kenhorst borough
Out of a total of 1,204 households in Kenhorst borough, 725 (60.2%) are family households, while 479 (39.8%) are nonfamily households. The most numerous type of family households are 2-person households, comprising 253, and the most common type of nonfamily households are 1-person households, comprising 338.
| Household Size | Family Households | Nonfamily Households |
| 1-Person Households | - | 338 (28.1%) |
| 2-Person Households | 253 (21.0%) | 141 (11.7%) |
| 3-Person Households | 229 (19.0%) | 0 (0.0%) |
| 4-Person Households | 122 (10.1%) | 0 (0.0%) |
| 5-Person Households | 42 (3.5%) | 0 (0.0%) |
| 6-Person Households | 79 (6.6%) | 0 (0.0%) |
| 7+ Person Households | 0 (0.0%) | 0 (0.0%) |
| Total | 725 (60.2%) | 479 (39.8%) |
Female Fertility in Kenhorst borough
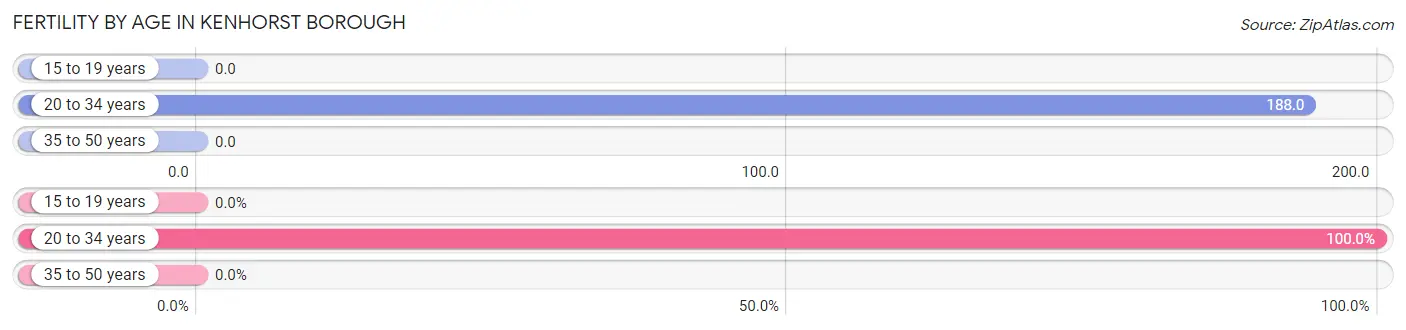
Fertility by Age in Kenhorst borough
Average fertility rate in Kenhorst borough is 109.0 births per 1,000 women. Women in the age bracket of 20 to 34 years have the highest fertility rate with 188.0 births per 1,000 women. Women in the age bracket of 20 to 34 years acount for 100.0% of all women with births.
| Age Bracket | Women with Births | Births / 1,000 Women |
| 15 to 19 years | 0 (0.0%) | 0.0 |
| 20 to 34 years | 82 (100.0%) | 188.0 |
| 35 to 50 years | 0 (0.0%) | 0.0 |
| Total | 82 (100.0%) | 109.0 |
Fertility by Age by Marriage Status in Kenhorst borough
7.3% of women with births (82) in Kenhorst borough are married. The highest percentage of unmarried women with births falls into 20 to 34 years age bracket with 92.7% of them unmarried at the time of birth, while the lowest percentage of unmarried women with births belong to 20 to 34 years age bracket with 92.7% of them unmarried.
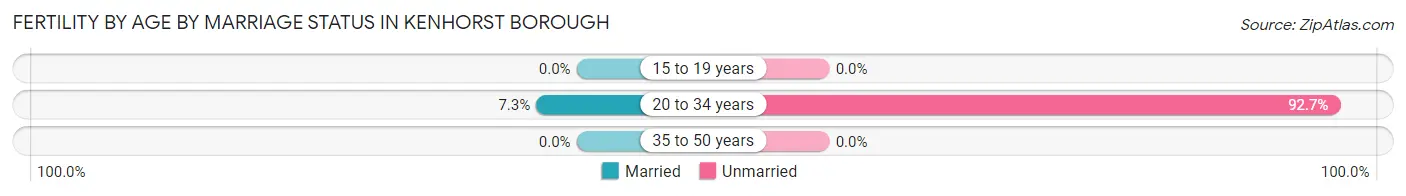
| Age Bracket | Married | Unmarried |
| 15 to 19 years | 0 (0.0%) | 0 (0.0%) |
| 20 to 34 years | 6 (7.3%) | 76 (92.7%) |
| 35 to 50 years | 0 (0.0%) | 0 (0.0%) |
| Total | 6 (7.3%) | 76 (92.7%) |
Fertility by Education in Kenhorst borough
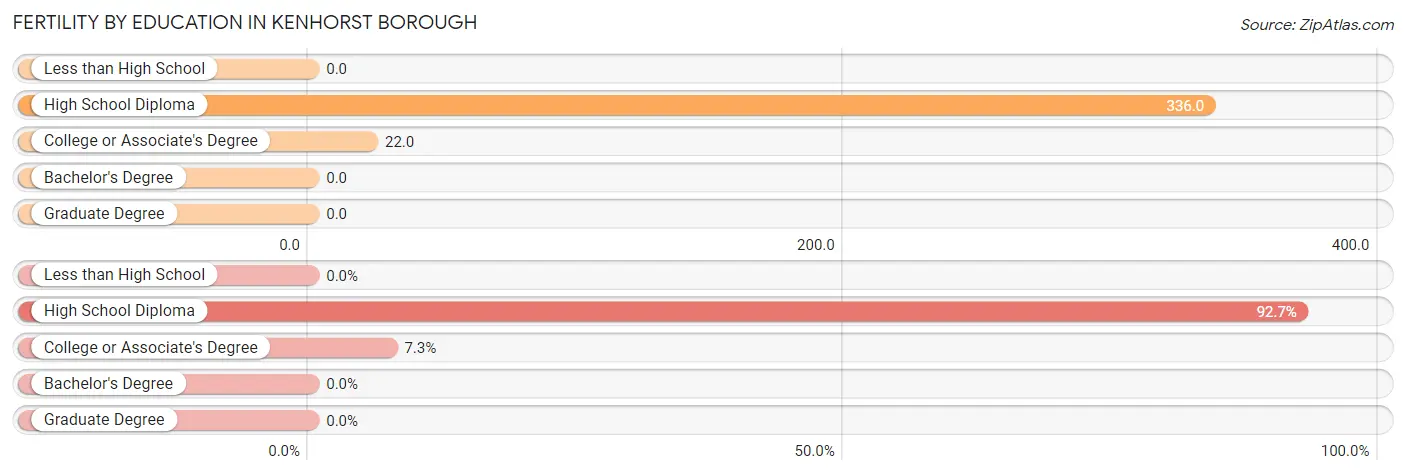
| Educational Attainment | Women with Births | Births / 1,000 Women |
| Less than High School | 0 (0.0%) | 0.0 |
| High School Diploma | 76 (92.7%) | 336.0 |
| College or Associate's Degree | 6 (7.3%) | 22.0 |
| Bachelor's Degree | 0 (0.0%) | 0.0 |
| Graduate Degree | 0 (0.0%) | 0.0 |
| Total | 82 (100.0%) | 109.0 |
Fertility by Education by Marriage Status in Kenhorst borough
92.7% of women with births in Kenhorst borough are unmarried. Women with the educational attainment of college or associate's degree are most likely to be married with 100.0% of them married at childbirth, while women with the educational attainment of high school diploma are least likely to be married with 100.0% of them unmarried at childbirth.
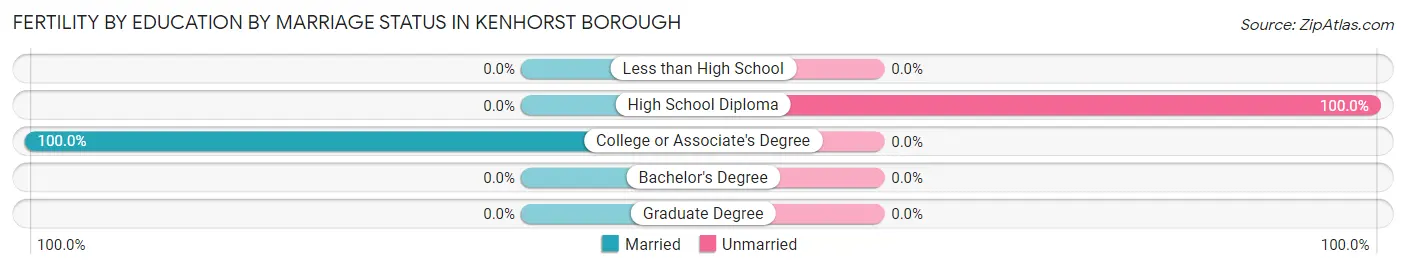
| Educational Attainment | Married | Unmarried |
| Less than High School | 0 (0.0%) | 0 (0.0%) |
| High School Diploma | 0 (0.0%) | 76 (100.0%) |
| College or Associate's Degree | 6 (100.0%) | 0 (0.0%) |
| Bachelor's Degree | 0 (0.0%) | 0 (0.0%) |
| Graduate Degree | 0 (0.0%) | 0 (0.0%) |
| Total | 6 (7.3%) | 76 (92.7%) |
Employment Characteristics in Kenhorst borough
Employment by Class of Employer in Kenhorst borough
Among the 1,646 employed individuals in Kenhorst borough, private company employees (1,355 | 82.3%), not-for-profit organizations (97 | 5.9%), and self-employed (not incorporated) (64 | 3.9%) make up the most common classes of employment.
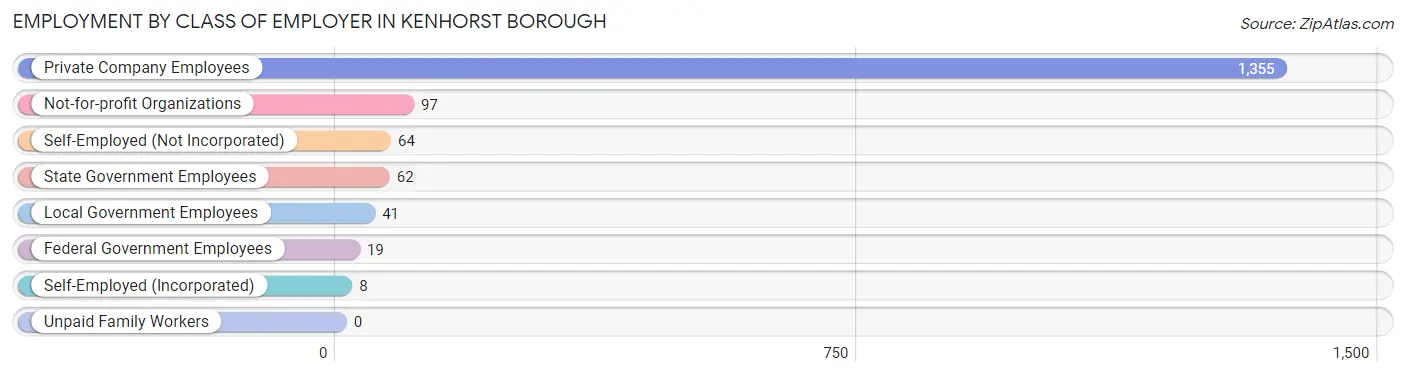
| Employer Class | # Employees | % Employees |
| Private Company Employees | 1,355 | 82.3% |
| Self-Employed (Incorporated) | 8 | 0.5% |
| Self-Employed (Not Incorporated) | 64 | 3.9% |
| Not-for-profit Organizations | 97 | 5.9% |
| Local Government Employees | 41 | 2.5% |
| State Government Employees | 62 | 3.8% |
| Federal Government Employees | 19 | 1.1% |
| Unpaid Family Workers | 0 | 0.0% |
| Total | 1,646 | 100.0% |
Employment Status by Age in Kenhorst borough
According to the labor force statistics for Kenhorst borough, out of the total population over 16 years of age (2,396), 76.3% or 1,828 individuals are in the labor force, with 5.9% or 108 of them unemployed. The age group with the highest labor force participation rate is 25 to 29 years, with 95.6% or 438 individuals in the labor force. Within the labor force, the 20 to 24 years age range has the highest percentage of unemployed individuals, with 30.7% or 61 of them being unemployed.
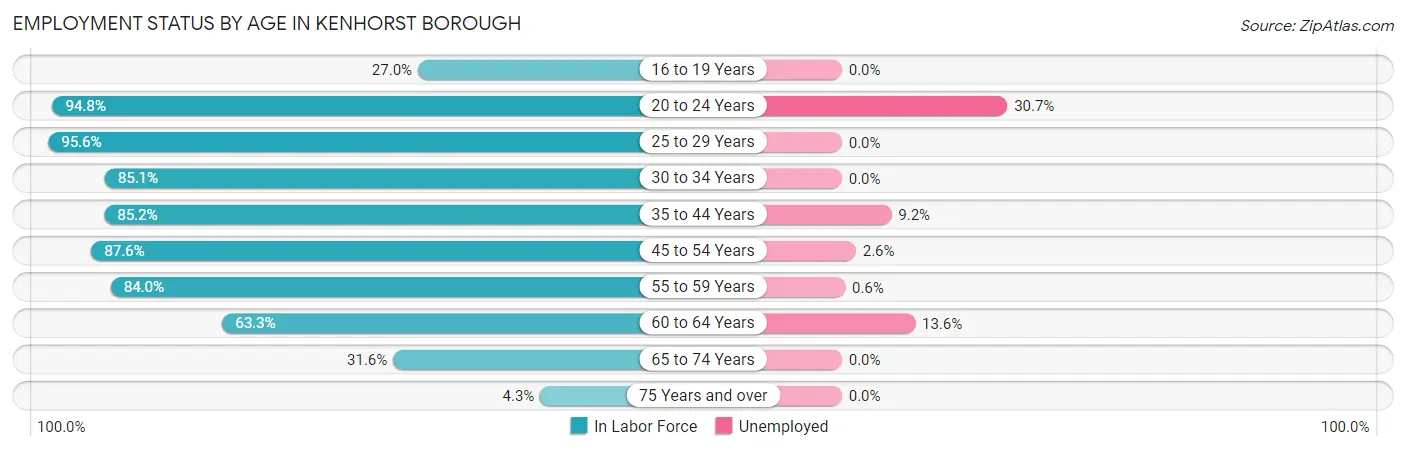
| Age Bracket | In Labor Force | Unemployed |
| 16 to 19 Years | 20 (27.0%) | 0 (0.0%) |
| 20 to 24 Years | 199 (94.8%) | 61 (30.7%) |
| 25 to 29 Years | 438 (95.6%) | 0 (0.0%) |
| 30 to 34 Years | 229 (85.1%) | 0 (0.0%) |
| 35 to 44 Years | 271 (85.2%) | 25 (9.2%) |
| 45 to 54 Years | 340 (87.6%) | 9 (2.6%) |
| 55 to 59 Years | 173 (84.0%) | 1 (0.6%) |
| 60 to 64 Years | 81 (63.3%) | 11 (13.6%) |
| 65 to 74 Years | 72 (31.6%) | 0 (0.0%) |
| 75 Years and over | 5 (4.3%) | 0 (0.0%) |
| Total | 1,828 (76.3%) | 108 (5.9%) |
Employment Status by Educational Attainment in Kenhorst borough
According to labor force statistics for Kenhorst borough, 86.7% of individuals (1,532) out of the total population between 25 and 64 years of age (1,767) are in the labor force, with 3.0% or 46 of them being unemployed. The group with the highest labor force participation rate are those with the educational attainment of bachelor's degree or higher, with 93.1% or 402 individuals in the labor force. Within the labor force, individuals with bachelor's degree or higher education have the highest percentage of unemployment, with 4.5% or 18 of them being unemployed.
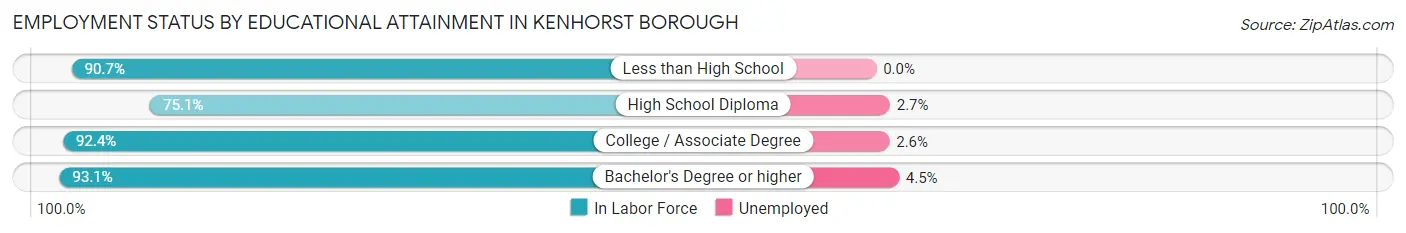
| Educational Attainment | In Labor Force | Unemployed |
| Less than High School | 78 (90.7%) | 0 (0.0%) |
| High School Diploma | 444 (75.1%) | 16 (2.7%) |
| College / Associate Degree | 608 (92.4%) | 17 (2.6%) |
| Bachelor's Degree or higher | 402 (93.1%) | 19 (4.5%) |
| Total | 1,532 (86.7%) | 53 (3.0%) |
Employment Occupations by Sex in Kenhorst borough
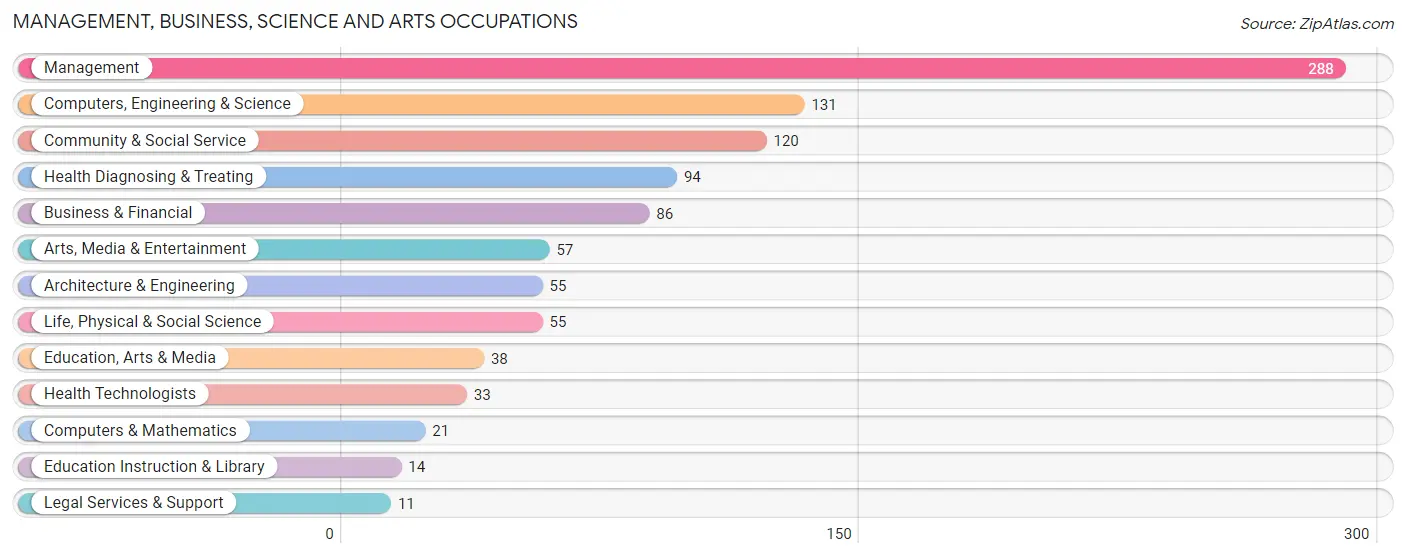
Management, Business, Science and Arts Occupations
The most common Management, Business, Science and Arts occupations in Kenhorst borough are Management (288 | 16.7%), Computers, Engineering & Science (131 | 7.6%), Community & Social Service (120 | 7.0%), Health Diagnosing & Treating (94 | 5.5%), and Business & Financial (86 | 5.0%).
Management, Business, Science and Arts Occupations by Sex
Within the Management, Business, Science and Arts occupations in Kenhorst borough, the most male-oriented occupations are Arts, Media & Entertainment (100.0%), Architecture & Engineering (94.6%), and Community & Social Service (82.5%), while the most female-oriented occupations are Life, Physical & Social Science (100.0%), Health Diagnosing & Treating (100.0%), and Health Technologists (100.0%).
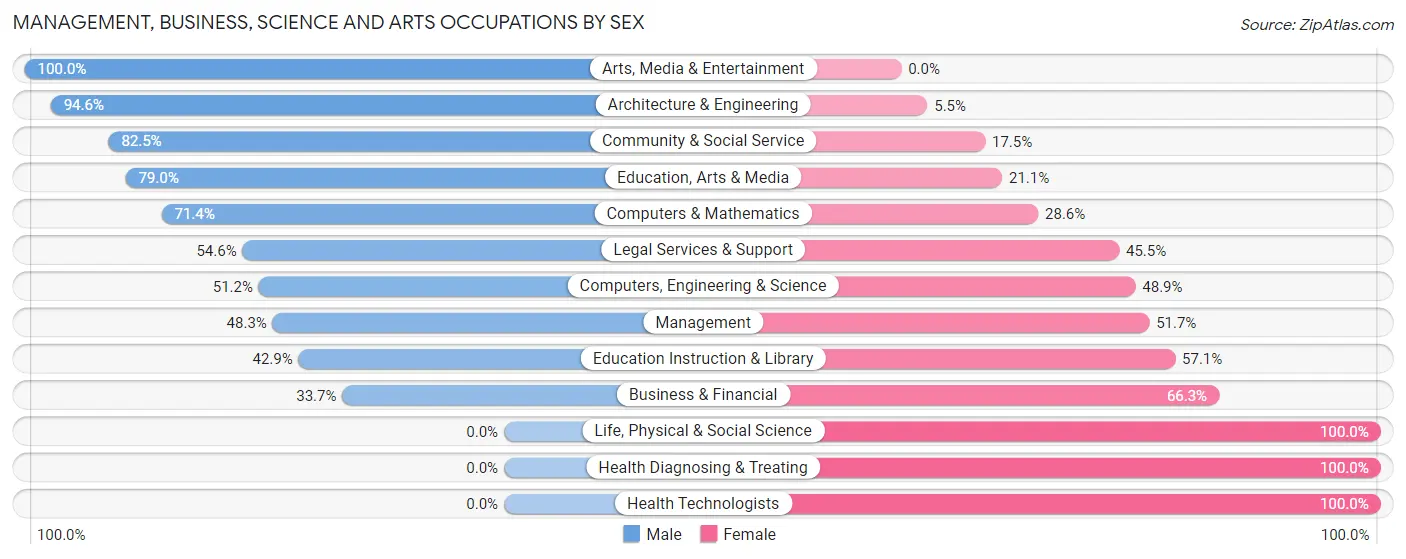
| Occupation | Male | Female |
| Management | 139 (48.3%) | 149 (51.7%) |
| Business & Financial | 29 (33.7%) | 57 (66.3%) |
| Computers, Engineering & Science | 67 (51.1%) | 64 (48.8%) |
| Computers & Mathematics | 15 (71.4%) | 6 (28.6%) |
| Architecture & Engineering | 52 (94.6%) | 3 (5.4%) |
| Life, Physical & Social Science | 0 (0.0%) | 55 (100.0%) |
| Community & Social Service | 99 (82.5%) | 21 (17.5%) |
| Education, Arts & Media | 30 (78.9%) | 8 (21.0%) |
| Legal Services & Support | 6 (54.5%) | 5 (45.5%) |
| Education Instruction & Library | 6 (42.9%) | 8 (57.1%) |
| Arts, Media & Entertainment | 57 (100.0%) | 0 (0.0%) |
| Health Diagnosing & Treating | 0 (0.0%) | 94 (100.0%) |
| Health Technologists | 0 (0.0%) | 33 (100.0%) |
| Total (Category) | 334 (46.5%) | 385 (53.5%) |
| Total (Overall) | 970 (56.4%) | 751 (43.6%) |
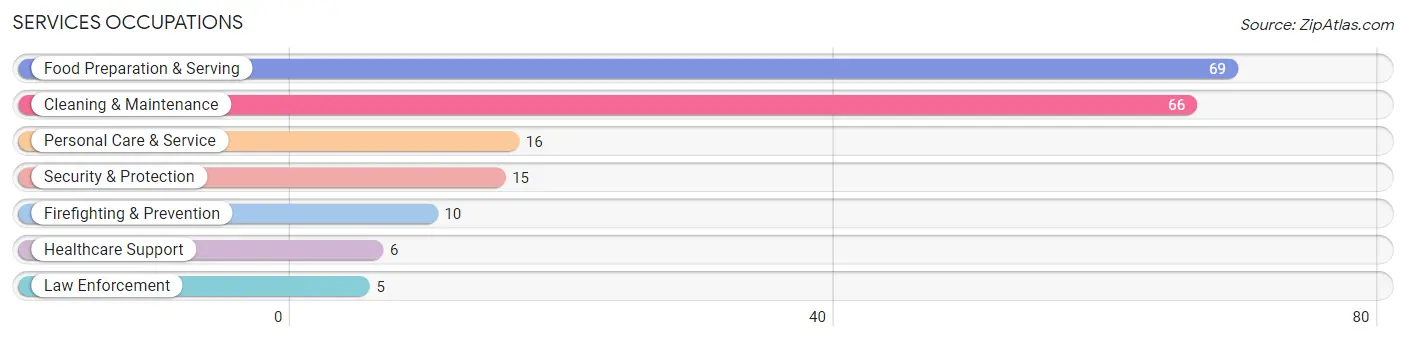
Services Occupations
The most common Services occupations in Kenhorst borough are Food Preparation & Serving (69 | 4.0%), Cleaning & Maintenance (66 | 3.8%), Personal Care & Service (16 | 0.9%), Security & Protection (15 | 0.9%), and Firefighting & Prevention (10 | 0.6%).
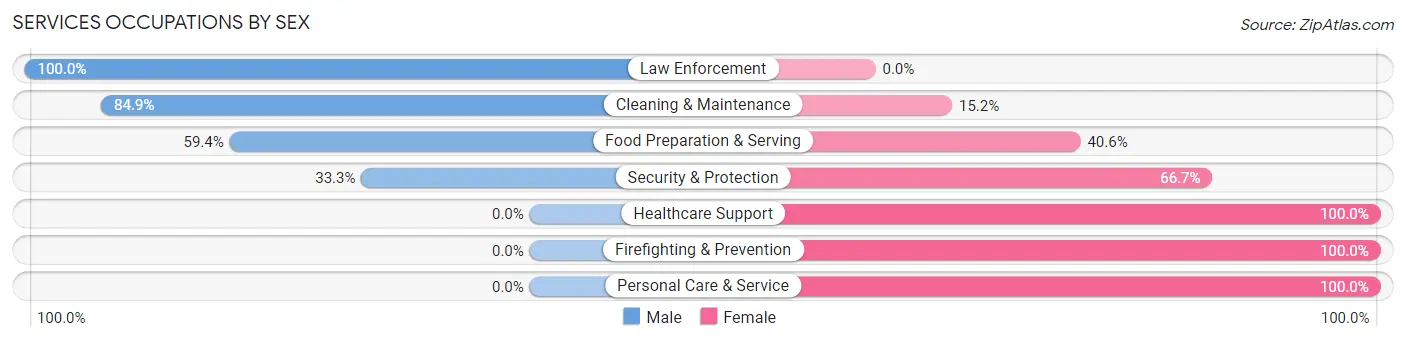
Services Occupations by Sex
Within the Services occupations in Kenhorst borough, the most male-oriented occupations are Law Enforcement (100.0%), Cleaning & Maintenance (84.9%), and Food Preparation & Serving (59.4%), while the most female-oriented occupations are Healthcare Support (100.0%), Firefighting & Prevention (100.0%), and Personal Care & Service (100.0%).
| Occupation | Male | Female |
| Healthcare Support | 0 (0.0%) | 6 (100.0%) |
| Security & Protection | 5 (33.3%) | 10 (66.7%) |
| Firefighting & Prevention | 0 (0.0%) | 10 (100.0%) |
| Law Enforcement | 5 (100.0%) | 0 (0.0%) |
| Food Preparation & Serving | 41 (59.4%) | 28 (40.6%) |
| Cleaning & Maintenance | 56 (84.9%) | 10 (15.1%) |
| Personal Care & Service | 0 (0.0%) | 16 (100.0%) |
| Total (Category) | 102 (59.3%) | 70 (40.7%) |
| Total (Overall) | 970 (56.4%) | 751 (43.6%) |
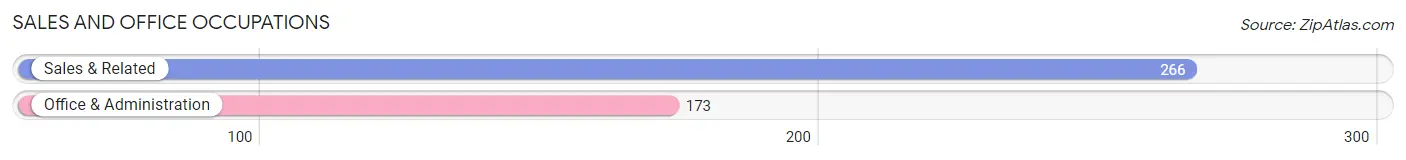
Sales and Office Occupations
The most common Sales and Office occupations in Kenhorst borough are Sales & Related (266 | 15.5%), and Office & Administration (173 | 10.1%).
Sales and Office Occupations by Sex
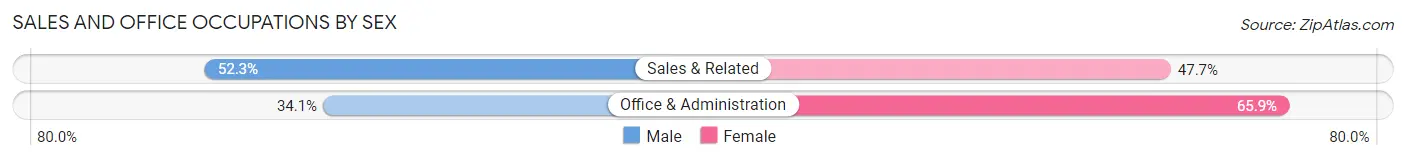
| Occupation | Male | Female |
| Sales & Related | 139 (52.3%) | 127 (47.7%) |
| Office & Administration | 59 (34.1%) | 114 (65.9%) |
| Total (Category) | 198 (45.1%) | 241 (54.9%) |
| Total (Overall) | 970 (56.4%) | 751 (43.6%) |
Natural Resources, Construction and Maintenance Occupations
The most common Natural Resources, Construction and Maintenance occupations in Kenhorst borough are Installation, Maintenance & Repair (84 | 4.9%), Construction & Extraction (56 | 3.3%), and Farming, Fishing & Forestry (11 | 0.6%).
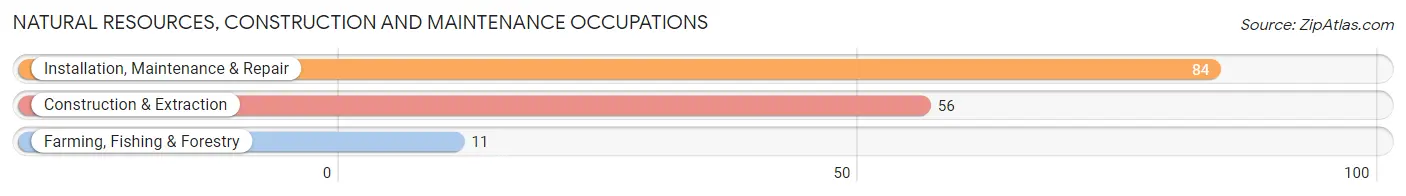
Natural Resources, Construction and Maintenance Occupations by Sex
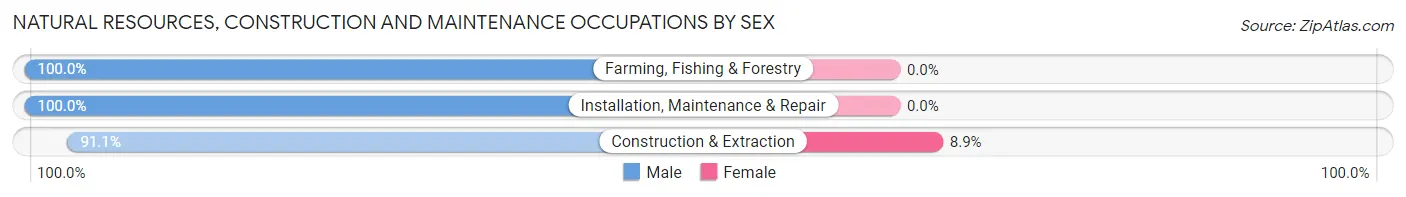
| Occupation | Male | Female |
| Farming, Fishing & Forestry | 11 (100.0%) | 0 (0.0%) |
| Construction & Extraction | 51 (91.1%) | 5 (8.9%) |
| Installation, Maintenance & Repair | 84 (100.0%) | 0 (0.0%) |
| Total (Category) | 146 (96.7%) | 5 (3.3%) |
| Total (Overall) | 970 (56.4%) | 751 (43.6%) |
Production, Transportation and Moving Occupations
The most common Production, Transportation and Moving occupations in Kenhorst borough are Production (114 | 6.6%), Material Moving (66 | 3.8%), and Transportation (60 | 3.5%).
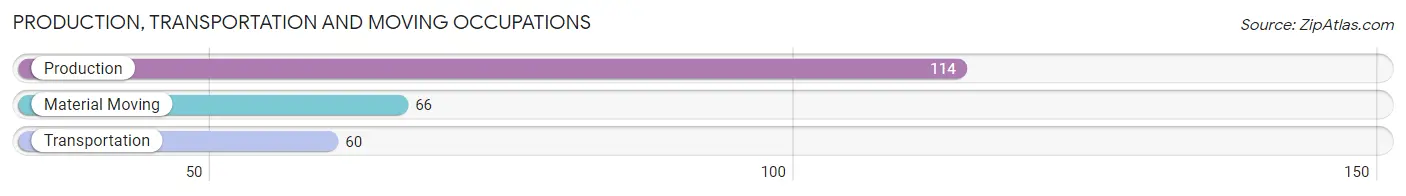
Production, Transportation and Moving Occupations by Sex
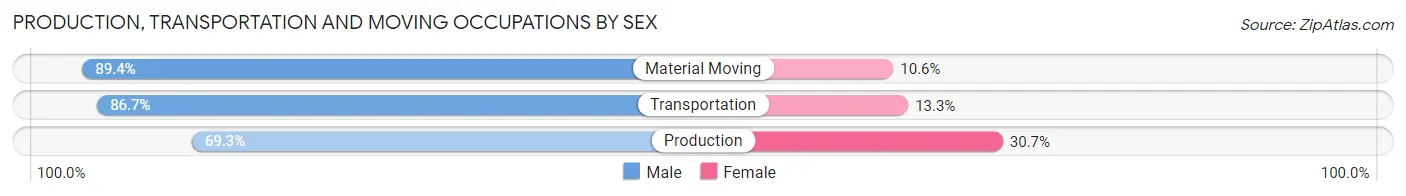
| Occupation | Male | Female |
| Production | 79 (69.3%) | 35 (30.7%) |
| Transportation | 52 (86.7%) | 8 (13.3%) |
| Material Moving | 59 (89.4%) | 7 (10.6%) |
| Total (Category) | 190 (79.2%) | 50 (20.8%) |
| Total (Overall) | 970 (56.4%) | 751 (43.6%) |
Employment Industries by Sex in Kenhorst borough
Employment Industries in Kenhorst borough
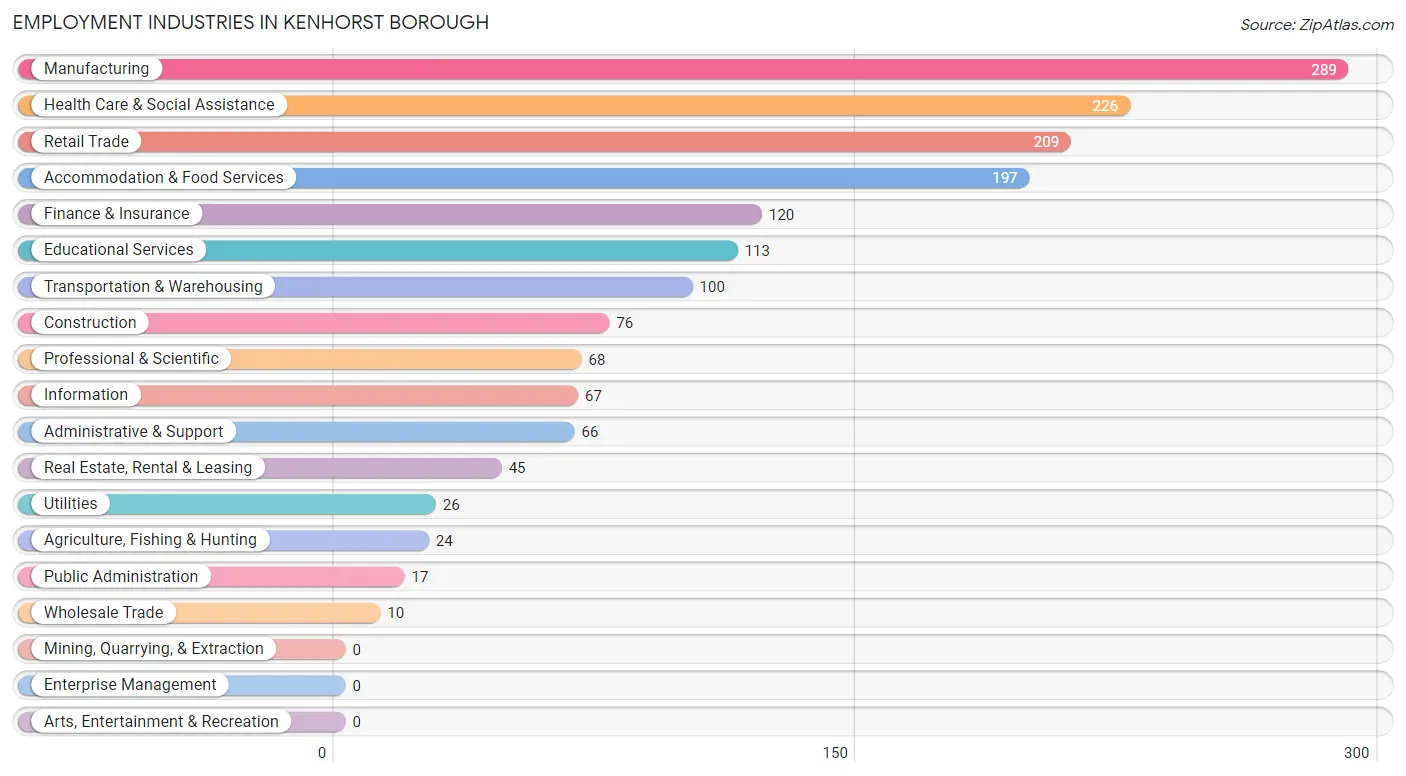
The major employment industries in Kenhorst borough include Manufacturing (289 | 16.8%), Health Care & Social Assistance (226 | 13.1%), Retail Trade (209 | 12.1%), Accommodation & Food Services (197 | 11.5%), and Finance & Insurance (120 | 7.0%).
Employment Industries by Sex in Kenhorst borough
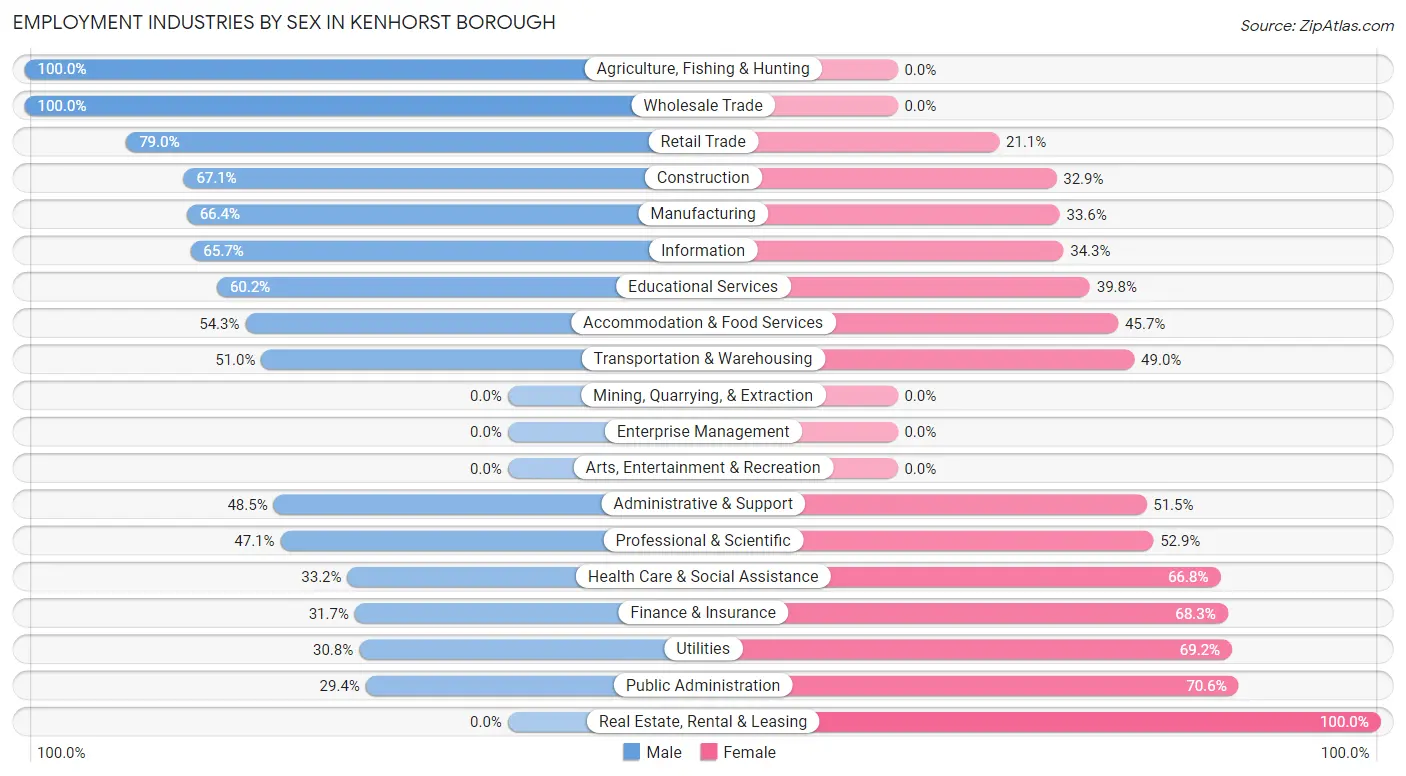
The Kenhorst borough industries that see more men than women are Agriculture, Fishing & Hunting (100.0%), Wholesale Trade (100.0%), and Retail Trade (78.9%), whereas the industries that tend to have a higher number of women are Real Estate, Rental & Leasing (100.0%), Public Administration (70.6%), and Utilities (69.2%).
| Industry | Male | Female |
| Agriculture, Fishing & Hunting | 24 (100.0%) | 0 (0.0%) |
| Mining, Quarrying, & Extraction | 0 (0.0%) | 0 (0.0%) |
| Construction | 51 (67.1%) | 25 (32.9%) |
| Manufacturing | 192 (66.4%) | 97 (33.6%) |
| Wholesale Trade | 10 (100.0%) | 0 (0.0%) |
| Retail Trade | 165 (78.9%) | 44 (21.0%) |
| Transportation & Warehousing | 51 (51.0%) | 49 (49.0%) |
| Utilities | 8 (30.8%) | 18 (69.2%) |
| Information | 44 (65.7%) | 23 (34.3%) |
| Finance & Insurance | 38 (31.7%) | 82 (68.3%) |
| Real Estate, Rental & Leasing | 0 (0.0%) | 45 (100.0%) |
| Professional & Scientific | 32 (47.1%) | 36 (52.9%) |
| Enterprise Management | 0 (0.0%) | 0 (0.0%) |
| Administrative & Support | 32 (48.5%) | 34 (51.5%) |
| Educational Services | 68 (60.2%) | 45 (39.8%) |
| Health Care & Social Assistance | 75 (33.2%) | 151 (66.8%) |
| Arts, Entertainment & Recreation | 0 (0.0%) | 0 (0.0%) |
| Accommodation & Food Services | 107 (54.3%) | 90 (45.7%) |
| Public Administration | 5 (29.4%) | 12 (70.6%) |
| Total | 970 (56.4%) | 751 (43.6%) |
Education in Kenhorst borough
School Enrollment in Kenhorst borough
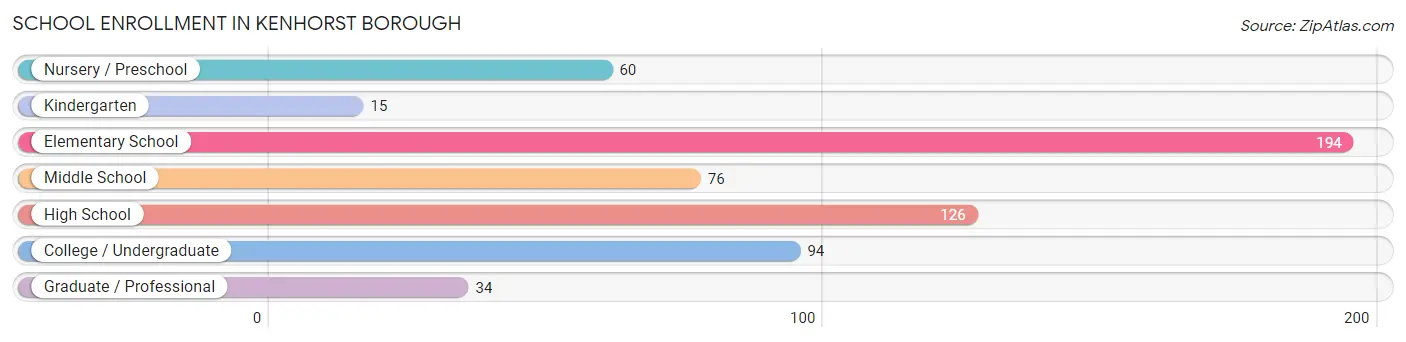
The most common levels of schooling among the 599 students in Kenhorst borough are elementary school (194 | 32.4%), high school (126 | 21.0%), and college / undergraduate (94 | 15.7%).
| School Level | # Students | % Students |
| Nursery / Preschool | 60 | 10.0% |
| Kindergarten | 15 | 2.5% |
| Elementary School | 194 | 32.4% |
| Middle School | 76 | 12.7% |
| High School | 126 | 21.0% |
| College / Undergraduate | 94 | 15.7% |
| Graduate / Professional | 34 | 5.7% |
| Total | 599 | 100.0% |
School Enrollment by Age by Funding Source in Kenhorst borough
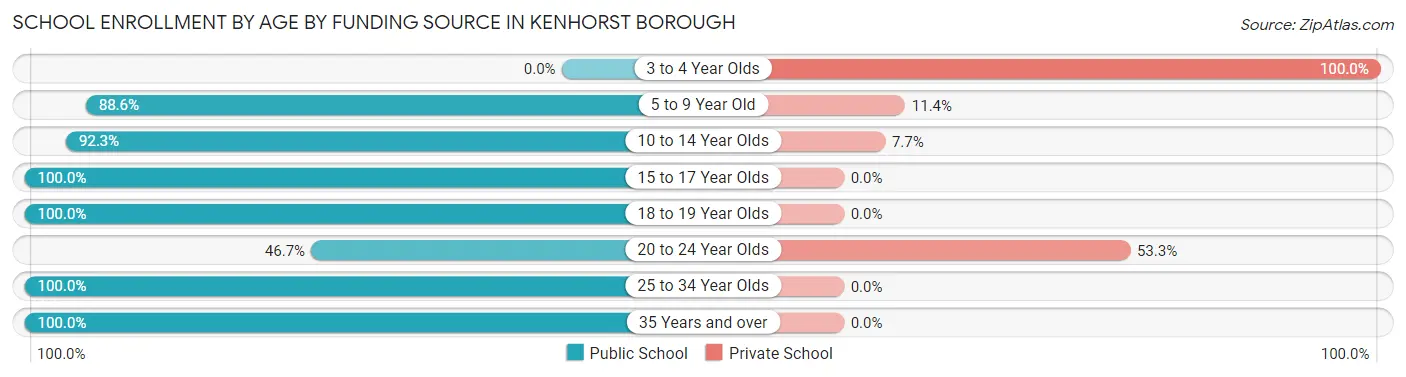
Out of a total of 599 students who are enrolled in schools in Kenhorst borough, 91 (15.2%) attend a private institution, while the remaining 508 (84.8%) are enrolled in public schools. The age group of 3 to 4 year olds has the highest likelihood of being enrolled in private schools, with 34 (100.0% in the age bracket) enrolled. Conversely, the age group of 15 to 17 year olds has the lowest likelihood of being enrolled in a private school, with 85 (100.0% in the age bracket) attending a public institution.
| Age Bracket | Public School | Private School |
| 3 to 4 Year Olds | 0 (0.0%) | 34 (100.0%) |
| 5 to 9 Year Old | 202 (88.6%) | 26 (11.4%) |
| 10 to 14 Year Olds | 84 (92.3%) | 7 (7.7%) |
| 15 to 17 Year Olds | 85 (100.0%) | 0 (0.0%) |
| 18 to 19 Year Olds | 33 (100.0%) | 0 (0.0%) |
| 20 to 24 Year Olds | 21 (46.7%) | 24 (53.3%) |
| 25 to 34 Year Olds | 74 (100.0%) | 0 (0.0%) |
| 35 Years and over | 9 (100.0%) | 0 (0.0%) |
| Total | 508 (84.8%) | 91 (15.2%) |
Educational Attainment by Field of Study in Kenhorst borough
Bio, nature & agricultural (152 | 27.5%), education (82 | 14.8%), science & technology (78 | 14.1%), business (70 | 12.7%), and arts & humanities (36 | 6.5%) are the most common fields of study among 553 individuals in Kenhorst borough who have obtained a bachelor's degree or higher.
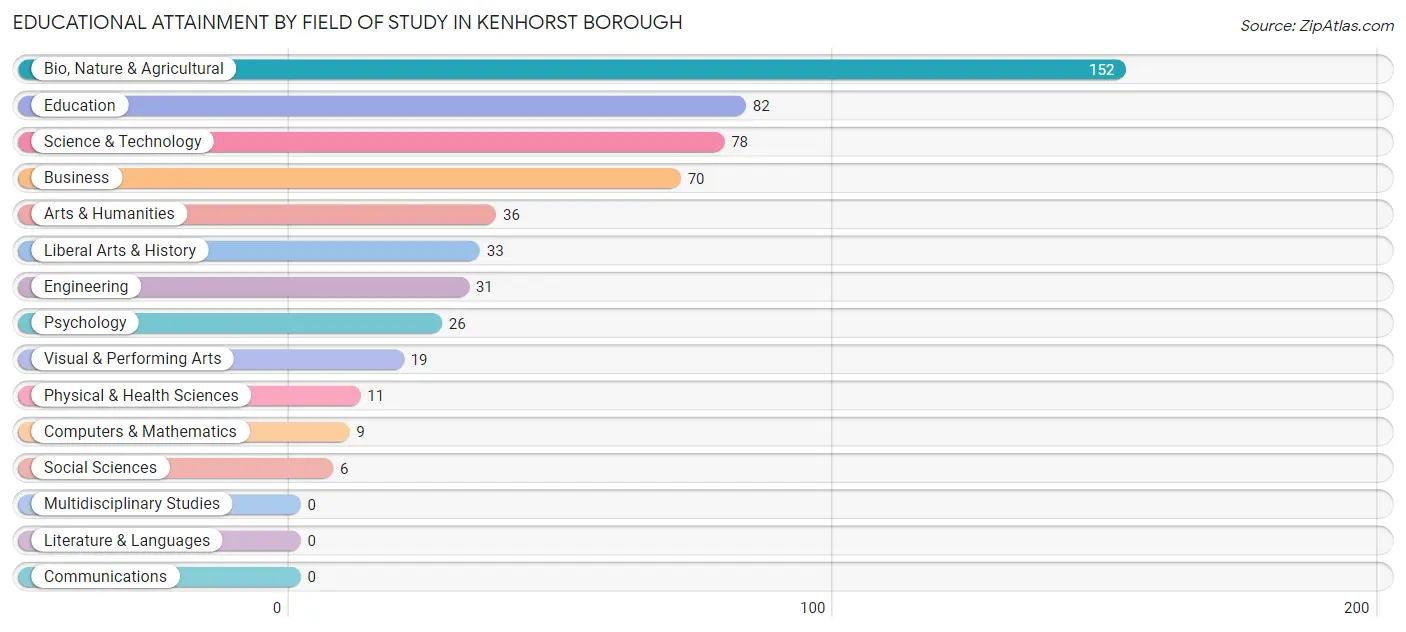
| Field of Study | # Graduates | % Graduates |
| Computers & Mathematics | 9 | 1.6% |
| Bio, Nature & Agricultural | 152 | 27.5% |
| Physical & Health Sciences | 11 | 2.0% |
| Psychology | 26 | 4.7% |
| Social Sciences | 6 | 1.1% |
| Engineering | 31 | 5.6% |
| Multidisciplinary Studies | 0 | 0.0% |
| Science & Technology | 78 | 14.1% |
| Business | 70 | 12.7% |
| Education | 82 | 14.8% |
| Literature & Languages | 0 | 0.0% |
| Liberal Arts & History | 33 | 6.0% |
| Visual & Performing Arts | 19 | 3.4% |
| Communications | 0 | 0.0% |
| Arts & Humanities | 36 | 6.5% |
| Total | 553 | 100.0% |
Transportation & Commute in Kenhorst borough
Vehicle Availability by Sex in Kenhorst borough
The most prevalent vehicle ownership categories in Kenhorst borough are males with 2 vehicles (514, accounting for 56.6%) and females with 2 vehicles (419, making up 70.0%).
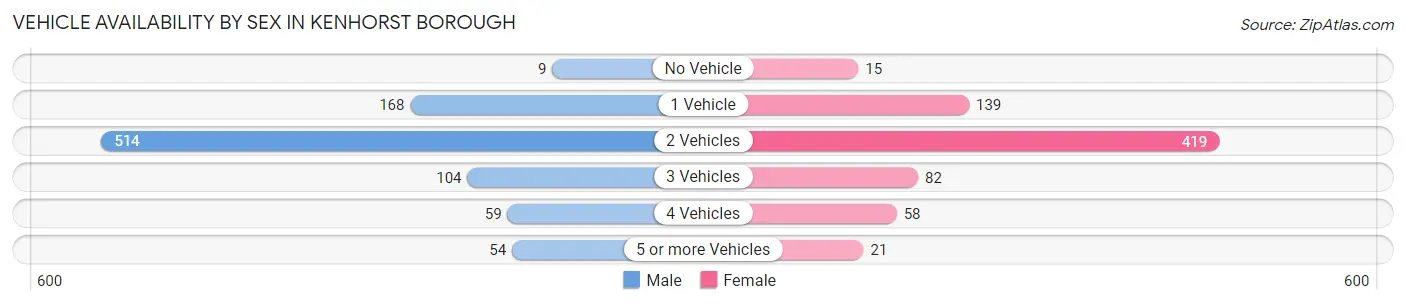
| Vehicles Available | Male | Female |
| No Vehicle | 9 (1.0%) | 15 (2.0%) |
| 1 Vehicle | 168 (18.5%) | 139 (18.9%) |
| 2 Vehicles | 514 (56.6%) | 419 (57.1%) |
| 3 Vehicles | 104 (11.5%) | 82 (11.2%) |
| 4 Vehicles | 59 (6.5%) | 58 (7.9%) |
| 5 or more Vehicles | 54 (5.9%) | 21 (2.9%) |
| Total | 908 (100.0%) | 734 (100.0%) |
Commute Time in Kenhorst borough
The most frequently occuring commute durations in Kenhorst borough are 10 to 14 minutes (362 commuters, 25.7%), 15 to 19 minutes (280 commuters, 19.9%), and 5 to 9 minutes (150 commuters, 10.6%).
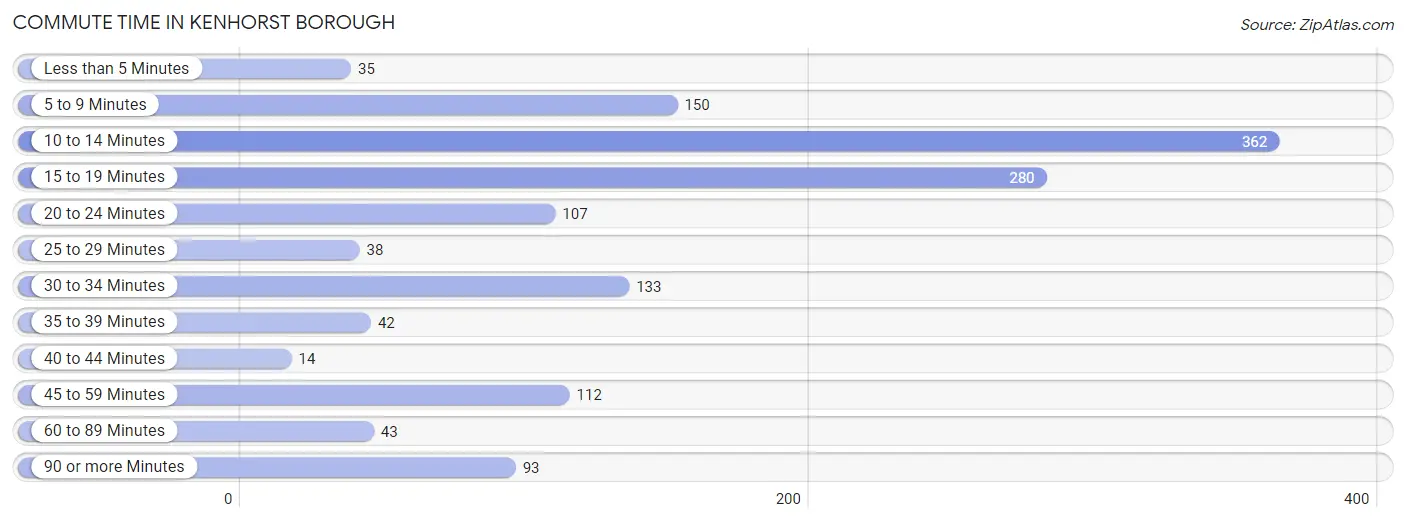
| Commute Time | # Commuters | % Commuters |
| Less than 5 Minutes | 35 | 2.5% |
| 5 to 9 Minutes | 150 | 10.6% |
| 10 to 14 Minutes | 362 | 25.7% |
| 15 to 19 Minutes | 280 | 19.9% |
| 20 to 24 Minutes | 107 | 7.6% |
| 25 to 29 Minutes | 38 | 2.7% |
| 30 to 34 Minutes | 133 | 9.4% |
| 35 to 39 Minutes | 42 | 3.0% |
| 40 to 44 Minutes | 14 | 1.0% |
| 45 to 59 Minutes | 112 | 8.0% |
| 60 to 89 Minutes | 43 | 3.0% |
| 90 or more Minutes | 93 | 6.6% |
Commute Time by Sex in Kenhorst borough
The most common commute times in Kenhorst borough are 10 to 14 minutes (273 commuters, 32.8%) for males and 15 to 19 minutes (155 commuters, 26.9%) for females.
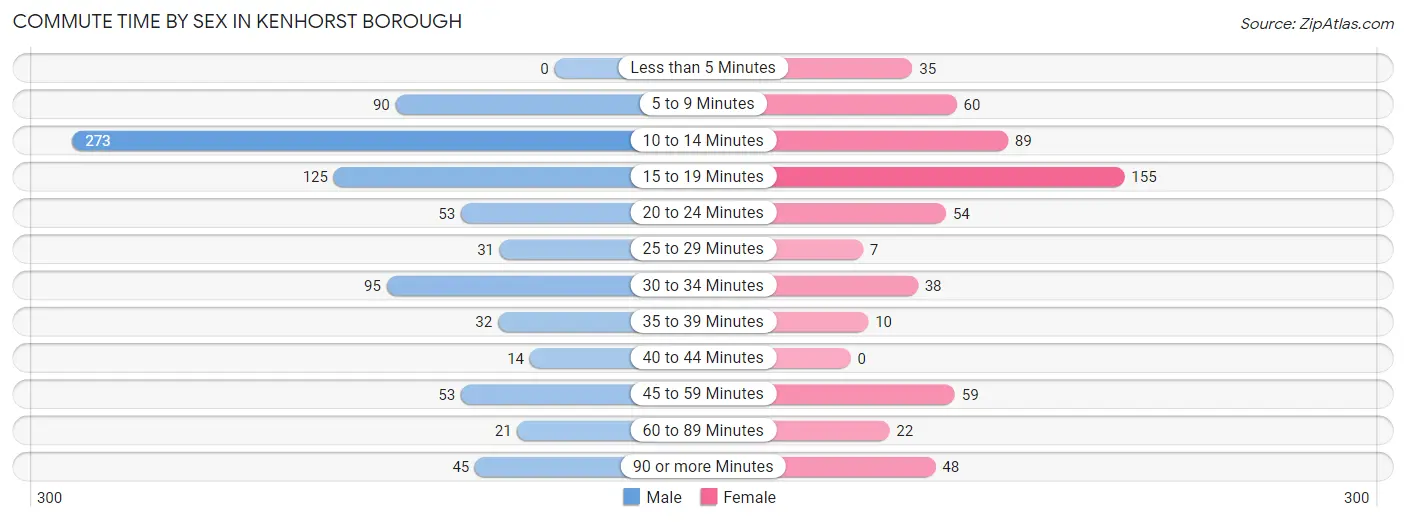
| Commute Time | Male | Female |
| Less than 5 Minutes | 0 (0.0%) | 35 (6.1%) |
| 5 to 9 Minutes | 90 (10.8%) | 60 (10.4%) |
| 10 to 14 Minutes | 273 (32.8%) | 89 (15.4%) |
| 15 to 19 Minutes | 125 (15.0%) | 155 (26.9%) |
| 20 to 24 Minutes | 53 (6.4%) | 54 (9.4%) |
| 25 to 29 Minutes | 31 (3.7%) | 7 (1.2%) |
| 30 to 34 Minutes | 95 (11.4%) | 38 (6.6%) |
| 35 to 39 Minutes | 32 (3.8%) | 10 (1.7%) |
| 40 to 44 Minutes | 14 (1.7%) | 0 (0.0%) |
| 45 to 59 Minutes | 53 (6.4%) | 59 (10.2%) |
| 60 to 89 Minutes | 21 (2.5%) | 22 (3.8%) |
| 90 or more Minutes | 45 (5.4%) | 48 (8.3%) |
Time of Departure to Work by Sex in Kenhorst borough
The most frequent times of departure to work in Kenhorst borough are 12:00 PM to 3:59 PM (167, 20.1%) for males and 7:00 AM to 7:29 AM (98, 17.0%) for females.
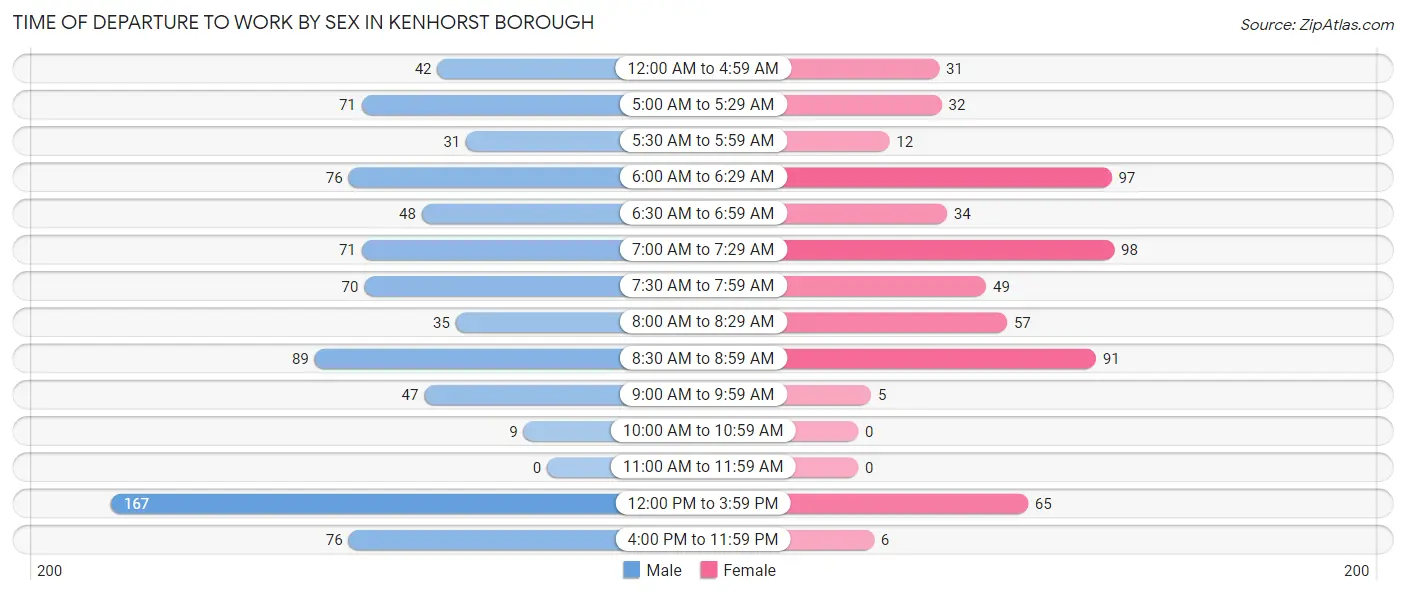
| Time of Departure | Male | Female |
| 12:00 AM to 4:59 AM | 42 (5.1%) | 31 (5.4%) |
| 5:00 AM to 5:29 AM | 71 (8.5%) | 32 (5.6%) |
| 5:30 AM to 5:59 AM | 31 (3.7%) | 12 (2.1%) |
| 6:00 AM to 6:29 AM | 76 (9.1%) | 97 (16.8%) |
| 6:30 AM to 6:59 AM | 48 (5.8%) | 34 (5.9%) |
| 7:00 AM to 7:29 AM | 71 (8.5%) | 98 (17.0%) |
| 7:30 AM to 7:59 AM | 70 (8.4%) | 49 (8.5%) |
| 8:00 AM to 8:29 AM | 35 (4.2%) | 57 (9.9%) |
| 8:30 AM to 8:59 AM | 89 (10.7%) | 91 (15.8%) |
| 9:00 AM to 9:59 AM | 47 (5.7%) | 5 (0.9%) |
| 10:00 AM to 10:59 AM | 9 (1.1%) | 0 (0.0%) |
| 11:00 AM to 11:59 AM | 0 (0.0%) | 0 (0.0%) |
| 12:00 PM to 3:59 PM | 167 (20.1%) | 65 (11.3%) |
| 4:00 PM to 11:59 PM | 76 (9.1%) | 6 (1.0%) |
| Total | 832 (100.0%) | 577 (100.0%) |
Housing Occupancy in Kenhorst borough
Occupancy by Ownership in Kenhorst borough
Of the total 1,204 dwellings in Kenhorst borough, owner-occupied units account for 952 (79.1%), while renter-occupied units make up 252 (20.9%).
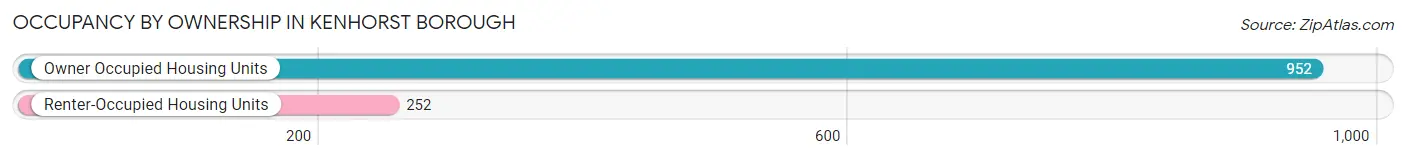
| Occupancy | # Housing Units | % Housing Units |
| Owner Occupied Housing Units | 952 | 79.1% |
| Renter-Occupied Housing Units | 252 | 20.9% |
| Total Occupied Housing Units | 1,204 | 100.0% |
Occupancy by Household Size in Kenhorst borough
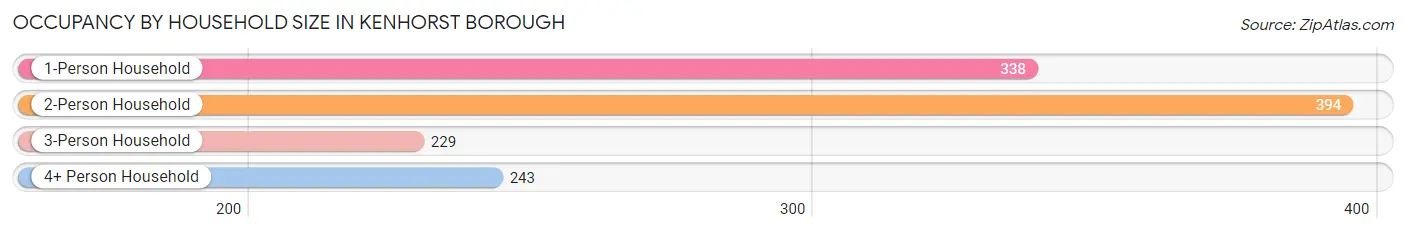
| Household Size | # Housing Units | % Housing Units |
| 1-Person Household | 338 | 28.1% |
| 2-Person Household | 394 | 32.7% |
| 3-Person Household | 229 | 19.0% |
| 4+ Person Household | 243 | 20.2% |
| Total Housing Units | 1,204 | 100.0% |
Occupancy by Ownership by Household Size in Kenhorst borough
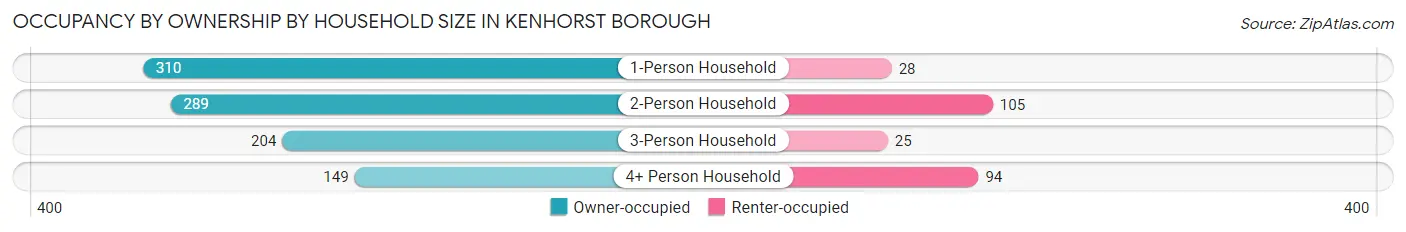
| Household Size | Owner-occupied | Renter-occupied |
| 1-Person Household | 310 (91.7%) | 28 (8.3%) |
| 2-Person Household | 289 (73.4%) | 105 (26.7%) |
| 3-Person Household | 204 (89.1%) | 25 (10.9%) |
| 4+ Person Household | 149 (61.3%) | 94 (38.7%) |
| Total Housing Units | 952 (79.1%) | 252 (20.9%) |
Occupancy by Educational Attainment in Kenhorst borough
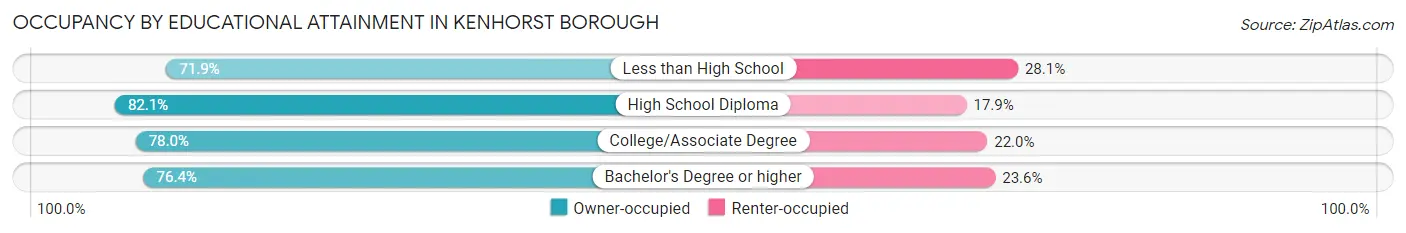
| Household Size | Owner-occupied | Renter-occupied |
| Less than High School | 23 (71.9%) | 9 (28.1%) |
| High School Diploma | 394 (82.1%) | 86 (17.9%) |
| College/Associate Degree | 315 (78.0%) | 89 (22.0%) |
| Bachelor's Degree or higher | 220 (76.4%) | 68 (23.6%) |
Occupancy by Age of Householder in Kenhorst borough
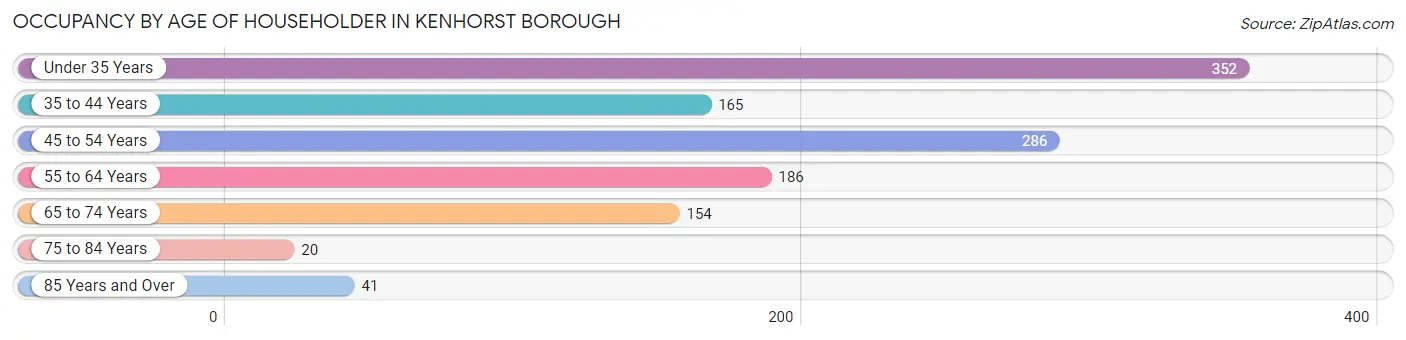
| Age Bracket | # Households | % Households |
| Under 35 Years | 352 | 29.2% |
| 35 to 44 Years | 165 | 13.7% |
| 45 to 54 Years | 286 | 23.7% |
| 55 to 64 Years | 186 | 15.4% |
| 65 to 74 Years | 154 | 12.8% |
| 75 to 84 Years | 20 | 1.7% |
| 85 Years and Over | 41 | 3.4% |
| Total | 1,204 | 100.0% |
Housing Finances in Kenhorst borough
Median Income by Occupancy in Kenhorst borough
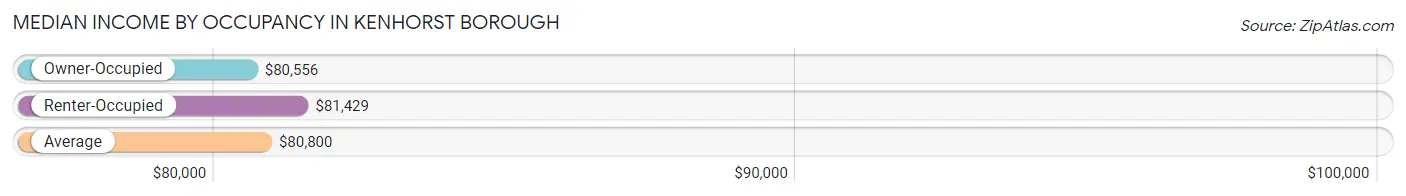
| Occupancy Type | # Households | Median Income |
| Owner-Occupied | 952 (79.1%) | $80,556 |
| Renter-Occupied | 252 (20.9%) | $81,429 |
| Average | 1,204 (100.0%) | $80,800 |
Occupancy by Householder Income Bracket in Kenhorst borough
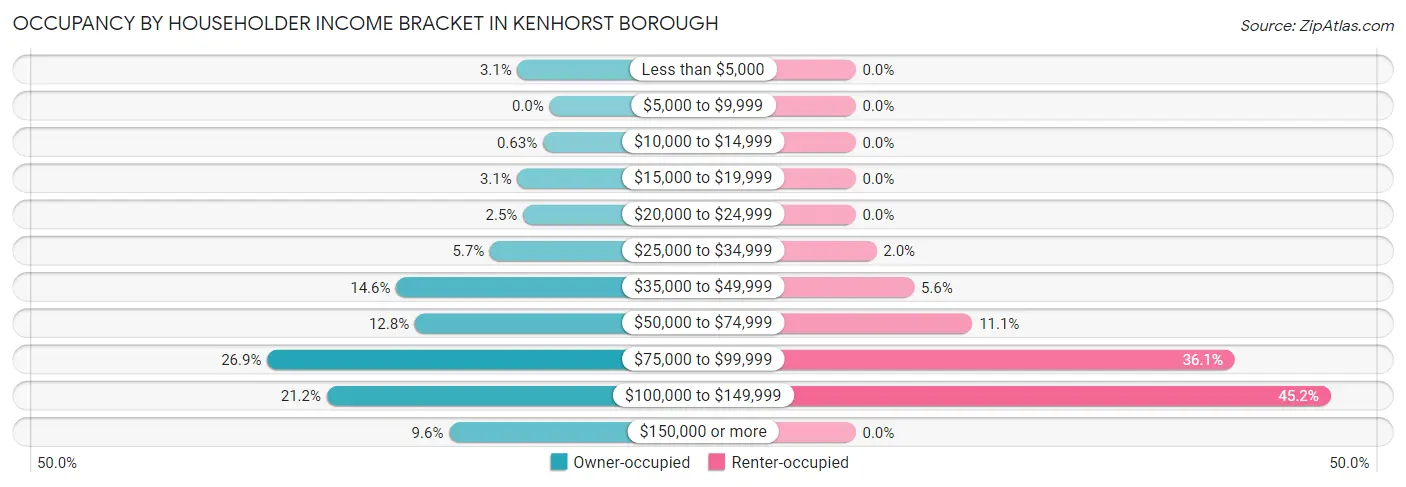
| Income Bracket | Owner-occupied | Renter-occupied |
| Less than $5,000 | 29 (3.0%) | 0 (0.0%) |
| $5,000 to $9,999 | 0 (0.0%) | 0 (0.0%) |
| $10,000 to $14,999 | 6 (0.6%) | 0 (0.0%) |
| $15,000 to $19,999 | 29 (3.0%) | 0 (0.0%) |
| $20,000 to $24,999 | 24 (2.5%) | 0 (0.0%) |
| $25,000 to $34,999 | 54 (5.7%) | 5 (2.0%) |
| $35,000 to $49,999 | 139 (14.6%) | 14 (5.6%) |
| $50,000 to $74,999 | 122 (12.8%) | 28 (11.1%) |
| $75,000 to $99,999 | 256 (26.9%) | 91 (36.1%) |
| $100,000 to $149,999 | 202 (21.2%) | 114 (45.2%) |
| $150,000 or more | 91 (9.6%) | 0 (0.0%) |
| Total | 952 (100.0%) | 252 (100.0%) |
Monthly Housing Cost Tiers in Kenhorst borough
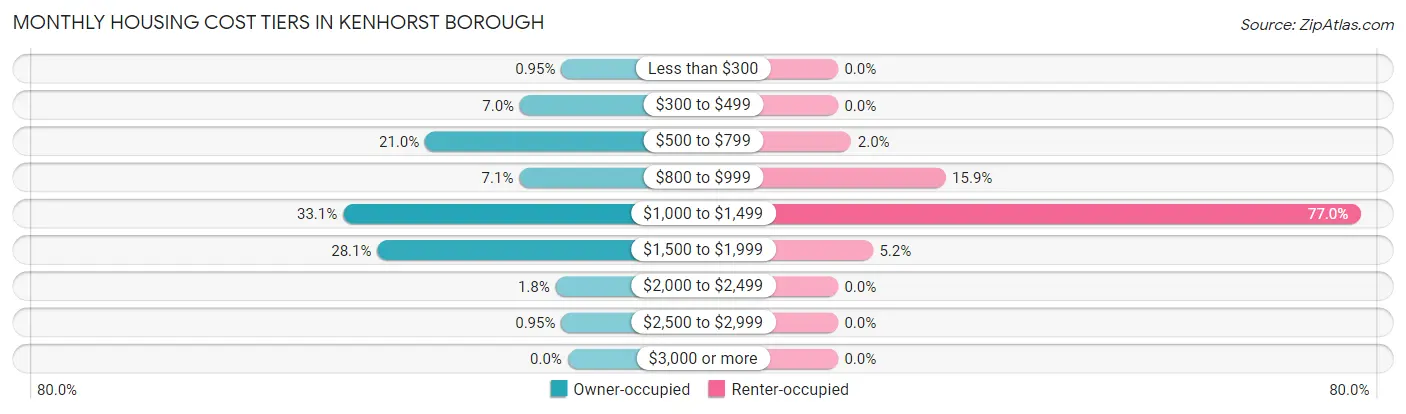
| Monthly Cost | Owner-occupied | Renter-occupied |
| Less than $300 | 9 (0.9%) | 0 (0.0%) |
| $300 to $499 | 67 (7.0%) | 0 (0.0%) |
| $500 to $799 | 200 (21.0%) | 5 (2.0%) |
| $800 to $999 | 68 (7.1%) | 40 (15.9%) |
| $1,000 to $1,499 | 315 (33.1%) | 194 (77.0%) |
| $1,500 to $1,999 | 267 (28.1%) | 13 (5.2%) |
| $2,000 to $2,499 | 17 (1.8%) | 0 (0.0%) |
| $2,500 to $2,999 | 9 (0.9%) | 0 (0.0%) |
| $3,000 or more | 0 (0.0%) | 0 (0.0%) |
| Total | 952 (100.0%) | 252 (100.0%) |
Physical Housing Characteristics in Kenhorst borough
Housing Structures in Kenhorst borough
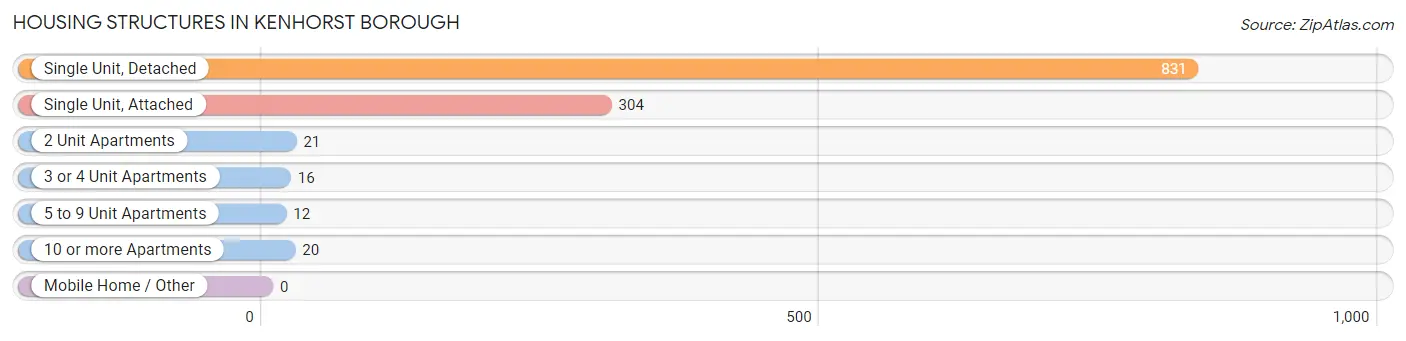
| Structure Type | # Housing Units | % Housing Units |
| Single Unit, Detached | 831 | 69.0% |
| Single Unit, Attached | 304 | 25.3% |
| 2 Unit Apartments | 21 | 1.7% |
| 3 or 4 Unit Apartments | 16 | 1.3% |
| 5 to 9 Unit Apartments | 12 | 1.0% |
| 10 or more Apartments | 20 | 1.7% |
| Mobile Home / Other | 0 | 0.0% |
| Total | 1,204 | 100.0% |
Housing Structures by Occupancy in Kenhorst borough
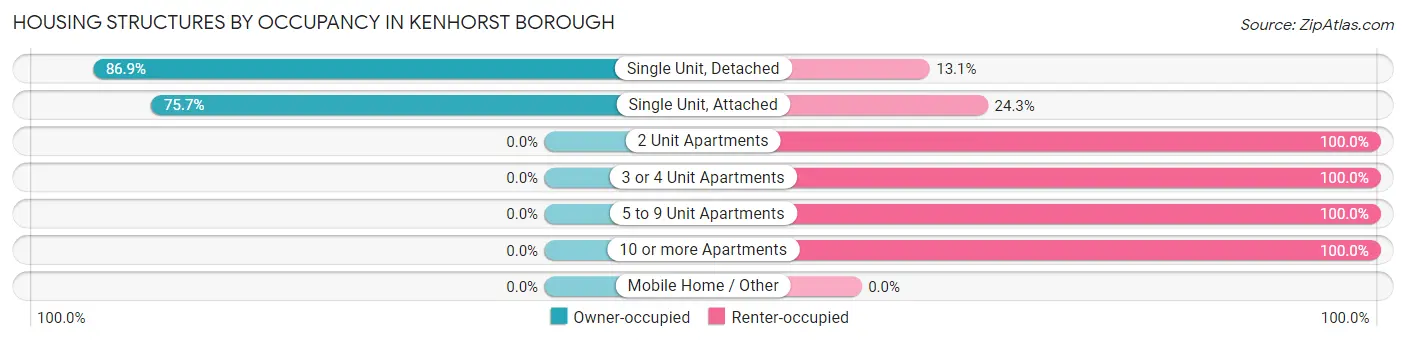
| Structure Type | Owner-occupied | Renter-occupied |
| Single Unit, Detached | 722 (86.9%) | 109 (13.1%) |
| Single Unit, Attached | 230 (75.7%) | 74 (24.3%) |
| 2 Unit Apartments | 0 (0.0%) | 21 (100.0%) |
| 3 or 4 Unit Apartments | 0 (0.0%) | 16 (100.0%) |
| 5 to 9 Unit Apartments | 0 (0.0%) | 12 (100.0%) |
| 10 or more Apartments | 0 (0.0%) | 20 (100.0%) |
| Mobile Home / Other | 0 (0.0%) | 0 (0.0%) |
| Total | 952 (79.1%) | 252 (20.9%) |
Housing Structures by Number of Rooms in Kenhorst borough
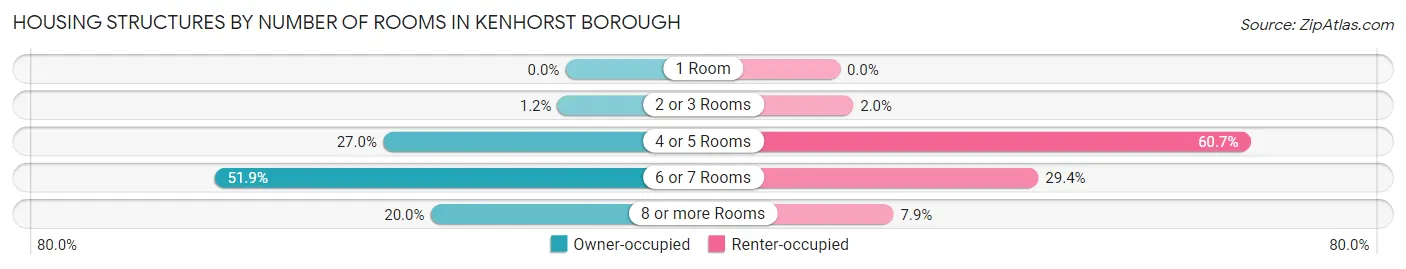
| Number of Rooms | Owner-occupied | Renter-occupied |
| 1 Room | 0 (0.0%) | 0 (0.0%) |
| 2 or 3 Rooms | 11 (1.2%) | 5 (2.0%) |
| 4 or 5 Rooms | 257 (27.0%) | 153 (60.7%) |
| 6 or 7 Rooms | 494 (51.9%) | 74 (29.4%) |
| 8 or more Rooms | 190 (20.0%) | 20 (7.9%) |
| Total | 952 (100.0%) | 252 (100.0%) |
Housing Structure by Heating Type in Kenhorst borough
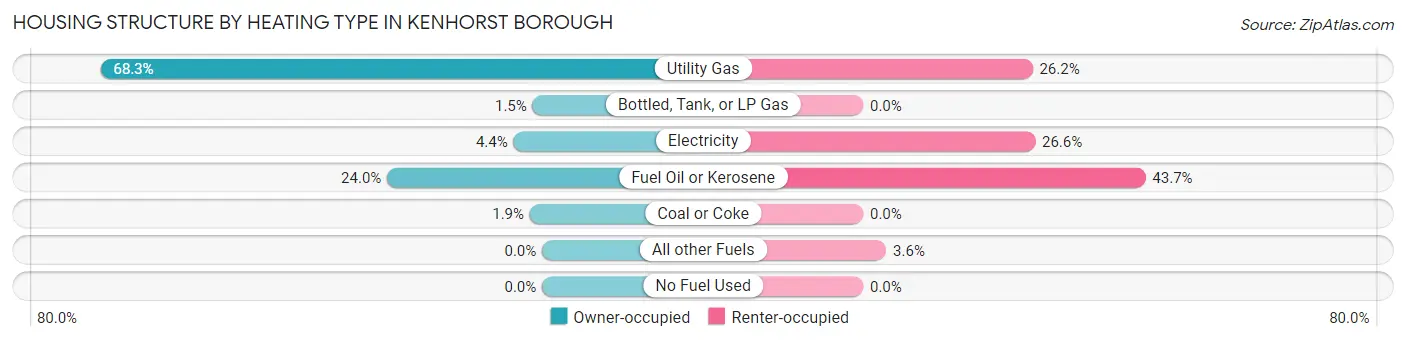
| Heating Type | Owner-occupied | Renter-occupied |
| Utility Gas | 650 (68.3%) | 66 (26.2%) |
| Bottled, Tank, or LP Gas | 14 (1.5%) | 0 (0.0%) |
| Electricity | 42 (4.4%) | 67 (26.6%) |
| Fuel Oil or Kerosene | 228 (23.9%) | 110 (43.6%) |
| Coal or Coke | 18 (1.9%) | 0 (0.0%) |
| All other Fuels | 0 (0.0%) | 9 (3.6%) |
| No Fuel Used | 0 (0.0%) | 0 (0.0%) |
| Total | 952 (100.0%) | 252 (100.0%) |
Household Vehicle Usage in Kenhorst borough
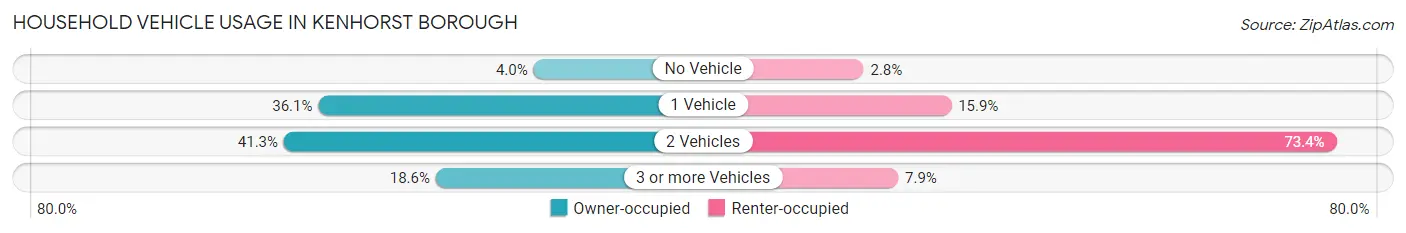
| Vehicles per Household | Owner-occupied | Renter-occupied |
| No Vehicle | 38 (4.0%) | 7 (2.8%) |
| 1 Vehicle | 344 (36.1%) | 40 (15.9%) |
| 2 Vehicles | 393 (41.3%) | 185 (73.4%) |
| 3 or more Vehicles | 177 (18.6%) | 20 (7.9%) |
| Total | 952 (100.0%) | 252 (100.0%) |
Real Estate & Mortgages in Kenhorst borough
Real Estate and Mortgage Overview in Kenhorst borough
| Characteristic | Without Mortgage | With Mortgage |
| Housing Units | 207 | 745 |
| Median Property Value | $151,300 | $166,300 |
| Median Household Income | $67,566 | $82 |
| Monthly Housing Costs | $577 | $0 |
| Real Estate Taxes | $3,698 | $13 |
Property Value by Mortgage Status in Kenhorst borough
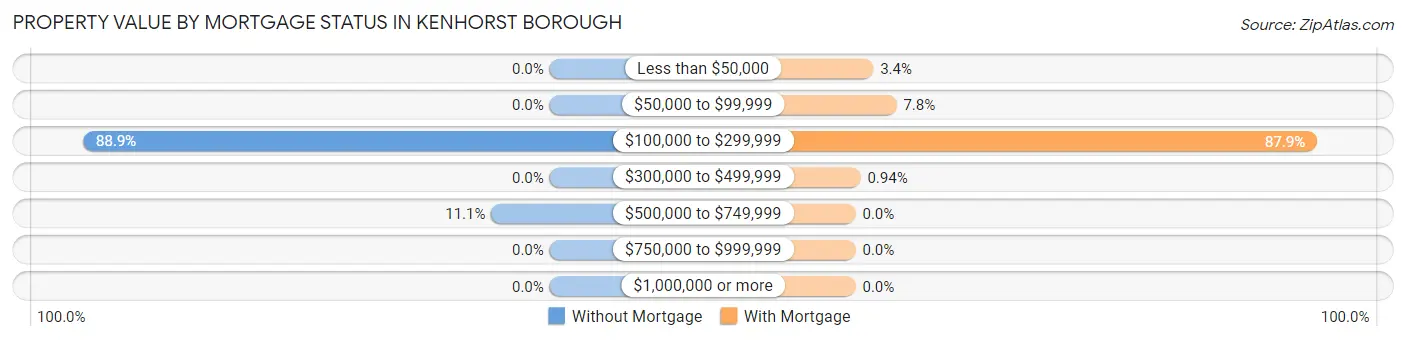
| Property Value | Without Mortgage | With Mortgage |
| Less than $50,000 | 0 (0.0%) | 25 (3.4%) |
| $50,000 to $99,999 | 0 (0.0%) | 58 (7.8%) |
| $100,000 to $299,999 | 184 (88.9%) | 655 (87.9%) |
| $300,000 to $499,999 | 0 (0.0%) | 7 (0.9%) |
| $500,000 to $749,999 | 23 (11.1%) | 0 (0.0%) |
| $750,000 to $999,999 | 0 (0.0%) | 0 (0.0%) |
| $1,000,000 or more | 0 (0.0%) | 0 (0.0%) |
| Total | 207 (100.0%) | 745 (100.0%) |
Household Income by Mortgage Status in Kenhorst borough
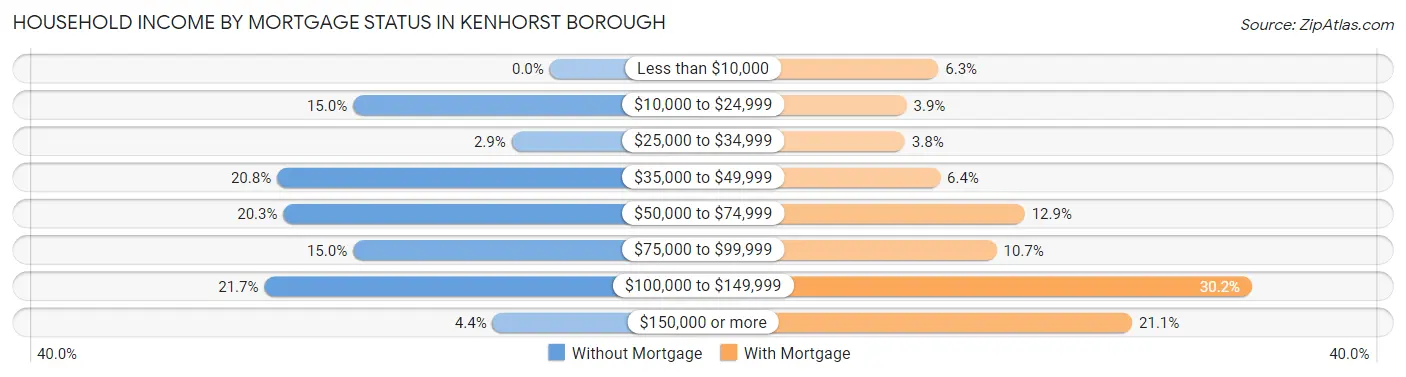
| Household Income | Without Mortgage | With Mortgage |
| Less than $10,000 | 0 (0.0%) | 47 (6.3%) |
| $10,000 to $24,999 | 31 (15.0%) | 29 (3.9%) |
| $25,000 to $34,999 | 6 (2.9%) | 28 (3.8%) |
| $35,000 to $49,999 | 43 (20.8%) | 48 (6.4%) |
| $50,000 to $74,999 | 42 (20.3%) | 96 (12.9%) |
| $75,000 to $99,999 | 31 (15.0%) | 80 (10.7%) |
| $100,000 to $149,999 | 45 (21.7%) | 225 (30.2%) |
| $150,000 or more | 9 (4.3%) | 157 (21.1%) |
| Total | 207 (100.0%) | 745 (100.0%) |
Property Value to Household Income Ratio in Kenhorst borough
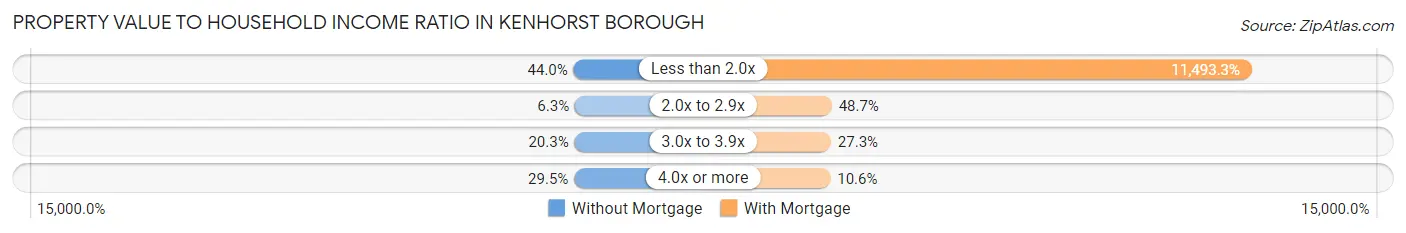
| Value-to-Income Ratio | Without Mortgage | With Mortgage |
| Less than 2.0x | 91 (44.0%) | 85,625 (11,493.3%) |
| 2.0x to 2.9x | 13 (6.3%) | 363 (48.7%) |
| 3.0x to 3.9x | 42 (20.3%) | 203 (27.3%) |
| 4.0x or more | 61 (29.5%) | 79 (10.6%) |
| Total | 207 (100.0%) | 745 (100.0%) |
Real Estate Taxes by Mortgage Status in Kenhorst borough
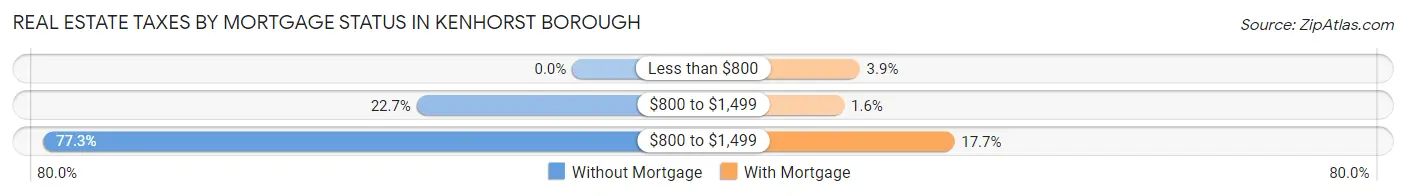
| Property Taxes | Without Mortgage | With Mortgage |
| Less than $800 | 0 (0.0%) | 29 (3.9%) |
| $800 to $1,499 | 47 (22.7%) | 12 (1.6%) |
| $800 to $1,499 | 160 (77.3%) | 132 (17.7%) |
| Total | 207 (100.0%) | 745 (100.0%) |
Health & Disability in Kenhorst borough
Health Insurance Coverage by Age in Kenhorst borough
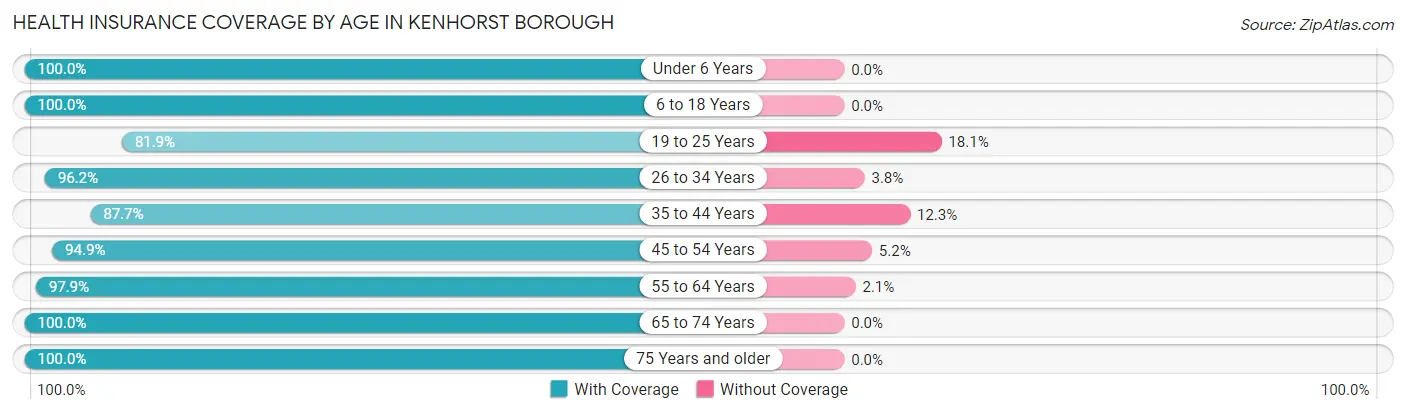
| Age Bracket | With Coverage | Without Coverage |
| Under 6 Years | 259 (100.0%) | 0 (0.0%) |
| 6 to 18 Years | 403 (100.0%) | 0 (0.0%) |
| 19 to 25 Years | 226 (81.9%) | 50 (18.1%) |
| 26 to 34 Years | 636 (96.2%) | 25 (3.8%) |
| 35 to 44 Years | 279 (87.7%) | 39 (12.3%) |
| 45 to 54 Years | 368 (94.9%) | 20 (5.1%) |
| 55 to 64 Years | 327 (97.9%) | 7 (2.1%) |
| 65 to 74 Years | 228 (100.0%) | 0 (0.0%) |
| 75 Years and older | 117 (100.0%) | 0 (0.0%) |
| Total | 2,843 (95.3%) | 141 (4.7%) |
Health Insurance Coverage by Citizenship Status in Kenhorst borough
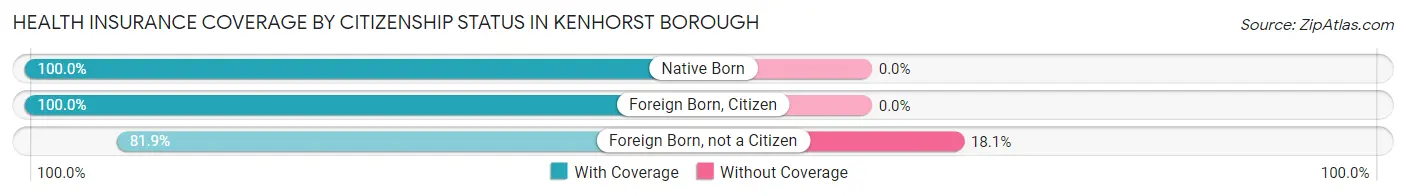
| Citizenship Status | With Coverage | Without Coverage |
| Native Born | 259 (100.0%) | 0 (0.0%) |
| Foreign Born, Citizen | 403 (100.0%) | 0 (0.0%) |
| Foreign Born, not a Citizen | 226 (81.9%) | 50 (18.1%) |
Health Insurance Coverage by Household Income in Kenhorst borough
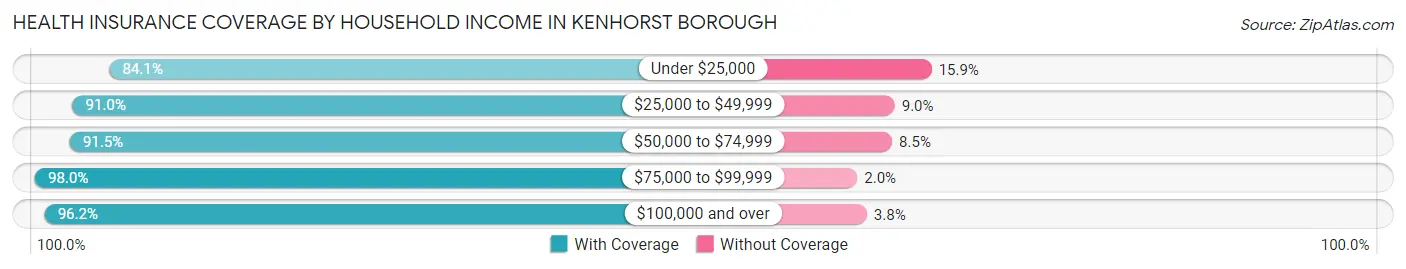
| Household Income | With Coverage | Without Coverage |
| Under $25,000 | 74 (84.1%) | 14 (15.9%) |
| $25,000 to $49,999 | 395 (91.0%) | 39 (9.0%) |
| $50,000 to $74,999 | 269 (91.5%) | 25 (8.5%) |
| $75,000 to $99,999 | 997 (98.0%) | 20 (2.0%) |
| $100,000 and over | 1,098 (96.2%) | 43 (3.8%) |
Public vs Private Health Insurance Coverage by Age in Kenhorst borough
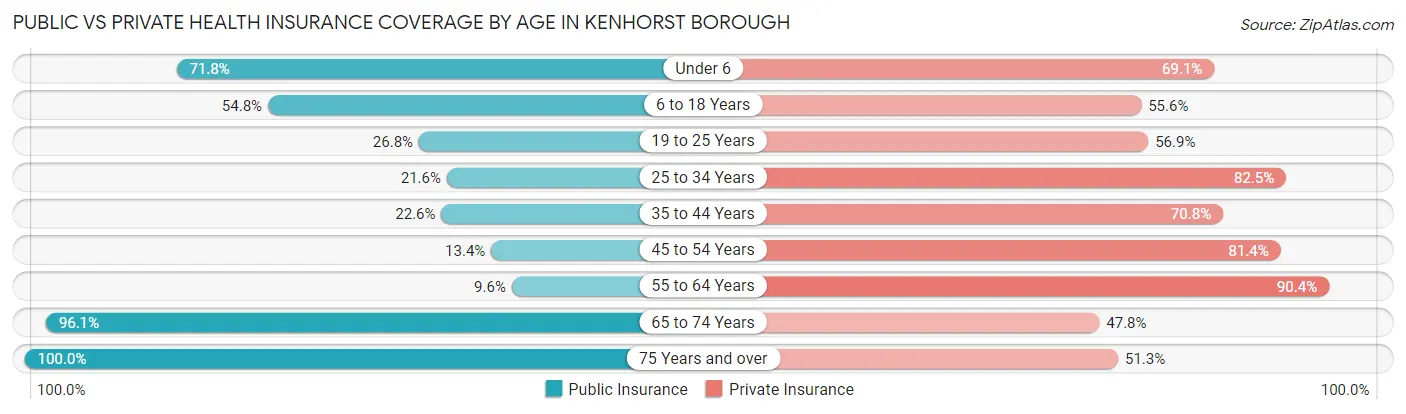
| Age Bracket | Public Insurance | Private Insurance |
| Under 6 | 186 (71.8%) | 179 (69.1%) |
| 6 to 18 Years | 221 (54.8%) | 224 (55.6%) |
| 19 to 25 Years | 74 (26.8%) | 157 (56.9%) |
| 25 to 34 Years | 143 (21.6%) | 545 (82.5%) |
| 35 to 44 Years | 72 (22.6%) | 225 (70.8%) |
| 45 to 54 Years | 52 (13.4%) | 316 (81.4%) |
| 55 to 64 Years | 32 (9.6%) | 302 (90.4%) |
| 65 to 74 Years | 219 (96.1%) | 109 (47.8%) |
| 75 Years and over | 117 (100.0%) | 60 (51.3%) |
| Total | 1,116 (37.4%) | 2,117 (71.0%) |
Disability Status by Sex by Age in Kenhorst borough
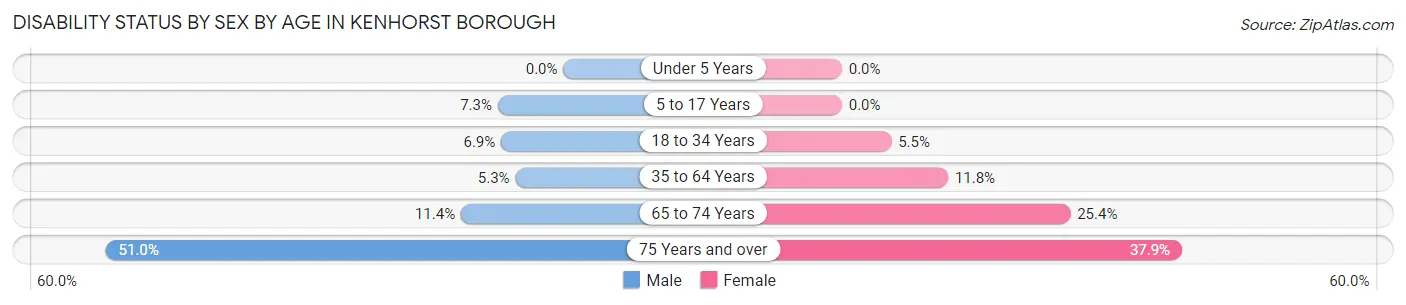
| Age Bracket | Male | Female |
| Under 5 Years | 0 (0.0%) | 0 (0.0%) |
| 5 to 17 Years | 17 (7.3%) | 0 (0.0%) |
| 18 to 34 Years | 37 (6.9%) | 24 (5.5%) |
| 35 to 64 Years | 28 (5.3%) | 61 (11.8%) |
| 65 to 74 Years | 13 (11.4%) | 29 (25.4%) |
| 75 Years and over | 26 (51.0%) | 25 (37.9%) |
Disability Class by Sex by Age in Kenhorst borough
Disability Class: Hearing Difficulty
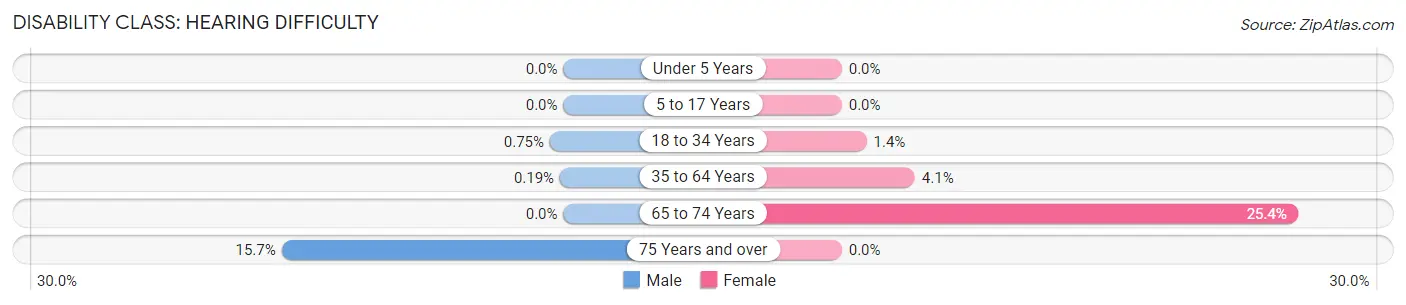
| Age Bracket | Male | Female |
| Under 5 Years | 0 (0.0%) | 0 (0.0%) |
| 5 to 17 Years | 0 (0.0%) | 0 (0.0%) |
| 18 to 34 Years | 4 (0.7%) | 6 (1.4%) |
| 35 to 64 Years | 1 (0.2%) | 21 (4.1%) |
| 65 to 74 Years | 0 (0.0%) | 29 (25.4%) |
| 75 Years and over | 8 (15.7%) | 0 (0.0%) |
Disability Class: Vision Difficulty
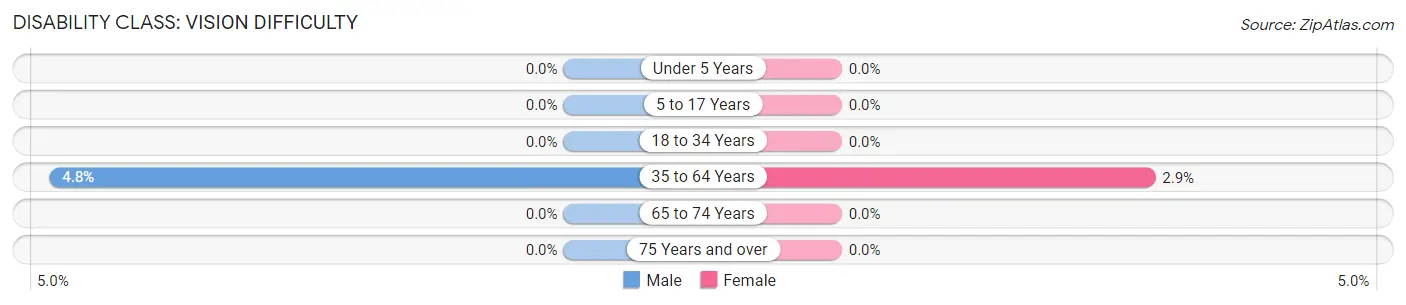
| Age Bracket | Male | Female |
| Under 5 Years | 0 (0.0%) | 0 (0.0%) |
| 5 to 17 Years | 0 (0.0%) | 0 (0.0%) |
| 18 to 34 Years | 0 (0.0%) | 0 (0.0%) |
| 35 to 64 Years | 25 (4.8%) | 15 (2.9%) |
| 65 to 74 Years | 0 (0.0%) | 0 (0.0%) |
| 75 Years and over | 0 (0.0%) | 0 (0.0%) |
Disability Class: Cognitive Difficulty
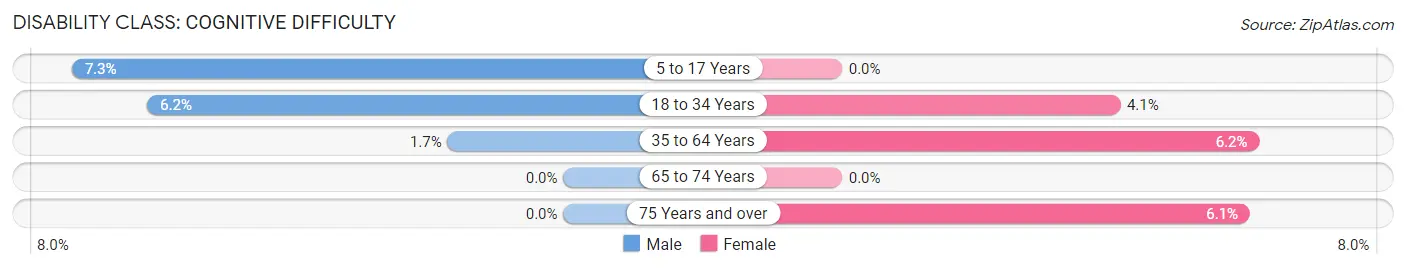
| Age Bracket | Male | Female |
| 5 to 17 Years | 17 (7.3%) | 0 (0.0%) |
| 18 to 34 Years | 33 (6.2%) | 18 (4.1%) |
| 35 to 64 Years | 9 (1.7%) | 32 (6.2%) |
| 65 to 74 Years | 0 (0.0%) | 0 (0.0%) |
| 75 Years and over | 0 (0.0%) | 4 (6.1%) |
Disability Class: Ambulatory Difficulty
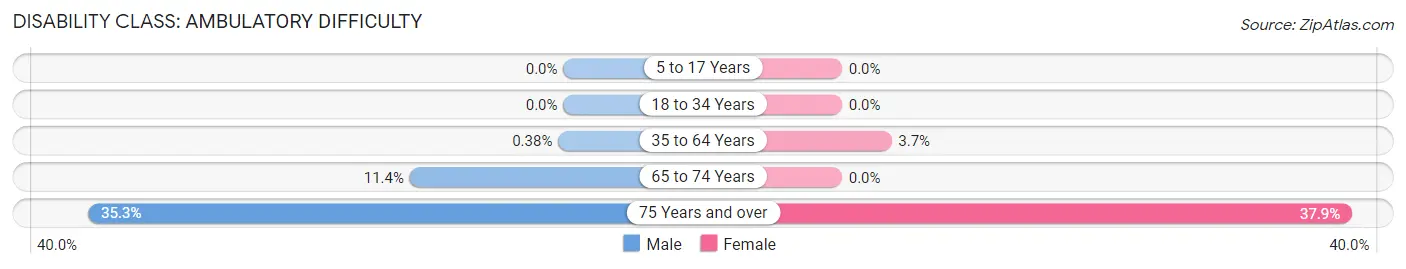
| Age Bracket | Male | Female |
| 5 to 17 Years | 0 (0.0%) | 0 (0.0%) |
| 18 to 34 Years | 0 (0.0%) | 0 (0.0%) |
| 35 to 64 Years | 2 (0.4%) | 19 (3.7%) |
| 65 to 74 Years | 13 (11.4%) | 0 (0.0%) |
| 75 Years and over | 18 (35.3%) | 25 (37.9%) |
Disability Class: Self-Care Difficulty
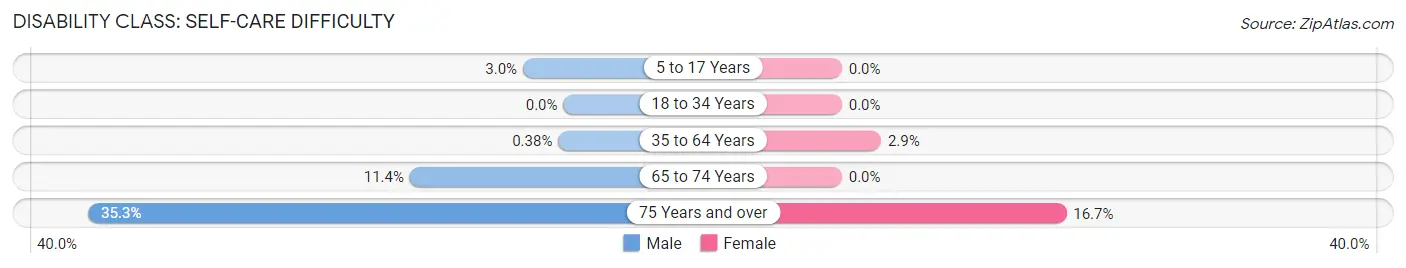
| Age Bracket | Male | Female |
| 5 to 17 Years | 7 (3.0%) | 0 (0.0%) |
| 18 to 34 Years | 0 (0.0%) | 0 (0.0%) |
| 35 to 64 Years | 2 (0.4%) | 15 (2.9%) |
| 65 to 74 Years | 13 (11.4%) | 0 (0.0%) |
| 75 Years and over | 18 (35.3%) | 11 (16.7%) |
Technology Access in Kenhorst borough
Computing Device Access in Kenhorst borough
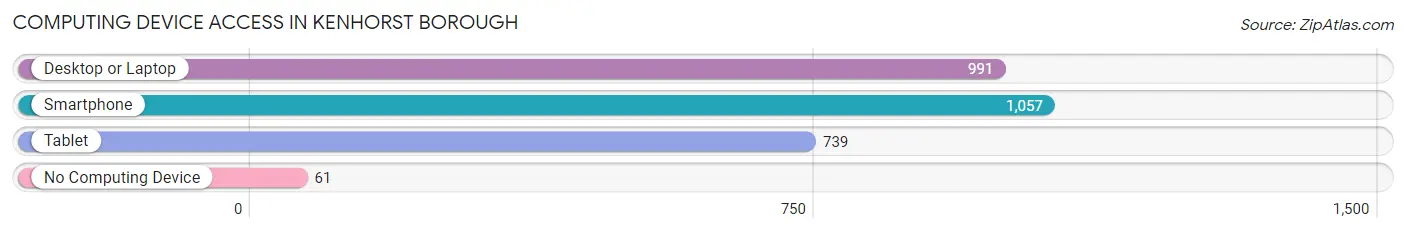
| Device Type | # Households | % Households |
| Desktop or Laptop | 991 | 82.3% |
| Smartphone | 1,057 | 87.8% |
| Tablet | 739 | 61.4% |
| No Computing Device | 61 | 5.1% |
| Total | 1,204 | 100.0% |
Internet Access in Kenhorst borough
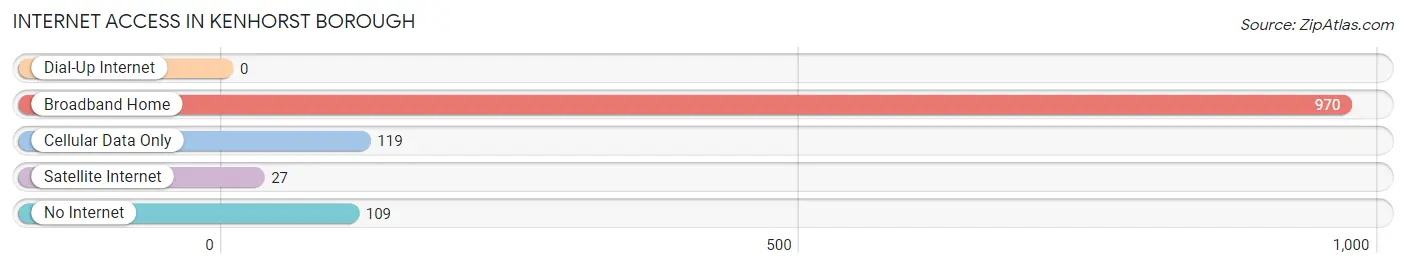
| Internet Type | # Households | % Households |
| Dial-Up Internet | 0 | 0.0% |
| Broadband Home | 970 | 80.6% |
| Cellular Data Only | 119 | 9.9% |
| Satellite Internet | 27 | 2.2% |
| No Internet | 109 | 9.0% |
| Total | 1,204 | 100.0% |
Kenhorst borough Summary
Kenhorst Borough is a small borough located in Berks County, Pennsylvania. It is situated in the southeastern corner of the county, just south of the city of Reading. The borough is home to a population of approximately 2,000 people, and is part of the Reading Metropolitan Statistical Area.
Geography
Kenhorst Borough is located at 40°20'45" North, 75°56'45" West (40.3458, -75.9457). It has a total area of 0.6 square miles, all of which is land. The borough is bordered by the city of Reading to the north, Muhlenberg Township to the east, Lower Alsace Township to the south, and Exeter Township to the west.
The borough is situated in the Schuylkill Valley, a region of southeastern Pennsylvania known for its rolling hills and lush farmland. The Schuylkill River runs through the borough, and is a popular destination for fishing, boating, and other recreational activities.
History
Kenhorst Borough was founded in 1876, when a group of local farmers purchased a tract of land from the Reading Railroad. The borough was named after the Kenhorst family, who had owned the land since the early 1700s.
The borough was originally a rural farming community, but in the early 1900s, it began to experience rapid growth due to its proximity to the city of Reading. By the mid-1900s, the borough had become a popular residential area for commuters to the city.
Economy
Kenhorst Borough is primarily a residential community, and the majority of its residents are employed in the nearby city of Reading. The borough does have a few small businesses, including a grocery store, a hardware store, and a few restaurants.
Demographics
As of the 2010 census, the population of Kenhorst Borough was 2,039. The racial makeup of the borough was 94.3% White, 2.2% African American, 0.4% Native American, 0.7% Asian, 0.1% Pacific Islander, 0.9% from other races, and 1.4% from two or more races. Hispanic or Latino of any race were 2.7% of the population.
The median household income in the borough was $50,938, and the median family income was $60,938. The per capita income was $25,938. About 4.3% of families and 5.7% of the population were below the poverty line, including 8.2% of those under age 18 and 4.3% of those age 65 or over.
Conclusion
Kenhorst Borough is a small borough located in Berks County, Pennsylvania. It is situated in the southeastern corner of the county, just south of the city of Reading. The borough is home to a population of approximately 2,000 people, and is part of the Reading Metropolitan Statistical Area. The borough is primarily a residential community, and the majority of its residents are employed in the nearby city of Reading. The racial makeup of the borough is predominantly White, with a small percentage of African American, Native American, Asian, and Pacific Islander residents. The median household income in the borough is $50,938, and the per capita income is $25,938.
Common Questions
What is Per Capita Income in Kenhorst borough?
Per Capita income in Kenhorst borough is $35,754.
What is the Median Family Income in Kenhorst borough?
Median Family Income in Kenhorst borough is $86,964.
What is the Median Household income in Kenhorst borough?
Median Household Income in Kenhorst borough is $80,800.
What is Income or Wage Gap in Kenhorst borough?
Income or Wage Gap in Kenhorst borough is 22.3%.
Women in Kenhorst borough earn 77.7 cents for every dollar earned by a man.
What is Inequality or Gini Index in Kenhorst borough?
Inequality or Gini Index in Kenhorst borough is 0.31.
What is the Total Population of Kenhorst borough?
Total Population of Kenhorst borough is 2,984.
What is the Total Male Population of Kenhorst borough?
Total Male Population of Kenhorst borough is 1,517.
What is the Total Female Population of Kenhorst borough?
Total Female Population of Kenhorst borough is 1,467.
What is the Ratio of Males per 100 Females in Kenhorst borough?
There are 103.41 Males per 100 Females in Kenhorst borough.
What is the Ratio of Females per 100 Males in Kenhorst borough?
There are 96.70 Females per 100 Males in Kenhorst borough.
What is the Median Population Age in Kenhorst borough?
Median Population Age in Kenhorst borough is 30.9 Years.
What is the Average Family Size in Kenhorst borough
Average Family Size in Kenhorst borough is 3.0 People.
What is the Average Household Size in Kenhorst borough
Average Household Size in Kenhorst borough is 2.5 People.
How Large is the Labor Force in Kenhorst borough?
There are 1,828 People in the Labor Forcein in Kenhorst borough.
What is the Percentage of People in the Labor Force in Kenhorst borough?
76.3% of People are in the Labor Force in Kenhorst borough.
What is the Unemployment Rate in Kenhorst borough?
Unemployment Rate in Kenhorst borough is 5.9%.