Temple, PA Map & Demographics
Temple Map
Temple Overview
$32,730
PER CAPITA INCOME
$72,478
AVG FAMILY INCOME
$70,278
AVG HOUSEHOLD INCOME
26.6%
WAGE / INCOME GAP [ % ]
73.4¢/ $1
WAGE / INCOME GAP [ $ ]
0.46
INEQUALITY / GINI INDEX
2,251
TOTAL POPULATION
1,132
MALE POPULATION
1,119
FEMALE POPULATION
101.16
MALES / 100 FEMALES
98.85
FEMALES / 100 MALES
31.7
MEDIAN AGE
3.4
AVG FAMILY SIZE
2.8
AVG HOUSEHOLD SIZE
1,162
LABOR FORCE [ PEOPLE ]
73.8%
PERCENT IN LABOR FORCE
7.7%
UNEMPLOYMENT RATE
Temple Zip Codes
Income in Temple
Income Overview in Temple
Per Capita Income in Temple is $32,730, while median incomes of families and households are $72,478 and $70,278 respectively.
| Characteristic | Number | Measure |
| Per Capita Income | 2,251 | $32,730 |
| Median Family Income | 517 | $72,478 |
| Mean Family Income | 517 | $103,410 |
| Median Household Income | 802 | $70,278 |
| Mean Household Income | 802 | $87,086 |
| Income Deficit | 517 | $0 |
| Wage / Income Gap (%) | 2,251 | 26.59% |
| Wage / Income Gap ($) | 2,251 | 73.41¢ per $1 |
| Gini / Inequality Index | 2,251 | 0.46 |
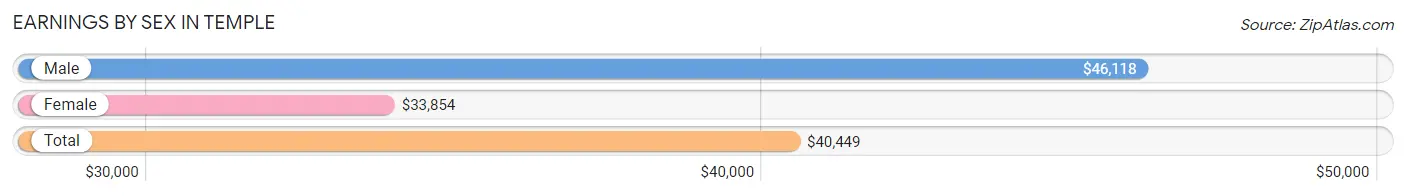
Earnings by Sex in Temple
Average Earnings in Temple are $40,449, $46,118 for men and $33,854 for women, a difference of 26.6%.
| Sex | Number | Average Earnings |
| Male | 486 (43.0%) | $46,118 |
| Female | 643 (57.0%) | $33,854 |
| Total | 1,129 (100.0%) | $40,449 |
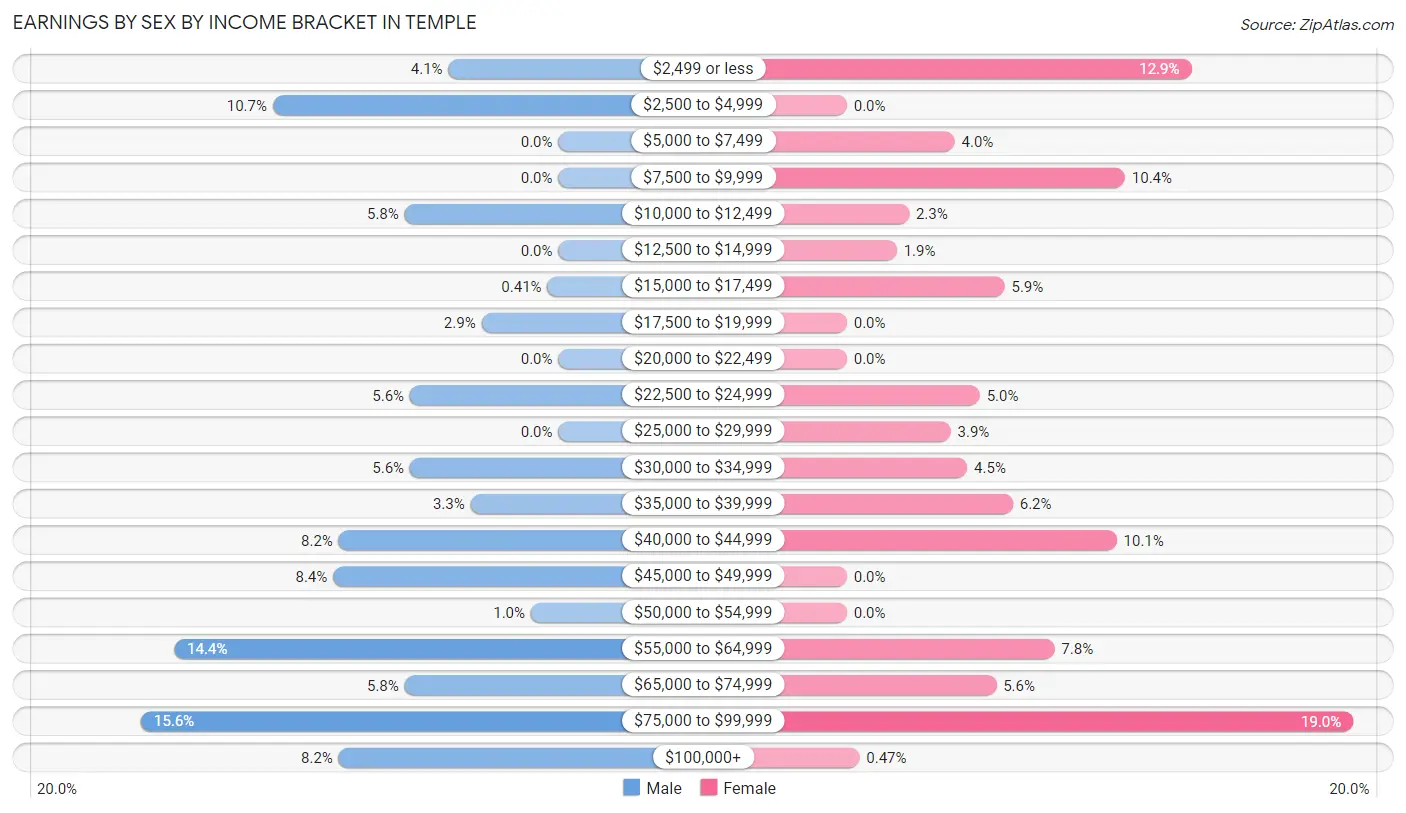
Earnings by Sex by Income Bracket in Temple
The most common earnings brackets in Temple are $75,000 to $99,999 for men (76 | 15.6%) and $75,000 to $99,999 for women (122 | 19.0%).
| Income | Male | Female |
| $2,499 or less | 20 (4.1%) | 83 (12.9%) |
| $2,500 to $4,999 | 52 (10.7%) | 0 (0.0%) |
| $5,000 to $7,499 | 0 (0.0%) | 26 (4.0%) |
| $7,500 to $9,999 | 0 (0.0%) | 67 (10.4%) |
| $10,000 to $12,499 | 28 (5.8%) | 15 (2.3%) |
| $12,500 to $14,999 | 0 (0.0%) | 12 (1.9%) |
| $15,000 to $17,499 | 2 (0.4%) | 38 (5.9%) |
| $17,500 to $19,999 | 14 (2.9%) | 0 (0.0%) |
| $20,000 to $22,499 | 0 (0.0%) | 0 (0.0%) |
| $22,500 to $24,999 | 27 (5.6%) | 32 (5.0%) |
| $25,000 to $29,999 | 0 (0.0%) | 25 (3.9%) |
| $30,000 to $34,999 | 27 (5.6%) | 29 (4.5%) |
| $35,000 to $39,999 | 16 (3.3%) | 40 (6.2%) |
| $40,000 to $44,999 | 40 (8.2%) | 65 (10.1%) |
| $45,000 to $49,999 | 41 (8.4%) | 0 (0.0%) |
| $50,000 to $54,999 | 5 (1.0%) | 0 (0.0%) |
| $55,000 to $64,999 | 70 (14.4%) | 50 (7.8%) |
| $65,000 to $74,999 | 28 (5.8%) | 36 (5.6%) |
| $75,000 to $99,999 | 76 (15.6%) | 122 (19.0%) |
| $100,000+ | 40 (8.2%) | 3 (0.5%) |
| Total | 486 (100.0%) | 643 (100.0%) |
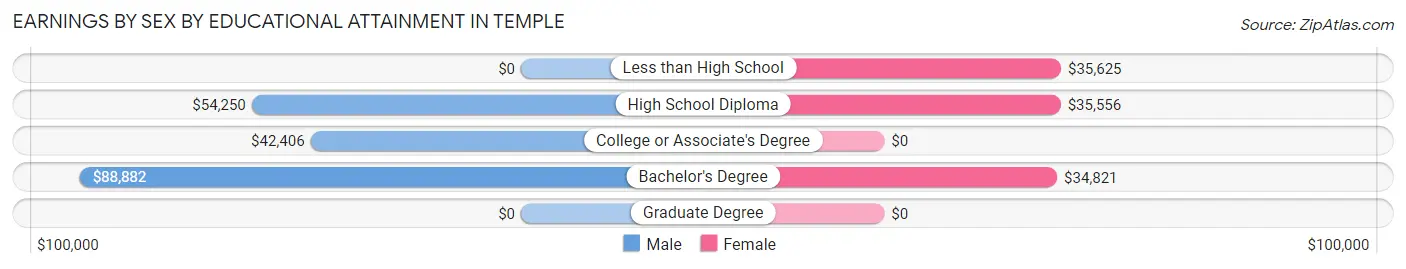
Earnings by Sex by Educational Attainment in Temple
Average earnings in Temple are $53,000 for men and $39,750 for women, a difference of 25.0%. Men with an educational attainment of bachelor's degree enjoy the highest average annual earnings of $88,882, while those with college or associate's degree education earn the least with $42,406. Women with an educational attainment of less than high school earn the most with the average annual earnings of $35,625, while those with bachelor's degree education have the smallest earnings of $34,821.
| Educational Attainment | Male Income | Female Income |
| Less than High School | - | - |
| High School Diploma | $54,250 | $35,556 |
| College or Associate's Degree | $42,406 | $0 |
| Bachelor's Degree | $88,882 | $34,821 |
| Graduate Degree | - | - |
| Total | $53,000 | $39,750 |
Family Income in Temple
Family Income Brackets in Temple
According to the Temple family income data, there are 170 families falling into the $75,000 to $99,999 income range, which is the most common income bracket and makes up 32.9% of all families.
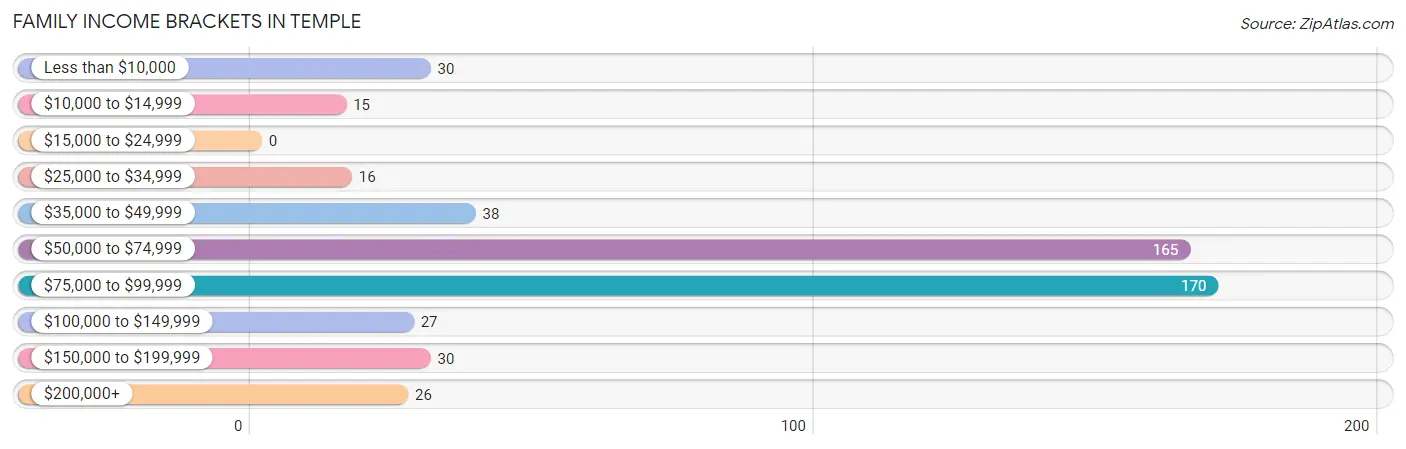
| Income Bracket | # Families | % Families |
| Less than $10,000 | 30 | 5.8% |
| $10,000 to $14,999 | 15 | 2.9% |
| $15,000 to $24,999 | 0 | 0.0% |
| $25,000 to $34,999 | 16 | 3.1% |
| $35,000 to $49,999 | 38 | 7.4% |
| $50,000 to $74,999 | 165 | 31.9% |
| $75,000 to $99,999 | 170 | 32.9% |
| $100,000 to $149,999 | 27 | 5.2% |
| $150,000 to $199,999 | 30 | 5.8% |
| $200,000+ | 26 | 5.0% |
Family Income by Famaliy Size in Temple
4-person families (12 | 2.3%) account for the highest median family income in Temple with $108,000 per family, while 2-person families (164 | 31.7%) have the highest median income of $35,819 per family member.
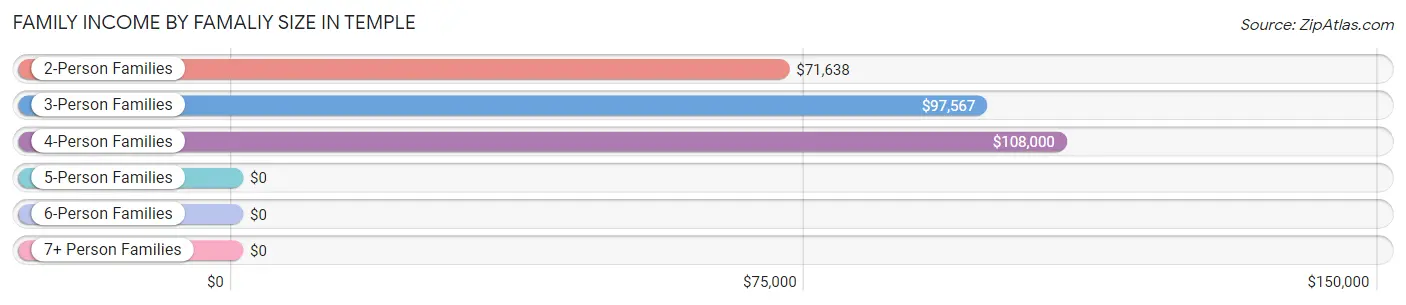
| Income Bracket | # Families | Median Income |
| 2-Person Families | 164 (31.7%) | $71,638 |
| 3-Person Families | 218 (42.2%) | $97,567 |
| 4-Person Families | 12 (2.3%) | $108,000 |
| 5-Person Families | 23 (4.4%) | $0 |
| 6-Person Families | 100 (19.3%) | $0 |
| 7+ Person Families | 0 (0.0%) | $0 |
| Total | 517 (100.0%) | $72,478 |
Family Income by Number of Earners in Temple
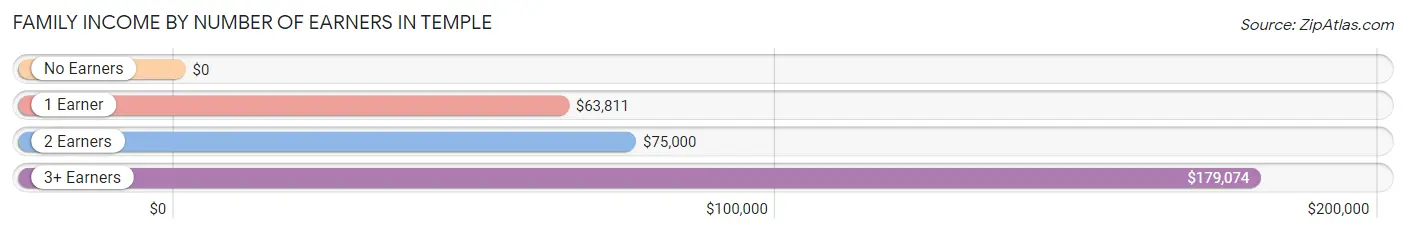
| Number of Earners | # Families | Median Income |
| No Earners | 34 (6.6%) | $0 |
| 1 Earner | 221 (42.7%) | $63,811 |
| 2 Earners | 218 (42.2%) | $75,000 |
| 3+ Earners | 44 (8.5%) | $179,074 |
| Total | 517 (100.0%) | $72,478 |
Household Income in Temple
Household Income Brackets in Temple
With 219 households falling in the category, the $75,000 to $99,999 income range is the most frequent in Temple, accounting for 27.3% of all households. In contrast, only 3 households (0.4%) fall into the $150,000 to $199,999 income bracket, making it the least populous group.
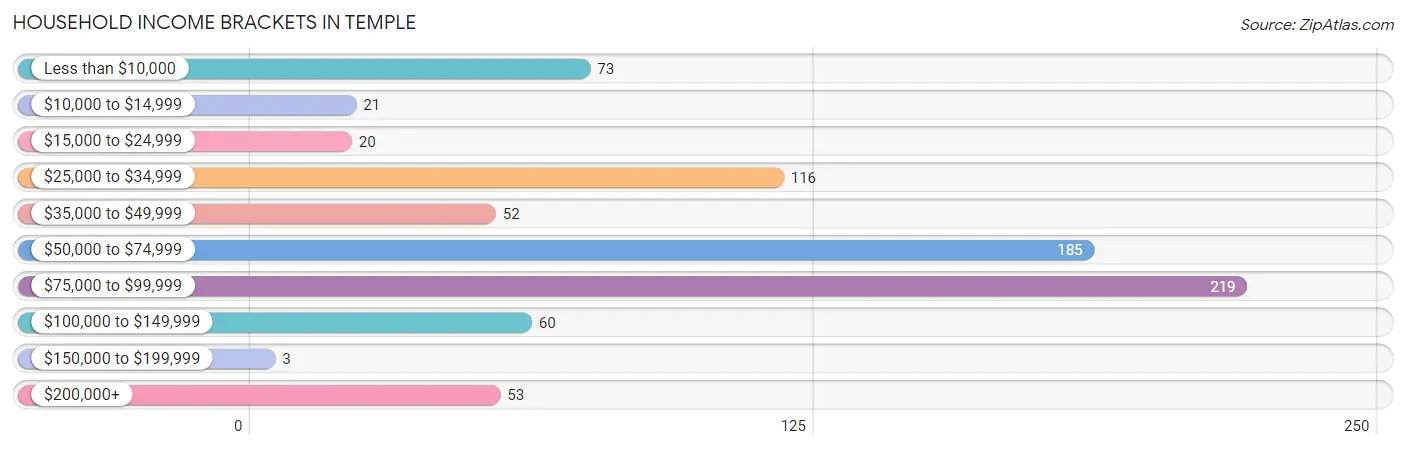
| Income Bracket | # Households | % Households |
| Less than $10,000 | 73 | 9.1% |
| $10,000 to $14,999 | 21 | 2.6% |
| $15,000 to $24,999 | 20 | 2.5% |
| $25,000 to $34,999 | 116 | 14.5% |
| $35,000 to $49,999 | 52 | 6.5% |
| $50,000 to $74,999 | 185 | 23.1% |
| $75,000 to $99,999 | 219 | 27.3% |
| $100,000 to $149,999 | 60 | 7.5% |
| $150,000 to $199,999 | 3 | 0.4% |
| $200,000+ | 53 | 6.6% |
Household Income by Householder Age in Temple
The median household income in Temple is $70,278, with the highest median household income of $98,116 found in the 25 to 44 years age bracket for the primary householder. A total of 335 households (41.8%) fall into this category. Meanwhile, the 15 to 24 years age bracket for the primary householder has the lowest median household income of $0, with 90 households (11.2%) in this group.

| Income Bracket | # Households | Median Income |
| 15 to 24 Years | 90 (11.2%) | $0 |
| 25 to 44 Years | 335 (41.8%) | $98,116 |
| 45 to 64 Years | 270 (33.7%) | $46,290 |
| 65+ Years | 107 (13.3%) | $46,250 |
| Total | 802 (100.0%) | $70,278 |
Poverty in Temple
Income Below Poverty by Sex and Age in Temple
With 15.7% poverty level for males and 9.0% for females among the residents of Temple, 15 year old males and 16 and 17 year old females are the most vulnerable to poverty, with 15 males (71.4%) and 20 females (100.0%) in their respective age groups living below the poverty level.
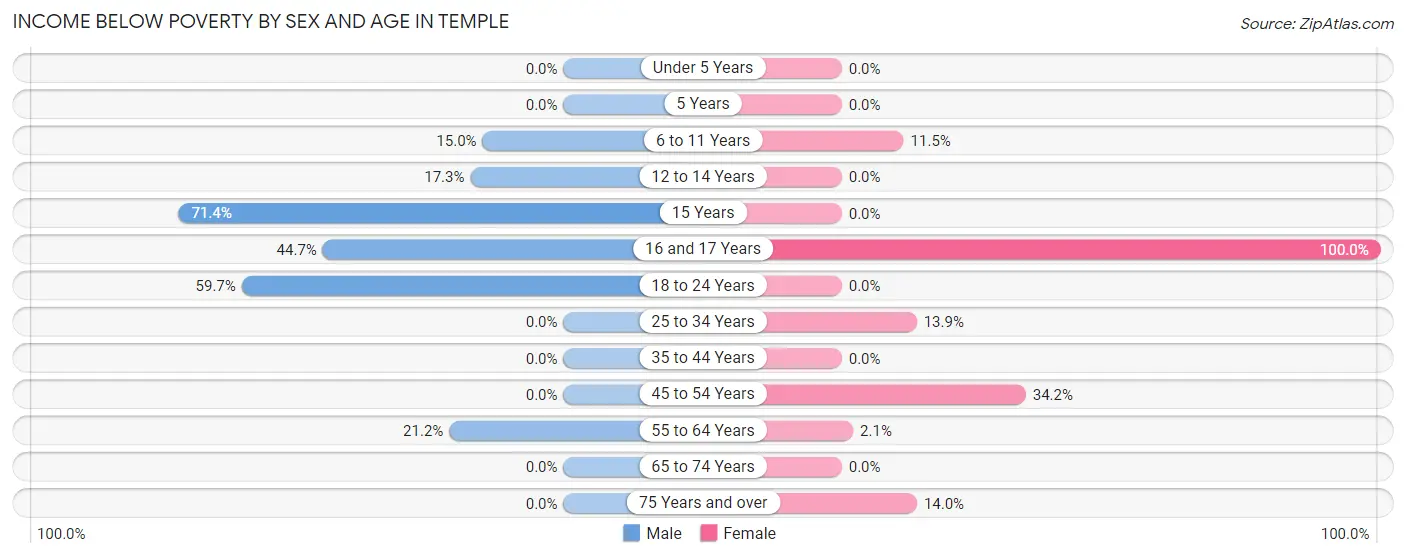
| Age Bracket | Male | Female |
| Under 5 Years | 0 (0.0%) | 0 (0.0%) |
| 5 Years | 0 (0.0%) | 0 (0.0%) |
| 6 to 11 Years | 38 (15.0%) | 14 (11.5%) |
| 12 to 14 Years | 19 (17.3%) | 0 (0.0%) |
| 15 Years | 15 (71.4%) | 0 (0.0%) |
| 16 and 17 Years | 21 (44.7%) | 20 (100.0%) |
| 18 to 24 Years | 43 (59.7%) | 0 (0.0%) |
| 25 to 34 Years | 0 (0.0%) | 16 (13.9%) |
| 35 to 44 Years | 0 (0.0%) | 0 (0.0%) |
| 45 to 54 Years | 0 (0.0%) | 42 (34.2%) |
| 55 to 64 Years | 39 (21.2%) | 3 (2.1%) |
| 65 to 74 Years | 0 (0.0%) | 0 (0.0%) |
| 75 Years and over | 0 (0.0%) | 6 (14.0%) |
| Total | 175 (15.7%) | 101 (9.0%) |
Income Above Poverty by Sex and Age in Temple
According to the poverty statistics in Temple, males aged under 5 years and females aged under 5 years are the age groups that are most secure financially, with 100.0% of males and 100.0% of females in these age groups living above the poverty line.
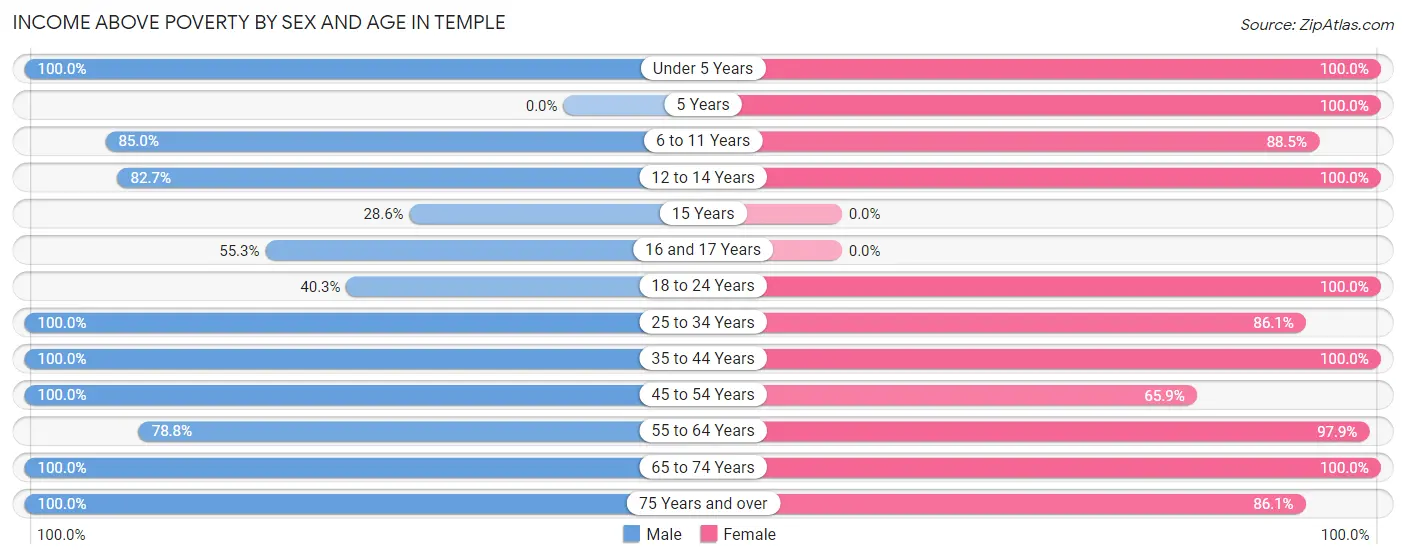
| Age Bracket | Male | Female |
| Under 5 Years | 28 (100.0%) | 24 (100.0%) |
| 5 Years | 0 (0.0%) | 80 (100.0%) |
| 6 to 11 Years | 215 (85.0%) | 108 (88.5%) |
| 12 to 14 Years | 91 (82.7%) | 21 (100.0%) |
| 15 Years | 6 (28.6%) | 0 (0.0%) |
| 16 and 17 Years | 26 (55.3%) | 0 (0.0%) |
| 18 to 24 Years | 29 (40.3%) | 202 (100.0%) |
| 25 to 34 Years | 160 (100.0%) | 99 (86.1%) |
| 35 to 44 Years | 153 (100.0%) | 195 (100.0%) |
| 45 to 54 Years | 22 (100.0%) | 81 (65.8%) |
| 55 to 64 Years | 145 (78.8%) | 139 (97.9%) |
| 65 to 74 Years | 14 (100.0%) | 32 (100.0%) |
| 75 Years and over | 51 (100.0%) | 37 (86.1%) |
| Total | 940 (84.3%) | 1,018 (91.0%) |
Income Below Poverty Among Married-Couple Families in Temple
The poverty statistics for married-couple families in Temple show that 1.4% or 3 of the total 218 families live below the poverty line. Families with no children have the highest poverty rate of 2.6%, comprising of 3 families. On the other hand, families with 1 or 2 children have the lowest poverty rate of 0.0%, which includes 0 families.
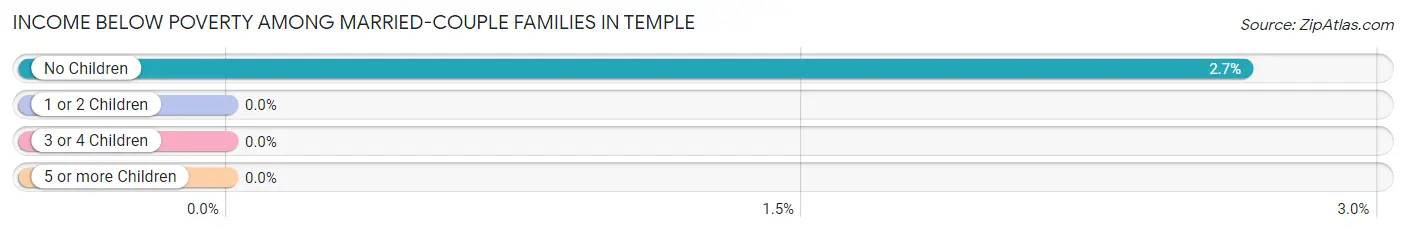
| Children | Above Poverty | Below Poverty |
| No Children | 110 (97.4%) | 3 (2.6%) |
| 1 or 2 Children | 37 (100.0%) | 0 (0.0%) |
| 3 or 4 Children | 68 (100.0%) | 0 (0.0%) |
| 5 or more Children | 0 (0.0%) | 0 (0.0%) |
| Total | 215 (98.6%) | 3 (1.4%) |
Income Below Poverty Among Single-Parent Households in Temple
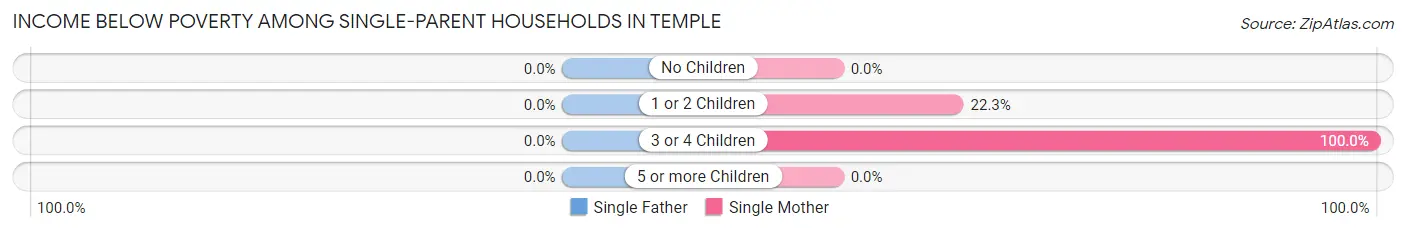
| Children | Single Father | Single Mother |
| No Children | 0 (0.0%) | 0 (0.0%) |
| 1 or 2 Children | 0 (0.0%) | 42 (22.3%) |
| 3 or 4 Children | 0 (0.0%) | 16 (100.0%) |
| 5 or more Children | 0 (0.0%) | 0 (0.0%) |
| Total | 0 (0.0%) | 58 (22.3%) |
Income Below Poverty Among Married-Couple vs Single-Parent Households in Temple
The poverty data for Temple shows that 3 of the married-couple family households (1.4%) and 58 of the single-parent households (19.4%) are living below the poverty level. Within the married-couple family households, those with no children have the highest poverty rate, with 3 households (2.6%) falling below the poverty line. Among the single-parent households, those with 3 or 4 children have the highest poverty rate, with 16 household (100.0%) living below poverty.
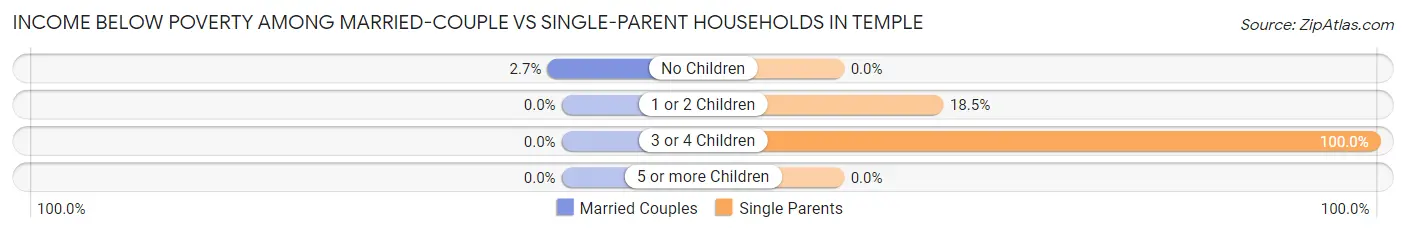
| Children | Married-Couple Families | Single-Parent Households |
| No Children | 3 (2.6%) | 0 (0.0%) |
| 1 or 2 Children | 0 (0.0%) | 42 (18.5%) |
| 3 or 4 Children | 0 (0.0%) | 16 (100.0%) |
| 5 or more Children | 0 (0.0%) | 0 (0.0%) |
| Total | 3 (1.4%) | 58 (19.4%) |
Race in Temple
The most populous races in Temple are White / Caucasian (1,575 | 70.0%), Hispanic or Latino (692 | 30.7%), and Some other Race (304 | 13.5%).
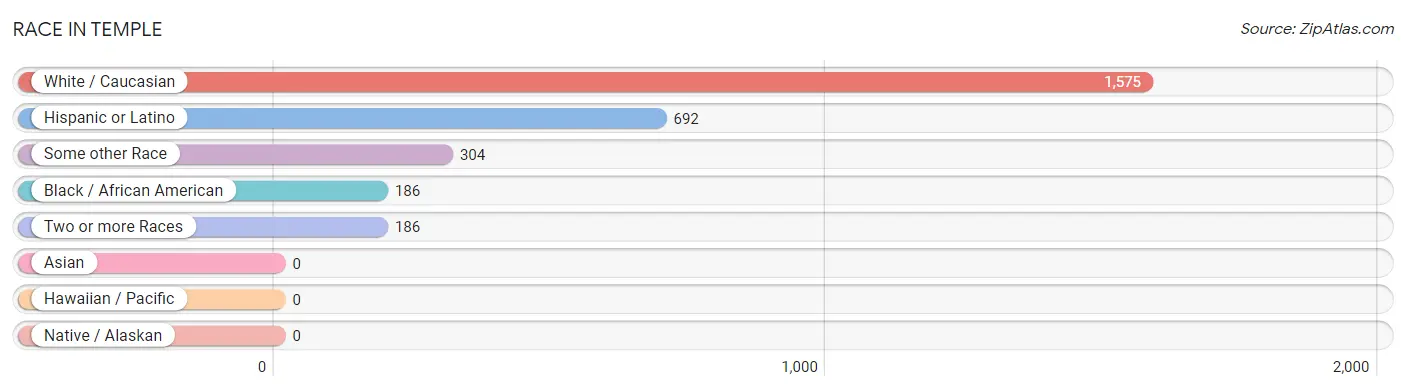
| Race | # Population | % Population |
| Asian | 0 | 0.0% |
| Black / African American | 186 | 8.3% |
| Hawaiian / Pacific | 0 | 0.0% |
| Hispanic or Latino | 692 | 30.7% |
| Native / Alaskan | 0 | 0.0% |
| White / Caucasian | 1,575 | 70.0% |
| Two or more Races | 186 | 8.3% |
| Some other Race | 304 | 13.5% |
| Total | 2,251 | 100.0% |
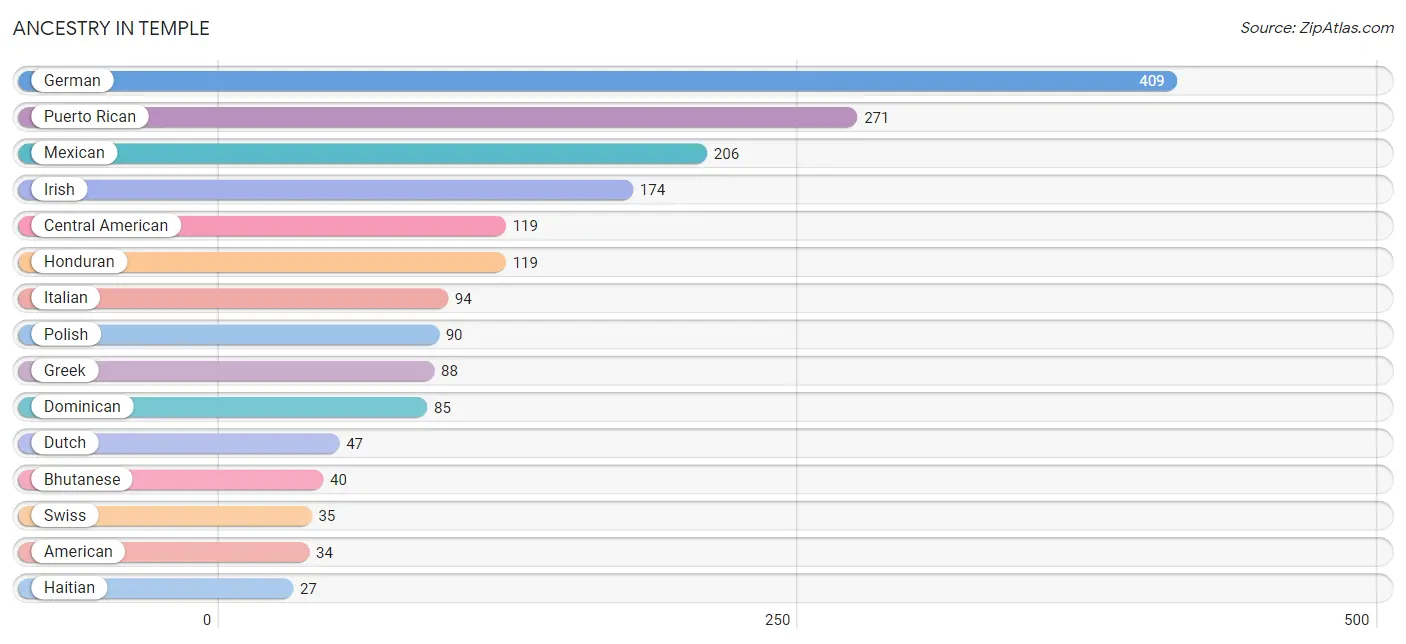
Ancestry in Temple
The most populous ancestries reported in Temple are German (409 | 18.2%), Puerto Rican (271 | 12.0%), Mexican (206 | 9.1%), Irish (174 | 7.7%), and Central American (119 | 5.3%), together accounting for 52.4% of all Temple residents.
| Ancestry | # Population | % Population |
| American | 34 | 1.5% |
| Arab | 5 | 0.2% |
| Bhutanese | 40 | 1.8% |
| Central American | 119 | 5.3% |
| Dominican | 85 | 3.8% |
| Dutch | 47 | 2.1% |
| English | 7 | 0.3% |
| French | 6 | 0.3% |
| German | 409 | 18.2% |
| Greek | 88 | 3.9% |
| Haitian | 27 | 1.2% |
| Honduran | 119 | 5.3% |
| Irish | 174 | 7.7% |
| Italian | 94 | 4.2% |
| Lithuanian | 2 | 0.1% |
| Mexican | 206 | 9.1% |
| Pennsylvania German | 22 | 1.0% |
| Polish | 90 | 4.0% |
| Puerto Rican | 271 | 12.0% |
| Scotch-Irish | 6 | 0.3% |
| Slovak | 14 | 0.6% |
| Spaniard | 5 | 0.2% |
| Swiss | 35 | 1.5% |
| Ukrainian | 6 | 0.3% |
| Welsh | 5 | 0.2% | View All 25 Rows |
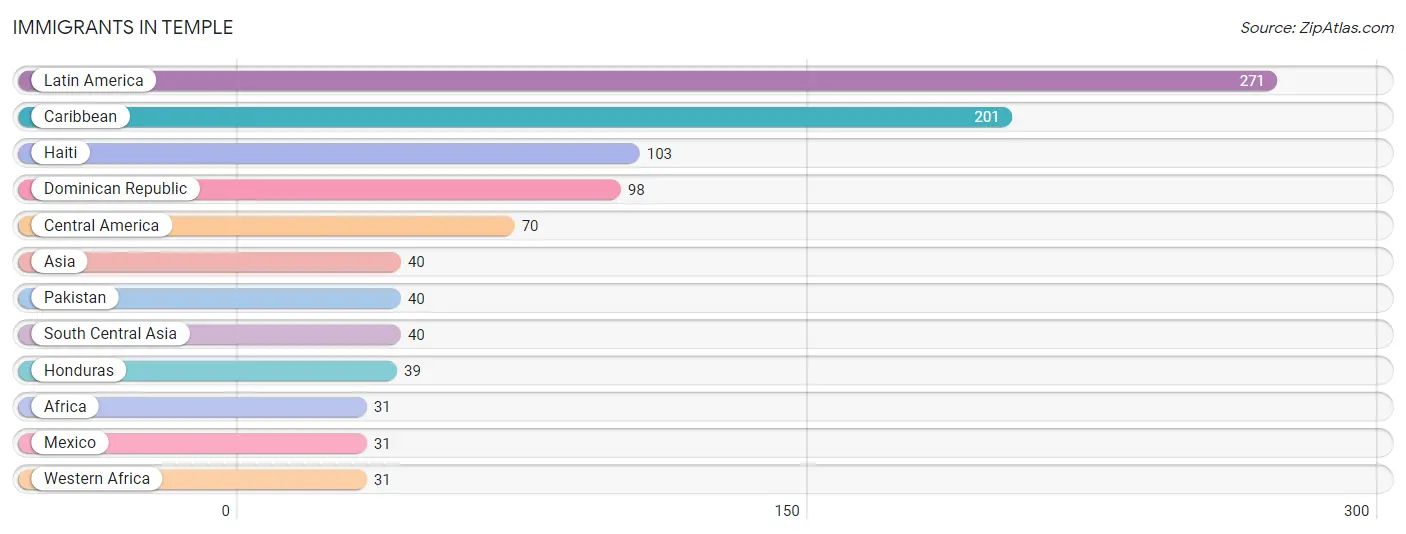
Immigrants in Temple
The most numerous immigrant groups reported in Temple came from Latin America (271 | 12.0%), Caribbean (201 | 8.9%), Haiti (103 | 4.6%), Dominican Republic (98 | 4.3%), and Central America (70 | 3.1%), together accounting for 33.0% of all Temple residents.
| Immigration Origin | # Population | % Population |
| Africa | 31 | 1.4% |
| Asia | 40 | 1.8% |
| Caribbean | 201 | 8.9% |
| Central America | 70 | 3.1% |
| Dominican Republic | 98 | 4.3% |
| Haiti | 103 | 4.6% |
| Honduras | 39 | 1.7% |
| Latin America | 271 | 12.0% |
| Mexico | 31 | 1.4% |
| Pakistan | 40 | 1.8% |
| South Central Asia | 40 | 1.8% |
| Western Africa | 31 | 1.4% | View All 12 Rows |
Sex and Age in Temple
Sex and Age in Temple
The most populous age groups in Temple are 10 to 14 Years (272 | 24.0%) for men and 5 to 9 Years (172 | 15.4%) for women.
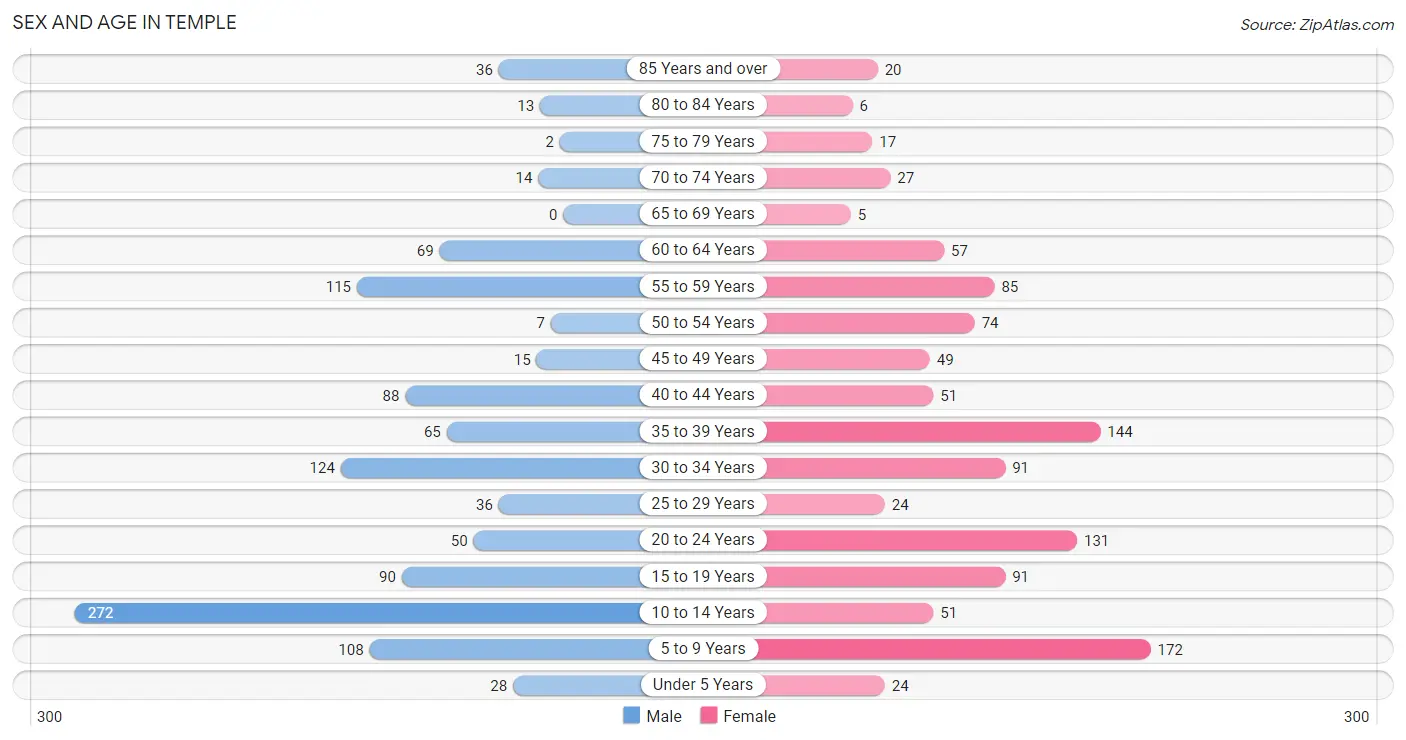
| Age Bracket | Male | Female |
| Under 5 Years | 28 (2.5%) | 24 (2.1%) |
| 5 to 9 Years | 108 (9.5%) | 172 (15.4%) |
| 10 to 14 Years | 272 (24.0%) | 51 (4.6%) |
| 15 to 19 Years | 90 (8.0%) | 91 (8.1%) |
| 20 to 24 Years | 50 (4.4%) | 131 (11.7%) |
| 25 to 29 Years | 36 (3.2%) | 24 (2.1%) |
| 30 to 34 Years | 124 (11.0%) | 91 (8.1%) |
| 35 to 39 Years | 65 (5.7%) | 144 (12.9%) |
| 40 to 44 Years | 88 (7.8%) | 51 (4.6%) |
| 45 to 49 Years | 15 (1.3%) | 49 (4.4%) |
| 50 to 54 Years | 7 (0.6%) | 74 (6.6%) |
| 55 to 59 Years | 115 (10.2%) | 85 (7.6%) |
| 60 to 64 Years | 69 (6.1%) | 57 (5.1%) |
| 65 to 69 Years | 0 (0.0%) | 5 (0.4%) |
| 70 to 74 Years | 14 (1.2%) | 27 (2.4%) |
| 75 to 79 Years | 2 (0.2%) | 17 (1.5%) |
| 80 to 84 Years | 13 (1.1%) | 6 (0.5%) |
| 85 Years and over | 36 (3.2%) | 20 (1.8%) |
| Total | 1,132 (100.0%) | 1,119 (100.0%) |
Families and Households in Temple
Median Family Size in Temple
The median family size in Temple is 3.41 persons per family, with married-couple families (218 | 42.2%) accounting for the largest median family size of 3.92 persons per family. On the other hand, single female/mother families (260 | 50.3%) represent the smallest median family size with 3.03 persons per family.
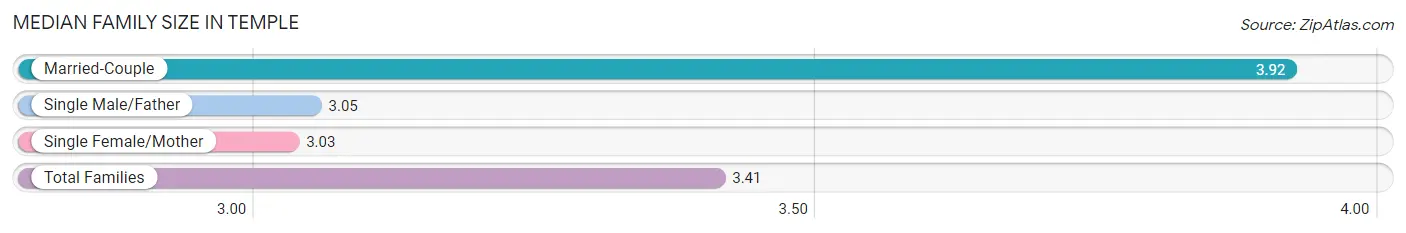
| Family Type | # Families | Family Size |
| Married-Couple | 218 (42.2%) | 3.92 |
| Single Male/Father | 39 (7.5%) | 3.05 |
| Single Female/Mother | 260 (50.3%) | 3.03 |
| Total Families | 517 (100.0%) | 3.41 |
Median Household Size in Temple
The median household size in Temple is 2.80 persons per household, with married-couple households (218 | 27.2%) accounting for the largest median household size of 4.06 persons per household. non-family households (285 | 35.5%) represent the smallest median household size with 1.48 persons per household.
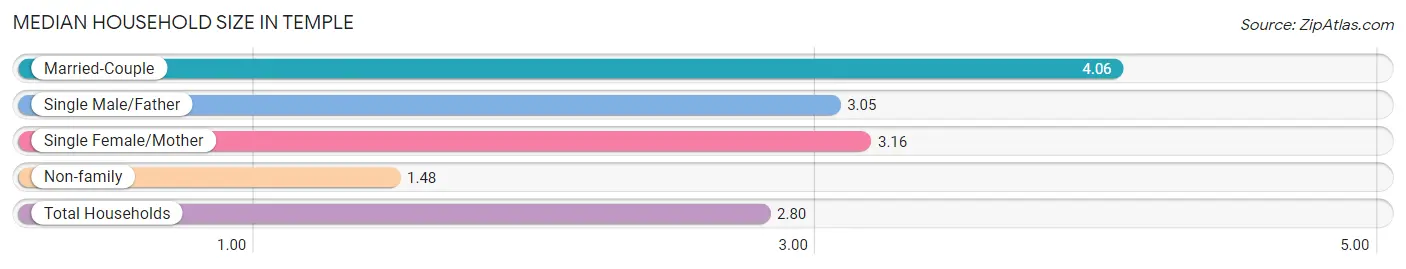
| Household Type | # Households | Household Size |
| Married-Couple | 218 (27.2%) | 4.06 |
| Single Male/Father | 39 (4.9%) | 3.05 |
| Single Female/Mother | 260 (32.4%) | 3.16 |
| Non-family | 285 (35.5%) | 1.48 |
| Total Households | 802 (100.0%) | 2.80 |
Household Size by Marriage Status in Temple
Out of a total of 802 households in Temple, 517 (64.5%) are family households, while 285 (35.5%) are nonfamily households. The most numerous type of family households are 3-person households, comprising 189, and the most common type of nonfamily households are 1-person households, comprising 188.
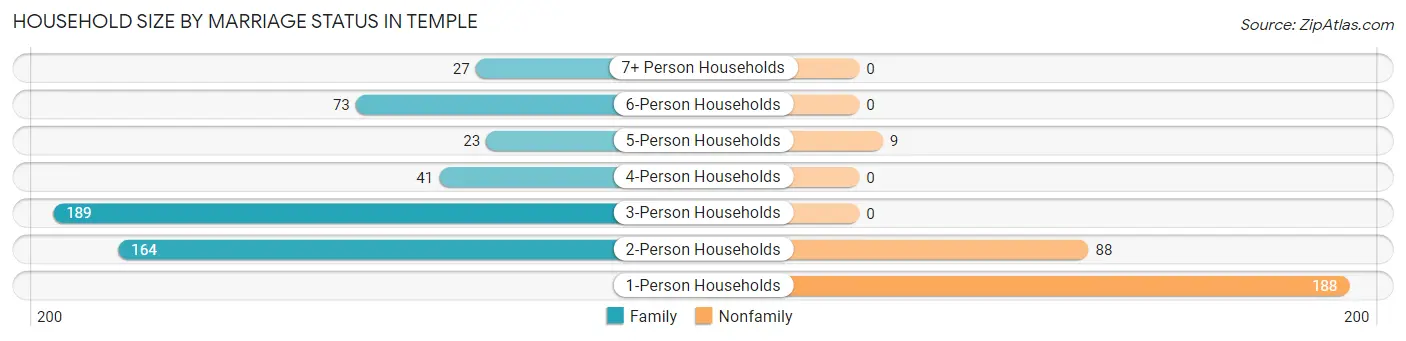
| Household Size | Family Households | Nonfamily Households |
| 1-Person Households | - | 188 (23.4%) |
| 2-Person Households | 164 (20.4%) | 88 (11.0%) |
| 3-Person Households | 189 (23.6%) | 0 (0.0%) |
| 4-Person Households | 41 (5.1%) | 0 (0.0%) |
| 5-Person Households | 23 (2.9%) | 9 (1.1%) |
| 6-Person Households | 73 (9.1%) | 0 (0.0%) |
| 7+ Person Households | 27 (3.4%) | 0 (0.0%) |
| Total | 517 (64.5%) | 285 (35.5%) |
Female Fertility in Temple
Fertility by Age in Temple
Average fertility rate in Temple is 17.0 births per 1,000 women. Women in the age bracket of 20 to 34 years have the highest fertility rate with 41.0 births per 1,000 women. Women in the age bracket of 20 to 34 years acount for 100.0% of all women with births.
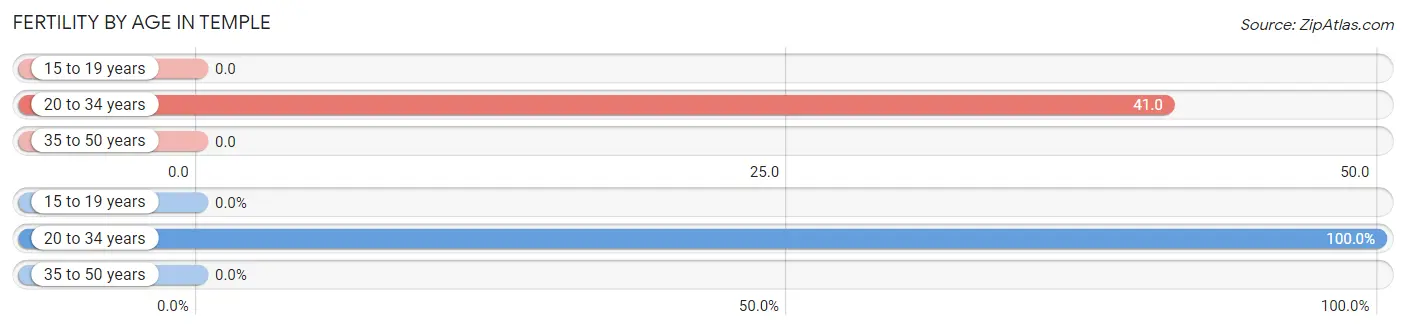
| Age Bracket | Women with Births | Births / 1,000 Women |
| 15 to 19 years | 0 (0.0%) | 0.0 |
| 20 to 34 years | 10 (100.0%) | 41.0 |
| 35 to 50 years | 0 (0.0%) | 0.0 |
| Total | 10 (100.0%) | 17.0 |
Fertility by Age by Marriage Status in Temple
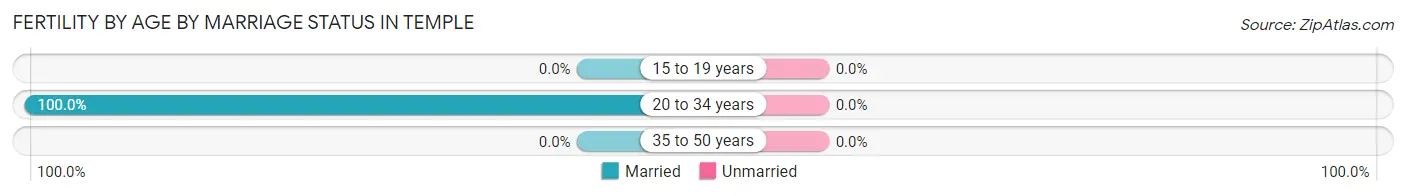
| Age Bracket | Married | Unmarried |
| 15 to 19 years | 0 (0.0%) | 0 (0.0%) |
| 20 to 34 years | 10 (100.0%) | 0 (0.0%) |
| 35 to 50 years | 0 (0.0%) | 0 (0.0%) |
| Total | 10 (100.0%) | 0 (0.0%) |
Fertility by Education in Temple
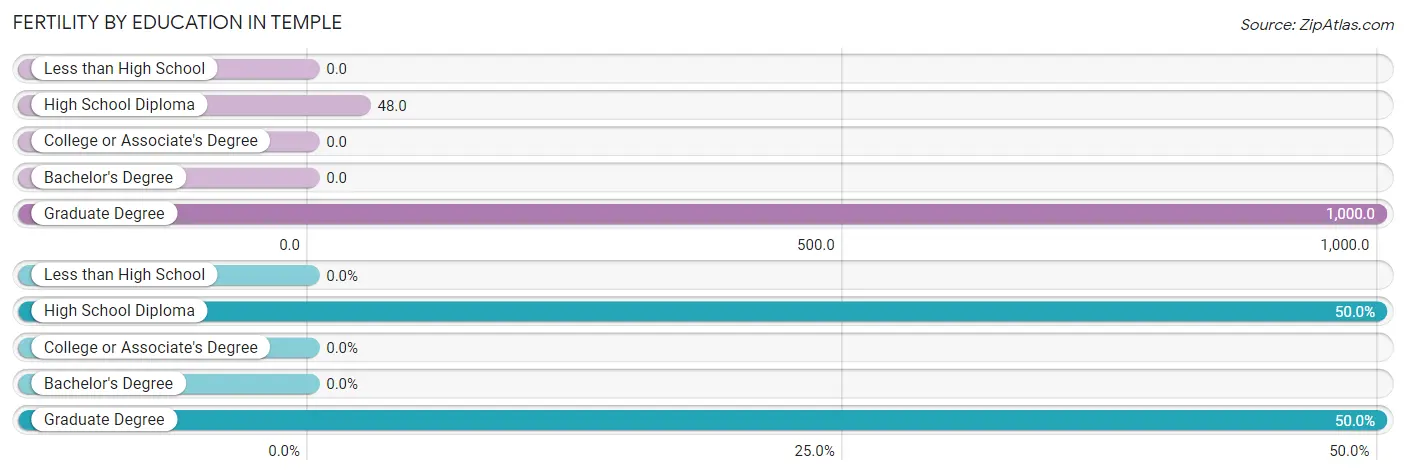
| Educational Attainment | Women with Births | Births / 1,000 Women |
| Less than High School | 0 (0.0%) | 0.0 |
| High School Diploma | 5 (50.0%) | 48.0 |
| College or Associate's Degree | 0 (0.0%) | 0.0 |
| Bachelor's Degree | 0 (0.0%) | 0.0 |
| Graduate Degree | 5 (50.0%) | 1,000.0 |
| Total | 10 (100.0%) | 17.0 |
Fertility by Education by Marriage Status in Temple
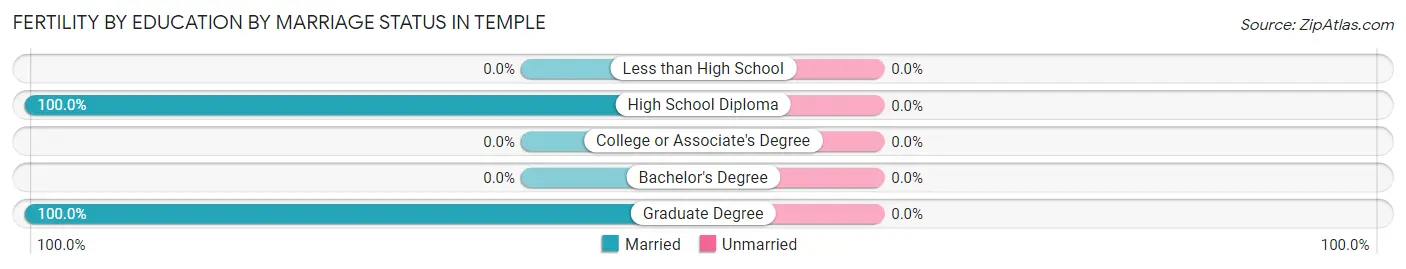
| Educational Attainment | Married | Unmarried |
| Less than High School | 0 (0.0%) | 0 (0.0%) |
| High School Diploma | 5 (100.0%) | 0 (0.0%) |
| College or Associate's Degree | 0 (0.0%) | 0 (0.0%) |
| Bachelor's Degree | 0 (0.0%) | 0 (0.0%) |
| Graduate Degree | 5 (100.0%) | 0 (0.0%) |
| Total | 10 (100.0%) | 0 (0.0%) |
Employment Characteristics in Temple
Employment by Class of Employer in Temple
Among the 1,052 employed individuals in Temple, private company employees (822 | 78.1%), local government employees (146 | 13.9%), and not-for-profit organizations (55 | 5.2%) make up the most common classes of employment.
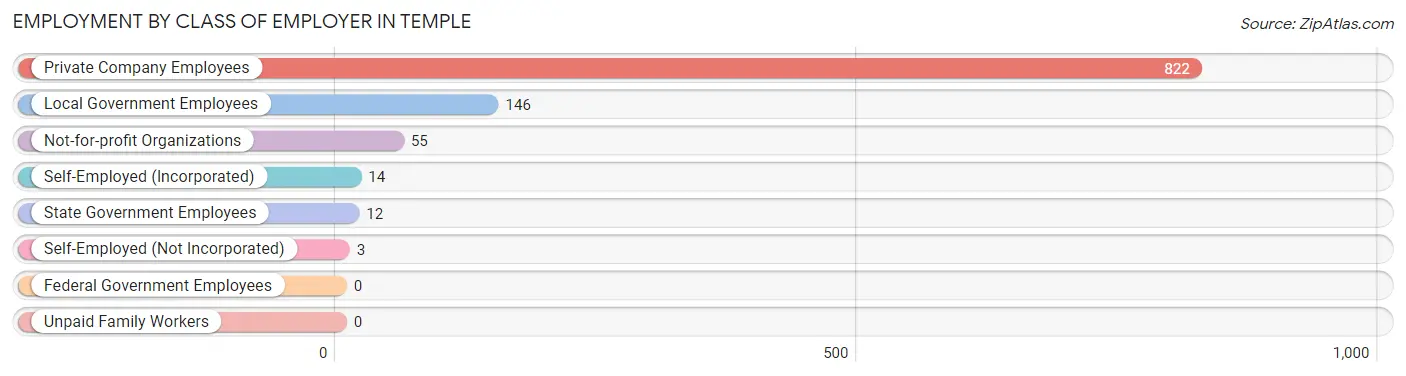
| Employer Class | # Employees | % Employees |
| Private Company Employees | 822 | 78.1% |
| Self-Employed (Incorporated) | 14 | 1.3% |
| Self-Employed (Not Incorporated) | 3 | 0.3% |
| Not-for-profit Organizations | 55 | 5.2% |
| Local Government Employees | 146 | 13.9% |
| State Government Employees | 12 | 1.1% |
| Federal Government Employees | 0 | 0.0% |
| Unpaid Family Workers | 0 | 0.0% |
| Total | 1,052 | 100.0% |
Employment Status by Age in Temple
According to the labor force statistics for Temple, out of the total population over 16 years of age (1,575), 73.8% or 1,162 individuals are in the labor force, with 7.7% or 89 of them unemployed. The age group with the highest labor force participation rate is 25 to 29 years, with 100.0% or 60 individuals in the labor force. Within the labor force, the 20 to 24 years age range has the highest percentage of unemployed individuals, with 28.9% or 43 of them being unemployed.
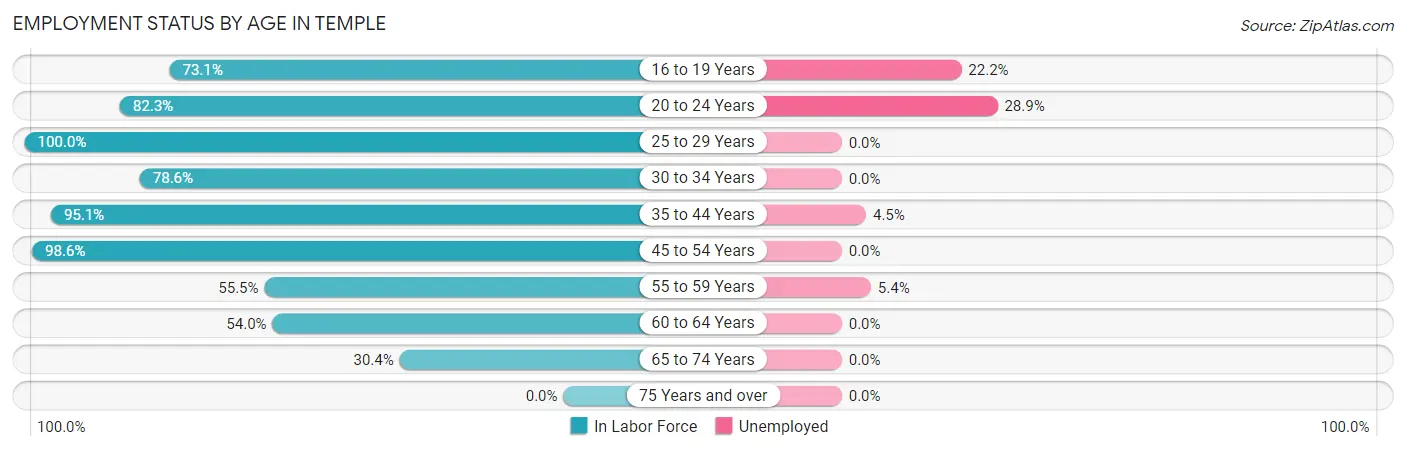
| Age Bracket | In Labor Force | Unemployed |
| 16 to 19 Years | 117 (73.1%) | 26 (22.2%) |
| 20 to 24 Years | 149 (82.3%) | 43 (28.9%) |
| 25 to 29 Years | 60 (100.0%) | 0 (0.0%) |
| 30 to 34 Years | 169 (78.6%) | 0 (0.0%) |
| 35 to 44 Years | 331 (95.1%) | 15 (4.5%) |
| 45 to 54 Years | 143 (98.6%) | 0 (0.0%) |
| 55 to 59 Years | 111 (55.5%) | 6 (5.4%) |
| 60 to 64 Years | 68 (54.0%) | 0 (0.0%) |
| 65 to 74 Years | 14 (30.4%) | 0 (0.0%) |
| 75 Years and over | 0 (0.0%) | 0 (0.0%) |
| Total | 1,162 (73.8%) | 89 (7.7%) |
Employment Status by Educational Attainment in Temple
According to labor force statistics for Temple, 80.6% of individuals (882) out of the total population between 25 and 64 years of age (1,094) are in the labor force, with 2.4% or 21 of them being unemployed. The group with the highest labor force participation rate are those with the educational attainment of bachelor's degree or higher, with 100.0% or 129 individuals in the labor force. Within the labor force, individuals with high school diploma education have the highest percentage of unemployment, with 6.7% or 21 of them being unemployed.
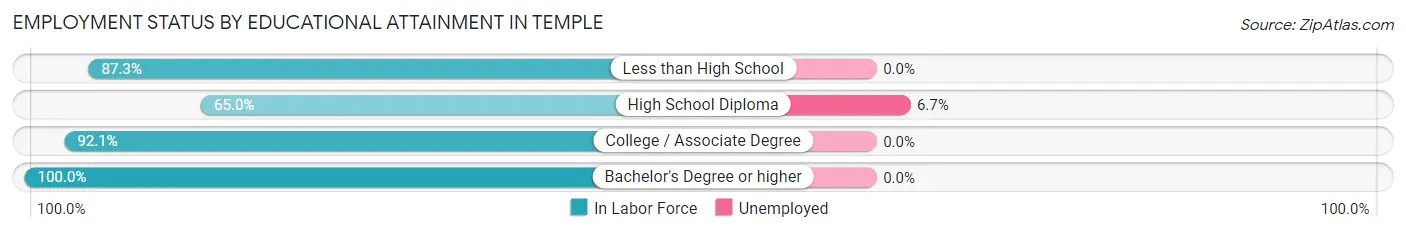
| Educational Attainment | In Labor Force | Unemployed |
| Less than High School | 89 (87.3%) | 0 (0.0%) |
| High School Diploma | 314 (65.0%) | 32 (6.7%) |
| College / Associate Degree | 350 (92.1%) | 0 (0.0%) |
| Bachelor's Degree or higher | 129 (100.0%) | 0 (0.0%) |
| Total | 882 (80.6%) | 26 (2.4%) |
Employment Occupations by Sex in Temple
Management, Business, Science and Arts Occupations
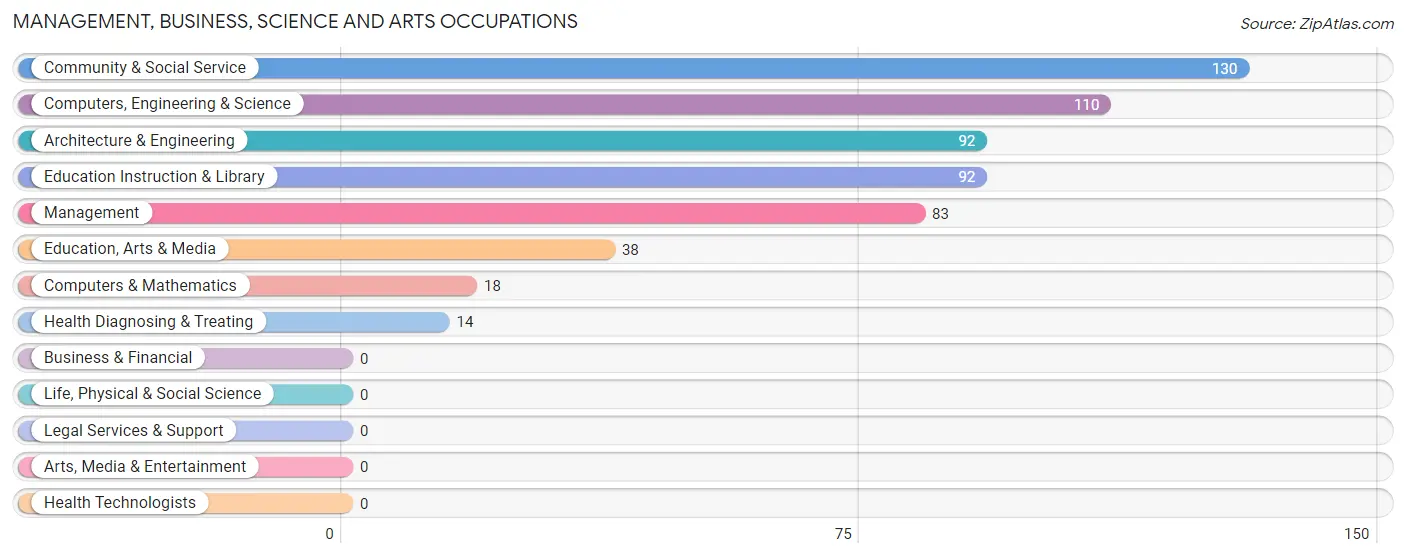
The most common Management, Business, Science and Arts occupations in Temple are Community & Social Service (130 | 12.1%), Computers, Engineering & Science (110 | 10.3%), Architecture & Engineering (92 | 8.6%), Education Instruction & Library (92 | 8.6%), and Management (83 | 7.7%).
Management, Business, Science and Arts Occupations by Sex
Within the Management, Business, Science and Arts occupations in Temple, the most male-oriented occupations are Computers & Mathematics (100.0%), Management (59.0%), and Computers, Engineering & Science (33.6%), while the most female-oriented occupations are Education Instruction & Library (100.0%), Health Diagnosing & Treating (100.0%), and Community & Social Service (95.4%).
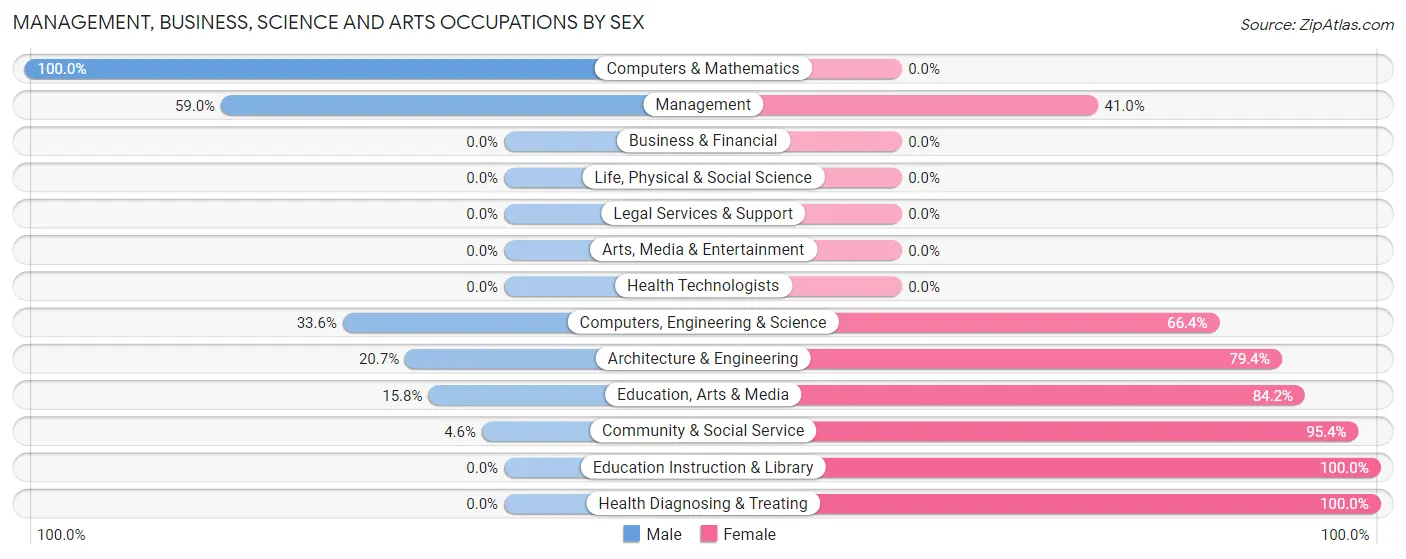
| Occupation | Male | Female |
| Management | 49 (59.0%) | 34 (41.0%) |
| Business & Financial | 0 (0.0%) | 0 (0.0%) |
| Computers, Engineering & Science | 37 (33.6%) | 73 (66.4%) |
| Computers & Mathematics | 18 (100.0%) | 0 (0.0%) |
| Architecture & Engineering | 19 (20.6%) | 73 (79.3%) |
| Life, Physical & Social Science | 0 (0.0%) | 0 (0.0%) |
| Community & Social Service | 6 (4.6%) | 124 (95.4%) |
| Education, Arts & Media | 6 (15.8%) | 32 (84.2%) |
| Legal Services & Support | 0 (0.0%) | 0 (0.0%) |
| Education Instruction & Library | 0 (0.0%) | 92 (100.0%) |
| Arts, Media & Entertainment | 0 (0.0%) | 0 (0.0%) |
| Health Diagnosing & Treating | 0 (0.0%) | 14 (100.0%) |
| Health Technologists | 0 (0.0%) | 0 (0.0%) |
| Total (Category) | 92 (27.3%) | 245 (72.7%) |
| Total (Overall) | 435 (40.6%) | 637 (59.4%) |
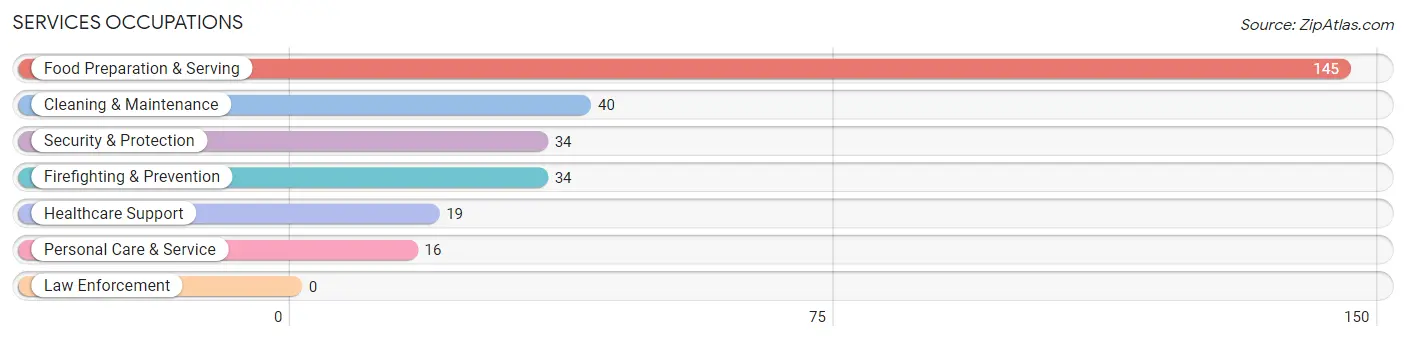
Services Occupations
The most common Services occupations in Temple are Food Preparation & Serving (145 | 13.5%), Cleaning & Maintenance (40 | 3.7%), Security & Protection (34 | 3.2%), Firefighting & Prevention (34 | 3.2%), and Healthcare Support (19 | 1.8%).
Services Occupations by Sex
Within the Services occupations in Temple, the most male-oriented occupations are Cleaning & Maintenance (100.0%), Personal Care & Service (100.0%), and Healthcare Support (73.7%), while the most female-oriented occupations are Food Preparation & Serving (86.2%), Security & Protection (52.9%), and Firefighting & Prevention (52.9%).
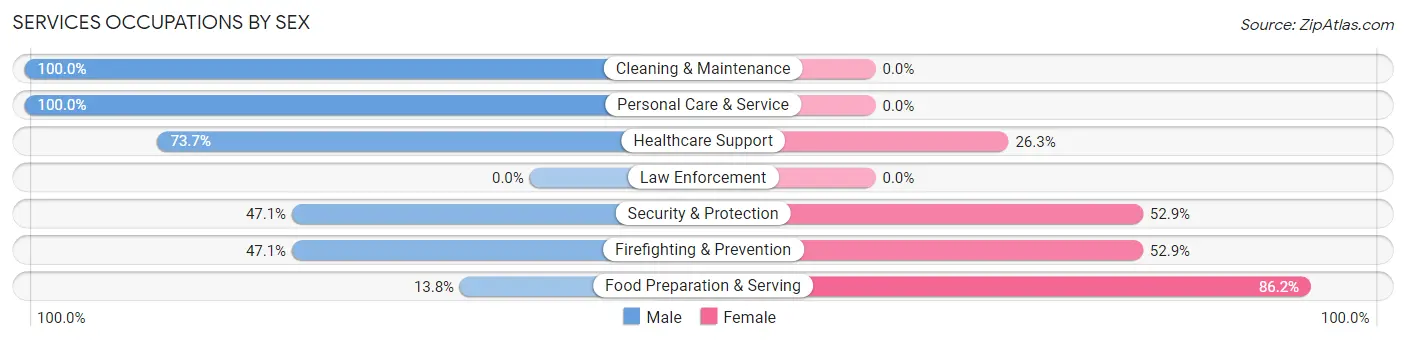
| Occupation | Male | Female |
| Healthcare Support | 14 (73.7%) | 5 (26.3%) |
| Security & Protection | 16 (47.1%) | 18 (52.9%) |
| Firefighting & Prevention | 16 (47.1%) | 18 (52.9%) |
| Law Enforcement | 0 (0.0%) | 0 (0.0%) |
| Food Preparation & Serving | 20 (13.8%) | 125 (86.2%) |
| Cleaning & Maintenance | 40 (100.0%) | 0 (0.0%) |
| Personal Care & Service | 16 (100.0%) | 0 (0.0%) |
| Total (Category) | 106 (41.7%) | 148 (58.3%) |
| Total (Overall) | 435 (40.6%) | 637 (59.4%) |
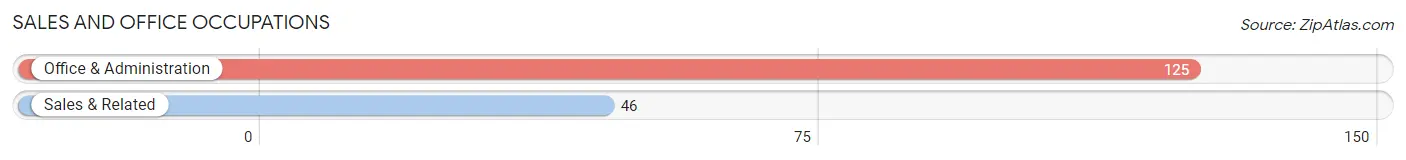
Sales and Office Occupations
The most common Sales and Office occupations in Temple are Office & Administration (125 | 11.7%), and Sales & Related (46 | 4.3%).
Sales and Office Occupations by Sex
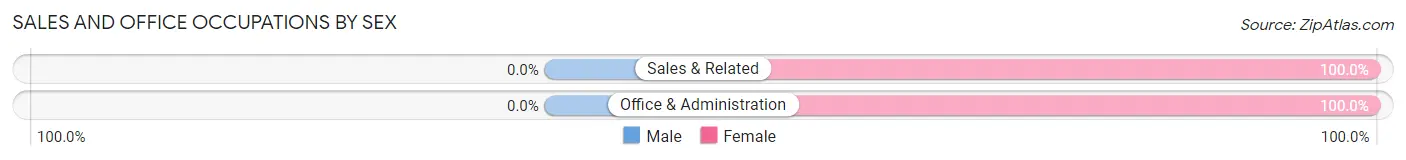
| Occupation | Male | Female |
| Sales & Related | 0 (0.0%) | 46 (100.0%) |
| Office & Administration | 0 (0.0%) | 125 (100.0%) |
| Total (Category) | 0 (0.0%) | 171 (100.0%) |
| Total (Overall) | 435 (40.6%) | 637 (59.4%) |
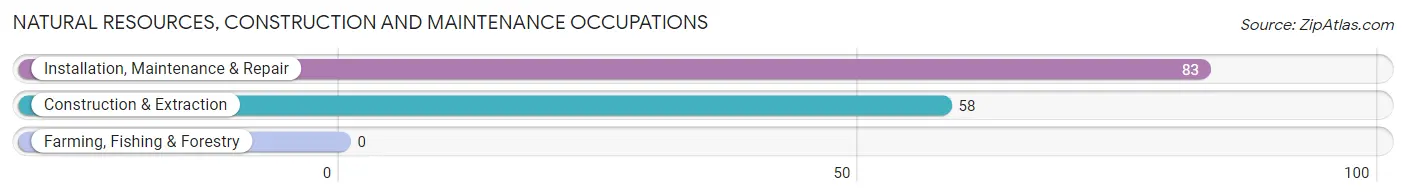
Natural Resources, Construction and Maintenance Occupations
The most common Natural Resources, Construction and Maintenance occupations in Temple are Installation, Maintenance & Repair (83 | 7.7%), and Construction & Extraction (58 | 5.4%).
Natural Resources, Construction and Maintenance Occupations by Sex
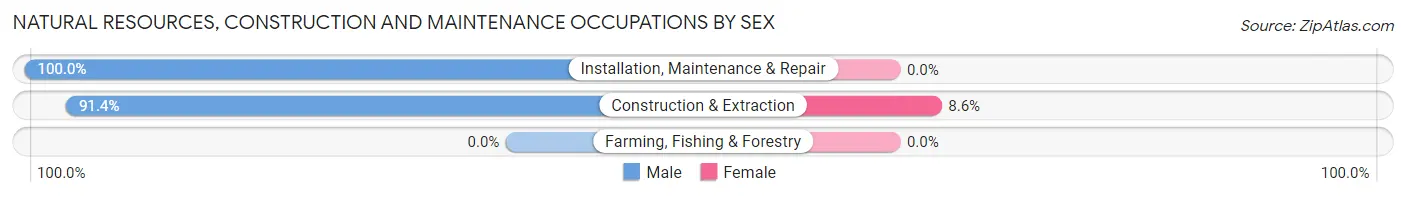
| Occupation | Male | Female |
| Farming, Fishing & Forestry | 0 (0.0%) | 0 (0.0%) |
| Construction & Extraction | 53 (91.4%) | 5 (8.6%) |
| Installation, Maintenance & Repair | 83 (100.0%) | 0 (0.0%) |
| Total (Category) | 136 (96.5%) | 5 (3.5%) |
| Total (Overall) | 435 (40.6%) | 637 (59.4%) |
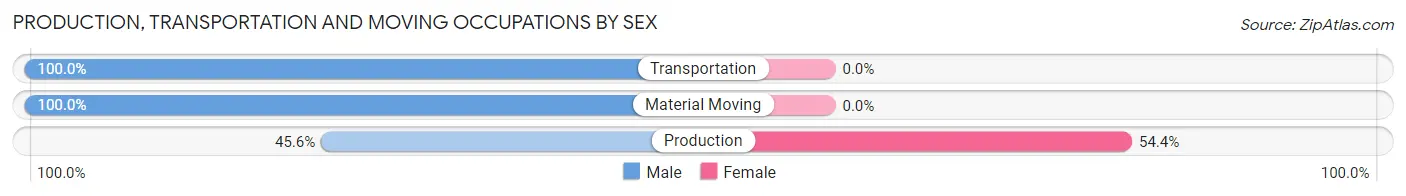
Production, Transportation and Moving Occupations
The most common Production, Transportation and Moving occupations in Temple are Production (125 | 11.7%), Material Moving (39 | 3.6%), and Transportation (5 | 0.5%).
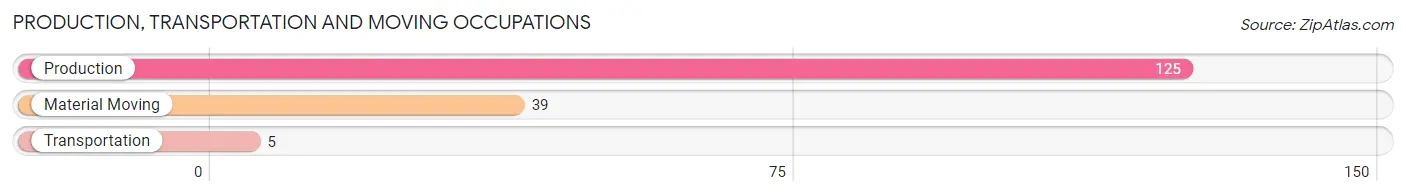
Production, Transportation and Moving Occupations by Sex
| Occupation | Male | Female |
| Production | 57 (45.6%) | 68 (54.4%) |
| Transportation | 5 (100.0%) | 0 (0.0%) |
| Material Moving | 39 (100.0%) | 0 (0.0%) |
| Total (Category) | 101 (59.8%) | 68 (40.2%) |
| Total (Overall) | 435 (40.6%) | 637 (59.4%) |
Employment Industries by Sex in Temple
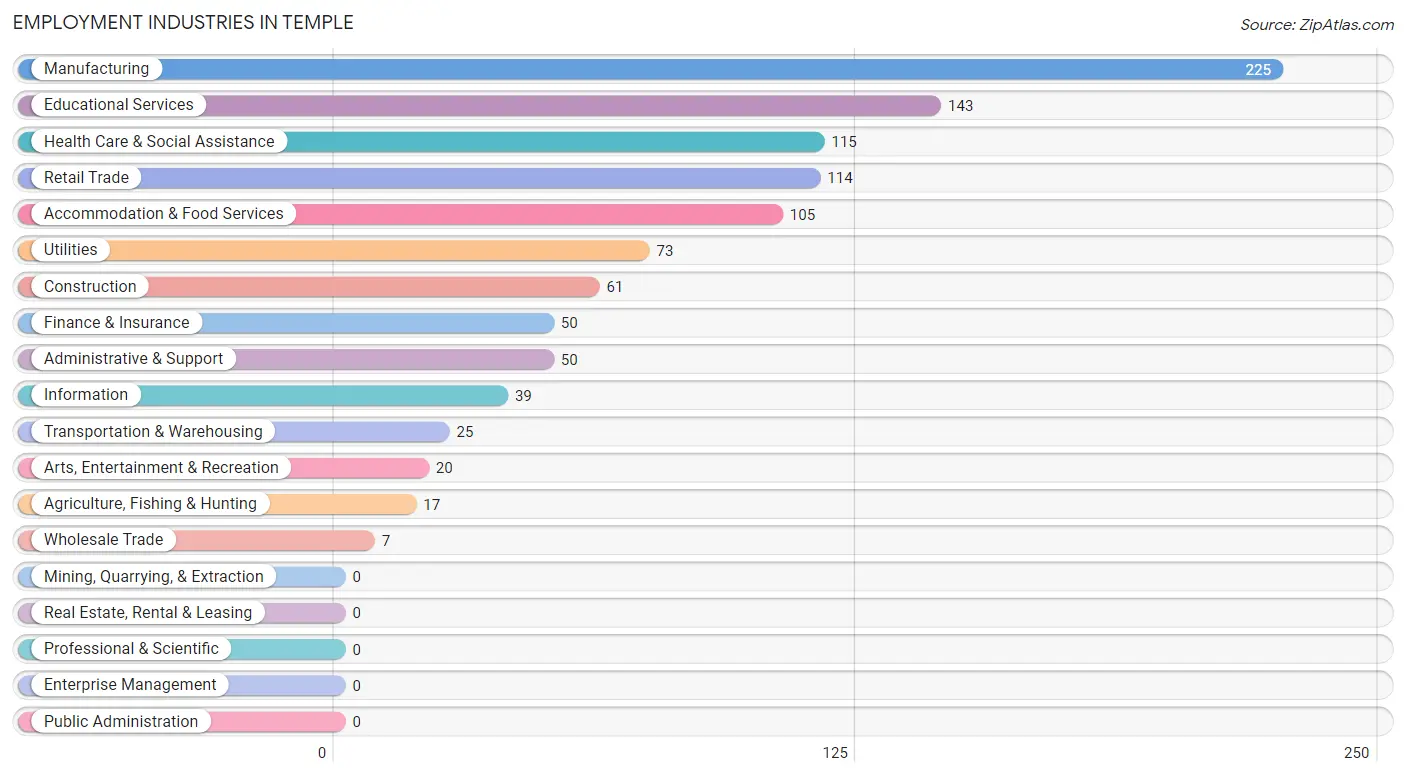
Employment Industries in Temple
The major employment industries in Temple include Manufacturing (225 | 21.0%), Educational Services (143 | 13.3%), Health Care & Social Assistance (115 | 10.7%), Retail Trade (114 | 10.6%), and Accommodation & Food Services (105 | 9.8%).
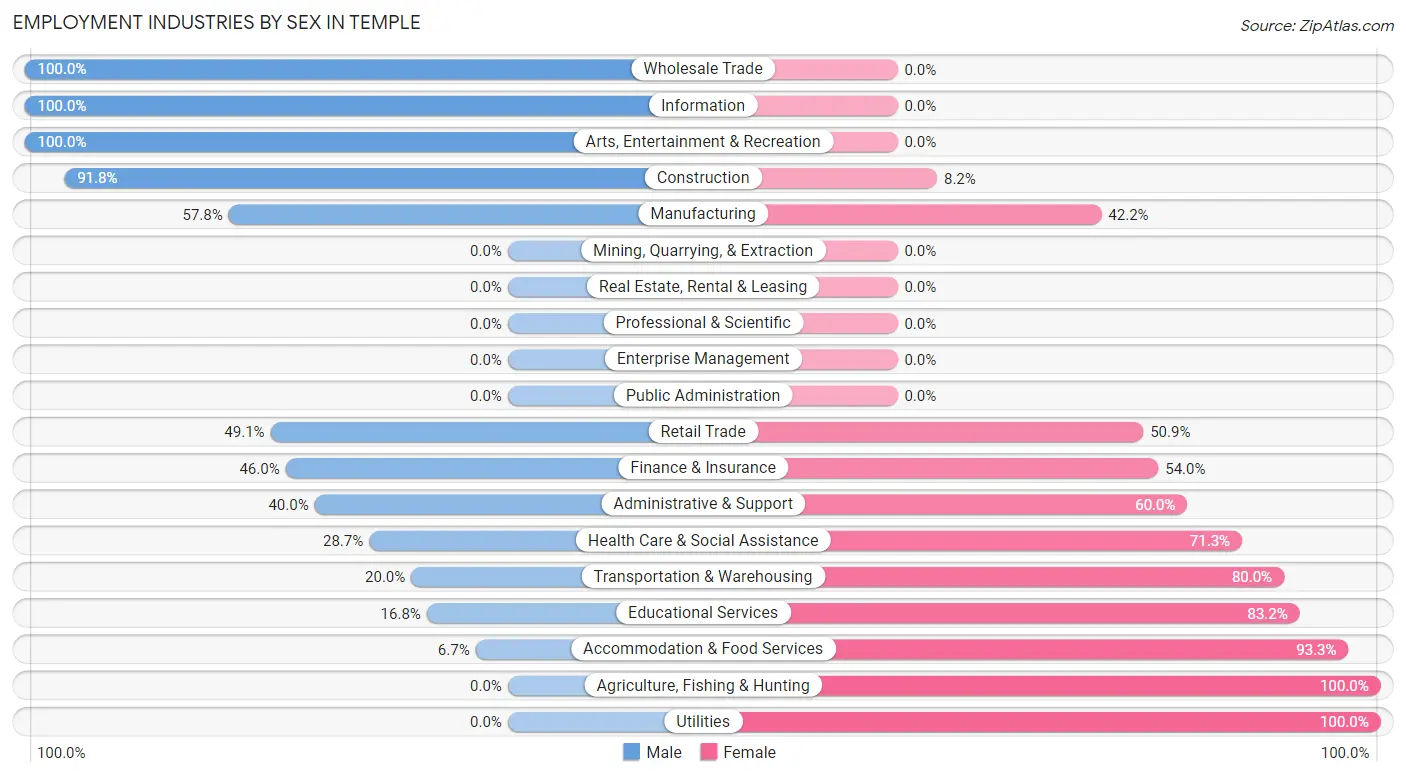
Employment Industries by Sex in Temple
The Temple industries that see more men than women are Wholesale Trade (100.0%), Information (100.0%), and Arts, Entertainment & Recreation (100.0%), whereas the industries that tend to have a higher number of women are Agriculture, Fishing & Hunting (100.0%), Utilities (100.0%), and Accommodation & Food Services (93.3%).
| Industry | Male | Female |
| Agriculture, Fishing & Hunting | 0 (0.0%) | 17 (100.0%) |
| Mining, Quarrying, & Extraction | 0 (0.0%) | 0 (0.0%) |
| Construction | 56 (91.8%) | 5 (8.2%) |
| Manufacturing | 130 (57.8%) | 95 (42.2%) |
| Wholesale Trade | 7 (100.0%) | 0 (0.0%) |
| Retail Trade | 56 (49.1%) | 58 (50.9%) |
| Transportation & Warehousing | 5 (20.0%) | 20 (80.0%) |
| Utilities | 0 (0.0%) | 73 (100.0%) |
| Information | 39 (100.0%) | 0 (0.0%) |
| Finance & Insurance | 23 (46.0%) | 27 (54.0%) |
| Real Estate, Rental & Leasing | 0 (0.0%) | 0 (0.0%) |
| Professional & Scientific | 0 (0.0%) | 0 (0.0%) |
| Enterprise Management | 0 (0.0%) | 0 (0.0%) |
| Administrative & Support | 20 (40.0%) | 30 (60.0%) |
| Educational Services | 24 (16.8%) | 119 (83.2%) |
| Health Care & Social Assistance | 33 (28.7%) | 82 (71.3%) |
| Arts, Entertainment & Recreation | 20 (100.0%) | 0 (0.0%) |
| Accommodation & Food Services | 7 (6.7%) | 98 (93.3%) |
| Public Administration | 0 (0.0%) | 0 (0.0%) |
| Total | 435 (40.6%) | 637 (59.4%) |
Education in Temple
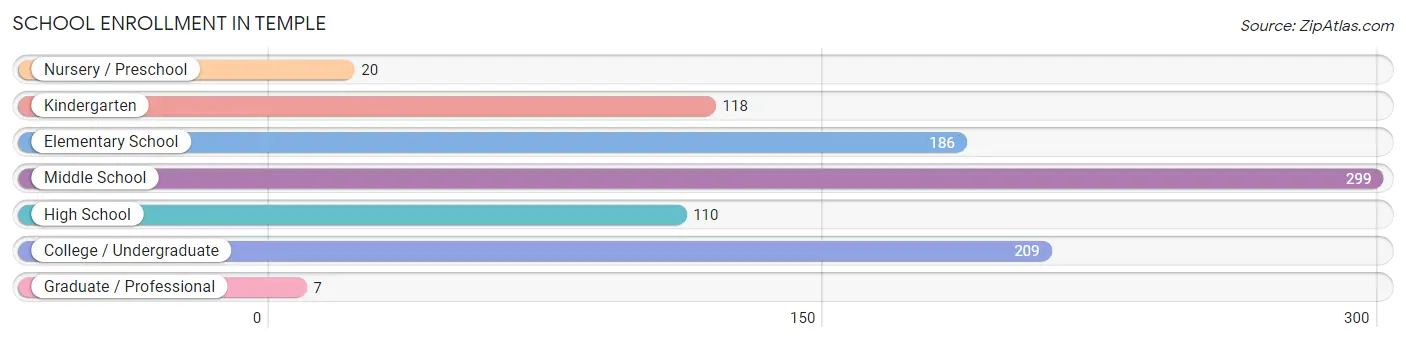
School Enrollment in Temple
The most common levels of schooling among the 949 students in Temple are middle school (299 | 31.5%), college / undergraduate (209 | 22.0%), and elementary school (186 | 19.6%).
| School Level | # Students | % Students |
| Nursery / Preschool | 20 | 2.1% |
| Kindergarten | 118 | 12.4% |
| Elementary School | 186 | 19.6% |
| Middle School | 299 | 31.5% |
| High School | 110 | 11.6% |
| College / Undergraduate | 209 | 22.0% |
| Graduate / Professional | 7 | 0.7% |
| Total | 949 | 100.0% |
School Enrollment by Age by Funding Source in Temple
Out of a total of 949 students who are enrolled in schools in Temple, 81 (8.5%) attend a private institution, while the remaining 868 (91.5%) are enrolled in public schools. The age group of 35 years and over has the highest likelihood of being enrolled in private schools, with 27 (50.0% in the age bracket) enrolled. Conversely, the age group of 3 to 4 year olds has the lowest likelihood of being enrolled in a private school, with 20 (100.0% in the age bracket) attending a public institution.
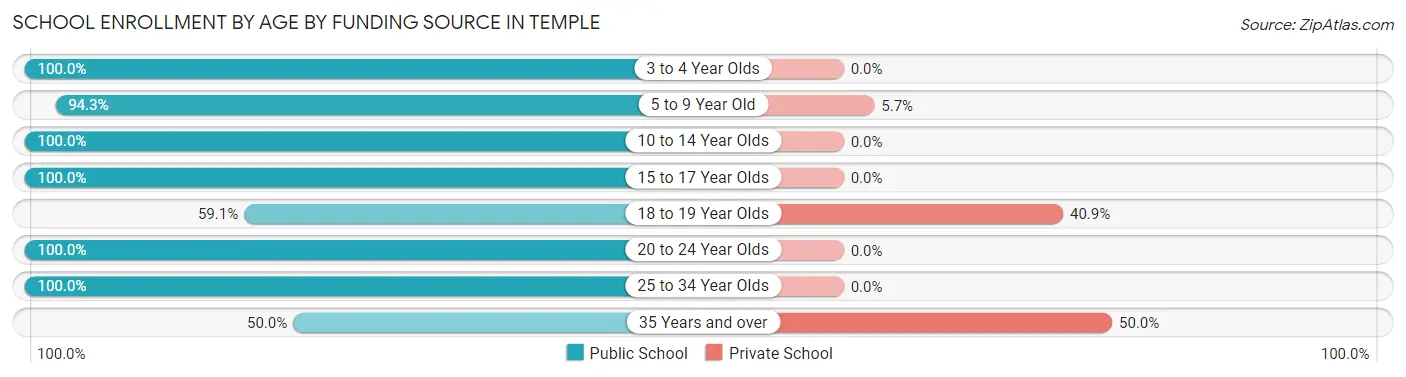
| Age Bracket | Public School | Private School |
| 3 to 4 Year Olds | 20 (100.0%) | 0 (0.0%) |
| 5 to 9 Year Old | 264 (94.3%) | 16 (5.7%) |
| 10 to 14 Year Olds | 323 (100.0%) | 0 (0.0%) |
| 15 to 17 Year Olds | 88 (100.0%) | 0 (0.0%) |
| 18 to 19 Year Olds | 55 (59.1%) | 38 (40.9%) |
| 20 to 24 Year Olds | 72 (100.0%) | 0 (0.0%) |
| 25 to 34 Year Olds | 19 (100.0%) | 0 (0.0%) |
| 35 Years and over | 27 (50.0%) | 27 (50.0%) |
| Total | 868 (91.5%) | 81 (8.5%) |
Educational Attainment by Field of Study in Temple
Liberal arts & history (36 | 26.9%), multidisciplinary studies (24 | 17.9%), education (20 | 14.9%), engineering (19 | 14.2%), and bio, nature & agricultural (11 | 8.2%) are the most common fields of study among 134 individuals in Temple who have obtained a bachelor's degree or higher.
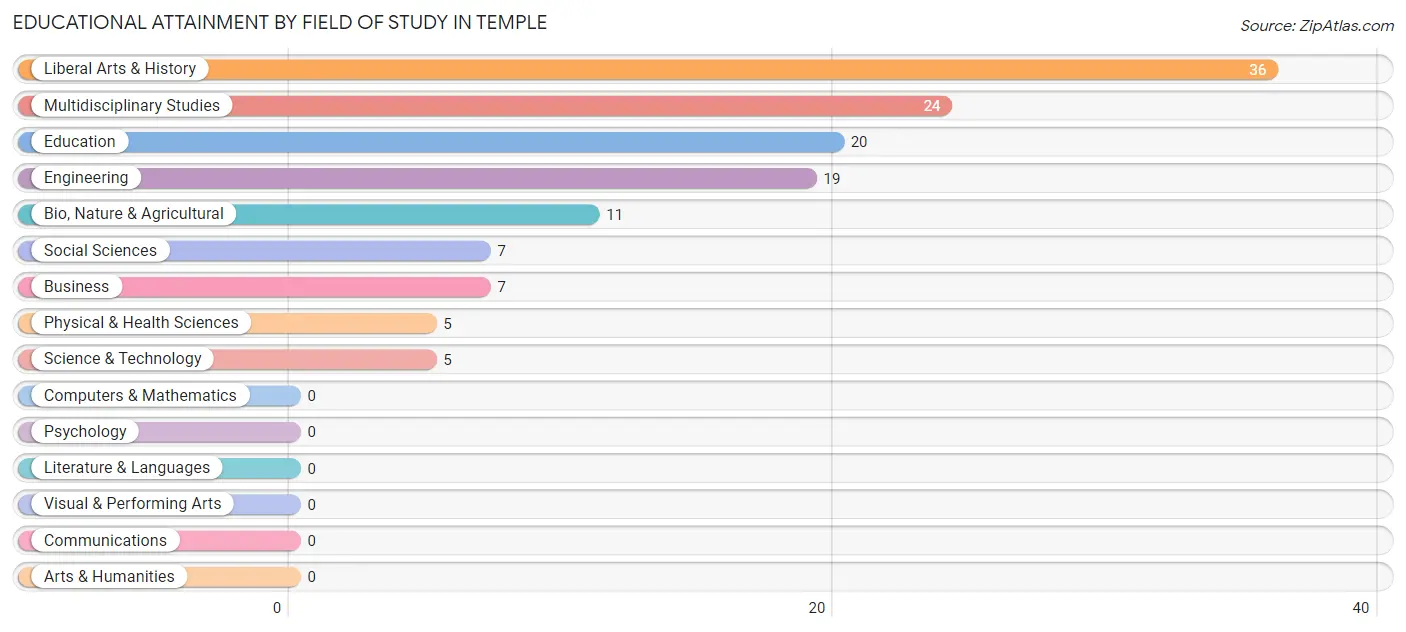
| Field of Study | # Graduates | % Graduates |
| Computers & Mathematics | 0 | 0.0% |
| Bio, Nature & Agricultural | 11 | 8.2% |
| Physical & Health Sciences | 5 | 3.7% |
| Psychology | 0 | 0.0% |
| Social Sciences | 7 | 5.2% |
| Engineering | 19 | 14.2% |
| Multidisciplinary Studies | 24 | 17.9% |
| Science & Technology | 5 | 3.7% |
| Business | 7 | 5.2% |
| Education | 20 | 14.9% |
| Literature & Languages | 0 | 0.0% |
| Liberal Arts & History | 36 | 26.9% |
| Visual & Performing Arts | 0 | 0.0% |
| Communications | 0 | 0.0% |
| Arts & Humanities | 0 | 0.0% |
| Total | 134 | 100.0% |
Transportation & Commute in Temple
Vehicle Availability by Sex in Temple
The most prevalent vehicle ownership categories in Temple are males with 2 vehicles (175, accounting for 40.2%) and females with 2 vehicles (289, making up 28.4%).
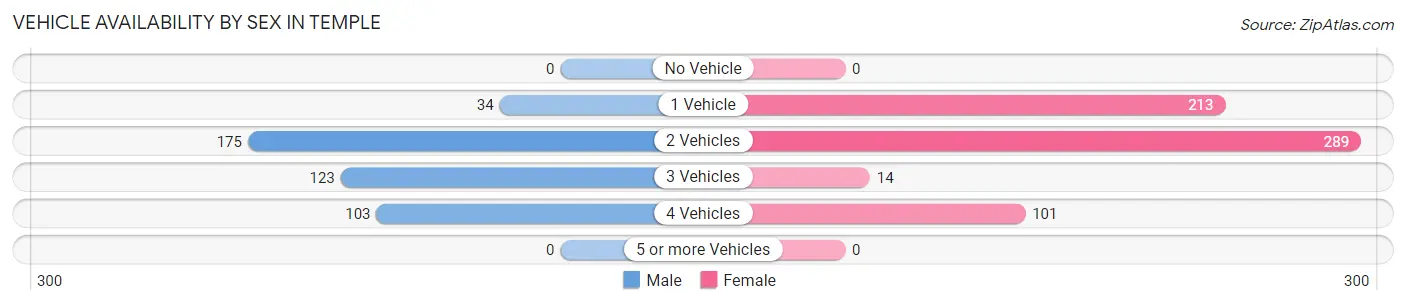
| Vehicles Available | Male | Female |
| No Vehicle | 0 (0.0%) | 0 (0.0%) |
| 1 Vehicle | 34 (7.8%) | 213 (34.5%) |
| 2 Vehicles | 175 (40.2%) | 289 (46.8%) |
| 3 Vehicles | 123 (28.3%) | 14 (2.3%) |
| 4 Vehicles | 103 (23.7%) | 101 (16.4%) |
| 5 or more Vehicles | 0 (0.0%) | 0 (0.0%) |
| Total | 435 (100.0%) | 617 (100.0%) |
Commute Time in Temple
The most frequently occuring commute durations in Temple are 15 to 19 minutes (289 commuters, 29.0%), 5 to 9 minutes (184 commuters, 18.5%), and 10 to 14 minutes (128 commuters, 12.9%).
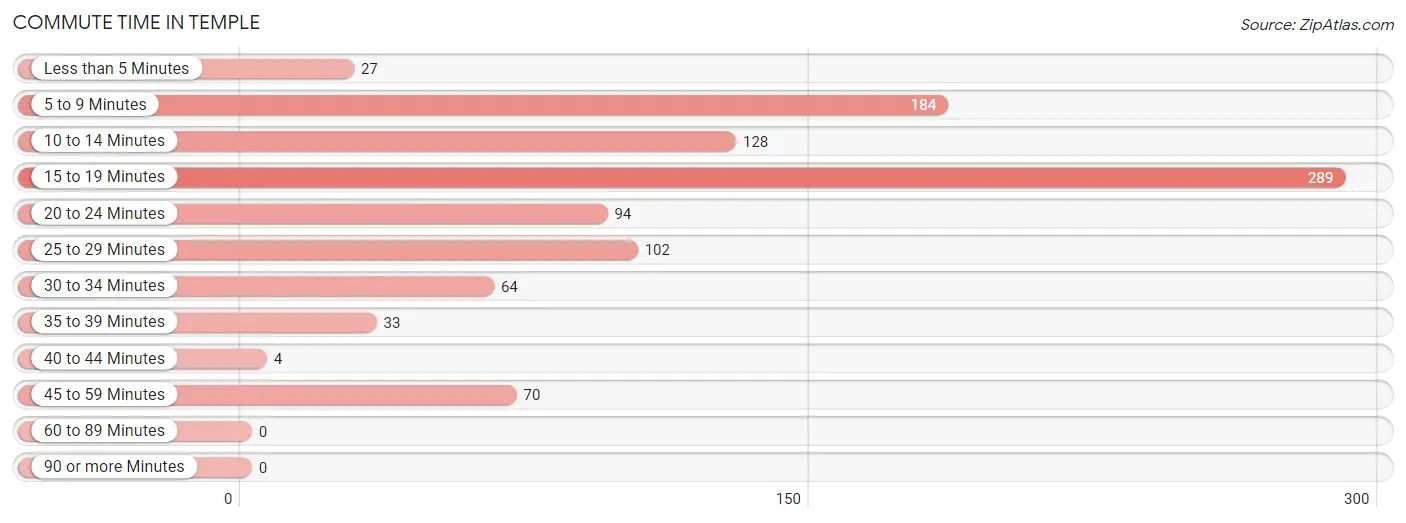
| Commute Time | # Commuters | % Commuters |
| Less than 5 Minutes | 27 | 2.7% |
| 5 to 9 Minutes | 184 | 18.5% |
| 10 to 14 Minutes | 128 | 12.9% |
| 15 to 19 Minutes | 289 | 29.0% |
| 20 to 24 Minutes | 94 | 9.5% |
| 25 to 29 Minutes | 102 | 10.2% |
| 30 to 34 Minutes | 64 | 6.4% |
| 35 to 39 Minutes | 33 | 3.3% |
| 40 to 44 Minutes | 4 | 0.4% |
| 45 to 59 Minutes | 70 | 7.0% |
| 60 to 89 Minutes | 0 | 0.0% |
| 90 or more Minutes | 0 | 0.0% |
Commute Time by Sex in Temple
The most common commute times in Temple are 10 to 14 minutes (105 commuters, 24.1%) for males and 15 to 19 minutes (230 commuters, 41.1%) for females.
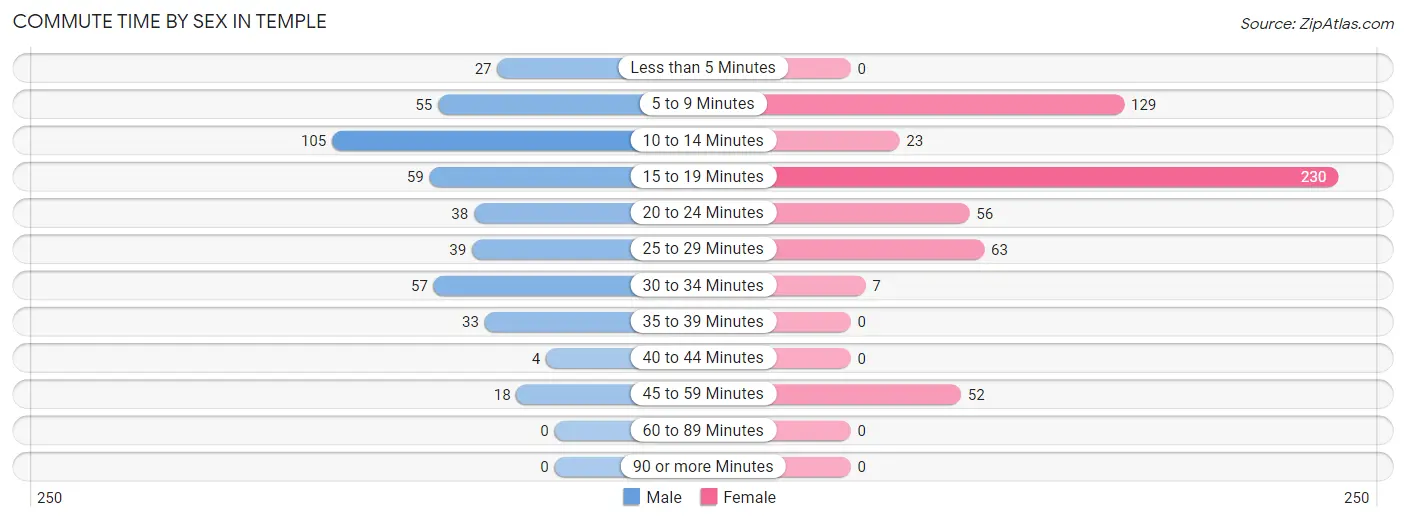
| Commute Time | Male | Female |
| Less than 5 Minutes | 27 (6.2%) | 0 (0.0%) |
| 5 to 9 Minutes | 55 (12.6%) | 129 (23.0%) |
| 10 to 14 Minutes | 105 (24.1%) | 23 (4.1%) |
| 15 to 19 Minutes | 59 (13.6%) | 230 (41.1%) |
| 20 to 24 Minutes | 38 (8.7%) | 56 (10.0%) |
| 25 to 29 Minutes | 39 (9.0%) | 63 (11.3%) |
| 30 to 34 Minutes | 57 (13.1%) | 7 (1.3%) |
| 35 to 39 Minutes | 33 (7.6%) | 0 (0.0%) |
| 40 to 44 Minutes | 4 (0.9%) | 0 (0.0%) |
| 45 to 59 Minutes | 18 (4.1%) | 52 (9.3%) |
| 60 to 89 Minutes | 0 (0.0%) | 0 (0.0%) |
| 90 or more Minutes | 0 (0.0%) | 0 (0.0%) |
Time of Departure to Work by Sex in Temple
The most frequent times of departure to work in Temple are 5:30 AM to 5:59 AM (125, 28.7%) for males and 7:30 AM to 7:59 AM (169, 30.2%) for females.
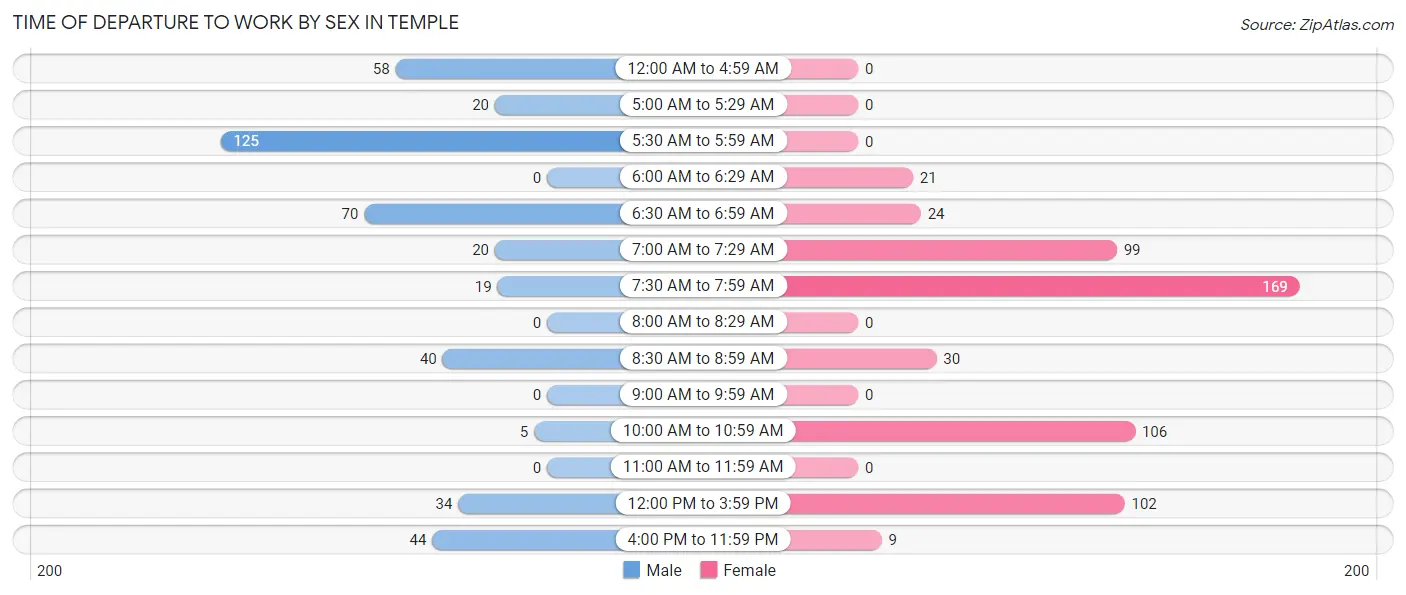
| Time of Departure | Male | Female |
| 12:00 AM to 4:59 AM | 58 (13.3%) | 0 (0.0%) |
| 5:00 AM to 5:29 AM | 20 (4.6%) | 0 (0.0%) |
| 5:30 AM to 5:59 AM | 125 (28.7%) | 0 (0.0%) |
| 6:00 AM to 6:29 AM | 0 (0.0%) | 21 (3.7%) |
| 6:30 AM to 6:59 AM | 70 (16.1%) | 24 (4.3%) |
| 7:00 AM to 7:29 AM | 20 (4.6%) | 99 (17.7%) |
| 7:30 AM to 7:59 AM | 19 (4.4%) | 169 (30.2%) |
| 8:00 AM to 8:29 AM | 0 (0.0%) | 0 (0.0%) |
| 8:30 AM to 8:59 AM | 40 (9.2%) | 30 (5.4%) |
| 9:00 AM to 9:59 AM | 0 (0.0%) | 0 (0.0%) |
| 10:00 AM to 10:59 AM | 5 (1.1%) | 106 (18.9%) |
| 11:00 AM to 11:59 AM | 0 (0.0%) | 0 (0.0%) |
| 12:00 PM to 3:59 PM | 34 (7.8%) | 102 (18.2%) |
| 4:00 PM to 11:59 PM | 44 (10.1%) | 9 (1.6%) |
| Total | 435 (100.0%) | 560 (100.0%) |
Housing Occupancy in Temple
Occupancy by Ownership in Temple
Of the total 802 dwellings in Temple, owner-occupied units account for 556 (69.3%), while renter-occupied units make up 246 (30.7%).
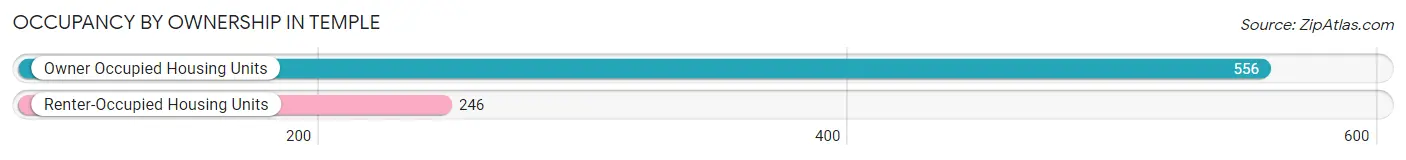
| Occupancy | # Housing Units | % Housing Units |
| Owner Occupied Housing Units | 556 | 69.3% |
| Renter-Occupied Housing Units | 246 | 30.7% |
| Total Occupied Housing Units | 802 | 100.0% |
Occupancy by Household Size in Temple
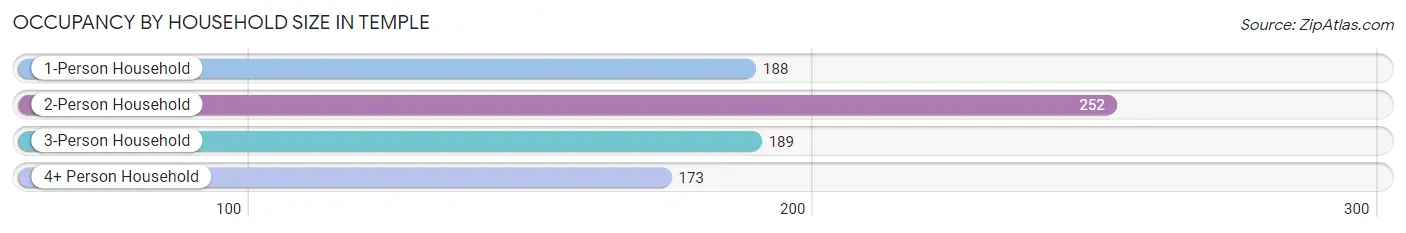
| Household Size | # Housing Units | % Housing Units |
| 1-Person Household | 188 | 23.4% |
| 2-Person Household | 252 | 31.4% |
| 3-Person Household | 189 | 23.6% |
| 4+ Person Household | 173 | 21.6% |
| Total Housing Units | 802 | 100.0% |
Occupancy by Ownership by Household Size in Temple
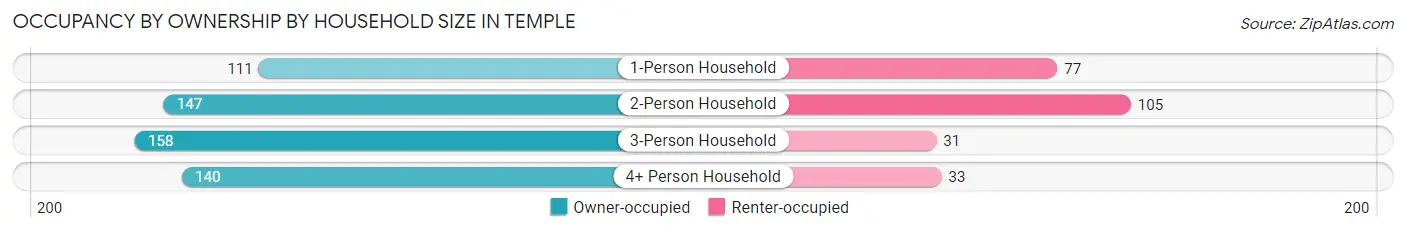
| Household Size | Owner-occupied | Renter-occupied |
| 1-Person Household | 111 (59.0%) | 77 (41.0%) |
| 2-Person Household | 147 (58.3%) | 105 (41.7%) |
| 3-Person Household | 158 (83.6%) | 31 (16.4%) |
| 4+ Person Household | 140 (80.9%) | 33 (19.1%) |
| Total Housing Units | 556 (69.3%) | 246 (30.7%) |
Occupancy by Educational Attainment in Temple
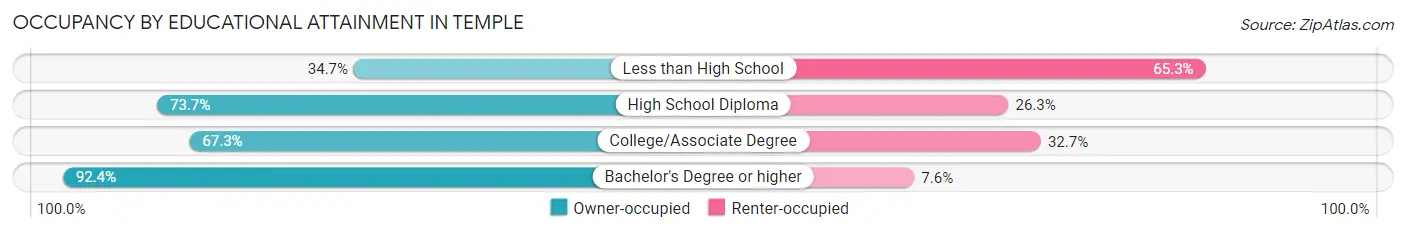
| Household Size | Owner-occupied | Renter-occupied |
| Less than High School | 25 (34.7%) | 47 (65.3%) |
| High School Diploma | 264 (73.7%) | 94 (26.3%) |
| College/Associate Degree | 206 (67.3%) | 100 (32.7%) |
| Bachelor's Degree or higher | 61 (92.4%) | 5 (7.6%) |
Occupancy by Age of Householder in Temple
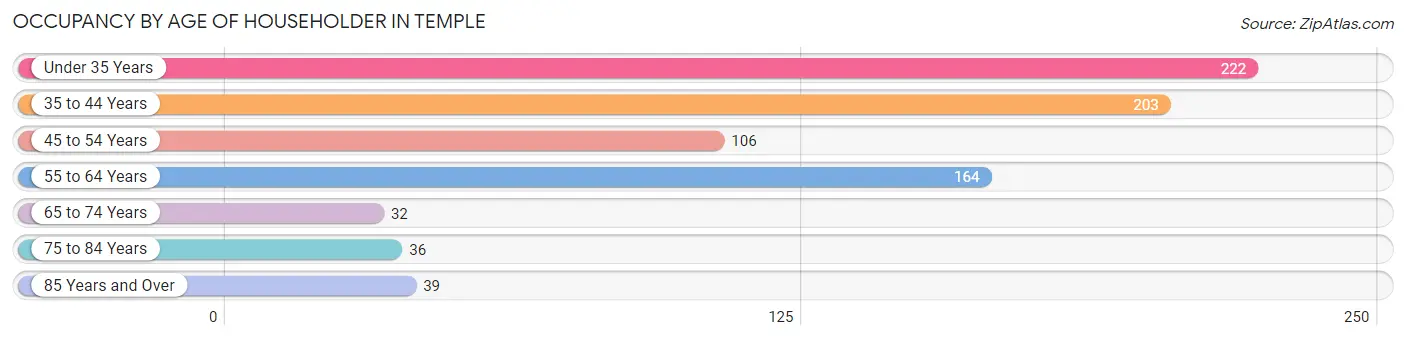
| Age Bracket | # Households | % Households |
| Under 35 Years | 222 | 27.7% |
| 35 to 44 Years | 203 | 25.3% |
| 45 to 54 Years | 106 | 13.2% |
| 55 to 64 Years | 164 | 20.4% |
| 65 to 74 Years | 32 | 4.0% |
| 75 to 84 Years | 36 | 4.5% |
| 85 Years and Over | 39 | 4.9% |
| Total | 802 | 100.0% |
Housing Finances in Temple
Median Income by Occupancy in Temple
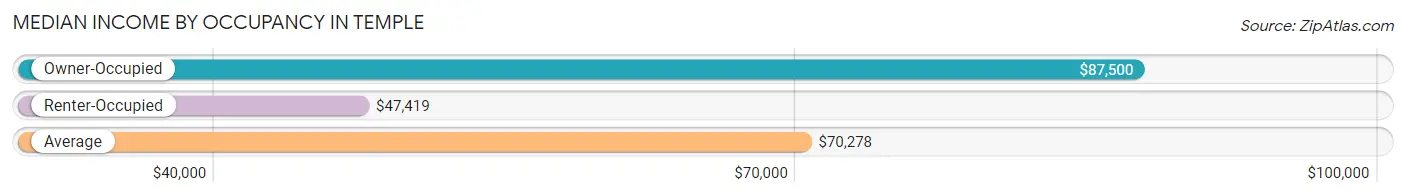
| Occupancy Type | # Households | Median Income |
| Owner-Occupied | 556 (69.3%) | $87,500 |
| Renter-Occupied | 246 (30.7%) | $47,419 |
| Average | 802 (100.0%) | $70,278 |
Occupancy by Householder Income Bracket in Temple
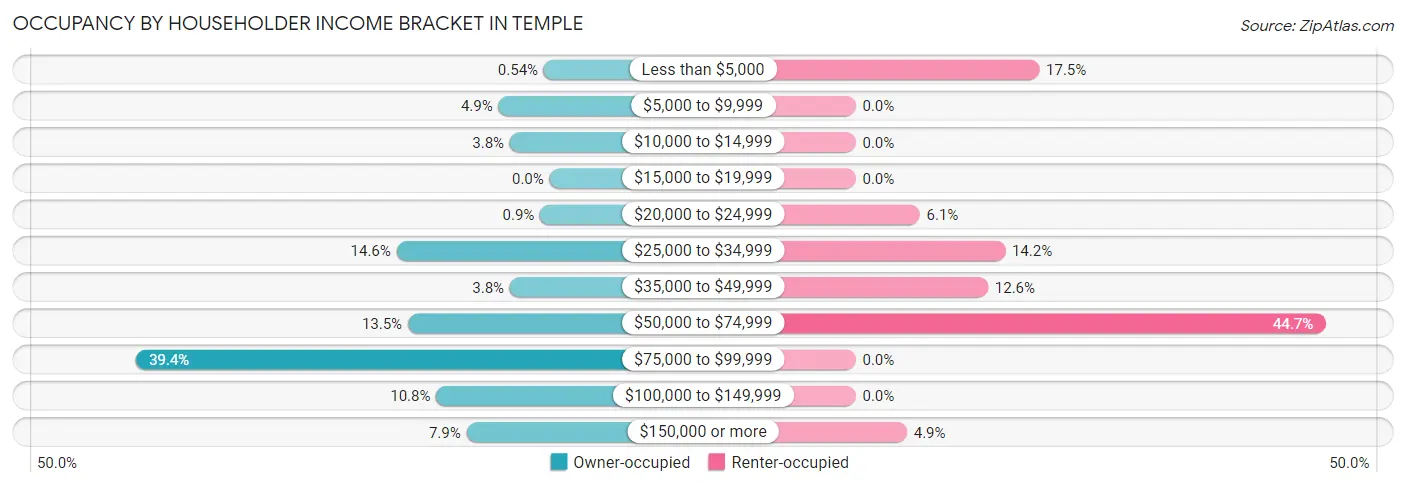
| Income Bracket | Owner-occupied | Renter-occupied |
| Less than $5,000 | 3 (0.5%) | 43 (17.5%) |
| $5,000 to $9,999 | 27 (4.9%) | 0 (0.0%) |
| $10,000 to $14,999 | 21 (3.8%) | 0 (0.0%) |
| $15,000 to $19,999 | 0 (0.0%) | 0 (0.0%) |
| $20,000 to $24,999 | 5 (0.9%) | 15 (6.1%) |
| $25,000 to $34,999 | 81 (14.6%) | 35 (14.2%) |
| $35,000 to $49,999 | 21 (3.8%) | 31 (12.6%) |
| $50,000 to $74,999 | 75 (13.5%) | 110 (44.7%) |
| $75,000 to $99,999 | 219 (39.4%) | 0 (0.0%) |
| $100,000 to $149,999 | 60 (10.8%) | 0 (0.0%) |
| $150,000 or more | 44 (7.9%) | 12 (4.9%) |
| Total | 556 (100.0%) | 246 (100.0%) |
Monthly Housing Cost Tiers in Temple
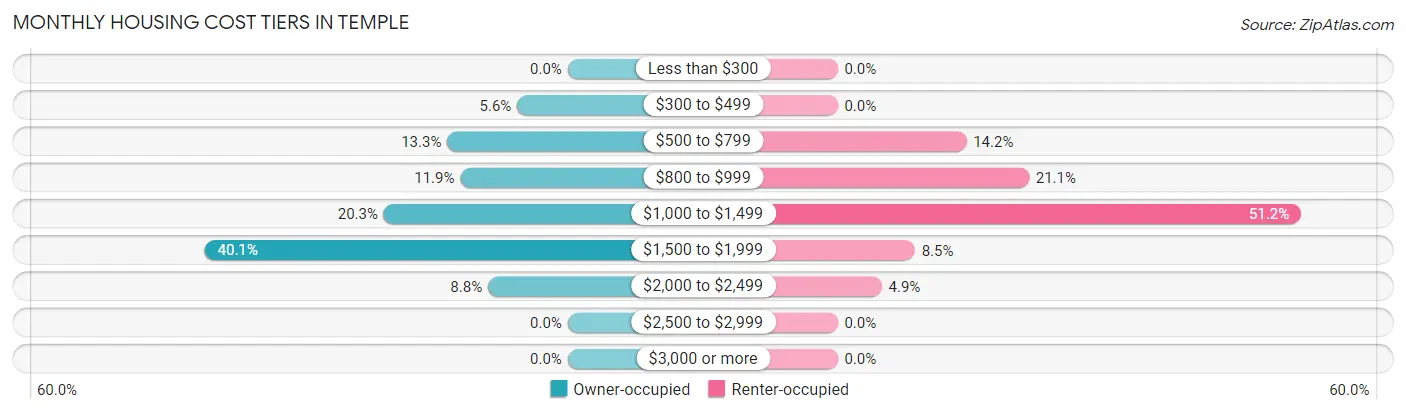
| Monthly Cost | Owner-occupied | Renter-occupied |
| Less than $300 | 0 (0.0%) | 0 (0.0%) |
| $300 to $499 | 31 (5.6%) | 0 (0.0%) |
| $500 to $799 | 74 (13.3%) | 35 (14.2%) |
| $800 to $999 | 66 (11.9%) | 52 (21.1%) |
| $1,000 to $1,499 | 113 (20.3%) | 126 (51.2%) |
| $1,500 to $1,999 | 223 (40.1%) | 21 (8.5%) |
| $2,000 to $2,499 | 49 (8.8%) | 12 (4.9%) |
| $2,500 to $2,999 | 0 (0.0%) | 0 (0.0%) |
| $3,000 or more | 0 (0.0%) | 0 (0.0%) |
| Total | 556 (100.0%) | 246 (100.0%) |
Physical Housing Characteristics in Temple
Housing Structures in Temple
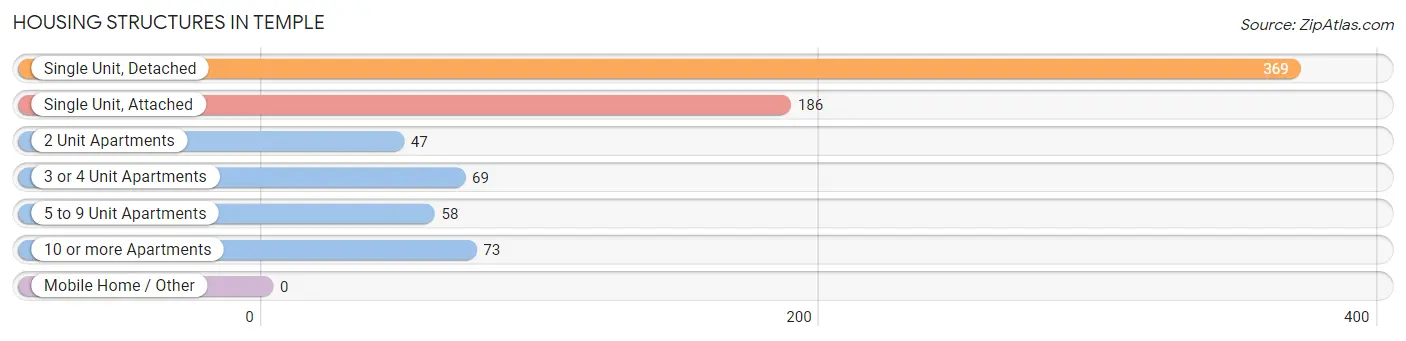
| Structure Type | # Housing Units | % Housing Units |
| Single Unit, Detached | 369 | 46.0% |
| Single Unit, Attached | 186 | 23.2% |
| 2 Unit Apartments | 47 | 5.9% |
| 3 or 4 Unit Apartments | 69 | 8.6% |
| 5 to 9 Unit Apartments | 58 | 7.2% |
| 10 or more Apartments | 73 | 9.1% |
| Mobile Home / Other | 0 | 0.0% |
| Total | 802 | 100.0% |
Housing Structures by Occupancy in Temple
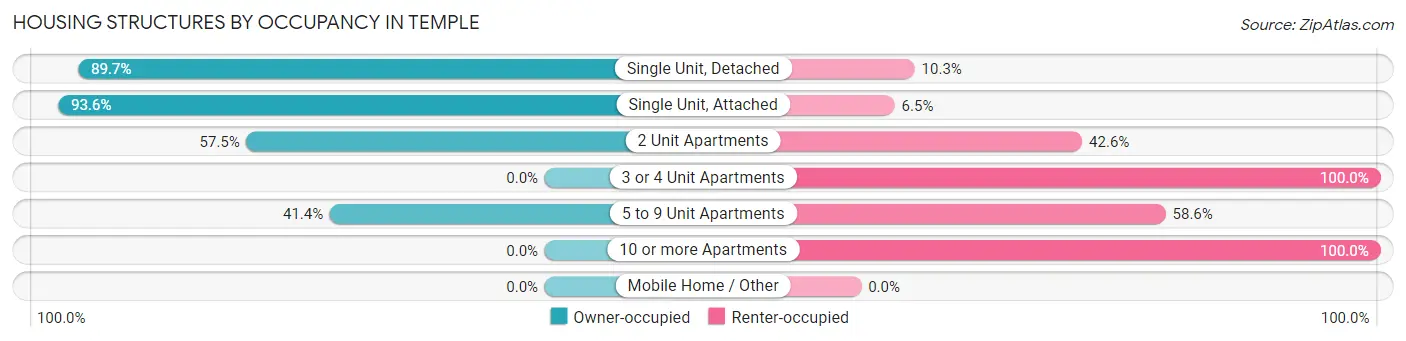
| Structure Type | Owner-occupied | Renter-occupied |
| Single Unit, Detached | 331 (89.7%) | 38 (10.3%) |
| Single Unit, Attached | 174 (93.5%) | 12 (6.5%) |
| 2 Unit Apartments | 27 (57.5%) | 20 (42.5%) |
| 3 or 4 Unit Apartments | 0 (0.0%) | 69 (100.0%) |
| 5 to 9 Unit Apartments | 24 (41.4%) | 34 (58.6%) |
| 10 or more Apartments | 0 (0.0%) | 73 (100.0%) |
| Mobile Home / Other | 0 (0.0%) | 0 (0.0%) |
| Total | 556 (69.3%) | 246 (30.7%) |
Housing Structures by Number of Rooms in Temple
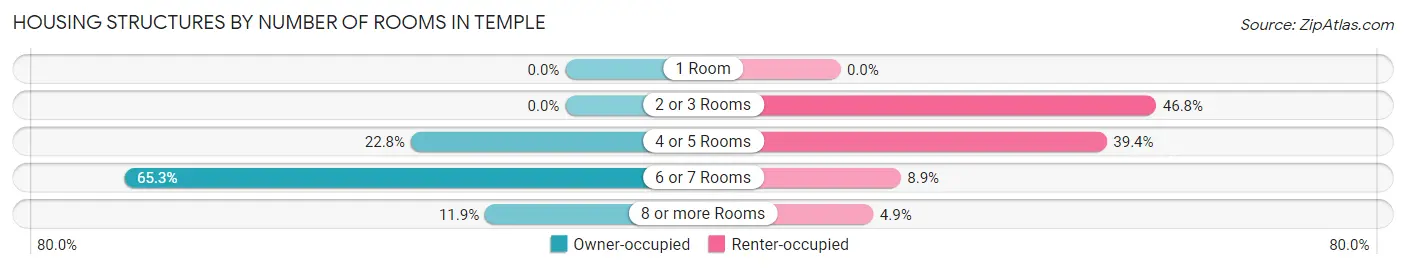
| Number of Rooms | Owner-occupied | Renter-occupied |
| 1 Room | 0 (0.0%) | 0 (0.0%) |
| 2 or 3 Rooms | 0 (0.0%) | 115 (46.8%) |
| 4 or 5 Rooms | 127 (22.8%) | 97 (39.4%) |
| 6 or 7 Rooms | 363 (65.3%) | 22 (8.9%) |
| 8 or more Rooms | 66 (11.9%) | 12 (4.9%) |
| Total | 556 (100.0%) | 246 (100.0%) |
Housing Structure by Heating Type in Temple
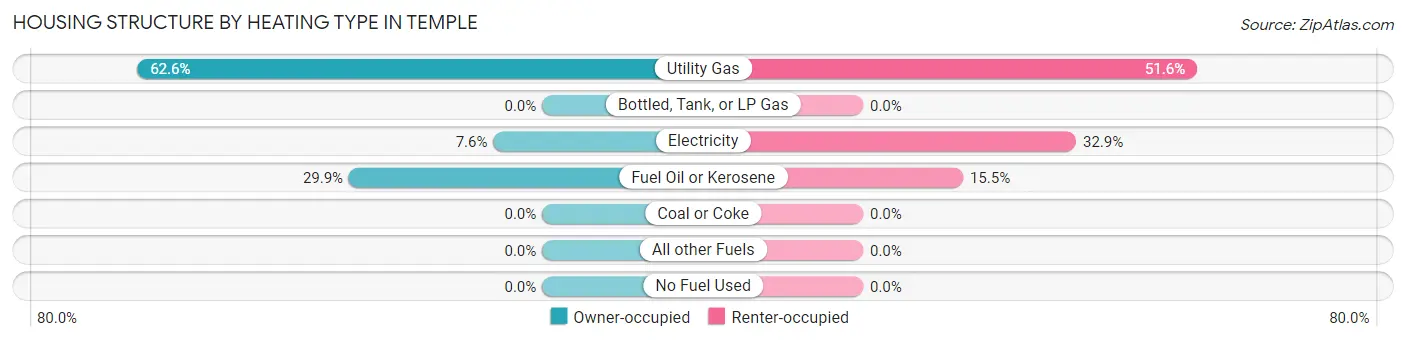
| Heating Type | Owner-occupied | Renter-occupied |
| Utility Gas | 348 (62.6%) | 127 (51.6%) |
| Bottled, Tank, or LP Gas | 0 (0.0%) | 0 (0.0%) |
| Electricity | 42 (7.5%) | 81 (32.9%) |
| Fuel Oil or Kerosene | 166 (29.9%) | 38 (15.4%) |
| Coal or Coke | 0 (0.0%) | 0 (0.0%) |
| All other Fuels | 0 (0.0%) | 0 (0.0%) |
| No Fuel Used | 0 (0.0%) | 0 (0.0%) |
| Total | 556 (100.0%) | 246 (100.0%) |
Household Vehicle Usage in Temple
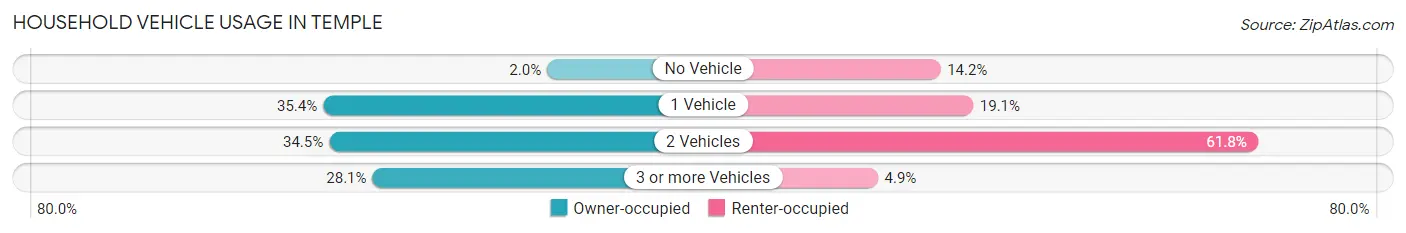
| Vehicles per Household | Owner-occupied | Renter-occupied |
| No Vehicle | 11 (2.0%) | 35 (14.2%) |
| 1 Vehicle | 197 (35.4%) | 47 (19.1%) |
| 2 Vehicles | 192 (34.5%) | 152 (61.8%) |
| 3 or more Vehicles | 156 (28.1%) | 12 (4.9%) |
| Total | 556 (100.0%) | 246 (100.0%) |
Real Estate & Mortgages in Temple
Real Estate and Mortgage Overview in Temple
| Characteristic | Without Mortgage | With Mortgage |
| Housing Units | 154 | 402 |
| Median Property Value | $166,000 | $160,000 |
| Median Household Income | $34,194 | $41 |
| Monthly Housing Costs | $781 | $0 |
| Real Estate Taxes | $3,872 | $12 |
Property Value by Mortgage Status in Temple
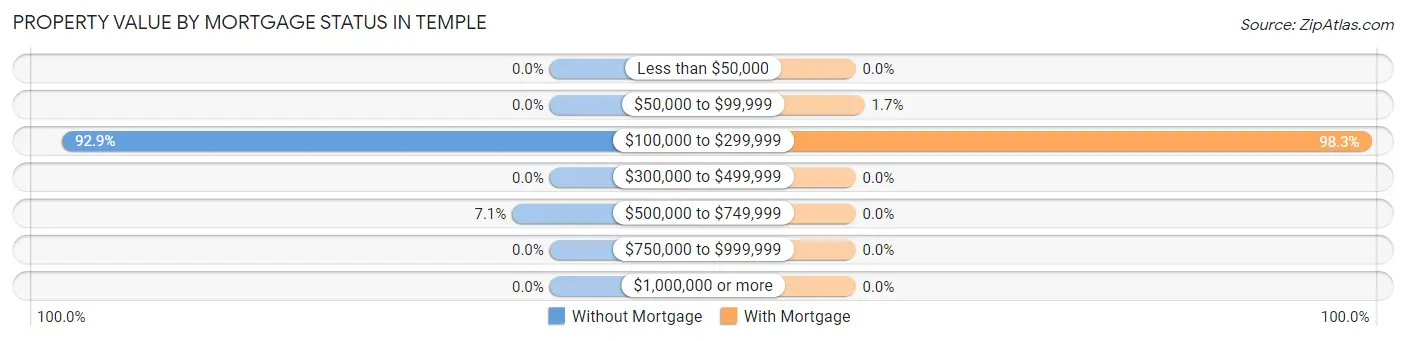
| Property Value | Without Mortgage | With Mortgage |
| Less than $50,000 | 0 (0.0%) | 0 (0.0%) |
| $50,000 to $99,999 | 0 (0.0%) | 7 (1.7%) |
| $100,000 to $299,999 | 143 (92.9%) | 395 (98.3%) |
| $300,000 to $499,999 | 0 (0.0%) | 0 (0.0%) |
| $500,000 to $749,999 | 11 (7.1%) | 0 (0.0%) |
| $750,000 to $999,999 | 0 (0.0%) | 0 (0.0%) |
| $1,000,000 or more | 0 (0.0%) | 0 (0.0%) |
| Total | 154 (100.0%) | 402 (100.0%) |
Household Income by Mortgage Status in Temple
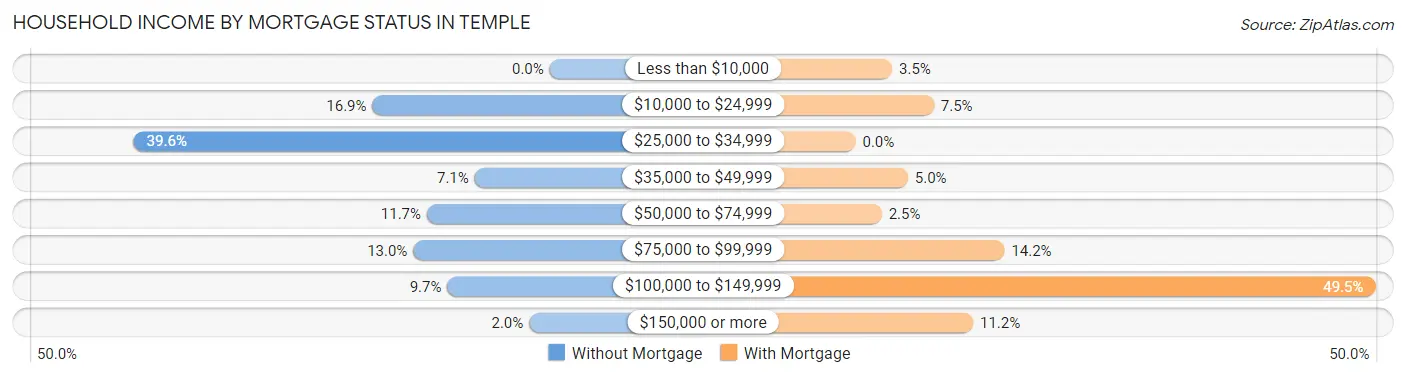
| Household Income | Without Mortgage | With Mortgage |
| Less than $10,000 | 0 (0.0%) | 14 (3.5%) |
| $10,000 to $24,999 | 26 (16.9%) | 30 (7.5%) |
| $25,000 to $34,999 | 61 (39.6%) | 0 (0.0%) |
| $35,000 to $49,999 | 11 (7.1%) | 20 (5.0%) |
| $50,000 to $74,999 | 18 (11.7%) | 10 (2.5%) |
| $75,000 to $99,999 | 20 (13.0%) | 57 (14.2%) |
| $100,000 to $149,999 | 15 (9.7%) | 199 (49.5%) |
| $150,000 or more | 3 (1.9%) | 45 (11.2%) |
| Total | 154 (100.0%) | 402 (100.0%) |
Property Value to Household Income Ratio in Temple
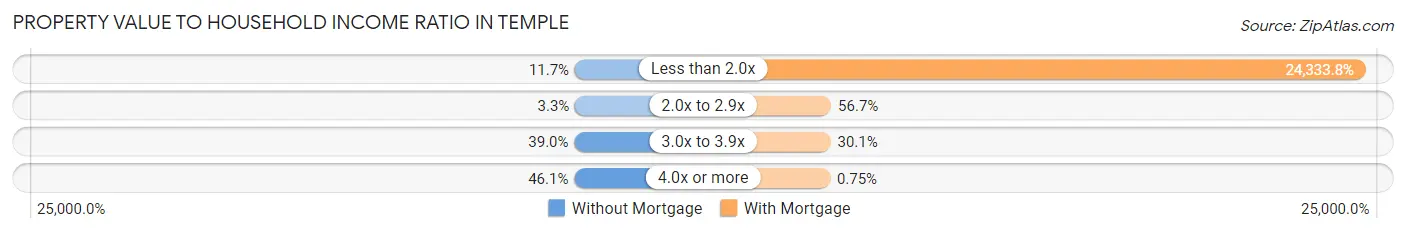
| Value-to-Income Ratio | Without Mortgage | With Mortgage |
| Less than 2.0x | 18 (11.7%) | 97,822 (24,333.8%) |
| 2.0x to 2.9x | 5 (3.3%) | 228 (56.7%) |
| 3.0x to 3.9x | 60 (39.0%) | 121 (30.1%) |
| 4.0x or more | 71 (46.1%) | 3 (0.7%) |
| Total | 154 (100.0%) | 402 (100.0%) |
Real Estate Taxes by Mortgage Status in Temple
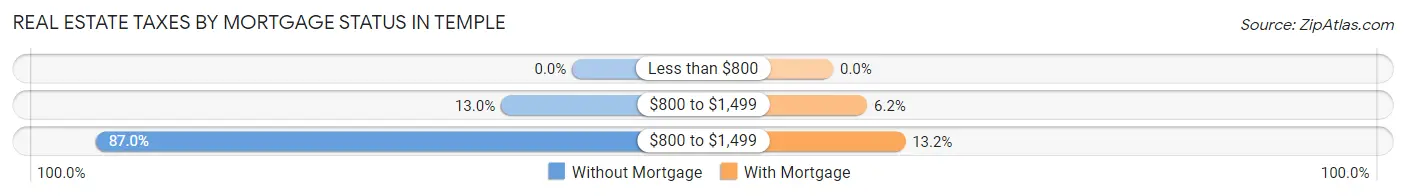
| Property Taxes | Without Mortgage | With Mortgage |
| Less than $800 | 0 (0.0%) | 0 (0.0%) |
| $800 to $1,499 | 20 (13.0%) | 25 (6.2%) |
| $800 to $1,499 | 134 (87.0%) | 53 (13.2%) |
| Total | 154 (100.0%) | 402 (100.0%) |
Health & Disability in Temple
Health Insurance Coverage by Age in Temple
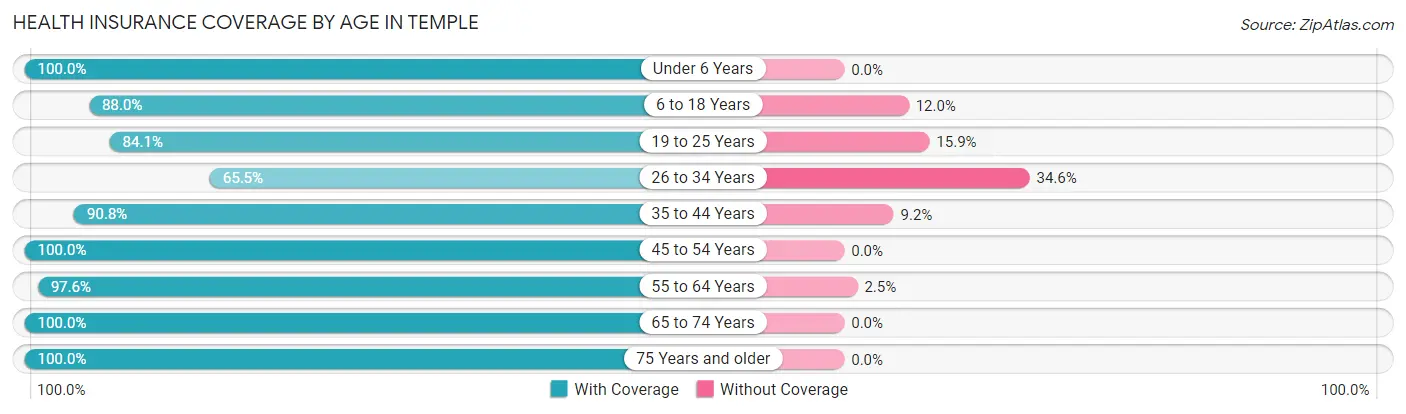
| Age Bracket | With Coverage | Without Coverage |
| Under 6 Years | 132 (100.0%) | 0 (0.0%) |
| 6 to 18 Years | 557 (88.0%) | 76 (12.0%) |
| 19 to 25 Years | 212 (84.1%) | 40 (15.9%) |
| 26 to 34 Years | 180 (65.4%) | 95 (34.5%) |
| 35 to 44 Years | 316 (90.8%) | 32 (9.2%) |
| 45 to 54 Years | 145 (100.0%) | 0 (0.0%) |
| 55 to 64 Years | 318 (97.6%) | 8 (2.5%) |
| 65 to 74 Years | 46 (100.0%) | 0 (0.0%) |
| 75 Years and older | 94 (100.0%) | 0 (0.0%) |
| Total | 2,000 (88.8%) | 251 (11.2%) |
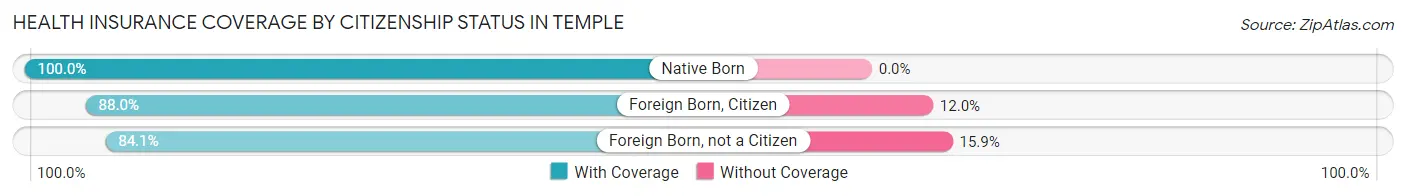
Health Insurance Coverage by Citizenship Status in Temple
| Citizenship Status | With Coverage | Without Coverage |
| Native Born | 132 (100.0%) | 0 (0.0%) |
| Foreign Born, Citizen | 557 (88.0%) | 76 (12.0%) |
| Foreign Born, not a Citizen | 212 (84.1%) | 40 (15.9%) |
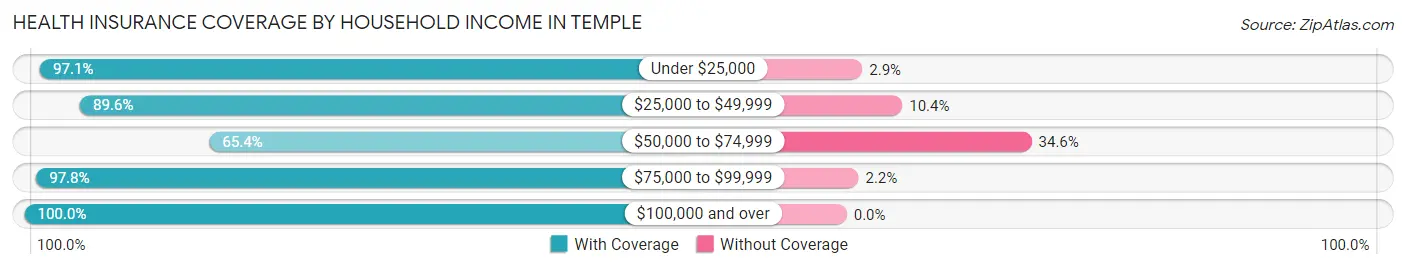
Health Insurance Coverage by Household Income in Temple
| Household Income | With Coverage | Without Coverage |
| Under $25,000 | 166 (97.1%) | 5 (2.9%) |
| $25,000 to $49,999 | 310 (89.6%) | 36 (10.4%) |
| $50,000 to $74,999 | 370 (65.4%) | 196 (34.6%) |
| $75,000 to $99,999 | 623 (97.8%) | 14 (2.2%) |
| $100,000 and over | 526 (100.0%) | 0 (0.0%) |
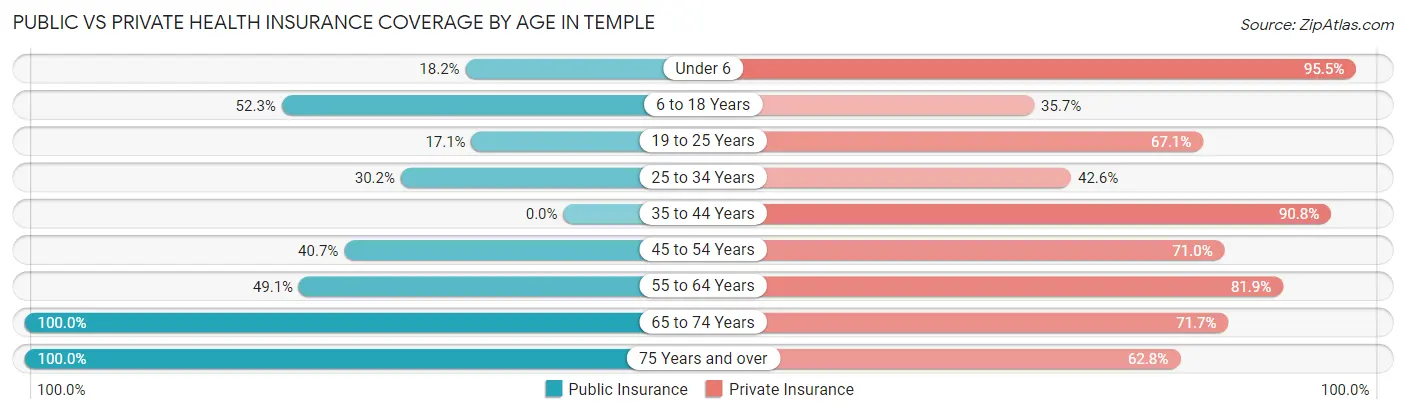
Public vs Private Health Insurance Coverage by Age in Temple
| Age Bracket | Public Insurance | Private Insurance |
| Under 6 | 24 (18.2%) | 126 (95.5%) |
| 6 to 18 Years | 331 (52.3%) | 226 (35.7%) |
| 19 to 25 Years | 43 (17.1%) | 169 (67.1%) |
| 25 to 34 Years | 83 (30.2%) | 117 (42.5%) |
| 35 to 44 Years | 0 (0.0%) | 316 (90.8%) |
| 45 to 54 Years | 59 (40.7%) | 103 (71.0%) |
| 55 to 64 Years | 160 (49.1%) | 267 (81.9%) |
| 65 to 74 Years | 46 (100.0%) | 33 (71.7%) |
| 75 Years and over | 94 (100.0%) | 59 (62.8%) |
| Total | 840 (37.3%) | 1,416 (62.9%) |
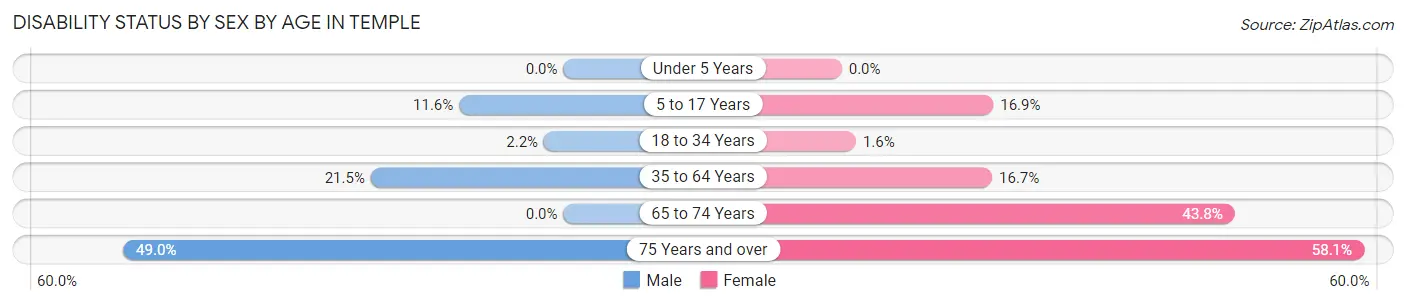
Disability Status by Sex by Age in Temple
| Age Bracket | Male | Female |
| Under 5 Years | 0 (0.0%) | 0 (0.0%) |
| 5 to 17 Years | 52 (11.6%) | 41 (16.9%) |
| 18 to 34 Years | 5 (2.2%) | 5 (1.6%) |
| 35 to 64 Years | 77 (21.4%) | 77 (16.7%) |
| 65 to 74 Years | 0 (0.0%) | 14 (43.8%) |
| 75 Years and over | 25 (49.0%) | 25 (58.1%) |
Disability Class by Sex by Age in Temple
Disability Class: Hearing Difficulty
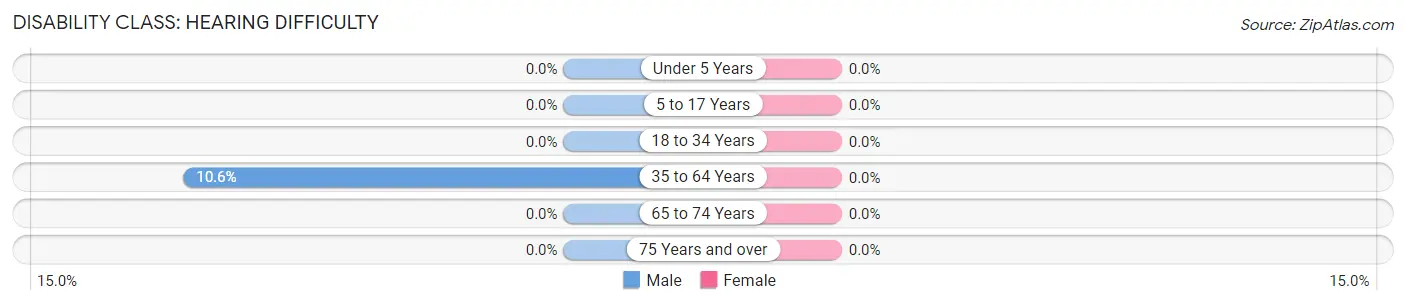
| Age Bracket | Male | Female |
| Under 5 Years | 0 (0.0%) | 0 (0.0%) |
| 5 to 17 Years | 0 (0.0%) | 0 (0.0%) |
| 18 to 34 Years | 0 (0.0%) | 0 (0.0%) |
| 35 to 64 Years | 38 (10.6%) | 0 (0.0%) |
| 65 to 74 Years | 0 (0.0%) | 0 (0.0%) |
| 75 Years and over | 0 (0.0%) | 0 (0.0%) |
Disability Class: Vision Difficulty
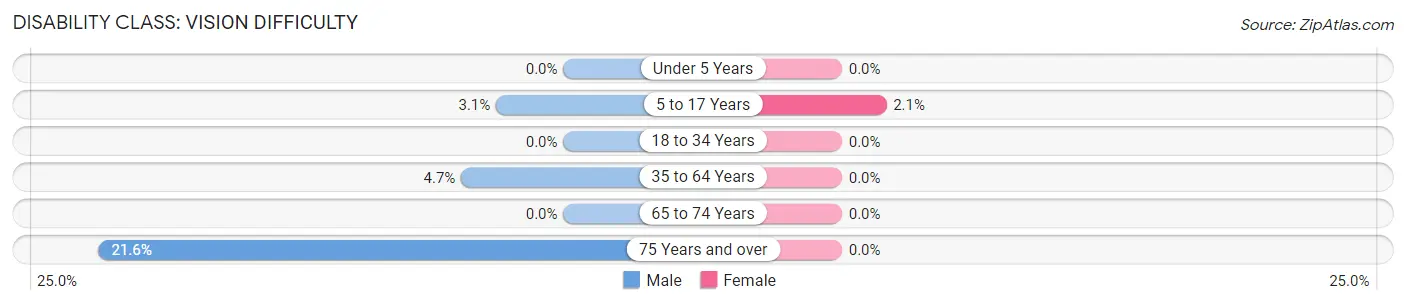
| Age Bracket | Male | Female |
| Under 5 Years | 0 (0.0%) | 0 (0.0%) |
| 5 to 17 Years | 14 (3.1%) | 5 (2.1%) |
| 18 to 34 Years | 0 (0.0%) | 0 (0.0%) |
| 35 to 64 Years | 17 (4.7%) | 0 (0.0%) |
| 65 to 74 Years | 0 (0.0%) | 0 (0.0%) |
| 75 Years and over | 11 (21.6%) | 0 (0.0%) |
Disability Class: Cognitive Difficulty
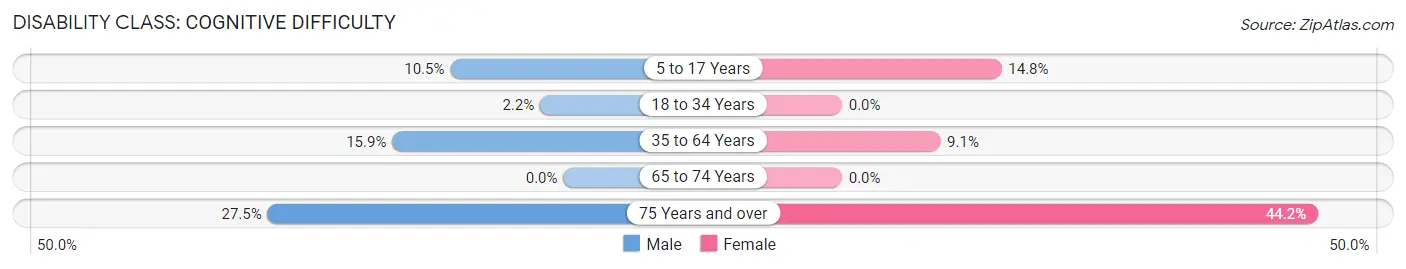
| Age Bracket | Male | Female |
| 5 to 17 Years | 47 (10.5%) | 36 (14.8%) |
| 18 to 34 Years | 5 (2.2%) | 0 (0.0%) |
| 35 to 64 Years | 57 (15.9%) | 42 (9.1%) |
| 65 to 74 Years | 0 (0.0%) | 0 (0.0%) |
| 75 Years and over | 14 (27.5%) | 19 (44.2%) |
Disability Class: Ambulatory Difficulty
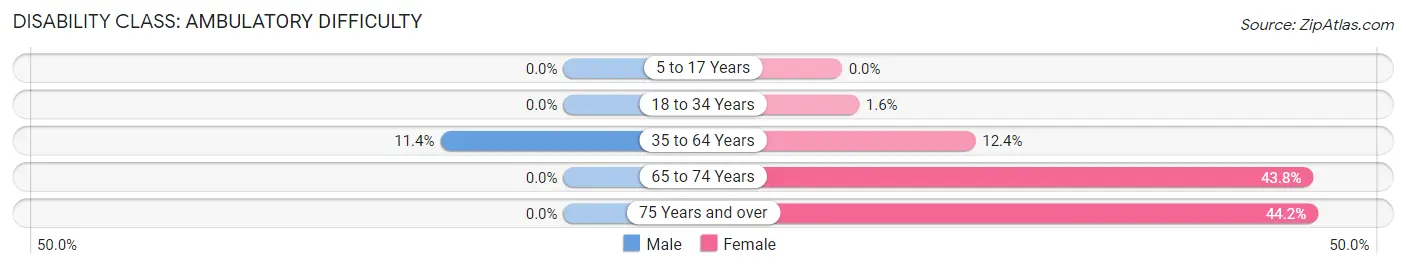
| Age Bracket | Male | Female |
| 5 to 17 Years | 0 (0.0%) | 0 (0.0%) |
| 18 to 34 Years | 0 (0.0%) | 5 (1.6%) |
| 35 to 64 Years | 41 (11.4%) | 57 (12.4%) |
| 65 to 74 Years | 0 (0.0%) | 14 (43.8%) |
| 75 Years and over | 0 (0.0%) | 19 (44.2%) |
Disability Class: Self-Care Difficulty
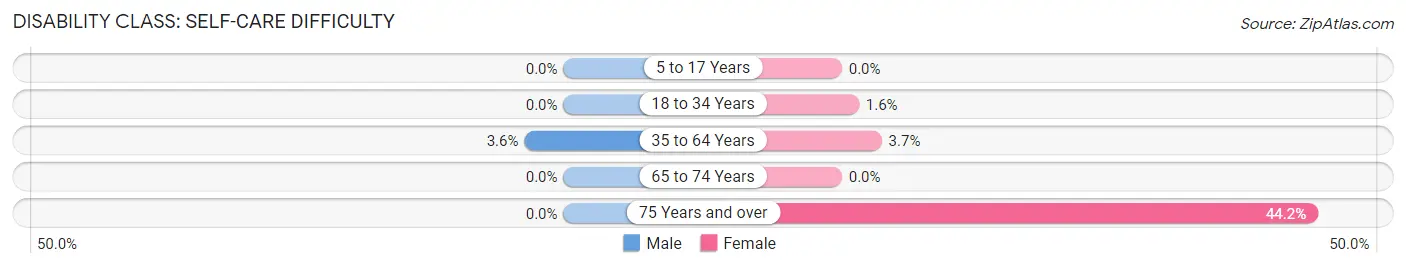
| Age Bracket | Male | Female |
| 5 to 17 Years | 0 (0.0%) | 0 (0.0%) |
| 18 to 34 Years | 0 (0.0%) | 5 (1.6%) |
| 35 to 64 Years | 13 (3.6%) | 17 (3.7%) |
| 65 to 74 Years | 0 (0.0%) | 0 (0.0%) |
| 75 Years and over | 0 (0.0%) | 19 (44.2%) |
Technology Access in Temple
Computing Device Access in Temple
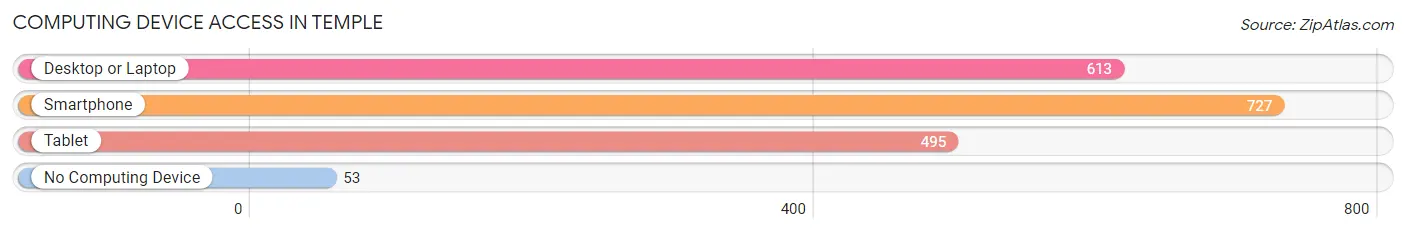
| Device Type | # Households | % Households |
| Desktop or Laptop | 613 | 76.4% |
| Smartphone | 727 | 90.6% |
| Tablet | 495 | 61.7% |
| No Computing Device | 53 | 6.6% |
| Total | 802 | 100.0% |
Internet Access in Temple
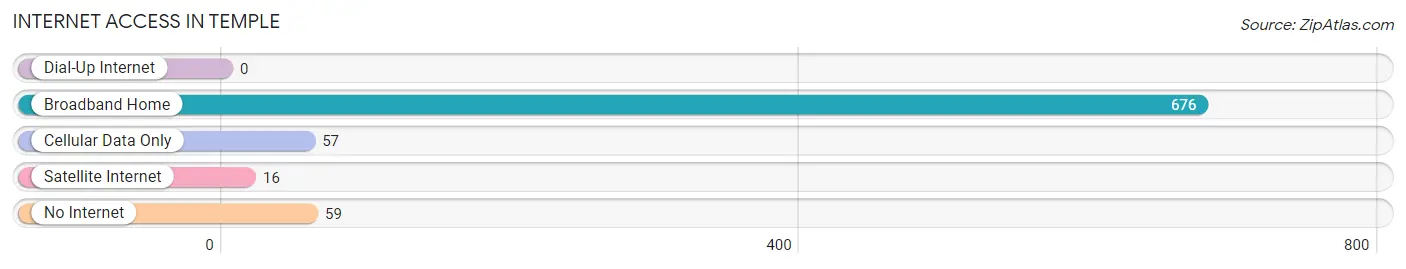
| Internet Type | # Households | % Households |
| Dial-Up Internet | 0 | 0.0% |
| Broadband Home | 676 | 84.3% |
| Cellular Data Only | 57 | 7.1% |
| Satellite Internet | 16 | 2.0% |
| No Internet | 59 | 7.4% |
| Total | 802 | 100.0% |
Temple Summary
Temple, Pennsylvania is a city located in Northampton County, Pennsylvania, United States. It is situated in the Lehigh Valley region of the state, and is part of the Allentown-Bethlehem-Easton metropolitan area. The city has a population of approximately 25,000 people, and is the county seat of Northampton County.
History
The area that is now Temple, Pennsylvania was originally inhabited by the Lenape Native Americans. The first European settlers arrived in the area in the late 17th century, and the town was officially founded in 1762. The town was named after a local Native American chief, Chief Tamaqua, who had been a leader of the Lenape tribe.
The town was initially a farming community, but in the 19th century, it began to develop into an industrial center. The Lehigh Valley Railroad was built through the town in 1855, and this helped to spur the growth of the local economy. The town was incorporated as a borough in 1867, and it was later incorporated as a city in 1891.
Geography
Temple, Pennsylvania is located in Northampton County, Pennsylvania, in the Lehigh Valley region of the state. It is situated at an elevation of approximately 500 feet above sea level. The city covers an area of approximately 4.2 square miles, and is located approximately 10 miles north of Allentown, Pennsylvania, and approximately 60 miles northwest of Philadelphia, Pennsylvania.
The city is located in the Lehigh Valley, which is a region of the state that is known for its rolling hills and lush farmland. The city is situated along the Lehigh River, and is surrounded by several small towns and villages.
Economy
The economy of Temple, Pennsylvania is largely based on manufacturing and services. The city is home to several large manufacturing companies, including Air Products and Chemicals, Inc., and Crayola. The city is also home to several large service-based companies, including Lehigh Valley Health Network, and St. Luke’s University Health Network.
The city is also home to several educational institutions, including Lehigh Carbon Community College, and Northampton Community College. The city is also home to several large retail stores, including Walmart, Target, and Kohl’s.
Demographics
As of the 2010 census, the population of Temple, Pennsylvania was 25,058. The racial makeup of the city was 87.3% White, 5.3% African American, 0.3% Native American, 2.2% Asian, 0.1% Pacific Islander, 2.2% from other races, and 2.7% from two or more races. Hispanic or Latino of any race were 5.3% of the population.
The median household income in the city was $45,945, and the median family income was $54,945. The per capita income in the city was $21,945. Approximately 11.3% of the population was below the poverty line.
The city is served by the Northampton Area School District, and is home to several private schools, including Notre Dame High School, and Lehigh Valley Christian High School. The city is also home to several churches, including St. John’s Lutheran Church, and St. Paul’s United Church of Christ.
Common Questions
What is Per Capita Income in Temple?
Per Capita income in Temple is $32,730.
What is the Median Family Income in Temple?
Median Family Income in Temple is $72,478.
What is the Median Household income in Temple?
Median Household Income in Temple is $70,278.
What is Income or Wage Gap in Temple?
Income or Wage Gap in Temple is 26.6%.
Women in Temple earn 73.4 cents for every dollar earned by a man.
What is Inequality or Gini Index in Temple?
Inequality or Gini Index in Temple is 0.46.
What is the Total Population of Temple?
Total Population of Temple is 2,251.
What is the Total Male Population of Temple?
Total Male Population of Temple is 1,132.
What is the Total Female Population of Temple?
Total Female Population of Temple is 1,119.
What is the Ratio of Males per 100 Females in Temple?
There are 101.16 Males per 100 Females in Temple.
What is the Ratio of Females per 100 Males in Temple?
There are 98.85 Females per 100 Males in Temple.
What is the Median Population Age in Temple?
Median Population Age in Temple is 31.7 Years.
What is the Average Family Size in Temple
Average Family Size in Temple is 3.4 People.
What is the Average Household Size in Temple
Average Household Size in Temple is 2.8 People.
How Large is the Labor Force in Temple?
There are 1,162 People in the Labor Forcein in Temple.
What is the Percentage of People in the Labor Force in Temple?
73.8% of People are in the Labor Force in Temple.
What is the Unemployment Rate in Temple?
Unemployment Rate in Temple is 7.7%.