North Catasauqua borough, PA Map & Demographics
North Catasauqua borough Overview
$37,425
PER CAPITA INCOME
$106,198
AVG FAMILY INCOME
$85,431
AVG HOUSEHOLD INCOME
6.1%
WAGE / INCOME GAP [ % ]
93.9¢/ $1
WAGE / INCOME GAP [ $ ]
0.39
INEQUALITY / GINI INDEX
2,956
TOTAL POPULATION
1,479
MALE POPULATION
1,477
FEMALE POPULATION
100.14
MALES / 100 FEMALES
99.86
FEMALES / 100 MALES
43.3
MEDIAN AGE
3.1
AVG FAMILY SIZE
2.5
AVG HOUSEHOLD SIZE
1,761
LABOR FORCE [ PEOPLE ]
71.5%
PERCENT IN LABOR FORCE
3.1%
UNEMPLOYMENT RATE
Income in North Catasauqua borough
Income Overview in North Catasauqua borough
Per Capita Income in North Catasauqua borough is $37,425, while median incomes of families and households are $106,198 and $85,431 respectively.
| Characteristic | Number | Measure |
| Per Capita Income | 2,956 | $37,425 |
| Median Family Income | 803 | $106,198 |
| Mean Family Income | 803 | $113,994 |
| Median Household Income | 1,184 | $85,431 |
| Mean Household Income | 1,184 | $90,951 |
| Income Deficit | 803 | $0 |
| Wage / Income Gap (%) | 2,956 | 6.11% |
| Wage / Income Gap ($) | 2,956 | 93.89¢ per $1 |
| Gini / Inequality Index | 2,956 | 0.39 |
Earnings by Sex in North Catasauqua borough
Average Earnings in North Catasauqua borough are $45,625, $46,458 for men and $43,618 for women, a difference of 6.1%.
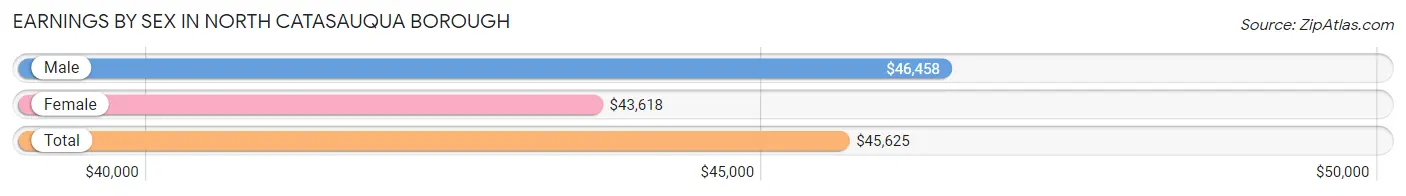
| Sex | Number | Average Earnings |
| Male | 935 (52.3%) | $46,458 |
| Female | 851 (47.6%) | $43,618 |
| Total | 1,786 (100.0%) | $45,625 |
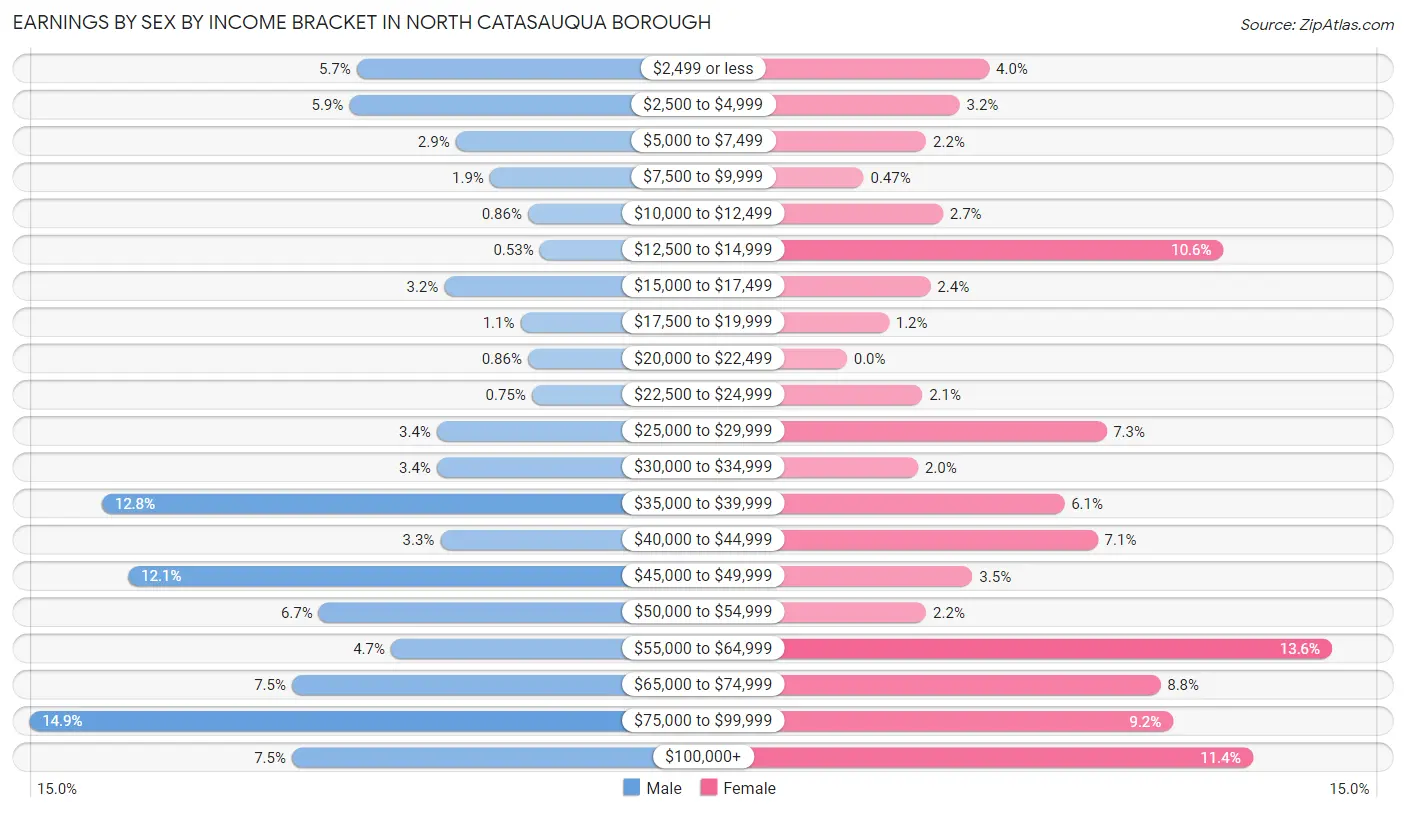
Earnings by Sex by Income Bracket in North Catasauqua borough
The most common earnings brackets in North Catasauqua borough are $75,000 to $99,999 for men (139 | 14.9%) and $55,000 to $64,999 for women (116 | 13.6%).
| Income | Male | Female |
| $2,499 or less | 53 (5.7%) | 34 (4.0%) |
| $2,500 to $4,999 | 55 (5.9%) | 27 (3.2%) |
| $5,000 to $7,499 | 27 (2.9%) | 19 (2.2%) |
| $7,500 to $9,999 | 18 (1.9%) | 4 (0.5%) |
| $10,000 to $12,499 | 8 (0.9%) | 23 (2.7%) |
| $12,500 to $14,999 | 5 (0.5%) | 90 (10.6%) |
| $15,000 to $17,499 | 30 (3.2%) | 20 (2.4%) |
| $17,500 to $19,999 | 10 (1.1%) | 10 (1.2%) |
| $20,000 to $22,499 | 8 (0.9%) | 0 (0.0%) |
| $22,500 to $24,999 | 7 (0.7%) | 18 (2.1%) |
| $25,000 to $29,999 | 32 (3.4%) | 62 (7.3%) |
| $30,000 to $34,999 | 32 (3.4%) | 17 (2.0%) |
| $35,000 to $39,999 | 120 (12.8%) | 52 (6.1%) |
| $40,000 to $44,999 | 31 (3.3%) | 60 (7.0%) |
| $45,000 to $49,999 | 113 (12.1%) | 30 (3.5%) |
| $50,000 to $54,999 | 63 (6.7%) | 19 (2.2%) |
| $55,000 to $64,999 | 44 (4.7%) | 116 (13.6%) |
| $65,000 to $74,999 | 70 (7.5%) | 75 (8.8%) |
| $75,000 to $99,999 | 139 (14.9%) | 78 (9.2%) |
| $100,000+ | 70 (7.5%) | 97 (11.4%) |
| Total | 935 (100.0%) | 851 (100.0%) |
Earnings by Sex by Educational Attainment in North Catasauqua borough
Average earnings in North Catasauqua borough are $48,665 for men and $52,813 for women, a difference of 7.9%. Men with an educational attainment of graduate degree enjoy the highest average annual earnings of $111,538, while those with bachelor's degree education earn the least with $42,417. Women with an educational attainment of graduate degree earn the most with the average annual earnings of $75,588, while those with high school diploma education have the smallest earnings of $28,375.
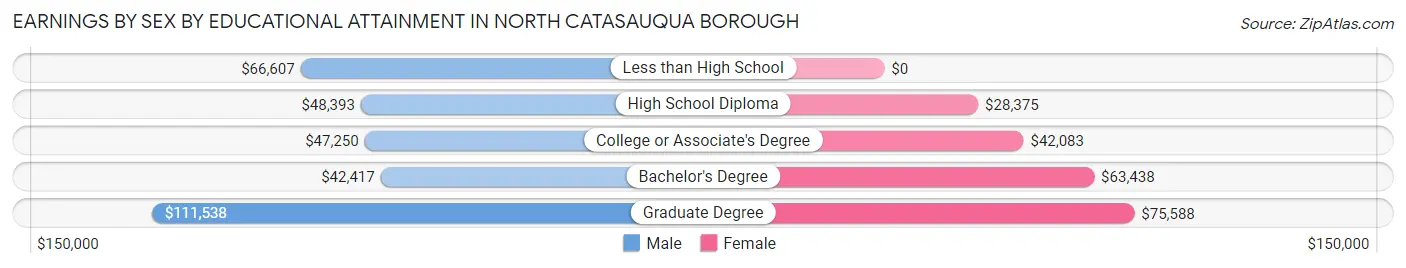
| Educational Attainment | Male Income | Female Income |
| Less than High School | $66,607 | $0 |
| High School Diploma | $48,393 | $28,375 |
| College or Associate's Degree | $47,250 | $42,083 |
| Bachelor's Degree | $42,417 | $63,438 |
| Graduate Degree | $111,538 | $75,588 |
| Total | $48,665 | $52,813 |
Family Income in North Catasauqua borough
Family Income Brackets in North Catasauqua borough
According to the North Catasauqua borough family income data, there are 299 families falling into the $100,000 to $149,999 income range, which is the most common income bracket and makes up 37.2% of all families.
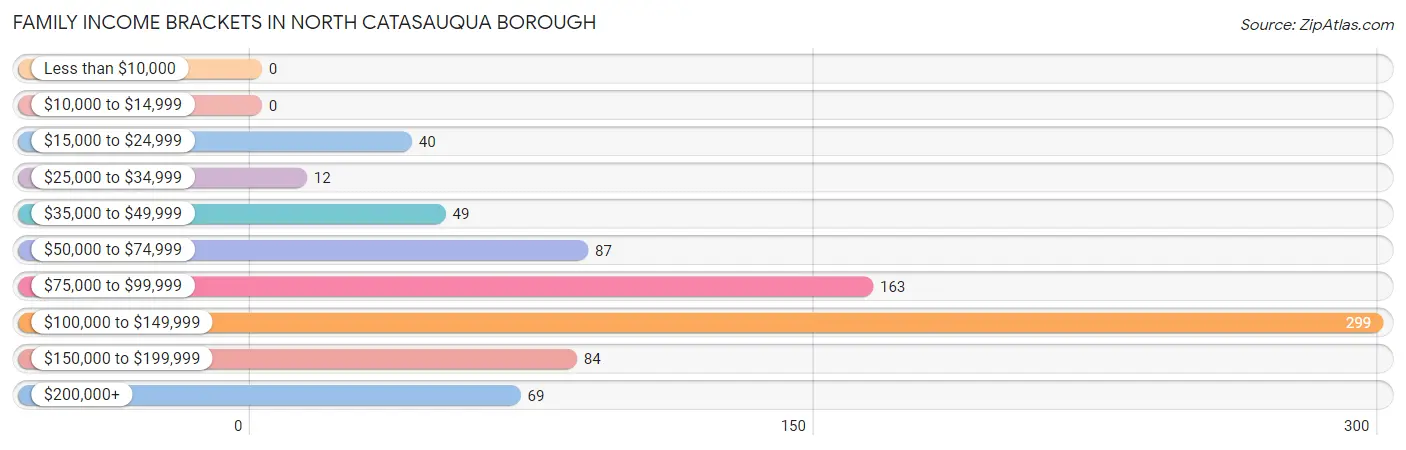
| Income Bracket | # Families | % Families |
| Less than $10,000 | 0 | 0.0% |
| $10,000 to $14,999 | 0 | 0.0% |
| $15,000 to $24,999 | 40 | 5.0% |
| $25,000 to $34,999 | 12 | 1.5% |
| $35,000 to $49,999 | 49 | 6.1% |
| $50,000 to $74,999 | 87 | 10.8% |
| $75,000 to $99,999 | 163 | 20.3% |
| $100,000 to $149,999 | 299 | 37.2% |
| $150,000 to $199,999 | 84 | 10.5% |
| $200,000+ | 69 | 8.6% |
Family Income by Famaliy Size in North Catasauqua borough
3-person families (160 | 19.9%) account for the highest median family income in North Catasauqua borough with $127,500 per family, while 2-person families (346 | 43.1%) have the highest median income of $44,196 per family member.
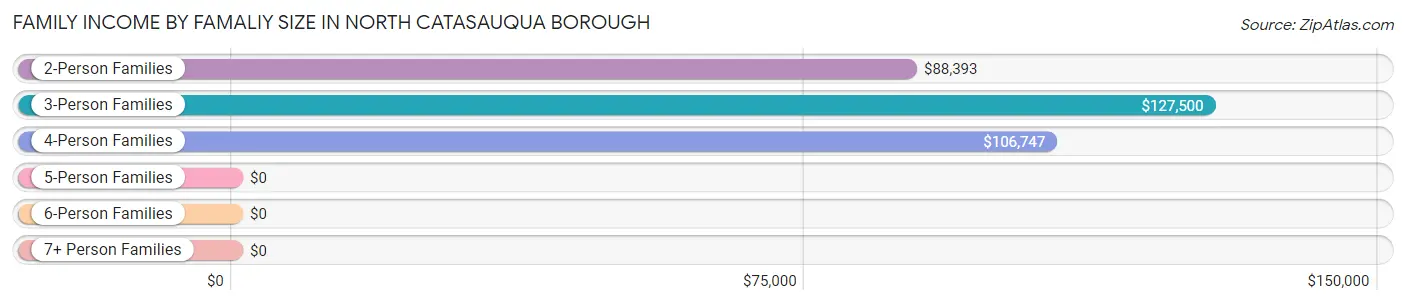
| Income Bracket | # Families | Median Income |
| 2-Person Families | 346 (43.1%) | $88,393 |
| 3-Person Families | 160 (19.9%) | $127,500 |
| 4-Person Families | 228 (28.4%) | $106,747 |
| 5-Person Families | 36 (4.5%) | $0 |
| 6-Person Families | 33 (4.1%) | $0 |
| 7+ Person Families | 0 (0.0%) | $0 |
| Total | 803 (100.0%) | $106,198 |
Family Income by Number of Earners in North Catasauqua borough
The median family income in North Catasauqua borough is $106,198, with families comprising 3+ earners (130) having the highest median family income of $173,214, while families with no earners (104) have the lowest median family income of $52,500, accounting for 16.2% and 13.0% of families, respectively.
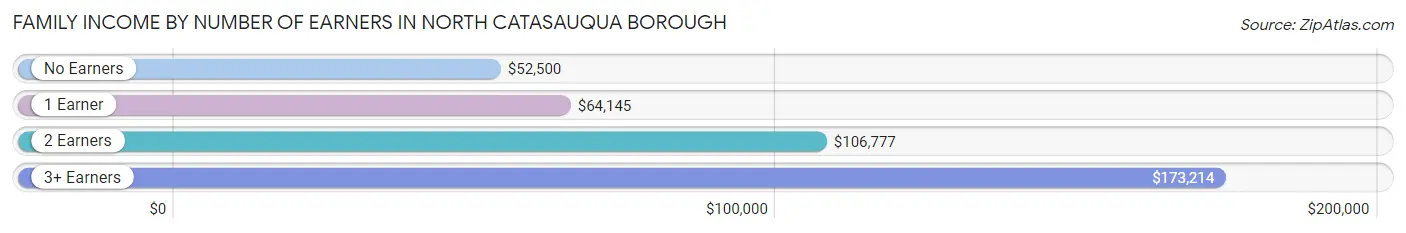
| Number of Earners | # Families | Median Income |
| No Earners | 104 (13.0%) | $52,500 |
| 1 Earner | 147 (18.3%) | $64,145 |
| 2 Earners | 422 (52.5%) | $106,777 |
| 3+ Earners | 130 (16.2%) | $173,214 |
| Total | 803 (100.0%) | $106,198 |
Household Income in North Catasauqua borough
Household Income Brackets in North Catasauqua borough
With 340 households falling in the category, the $100,000 to $149,999 income range is the most frequent in North Catasauqua borough, accounting for 28.7% of all households. In contrast, only 54 households (4.6%) fall into the $10,000 to $14,999 income bracket, making it the least populous group.
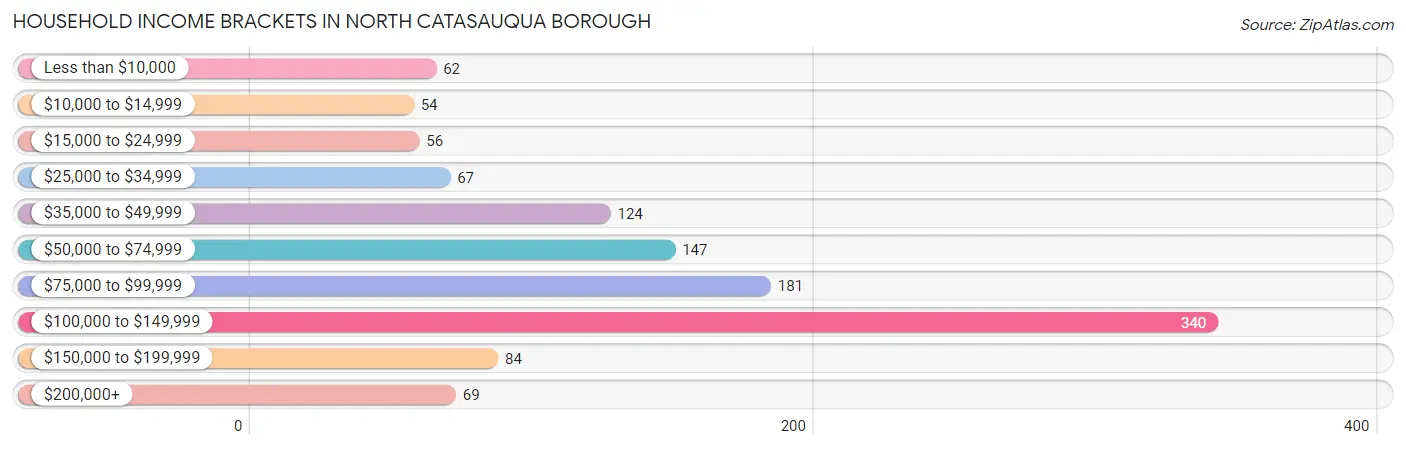
| Income Bracket | # Households | % Households |
| Less than $10,000 | 62 | 5.2% |
| $10,000 to $14,999 | 54 | 4.6% |
| $15,000 to $24,999 | 56 | 4.7% |
| $25,000 to $34,999 | 67 | 5.7% |
| $35,000 to $49,999 | 124 | 10.5% |
| $50,000 to $74,999 | 147 | 12.4% |
| $75,000 to $99,999 | 181 | 15.3% |
| $100,000 to $149,999 | 340 | 28.7% |
| $150,000 to $199,999 | 84 | 7.1% |
| $200,000+ | 69 | 5.8% |
Household Income by Householder Age in North Catasauqua borough
The median household income in North Catasauqua borough is $85,431, with the highest median household income of $99,737 found in the 25 to 44 years age bracket for the primary householder. A total of 388 households (32.8%) fall into this category. Meanwhile, the 15 to 24 years age bracket for the primary householder has the lowest median household income of $0, with 4 households (0.3%) in this group.
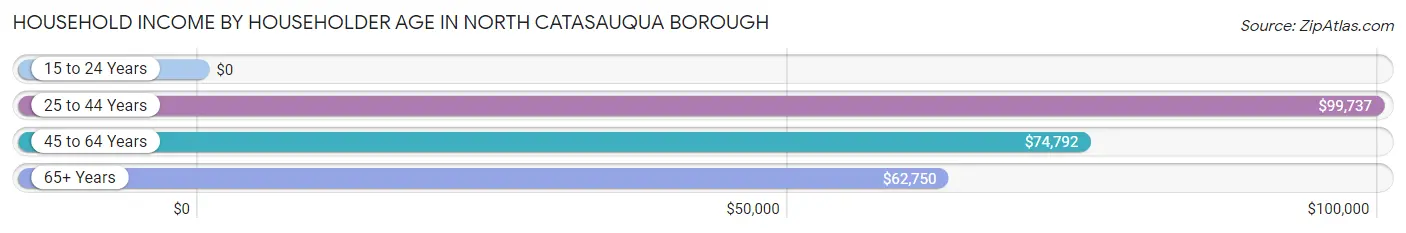
| Income Bracket | # Households | Median Income |
| 15 to 24 Years | 4 (0.3%) | $0 |
| 25 to 44 Years | 388 (32.8%) | $99,737 |
| 45 to 64 Years | 515 (43.5%) | $74,792 |
| 65+ Years | 277 (23.4%) | $62,750 |
| Total | 1,184 (100.0%) | $85,431 |
Poverty in North Catasauqua borough
Income Below Poverty by Sex and Age in North Catasauqua borough
With 10.7% poverty level for males and 4.4% for females among the residents of North Catasauqua borough, 6 to 11 year old males and 16 and 17 year old females are the most vulnerable to poverty, with 14 males (77.8%) and 16 females (32.0%) in their respective age groups living below the poverty level.
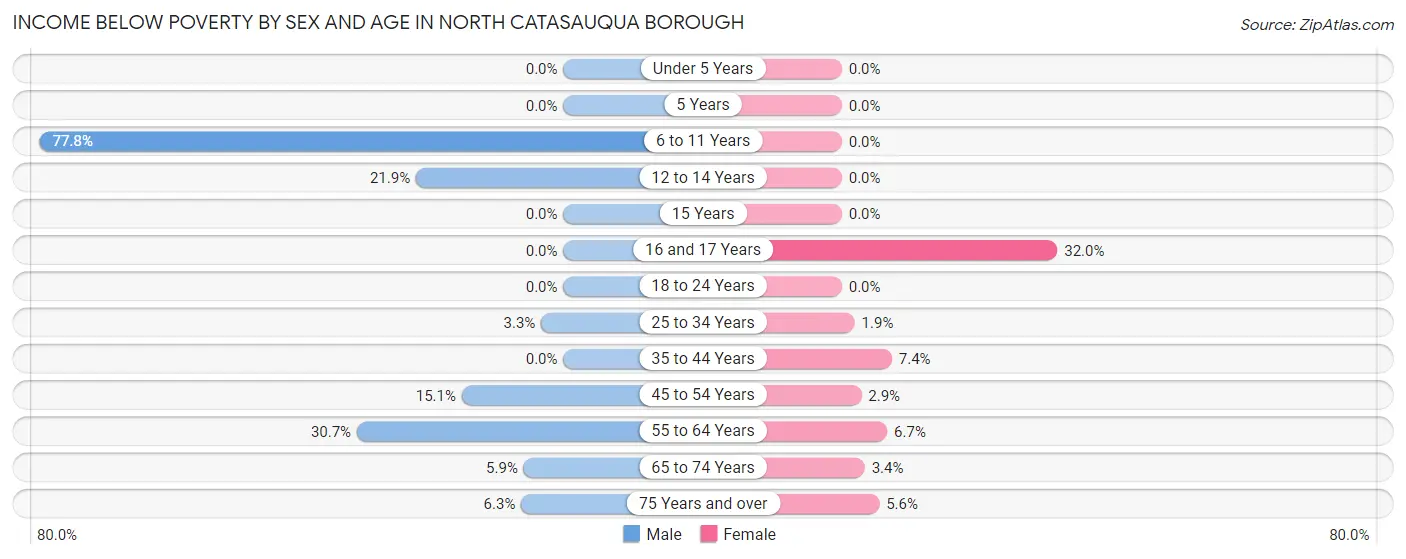
| Age Bracket | Male | Female |
| Under 5 Years | 0 (0.0%) | 0 (0.0%) |
| 5 Years | 0 (0.0%) | 0 (0.0%) |
| 6 to 11 Years | 14 (77.8%) | 0 (0.0%) |
| 12 to 14 Years | 14 (21.9%) | 0 (0.0%) |
| 15 Years | 0 (0.0%) | 0 (0.0%) |
| 16 and 17 Years | 0 (0.0%) | 16 (32.0%) |
| 18 to 24 Years | 0 (0.0%) | 0 (0.0%) |
| 25 to 34 Years | 7 (3.3%) | 4 (1.9%) |
| 35 to 44 Years | 0 (0.0%) | 15 (7.4%) |
| 45 to 54 Years | 30 (15.1%) | 6 (2.9%) |
| 55 to 64 Years | 80 (30.6%) | 13 (6.7%) |
| 65 to 74 Years | 8 (5.9%) | 5 (3.4%) |
| 75 Years and over | 5 (6.2%) | 6 (5.6%) |
| Total | 158 (10.7%) | 65 (4.4%) |
Income Above Poverty by Sex and Age in North Catasauqua borough
According to the poverty statistics in North Catasauqua borough, males aged under 5 years and females aged under 5 years are the age groups that are most secure financially, with 100.0% of males and 100.0% of females in these age groups living above the poverty line.
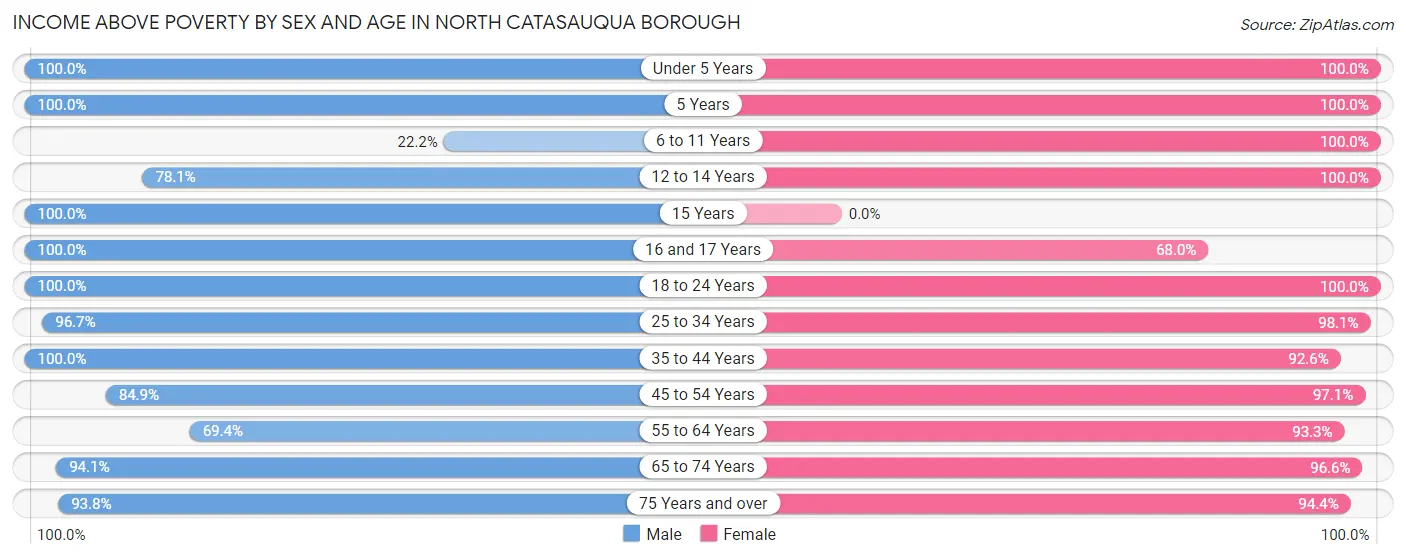
| Age Bracket | Male | Female |
| Under 5 Years | 74 (100.0%) | 62 (100.0%) |
| 5 Years | 33 (100.0%) | 8 (100.0%) |
| 6 to 11 Years | 4 (22.2%) | 138 (100.0%) |
| 12 to 14 Years | 50 (78.1%) | 62 (100.0%) |
| 15 Years | 34 (100.0%) | 0 (0.0%) |
| 16 and 17 Years | 47 (100.0%) | 34 (68.0%) |
| 18 to 24 Years | 90 (100.0%) | 91 (100.0%) |
| 25 to 34 Years | 206 (96.7%) | 205 (98.1%) |
| 35 to 44 Years | 230 (100.0%) | 187 (92.6%) |
| 45 to 54 Years | 169 (84.9%) | 201 (97.1%) |
| 55 to 64 Years | 181 (69.4%) | 180 (93.3%) |
| 65 to 74 Years | 128 (94.1%) | 142 (96.6%) |
| 75 Years and over | 75 (93.8%) | 102 (94.4%) |
| Total | 1,321 (89.3%) | 1,412 (95.6%) |
Income Below Poverty Among Married-Couple Families in North Catasauqua borough
The poverty statistics for married-couple families in North Catasauqua borough show that 0.7% or 5 of the total 671 families live below the poverty line. Families with no children have the highest poverty rate of 1.2%, comprising of 5 families. On the other hand, families with 1 or 2 children have the lowest poverty rate of 0.0%, which includes 0 families.
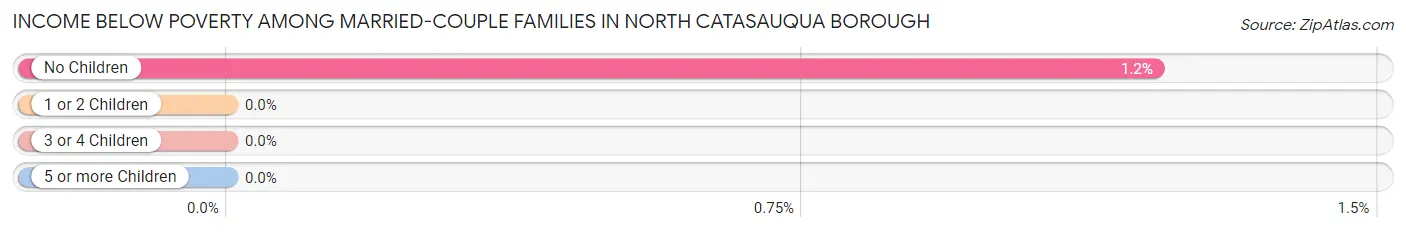
| Children | Above Poverty | Below Poverty |
| No Children | 408 (98.8%) | 5 (1.2%) |
| 1 or 2 Children | 214 (100.0%) | 0 (0.0%) |
| 3 or 4 Children | 44 (100.0%) | 0 (0.0%) |
| 5 or more Children | 0 (0.0%) | 0 (0.0%) |
| Total | 666 (99.3%) | 5 (0.7%) |
Income Below Poverty Among Single-Parent Households in North Catasauqua borough
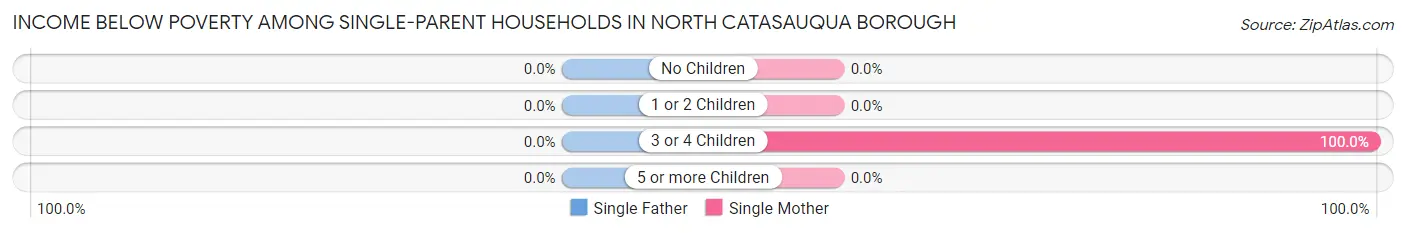
| Children | Single Father | Single Mother |
| No Children | 0 (0.0%) | 0 (0.0%) |
| 1 or 2 Children | 0 (0.0%) | 0 (0.0%) |
| 3 or 4 Children | 0 (0.0%) | 15 (100.0%) |
| 5 or more Children | 0 (0.0%) | 0 (0.0%) |
| Total | 0 (0.0%) | 15 (19.5%) |
Income Below Poverty Among Married-Couple vs Single-Parent Households in North Catasauqua borough
The poverty data for North Catasauqua borough shows that 5 of the married-couple family households (0.7%) and 15 of the single-parent households (11.4%) are living below the poverty level. Within the married-couple family households, those with no children have the highest poverty rate, with 5 households (1.2%) falling below the poverty line. Among the single-parent households, those with 3 or 4 children have the highest poverty rate, with 15 household (100.0%) living below poverty.
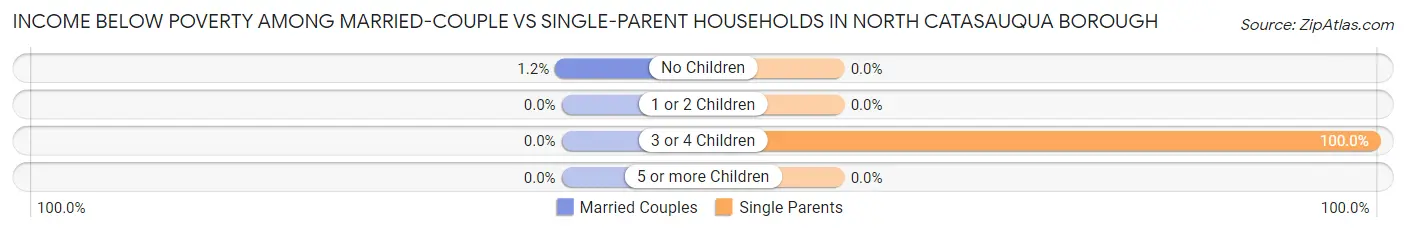
| Children | Married-Couple Families | Single-Parent Households |
| No Children | 5 (1.2%) | 0 (0.0%) |
| 1 or 2 Children | 0 (0.0%) | 0 (0.0%) |
| 3 or 4 Children | 0 (0.0%) | 15 (100.0%) |
| 5 or more Children | 0 (0.0%) | 0 (0.0%) |
| Total | 5 (0.7%) | 15 (11.4%) |
Race in North Catasauqua borough
The most populous races in North Catasauqua borough are White / Caucasian (2,411 | 81.6%), Hispanic or Latino (521 | 17.6%), and Two or more Races (344 | 11.6%).
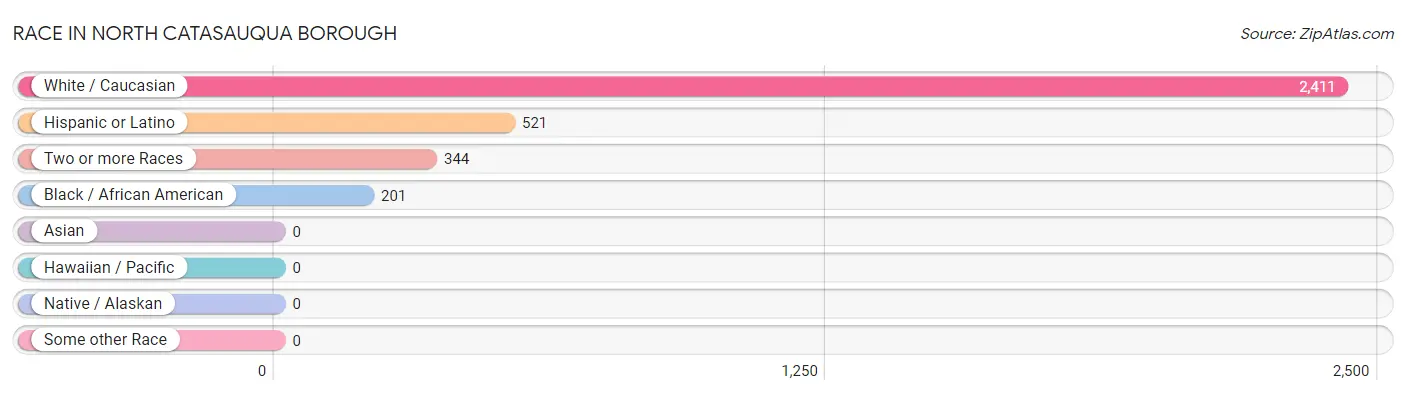
| Race | # Population | % Population |
| Asian | 0 | 0.0% |
| Black / African American | 201 | 6.8% |
| Hawaiian / Pacific | 0 | 0.0% |
| Hispanic or Latino | 521 | 17.6% |
| Native / Alaskan | 0 | 0.0% |
| White / Caucasian | 2,411 | 81.6% |
| Two or more Races | 344 | 11.6% |
| Some other Race | 0 | 0.0% |
| Total | 2,956 | 100.0% |
Ancestry in North Catasauqua borough
The most populous ancestries reported in North Catasauqua borough are German (1,023 | 34.6%), Puerto Rican (348 | 11.8%), Italian (302 | 10.2%), Irish (292 | 9.9%), and Austrian (159 | 5.4%), together accounting for 71.9% of all North Catasauqua borough residents.
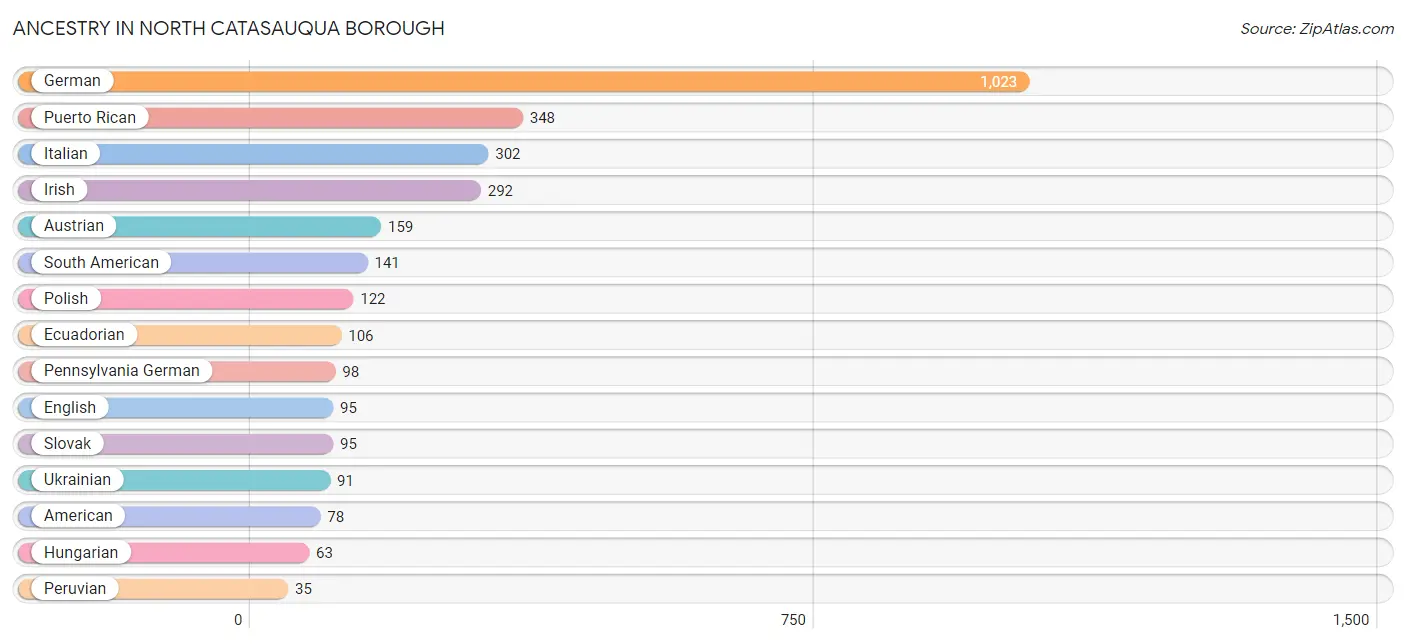
| Ancestry | # Population | % Population |
| American | 78 | 2.6% |
| Arab | 6 | 0.2% |
| Austrian | 159 | 5.4% |
| Canadian | 11 | 0.4% |
| Central American | 26 | 0.9% |
| Dutch | 20 | 0.7% |
| Eastern European | 3 | 0.1% |
| Ecuadorian | 106 | 3.6% |
| English | 95 | 3.2% |
| European | 21 | 0.7% |
| Finnish | 11 | 0.4% |
| French | 4 | 0.1% |
| French Canadian | 4 | 0.1% |
| German | 1,023 | 34.6% |
| Greek | 5 | 0.2% |
| Guatemalan | 26 | 0.9% |
| Hungarian | 63 | 2.1% |
| Indian (Asian) | 4 | 0.1% |
| Irish | 292 | 9.9% |
| Italian | 302 | 10.2% |
| Lithuanian | 20 | 0.7% |
| Norwegian | 26 | 0.9% |
| Pennsylvania German | 98 | 3.3% |
| Peruvian | 35 | 1.2% |
| Polish | 122 | 4.1% |
| Portuguese | 12 | 0.4% |
| Puerto Rican | 348 | 11.8% |
| Russian | 5 | 0.2% |
| Scotch-Irish | 6 | 0.2% |
| Scottish | 5 | 0.2% |
| Slavic | 4 | 0.1% |
| Slovak | 95 | 3.2% |
| South American | 141 | 4.8% |
| Spanish | 6 | 0.2% |
| Swedish | 4 | 0.1% |
| Swiss | 15 | 0.5% |
| Syrian | 6 | 0.2% |
| Ukrainian | 91 | 3.1% |
| Welsh | 20 | 0.7% | View All 39 Rows |
Immigrants in North Catasauqua borough
The most numerous immigrant groups reported in North Catasauqua borough came from Latin America (84 | 2.8%), Central America (63 | 2.1%), El Salvador (47 | 1.6%), Ecuador (21 | 0.7%), and South America (21 | 0.7%), together accounting for 8.0% of all North Catasauqua borough residents.
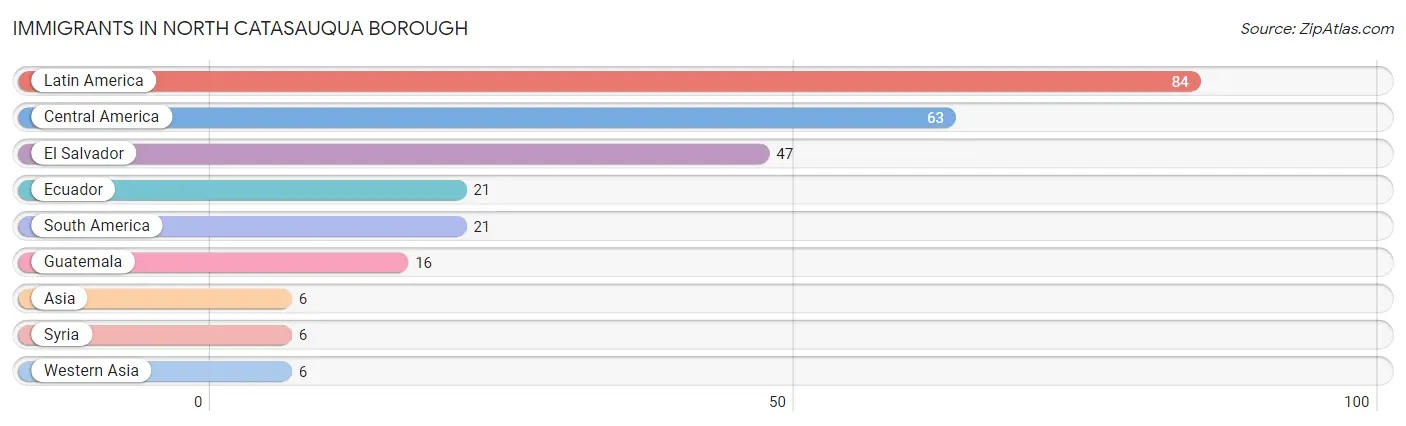
| Immigration Origin | # Population | % Population |
| Asia | 6 | 0.2% |
| Central America | 63 | 2.1% |
| Ecuador | 21 | 0.7% |
| El Salvador | 47 | 1.6% |
| Guatemala | 16 | 0.5% |
| Latin America | 84 | 2.8% |
| South America | 21 | 0.7% |
| Syria | 6 | 0.2% |
| Western Asia | 6 | 0.2% | View All 9 Rows |
Sex and Age in North Catasauqua borough
Sex and Age in North Catasauqua borough
The most populous age groups in North Catasauqua borough are 60 to 64 Years (159 | 10.7%) for men and 30 to 34 Years (181 | 12.2%) for women.
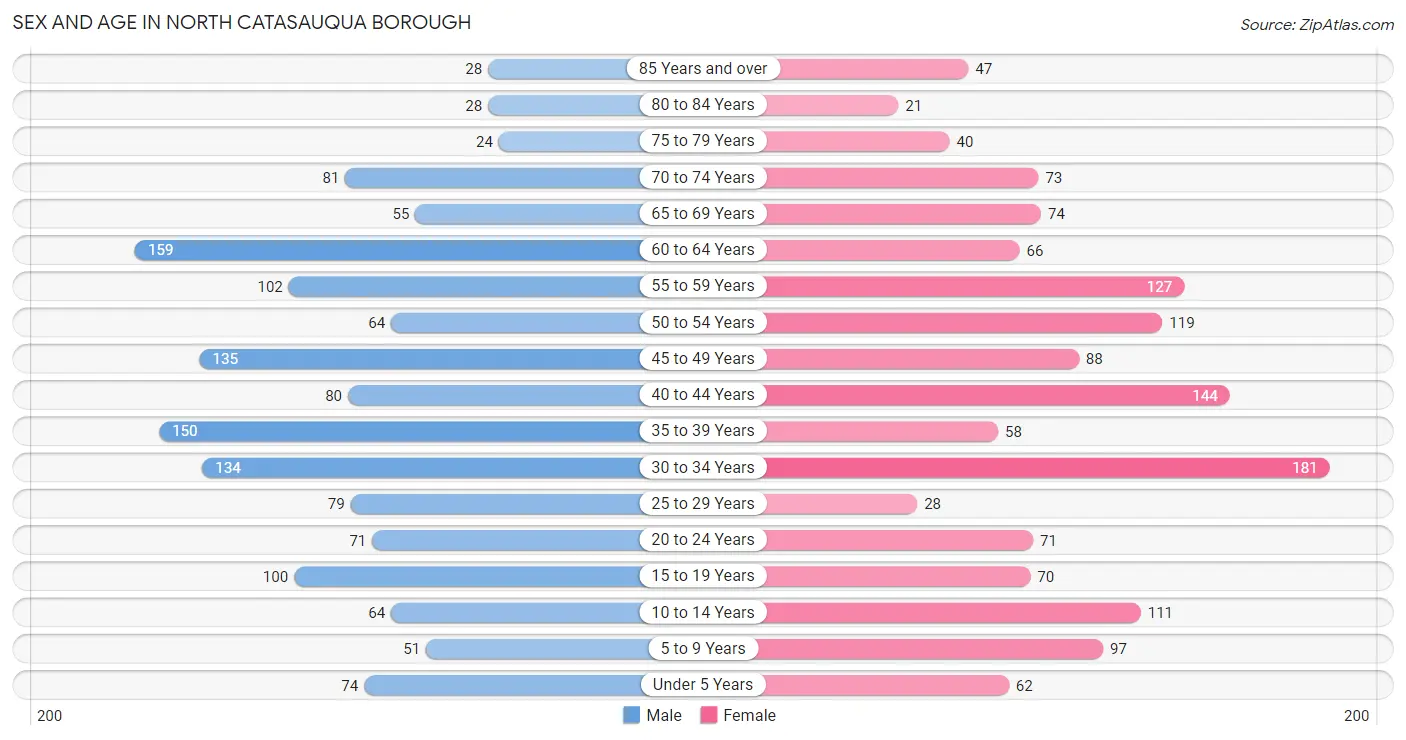
| Age Bracket | Male | Female |
| Under 5 Years | 74 (5.0%) | 62 (4.2%) |
| 5 to 9 Years | 51 (3.5%) | 97 (6.6%) |
| 10 to 14 Years | 64 (4.3%) | 111 (7.5%) |
| 15 to 19 Years | 100 (6.8%) | 70 (4.7%) |
| 20 to 24 Years | 71 (4.8%) | 71 (4.8%) |
| 25 to 29 Years | 79 (5.3%) | 28 (1.9%) |
| 30 to 34 Years | 134 (9.1%) | 181 (12.2%) |
| 35 to 39 Years | 150 (10.1%) | 58 (3.9%) |
| 40 to 44 Years | 80 (5.4%) | 144 (9.8%) |
| 45 to 49 Years | 135 (9.1%) | 88 (6.0%) |
| 50 to 54 Years | 64 (4.3%) | 119 (8.1%) |
| 55 to 59 Years | 102 (6.9%) | 127 (8.6%) |
| 60 to 64 Years | 159 (10.7%) | 66 (4.5%) |
| 65 to 69 Years | 55 (3.7%) | 74 (5.0%) |
| 70 to 74 Years | 81 (5.5%) | 73 (4.9%) |
| 75 to 79 Years | 24 (1.6%) | 40 (2.7%) |
| 80 to 84 Years | 28 (1.9%) | 21 (1.4%) |
| 85 Years and over | 28 (1.9%) | 47 (3.2%) |
| Total | 1,479 (100.0%) | 1,477 (100.0%) |
Families and Households in North Catasauqua borough
Median Family Size in North Catasauqua borough
The median family size in North Catasauqua borough is 3.10 persons per family, with single female/mother families (77 | 9.6%) accounting for the largest median family size of 4.6 persons per family. On the other hand, single male/father families (55 | 6.9%) represent the smallest median family size with 2.78 persons per family.
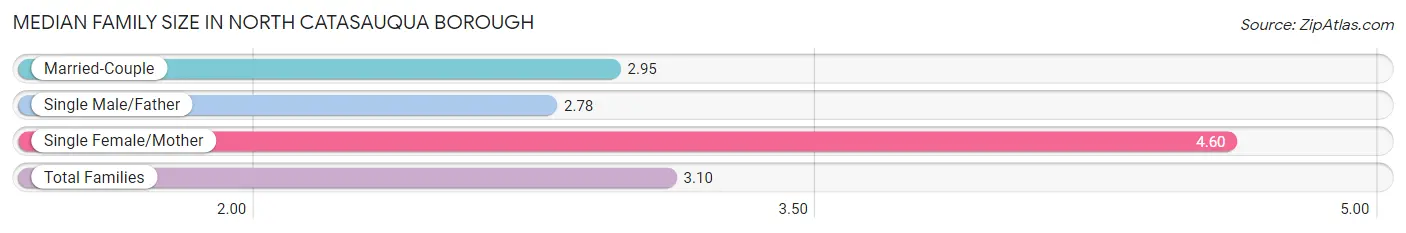
| Family Type | # Families | Family Size |
| Married-Couple | 671 (83.6%) | 2.95 |
| Single Male/Father | 55 (6.9%) | 2.78 |
| Single Female/Mother | 77 (9.6%) | 4.60 |
| Total Families | 803 (100.0%) | 3.10 |
Median Household Size in North Catasauqua borough
The median household size in North Catasauqua borough is 2.50 persons per household, with single female/mother households (77 | 6.5%) accounting for the largest median household size of 5.38 persons per household. non-family households (381 | 32.2%) represent the smallest median household size with 1.02 persons per household.
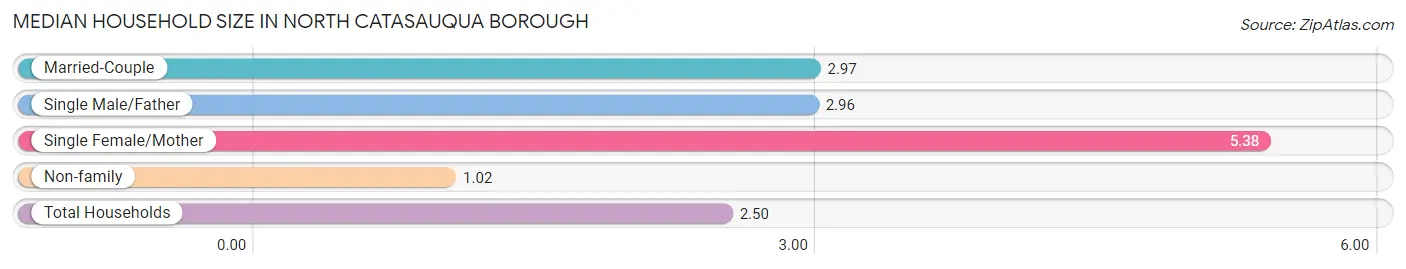
| Household Type | # Households | Household Size |
| Married-Couple | 671 (56.7%) | 2.97 |
| Single Male/Father | 55 (4.6%) | 2.96 |
| Single Female/Mother | 77 (6.5%) | 5.38 |
| Non-family | 381 (32.2%) | 1.02 |
| Total Households | 1,184 (100.0%) | 2.50 |
Household Size by Marriage Status in North Catasauqua borough
Out of a total of 1,184 households in North Catasauqua borough, 803 (67.8%) are family households, while 381 (32.2%) are nonfamily households. The most numerous type of family households are 2-person households, comprising 334, and the most common type of nonfamily households are 1-person households, comprising 377.
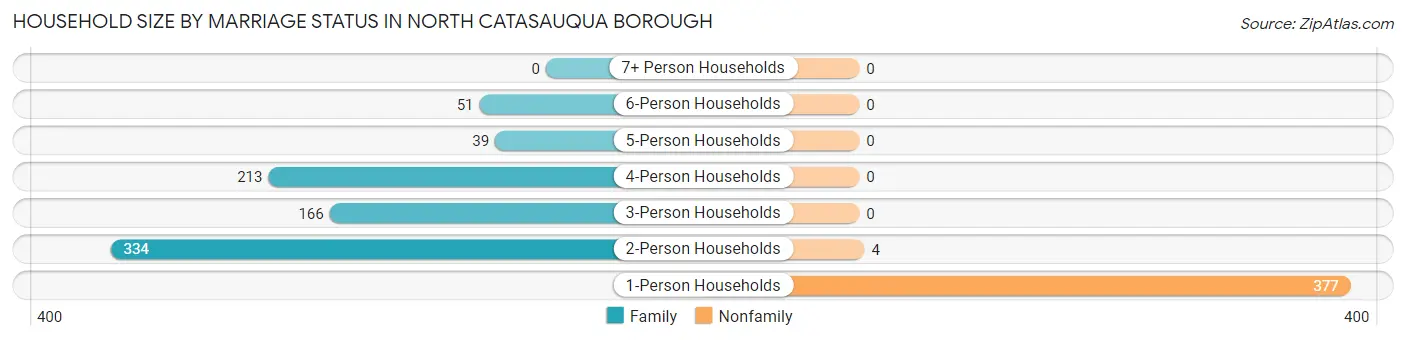
| Household Size | Family Households | Nonfamily Households |
| 1-Person Households | - | 377 (31.8%) |
| 2-Person Households | 334 (28.2%) | 4 (0.3%) |
| 3-Person Households | 166 (14.0%) | 0 (0.0%) |
| 4-Person Households | 213 (18.0%) | 0 (0.0%) |
| 5-Person Households | 39 (3.3%) | 0 (0.0%) |
| 6-Person Households | 51 (4.3%) | 0 (0.0%) |
| 7+ Person Households | 0 (0.0%) | 0 (0.0%) |
| Total | 803 (67.8%) | 381 (32.2%) |
Female Fertility in North Catasauqua borough
Fertility by Age in North Catasauqua borough
Average fertility rate in North Catasauqua borough is 23.0 births per 1,000 women. Women in the age bracket of 20 to 34 years have the highest fertility rate with 36.0 births per 1,000 women. Women in the age bracket of 20 to 34 years acount for 66.7% of all women with births.
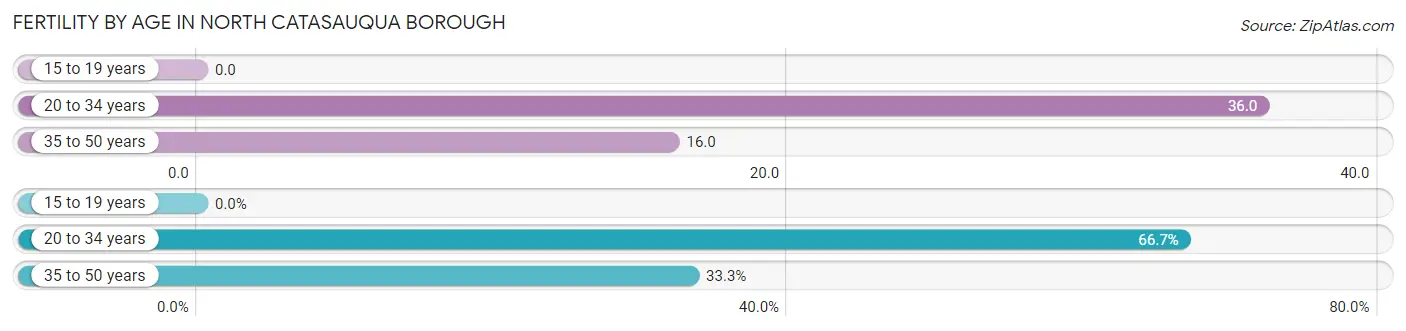
| Age Bracket | Women with Births | Births / 1,000 Women |
| 15 to 19 years | 0 (0.0%) | 0.0 |
| 20 to 34 years | 10 (66.7%) | 36.0 |
| 35 to 50 years | 5 (33.3%) | 16.0 |
| Total | 15 (100.0%) | 23.0 |
Fertility by Age by Marriage Status in North Catasauqua borough
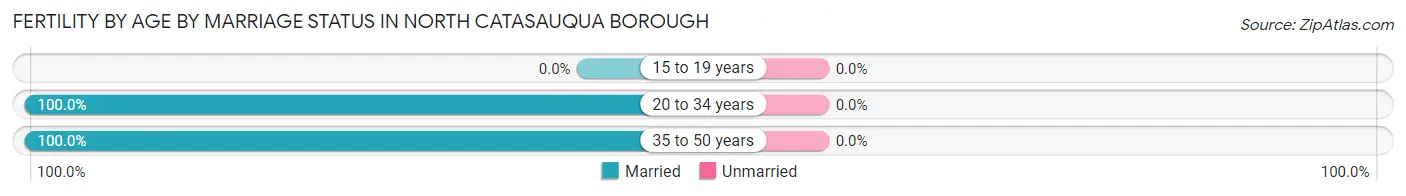
| Age Bracket | Married | Unmarried |
| 15 to 19 years | 0 (0.0%) | 0 (0.0%) |
| 20 to 34 years | 10 (100.0%) | 0 (0.0%) |
| 35 to 50 years | 5 (100.0%) | 0 (0.0%) |
| Total | 15 (100.0%) | 0 (0.0%) |
Fertility by Education in North Catasauqua borough
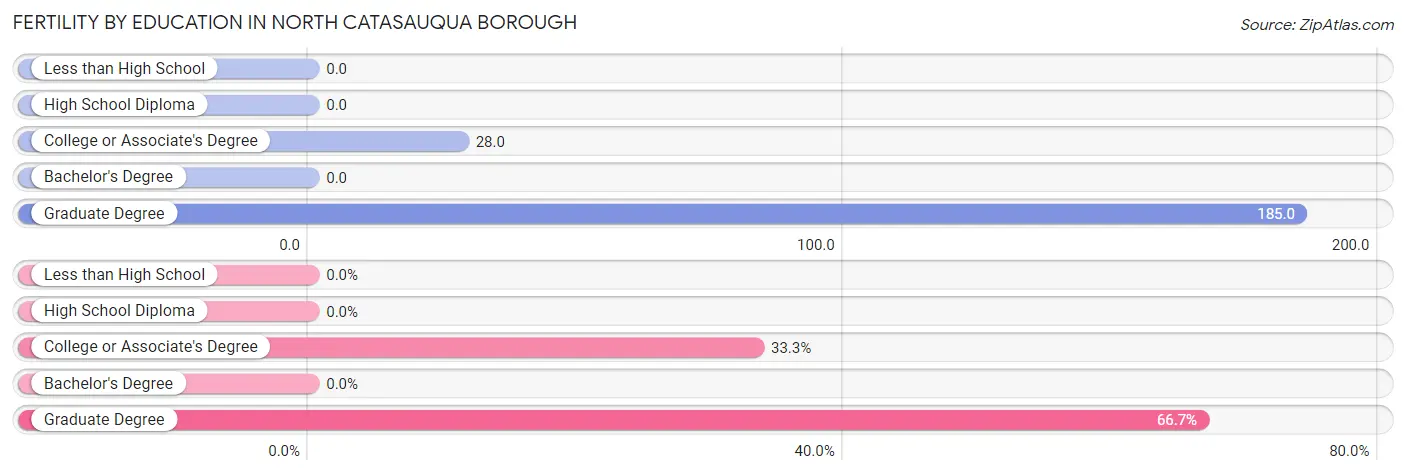
| Educational Attainment | Women with Births | Births / 1,000 Women |
| Less than High School | 0 (0.0%) | 0.0 |
| High School Diploma | 0 (0.0%) | 0.0 |
| College or Associate's Degree | 5 (33.3%) | 28.0 |
| Bachelor's Degree | 0 (0.0%) | 0.0 |
| Graduate Degree | 10 (66.7%) | 185.0 |
| Total | 15 (100.0%) | 23.0 |
Fertility by Education by Marriage Status in North Catasauqua borough
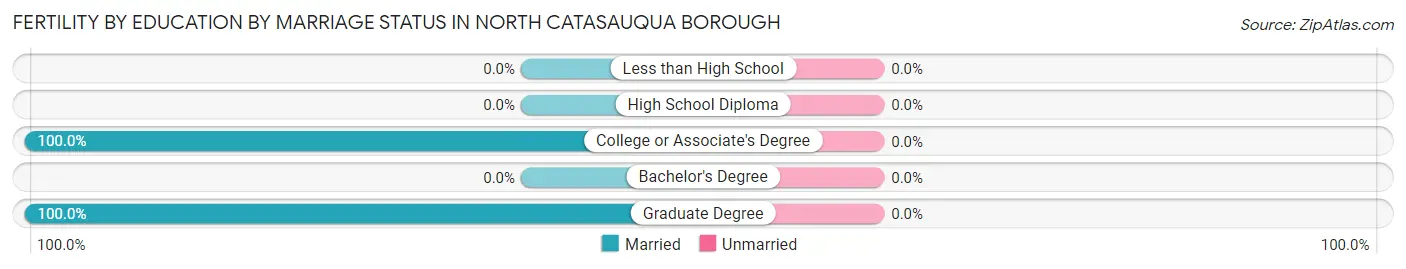
| Educational Attainment | Married | Unmarried |
| Less than High School | 0 (0.0%) | 0 (0.0%) |
| High School Diploma | 0 (0.0%) | 0 (0.0%) |
| College or Associate's Degree | 5 (100.0%) | 0 (0.0%) |
| Bachelor's Degree | 0 (0.0%) | 0 (0.0%) |
| Graduate Degree | 10 (100.0%) | 0 (0.0%) |
| Total | 15 (100.0%) | 0 (0.0%) |
Employment Characteristics in North Catasauqua borough
Employment by Class of Employer in North Catasauqua borough
Among the 1,689 employed individuals in North Catasauqua borough, private company employees (1,224 | 72.5%), not-for-profit organizations (154 | 9.1%), and local government employees (106 | 6.3%) make up the most common classes of employment.
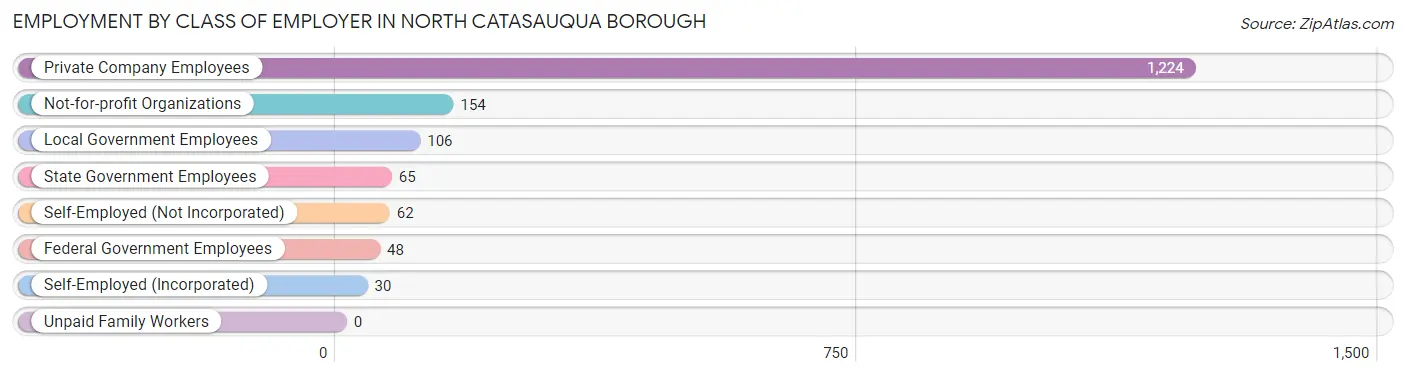
| Employer Class | # Employees | % Employees |
| Private Company Employees | 1,224 | 72.5% |
| Self-Employed (Incorporated) | 30 | 1.8% |
| Self-Employed (Not Incorporated) | 62 | 3.7% |
| Not-for-profit Organizations | 154 | 9.1% |
| Local Government Employees | 106 | 6.3% |
| State Government Employees | 65 | 3.8% |
| Federal Government Employees | 48 | 2.8% |
| Unpaid Family Workers | 0 | 0.0% |
| Total | 1,689 | 100.0% |
Employment Status by Age in North Catasauqua borough
According to the labor force statistics for North Catasauqua borough, out of the total population over 16 years of age (2,463), 71.5% or 1,761 individuals are in the labor force, with 3.1% or 55 of them unemployed. The age group with the highest labor force participation rate is 25 to 29 years, with 100.0% or 107 individuals in the labor force. Within the labor force, the 20 to 24 years age range has the highest percentage of unemployed individuals, with 15.8% or 19 of them being unemployed.
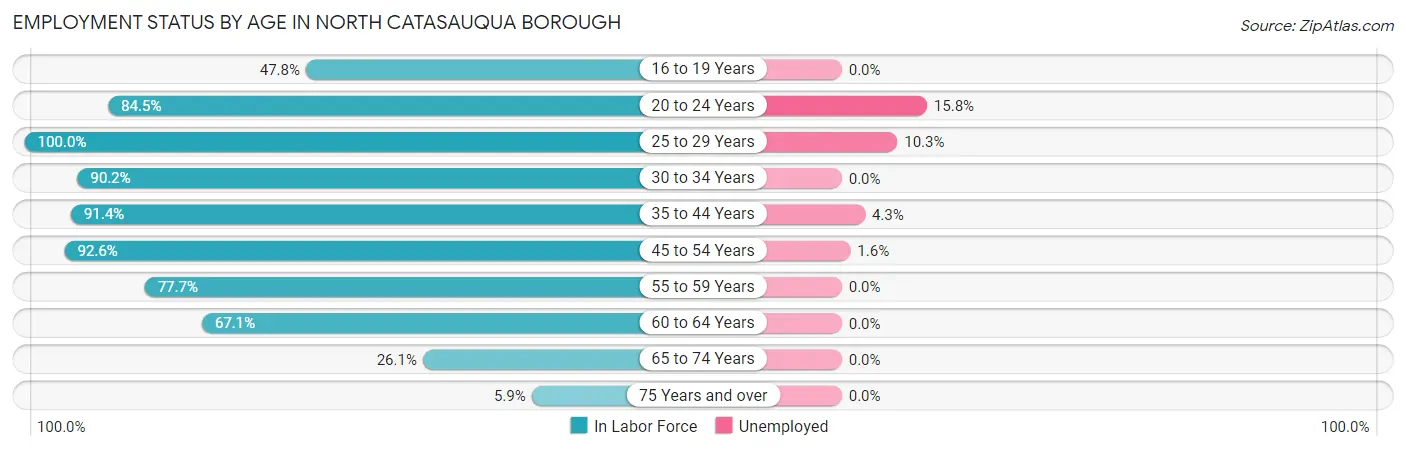
| Age Bracket | In Labor Force | Unemployed |
| 16 to 19 Years | 65 (47.8%) | 0 (0.0%) |
| 20 to 24 Years | 120 (84.5%) | 19 (15.8%) |
| 25 to 29 Years | 107 (100.0%) | 11 (10.3%) |
| 30 to 34 Years | 284 (90.2%) | 0 (0.0%) |
| 35 to 44 Years | 395 (91.4%) | 17 (4.3%) |
| 45 to 54 Years | 376 (92.6%) | 6 (1.6%) |
| 55 to 59 Years | 178 (77.7%) | 0 (0.0%) |
| 60 to 64 Years | 151 (67.1%) | 0 (0.0%) |
| 65 to 74 Years | 74 (26.1%) | 0 (0.0%) |
| 75 Years and over | 11 (5.9%) | 0 (0.0%) |
| Total | 1,761 (71.5%) | 55 (3.1%) |
Employment Status by Educational Attainment in North Catasauqua borough
According to labor force statistics for North Catasauqua borough, 87.0% of individuals (1,491) out of the total population between 25 and 64 years of age (1,714) are in the labor force, with 2.4% or 36 of them being unemployed. The group with the highest labor force participation rate are those with the educational attainment of bachelor's degree or higher, with 98.3% or 457 individuals in the labor force. Within the labor force, individuals with high school diploma education have the highest percentage of unemployment, with 4.4% or 27 of them being unemployed.
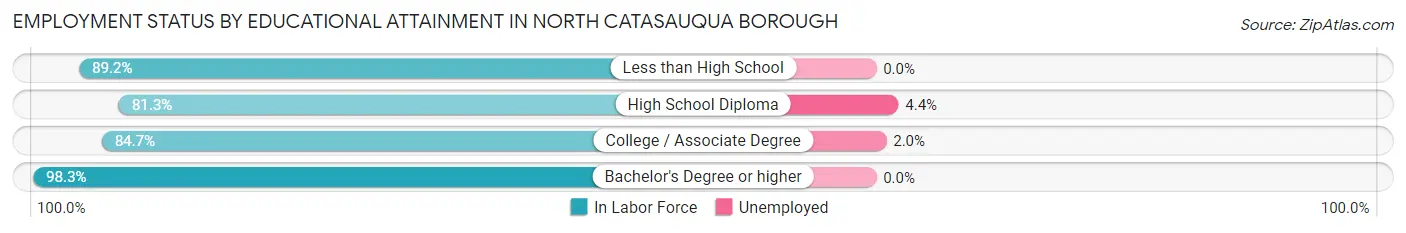
| Educational Attainment | In Labor Force | Unemployed |
| Less than High School | 33 (89.2%) | 0 (0.0%) |
| High School Diploma | 607 (81.3%) | 33 (4.4%) |
| College / Associate Degree | 394 (84.7%) | 9 (2.0%) |
| Bachelor's Degree or higher | 457 (98.3%) | 0 (0.0%) |
| Total | 1,491 (87.0%) | 41 (2.4%) |
Employment Occupations by Sex in North Catasauqua borough
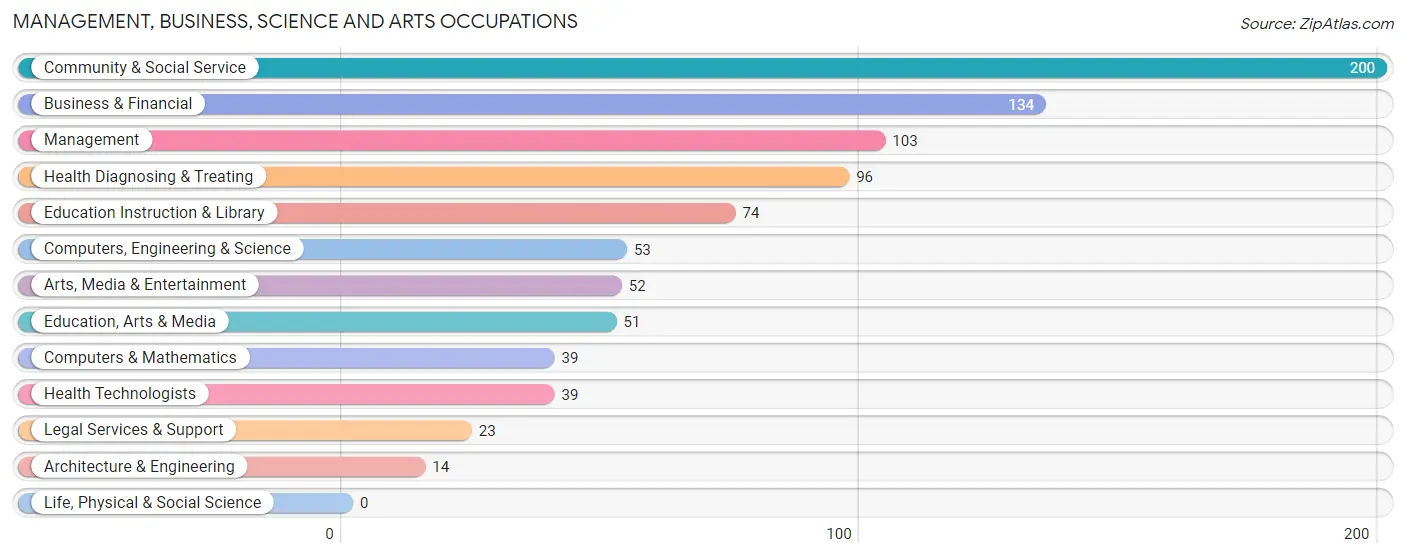
Management, Business, Science and Arts Occupations
The most common Management, Business, Science and Arts occupations in North Catasauqua borough are Community & Social Service (200 | 12.0%), Business & Financial (134 | 8.1%), Management (103 | 6.2%), Health Diagnosing & Treating (96 | 5.8%), and Education Instruction & Library (74 | 4.5%).
Management, Business, Science and Arts Occupations by Sex
Within the Management, Business, Science and Arts occupations in North Catasauqua borough, the most male-oriented occupations are Computers, Engineering & Science (100.0%), Computers & Mathematics (100.0%), and Architecture & Engineering (100.0%), while the most female-oriented occupations are Health Diagnosing & Treating (100.0%), Health Technologists (100.0%), and Management (83.5%).
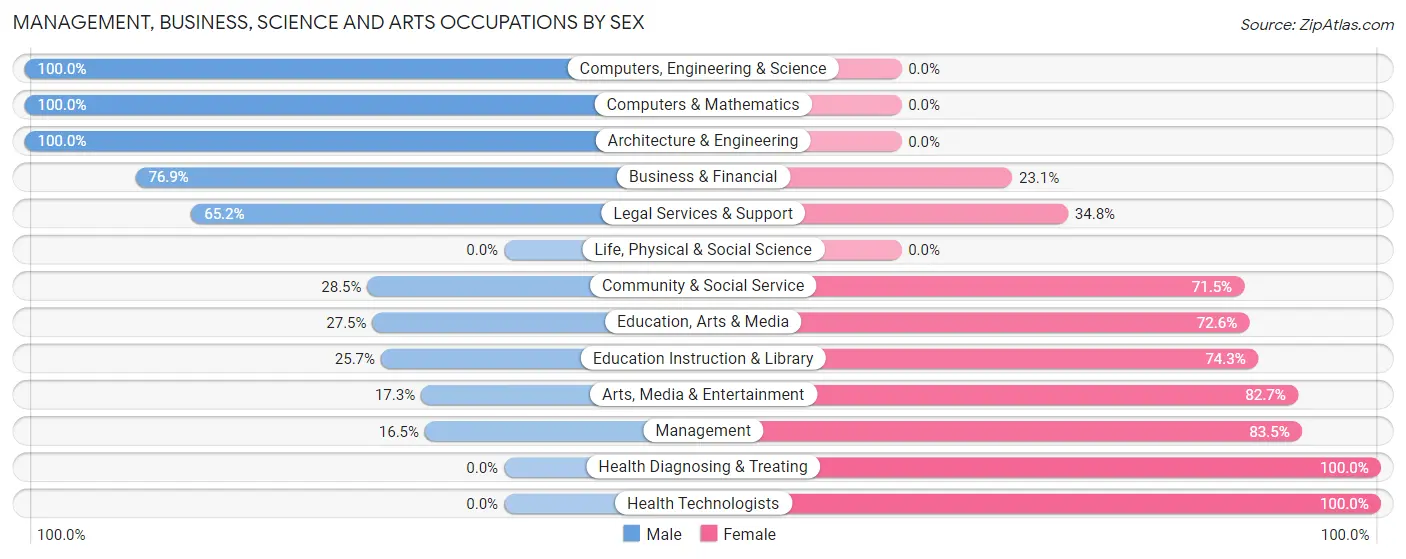
| Occupation | Male | Female |
| Management | 17 (16.5%) | 86 (83.5%) |
| Business & Financial | 103 (76.9%) | 31 (23.1%) |
| Computers, Engineering & Science | 53 (100.0%) | 0 (0.0%) |
| Computers & Mathematics | 39 (100.0%) | 0 (0.0%) |
| Architecture & Engineering | 14 (100.0%) | 0 (0.0%) |
| Life, Physical & Social Science | 0 (0.0%) | 0 (0.0%) |
| Community & Social Service | 57 (28.5%) | 143 (71.5%) |
| Education, Arts & Media | 14 (27.5%) | 37 (72.6%) |
| Legal Services & Support | 15 (65.2%) | 8 (34.8%) |
| Education Instruction & Library | 19 (25.7%) | 55 (74.3%) |
| Arts, Media & Entertainment | 9 (17.3%) | 43 (82.7%) |
| Health Diagnosing & Treating | 0 (0.0%) | 96 (100.0%) |
| Health Technologists | 0 (0.0%) | 39 (100.0%) |
| Total (Category) | 230 (39.3%) | 356 (60.8%) |
| Total (Overall) | 844 (50.8%) | 816 (49.2%) |
Services Occupations
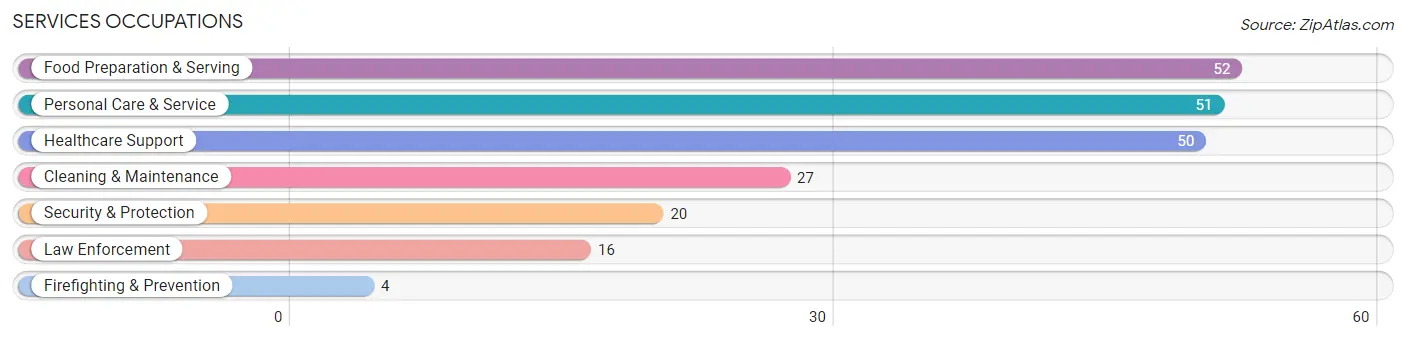
The most common Services occupations in North Catasauqua borough are Food Preparation & Serving (52 | 3.1%), Personal Care & Service (51 | 3.1%), Healthcare Support (50 | 3.0%), Cleaning & Maintenance (27 | 1.6%), and Security & Protection (20 | 1.2%).
Services Occupations by Sex
Within the Services occupations in North Catasauqua borough, the most male-oriented occupations are Firefighting & Prevention (100.0%), Cleaning & Maintenance (100.0%), and Food Preparation & Serving (76.9%), while the most female-oriented occupations are Healthcare Support (100.0%), Law Enforcement (68.8%), and Personal Care & Service (58.8%).
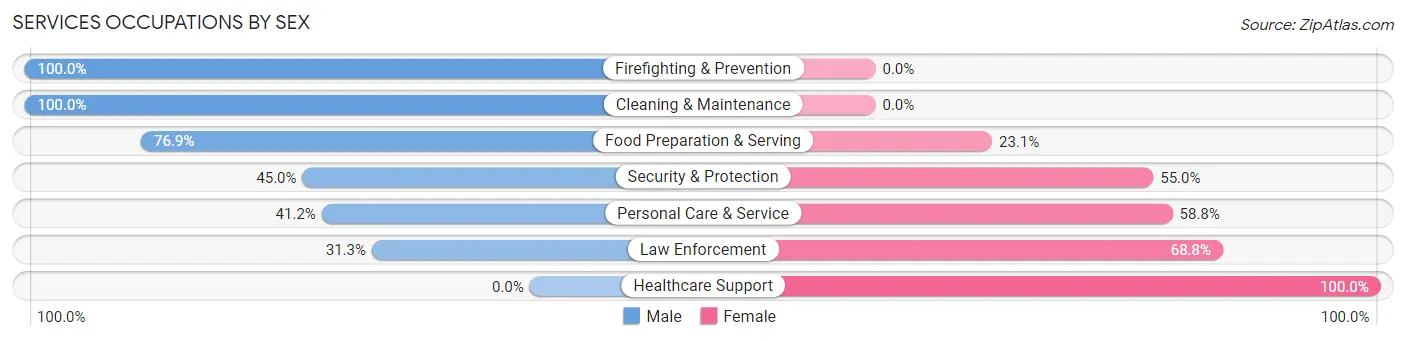
| Occupation | Male | Female |
| Healthcare Support | 0 (0.0%) | 50 (100.0%) |
| Security & Protection | 9 (45.0%) | 11 (55.0%) |
| Firefighting & Prevention | 4 (100.0%) | 0 (0.0%) |
| Law Enforcement | 5 (31.2%) | 11 (68.8%) |
| Food Preparation & Serving | 40 (76.9%) | 12 (23.1%) |
| Cleaning & Maintenance | 27 (100.0%) | 0 (0.0%) |
| Personal Care & Service | 21 (41.2%) | 30 (58.8%) |
| Total (Category) | 97 (48.5%) | 103 (51.5%) |
| Total (Overall) | 844 (50.8%) | 816 (49.2%) |
Sales and Office Occupations
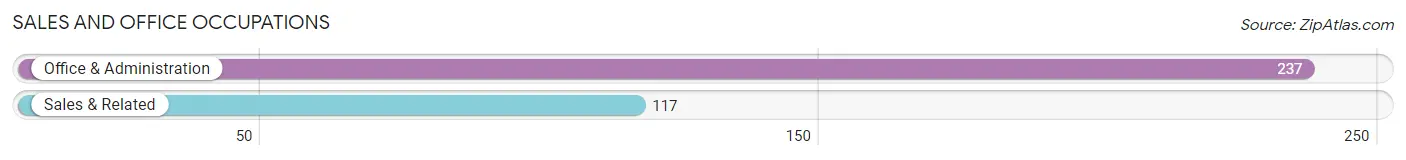
The most common Sales and Office occupations in North Catasauqua borough are Office & Administration (237 | 14.3%), and Sales & Related (117 | 7.0%).
Sales and Office Occupations by Sex
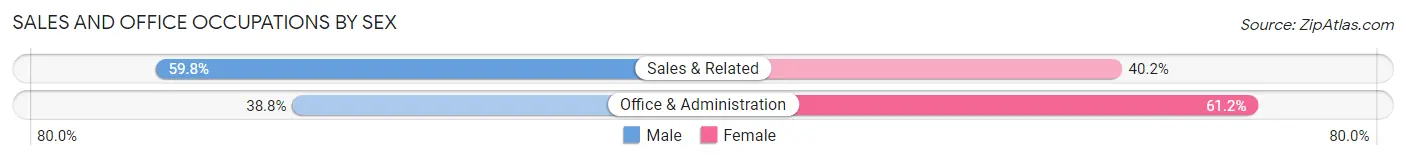
| Occupation | Male | Female |
| Sales & Related | 70 (59.8%) | 47 (40.2%) |
| Office & Administration | 92 (38.8%) | 145 (61.2%) |
| Total (Category) | 162 (45.8%) | 192 (54.2%) |
| Total (Overall) | 844 (50.8%) | 816 (49.2%) |
Natural Resources, Construction and Maintenance Occupations
The most common Natural Resources, Construction and Maintenance occupations in North Catasauqua borough are Construction & Extraction (99 | 6.0%), Installation, Maintenance & Repair (33 | 2.0%), and Farming, Fishing & Forestry (6 | 0.4%).
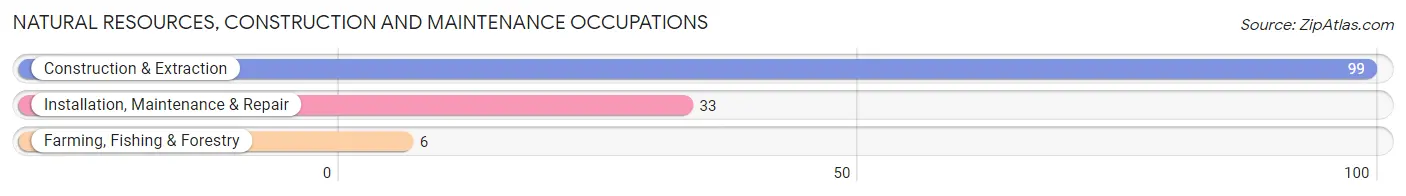
Natural Resources, Construction and Maintenance Occupations by Sex
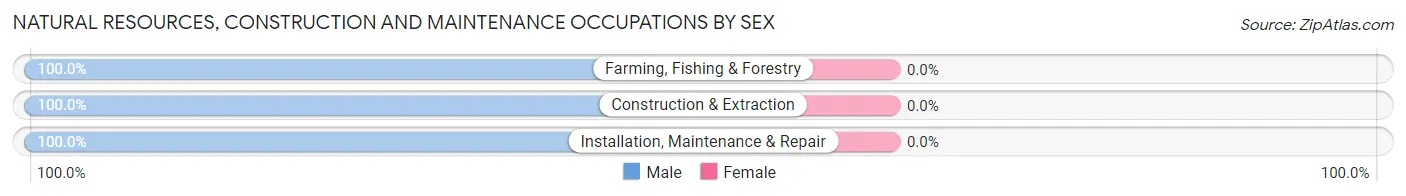
| Occupation | Male | Female |
| Farming, Fishing & Forestry | 6 (100.0%) | 0 (0.0%) |
| Construction & Extraction | 99 (100.0%) | 0 (0.0%) |
| Installation, Maintenance & Repair | 33 (100.0%) | 0 (0.0%) |
| Total (Category) | 138 (100.0%) | 0 (0.0%) |
| Total (Overall) | 844 (50.8%) | 816 (49.2%) |
Production, Transportation and Moving Occupations
The most common Production, Transportation and Moving occupations in North Catasauqua borough are Production (195 | 11.7%), Material Moving (140 | 8.4%), and Transportation (47 | 2.8%).
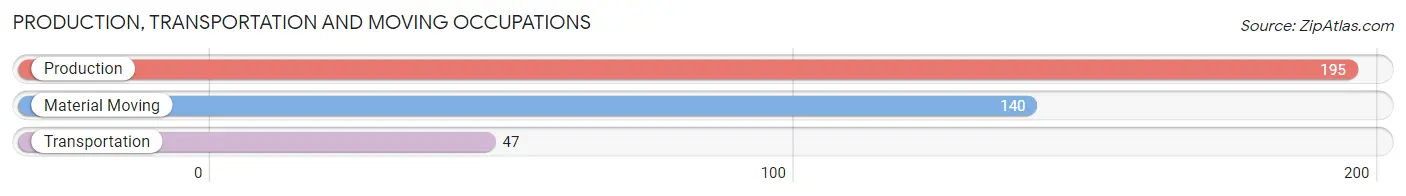
Production, Transportation and Moving Occupations by Sex
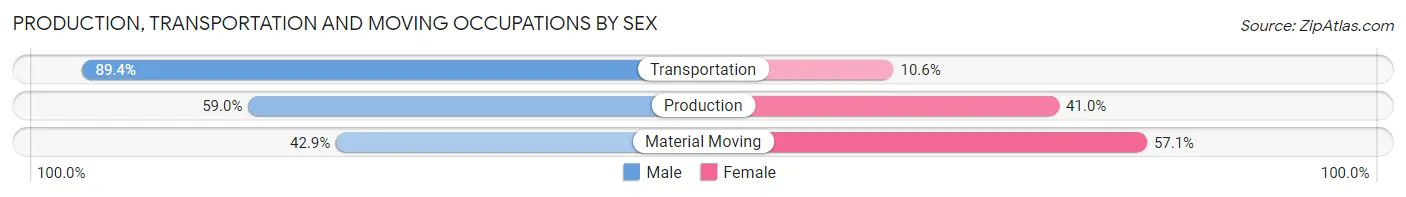
| Occupation | Male | Female |
| Production | 115 (59.0%) | 80 (41.0%) |
| Transportation | 42 (89.4%) | 5 (10.6%) |
| Material Moving | 60 (42.9%) | 80 (57.1%) |
| Total (Category) | 217 (56.8%) | 165 (43.2%) |
| Total (Overall) | 844 (50.8%) | 816 (49.2%) |
Employment Industries by Sex in North Catasauqua borough
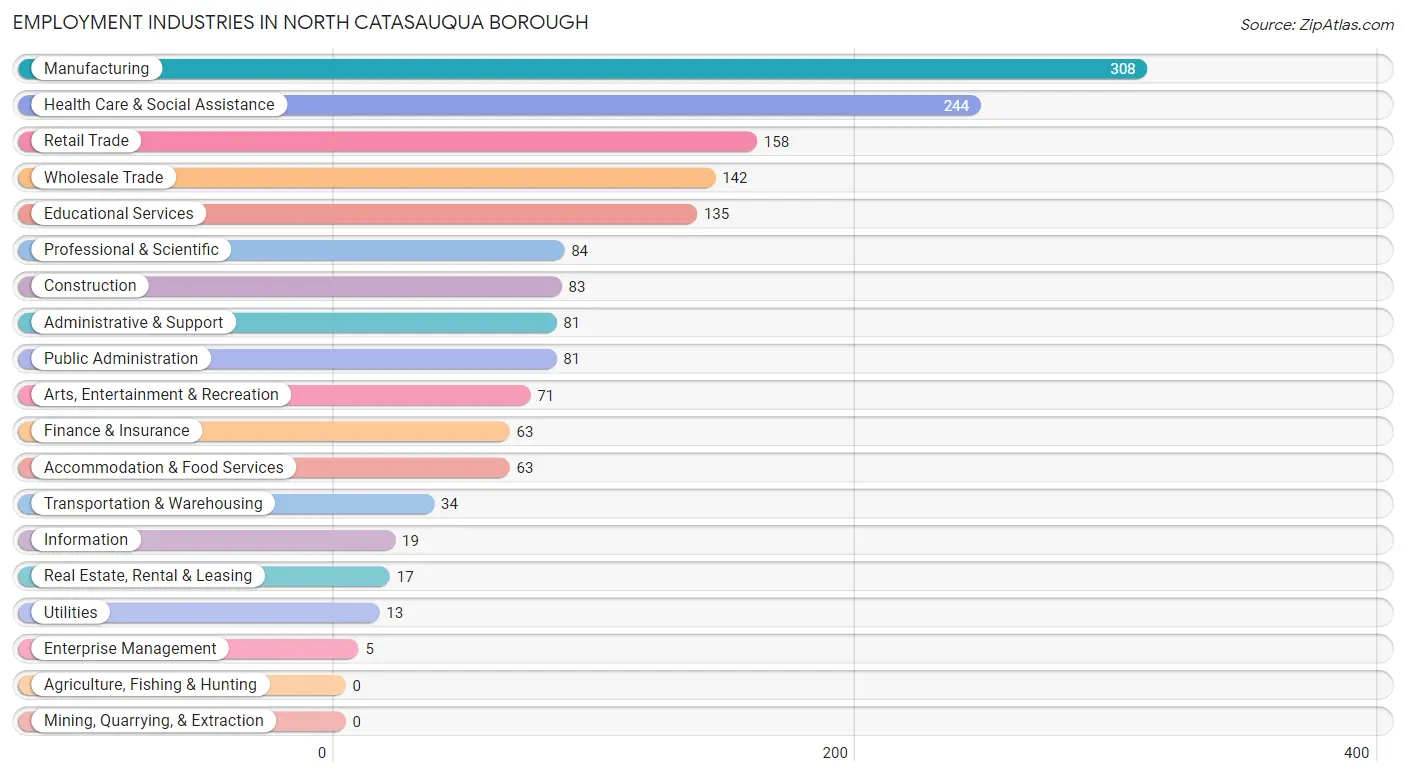
Employment Industries in North Catasauqua borough
The major employment industries in North Catasauqua borough include Manufacturing (308 | 18.5%), Health Care & Social Assistance (244 | 14.7%), Retail Trade (158 | 9.5%), Wholesale Trade (142 | 8.6%), and Educational Services (135 | 8.1%).
Employment Industries by Sex in North Catasauqua borough
The North Catasauqua borough industries that see more men than women are Utilities (100.0%), Information (100.0%), and Enterprise Management (100.0%), whereas the industries that tend to have a higher number of women are Finance & Insurance (100.0%), Health Care & Social Assistance (88.9%), and Professional & Scientific (67.9%).
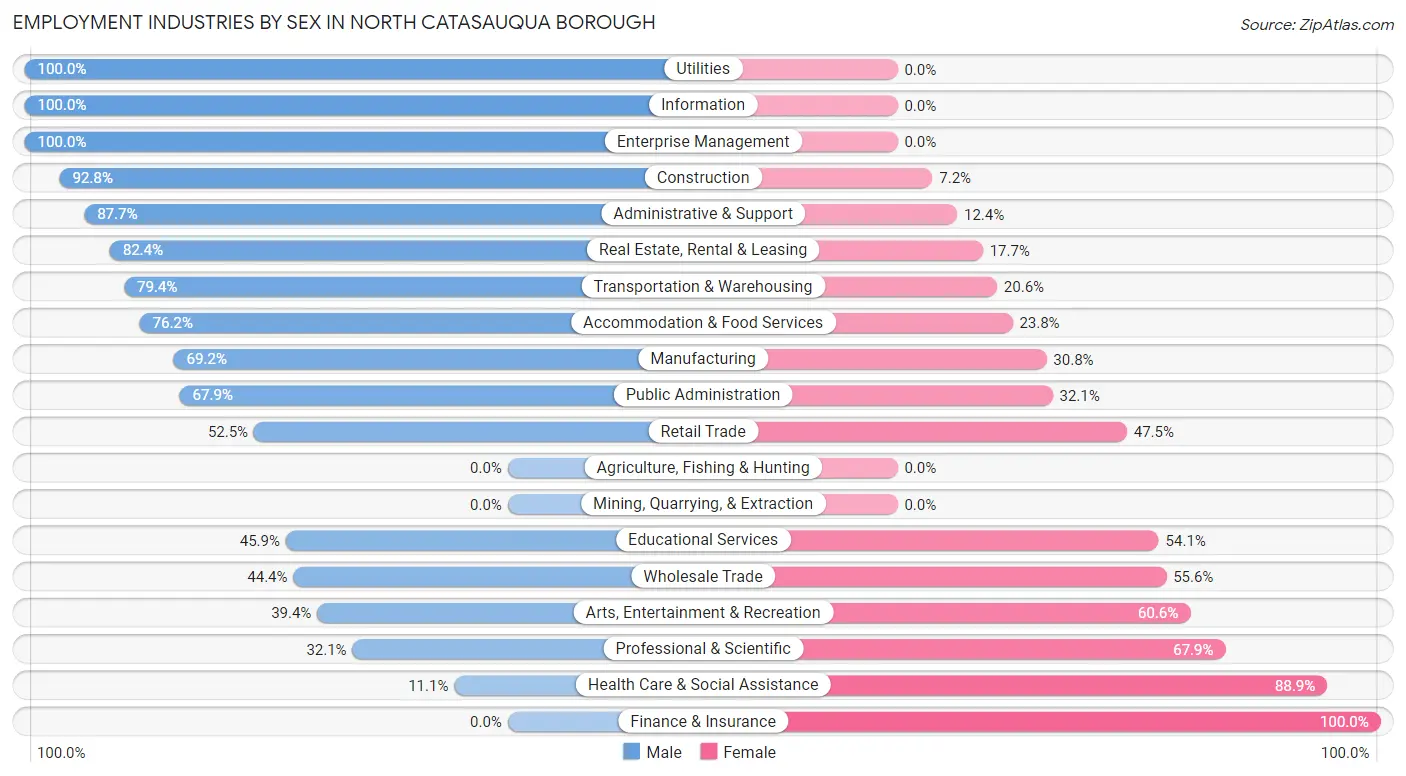
| Industry | Male | Female |
| Agriculture, Fishing & Hunting | 0 (0.0%) | 0 (0.0%) |
| Mining, Quarrying, & Extraction | 0 (0.0%) | 0 (0.0%) |
| Construction | 77 (92.8%) | 6 (7.2%) |
| Manufacturing | 213 (69.2%) | 95 (30.8%) |
| Wholesale Trade | 63 (44.4%) | 79 (55.6%) |
| Retail Trade | 83 (52.5%) | 75 (47.5%) |
| Transportation & Warehousing | 27 (79.4%) | 7 (20.6%) |
| Utilities | 13 (100.0%) | 0 (0.0%) |
| Information | 19 (100.0%) | 0 (0.0%) |
| Finance & Insurance | 0 (0.0%) | 63 (100.0%) |
| Real Estate, Rental & Leasing | 14 (82.4%) | 3 (17.6%) |
| Professional & Scientific | 27 (32.1%) | 57 (67.9%) |
| Enterprise Management | 5 (100.0%) | 0 (0.0%) |
| Administrative & Support | 71 (87.6%) | 10 (12.3%) |
| Educational Services | 62 (45.9%) | 73 (54.1%) |
| Health Care & Social Assistance | 27 (11.1%) | 217 (88.9%) |
| Arts, Entertainment & Recreation | 28 (39.4%) | 43 (60.6%) |
| Accommodation & Food Services | 48 (76.2%) | 15 (23.8%) |
| Public Administration | 55 (67.9%) | 26 (32.1%) |
| Total | 844 (50.8%) | 816 (49.2%) |
Education in North Catasauqua borough
School Enrollment in North Catasauqua borough
The most common levels of schooling among the 638 students in North Catasauqua borough are middle school (142 | 22.3%), high school (141 | 22.1%), and elementary school (138 | 21.6%).
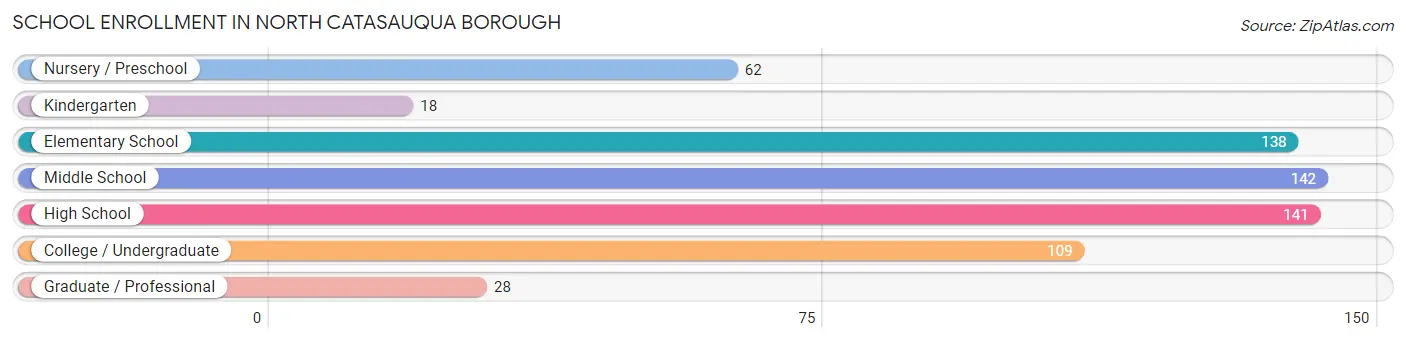
| School Level | # Students | % Students |
| Nursery / Preschool | 62 | 9.7% |
| Kindergarten | 18 | 2.8% |
| Elementary School | 138 | 21.6% |
| Middle School | 142 | 22.3% |
| High School | 141 | 22.1% |
| College / Undergraduate | 109 | 17.1% |
| Graduate / Professional | 28 | 4.4% |
| Total | 638 | 100.0% |
School Enrollment by Age by Funding Source in North Catasauqua borough
Out of a total of 638 students who are enrolled in schools in North Catasauqua borough, 113 (17.7%) attend a private institution, while the remaining 525 (82.3%) are enrolled in public schools. The age group of 20 to 24 year olds has the highest likelihood of being enrolled in private schools, with 33 (38.4% in the age bracket) enrolled. Conversely, the age group of 3 to 4 year olds has the lowest likelihood of being enrolled in a private school, with 50 (100.0% in the age bracket) attending a public institution.
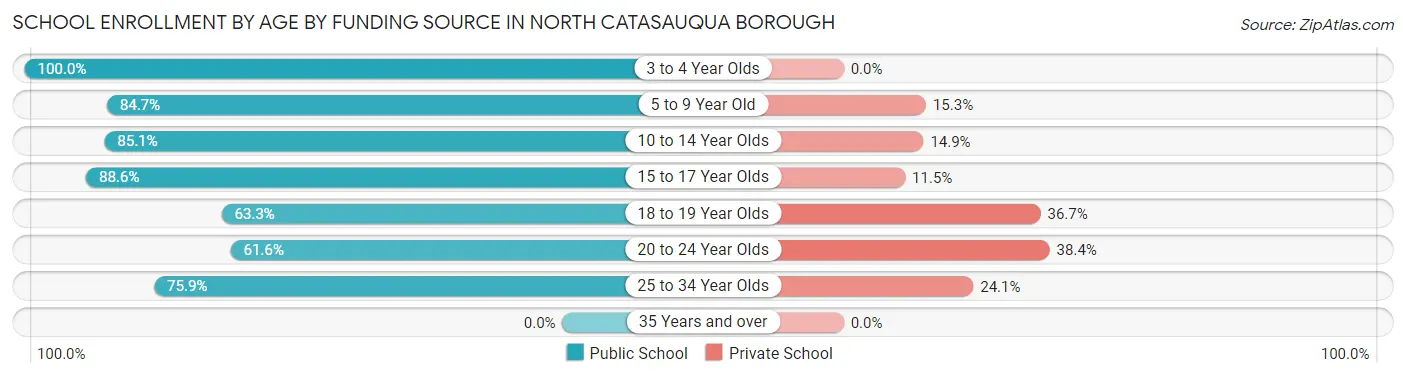
| Age Bracket | Public School | Private School |
| 3 to 4 Year Olds | 50 (100.0%) | 0 (0.0%) |
| 5 to 9 Year Old | 116 (84.7%) | 21 (15.3%) |
| 10 to 14 Year Olds | 149 (85.1%) | 26 (14.9%) |
| 15 to 17 Year Olds | 116 (88.5%) | 15 (11.5%) |
| 18 to 19 Year Olds | 19 (63.3%) | 11 (36.7%) |
| 20 to 24 Year Olds | 53 (61.6%) | 33 (38.4%) |
| 25 to 34 Year Olds | 22 (75.9%) | 7 (24.1%) |
| 35 Years and over | 0 (0.0%) | 0 (0.0%) |
| Total | 525 (82.3%) | 113 (17.7%) |
Educational Attainment by Field of Study in North Catasauqua borough
Arts & humanities (85 | 15.7%), psychology (76 | 14.0%), education (76 | 14.0%), business (61 | 11.2%), and bio, nature & agricultural (49 | 9.0%) are the most common fields of study among 543 individuals in North Catasauqua borough who have obtained a bachelor's degree or higher.
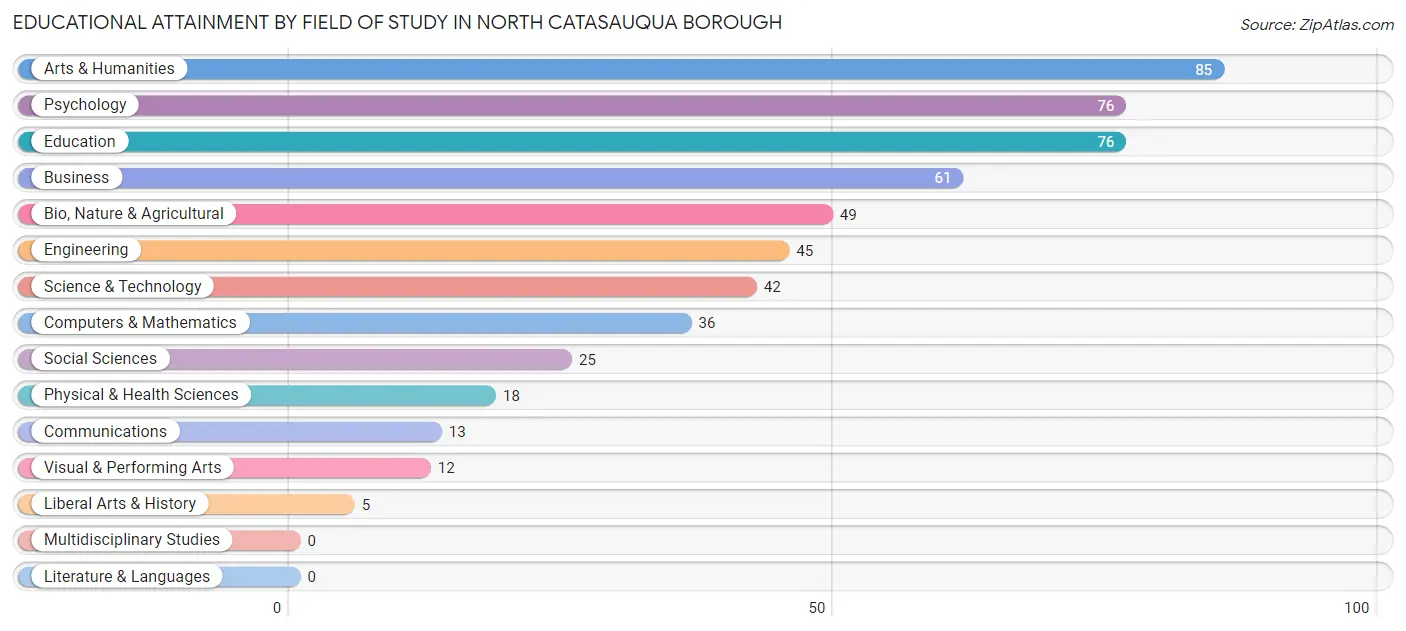
| Field of Study | # Graduates | % Graduates |
| Computers & Mathematics | 36 | 6.6% |
| Bio, Nature & Agricultural | 49 | 9.0% |
| Physical & Health Sciences | 18 | 3.3% |
| Psychology | 76 | 14.0% |
| Social Sciences | 25 | 4.6% |
| Engineering | 45 | 8.3% |
| Multidisciplinary Studies | 0 | 0.0% |
| Science & Technology | 42 | 7.7% |
| Business | 61 | 11.2% |
| Education | 76 | 14.0% |
| Literature & Languages | 0 | 0.0% |
| Liberal Arts & History | 5 | 0.9% |
| Visual & Performing Arts | 12 | 2.2% |
| Communications | 13 | 2.4% |
| Arts & Humanities | 85 | 15.7% |
| Total | 543 | 100.0% |
Transportation & Commute in North Catasauqua borough
Vehicle Availability by Sex in North Catasauqua borough
The most prevalent vehicle ownership categories in North Catasauqua borough are males with 2 vehicles (366, accounting for 41.7%) and females with 2 vehicles (299, making up 45.1%).
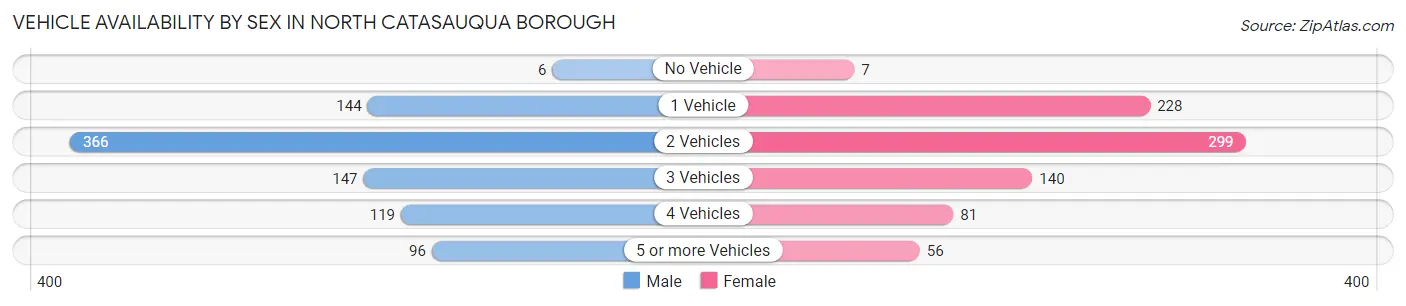
| Vehicles Available | Male | Female |
| No Vehicle | 6 (0.7%) | 7 (0.9%) |
| 1 Vehicle | 144 (16.4%) | 228 (28.1%) |
| 2 Vehicles | 366 (41.7%) | 299 (36.9%) |
| 3 Vehicles | 147 (16.7%) | 140 (17.3%) |
| 4 Vehicles | 119 (13.6%) | 81 (10.0%) |
| 5 or more Vehicles | 96 (10.9%) | 56 (6.9%) |
| Total | 878 (100.0%) | 811 (100.0%) |
Commute Time in North Catasauqua borough
The most frequently occuring commute durations in North Catasauqua borough are 20 to 24 minutes (363 commuters, 27.1%), 30 to 34 minutes (198 commuters, 14.7%), and 15 to 19 minutes (195 commuters, 14.5%).
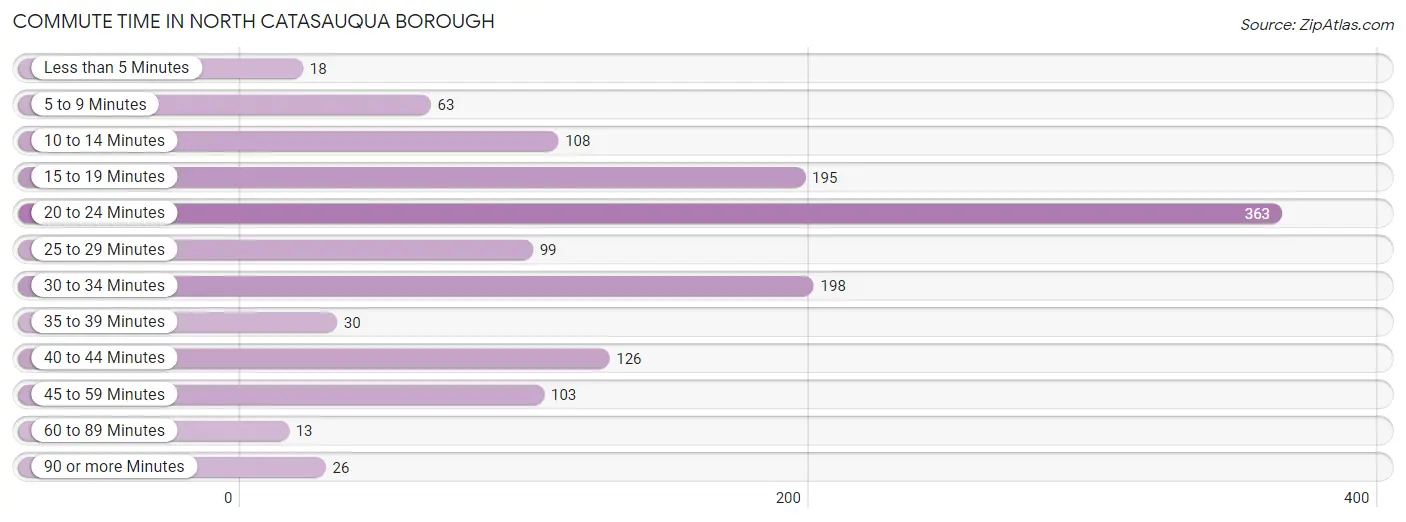
| Commute Time | # Commuters | % Commuters |
| Less than 5 Minutes | 18 | 1.3% |
| 5 to 9 Minutes | 63 | 4.7% |
| 10 to 14 Minutes | 108 | 8.1% |
| 15 to 19 Minutes | 195 | 14.5% |
| 20 to 24 Minutes | 363 | 27.1% |
| 25 to 29 Minutes | 99 | 7.4% |
| 30 to 34 Minutes | 198 | 14.7% |
| 35 to 39 Minutes | 30 | 2.2% |
| 40 to 44 Minutes | 126 | 9.4% |
| 45 to 59 Minutes | 103 | 7.7% |
| 60 to 89 Minutes | 13 | 1.0% |
| 90 or more Minutes | 26 | 1.9% |
Commute Time by Sex in North Catasauqua borough
The most common commute times in North Catasauqua borough are 20 to 24 minutes (204 commuters, 27.3%) for males and 20 to 24 minutes (159 commuters, 26.8%) for females.
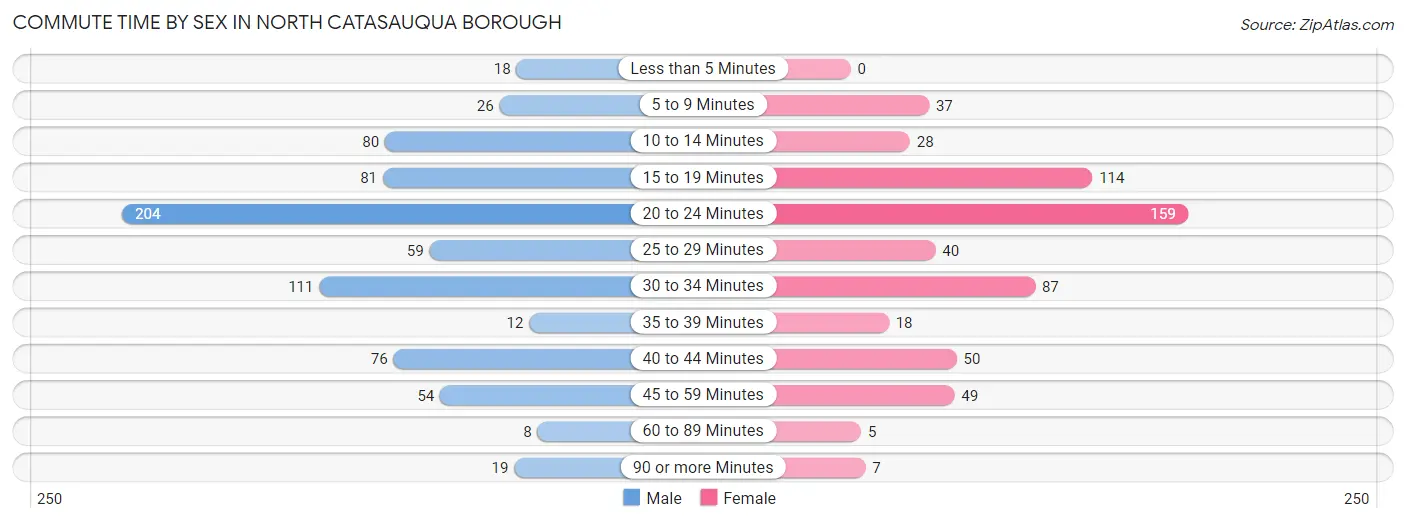
| Commute Time | Male | Female |
| Less than 5 Minutes | 18 (2.4%) | 0 (0.0%) |
| 5 to 9 Minutes | 26 (3.5%) | 37 (6.2%) |
| 10 to 14 Minutes | 80 (10.7%) | 28 (4.7%) |
| 15 to 19 Minutes | 81 (10.8%) | 114 (19.2%) |
| 20 to 24 Minutes | 204 (27.3%) | 159 (26.8%) |
| 25 to 29 Minutes | 59 (7.9%) | 40 (6.7%) |
| 30 to 34 Minutes | 111 (14.8%) | 87 (14.6%) |
| 35 to 39 Minutes | 12 (1.6%) | 18 (3.0%) |
| 40 to 44 Minutes | 76 (10.2%) | 50 (8.4%) |
| 45 to 59 Minutes | 54 (7.2%) | 49 (8.3%) |
| 60 to 89 Minutes | 8 (1.1%) | 5 (0.8%) |
| 90 or more Minutes | 19 (2.5%) | 7 (1.2%) |
Time of Departure to Work by Sex in North Catasauqua borough
The most frequent times of departure to work in North Catasauqua borough are 7:00 AM to 7:29 AM (107, 14.3%) for males and 7:00 AM to 7:29 AM (139, 23.4%) for females.
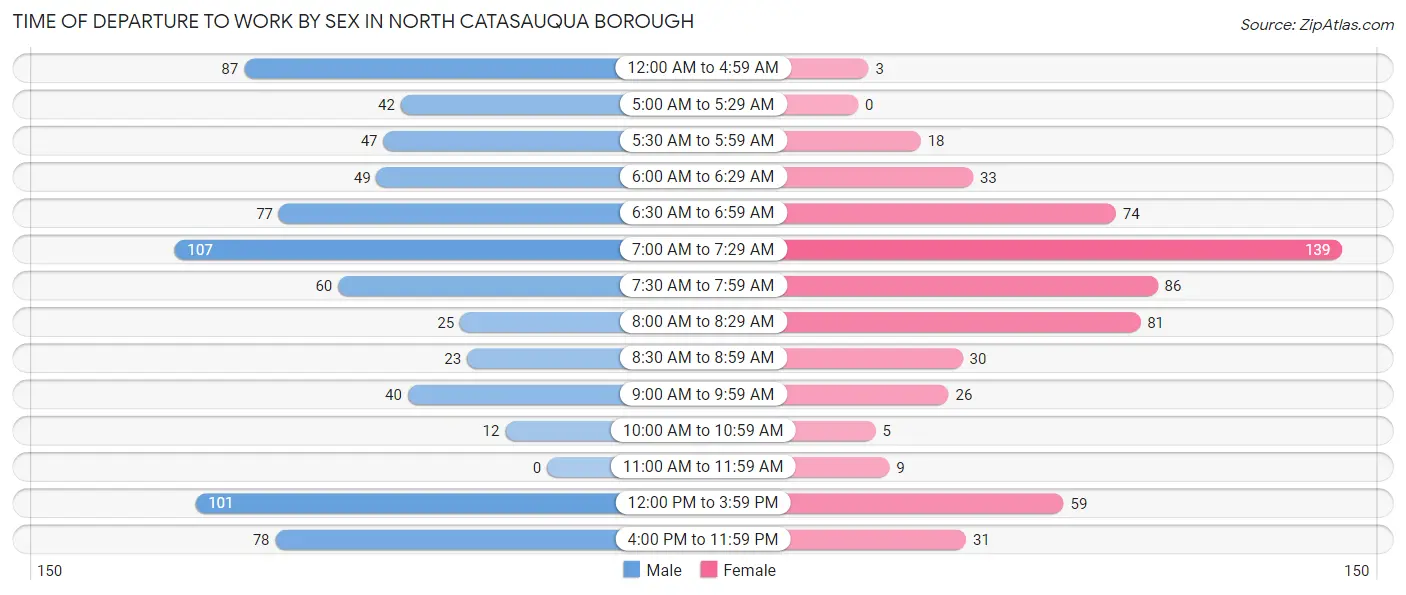
| Time of Departure | Male | Female |
| 12:00 AM to 4:59 AM | 87 (11.6%) | 3 (0.5%) |
| 5:00 AM to 5:29 AM | 42 (5.6%) | 0 (0.0%) |
| 5:30 AM to 5:59 AM | 47 (6.3%) | 18 (3.0%) |
| 6:00 AM to 6:29 AM | 49 (6.6%) | 33 (5.6%) |
| 6:30 AM to 6:59 AM | 77 (10.3%) | 74 (12.5%) |
| 7:00 AM to 7:29 AM | 107 (14.3%) | 139 (23.4%) |
| 7:30 AM to 7:59 AM | 60 (8.0%) | 86 (14.5%) |
| 8:00 AM to 8:29 AM | 25 (3.3%) | 81 (13.6%) |
| 8:30 AM to 8:59 AM | 23 (3.1%) | 30 (5.1%) |
| 9:00 AM to 9:59 AM | 40 (5.3%) | 26 (4.4%) |
| 10:00 AM to 10:59 AM | 12 (1.6%) | 5 (0.8%) |
| 11:00 AM to 11:59 AM | 0 (0.0%) | 9 (1.5%) |
| 12:00 PM to 3:59 PM | 101 (13.5%) | 59 (9.9%) |
| 4:00 PM to 11:59 PM | 78 (10.4%) | 31 (5.2%) |
| Total | 748 (100.0%) | 594 (100.0%) |
Housing Occupancy in North Catasauqua borough
Occupancy by Ownership in North Catasauqua borough
Of the total 1,184 dwellings in North Catasauqua borough, owner-occupied units account for 920 (77.7%), while renter-occupied units make up 264 (22.3%).
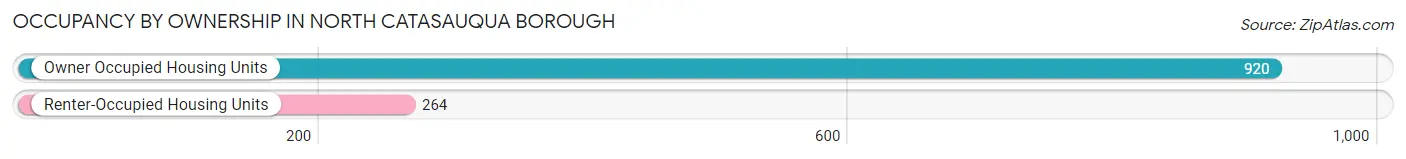
| Occupancy | # Housing Units | % Housing Units |
| Owner Occupied Housing Units | 920 | 77.7% |
| Renter-Occupied Housing Units | 264 | 22.3% |
| Total Occupied Housing Units | 1,184 | 100.0% |
Occupancy by Household Size in North Catasauqua borough
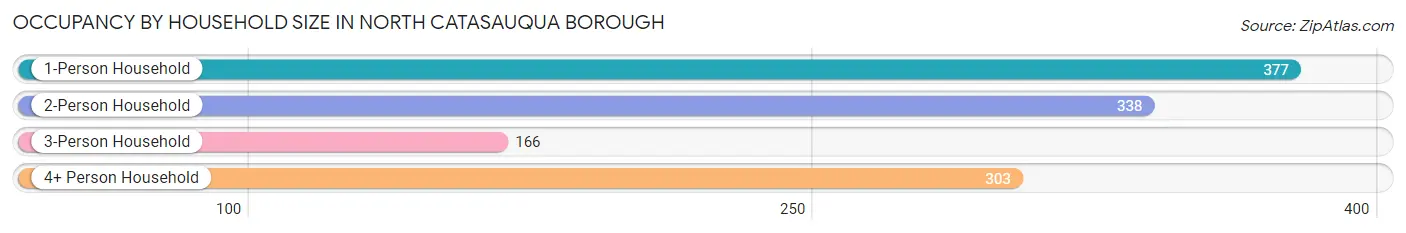
| Household Size | # Housing Units | % Housing Units |
| 1-Person Household | 377 | 31.8% |
| 2-Person Household | 338 | 28.5% |
| 3-Person Household | 166 | 14.0% |
| 4+ Person Household | 303 | 25.6% |
| Total Housing Units | 1,184 | 100.0% |
Occupancy by Ownership by Household Size in North Catasauqua borough
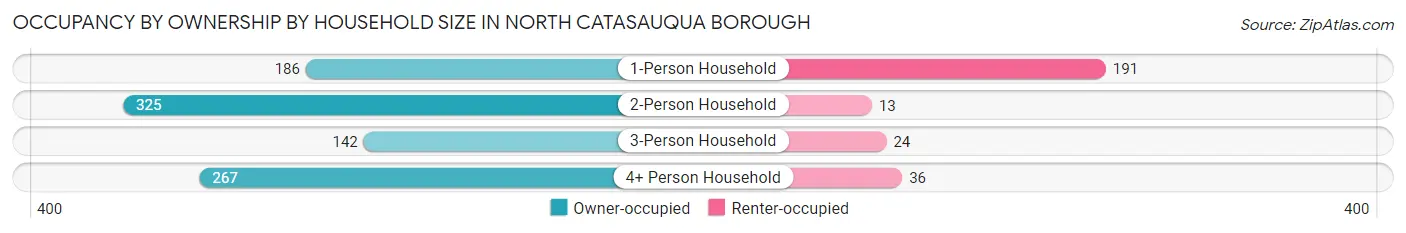
| Household Size | Owner-occupied | Renter-occupied |
| 1-Person Household | 186 (49.3%) | 191 (50.7%) |
| 2-Person Household | 325 (96.2%) | 13 (3.8%) |
| 3-Person Household | 142 (85.5%) | 24 (14.5%) |
| 4+ Person Household | 267 (88.1%) | 36 (11.9%) |
| Total Housing Units | 920 (77.7%) | 264 (22.3%) |
Occupancy by Educational Attainment in North Catasauqua borough
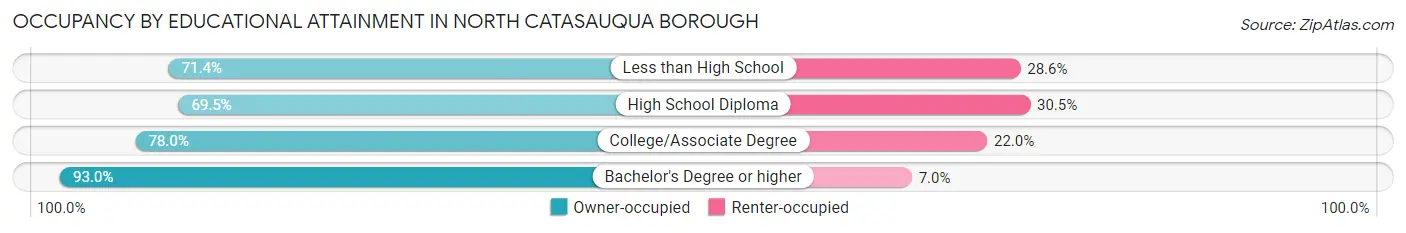
| Household Size | Owner-occupied | Renter-occupied |
| Less than High School | 20 (71.4%) | 8 (28.6%) |
| High School Diploma | 344 (69.5%) | 151 (30.5%) |
| College/Associate Degree | 305 (78.0%) | 86 (22.0%) |
| Bachelor's Degree or higher | 251 (93.0%) | 19 (7.0%) |
Occupancy by Age of Householder in North Catasauqua borough
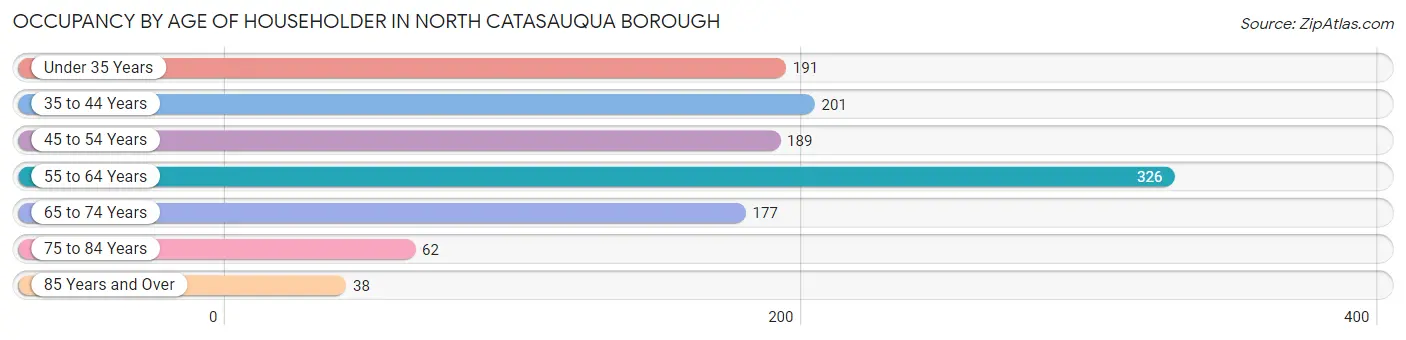
| Age Bracket | # Households | % Households |
| Under 35 Years | 191 | 16.1% |
| 35 to 44 Years | 201 | 17.0% |
| 45 to 54 Years | 189 | 16.0% |
| 55 to 64 Years | 326 | 27.5% |
| 65 to 74 Years | 177 | 14.9% |
| 75 to 84 Years | 62 | 5.2% |
| 85 Years and Over | 38 | 3.2% |
| Total | 1,184 | 100.0% |
Housing Finances in North Catasauqua borough
Median Income by Occupancy in North Catasauqua borough
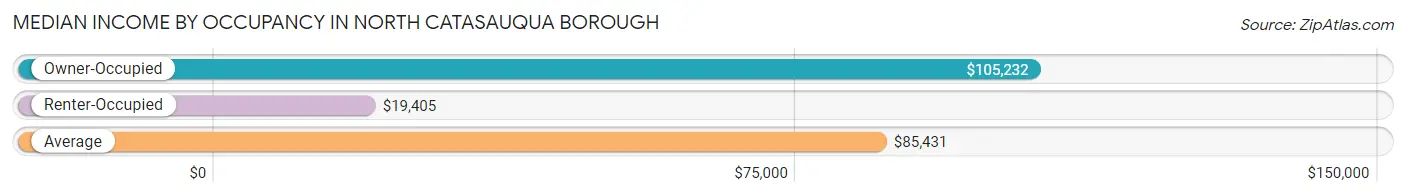
| Occupancy Type | # Households | Median Income |
| Owner-Occupied | 920 (77.7%) | $105,232 |
| Renter-Occupied | 264 (22.3%) | $19,405 |
| Average | 1,184 (100.0%) | $85,431 |
Occupancy by Householder Income Bracket in North Catasauqua borough
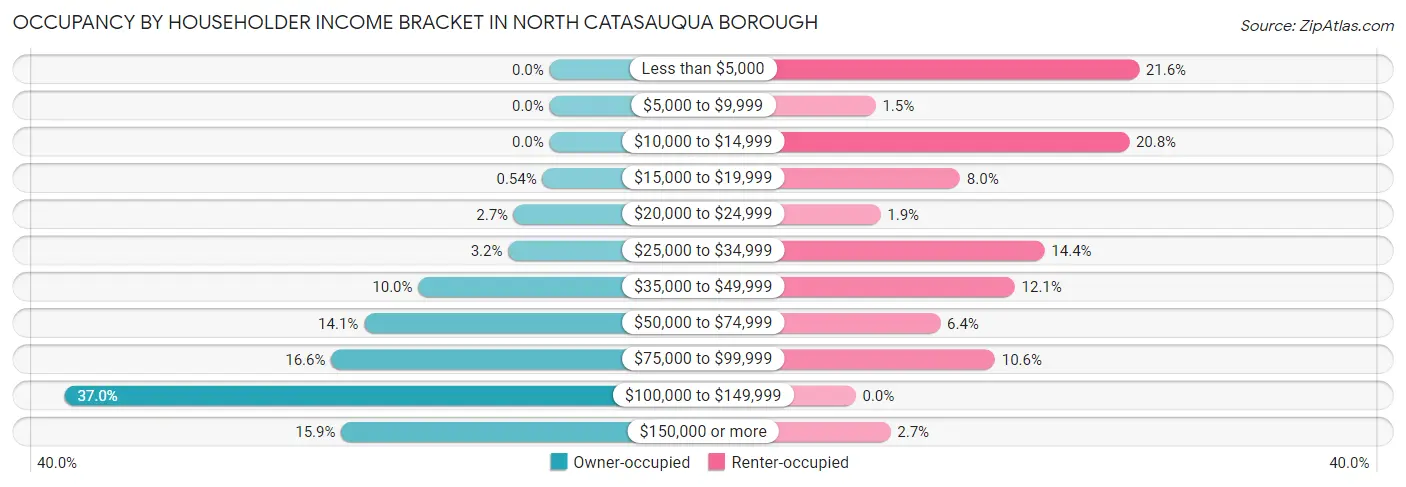
| Income Bracket | Owner-occupied | Renter-occupied |
| Less than $5,000 | 0 (0.0%) | 57 (21.6%) |
| $5,000 to $9,999 | 0 (0.0%) | 4 (1.5%) |
| $10,000 to $14,999 | 0 (0.0%) | 55 (20.8%) |
| $15,000 to $19,999 | 5 (0.5%) | 21 (8.0%) |
| $20,000 to $24,999 | 25 (2.7%) | 5 (1.9%) |
| $25,000 to $34,999 | 29 (3.2%) | 38 (14.4%) |
| $35,000 to $49,999 | 92 (10.0%) | 32 (12.1%) |
| $50,000 to $74,999 | 130 (14.1%) | 17 (6.4%) |
| $75,000 to $99,999 | 153 (16.6%) | 28 (10.6%) |
| $100,000 to $149,999 | 340 (37.0%) | 0 (0.0%) |
| $150,000 or more | 146 (15.9%) | 7 (2.6%) |
| Total | 920 (100.0%) | 264 (100.0%) |
Monthly Housing Cost Tiers in North Catasauqua borough
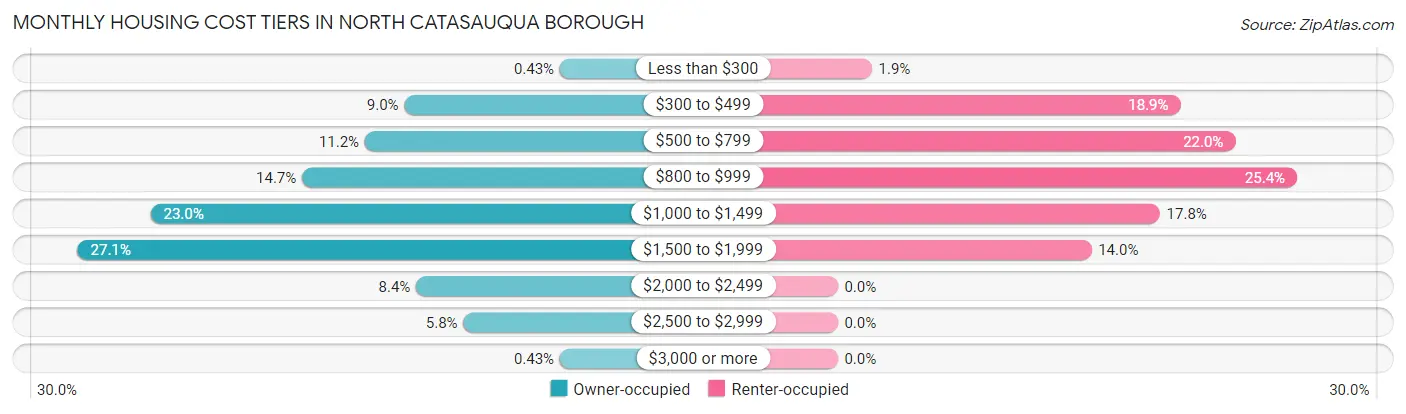
| Monthly Cost | Owner-occupied | Renter-occupied |
| Less than $300 | 4 (0.4%) | 5 (1.9%) |
| $300 to $499 | 83 (9.0%) | 50 (18.9%) |
| $500 to $799 | 103 (11.2%) | 58 (22.0%) |
| $800 to $999 | 135 (14.7%) | 67 (25.4%) |
| $1,000 to $1,499 | 212 (23.0%) | 47 (17.8%) |
| $1,500 to $1,999 | 249 (27.1%) | 37 (14.0%) |
| $2,000 to $2,499 | 77 (8.4%) | 0 (0.0%) |
| $2,500 to $2,999 | 53 (5.8%) | 0 (0.0%) |
| $3,000 or more | 4 (0.4%) | 0 (0.0%) |
| Total | 920 (100.0%) | 264 (100.0%) |
Physical Housing Characteristics in North Catasauqua borough
Housing Structures in North Catasauqua borough
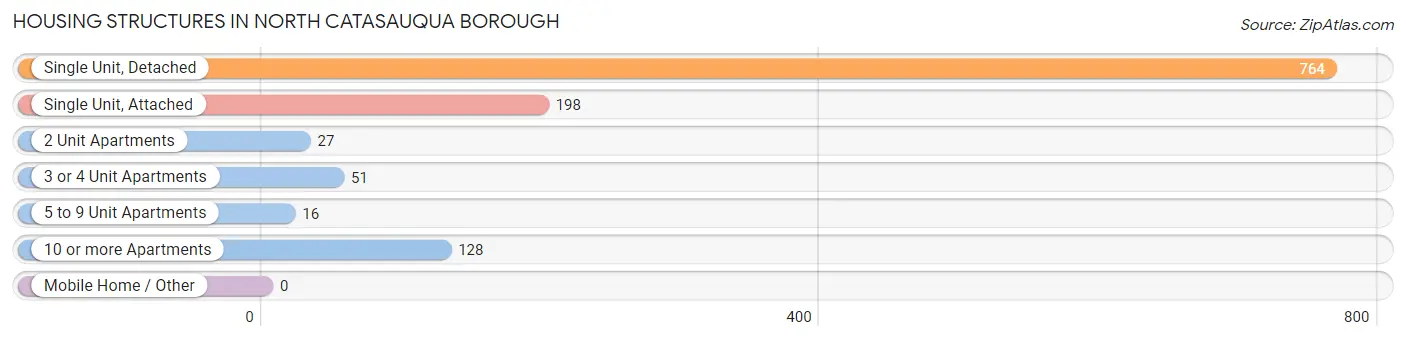
| Structure Type | # Housing Units | % Housing Units |
| Single Unit, Detached | 764 | 64.5% |
| Single Unit, Attached | 198 | 16.7% |
| 2 Unit Apartments | 27 | 2.3% |
| 3 or 4 Unit Apartments | 51 | 4.3% |
| 5 to 9 Unit Apartments | 16 | 1.3% |
| 10 or more Apartments | 128 | 10.8% |
| Mobile Home / Other | 0 | 0.0% |
| Total | 1,184 | 100.0% |
Housing Structures by Occupancy in North Catasauqua borough
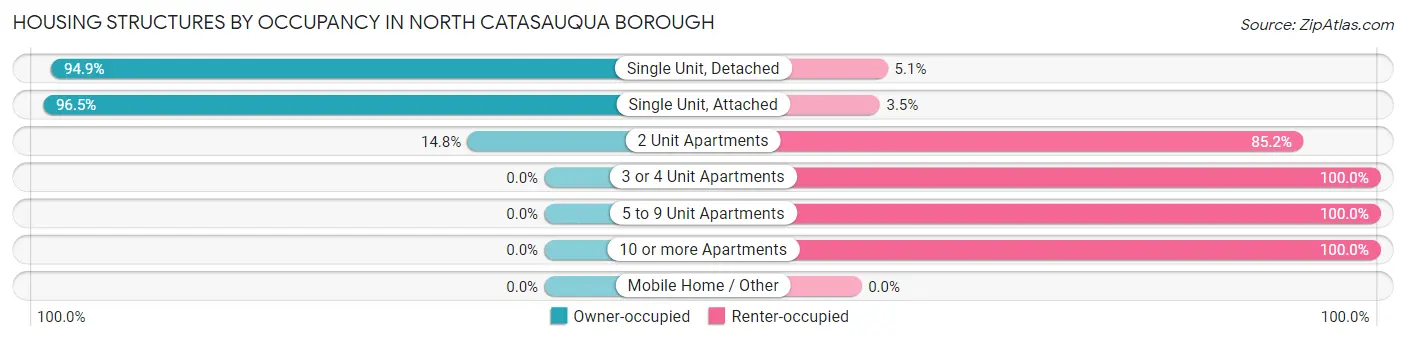
| Structure Type | Owner-occupied | Renter-occupied |
| Single Unit, Detached | 725 (94.9%) | 39 (5.1%) |
| Single Unit, Attached | 191 (96.5%) | 7 (3.5%) |
| 2 Unit Apartments | 4 (14.8%) | 23 (85.2%) |
| 3 or 4 Unit Apartments | 0 (0.0%) | 51 (100.0%) |
| 5 to 9 Unit Apartments | 0 (0.0%) | 16 (100.0%) |
| 10 or more Apartments | 0 (0.0%) | 128 (100.0%) |
| Mobile Home / Other | 0 (0.0%) | 0 (0.0%) |
| Total | 920 (77.7%) | 264 (22.3%) |
Housing Structures by Number of Rooms in North Catasauqua borough
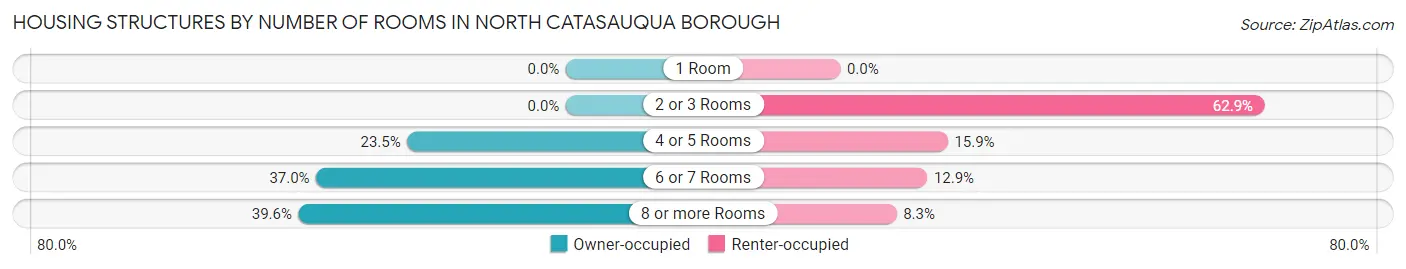
| Number of Rooms | Owner-occupied | Renter-occupied |
| 1 Room | 0 (0.0%) | 0 (0.0%) |
| 2 or 3 Rooms | 0 (0.0%) | 166 (62.9%) |
| 4 or 5 Rooms | 216 (23.5%) | 42 (15.9%) |
| 6 or 7 Rooms | 340 (37.0%) | 34 (12.9%) |
| 8 or more Rooms | 364 (39.6%) | 22 (8.3%) |
| Total | 920 (100.0%) | 264 (100.0%) |
Housing Structure by Heating Type in North Catasauqua borough
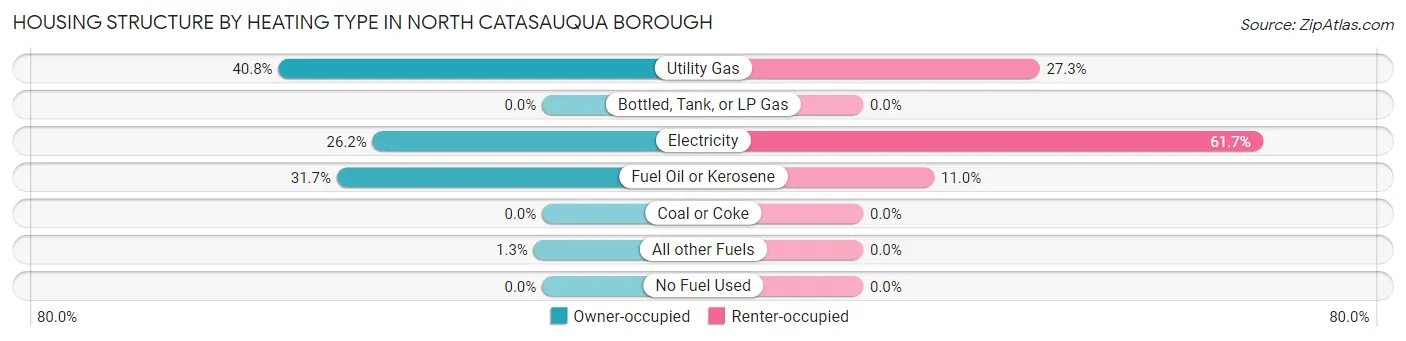
| Heating Type | Owner-occupied | Renter-occupied |
| Utility Gas | 375 (40.8%) | 72 (27.3%) |
| Bottled, Tank, or LP Gas | 0 (0.0%) | 0 (0.0%) |
| Electricity | 241 (26.2%) | 163 (61.7%) |
| Fuel Oil or Kerosene | 292 (31.7%) | 29 (11.0%) |
| Coal or Coke | 0 (0.0%) | 0 (0.0%) |
| All other Fuels | 12 (1.3%) | 0 (0.0%) |
| No Fuel Used | 0 (0.0%) | 0 (0.0%) |
| Total | 920 (100.0%) | 264 (100.0%) |
Household Vehicle Usage in North Catasauqua borough
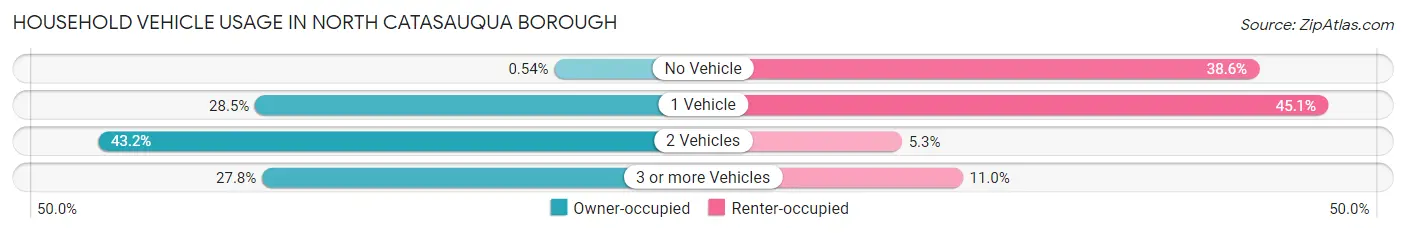
| Vehicles per Household | Owner-occupied | Renter-occupied |
| No Vehicle | 5 (0.5%) | 102 (38.6%) |
| 1 Vehicle | 262 (28.5%) | 119 (45.1%) |
| 2 Vehicles | 397 (43.1%) | 14 (5.3%) |
| 3 or more Vehicles | 256 (27.8%) | 29 (11.0%) |
| Total | 920 (100.0%) | 264 (100.0%) |
Real Estate & Mortgages in North Catasauqua borough
Real Estate and Mortgage Overview in North Catasauqua borough
| Characteristic | Without Mortgage | With Mortgage |
| Housing Units | 313 | 607 |
| Median Property Value | $207,300 | $221,600 |
| Median Household Income | $76,563 | $85 |
| Monthly Housing Costs | $738 | $4 |
| Real Estate Taxes | $3,611 | $18 |
Property Value by Mortgage Status in North Catasauqua borough
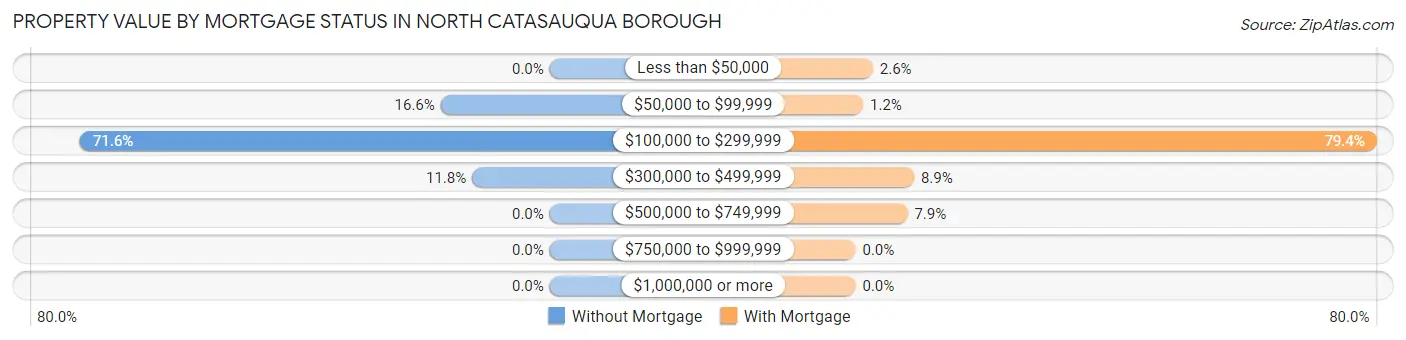
| Property Value | Without Mortgage | With Mortgage |
| Less than $50,000 | 0 (0.0%) | 16 (2.6%) |
| $50,000 to $99,999 | 52 (16.6%) | 7 (1.1%) |
| $100,000 to $299,999 | 224 (71.6%) | 482 (79.4%) |
| $300,000 to $499,999 | 37 (11.8%) | 54 (8.9%) |
| $500,000 to $749,999 | 0 (0.0%) | 48 (7.9%) |
| $750,000 to $999,999 | 0 (0.0%) | 0 (0.0%) |
| $1,000,000 or more | 0 (0.0%) | 0 (0.0%) |
| Total | 313 (100.0%) | 607 (100.0%) |
Household Income by Mortgage Status in North Catasauqua borough
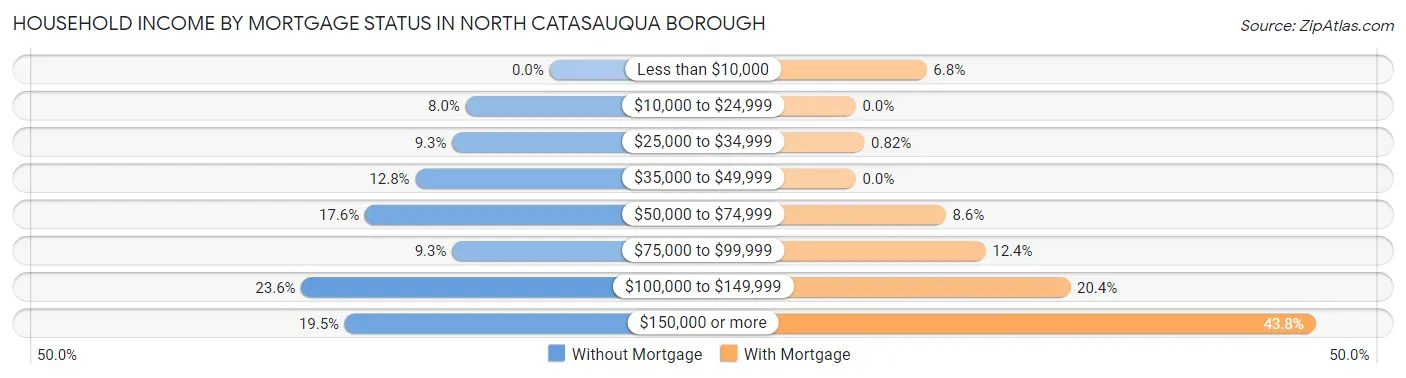
| Household Income | Without Mortgage | With Mortgage |
| Less than $10,000 | 0 (0.0%) | 41 (6.8%) |
| $10,000 to $24,999 | 25 (8.0%) | 0 (0.0%) |
| $25,000 to $34,999 | 29 (9.3%) | 5 (0.8%) |
| $35,000 to $49,999 | 40 (12.8%) | 0 (0.0%) |
| $50,000 to $74,999 | 55 (17.6%) | 52 (8.6%) |
| $75,000 to $99,999 | 29 (9.3%) | 75 (12.4%) |
| $100,000 to $149,999 | 74 (23.6%) | 124 (20.4%) |
| $150,000 or more | 61 (19.5%) | 266 (43.8%) |
| Total | 313 (100.0%) | 607 (100.0%) |
Property Value to Household Income Ratio in North Catasauqua borough
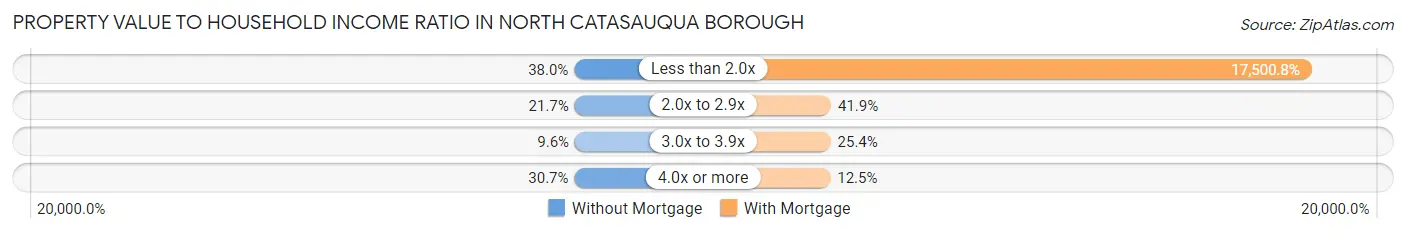
| Value-to-Income Ratio | Without Mortgage | With Mortgage |
| Less than 2.0x | 119 (38.0%) | 106,230 (17,500.8%) |
| 2.0x to 2.9x | 68 (21.7%) | 254 (41.8%) |
| 3.0x to 3.9x | 30 (9.6%) | 154 (25.4%) |
| 4.0x or more | 96 (30.7%) | 76 (12.5%) |
| Total | 313 (100.0%) | 607 (100.0%) |
Real Estate Taxes by Mortgage Status in North Catasauqua borough
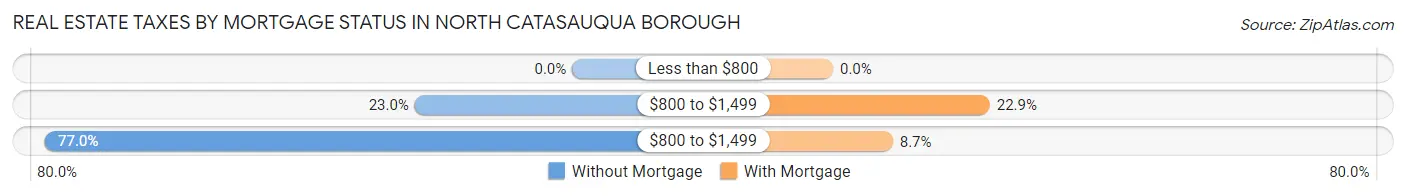
| Property Taxes | Without Mortgage | With Mortgage |
| Less than $800 | 0 (0.0%) | 0 (0.0%) |
| $800 to $1,499 | 72 (23.0%) | 139 (22.9%) |
| $800 to $1,499 | 241 (77.0%) | 53 (8.7%) |
| Total | 313 (100.0%) | 607 (100.0%) |
Health & Disability in North Catasauqua borough
Health Insurance Coverage by Age in North Catasauqua borough
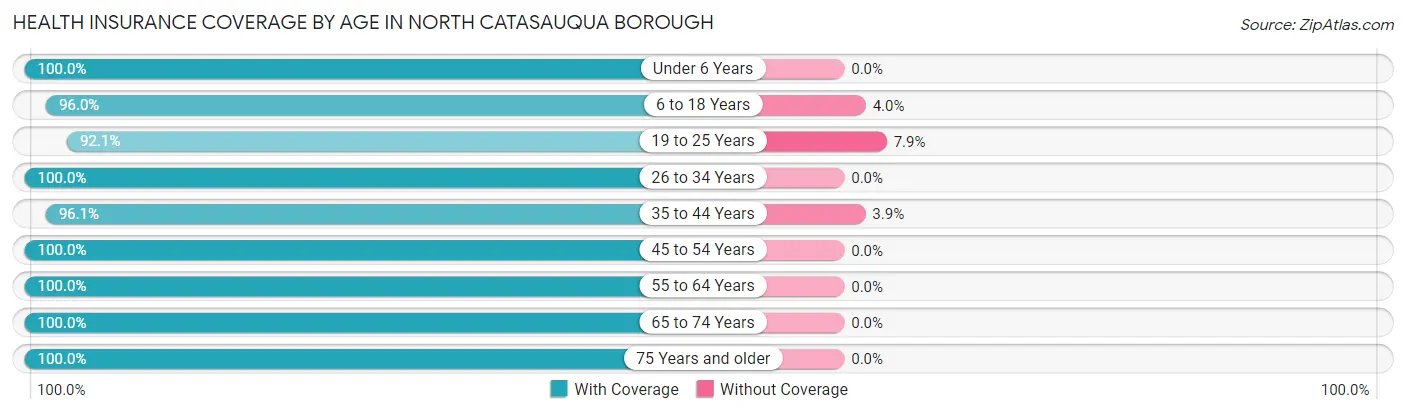
| Age Bracket | With Coverage | Without Coverage |
| Under 6 Years | 177 (100.0%) | 0 (0.0%) |
| 6 to 18 Years | 409 (96.0%) | 17 (4.0%) |
| 19 to 25 Years | 198 (92.1%) | 17 (7.9%) |
| 26 to 34 Years | 327 (100.0%) | 0 (0.0%) |
| 35 to 44 Years | 415 (96.1%) | 17 (3.9%) |
| 45 to 54 Years | 406 (100.0%) | 0 (0.0%) |
| 55 to 64 Years | 454 (100.0%) | 0 (0.0%) |
| 65 to 74 Years | 283 (100.0%) | 0 (0.0%) |
| 75 Years and older | 188 (100.0%) | 0 (0.0%) |
| Total | 2,857 (98.3%) | 51 (1.8%) |
Health Insurance Coverage by Citizenship Status in North Catasauqua borough
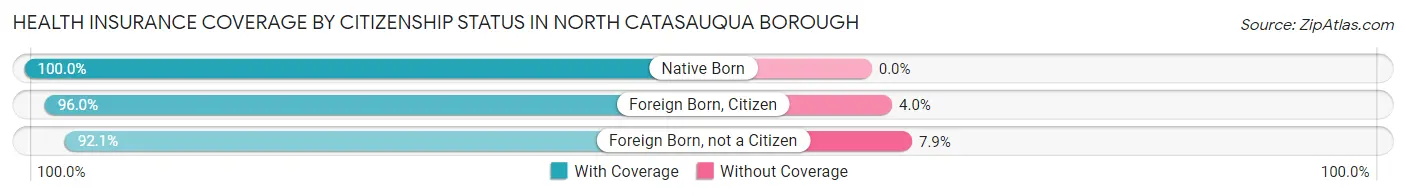
| Citizenship Status | With Coverage | Without Coverage |
| Native Born | 177 (100.0%) | 0 (0.0%) |
| Foreign Born, Citizen | 409 (96.0%) | 17 (4.0%) |
| Foreign Born, not a Citizen | 198 (92.1%) | 17 (7.9%) |
Health Insurance Coverage by Household Income in North Catasauqua borough
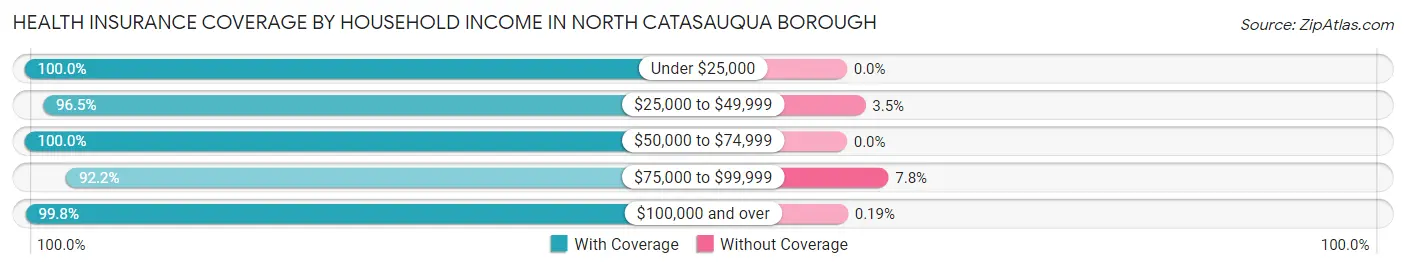
| Household Income | With Coverage | Without Coverage |
| Under $25,000 | 197 (100.0%) | 0 (0.0%) |
| $25,000 to $49,999 | 390 (96.5%) | 14 (3.5%) |
| $50,000 to $74,999 | 262 (100.0%) | 0 (0.0%) |
| $75,000 to $99,999 | 403 (92.2%) | 34 (7.8%) |
| $100,000 and over | 1,605 (99.8%) | 3 (0.2%) |
Public vs Private Health Insurance Coverage by Age in North Catasauqua borough
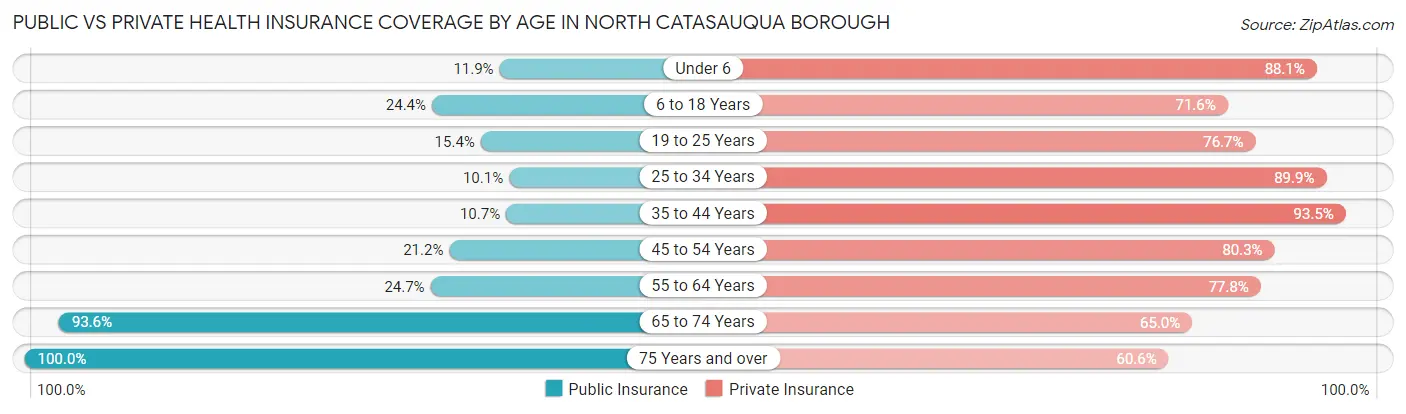
| Age Bracket | Public Insurance | Private Insurance |
| Under 6 | 21 (11.9%) | 156 (88.1%) |
| 6 to 18 Years | 104 (24.4%) | 305 (71.6%) |
| 19 to 25 Years | 33 (15.3%) | 165 (76.7%) |
| 25 to 34 Years | 33 (10.1%) | 294 (89.9%) |
| 35 to 44 Years | 46 (10.6%) | 404 (93.5%) |
| 45 to 54 Years | 86 (21.2%) | 326 (80.3%) |
| 55 to 64 Years | 112 (24.7%) | 353 (77.7%) |
| 65 to 74 Years | 265 (93.6%) | 184 (65.0%) |
| 75 Years and over | 188 (100.0%) | 114 (60.6%) |
| Total | 888 (30.5%) | 2,301 (79.1%) |
Disability Status by Sex by Age in North Catasauqua borough
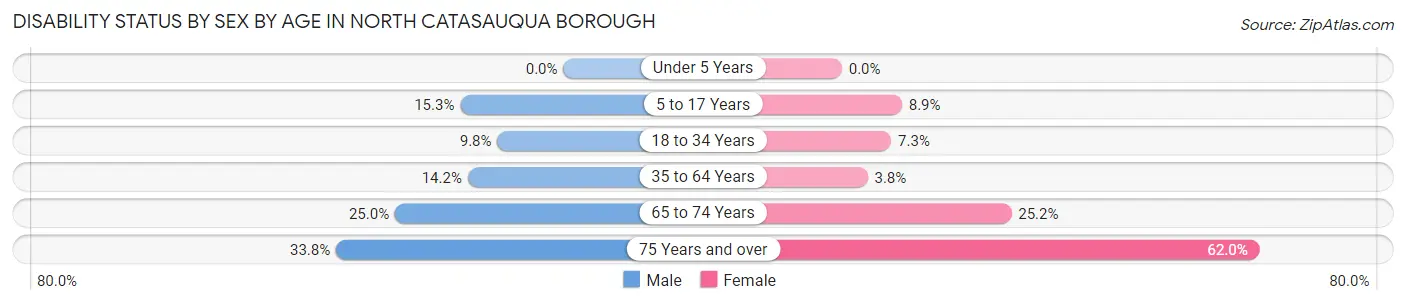
| Age Bracket | Male | Female |
| Under 5 Years | 0 (0.0%) | 0 (0.0%) |
| 5 to 17 Years | 30 (15.3%) | 23 (8.9%) |
| 18 to 34 Years | 25 (9.8%) | 22 (7.3%) |
| 35 to 64 Years | 98 (14.2%) | 23 (3.8%) |
| 65 to 74 Years | 34 (25.0%) | 37 (25.2%) |
| 75 Years and over | 27 (33.8%) | 67 (62.0%) |
Disability Class by Sex by Age in North Catasauqua borough
Disability Class: Hearing Difficulty
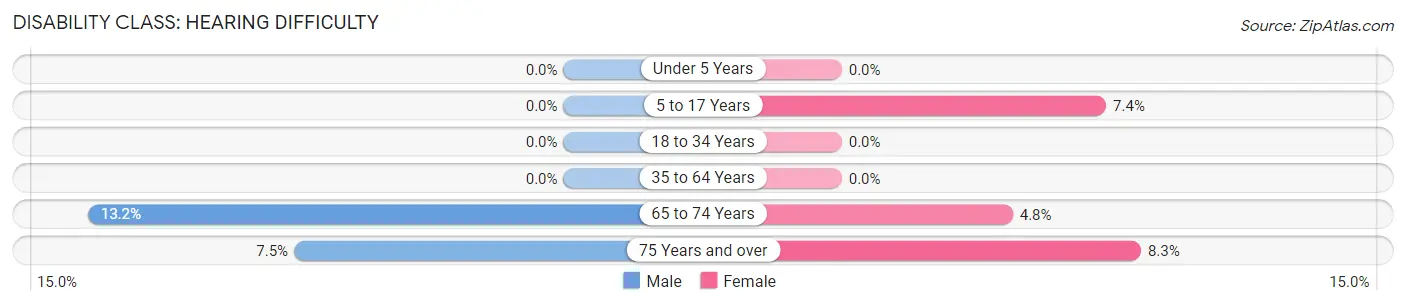
| Age Bracket | Male | Female |
| Under 5 Years | 0 (0.0%) | 0 (0.0%) |
| 5 to 17 Years | 0 (0.0%) | 19 (7.4%) |
| 18 to 34 Years | 0 (0.0%) | 0 (0.0%) |
| 35 to 64 Years | 0 (0.0%) | 0 (0.0%) |
| 65 to 74 Years | 18 (13.2%) | 7 (4.8%) |
| 75 Years and over | 6 (7.5%) | 9 (8.3%) |
Disability Class: Vision Difficulty
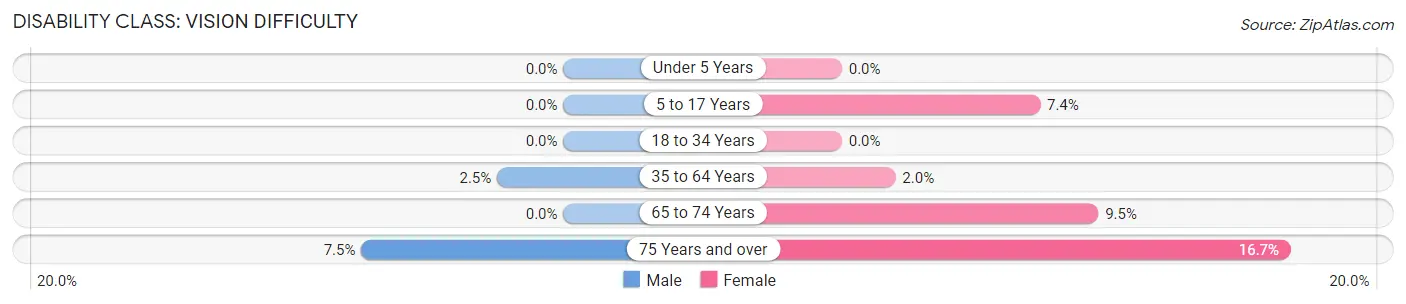
| Age Bracket | Male | Female |
| Under 5 Years | 0 (0.0%) | 0 (0.0%) |
| 5 to 17 Years | 0 (0.0%) | 19 (7.4%) |
| 18 to 34 Years | 0 (0.0%) | 0 (0.0%) |
| 35 to 64 Years | 17 (2.5%) | 12 (2.0%) |
| 65 to 74 Years | 0 (0.0%) | 14 (9.5%) |
| 75 Years and over | 6 (7.5%) | 18 (16.7%) |
Disability Class: Cognitive Difficulty
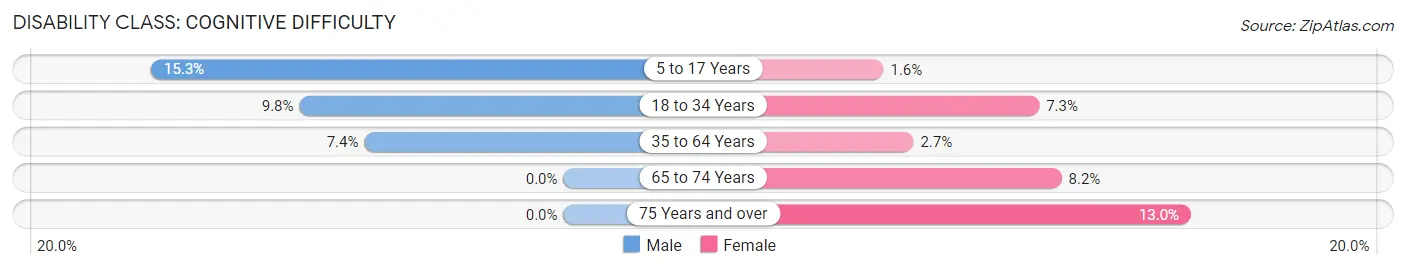
| Age Bracket | Male | Female |
| 5 to 17 Years | 30 (15.3%) | 4 (1.5%) |
| 18 to 34 Years | 25 (9.8%) | 22 (7.3%) |
| 35 to 64 Years | 51 (7.4%) | 16 (2.7%) |
| 65 to 74 Years | 0 (0.0%) | 12 (8.2%) |
| 75 Years and over | 0 (0.0%) | 14 (13.0%) |
Disability Class: Ambulatory Difficulty
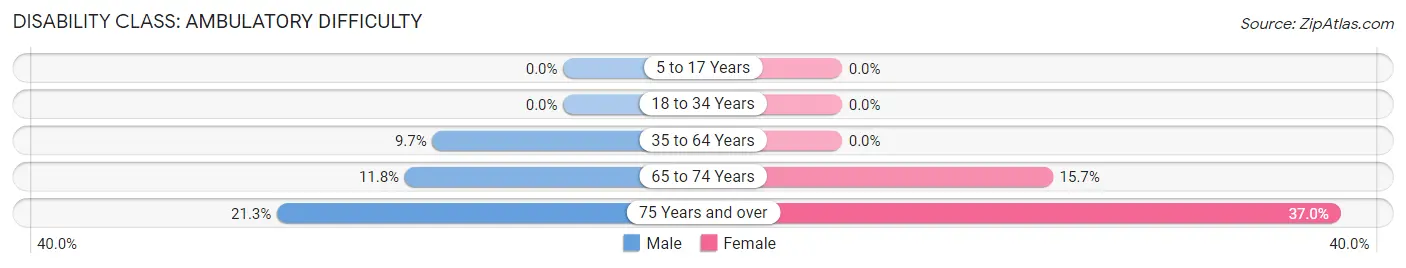
| Age Bracket | Male | Female |
| 5 to 17 Years | 0 (0.0%) | 0 (0.0%) |
| 18 to 34 Years | 0 (0.0%) | 0 (0.0%) |
| 35 to 64 Years | 67 (9.7%) | 0 (0.0%) |
| 65 to 74 Years | 16 (11.8%) | 23 (15.7%) |
| 75 Years and over | 17 (21.2%) | 40 (37.0%) |
Disability Class: Self-Care Difficulty
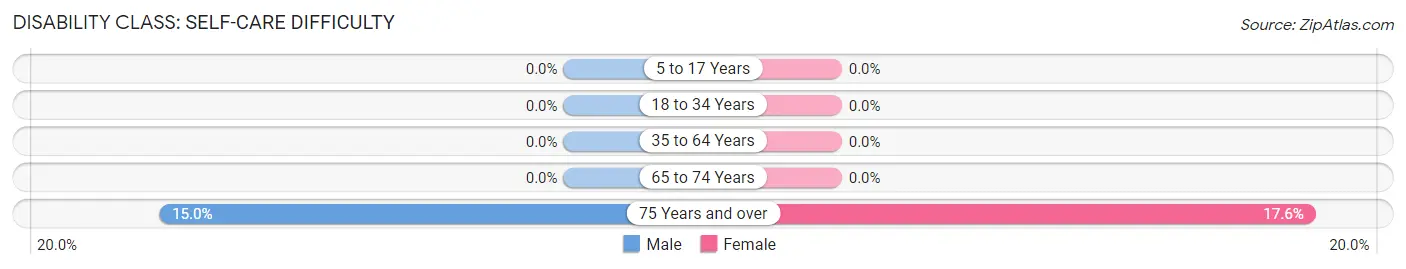
| Age Bracket | Male | Female |
| 5 to 17 Years | 0 (0.0%) | 0 (0.0%) |
| 18 to 34 Years | 0 (0.0%) | 0 (0.0%) |
| 35 to 64 Years | 0 (0.0%) | 0 (0.0%) |
| 65 to 74 Years | 0 (0.0%) | 0 (0.0%) |
| 75 Years and over | 12 (15.0%) | 19 (17.6%) |
Technology Access in North Catasauqua borough
Computing Device Access in North Catasauqua borough
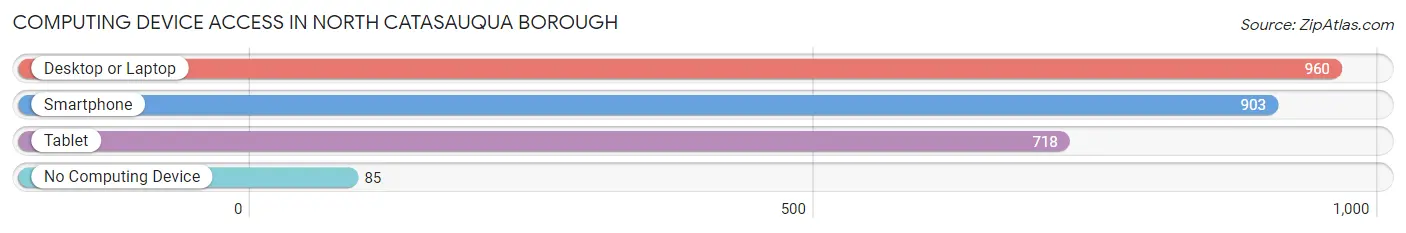
| Device Type | # Households | % Households |
| Desktop or Laptop | 960 | 81.1% |
| Smartphone | 903 | 76.3% |
| Tablet | 718 | 60.6% |
| No Computing Device | 85 | 7.2% |
| Total | 1,184 | 100.0% |
Internet Access in North Catasauqua borough
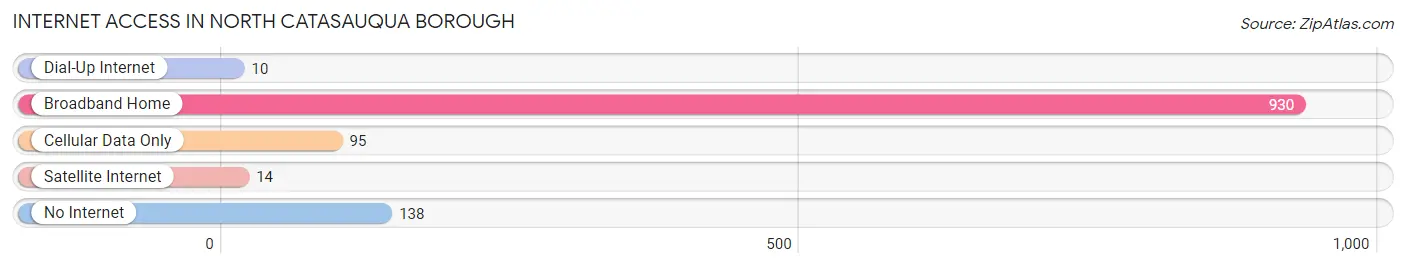
| Internet Type | # Households | % Households |
| Dial-Up Internet | 10 | 0.8% |
| Broadband Home | 930 | 78.5% |
| Cellular Data Only | 95 | 8.0% |
| Satellite Internet | 14 | 1.2% |
| No Internet | 138 | 11.7% |
| Total | 1,184 | 100.0% |
North Catasauqua borough Summary
Catasauqua Borough, Pennsylvania is a small borough located in Lehigh County, Pennsylvania. It is located just north of Allentown, the county seat of Lehigh County. The borough is part of the Lehigh Valley region and is part of the Allentown-Bethlehem-Easton metropolitan area. The population of Catasauqua Borough was 6,588 at the 2010 census.
History
Catasauqua Borough was founded in 1853 by the Catasauqua and Fogelsville Railroad Company. The name of the borough is derived from the Native American word “Kittochtinny”, which means “where the streams meet”. The borough was originally a small farming community, but it quickly grew into an industrial center due to its proximity to the Lehigh Canal and the Lehigh Valley Railroad. The borough was incorporated in 1867.
The borough was home to several large industries, including the Catasauqua Iron Works, which was founded in 1855 and was the largest iron works in the United States at the time. The iron works produced a variety of products, including railroad cars, bridges, and boilers. The Catasauqua Manufacturing Company was also located in the borough and produced a variety of products, including textiles, paper, and leather goods.
The borough was also home to several other industries, including the Catasauqua Shoe Company, the Catasauqua Pottery Company, and the Catasauqua Brewing Company. The borough was also home to several churches, including the First Presbyterian Church, the First Methodist Church, and the St. Paul’s Lutheran Church.
Geography
Catasauqua Borough is located in Lehigh County, Pennsylvania. It is located just north of Allentown, the county seat of Lehigh County. The borough is part of the Lehigh Valley region and is part of the Allentown-Bethlehem-Easton metropolitan area. The borough is located in the Lehigh Valley region of Pennsylvania, which is located in the southeastern part of the state.
The borough is located in the Lehigh Valley region of Pennsylvania, which is located in the southeastern part of the state. The borough is located in the Lehigh Valley region of Pennsylvania, which is located in the southeastern part of the state. The borough is located in the Lehigh Valley region of Pennsylvania, which is located in the southeastern part of the state.
The borough is located in the Lehigh Valley region of Pennsylvania, which is located in the southeastern part of the state. The borough is located in the Lehigh Valley region of Pennsylvania, which is located in the southeastern part of the state. The borough is located in the Lehigh Valley region of Pennsylvania, which is located in the southeastern part of the state.
The borough is located in the Lehigh Valley region of Pennsylvania, which is located in the southeastern part of the state. The borough is located in the Lehigh Valley region of Pennsylvania, which is located in the southeastern part of the state. The borough is located in the Lehigh Valley region of Pennsylvania, which is located in the southeastern part of the state.
The borough is located in the Lehigh Valley region of Pennsylvania, which is located in the southeastern part of the state. The borough is located in the Lehigh Valley region of Pennsylvania, which is located in the southeastern part of the state. The borough is located in the Lehigh Valley region of Pennsylvania, which is located in the southeastern part of the state.
The borough is located in the Lehigh Valley region of Pennsylvania, which is located in the southeastern part of the state. The borough is located in the Lehigh Valley region of Pennsylvania, which is located in the southeastern part of the state. The borough is located in the Lehigh Valley region of Pennsylvania, which is located in the southeastern part of the state.
Economy
Catasauqua Borough is a small borough with a population of 6,588 at the 2010 census. The borough is home to several small businesses, including restaurants, retail stores, and professional services. The borough is also home to several industrial businesses, including the Catasauqua Iron Works, the Catasauqua Manufacturing Company, and the Catasauqua Shoe Company.
The borough is also home to several educational institutions, including the Catasauqua Area School District, which serves the borough and the surrounding area. The borough is also home to several parks, including the Catasauqua Park and the Catasauqua Playground.
Demographics
As of the 2010 census, the population of Catasauqua Borough was 6,588. The racial makeup of the borough was 94.3% White, 1.3% African American, 0.2% Native American, 0.7% Asian, 0.1% Pacific Islander, 1.2% from other races, and 2.3% from two or more races. Hispanic or Latino of any race were 4.2% of the population.
The median income for a household in the borough was $45,938, and the median income for a family was $54,938. The per capita income for the borough was $21,938. About 8.2% of families and 10.2% of the population were below the poverty line, including 14.2% of those under age 18 and 6.2% of those age 65 or over.
Conclusion
Catasauqua Borough, Pennsylvania is a small borough located in Lehigh County, Pennsylvania. It is located just north of Allentown, the county seat of Lehigh County. The borough was founded in 1853 and was originally a small farming community. It quickly grew into an industrial center due to its proximity to the Lehigh Canal and the Lehigh Valley Railroad. The borough is home to several small businesses, industrial businesses, educational institutions, and parks. The population of Catasauqua Borough was 6,588 at the 2010 census. The median income for a household in the borough was $45,938, and the median income for a family was $54,938. About 8.2% of families and 10.2% of the population were below the poverty line.
Common Questions
What is Per Capita Income in North Catasauqua borough?
Per Capita income in North Catasauqua borough is $37,425.
What is the Median Family Income in North Catasauqua borough?
Median Family Income in North Catasauqua borough is $106,198.
What is the Median Household income in North Catasauqua borough?
Median Household Income in North Catasauqua borough is $85,431.
What is Income or Wage Gap in North Catasauqua borough?
Income or Wage Gap in North Catasauqua borough is 6.1%.
Women in North Catasauqua borough earn 93.9 cents for every dollar earned by a man.
What is Inequality or Gini Index in North Catasauqua borough?
Inequality or Gini Index in North Catasauqua borough is 0.39.
What is the Total Population of North Catasauqua borough?
Total Population of North Catasauqua borough is 2,956.
What is the Total Male Population of North Catasauqua borough?
Total Male Population of North Catasauqua borough is 1,479.
What is the Total Female Population of North Catasauqua borough?
Total Female Population of North Catasauqua borough is 1,477.
What is the Ratio of Males per 100 Females in North Catasauqua borough?
There are 100.14 Males per 100 Females in North Catasauqua borough.
What is the Ratio of Females per 100 Males in North Catasauqua borough?
There are 99.86 Females per 100 Males in North Catasauqua borough.
What is the Median Population Age in North Catasauqua borough?
Median Population Age in North Catasauqua borough is 43.3 Years.
What is the Average Family Size in North Catasauqua borough
Average Family Size in North Catasauqua borough is 3.1 People.
What is the Average Household Size in North Catasauqua borough
Average Household Size in North Catasauqua borough is 2.5 People.
How Large is the Labor Force in North Catasauqua borough?
There are 1,761 People in the Labor Forcein in North Catasauqua borough.
What is the Percentage of People in the Labor Force in North Catasauqua borough?
71.5% of People are in the Labor Force in North Catasauqua borough.
What is the Unemployment Rate in North Catasauqua borough?
Unemployment Rate in North Catasauqua borough is 3.1%.