West Wyomissing, PA Map & Demographics
West Wyomissing Map
West Wyomissing Overview
$31,390
PER CAPITA INCOME
$77,051
AVG FAMILY INCOME
$70,500
AVG HOUSEHOLD INCOME
0.6%
WAGE / INCOME GAP [ % ]
99.4¢/ $1
WAGE / INCOME GAP [ $ ]
0.42
INEQUALITY / GINI INDEX
3,267
TOTAL POPULATION
1,580
MALE POPULATION
1,687
FEMALE POPULATION
93.66
MALES / 100 FEMALES
106.77
FEMALES / 100 MALES
45.3
MEDIAN AGE
2.9
AVG FAMILY SIZE
2.3
AVG HOUSEHOLD SIZE
1,697
LABOR FORCE [ PEOPLE ]
62.9%
PERCENT IN LABOR FORCE
1.2%
UNEMPLOYMENT RATE
Income in West Wyomissing
Income Overview in West Wyomissing
Per Capita Income in West Wyomissing is $31,390, while median incomes of families and households are $77,051 and $70,500 respectively.
| Characteristic | Number | Measure |
| Per Capita Income | 3,267 | $31,390 |
| Median Family Income | 915 | $77,051 |
| Mean Family Income | 915 | $87,985 |
| Median Household Income | 1,394 | $70,500 |
| Mean Household Income | 1,394 | $73,855 |
| Income Deficit | 915 | $0 |
| Wage / Income Gap (%) | 3,267 | 0.62% |
| Wage / Income Gap ($) | 3,267 | 99.38¢ per $1 |
| Gini / Inequality Index | 3,267 | 0.42 |
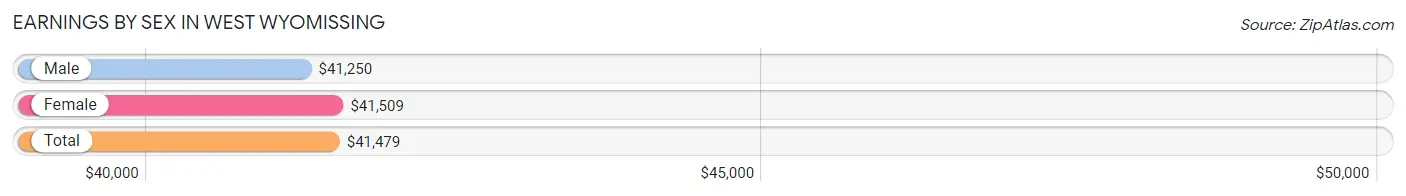
Earnings by Sex in West Wyomissing
Average Earnings in West Wyomissing are $41,479, $41,250 for men and $41,509 for women, a difference of 0.6%.
| Sex | Number | Average Earnings |
| Male | 870 (49.9%) | $41,250 |
| Female | 872 (50.1%) | $41,509 |
| Total | 1,742 (100.0%) | $41,479 |
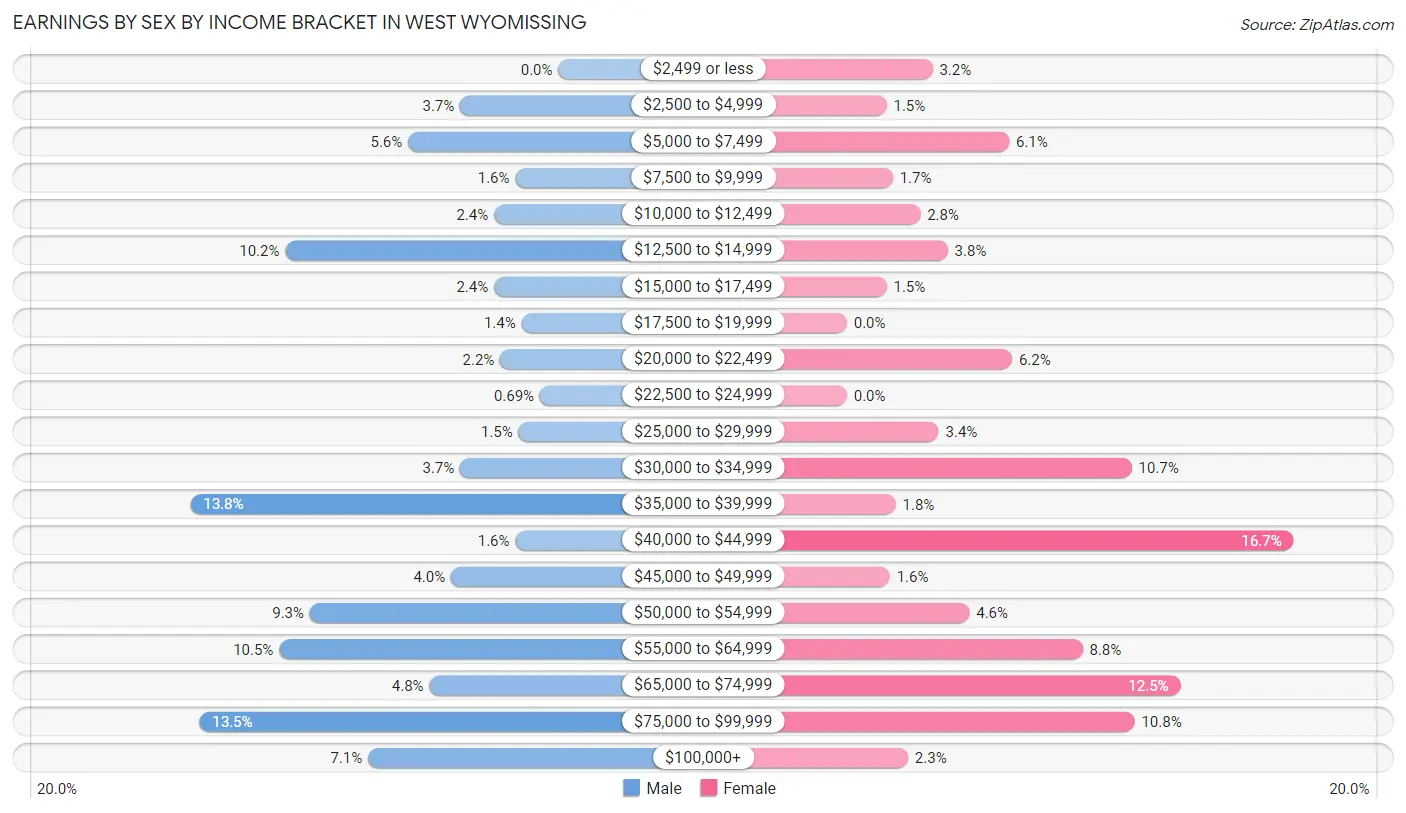
Earnings by Sex by Income Bracket in West Wyomissing
The most common earnings brackets in West Wyomissing are $35,000 to $39,999 for men (120 | 13.8%) and $40,000 to $44,999 for women (146 | 16.7%).
| Income | Male | Female |
| $2,499 or less | 0 (0.0%) | 28 (3.2%) |
| $2,500 to $4,999 | 32 (3.7%) | 13 (1.5%) |
| $5,000 to $7,499 | 49 (5.6%) | 53 (6.1%) |
| $7,500 to $9,999 | 14 (1.6%) | 15 (1.7%) |
| $10,000 to $12,499 | 21 (2.4%) | 24 (2.8%) |
| $12,500 to $14,999 | 89 (10.2%) | 33 (3.8%) |
| $15,000 to $17,499 | 21 (2.4%) | 13 (1.5%) |
| $17,500 to $19,999 | 12 (1.4%) | 0 (0.0%) |
| $20,000 to $22,499 | 19 (2.2%) | 54 (6.2%) |
| $22,500 to $24,999 | 6 (0.7%) | 0 (0.0%) |
| $25,000 to $29,999 | 13 (1.5%) | 30 (3.4%) |
| $30,000 to $34,999 | 32 (3.7%) | 93 (10.7%) |
| $35,000 to $39,999 | 120 (13.8%) | 16 (1.8%) |
| $40,000 to $44,999 | 14 (1.6%) | 146 (16.7%) |
| $45,000 to $49,999 | 35 (4.0%) | 14 (1.6%) |
| $50,000 to $54,999 | 81 (9.3%) | 40 (4.6%) |
| $55,000 to $64,999 | 91 (10.5%) | 77 (8.8%) |
| $65,000 to $74,999 | 42 (4.8%) | 109 (12.5%) |
| $75,000 to $99,999 | 117 (13.5%) | 94 (10.8%) |
| $100,000+ | 62 (7.1%) | 20 (2.3%) |
| Total | 870 (100.0%) | 872 (100.0%) |
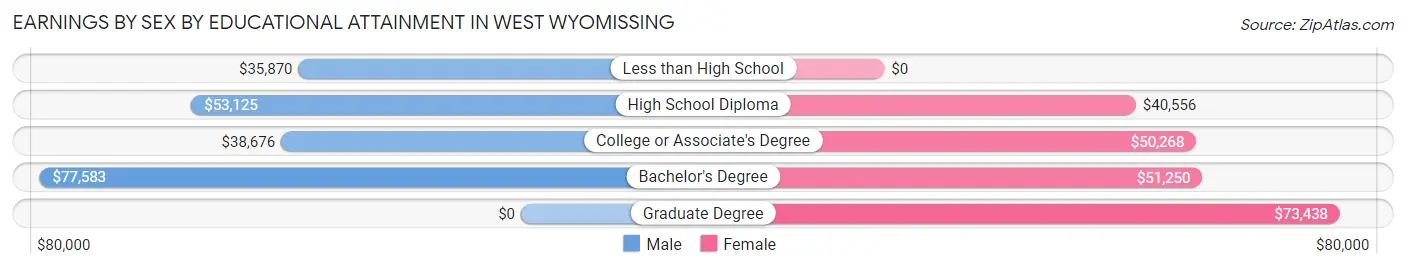
Earnings by Sex by Educational Attainment in West Wyomissing
Average earnings in West Wyomissing are $50,833 for men and $45,268 for women, a difference of 11.0%. Men with an educational attainment of bachelor's degree enjoy the highest average annual earnings of $77,583, while those with less than high school education earn the least with $35,870. Women with an educational attainment of graduate degree earn the most with the average annual earnings of $73,438, while those with high school diploma education have the smallest earnings of $40,556.
| Educational Attainment | Male Income | Female Income |
| Less than High School | $35,870 | $0 |
| High School Diploma | $53,125 | $40,556 |
| College or Associate's Degree | $38,676 | $50,268 |
| Bachelor's Degree | $77,583 | $51,250 |
| Graduate Degree | - | - |
| Total | $50,833 | $45,268 |
Family Income in West Wyomissing
Family Income Brackets in West Wyomissing
According to the West Wyomissing family income data, there are 221 families falling into the $100,000 to $149,999 income range, which is the most common income bracket and makes up 24.1% of all families.
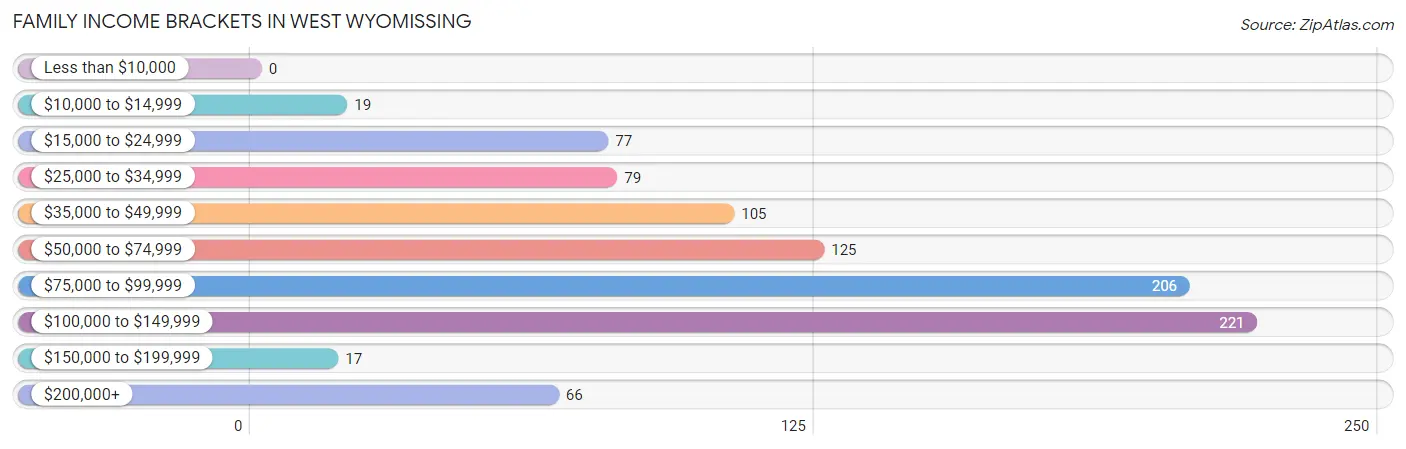
| Income Bracket | # Families | % Families |
| Less than $10,000 | 0 | 0.0% |
| $10,000 to $14,999 | 19 | 2.1% |
| $15,000 to $24,999 | 77 | 8.4% |
| $25,000 to $34,999 | 79 | 8.6% |
| $35,000 to $49,999 | 105 | 11.5% |
| $50,000 to $74,999 | 125 | 13.7% |
| $75,000 to $99,999 | 206 | 22.5% |
| $100,000 to $149,999 | 221 | 24.2% |
| $150,000 to $199,999 | 17 | 1.9% |
| $200,000+ | 66 | 7.2% |
Family Income by Famaliy Size in West Wyomissing
4-person families (120 | 13.1%) account for the highest median family income in West Wyomissing with $145,417 per family, while 4-person families (120 | 13.1%) have the highest median income of $36,354 per family member.
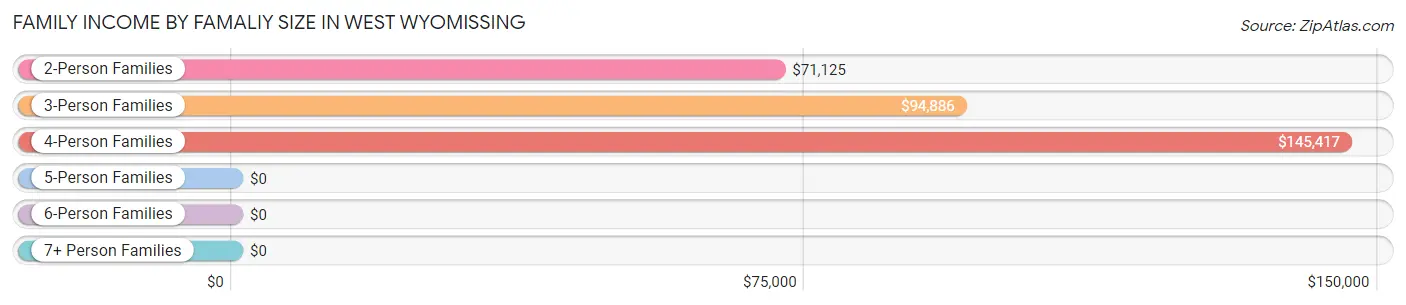
| Income Bracket | # Families | Median Income |
| 2-Person Families | 501 (54.7%) | $71,125 |
| 3-Person Families | 211 (23.1%) | $94,886 |
| 4-Person Families | 120 (13.1%) | $145,417 |
| 5-Person Families | 62 (6.8%) | $0 |
| 6-Person Families | 21 (2.3%) | $0 |
| 7+ Person Families | 0 (0.0%) | $0 |
| Total | 915 (100.0%) | $77,051 |
Family Income by Number of Earners in West Wyomissing
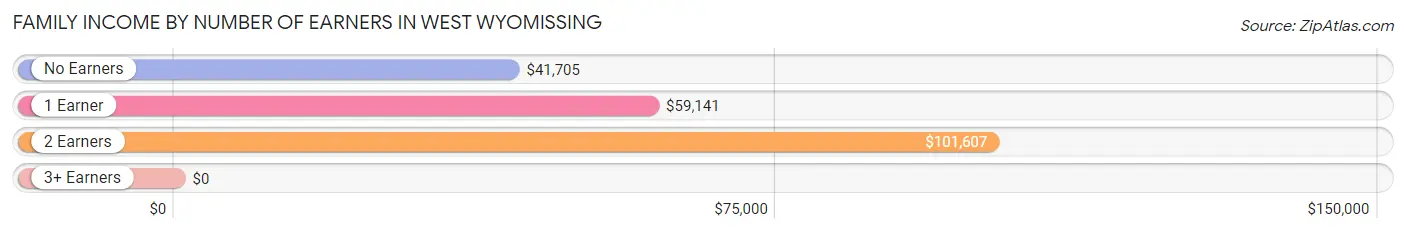
| Number of Earners | # Families | Median Income |
| No Earners | 171 (18.7%) | $41,705 |
| 1 Earner | 301 (32.9%) | $59,141 |
| 2 Earners | 348 (38.0%) | $101,607 |
| 3+ Earners | 95 (10.4%) | $0 |
| Total | 915 (100.0%) | $77,051 |
Household Income in West Wyomissing
Household Income Brackets in West Wyomissing
With 293 households falling in the category, the $75,000 to $99,999 income range is the most frequent in West Wyomissing, accounting for 21.0% of all households. In contrast, only 20 households (1.4%) fall into the $10,000 to $14,999 income bracket, making it the least populous group.
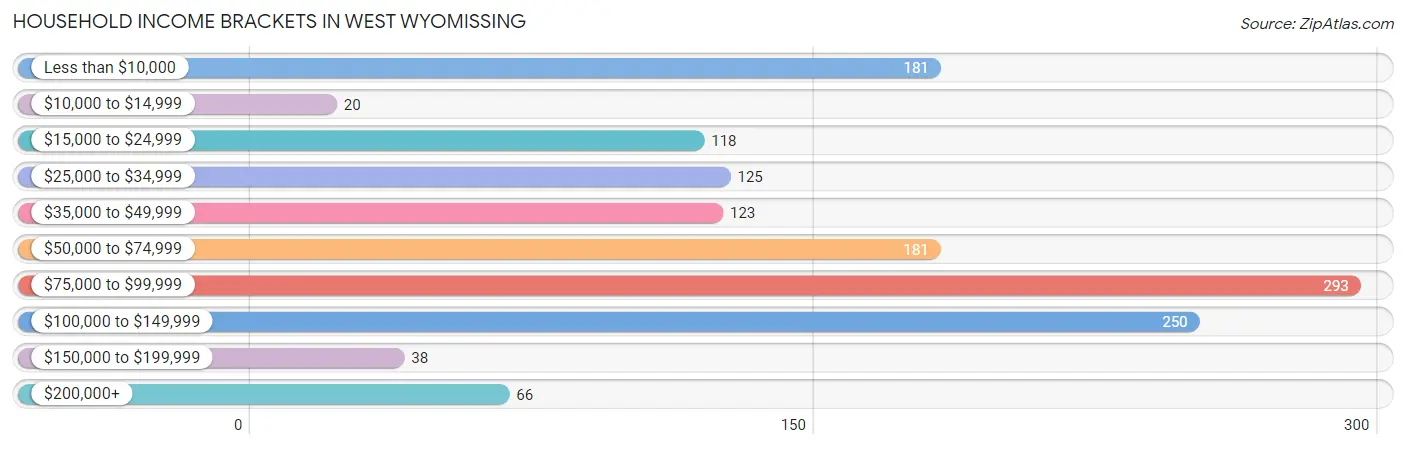
| Income Bracket | # Households | % Households |
| Less than $10,000 | 181 | 13.0% |
| $10,000 to $14,999 | 20 | 1.4% |
| $15,000 to $24,999 | 118 | 8.5% |
| $25,000 to $34,999 | 125 | 9.0% |
| $35,000 to $49,999 | 123 | 8.8% |
| $50,000 to $74,999 | 181 | 13.0% |
| $75,000 to $99,999 | 293 | 21.0% |
| $100,000 to $149,999 | 250 | 17.9% |
| $150,000 to $199,999 | 38 | 2.7% |
| $200,000+ | 66 | 4.7% |
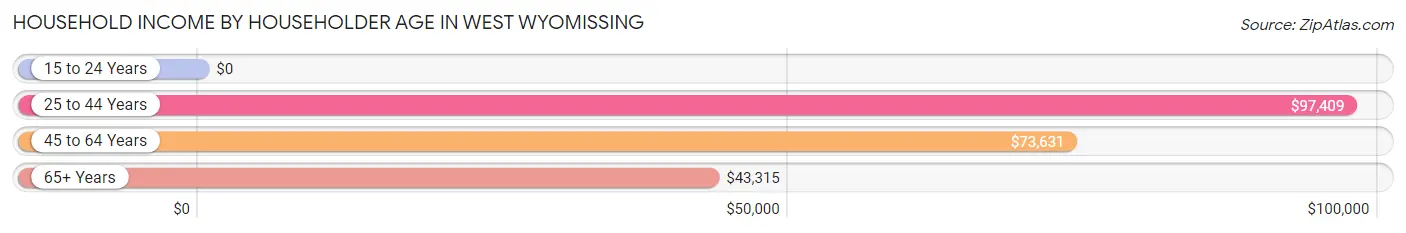
Household Income by Householder Age in West Wyomissing
The median household income in West Wyomissing is $70,500, with the highest median household income of $97,409 found in the 25 to 44 years age bracket for the primary householder. A total of 332 households (23.8%) fall into this category. Meanwhile, the 15 to 24 years age bracket for the primary householder has the lowest median household income of $0, with 51 households (3.7%) in this group.
| Income Bracket | # Households | Median Income |
| 15 to 24 Years | 51 (3.7%) | $0 |
| 25 to 44 Years | 332 (23.8%) | $97,409 |
| 45 to 64 Years | 524 (37.6%) | $73,631 |
| 65+ Years | 487 (34.9%) | $43,315 |
| Total | 1,394 (100.0%) | $70,500 |
Poverty in West Wyomissing
Income Below Poverty by Sex and Age in West Wyomissing
With 5.1% poverty level for males and 15.1% for females among the residents of West Wyomissing, 18 to 24 year old males and 5 year old females are the most vulnerable to poverty, with 36 males (25.9%) and 37 females (66.1%) in their respective age groups living below the poverty level.
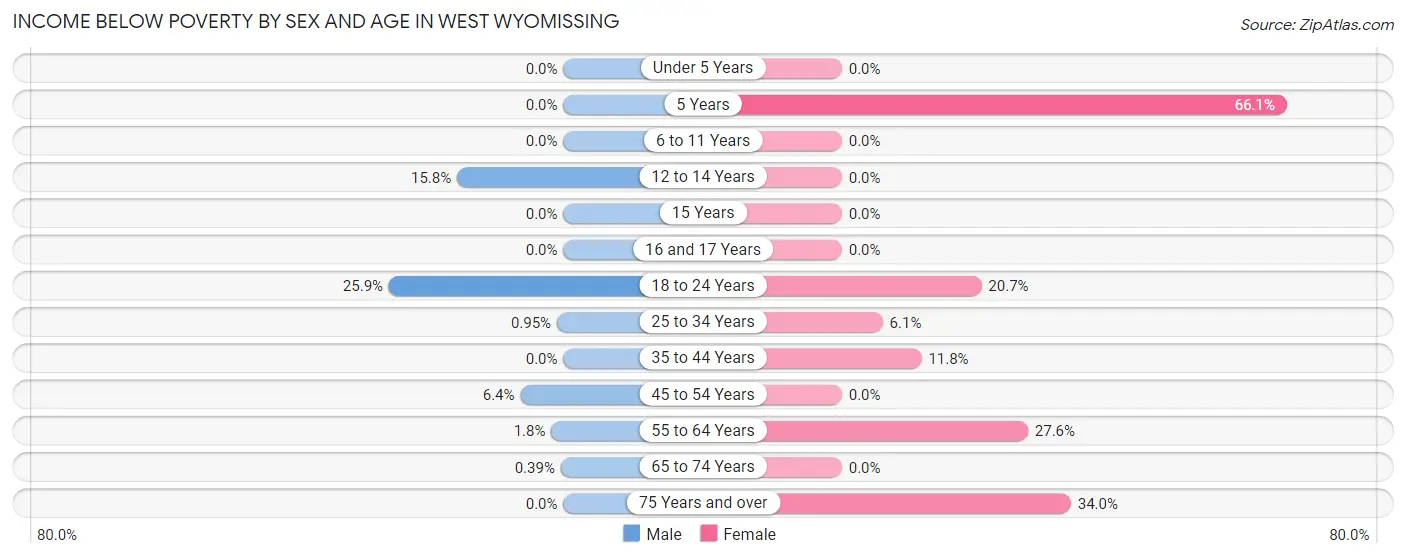
| Age Bracket | Male | Female |
| Under 5 Years | 0 (0.0%) | 0 (0.0%) |
| 5 Years | 0 (0.0%) | 37 (66.1%) |
| 6 to 11 Years | 0 (0.0%) | 0 (0.0%) |
| 12 to 14 Years | 21 (15.8%) | 0 (0.0%) |
| 15 Years | 0 (0.0%) | 0 (0.0%) |
| 16 and 17 Years | 0 (0.0%) | 0 (0.0%) |
| 18 to 24 Years | 36 (25.9%) | 34 (20.7%) |
| 25 to 34 Years | 2 (0.9%) | 13 (6.1%) |
| 35 to 44 Years | 0 (0.0%) | 20 (11.8%) |
| 45 to 54 Years | 19 (6.4%) | 0 (0.0%) |
| 55 to 64 Years | 1 (1.8%) | 63 (27.6%) |
| 65 to 74 Years | 1 (0.4%) | 0 (0.0%) |
| 75 Years and over | 0 (0.0%) | 84 (34.0%) |
| Total | 80 (5.1%) | 251 (15.1%) |
Income Above Poverty by Sex and Age in West Wyomissing
According to the poverty statistics in West Wyomissing, males aged under 5 years and females aged under 5 years are the age groups that are most secure financially, with 100.0% of males and 100.0% of females in these age groups living above the poverty line.
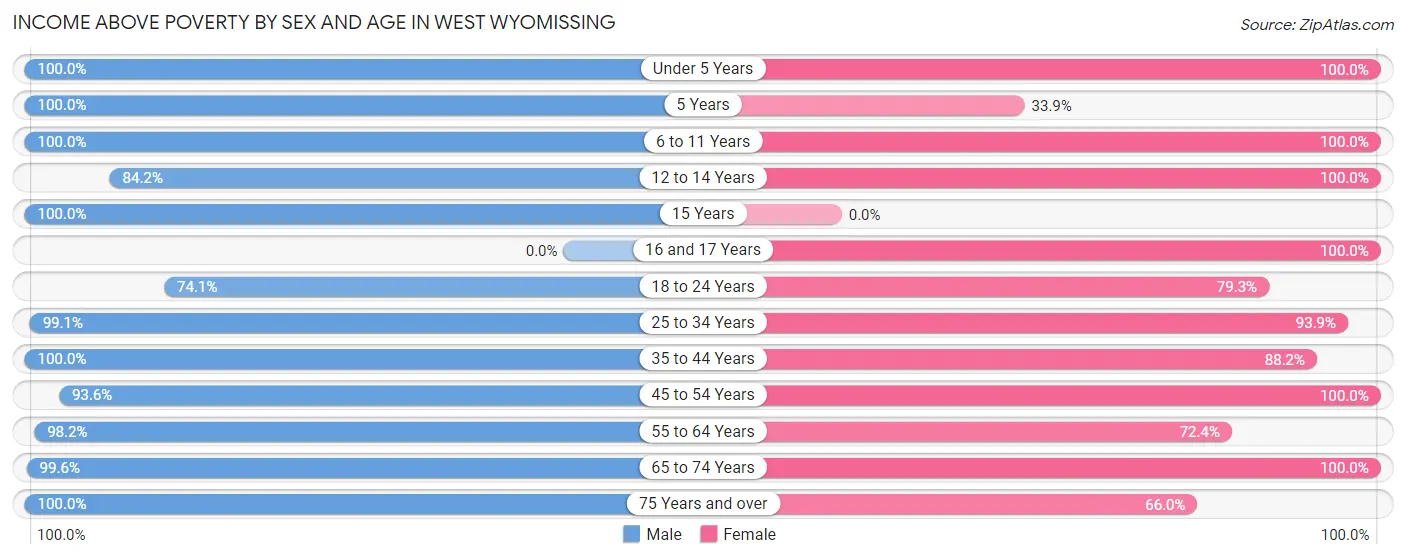
| Age Bracket | Male | Female |
| Under 5 Years | 64 (100.0%) | 25 (100.0%) |
| 5 Years | 11 (100.0%) | 19 (33.9%) |
| 6 to 11 Years | 109 (100.0%) | 57 (100.0%) |
| 12 to 14 Years | 112 (84.2%) | 23 (100.0%) |
| 15 Years | 70 (100.0%) | 0 (0.0%) |
| 16 and 17 Years | 0 (0.0%) | 39 (100.0%) |
| 18 to 24 Years | 103 (74.1%) | 130 (79.3%) |
| 25 to 34 Years | 208 (99.1%) | 201 (93.9%) |
| 35 to 44 Years | 125 (100.0%) | 149 (88.2%) |
| 45 to 54 Years | 279 (93.6%) | 219 (100.0%) |
| 55 to 64 Years | 55 (98.2%) | 165 (72.4%) |
| 65 to 74 Years | 257 (99.6%) | 225 (100.0%) |
| 75 Years and over | 107 (100.0%) | 163 (66.0%) |
| Total | 1,500 (94.9%) | 1,415 (84.9%) |
Income Below Poverty Among Married-Couple Families in West Wyomissing
The poverty statistics for married-couple families in West Wyomissing show that 2.6% or 19 of the total 731 families live below the poverty line. Families with 1 or 2 children have the highest poverty rate of 10.6%, comprising of 19 families. On the other hand, families with no children have the lowest poverty rate of 0.0%, which includes 0 families.
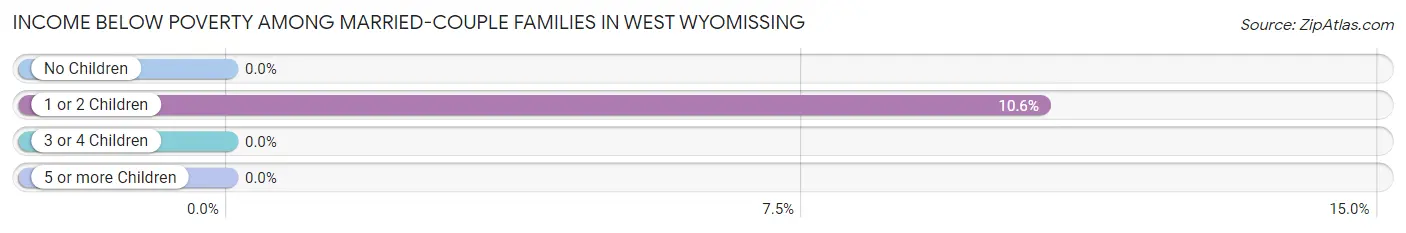
| Children | Above Poverty | Below Poverty |
| No Children | 496 (100.0%) | 0 (0.0%) |
| 1 or 2 Children | 160 (89.4%) | 19 (10.6%) |
| 3 or 4 Children | 56 (100.0%) | 0 (0.0%) |
| 5 or more Children | 0 (0.0%) | 0 (0.0%) |
| Total | 712 (97.4%) | 19 (2.6%) |
Income Below Poverty Among Single-Parent Households in West Wyomissing
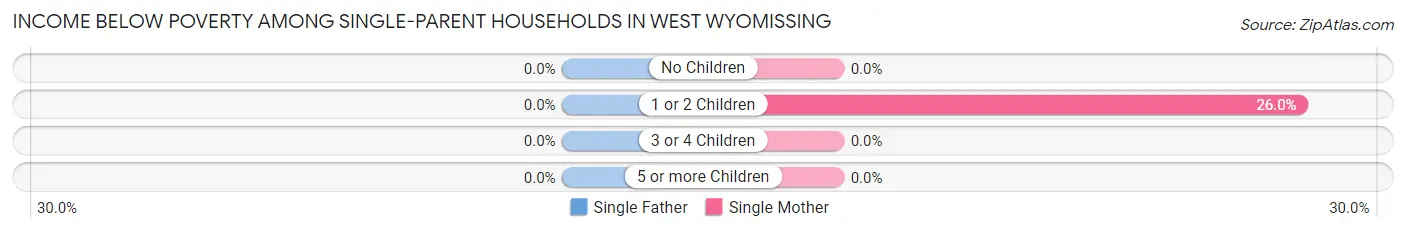
| Children | Single Father | Single Mother |
| No Children | 0 (0.0%) | 0 (0.0%) |
| 1 or 2 Children | 0 (0.0%) | 20 (26.0%) |
| 3 or 4 Children | 0 (0.0%) | 0 (0.0%) |
| 5 or more Children | 0 (0.0%) | 0 (0.0%) |
| Total | 0 (0.0%) | 20 (13.3%) |
Income Below Poverty Among Married-Couple vs Single-Parent Households in West Wyomissing
The poverty data for West Wyomissing shows that 19 of the married-couple family households (2.6%) and 20 of the single-parent households (10.9%) are living below the poverty level. Within the married-couple family households, those with 1 or 2 children have the highest poverty rate, with 19 households (10.6%) falling below the poverty line. Among the single-parent households, those with 1 or 2 children have the highest poverty rate, with 20 household (21.0%) living below poverty.
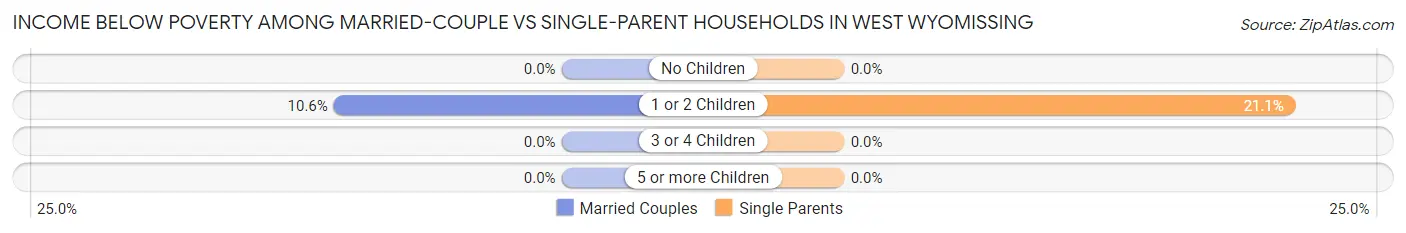
| Children | Married-Couple Families | Single-Parent Households |
| No Children | 0 (0.0%) | 0 (0.0%) |
| 1 or 2 Children | 19 (10.6%) | 20 (21.0%) |
| 3 or 4 Children | 0 (0.0%) | 0 (0.0%) |
| 5 or more Children | 0 (0.0%) | 0 (0.0%) |
| Total | 19 (2.6%) | 20 (10.9%) |
Race in West Wyomissing
The most populous races in West Wyomissing are White / Caucasian (2,687 | 82.3%), Hispanic or Latino (632 | 19.3%), and Black / African American (184 | 5.6%).
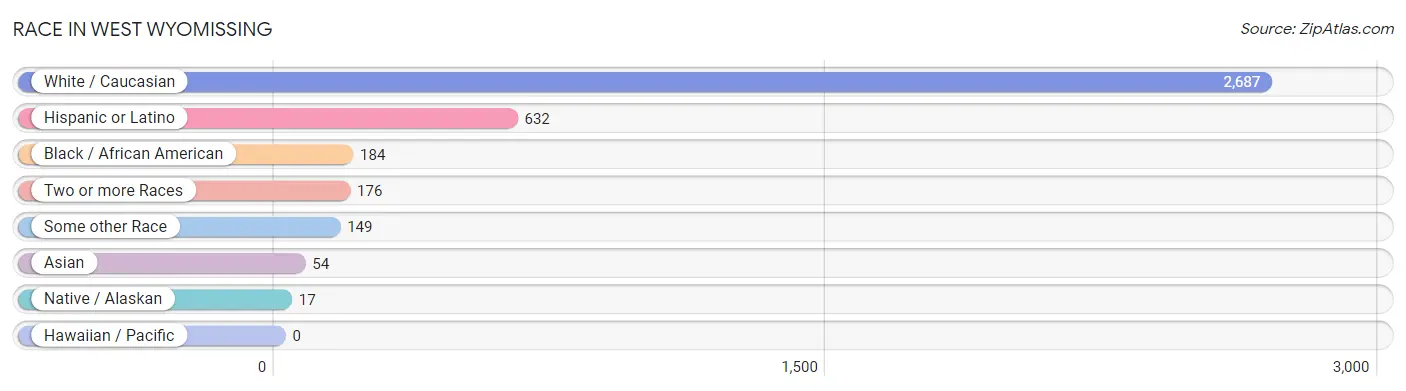
| Race | # Population | % Population |
| Asian | 54 | 1.7% |
| Black / African American | 184 | 5.6% |
| Hawaiian / Pacific | 0 | 0.0% |
| Hispanic or Latino | 632 | 19.3% |
| Native / Alaskan | 17 | 0.5% |
| White / Caucasian | 2,687 | 82.3% |
| Two or more Races | 176 | 5.4% |
| Some other Race | 149 | 4.6% |
| Total | 3,267 | 100.0% |
Ancestry in West Wyomissing
The most populous ancestries reported in West Wyomissing are German (957 | 29.3%), Dominican (411 | 12.6%), Irish (393 | 12.0%), Polish (384 | 11.7%), and Italian (335 | 10.2%), together accounting for 75.9% of all West Wyomissing residents.
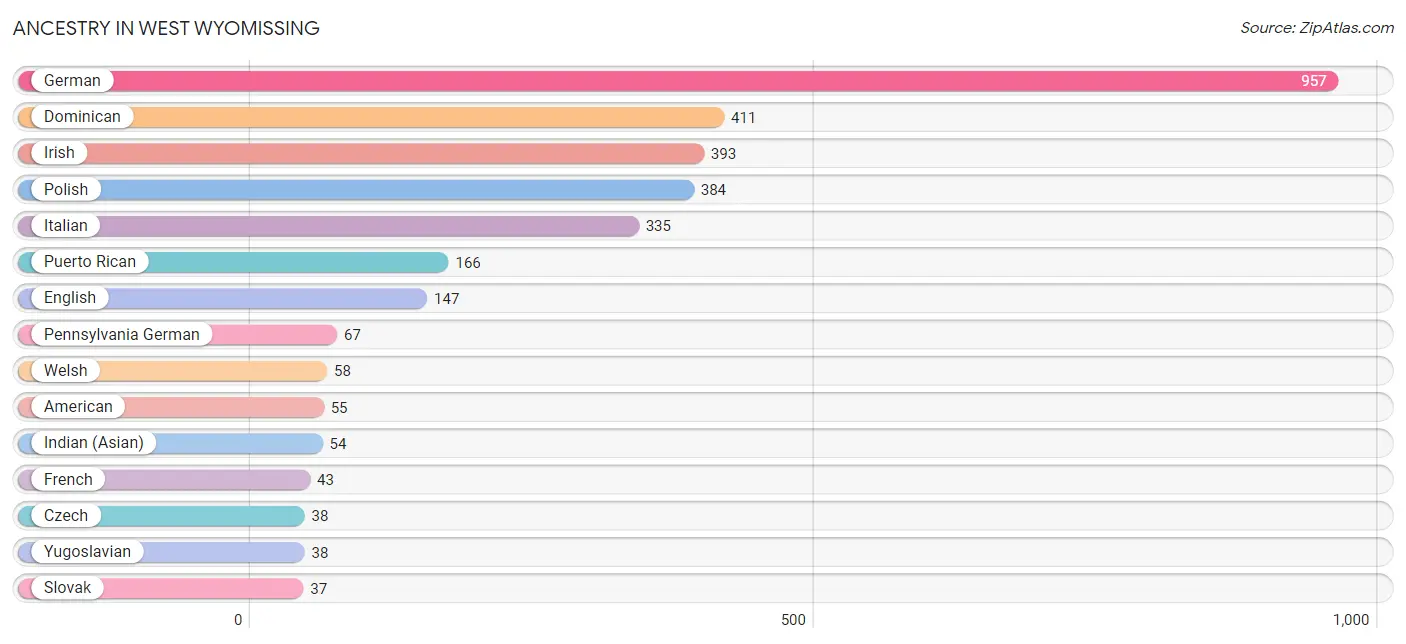
| Ancestry | # Population | % Population |
| American | 55 | 1.7% |
| Colombian | 33 | 1.0% |
| Czech | 38 | 1.2% |
| Dominican | 411 | 12.6% |
| English | 147 | 4.5% |
| French | 43 | 1.3% |
| German | 957 | 29.3% |
| Greek | 13 | 0.4% |
| Hungarian | 34 | 1.0% |
| Indian (Asian) | 54 | 1.7% |
| Irish | 393 | 12.0% |
| Italian | 335 | 10.2% |
| Jamaican | 30 | 0.9% |
| Mexican | 22 | 0.7% |
| Norwegian | 19 | 0.6% |
| Pennsylvania German | 67 | 2.1% |
| Polish | 384 | 11.7% |
| Puerto Rican | 166 | 5.1% |
| Scottish | 27 | 0.8% |
| Slovak | 37 | 1.1% |
| South American | 33 | 1.0% |
| Swedish | 22 | 0.7% |
| Tlingit-Haida | 17 | 0.5% |
| Welsh | 58 | 1.8% |
| Yugoslavian | 38 | 1.2% | View All 25 Rows |
Immigrants in West Wyomissing
The most numerous immigrant groups reported in West Wyomissing came from Caribbean (213 | 6.5%), Dominican Republic (213 | 6.5%), Latin America (213 | 6.5%), Europe (197 | 6.0%), and Eastern Europe (182 | 5.6%), together accounting for 31.2% of all West Wyomissing residents.
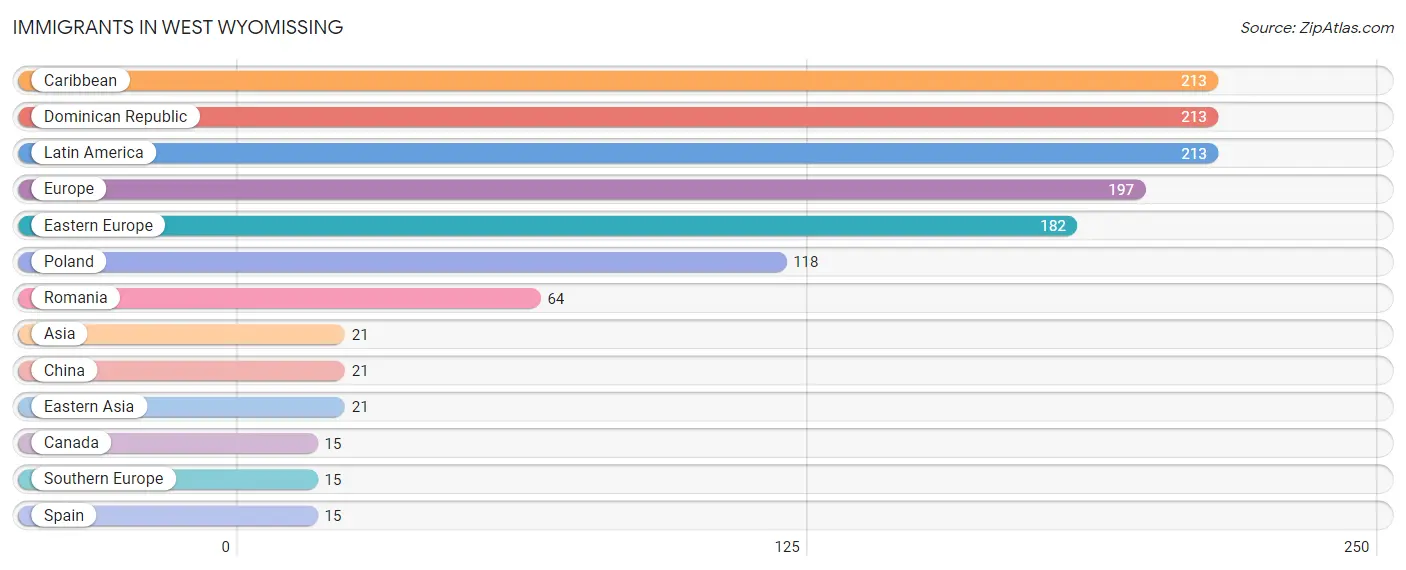
| Immigration Origin | # Population | % Population |
| Asia | 21 | 0.6% |
| Canada | 15 | 0.5% |
| Caribbean | 213 | 6.5% |
| China | 21 | 0.6% |
| Dominican Republic | 213 | 6.5% |
| Eastern Asia | 21 | 0.6% |
| Eastern Europe | 182 | 5.6% |
| Europe | 197 | 6.0% |
| Latin America | 213 | 6.5% |
| Poland | 118 | 3.6% |
| Romania | 64 | 2.0% |
| Southern Europe | 15 | 0.5% |
| Spain | 15 | 0.5% | View All 13 Rows |
Sex and Age in West Wyomissing
Sex and Age in West Wyomissing
The most populous age groups in West Wyomissing are 50 to 54 Years (247 | 15.6%) for men and 60 to 64 Years (160 | 9.5%) for women.
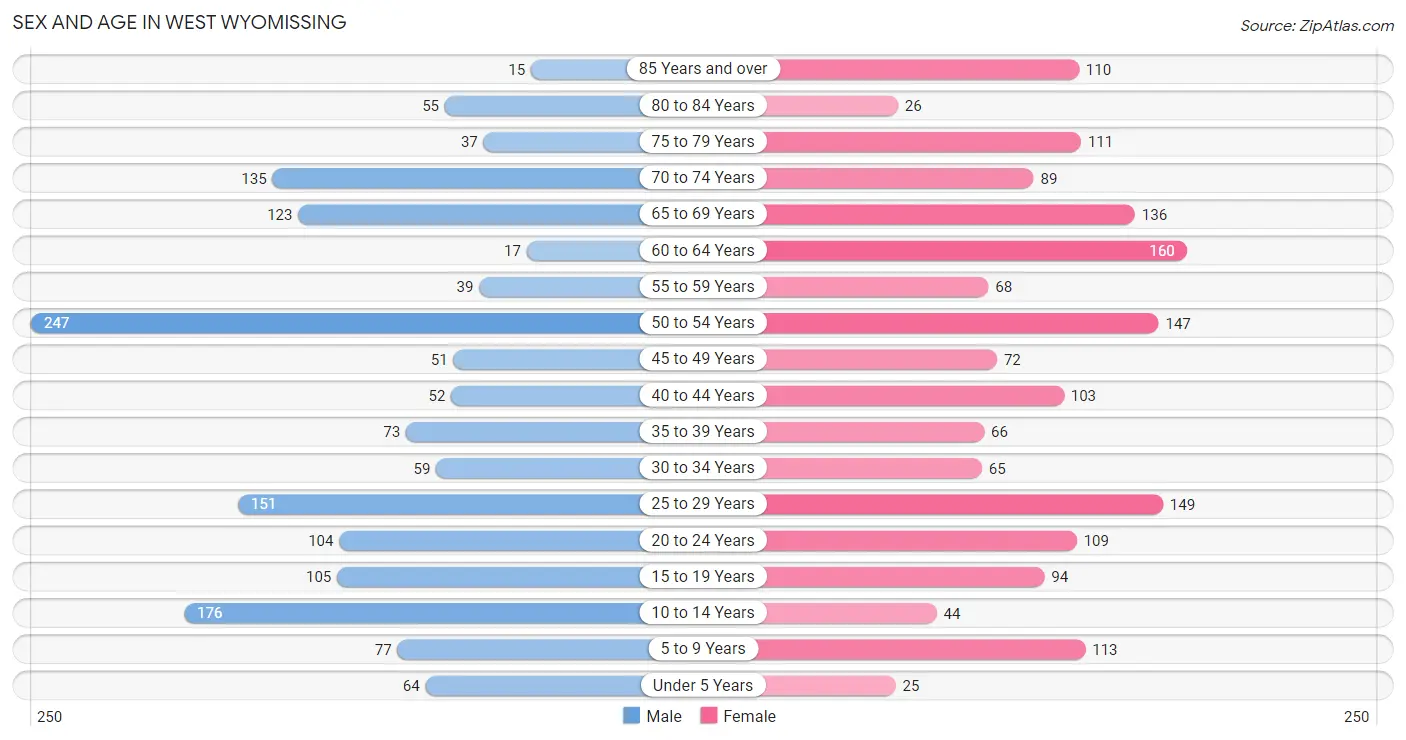
| Age Bracket | Male | Female |
| Under 5 Years | 64 (4.1%) | 25 (1.5%) |
| 5 to 9 Years | 77 (4.9%) | 113 (6.7%) |
| 10 to 14 Years | 176 (11.1%) | 44 (2.6%) |
| 15 to 19 Years | 105 (6.7%) | 94 (5.6%) |
| 20 to 24 Years | 104 (6.6%) | 109 (6.5%) |
| 25 to 29 Years | 151 (9.6%) | 149 (8.8%) |
| 30 to 34 Years | 59 (3.7%) | 65 (3.8%) |
| 35 to 39 Years | 73 (4.6%) | 66 (3.9%) |
| 40 to 44 Years | 52 (3.3%) | 103 (6.1%) |
| 45 to 49 Years | 51 (3.2%) | 72 (4.3%) |
| 50 to 54 Years | 247 (15.6%) | 147 (8.7%) |
| 55 to 59 Years | 39 (2.5%) | 68 (4.0%) |
| 60 to 64 Years | 17 (1.1%) | 160 (9.5%) |
| 65 to 69 Years | 123 (7.8%) | 136 (8.1%) |
| 70 to 74 Years | 135 (8.5%) | 89 (5.3%) |
| 75 to 79 Years | 37 (2.3%) | 111 (6.6%) |
| 80 to 84 Years | 55 (3.5%) | 26 (1.5%) |
| 85 Years and over | 15 (0.9%) | 110 (6.5%) |
| Total | 1,580 (100.0%) | 1,687 (100.0%) |
Families and Households in West Wyomissing
Median Family Size in West Wyomissing
The median family size in West Wyomissing is 2.85 persons per family, with single female/mother families (150 | 16.4%) accounting for the largest median family size of 2.98 persons per family. On the other hand, married-couple families (731 | 79.9%) represent the smallest median family size with 2.82 persons per family.
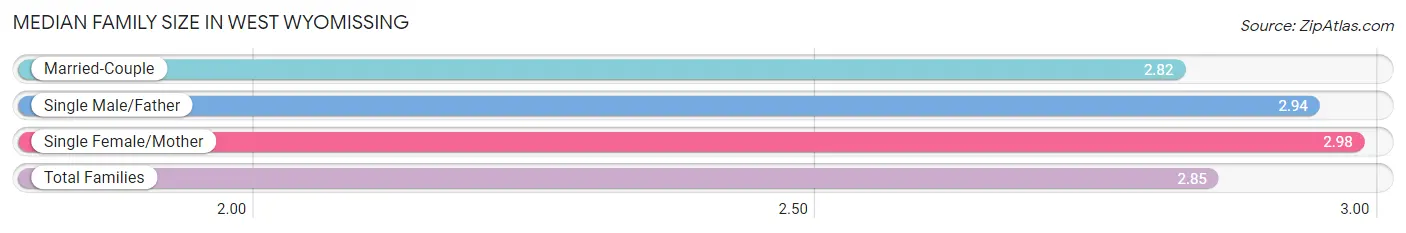
| Family Type | # Families | Family Size |
| Married-Couple | 731 (79.9%) | 2.82 |
| Single Male/Father | 34 (3.7%) | 2.94 |
| Single Female/Mother | 150 (16.4%) | 2.98 |
| Total Families | 915 (100.0%) | 2.85 |
Median Household Size in West Wyomissing
The median household size in West Wyomissing is 2.34 persons per household, with single male/father households (34 | 2.4%) accounting for the largest median household size of 3.53 persons per household. non-family households (479 | 34.4%) represent the smallest median household size with 1.23 persons per household.
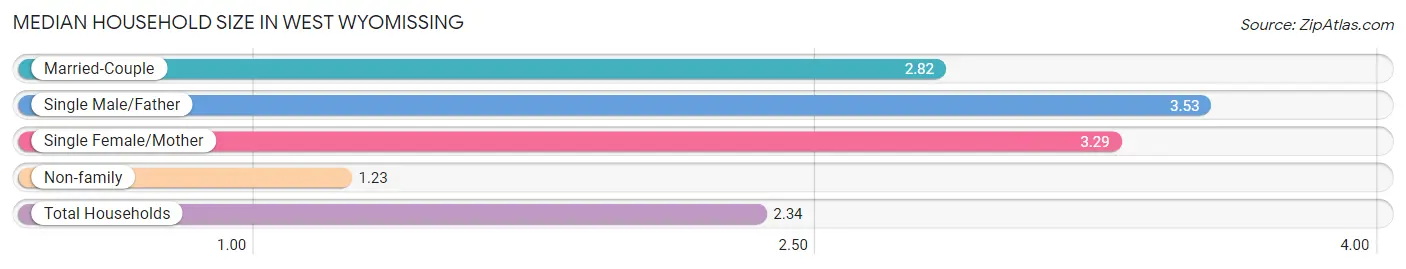
| Household Type | # Households | Household Size |
| Married-Couple | 731 (52.4%) | 2.82 |
| Single Male/Father | 34 (2.4%) | 3.53 |
| Single Female/Mother | 150 (10.8%) | 3.29 |
| Non-family | 479 (34.4%) | 1.23 |
| Total Households | 1,394 (100.0%) | 2.34 |
Household Size by Marriage Status in West Wyomissing
Out of a total of 1,394 households in West Wyomissing, 915 (65.6%) are family households, while 479 (34.4%) are nonfamily households. The most numerous type of family households are 2-person households, comprising 468, and the most common type of nonfamily households are 1-person households, comprising 386.
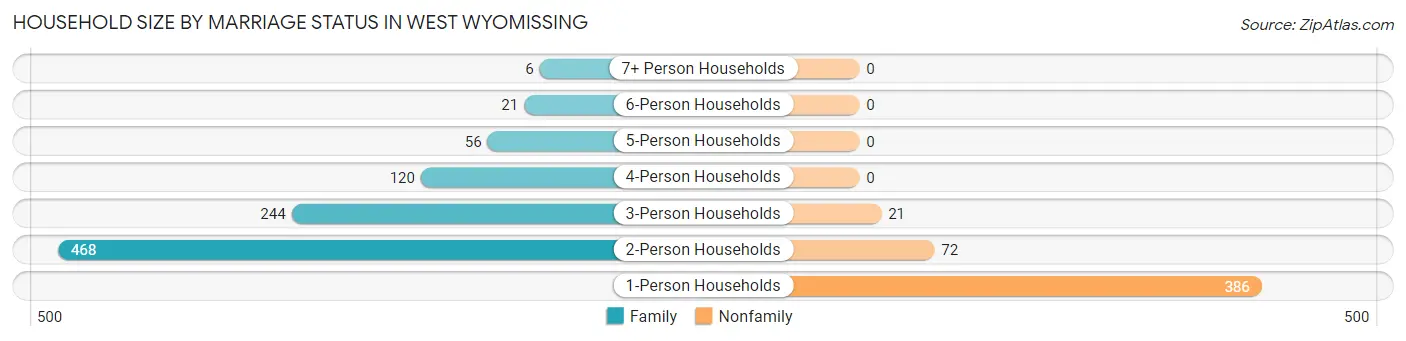
| Household Size | Family Households | Nonfamily Households |
| 1-Person Households | - | 386 (27.7%) |
| 2-Person Households | 468 (33.6%) | 72 (5.2%) |
| 3-Person Households | 244 (17.5%) | 21 (1.5%) |
| 4-Person Households | 120 (8.6%) | 0 (0.0%) |
| 5-Person Households | 56 (4.0%) | 0 (0.0%) |
| 6-Person Households | 21 (1.5%) | 0 (0.0%) |
| 7+ Person Households | 6 (0.4%) | 0 (0.0%) |
| Total | 915 (65.6%) | 479 (34.4%) |
Female Fertility in West Wyomissing
Fertility by Age in West Wyomissing
Average fertility rate in West Wyomissing is 46.0 births per 1,000 women. Women in the age bracket of 15 to 19 years have the highest fertility rate with 138.0 births per 1,000 women. Women in the age bracket of 20 to 34 years acount for 56.7% of all women with births.
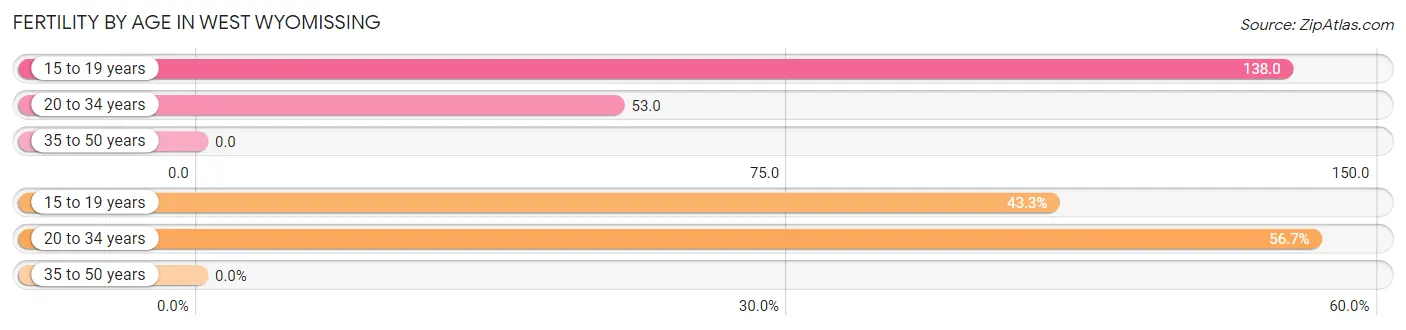
| Age Bracket | Women with Births | Births / 1,000 Women |
| 15 to 19 years | 13 (43.3%) | 138.0 |
| 20 to 34 years | 17 (56.7%) | 53.0 |
| 35 to 50 years | 0 (0.0%) | 0.0 |
| Total | 30 (100.0%) | 46.0 |
Fertility by Age by Marriage Status in West Wyomissing
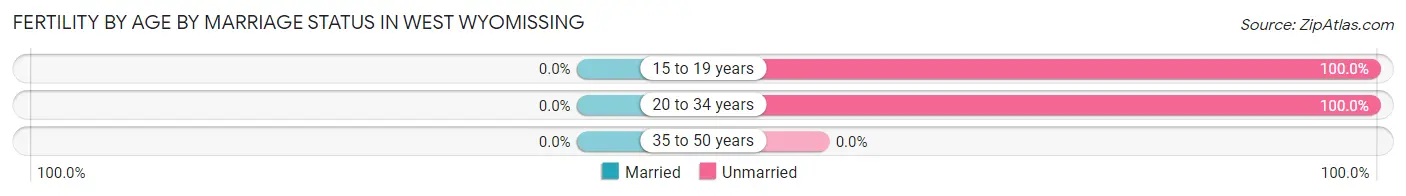
| Age Bracket | Married | Unmarried |
| 15 to 19 years | 0 (0.0%) | 13 (100.0%) |
| 20 to 34 years | 0 (0.0%) | 17 (100.0%) |
| 35 to 50 years | 0 (0.0%) | 0 (0.0%) |
| Total | 0 (0.0%) | 30 (100.0%) |
Fertility by Education in West Wyomissing
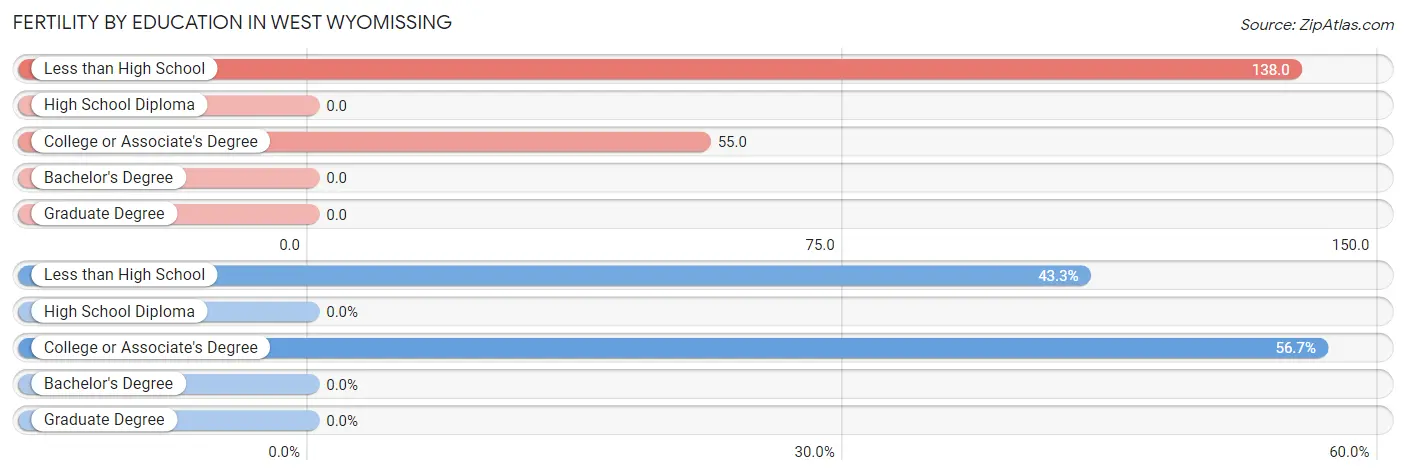
| Educational Attainment | Women with Births | Births / 1,000 Women |
| Less than High School | 13 (43.3%) | 138.0 |
| High School Diploma | 0 (0.0%) | 0.0 |
| College or Associate's Degree | 17 (56.7%) | 55.0 |
| Bachelor's Degree | 0 (0.0%) | 0.0 |
| Graduate Degree | 0 (0.0%) | 0.0 |
| Total | 30 (100.0%) | 46.0 |
Fertility by Education by Marriage Status in West Wyomissing
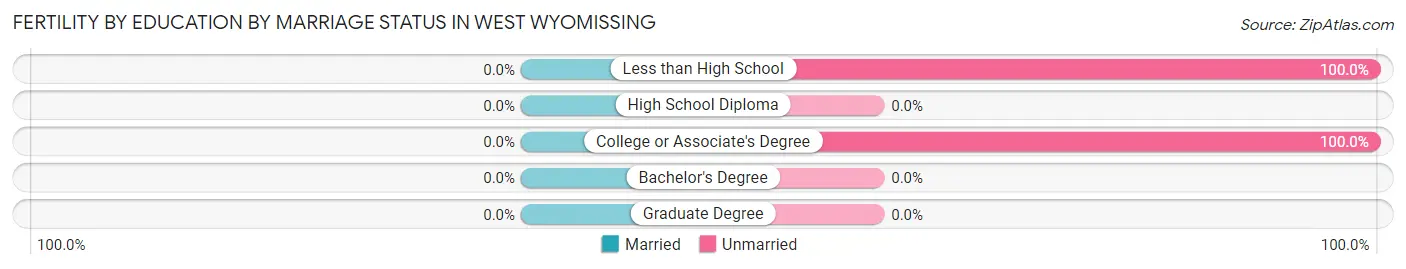
| Educational Attainment | Married | Unmarried |
| Less than High School | 0 (0.0%) | 13 (100.0%) |
| High School Diploma | 0 (0.0%) | 0 (0.0%) |
| College or Associate's Degree | 0 (0.0%) | 17 (100.0%) |
| Bachelor's Degree | 0 (0.0%) | 0 (0.0%) |
| Graduate Degree | 0 (0.0%) | 0 (0.0%) |
| Total | 0 (0.0%) | 30 (100.0%) |
Employment Characteristics in West Wyomissing
Employment by Class of Employer in West Wyomissing
Among the 1,645 employed individuals in West Wyomissing, private company employees (1,216 | 73.9%), not-for-profit organizations (187 | 11.4%), and local government employees (90 | 5.5%) make up the most common classes of employment.
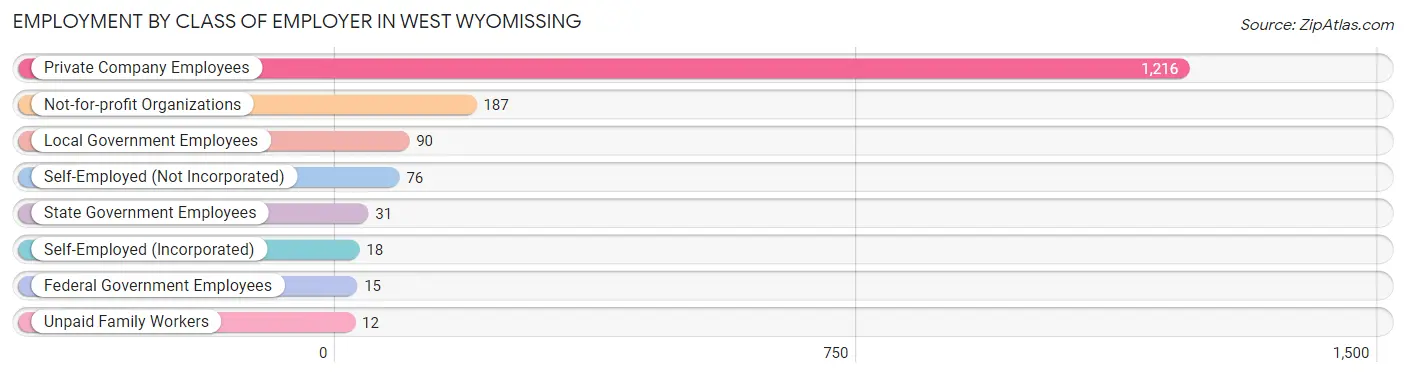
| Employer Class | # Employees | % Employees |
| Private Company Employees | 1,216 | 73.9% |
| Self-Employed (Incorporated) | 18 | 1.1% |
| Self-Employed (Not Incorporated) | 76 | 4.6% |
| Not-for-profit Organizations | 187 | 11.4% |
| Local Government Employees | 90 | 5.5% |
| State Government Employees | 31 | 1.9% |
| Federal Government Employees | 15 | 0.9% |
| Unpaid Family Workers | 12 | 0.7% |
| Total | 1,645 | 100.0% |
Employment Status by Age in West Wyomissing
According to the labor force statistics for West Wyomissing, out of the total population over 16 years of age (2,698), 62.9% or 1,697 individuals are in the labor force, with 1.2% or 20 of them unemployed. The age group with the highest labor force participation rate is 55 to 59 years, with 100.0% or 107 individuals in the labor force. Within the labor force, the 20 to 24 years age range has the highest percentage of unemployed individuals, with 16.0% or 21 of them being unemployed.
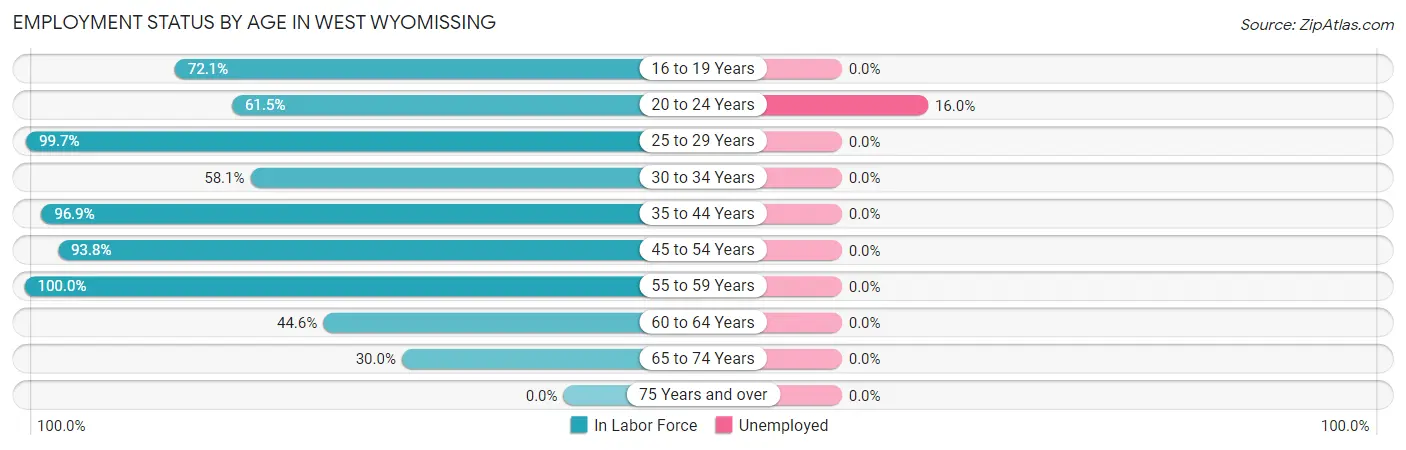
| Age Bracket | In Labor Force | Unemployed |
| 16 to 19 Years | 93 (72.1%) | 0 (0.0%) |
| 20 to 24 Years | 131 (61.5%) | 21 (16.0%) |
| 25 to 29 Years | 299 (99.7%) | 0 (0.0%) |
| 30 to 34 Years | 72 (58.1%) | 0 (0.0%) |
| 35 to 44 Years | 285 (96.9%) | 0 (0.0%) |
| 45 to 54 Years | 485 (93.8%) | 0 (0.0%) |
| 55 to 59 Years | 107 (100.0%) | 0 (0.0%) |
| 60 to 64 Years | 79 (44.6%) | 0 (0.0%) |
| 65 to 74 Years | 145 (30.0%) | 0 (0.0%) |
| 75 Years and over | 0 (0.0%) | 0 (0.0%) |
| Total | 1,697 (62.9%) | 20 (1.2%) |
Employment Status by Educational Attainment in West Wyomissing
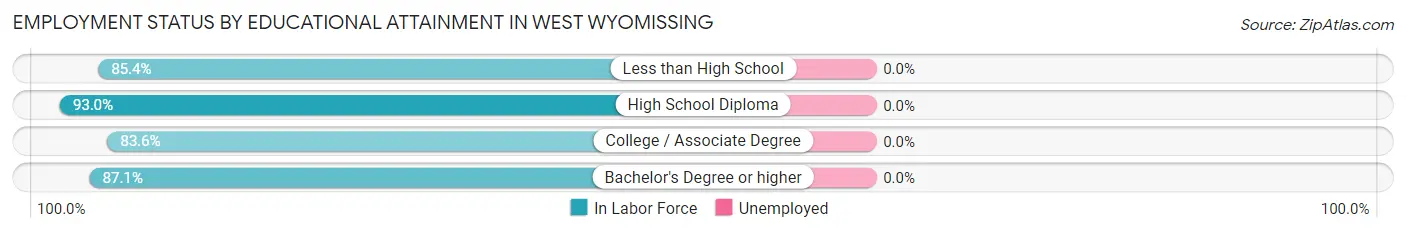
| Educational Attainment | In Labor Force | Unemployed |
| Less than High School | 82 (85.4%) | 0 (0.0%) |
| High School Diploma | 358 (93.0%) | 0 (0.0%) |
| College / Associate Degree | 407 (83.6%) | 0 (0.0%) |
| Bachelor's Degree or higher | 480 (87.1%) | 0 (0.0%) |
| Total | 1,328 (87.4%) | 0 (0.0%) |
Employment Occupations by Sex in West Wyomissing
Management, Business, Science and Arts Occupations
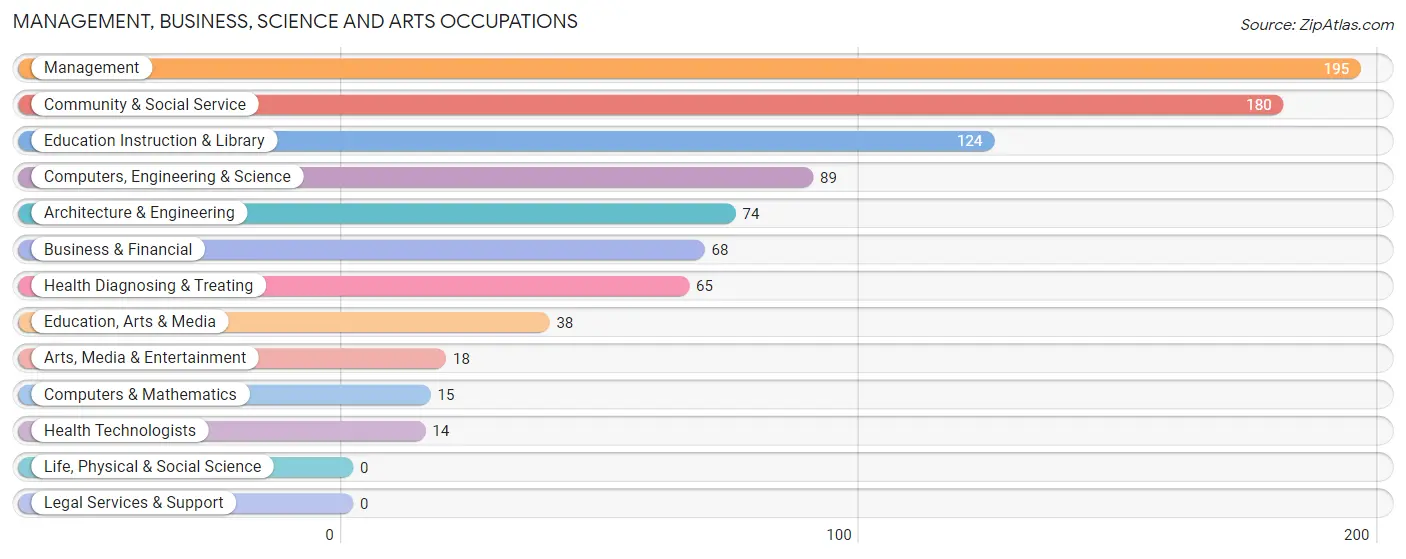
The most common Management, Business, Science and Arts occupations in West Wyomissing are Management (195 | 11.6%), Community & Social Service (180 | 10.7%), Education Instruction & Library (124 | 7.4%), Computers, Engineering & Science (89 | 5.3%), and Architecture & Engineering (74 | 4.4%).
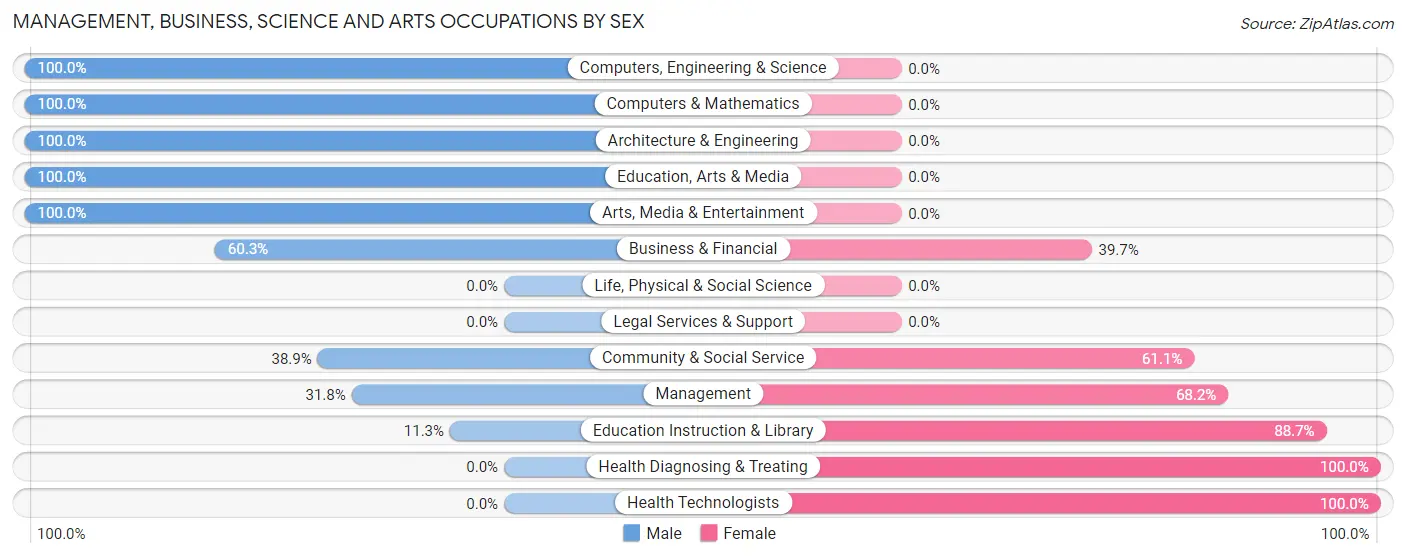
Management, Business, Science and Arts Occupations by Sex
Within the Management, Business, Science and Arts occupations in West Wyomissing, the most male-oriented occupations are Computers, Engineering & Science (100.0%), Computers & Mathematics (100.0%), and Architecture & Engineering (100.0%), while the most female-oriented occupations are Health Diagnosing & Treating (100.0%), Health Technologists (100.0%), and Education Instruction & Library (88.7%).
| Occupation | Male | Female |
| Management | 62 (31.8%) | 133 (68.2%) |
| Business & Financial | 41 (60.3%) | 27 (39.7%) |
| Computers, Engineering & Science | 89 (100.0%) | 0 (0.0%) |
| Computers & Mathematics | 15 (100.0%) | 0 (0.0%) |
| Architecture & Engineering | 74 (100.0%) | 0 (0.0%) |
| Life, Physical & Social Science | 0 (0.0%) | 0 (0.0%) |
| Community & Social Service | 70 (38.9%) | 110 (61.1%) |
| Education, Arts & Media | 38 (100.0%) | 0 (0.0%) |
| Legal Services & Support | 0 (0.0%) | 0 (0.0%) |
| Education Instruction & Library | 14 (11.3%) | 110 (88.7%) |
| Arts, Media & Entertainment | 18 (100.0%) | 0 (0.0%) |
| Health Diagnosing & Treating | 0 (0.0%) | 65 (100.0%) |
| Health Technologists | 0 (0.0%) | 14 (100.0%) |
| Total (Category) | 262 (43.9%) | 335 (56.1%) |
| Total (Overall) | 870 (51.9%) | 805 (48.1%) |
Services Occupations
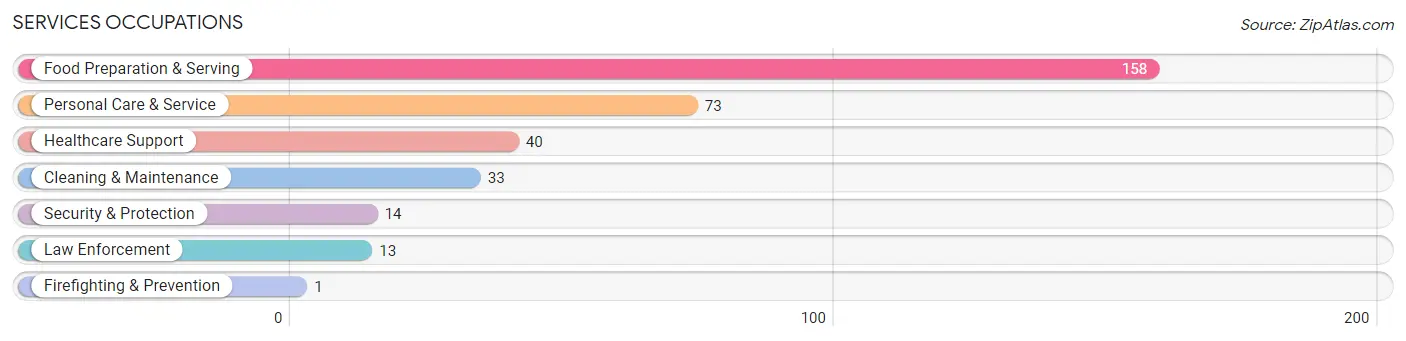
The most common Services occupations in West Wyomissing are Food Preparation & Serving (158 | 9.4%), Personal Care & Service (73 | 4.4%), Healthcare Support (40 | 2.4%), Cleaning & Maintenance (33 | 2.0%), and Security & Protection (14 | 0.8%).
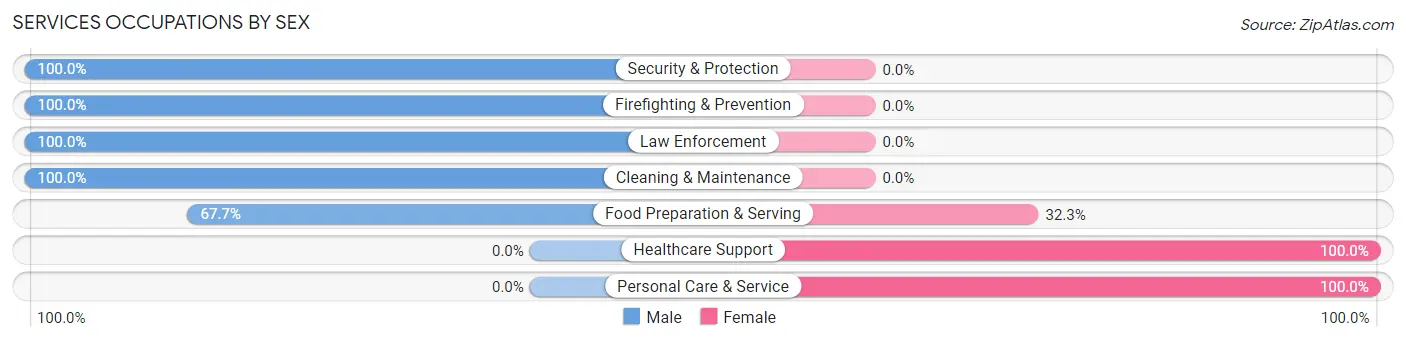
Services Occupations by Sex
Within the Services occupations in West Wyomissing, the most male-oriented occupations are Security & Protection (100.0%), Firefighting & Prevention (100.0%), and Law Enforcement (100.0%), while the most female-oriented occupations are Healthcare Support (100.0%), Personal Care & Service (100.0%), and Food Preparation & Serving (32.3%).
| Occupation | Male | Female |
| Healthcare Support | 0 (0.0%) | 40 (100.0%) |
| Security & Protection | 14 (100.0%) | 0 (0.0%) |
| Firefighting & Prevention | 1 (100.0%) | 0 (0.0%) |
| Law Enforcement | 13 (100.0%) | 0 (0.0%) |
| Food Preparation & Serving | 107 (67.7%) | 51 (32.3%) |
| Cleaning & Maintenance | 33 (100.0%) | 0 (0.0%) |
| Personal Care & Service | 0 (0.0%) | 73 (100.0%) |
| Total (Category) | 154 (48.4%) | 164 (51.6%) |
| Total (Overall) | 870 (51.9%) | 805 (48.1%) |
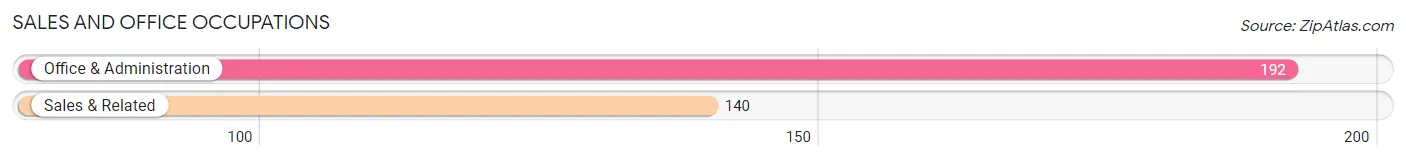
Sales and Office Occupations
The most common Sales and Office occupations in West Wyomissing are Office & Administration (192 | 11.5%), and Sales & Related (140 | 8.4%).
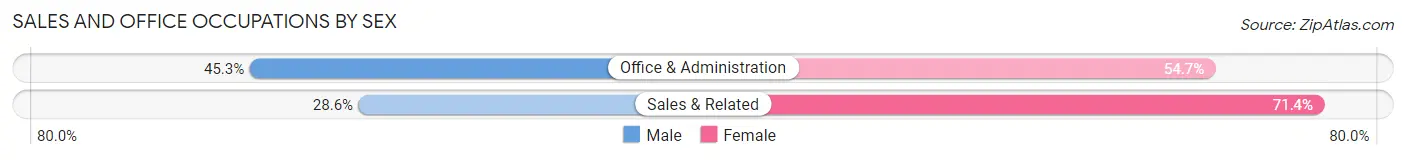
Sales and Office Occupations by Sex
| Occupation | Male | Female |
| Sales & Related | 40 (28.6%) | 100 (71.4%) |
| Office & Administration | 87 (45.3%) | 105 (54.7%) |
| Total (Category) | 127 (38.3%) | 205 (61.8%) |
| Total (Overall) | 870 (51.9%) | 805 (48.1%) |
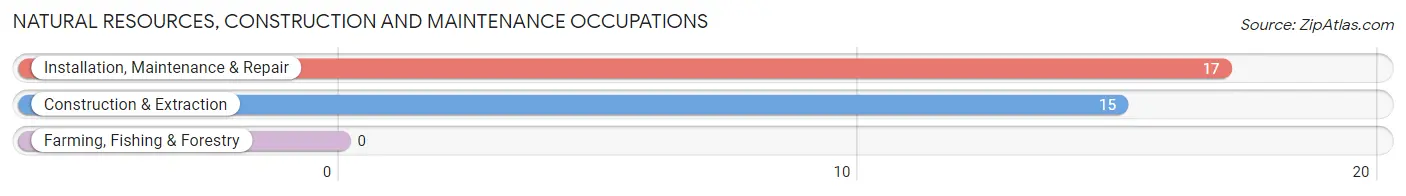
Natural Resources, Construction and Maintenance Occupations
The most common Natural Resources, Construction and Maintenance occupations in West Wyomissing are Installation, Maintenance & Repair (17 | 1.0%), and Construction & Extraction (15 | 0.9%).
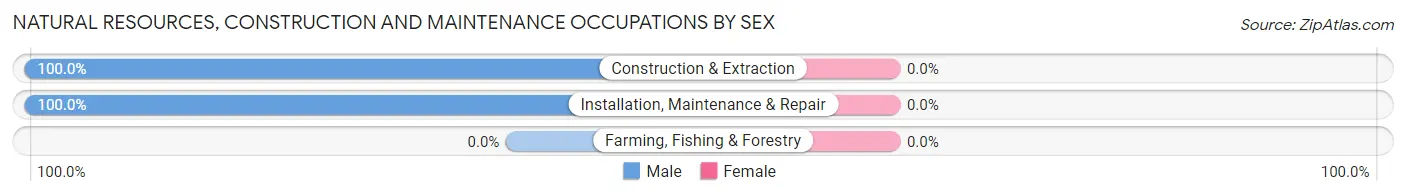
Natural Resources, Construction and Maintenance Occupations by Sex
| Occupation | Male | Female |
| Farming, Fishing & Forestry | 0 (0.0%) | 0 (0.0%) |
| Construction & Extraction | 15 (100.0%) | 0 (0.0%) |
| Installation, Maintenance & Repair | 17 (100.0%) | 0 (0.0%) |
| Total (Category) | 32 (100.0%) | 0 (0.0%) |
| Total (Overall) | 870 (51.9%) | 805 (48.1%) |
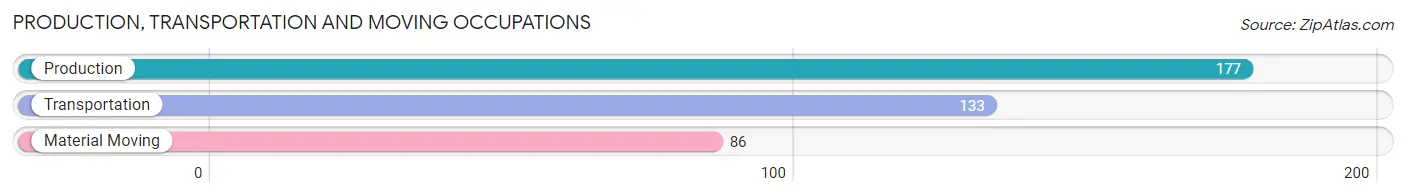
Production, Transportation and Moving Occupations
The most common Production, Transportation and Moving occupations in West Wyomissing are Production (177 | 10.6%), Transportation (133 | 7.9%), and Material Moving (86 | 5.1%).
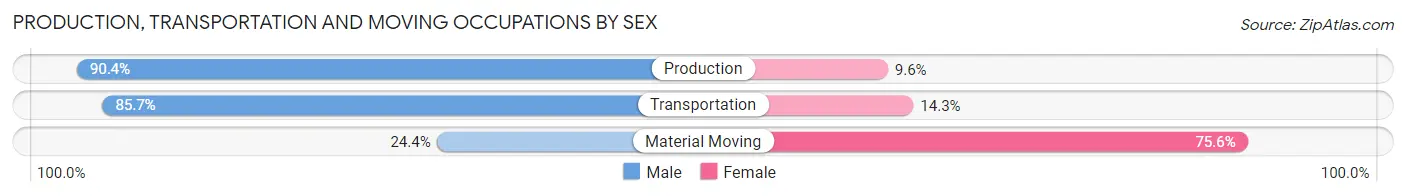
Production, Transportation and Moving Occupations by Sex
| Occupation | Male | Female |
| Production | 160 (90.4%) | 17 (9.6%) |
| Transportation | 114 (85.7%) | 19 (14.3%) |
| Material Moving | 21 (24.4%) | 65 (75.6%) |
| Total (Category) | 295 (74.5%) | 101 (25.5%) |
| Total (Overall) | 870 (51.9%) | 805 (48.1%) |
Employment Industries by Sex in West Wyomissing
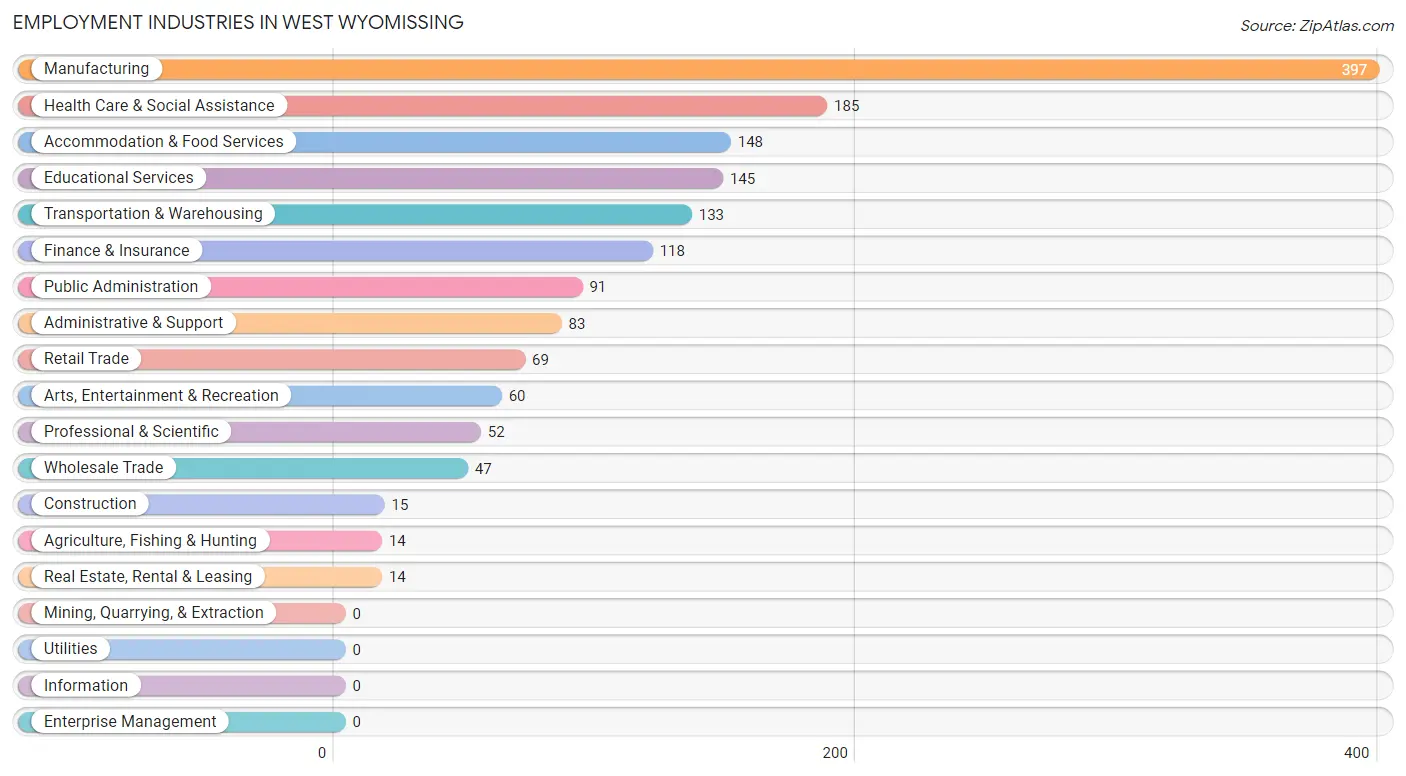
Employment Industries in West Wyomissing
The major employment industries in West Wyomissing include Manufacturing (397 | 23.7%), Health Care & Social Assistance (185 | 11.0%), Accommodation & Food Services (148 | 8.8%), Educational Services (145 | 8.7%), and Transportation & Warehousing (133 | 7.9%).
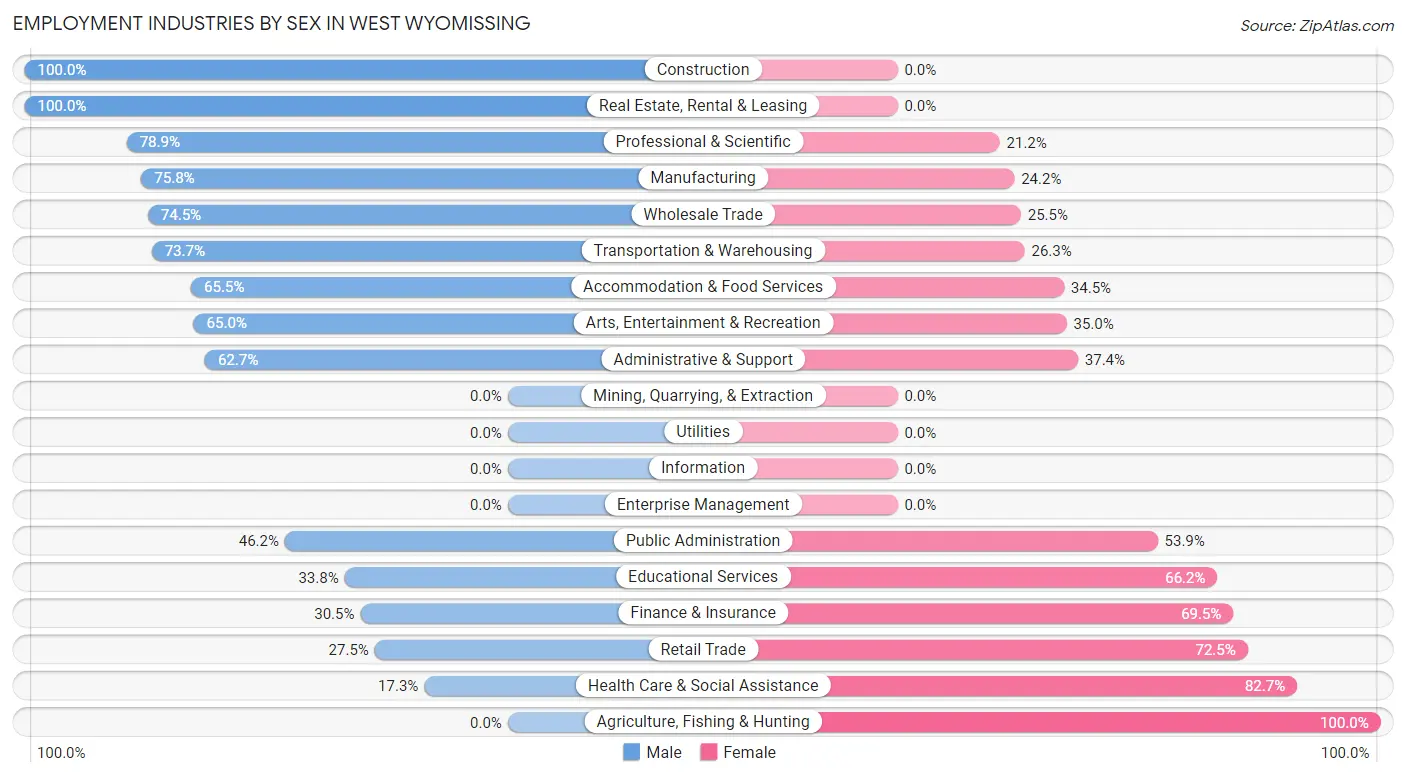
Employment Industries by Sex in West Wyomissing
The West Wyomissing industries that see more men than women are Construction (100.0%), Real Estate, Rental & Leasing (100.0%), and Professional & Scientific (78.8%), whereas the industries that tend to have a higher number of women are Agriculture, Fishing & Hunting (100.0%), Health Care & Social Assistance (82.7%), and Retail Trade (72.5%).
| Industry | Male | Female |
| Agriculture, Fishing & Hunting | 0 (0.0%) | 14 (100.0%) |
| Mining, Quarrying, & Extraction | 0 (0.0%) | 0 (0.0%) |
| Construction | 15 (100.0%) | 0 (0.0%) |
| Manufacturing | 301 (75.8%) | 96 (24.2%) |
| Wholesale Trade | 35 (74.5%) | 12 (25.5%) |
| Retail Trade | 19 (27.5%) | 50 (72.5%) |
| Transportation & Warehousing | 98 (73.7%) | 35 (26.3%) |
| Utilities | 0 (0.0%) | 0 (0.0%) |
| Information | 0 (0.0%) | 0 (0.0%) |
| Finance & Insurance | 36 (30.5%) | 82 (69.5%) |
| Real Estate, Rental & Leasing | 14 (100.0%) | 0 (0.0%) |
| Professional & Scientific | 41 (78.8%) | 11 (21.1%) |
| Enterprise Management | 0 (0.0%) | 0 (0.0%) |
| Administrative & Support | 52 (62.6%) | 31 (37.3%) |
| Educational Services | 49 (33.8%) | 96 (66.2%) |
| Health Care & Social Assistance | 32 (17.3%) | 153 (82.7%) |
| Arts, Entertainment & Recreation | 39 (65.0%) | 21 (35.0%) |
| Accommodation & Food Services | 97 (65.5%) | 51 (34.5%) |
| Public Administration | 42 (46.2%) | 49 (53.8%) |
| Total | 870 (51.9%) | 805 (48.1%) |
Education in West Wyomissing
School Enrollment in West Wyomissing
The most common levels of schooling among the 827 students in West Wyomissing are college / undergraduate (256 | 31.0%), middle school (174 | 21.0%), and high school (146 | 17.6%).
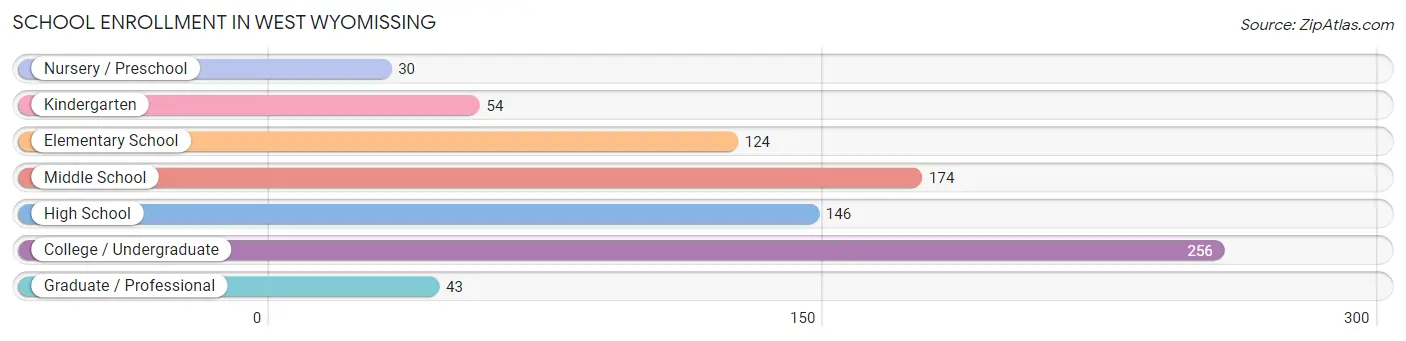
| School Level | # Students | % Students |
| Nursery / Preschool | 30 | 3.6% |
| Kindergarten | 54 | 6.5% |
| Elementary School | 124 | 15.0% |
| Middle School | 174 | 21.0% |
| High School | 146 | 17.6% |
| College / Undergraduate | 256 | 31.0% |
| Graduate / Professional | 43 | 5.2% |
| Total | 827 | 100.0% |
School Enrollment by Age by Funding Source in West Wyomissing
Out of a total of 827 students who are enrolled in schools in West Wyomissing, 86 (10.4%) attend a private institution, while the remaining 741 (89.6%) are enrolled in public schools. The age group of 3 to 4 year olds has the highest likelihood of being enrolled in private schools, with 12 (100.0% in the age bracket) enrolled. Conversely, the age group of 10 to 14 year olds has the lowest likelihood of being enrolled in a private school, with 220 (100.0% in the age bracket) attending a public institution.
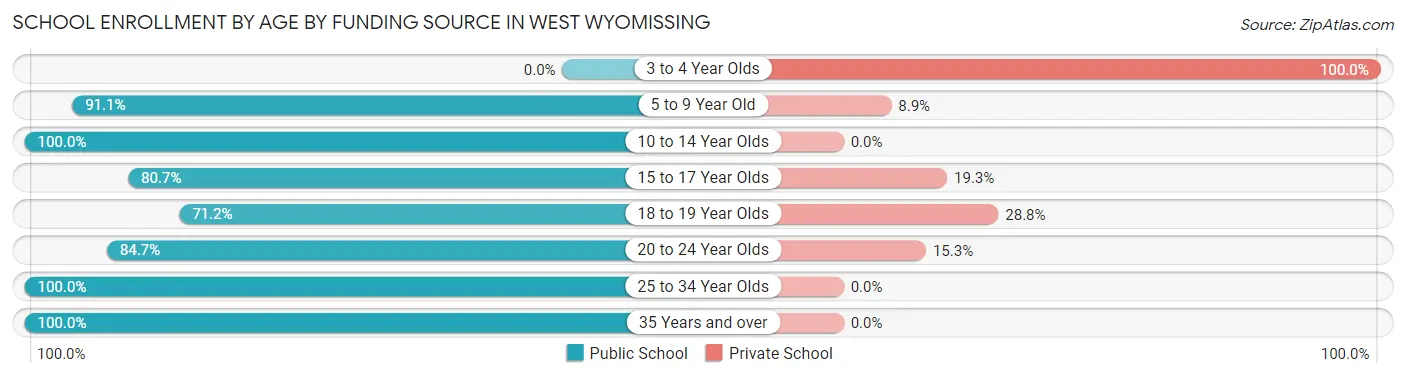
| Age Bracket | Public School | Private School |
| 3 to 4 Year Olds | 0 (0.0%) | 12 (100.0%) |
| 5 to 9 Year Old | 154 (91.1%) | 15 (8.9%) |
| 10 to 14 Year Olds | 220 (100.0%) | 0 (0.0%) |
| 15 to 17 Year Olds | 88 (80.7%) | 21 (19.3%) |
| 18 to 19 Year Olds | 42 (71.2%) | 17 (28.8%) |
| 20 to 24 Year Olds | 116 (84.7%) | 21 (15.3%) |
| 25 to 34 Year Olds | 61 (100.0%) | 0 (0.0%) |
| 35 Years and over | 60 (100.0%) | 0 (0.0%) |
| Total | 741 (89.6%) | 86 (10.4%) |
Educational Attainment by Field of Study in West Wyomissing
Psychology (120 | 16.3%), social sciences (101 | 13.7%), arts & humanities (81 | 11.0%), engineering (62 | 8.4%), and computers & mathematics (56 | 7.6%) are the most common fields of study among 736 individuals in West Wyomissing who have obtained a bachelor's degree or higher.
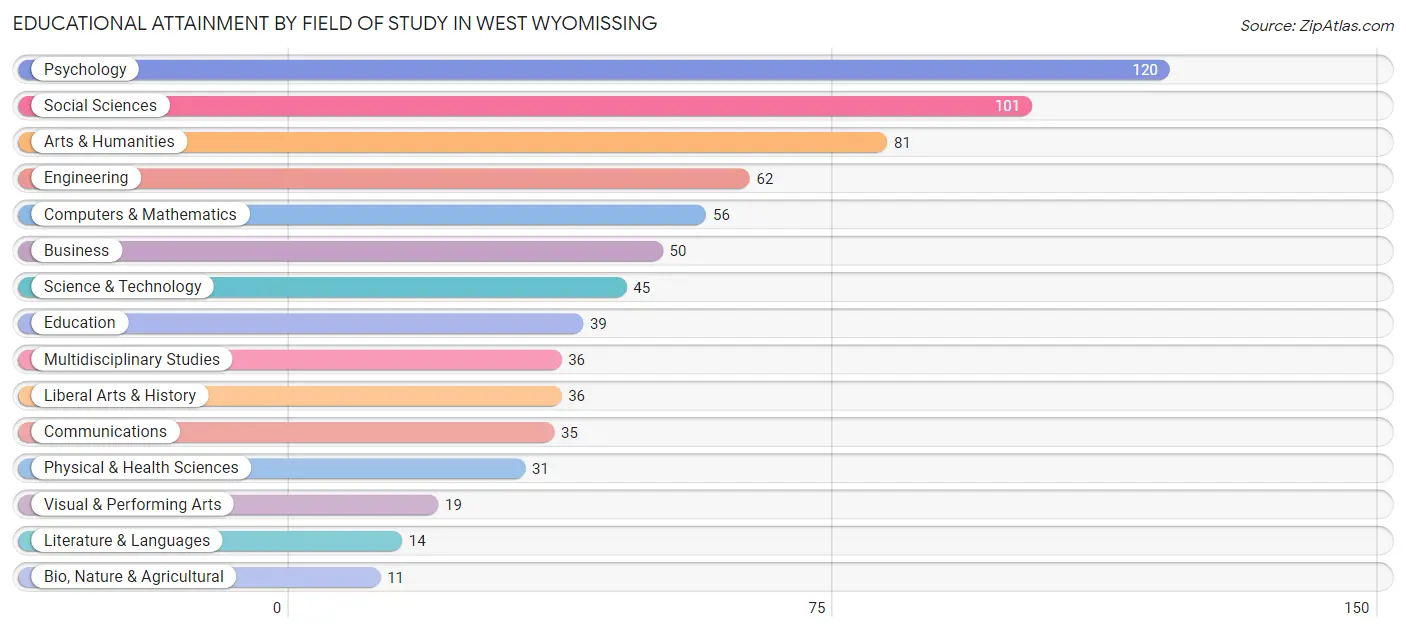
| Field of Study | # Graduates | % Graduates |
| Computers & Mathematics | 56 | 7.6% |
| Bio, Nature & Agricultural | 11 | 1.5% |
| Physical & Health Sciences | 31 | 4.2% |
| Psychology | 120 | 16.3% |
| Social Sciences | 101 | 13.7% |
| Engineering | 62 | 8.4% |
| Multidisciplinary Studies | 36 | 4.9% |
| Science & Technology | 45 | 6.1% |
| Business | 50 | 6.8% |
| Education | 39 | 5.3% |
| Literature & Languages | 14 | 1.9% |
| Liberal Arts & History | 36 | 4.9% |
| Visual & Performing Arts | 19 | 2.6% |
| Communications | 35 | 4.8% |
| Arts & Humanities | 81 | 11.0% |
| Total | 736 | 100.0% |
Transportation & Commute in West Wyomissing
Vehicle Availability by Sex in West Wyomissing
The most prevalent vehicle ownership categories in West Wyomissing are males with 2 vehicles (445, accounting for 52.1%) and females with 2 vehicles (230, making up 56.3%).
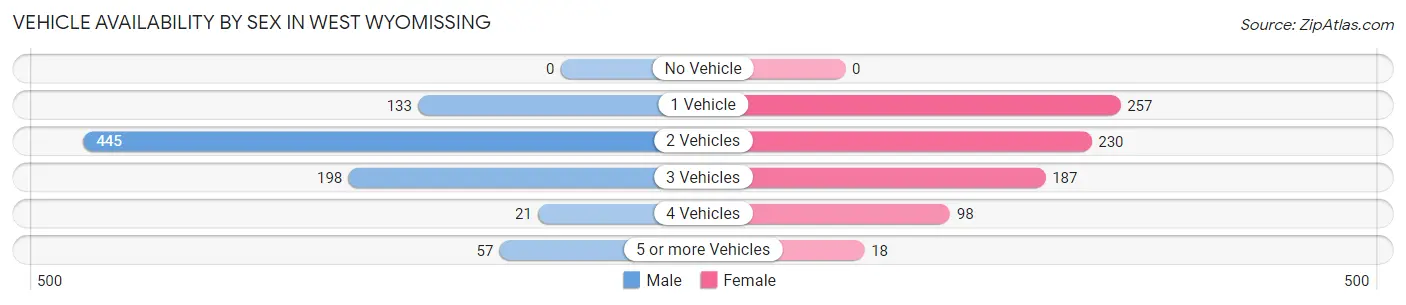
| Vehicles Available | Male | Female |
| No Vehicle | 0 (0.0%) | 0 (0.0%) |
| 1 Vehicle | 133 (15.6%) | 257 (32.5%) |
| 2 Vehicles | 445 (52.1%) | 230 (29.1%) |
| 3 Vehicles | 198 (23.2%) | 187 (23.7%) |
| 4 Vehicles | 21 (2.5%) | 98 (12.4%) |
| 5 or more Vehicles | 57 (6.7%) | 18 (2.3%) |
| Total | 854 (100.0%) | 790 (100.0%) |
Commute Time in West Wyomissing
The most frequently occuring commute durations in West Wyomissing are 10 to 14 minutes (321 commuters, 20.9%), 15 to 19 minutes (290 commuters, 18.9%), and 20 to 24 minutes (218 commuters, 14.2%).
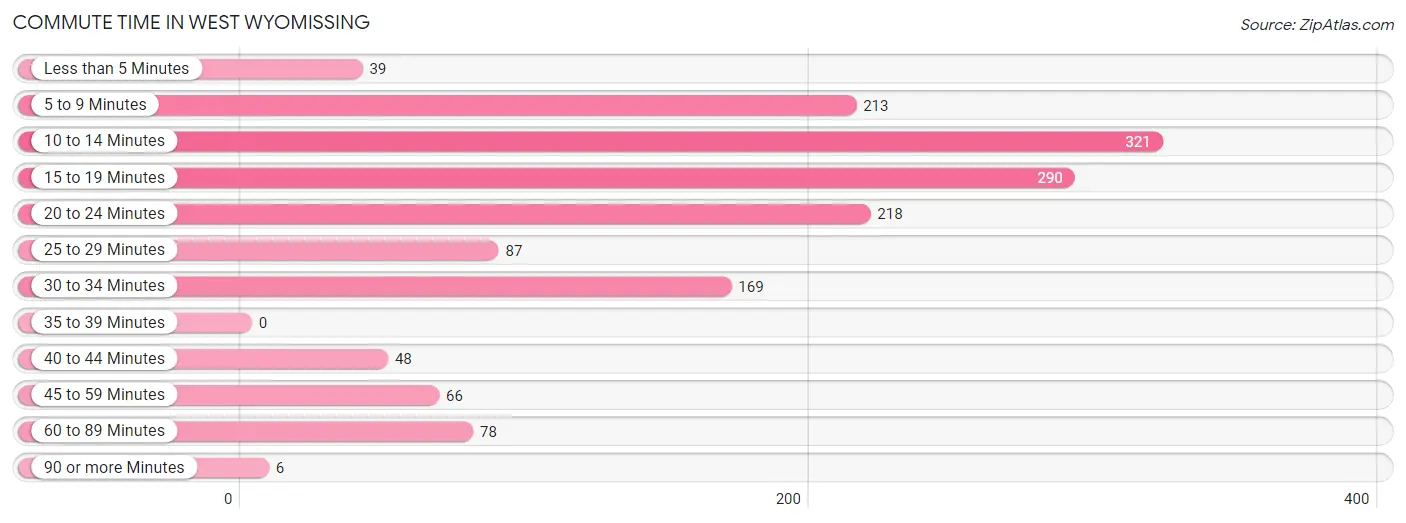
| Commute Time | # Commuters | % Commuters |
| Less than 5 Minutes | 39 | 2.5% |
| 5 to 9 Minutes | 213 | 13.9% |
| 10 to 14 Minutes | 321 | 20.9% |
| 15 to 19 Minutes | 290 | 18.9% |
| 20 to 24 Minutes | 218 | 14.2% |
| 25 to 29 Minutes | 87 | 5.7% |
| 30 to 34 Minutes | 169 | 11.0% |
| 35 to 39 Minutes | 0 | 0.0% |
| 40 to 44 Minutes | 48 | 3.1% |
| 45 to 59 Minutes | 66 | 4.3% |
| 60 to 89 Minutes | 78 | 5.1% |
| 90 or more Minutes | 6 | 0.4% |
Commute Time by Sex in West Wyomissing
The most common commute times in West Wyomissing are 10 to 14 minutes (227 commuters, 28.9%) for males and 20 to 24 minutes (150 commuters, 20.0%) for females.
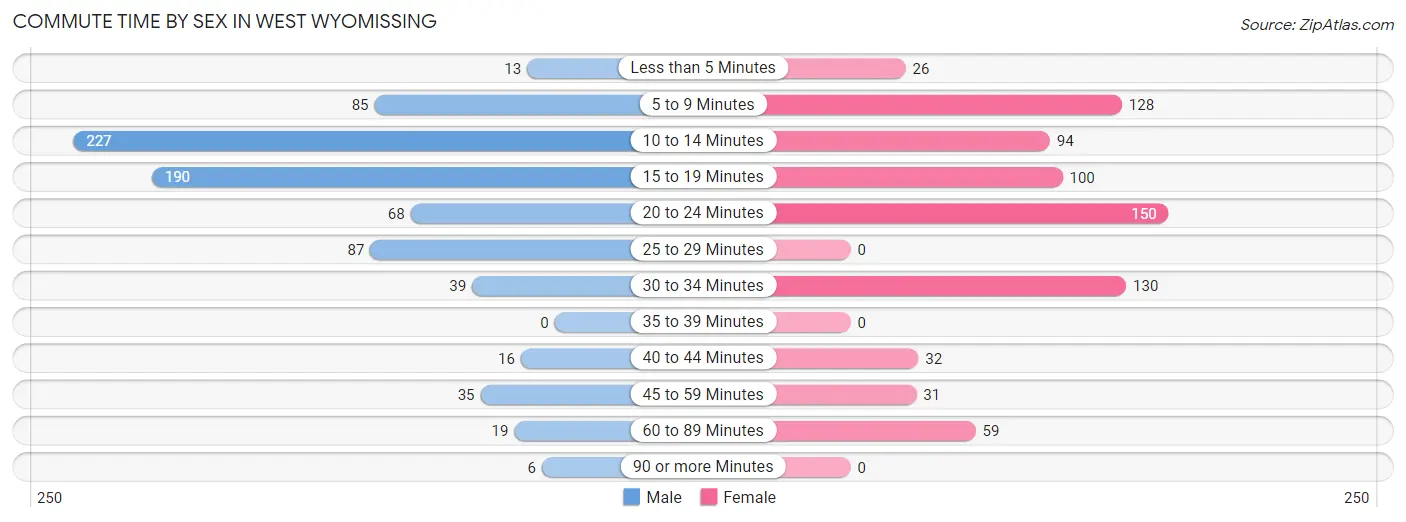
| Commute Time | Male | Female |
| Less than 5 Minutes | 13 (1.7%) | 26 (3.5%) |
| 5 to 9 Minutes | 85 (10.8%) | 128 (17.1%) |
| 10 to 14 Minutes | 227 (28.9%) | 94 (12.5%) |
| 15 to 19 Minutes | 190 (24.2%) | 100 (13.3%) |
| 20 to 24 Minutes | 68 (8.7%) | 150 (20.0%) |
| 25 to 29 Minutes | 87 (11.1%) | 0 (0.0%) |
| 30 to 34 Minutes | 39 (5.0%) | 130 (17.3%) |
| 35 to 39 Minutes | 0 (0.0%) | 0 (0.0%) |
| 40 to 44 Minutes | 16 (2.0%) | 32 (4.3%) |
| 45 to 59 Minutes | 35 (4.5%) | 31 (4.1%) |
| 60 to 89 Minutes | 19 (2.4%) | 59 (7.9%) |
| 90 or more Minutes | 6 (0.8%) | 0 (0.0%) |
Time of Departure to Work by Sex in West Wyomissing
The most frequent times of departure to work in West Wyomissing are 6:30 AM to 6:59 AM (141, 18.0%) for males and 7:30 AM to 7:59 AM (143, 19.1%) for females.
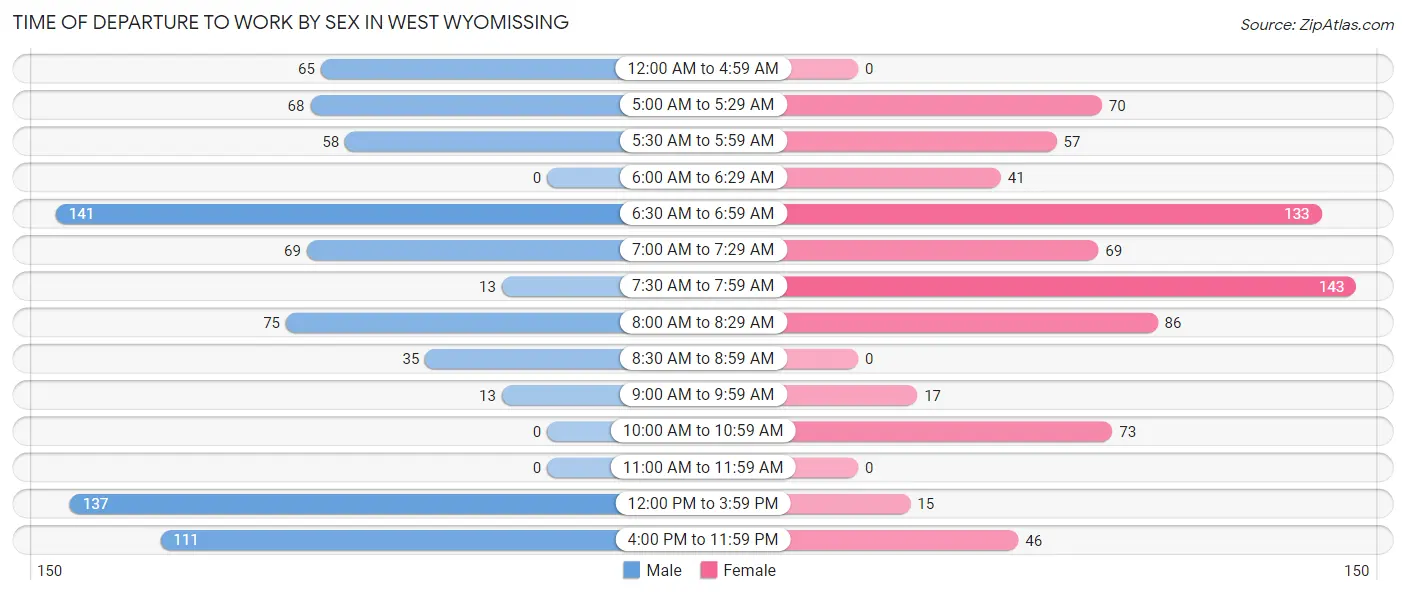
| Time of Departure | Male | Female |
| 12:00 AM to 4:59 AM | 65 (8.3%) | 0 (0.0%) |
| 5:00 AM to 5:29 AM | 68 (8.7%) | 70 (9.3%) |
| 5:30 AM to 5:59 AM | 58 (7.4%) | 57 (7.6%) |
| 6:00 AM to 6:29 AM | 0 (0.0%) | 41 (5.5%) |
| 6:30 AM to 6:59 AM | 141 (18.0%) | 133 (17.7%) |
| 7:00 AM to 7:29 AM | 69 (8.8%) | 69 (9.2%) |
| 7:30 AM to 7:59 AM | 13 (1.7%) | 143 (19.1%) |
| 8:00 AM to 8:29 AM | 75 (9.6%) | 86 (11.5%) |
| 8:30 AM to 8:59 AM | 35 (4.5%) | 0 (0.0%) |
| 9:00 AM to 9:59 AM | 13 (1.7%) | 17 (2.3%) |
| 10:00 AM to 10:59 AM | 0 (0.0%) | 73 (9.7%) |
| 11:00 AM to 11:59 AM | 0 (0.0%) | 0 (0.0%) |
| 12:00 PM to 3:59 PM | 137 (17.4%) | 15 (2.0%) |
| 4:00 PM to 11:59 PM | 111 (14.1%) | 46 (6.1%) |
| Total | 785 (100.0%) | 750 (100.0%) |
Housing Occupancy in West Wyomissing
Occupancy by Ownership in West Wyomissing
Of the total 1,394 dwellings in West Wyomissing, owner-occupied units account for 1,109 (79.6%), while renter-occupied units make up 285 (20.4%).
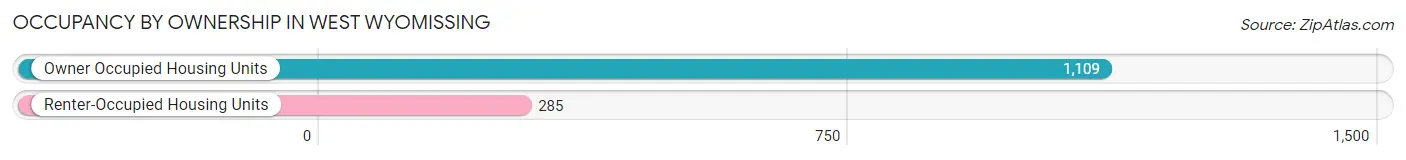
| Occupancy | # Housing Units | % Housing Units |
| Owner Occupied Housing Units | 1,109 | 79.6% |
| Renter-Occupied Housing Units | 285 | 20.4% |
| Total Occupied Housing Units | 1,394 | 100.0% |
Occupancy by Household Size in West Wyomissing
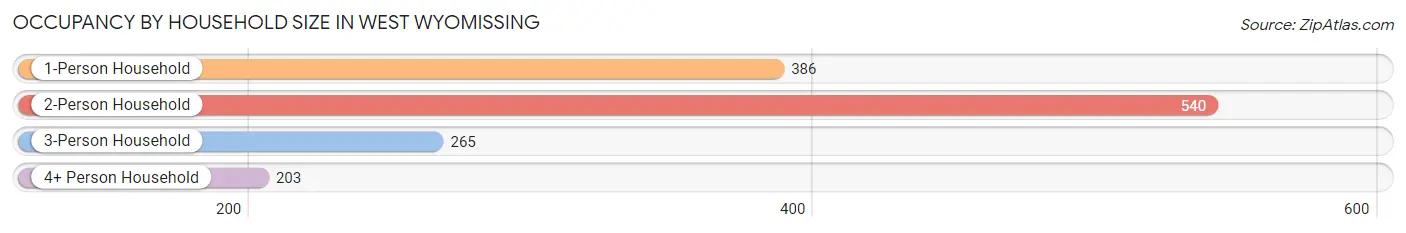
| Household Size | # Housing Units | % Housing Units |
| 1-Person Household | 386 | 27.7% |
| 2-Person Household | 540 | 38.7% |
| 3-Person Household | 265 | 19.0% |
| 4+ Person Household | 203 | 14.6% |
| Total Housing Units | 1,394 | 100.0% |
Occupancy by Ownership by Household Size in West Wyomissing
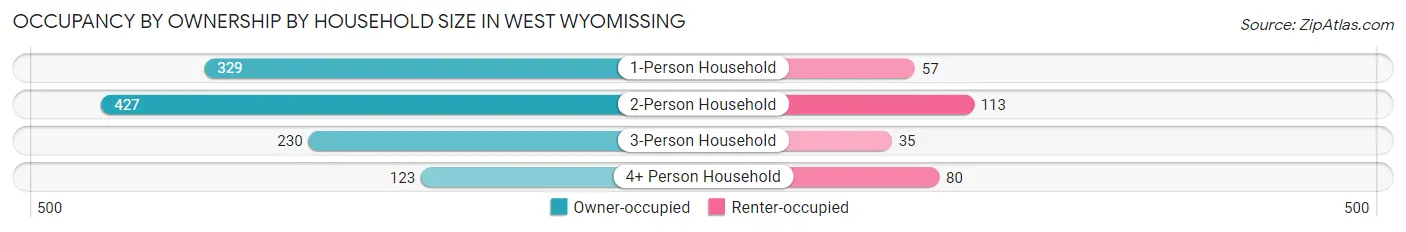
| Household Size | Owner-occupied | Renter-occupied |
| 1-Person Household | 329 (85.2%) | 57 (14.8%) |
| 2-Person Household | 427 (79.1%) | 113 (20.9%) |
| 3-Person Household | 230 (86.8%) | 35 (13.2%) |
| 4+ Person Household | 123 (60.6%) | 80 (39.4%) |
| Total Housing Units | 1,109 (79.6%) | 285 (20.4%) |
Occupancy by Educational Attainment in West Wyomissing
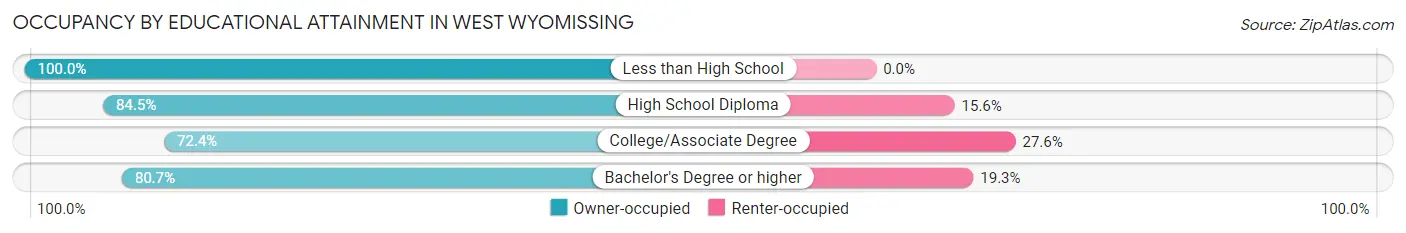
| Household Size | Owner-occupied | Renter-occupied |
| Less than High School | 69 (100.0%) | 0 (0.0%) |
| High School Diploma | 391 (84.5%) | 72 (15.5%) |
| College/Associate Degree | 406 (72.4%) | 155 (27.6%) |
| Bachelor's Degree or higher | 243 (80.7%) | 58 (19.3%) |
Occupancy by Age of Householder in West Wyomissing
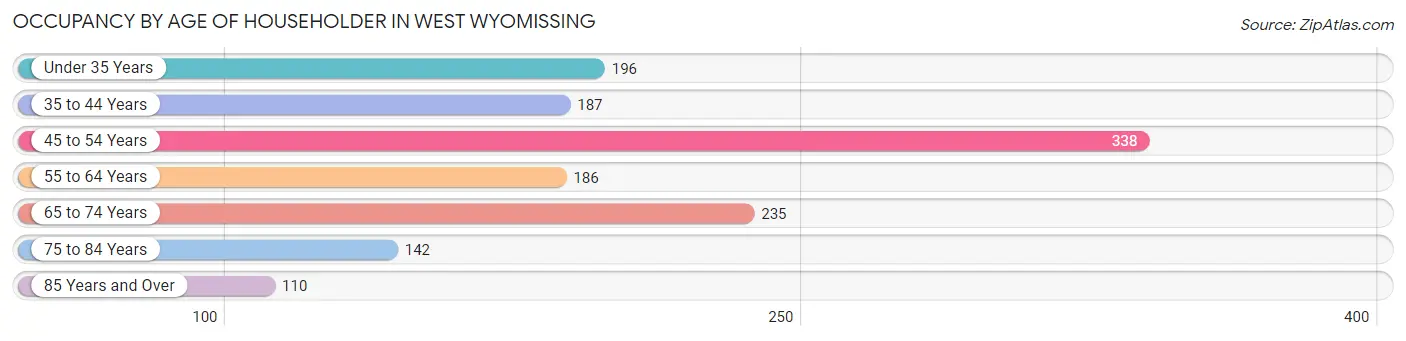
| Age Bracket | # Households | % Households |
| Under 35 Years | 196 | 14.1% |
| 35 to 44 Years | 187 | 13.4% |
| 45 to 54 Years | 338 | 24.2% |
| 55 to 64 Years | 186 | 13.3% |
| 65 to 74 Years | 235 | 16.9% |
| 75 to 84 Years | 142 | 10.2% |
| 85 Years and Over | 110 | 7.9% |
| Total | 1,394 | 100.0% |
Housing Finances in West Wyomissing
Median Income by Occupancy in West Wyomissing
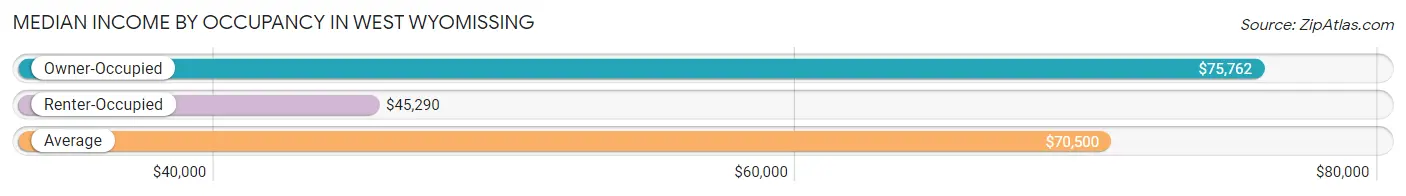
| Occupancy Type | # Households | Median Income |
| Owner-Occupied | 1,109 (79.6%) | $75,762 |
| Renter-Occupied | 285 (20.4%) | $45,290 |
| Average | 1,394 (100.0%) | $70,500 |
Occupancy by Householder Income Bracket in West Wyomissing
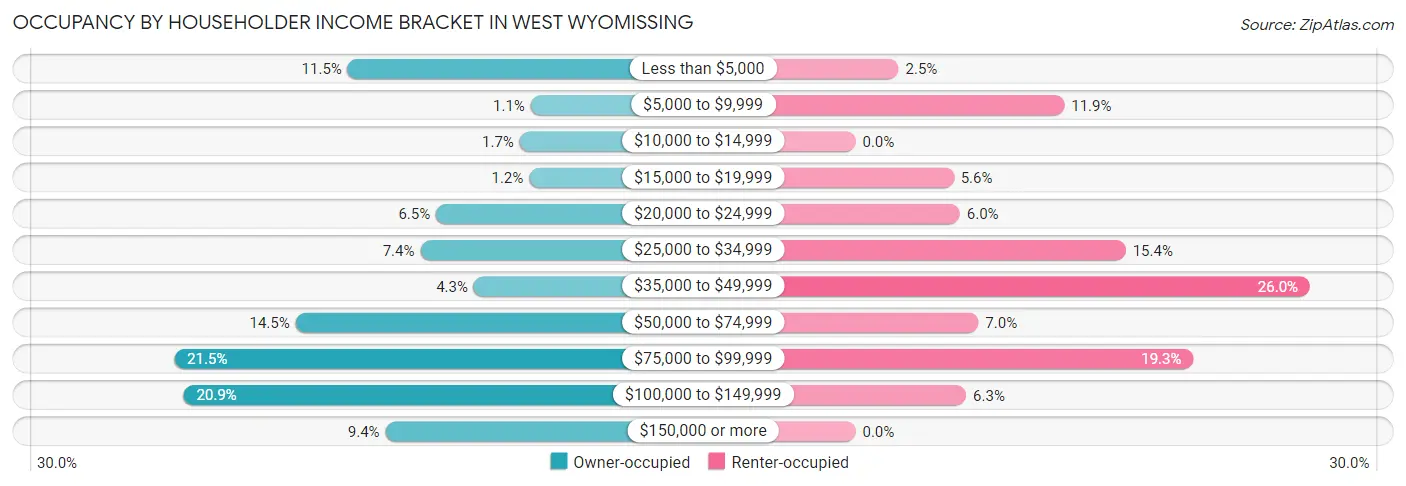
| Income Bracket | Owner-occupied | Renter-occupied |
| Less than $5,000 | 128 (11.5%) | 7 (2.5%) |
| $5,000 to $9,999 | 12 (1.1%) | 34 (11.9%) |
| $10,000 to $14,999 | 19 (1.7%) | 0 (0.0%) |
| $15,000 to $19,999 | 13 (1.2%) | 16 (5.6%) |
| $20,000 to $24,999 | 72 (6.5%) | 17 (6.0%) |
| $25,000 to $34,999 | 82 (7.4%) | 44 (15.4%) |
| $35,000 to $49,999 | 48 (4.3%) | 74 (26.0%) |
| $50,000 to $74,999 | 161 (14.5%) | 20 (7.0%) |
| $75,000 to $99,999 | 238 (21.5%) | 55 (19.3%) |
| $100,000 to $149,999 | 232 (20.9%) | 18 (6.3%) |
| $150,000 or more | 104 (9.4%) | 0 (0.0%) |
| Total | 1,109 (100.0%) | 285 (100.0%) |
Monthly Housing Cost Tiers in West Wyomissing
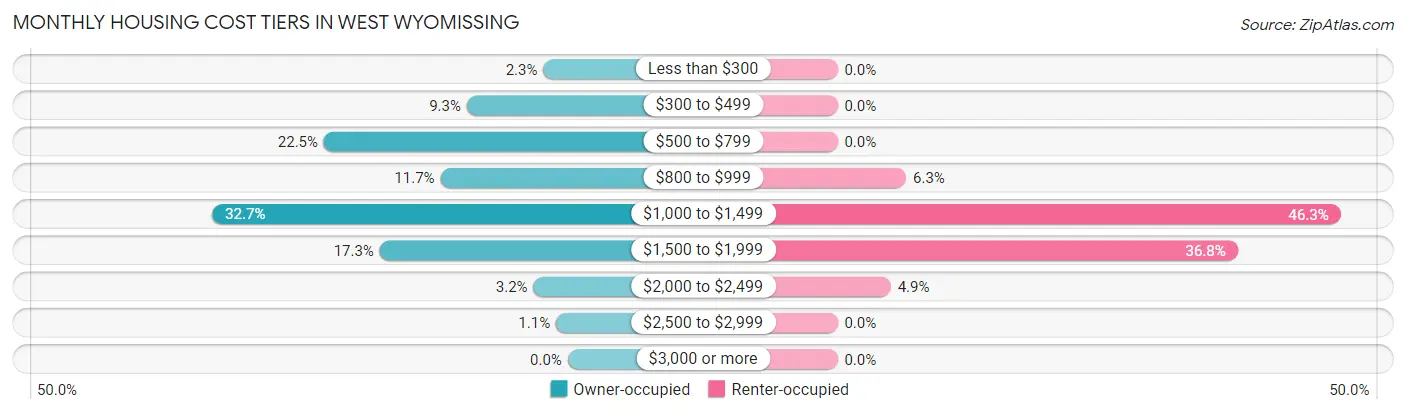
| Monthly Cost | Owner-occupied | Renter-occupied |
| Less than $300 | 25 (2.2%) | 0 (0.0%) |
| $300 to $499 | 103 (9.3%) | 0 (0.0%) |
| $500 to $799 | 249 (22.5%) | 0 (0.0%) |
| $800 to $999 | 130 (11.7%) | 18 (6.3%) |
| $1,000 to $1,499 | 363 (32.7%) | 132 (46.3%) |
| $1,500 to $1,999 | 192 (17.3%) | 105 (36.8%) |
| $2,000 to $2,499 | 35 (3.2%) | 14 (4.9%) |
| $2,500 to $2,999 | 12 (1.1%) | 0 (0.0%) |
| $3,000 or more | 0 (0.0%) | 0 (0.0%) |
| Total | 1,109 (100.0%) | 285 (100.0%) |
Physical Housing Characteristics in West Wyomissing
Housing Structures in West Wyomissing
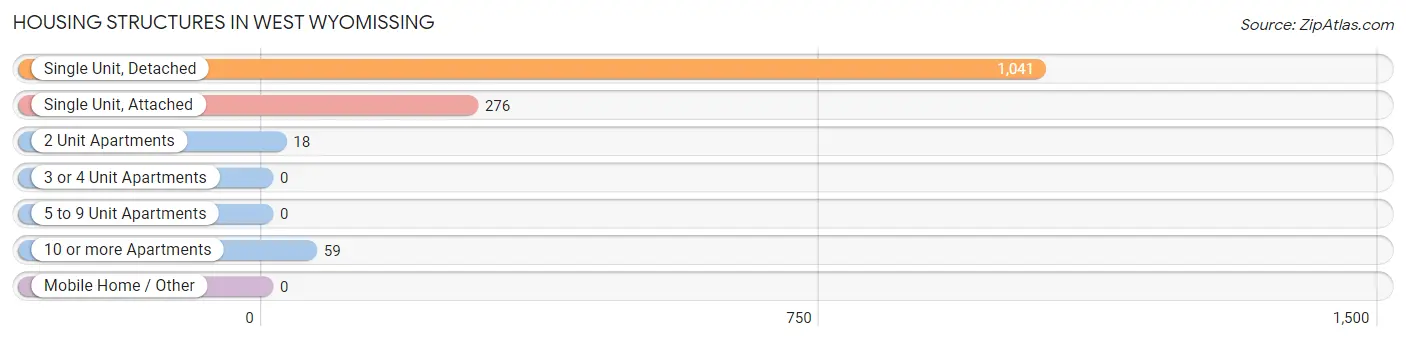
| Structure Type | # Housing Units | % Housing Units |
| Single Unit, Detached | 1,041 | 74.7% |
| Single Unit, Attached | 276 | 19.8% |
| 2 Unit Apartments | 18 | 1.3% |
| 3 or 4 Unit Apartments | 0 | 0.0% |
| 5 to 9 Unit Apartments | 0 | 0.0% |
| 10 or more Apartments | 59 | 4.2% |
| Mobile Home / Other | 0 | 0.0% |
| Total | 1,394 | 100.0% |
Housing Structures by Occupancy in West Wyomissing
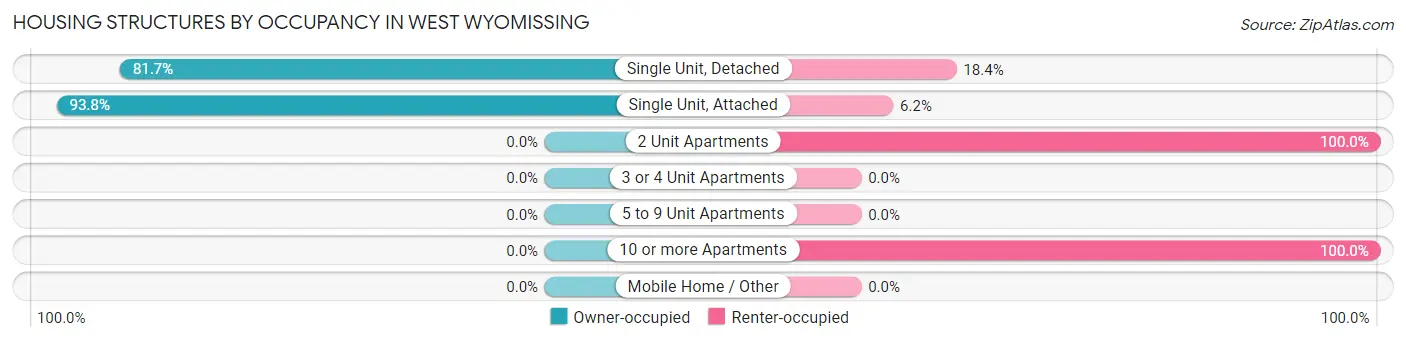
| Structure Type | Owner-occupied | Renter-occupied |
| Single Unit, Detached | 850 (81.7%) | 191 (18.3%) |
| Single Unit, Attached | 259 (93.8%) | 17 (6.2%) |
| 2 Unit Apartments | 0 (0.0%) | 18 (100.0%) |
| 3 or 4 Unit Apartments | 0 (0.0%) | 0 (0.0%) |
| 5 to 9 Unit Apartments | 0 (0.0%) | 0 (0.0%) |
| 10 or more Apartments | 0 (0.0%) | 59 (100.0%) |
| Mobile Home / Other | 0 (0.0%) | 0 (0.0%) |
| Total | 1,109 (79.6%) | 285 (20.4%) |
Housing Structures by Number of Rooms in West Wyomissing
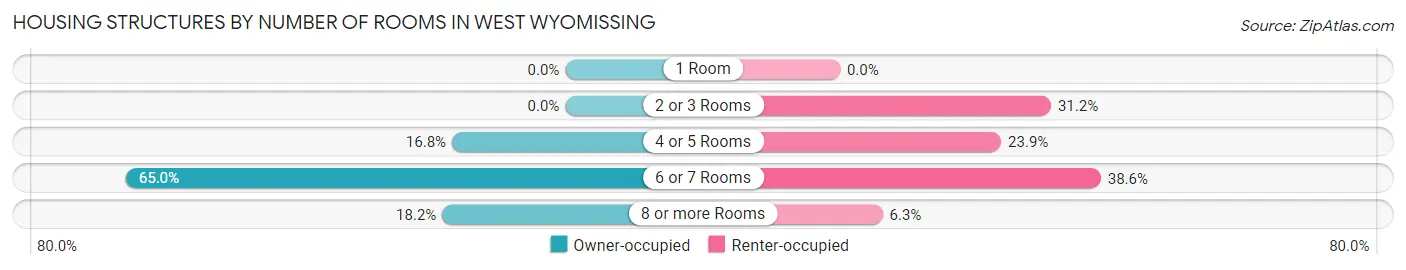
| Number of Rooms | Owner-occupied | Renter-occupied |
| 1 Room | 0 (0.0%) | 0 (0.0%) |
| 2 or 3 Rooms | 0 (0.0%) | 89 (31.2%) |
| 4 or 5 Rooms | 186 (16.8%) | 68 (23.9%) |
| 6 or 7 Rooms | 721 (65.0%) | 110 (38.6%) |
| 8 or more Rooms | 202 (18.2%) | 18 (6.3%) |
| Total | 1,109 (100.0%) | 285 (100.0%) |
Housing Structure by Heating Type in West Wyomissing
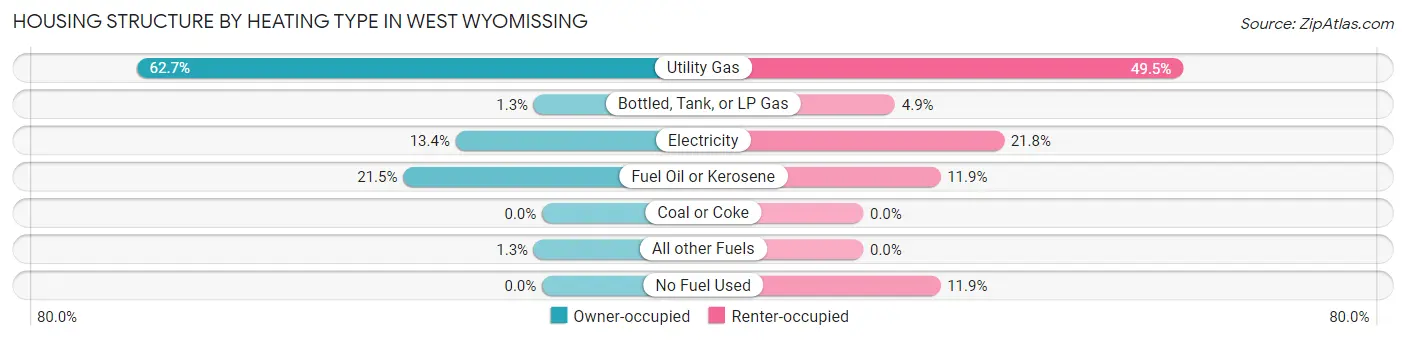
| Heating Type | Owner-occupied | Renter-occupied |
| Utility Gas | 695 (62.7%) | 141 (49.5%) |
| Bottled, Tank, or LP Gas | 14 (1.3%) | 14 (4.9%) |
| Electricity | 148 (13.4%) | 62 (21.7%) |
| Fuel Oil or Kerosene | 238 (21.5%) | 34 (11.9%) |
| Coal or Coke | 0 (0.0%) | 0 (0.0%) |
| All other Fuels | 14 (1.3%) | 0 (0.0%) |
| No Fuel Used | 0 (0.0%) | 34 (11.9%) |
| Total | 1,109 (100.0%) | 285 (100.0%) |
Household Vehicle Usage in West Wyomissing
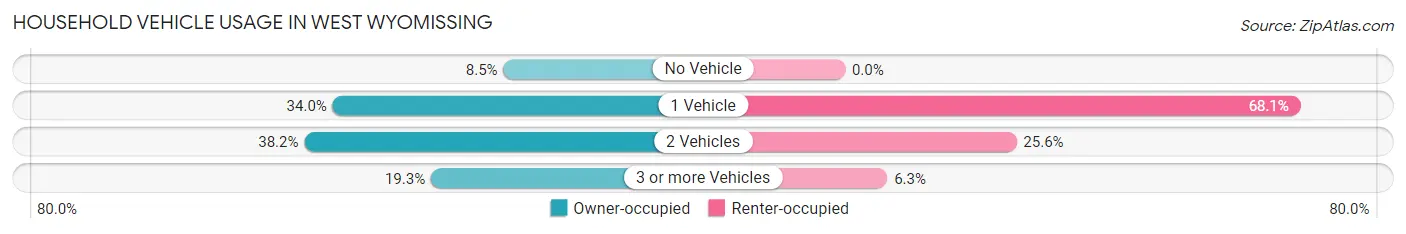
| Vehicles per Household | Owner-occupied | Renter-occupied |
| No Vehicle | 94 (8.5%) | 0 (0.0%) |
| 1 Vehicle | 377 (34.0%) | 194 (68.1%) |
| 2 Vehicles | 424 (38.2%) | 73 (25.6%) |
| 3 or more Vehicles | 214 (19.3%) | 18 (6.3%) |
| Total | 1,109 (100.0%) | 285 (100.0%) |
Real Estate & Mortgages in West Wyomissing
Real Estate and Mortgage Overview in West Wyomissing
| Characteristic | Without Mortgage | With Mortgage |
| Housing Units | 353 | 756 |
| Median Property Value | $172,800 | $168,700 |
| Median Household Income | $50,362 | $83 |
| Monthly Housing Costs | $576 | $0 |
| Real Estate Taxes | $3,523 | $0 |
Property Value by Mortgage Status in West Wyomissing
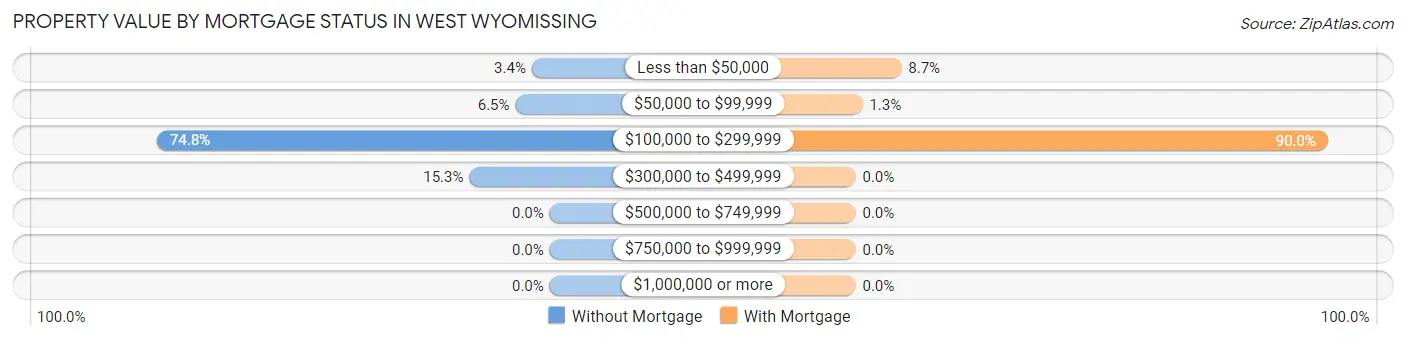
| Property Value | Without Mortgage | With Mortgage |
| Less than $50,000 | 12 (3.4%) | 66 (8.7%) |
| $50,000 to $99,999 | 23 (6.5%) | 10 (1.3%) |
| $100,000 to $299,999 | 264 (74.8%) | 680 (89.9%) |
| $300,000 to $499,999 | 54 (15.3%) | 0 (0.0%) |
| $500,000 to $749,999 | 0 (0.0%) | 0 (0.0%) |
| $750,000 to $999,999 | 0 (0.0%) | 0 (0.0%) |
| $1,000,000 or more | 0 (0.0%) | 0 (0.0%) |
| Total | 353 (100.0%) | 756 (100.0%) |
Household Income by Mortgage Status in West Wyomissing
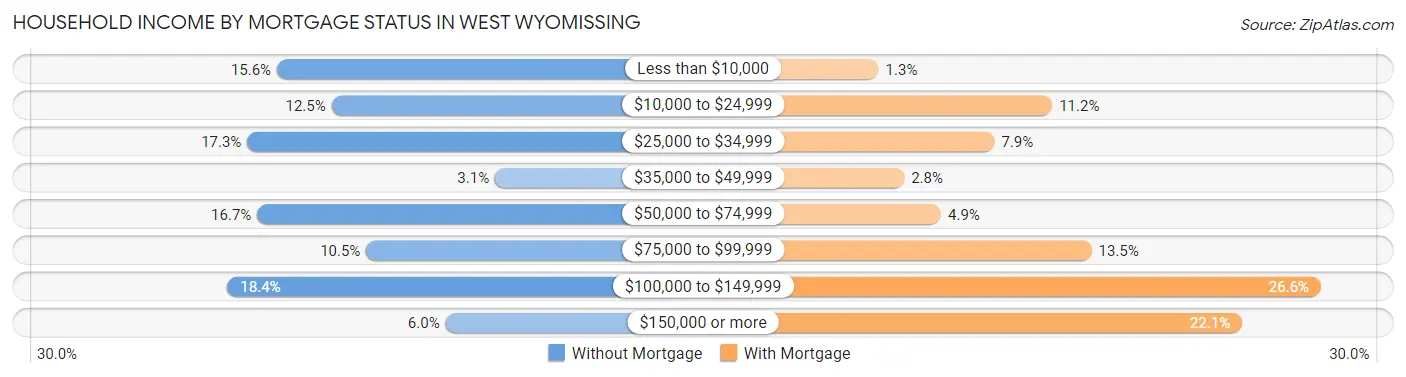
| Household Income | Without Mortgage | With Mortgage |
| Less than $10,000 | 55 (15.6%) | 10 (1.3%) |
| $10,000 to $24,999 | 44 (12.5%) | 85 (11.2%) |
| $25,000 to $34,999 | 61 (17.3%) | 60 (7.9%) |
| $35,000 to $49,999 | 11 (3.1%) | 21 (2.8%) |
| $50,000 to $74,999 | 59 (16.7%) | 37 (4.9%) |
| $75,000 to $99,999 | 37 (10.5%) | 102 (13.5%) |
| $100,000 to $149,999 | 65 (18.4%) | 201 (26.6%) |
| $150,000 or more | 21 (5.9%) | 167 (22.1%) |
| Total | 353 (100.0%) | 756 (100.0%) |
Property Value to Household Income Ratio in West Wyomissing
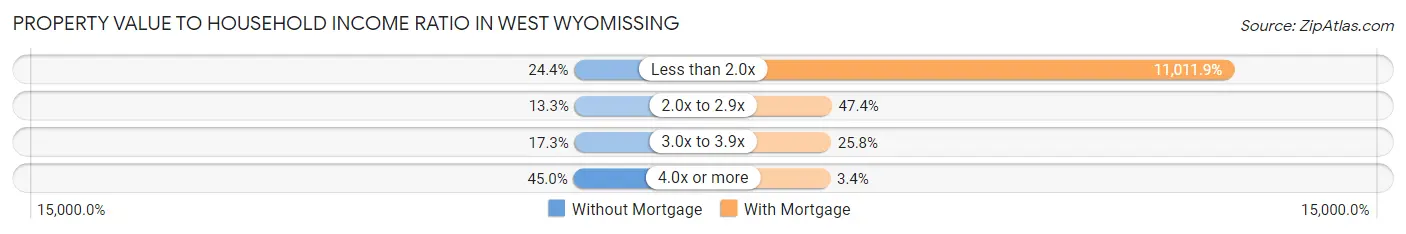
| Value-to-Income Ratio | Without Mortgage | With Mortgage |
| Less than 2.0x | 86 (24.4%) | 83,250 (11,011.9%) |
| 2.0x to 2.9x | 47 (13.3%) | 358 (47.3%) |
| 3.0x to 3.9x | 61 (17.3%) | 195 (25.8%) |
| 4.0x or more | 159 (45.0%) | 26 (3.4%) |
| Total | 353 (100.0%) | 756 (100.0%) |
Real Estate Taxes by Mortgage Status in West Wyomissing
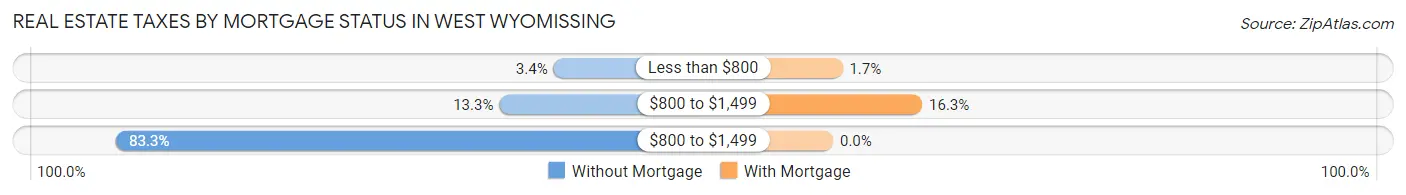
| Property Taxes | Without Mortgage | With Mortgage |
| Less than $800 | 12 (3.4%) | 13 (1.7%) |
| $800 to $1,499 | 47 (13.3%) | 123 (16.3%) |
| $800 to $1,499 | 294 (83.3%) | 0 (0.0%) |
| Total | 353 (100.0%) | 756 (100.0%) |
Health & Disability in West Wyomissing
Health Insurance Coverage by Age in West Wyomissing
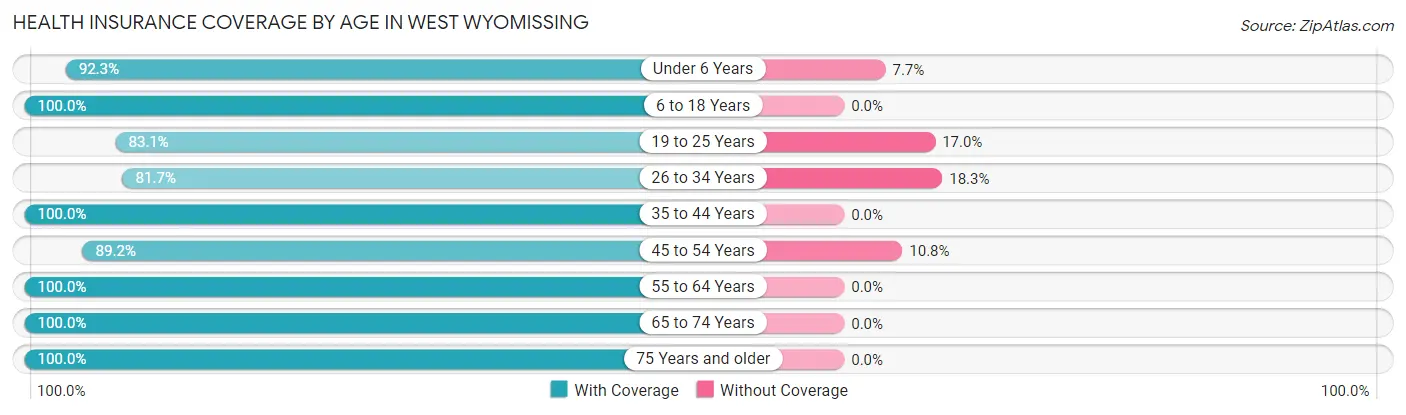
| Age Bracket | With Coverage | Without Coverage |
| Under 6 Years | 144 (92.3%) | 12 (7.7%) |
| 6 to 18 Years | 470 (100.0%) | 0 (0.0%) |
| 19 to 25 Years | 289 (83.1%) | 59 (17.0%) |
| 26 to 34 Years | 295 (81.7%) | 66 (18.3%) |
| 35 to 44 Years | 294 (100.0%) | 0 (0.0%) |
| 45 to 54 Years | 461 (89.2%) | 56 (10.8%) |
| 55 to 64 Years | 284 (100.0%) | 0 (0.0%) |
| 65 to 74 Years | 483 (100.0%) | 0 (0.0%) |
| 75 Years and older | 354 (100.0%) | 0 (0.0%) |
| Total | 3,074 (94.1%) | 193 (5.9%) |
Health Insurance Coverage by Citizenship Status in West Wyomissing
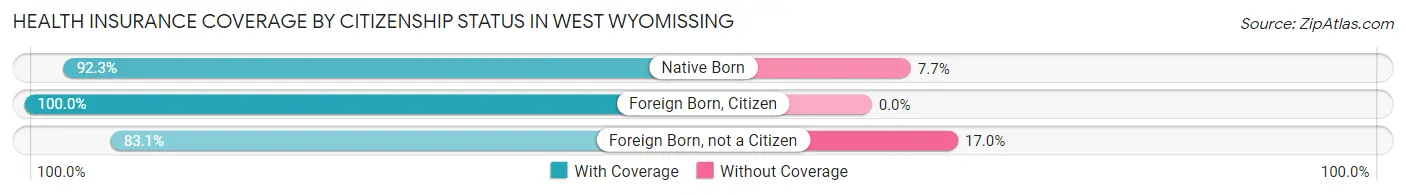
| Citizenship Status | With Coverage | Without Coverage |
| Native Born | 144 (92.3%) | 12 (7.7%) |
| Foreign Born, Citizen | 470 (100.0%) | 0 (0.0%) |
| Foreign Born, not a Citizen | 289 (83.1%) | 59 (17.0%) |
Health Insurance Coverage by Household Income in West Wyomissing
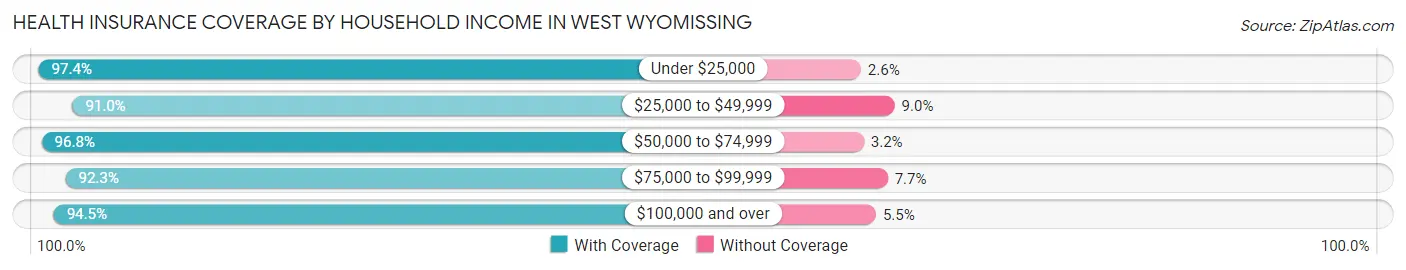
| Household Income | With Coverage | Without Coverage |
| Under $25,000 | 480 (97.4%) | 13 (2.6%) |
| $25,000 to $49,999 | 568 (91.0%) | 56 (9.0%) |
| $50,000 to $74,999 | 363 (96.8%) | 12 (3.2%) |
| $75,000 to $99,999 | 638 (92.3%) | 53 (7.7%) |
| $100,000 and over | 1,020 (94.5%) | 59 (5.5%) |
Public vs Private Health Insurance Coverage by Age in West Wyomissing
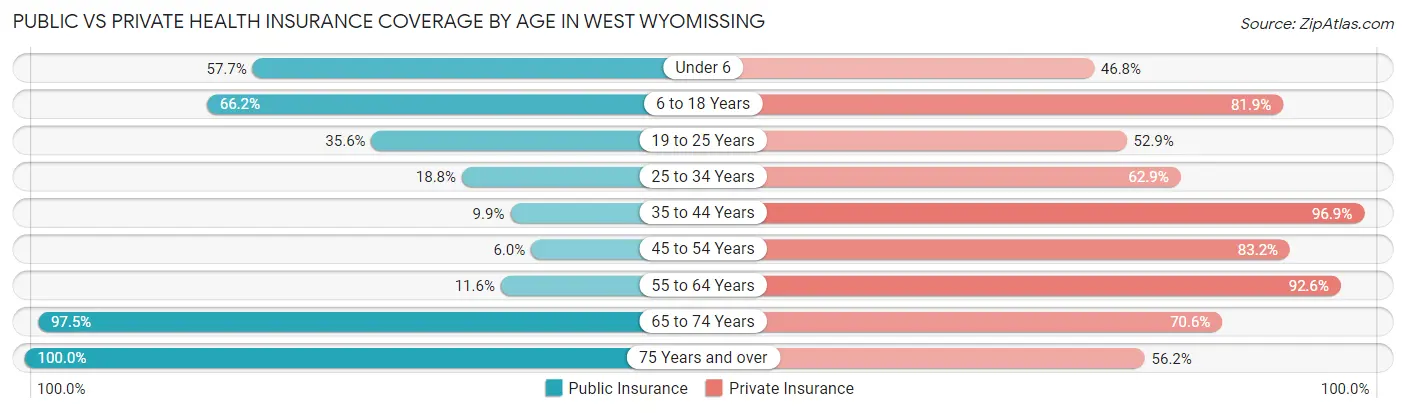
| Age Bracket | Public Insurance | Private Insurance |
| Under 6 | 90 (57.7%) | 73 (46.8%) |
| 6 to 18 Years | 311 (66.2%) | 385 (81.9%) |
| 19 to 25 Years | 124 (35.6%) | 184 (52.9%) |
| 25 to 34 Years | 68 (18.8%) | 227 (62.9%) |
| 35 to 44 Years | 29 (9.9%) | 285 (96.9%) |
| 45 to 54 Years | 31 (6.0%) | 430 (83.2%) |
| 55 to 64 Years | 33 (11.6%) | 263 (92.6%) |
| 65 to 74 Years | 471 (97.5%) | 341 (70.6%) |
| 75 Years and over | 354 (100.0%) | 199 (56.2%) |
| Total | 1,511 (46.3%) | 2,387 (73.1%) |
Disability Status by Sex by Age in West Wyomissing
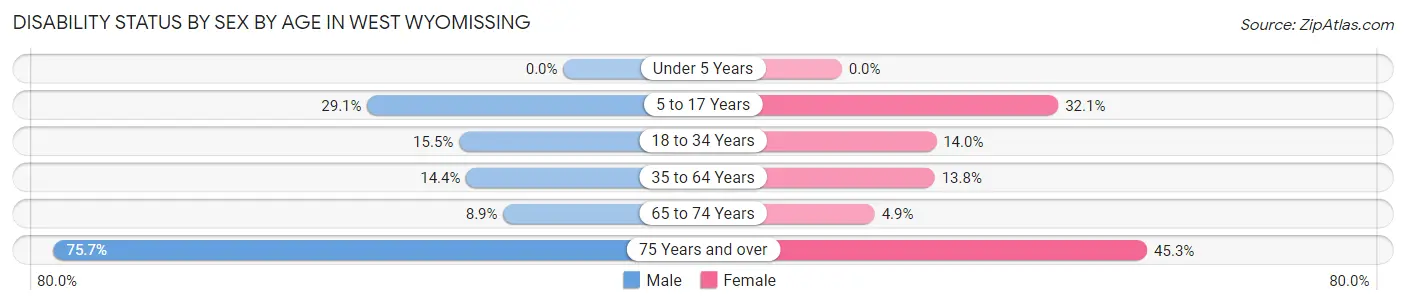
| Age Bracket | Male | Female |
| Under 5 Years | 0 (0.0%) | 0 (0.0%) |
| 5 to 17 Years | 94 (29.1%) | 63 (32.1%) |
| 18 to 34 Years | 54 (15.5%) | 53 (14.0%) |
| 35 to 64 Years | 69 (14.4%) | 85 (13.8%) |
| 65 to 74 Years | 23 (8.9%) | 11 (4.9%) |
| 75 Years and over | 81 (75.7%) | 112 (45.3%) |
Disability Class by Sex by Age in West Wyomissing
Disability Class: Hearing Difficulty
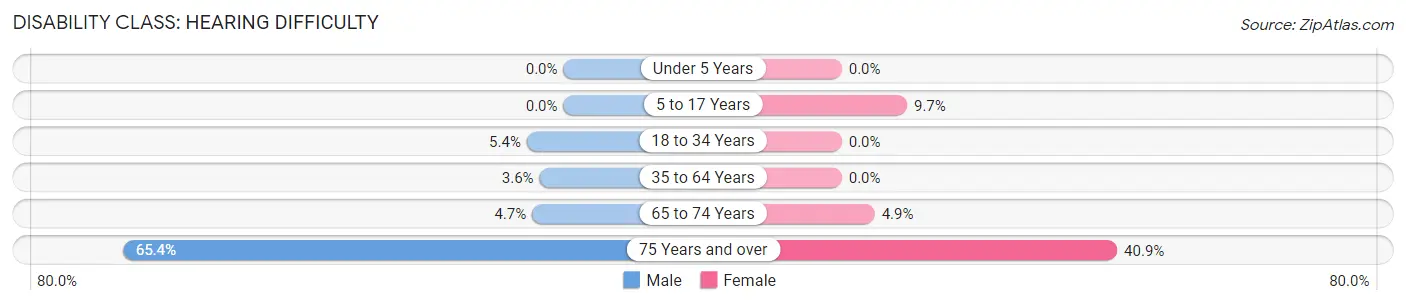
| Age Bracket | Male | Female |
| Under 5 Years | 0 (0.0%) | 0 (0.0%) |
| 5 to 17 Years | 0 (0.0%) | 19 (9.7%) |
| 18 to 34 Years | 19 (5.4%) | 0 (0.0%) |
| 35 to 64 Years | 17 (3.5%) | 0 (0.0%) |
| 65 to 74 Years | 12 (4.6%) | 11 (4.9%) |
| 75 Years and over | 70 (65.4%) | 101 (40.9%) |
Disability Class: Vision Difficulty
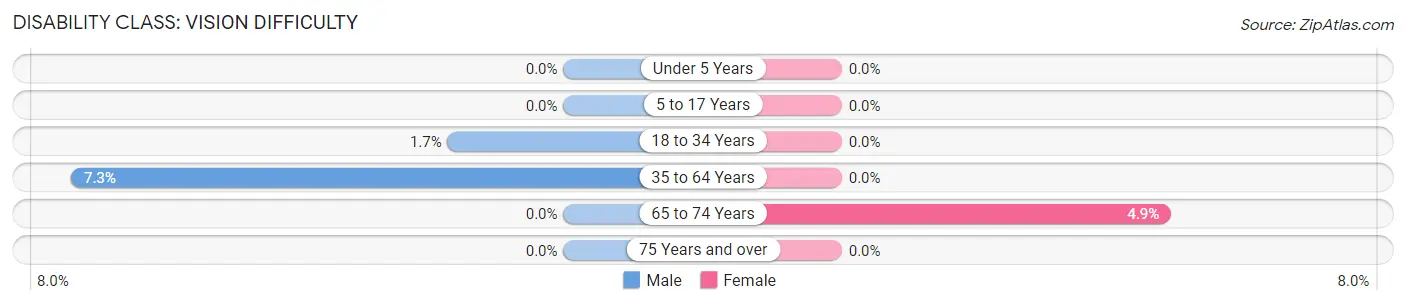
| Age Bracket | Male | Female |
| Under 5 Years | 0 (0.0%) | 0 (0.0%) |
| 5 to 17 Years | 0 (0.0%) | 0 (0.0%) |
| 18 to 34 Years | 6 (1.7%) | 0 (0.0%) |
| 35 to 64 Years | 35 (7.3%) | 0 (0.0%) |
| 65 to 74 Years | 0 (0.0%) | 11 (4.9%) |
| 75 Years and over | 0 (0.0%) | 0 (0.0%) |
Disability Class: Cognitive Difficulty
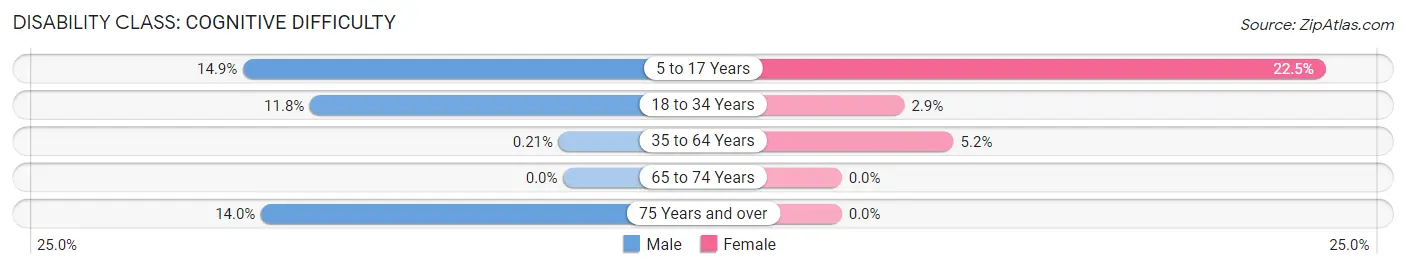
| Age Bracket | Male | Female |
| 5 to 17 Years | 48 (14.9%) | 44 (22.5%) |
| 18 to 34 Years | 41 (11.7%) | 11 (2.9%) |
| 35 to 64 Years | 1 (0.2%) | 32 (5.2%) |
| 65 to 74 Years | 0 (0.0%) | 0 (0.0%) |
| 75 Years and over | 15 (14.0%) | 0 (0.0%) |
Disability Class: Ambulatory Difficulty
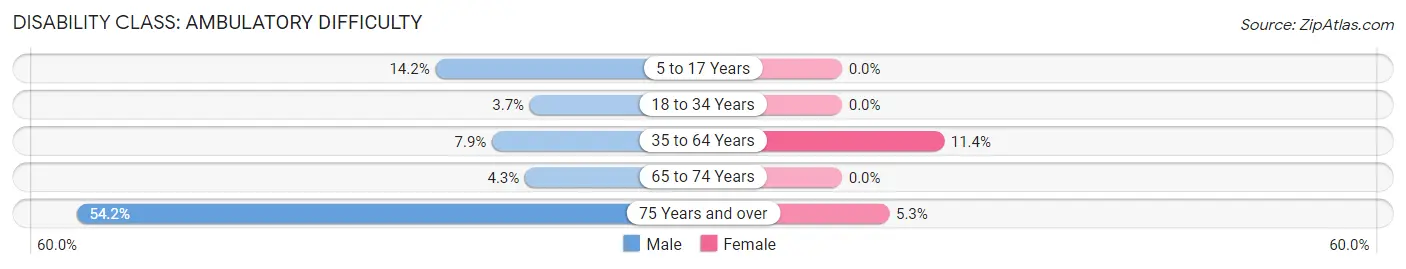
| Age Bracket | Male | Female |
| 5 to 17 Years | 46 (14.2%) | 0 (0.0%) |
| 18 to 34 Years | 13 (3.7%) | 0 (0.0%) |
| 35 to 64 Years | 38 (7.9%) | 70 (11.4%) |
| 65 to 74 Years | 11 (4.3%) | 0 (0.0%) |
| 75 Years and over | 58 (54.2%) | 13 (5.3%) |
Disability Class: Self-Care Difficulty
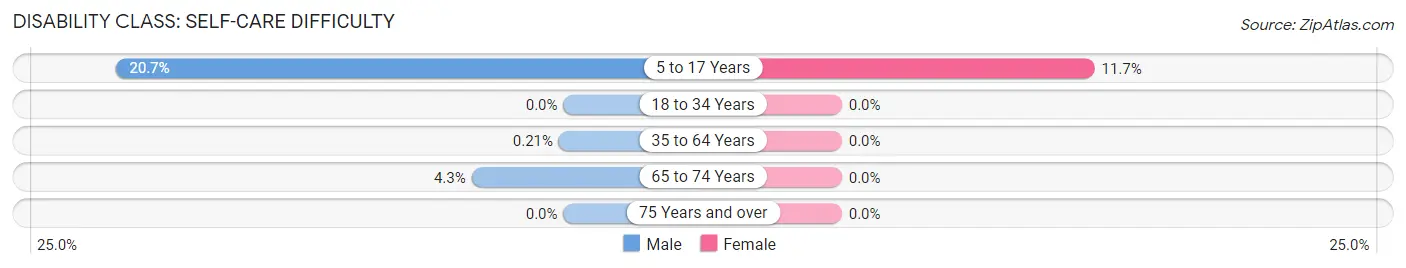
| Age Bracket | Male | Female |
| 5 to 17 Years | 67 (20.7%) | 23 (11.7%) |
| 18 to 34 Years | 0 (0.0%) | 0 (0.0%) |
| 35 to 64 Years | 1 (0.2%) | 0 (0.0%) |
| 65 to 74 Years | 11 (4.3%) | 0 (0.0%) |
| 75 Years and over | 0 (0.0%) | 0 (0.0%) |
Technology Access in West Wyomissing
Computing Device Access in West Wyomissing
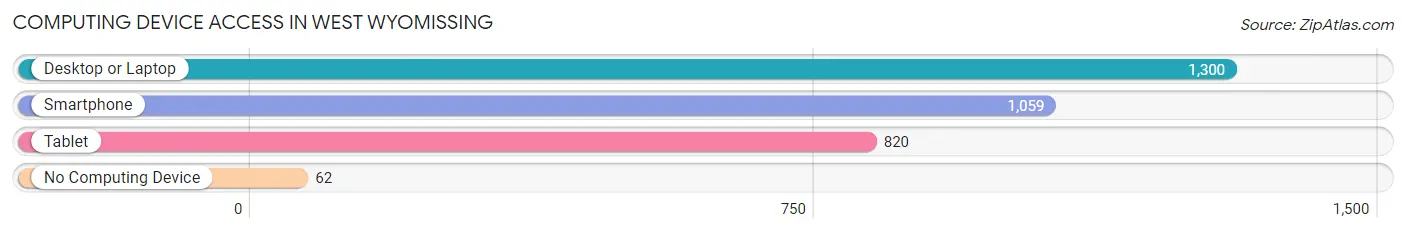
| Device Type | # Households | % Households |
| Desktop or Laptop | 1,300 | 93.3% |
| Smartphone | 1,059 | 76.0% |
| Tablet | 820 | 58.8% |
| No Computing Device | 62 | 4.4% |
| Total | 1,394 | 100.0% |
Internet Access in West Wyomissing
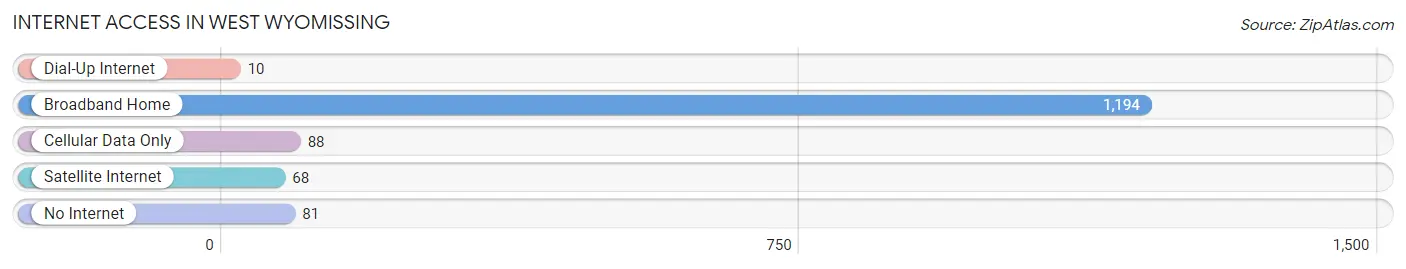
| Internet Type | # Households | % Households |
| Dial-Up Internet | 10 | 0.7% |
| Broadband Home | 1,194 | 85.7% |
| Cellular Data Only | 88 | 6.3% |
| Satellite Internet | 68 | 4.9% |
| No Internet | 81 | 5.8% |
| Total | 1,394 | 100.0% |
West Wyomissing Summary
Wyomissing is a borough located in Berks County, Pennsylvania, United States. It is located in the southeastern part of the state, about 10 miles (16 km) west of Reading. The population was 10,461 at the 2010 census.
History
Wyomissing was founded in 1906 by the Reading Company, a railroad company that had been operating in the area since the mid-19th century. The company wanted to create a planned community that would be a model for other towns in the area. The town was named after the Wyomissing Creek, which runs through the area.
The town was designed to be a model community, with wide streets, parks, and a variety of housing options. The Reading Company also built a large factory in the town, which provided jobs for many of the residents.
The town grew rapidly in the early 20th century, and by the 1950s it had become a thriving suburb of Reading. The town was incorporated as a borough in 1951.
Geography
Wyomissing is located at 40°20'17" North, 75°59'45" West (40.338, -75.996). According to the United States Census Bureau, the borough has a total area of 4.2 square miles (10.8 km2), all of it land.
Economy
Wyomissing is home to a variety of businesses, including manufacturing, retail, and professional services. The largest employer in the borough is the Reading Company, which operates a large factory in the town. Other major employers include the Wyomissing Area School District, the Wyomissing Public Library, and the Wyomissing Institute of Technology.
Demographics
As of the census of 2000, there were 10,461 people, 4,541 households, and 2,845 families residing in the borough. The population density was 2,521.2 people per square mile (973.2/km2). There were 4,717 housing units at an average density of 1,133.2 per square mile (438.2/km2). The racial makeup of the borough was 94.2% White, 1.7% African American, 0.1% Native American, 2.7% Asian, 0.1% Pacific Islander, 0.4% from other races, and 0.9% from two or more races. Hispanic or Latino of any race were 1.3% of the population.
There were 4,541 households, out of which 25.7% had children under the age of 18 living with them, 51.2% were married couples living together, 8.7% had a female householder with no husband present, and 37.2% were non-families. 32.2% of all households were made up of individuals, and 14.2% had someone living alone who was 65 years of age or older. The average household size was 2.27 and the average family size was 2.90.
In the borough the population was spread out, with 20.3% under the age of 18, 6.2% from 18 to 24, 28.2% from 25 to 44, 24.2% from 45 to 64, and 21.1% who were 65 years of age or older. The median age was 42 years. For every 100 females, there were 87.2 males. For every 100 females age 18 and over, there were 83.3 males.
The median income for a household in the borough was $50,945, and the median income for a family was $63,917. Males had a median income of $45,945 versus $31,917 for females. The per capita income for the borough was $27,945. About 2.2% of families and 3.7% of the population were below the poverty line, including 3.3% of those under age 18 and 4.2% of those age 65 or over.
Common Questions
What is Per Capita Income in West Wyomissing?
Per Capita income in West Wyomissing is $31,390.
What is the Median Family Income in West Wyomissing?
Median Family Income in West Wyomissing is $77,051.
What is the Median Household income in West Wyomissing?
Median Household Income in West Wyomissing is $70,500.
What is Income or Wage Gap in West Wyomissing?
Income or Wage Gap in West Wyomissing is 0.6%.
Women in West Wyomissing earn 99.4 cents for every dollar earned by a man.
What is Inequality or Gini Index in West Wyomissing?
Inequality or Gini Index in West Wyomissing is 0.42.
What is the Total Population of West Wyomissing?
Total Population of West Wyomissing is 3,267.
What is the Total Male Population of West Wyomissing?
Total Male Population of West Wyomissing is 1,580.
What is the Total Female Population of West Wyomissing?
Total Female Population of West Wyomissing is 1,687.
What is the Ratio of Males per 100 Females in West Wyomissing?
There are 93.66 Males per 100 Females in West Wyomissing.
What is the Ratio of Females per 100 Males in West Wyomissing?
There are 106.77 Females per 100 Males in West Wyomissing.
What is the Median Population Age in West Wyomissing?
Median Population Age in West Wyomissing is 45.3 Years.
What is the Average Family Size in West Wyomissing
Average Family Size in West Wyomissing is 2.9 People.
What is the Average Household Size in West Wyomissing
Average Household Size in West Wyomissing is 2.3 People.
How Large is the Labor Force in West Wyomissing?
There are 1,697 People in the Labor Forcein in West Wyomissing.
What is the Percentage of People in the Labor Force in West Wyomissing?
62.9% of People are in the Labor Force in West Wyomissing.
What is the Unemployment Rate in West Wyomissing?
Unemployment Rate in West Wyomissing is 1.2%.