Kennett Square borough, PA Map & Demographics
Kennett Square borough Overview
$43,677
PER CAPITA INCOME
$102,188
AVG FAMILY INCOME
$70,903
AVG HOUSEHOLD INCOME
38.2%
WAGE / INCOME GAP [ % ]
61.8¢/ $1
WAGE / INCOME GAP [ $ ]
0.49
INEQUALITY / GINI INDEX
5,982
TOTAL POPULATION
3,002
MALE POPULATION
2,980
FEMALE POPULATION
100.74
MALES / 100 FEMALES
99.27
FEMALES / 100 MALES
38.7
MEDIAN AGE
3.4
AVG FAMILY SIZE
2.7
AVG HOUSEHOLD SIZE
3,436
LABOR FORCE [ PEOPLE ]
71.5%
PERCENT IN LABOR FORCE
4.7%
UNEMPLOYMENT RATE
Income in Kennett Square borough
Income Overview in Kennett Square borough
Per Capita Income in Kennett Square borough is $43,677, while median incomes of families and households are $102,188 and $70,903 respectively.
| Characteristic | Number | Measure |
| Per Capita Income | 5,982 | $43,677 |
| Median Family Income | 1,485 | $102,188 |
| Mean Family Income | 1,485 | $135,328 |
| Median Household Income | 2,233 | $70,903 |
| Mean Household Income | 2,233 | $114,350 |
| Income Deficit | 1,485 | $0 |
| Wage / Income Gap (%) | 5,982 | 38.23% |
| Wage / Income Gap ($) | 5,982 | 61.77¢ per $1 |
| Gini / Inequality Index | 5,982 | 0.49 |
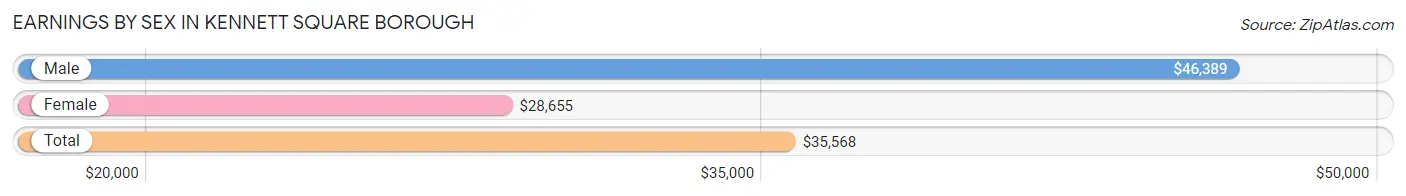
Earnings by Sex in Kennett Square borough
Average Earnings in Kennett Square borough are $35,568, $46,389 for men and $28,655 for women, a difference of 38.2%.
| Sex | Number | Average Earnings |
| Male | 2,100 (56.0%) | $46,389 |
| Female | 1,649 (44.0%) | $28,655 |
| Total | 3,749 (100.0%) | $35,568 |
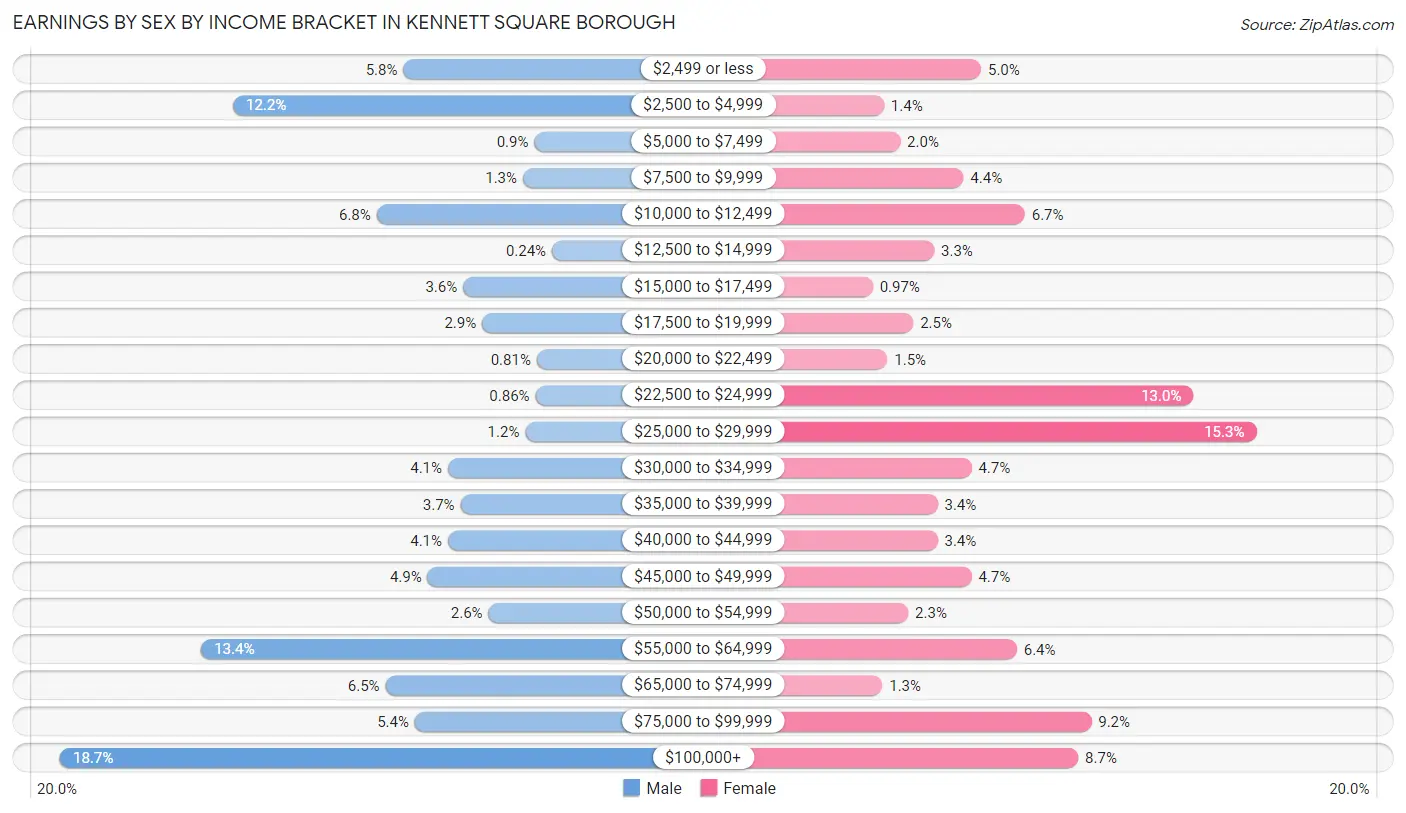
Earnings by Sex by Income Bracket in Kennett Square borough
The most common earnings brackets in Kennett Square borough are $100,000+ for men (392 | 18.7%) and $25,000 to $29,999 for women (253 | 15.3%).
| Income | Male | Female |
| $2,499 or less | 122 (5.8%) | 83 (5.0%) |
| $2,500 to $4,999 | 256 (12.2%) | 23 (1.4%) |
| $5,000 to $7,499 | 19 (0.9%) | 33 (2.0%) |
| $7,500 to $9,999 | 28 (1.3%) | 72 (4.4%) |
| $10,000 to $12,499 | 143 (6.8%) | 110 (6.7%) |
| $12,500 to $14,999 | 5 (0.2%) | 54 (3.3%) |
| $15,000 to $17,499 | 75 (3.6%) | 16 (1.0%) |
| $17,500 to $19,999 | 60 (2.9%) | 41 (2.5%) |
| $20,000 to $22,499 | 17 (0.8%) | 25 (1.5%) |
| $22,500 to $24,999 | 18 (0.9%) | 214 (13.0%) |
| $25,000 to $29,999 | 26 (1.2%) | 253 (15.3%) |
| $30,000 to $34,999 | 87 (4.1%) | 77 (4.7%) |
| $35,000 to $39,999 | 77 (3.7%) | 56 (3.4%) |
| $40,000 to $44,999 | 87 (4.1%) | 56 (3.4%) |
| $45,000 to $49,999 | 103 (4.9%) | 77 (4.7%) |
| $50,000 to $54,999 | 55 (2.6%) | 38 (2.3%) |
| $55,000 to $64,999 | 281 (13.4%) | 105 (6.4%) |
| $65,000 to $74,999 | 136 (6.5%) | 22 (1.3%) |
| $75,000 to $99,999 | 113 (5.4%) | 151 (9.2%) |
| $100,000+ | 392 (18.7%) | 143 (8.7%) |
| Total | 2,100 (100.0%) | 1,649 (100.0%) |
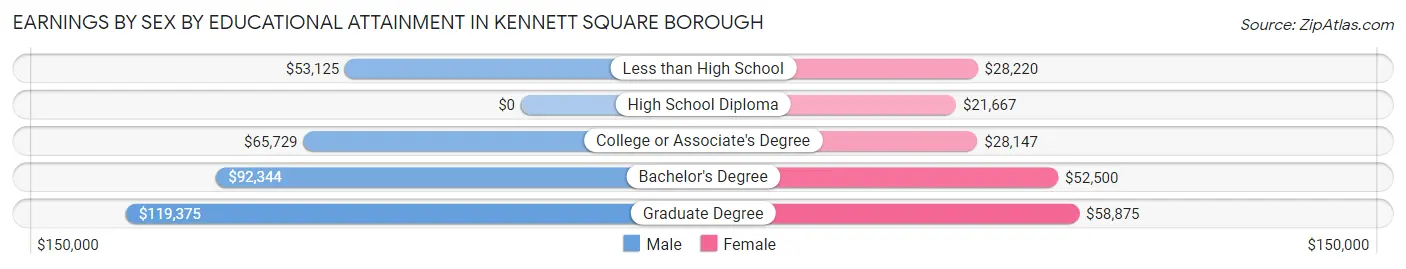
Earnings by Sex by Educational Attainment in Kennett Square borough
Average earnings in Kennett Square borough are $57,573 for men and $33,198 for women, a difference of 42.3%. Men with an educational attainment of graduate degree enjoy the highest average annual earnings of $119,375, while those with less than high school education earn the least with $53,125. Women with an educational attainment of graduate degree earn the most with the average annual earnings of $58,875, while those with high school diploma education have the smallest earnings of $21,667.
| Educational Attainment | Male Income | Female Income |
| Less than High School | $53,125 | $28,220 |
| High School Diploma | - | - |
| College or Associate's Degree | $65,729 | $28,147 |
| Bachelor's Degree | $92,344 | $52,500 |
| Graduate Degree | $119,375 | $58,875 |
| Total | $57,573 | $33,198 |
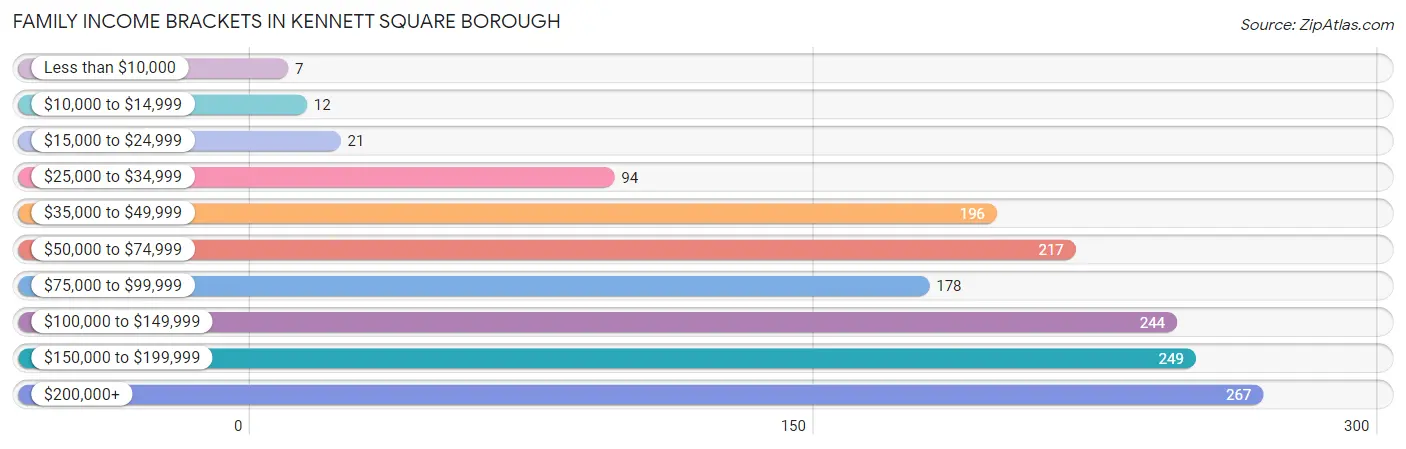
Family Income in Kennett Square borough
Family Income Brackets in Kennett Square borough
According to the Kennett Square borough family income data, there are 267 families falling into the $200,000+ income range, which is the most common income bracket and makes up 18.0% of all families. Conversely, the less than $10,000 income bracket is the least frequent group with only 7 families (0.5%) belonging to this category.
| Income Bracket | # Families | % Families |
| Less than $10,000 | 7 | 0.5% |
| $10,000 to $14,999 | 12 | 0.8% |
| $15,000 to $24,999 | 21 | 1.4% |
| $25,000 to $34,999 | 94 | 6.3% |
| $35,000 to $49,999 | 196 | 13.2% |
| $50,000 to $74,999 | 217 | 14.6% |
| $75,000 to $99,999 | 178 | 12.0% |
| $100,000 to $149,999 | 244 | 16.4% |
| $150,000 to $199,999 | 249 | 16.8% |
| $200,000+ | 267 | 18.0% |
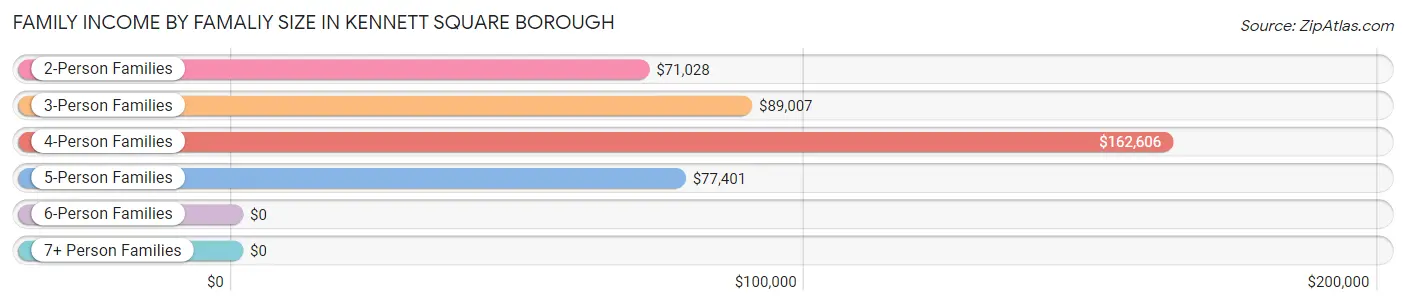
Family Income by Famaliy Size in Kennett Square borough
4-person families (412 | 27.7%) account for the highest median family income in Kennett Square borough with $162,606 per family, while 4-person families (412 | 27.7%) have the highest median income of $40,652 per family member.
| Income Bracket | # Families | Median Income |
| 2-Person Families | 607 (40.9%) | $71,028 |
| 3-Person Families | 217 (14.6%) | $89,007 |
| 4-Person Families | 412 (27.7%) | $162,606 |
| 5-Person Families | 183 (12.3%) | $77,401 |
| 6-Person Families | 32 (2.1%) | $0 |
| 7+ Person Families | 34 (2.3%) | $0 |
| Total | 1,485 (100.0%) | $102,188 |
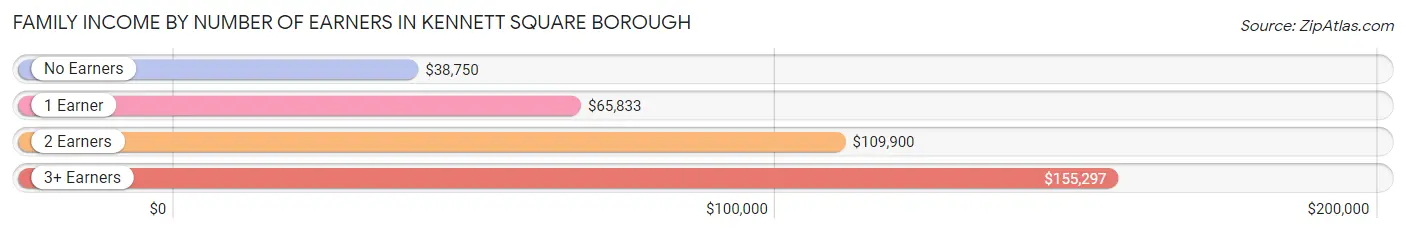
Family Income by Number of Earners in Kennett Square borough
The median family income in Kennett Square borough is $102,188, with families comprising 3+ earners (416) having the highest median family income of $155,297, while families with no earners (99) have the lowest median family income of $38,750, accounting for 28.0% and 6.7% of families, respectively.
| Number of Earners | # Families | Median Income |
| No Earners | 99 (6.7%) | $38,750 |
| 1 Earner | 458 (30.8%) | $65,833 |
| 2 Earners | 512 (34.5%) | $109,900 |
| 3+ Earners | 416 (28.0%) | $155,297 |
| Total | 1,485 (100.0%) | $102,188 |
Household Income in Kennett Square borough
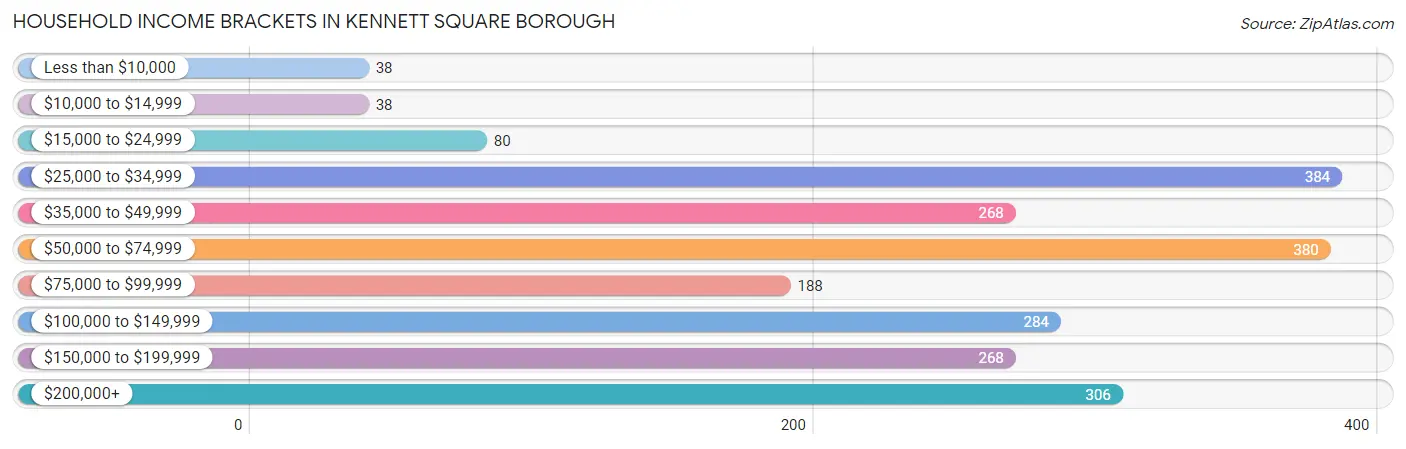
Household Income Brackets in Kennett Square borough
With 384 households falling in the category, the $25,000 to $34,999 income range is the most frequent in Kennett Square borough, accounting for 17.2% of all households. In contrast, only 38 households (1.7%) fall into the less than $10,000 income bracket, making it the least populous group.
| Income Bracket | # Households | % Households |
| Less than $10,000 | 38 | 1.7% |
| $10,000 to $14,999 | 38 | 1.7% |
| $15,000 to $24,999 | 80 | 3.6% |
| $25,000 to $34,999 | 384 | 17.2% |
| $35,000 to $49,999 | 268 | 12.0% |
| $50,000 to $74,999 | 380 | 17.0% |
| $75,000 to $99,999 | 188 | 8.4% |
| $100,000 to $149,999 | 284 | 12.7% |
| $150,000 to $199,999 | 268 | 12.0% |
| $200,000+ | 306 | 13.7% |
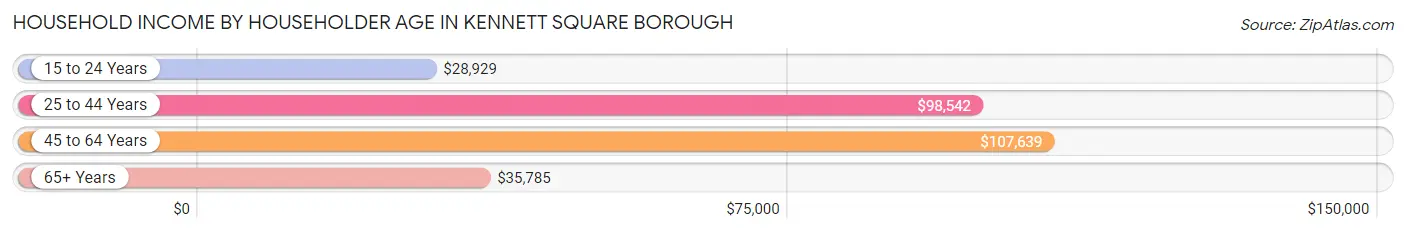
Household Income by Householder Age in Kennett Square borough
The median household income in Kennett Square borough is $70,903, with the highest median household income of $107,639 found in the 45 to 64 years age bracket for the primary householder. A total of 846 households (37.9%) fall into this category. Meanwhile, the 15 to 24 years age bracket for the primary householder has the lowest median household income of $28,929, with 60 households (2.7%) in this group.
| Income Bracket | # Households | Median Income |
| 15 to 24 Years | 60 (2.7%) | $28,929 |
| 25 to 44 Years | 644 (28.8%) | $98,542 |
| 45 to 64 Years | 846 (37.9%) | $107,639 |
| 65+ Years | 683 (30.6%) | $35,785 |
| Total | 2,233 (100.0%) | $70,903 |
Poverty in Kennett Square borough
Income Below Poverty by Sex and Age in Kennett Square borough
With 2.4% poverty level for males and 2.4% for females among the residents of Kennett Square borough, 75 year old and over males and 75 year old and over females are the most vulnerable to poverty, with 7 males (6.9%) and 12 females (8.1%) in their respective age groups living below the poverty level.
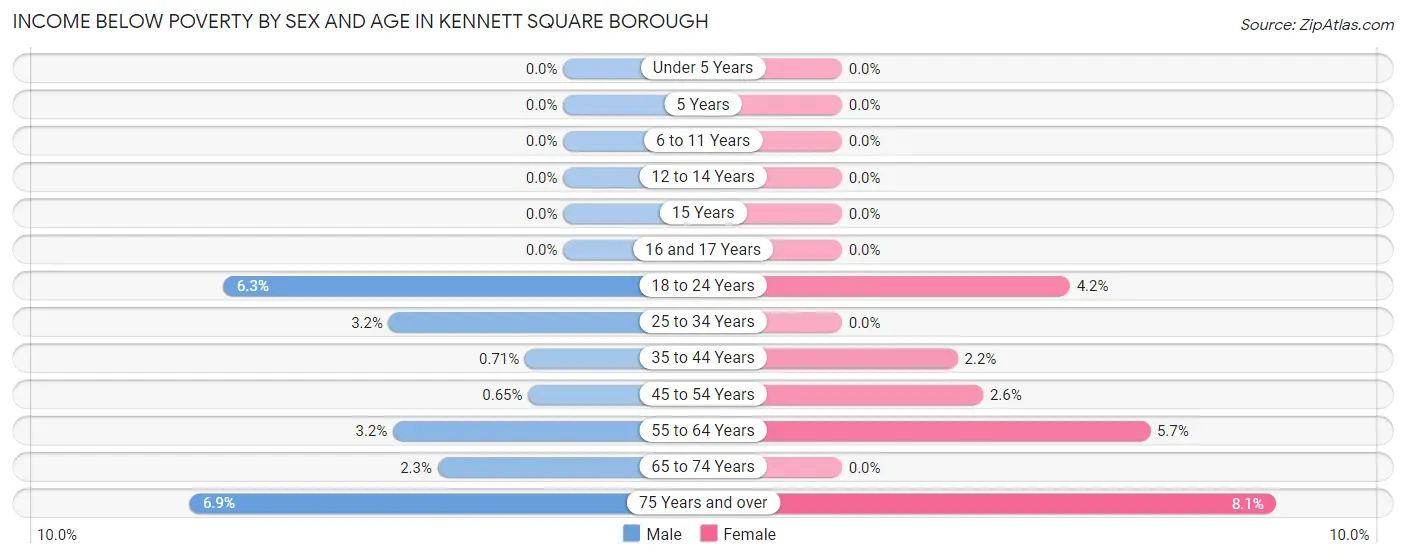
| Age Bracket | Male | Female |
| Under 5 Years | 0 (0.0%) | 0 (0.0%) |
| 5 Years | 0 (0.0%) | 0 (0.0%) |
| 6 to 11 Years | 0 (0.0%) | 0 (0.0%) |
| 12 to 14 Years | 0 (0.0%) | 0 (0.0%) |
| 15 Years | 0 (0.0%) | 0 (0.0%) |
| 16 and 17 Years | 0 (0.0%) | 0 (0.0%) |
| 18 to 24 Years | 31 (6.3%) | 14 (4.2%) |
| 25 to 34 Years | 8 (3.2%) | 0 (0.0%) |
| 35 to 44 Years | 3 (0.7%) | 10 (2.1%) |
| 45 to 54 Years | 2 (0.6%) | 9 (2.6%) |
| 55 to 64 Years | 13 (3.2%) | 27 (5.7%) |
| 65 to 74 Years | 9 (2.3%) | 0 (0.0%) |
| 75 Years and over | 7 (6.9%) | 12 (8.1%) |
| Total | 73 (2.4%) | 72 (2.4%) |
Income Above Poverty by Sex and Age in Kennett Square borough
According to the poverty statistics in Kennett Square borough, males aged under 5 years and females aged under 5 years are the age groups that are most secure financially, with 100.0% of males and 100.0% of females in these age groups living above the poverty line.
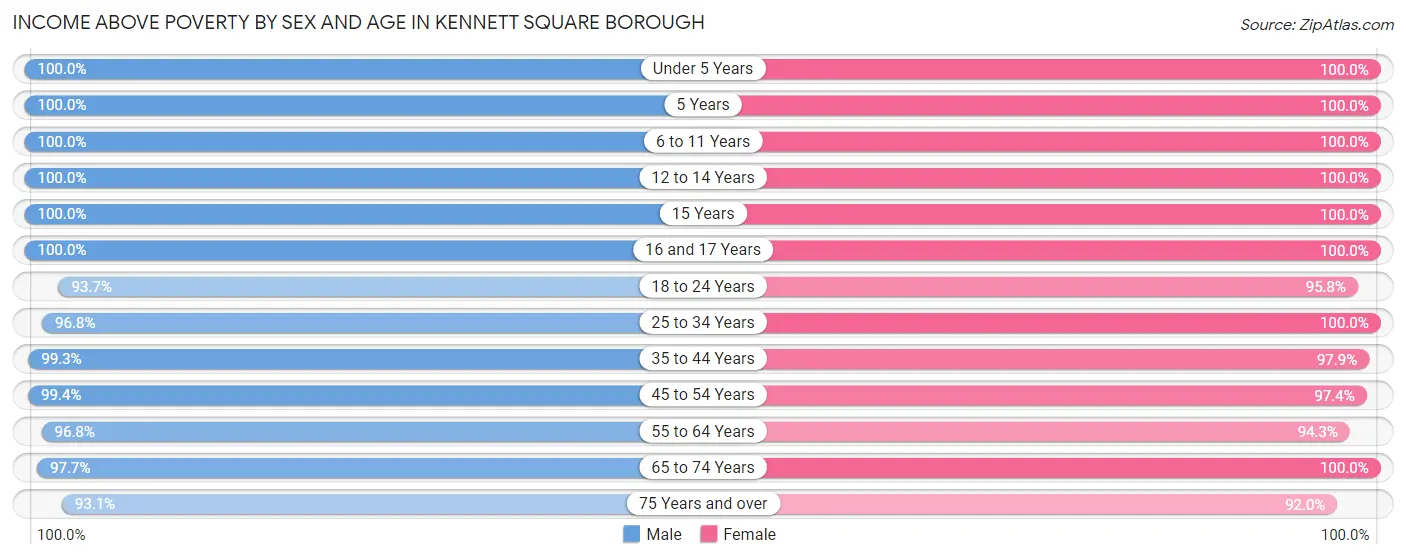
| Age Bracket | Male | Female |
| Under 5 Years | 106 (100.0%) | 227 (100.0%) |
| 5 Years | 29 (100.0%) | 11 (100.0%) |
| 6 to 11 Years | 245 (100.0%) | 217 (100.0%) |
| 12 to 14 Years | 111 (100.0%) | 162 (100.0%) |
| 15 Years | 10 (100.0%) | 59 (100.0%) |
| 16 and 17 Years | 122 (100.0%) | 43 (100.0%) |
| 18 to 24 Years | 461 (93.7%) | 317 (95.8%) |
| 25 to 34 Years | 239 (96.8%) | 262 (100.0%) |
| 35 to 44 Years | 419 (99.3%) | 455 (97.9%) |
| 45 to 54 Years | 307 (99.4%) | 335 (97.4%) |
| 55 to 64 Years | 399 (96.8%) | 445 (94.3%) |
| 65 to 74 Years | 378 (97.7%) | 223 (100.0%) |
| 75 Years and over | 94 (93.1%) | 137 (91.9%) |
| Total | 2,920 (97.6%) | 2,893 (97.6%) |
Income Below Poverty Among Married-Couple Families in Kennett Square borough
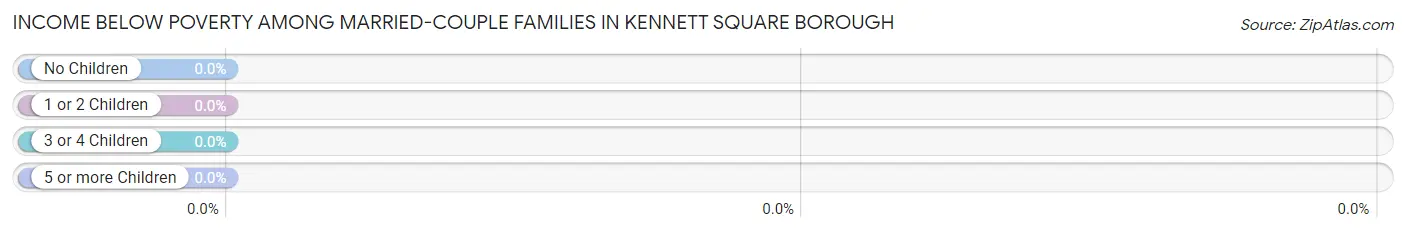
| Children | Above Poverty | Below Poverty |
| No Children | 527 (100.0%) | 0 (0.0%) |
| 1 or 2 Children | 408 (100.0%) | 0 (0.0%) |
| 3 or 4 Children | 136 (100.0%) | 0 (0.0%) |
| 5 or more Children | 0 (0.0%) | 0 (0.0%) |
| Total | 1,071 (100.0%) | 0 (0.0%) |
Income Below Poverty Among Single-Parent Households in Kennett Square borough
According to the poverty data in Kennett Square borough, 8.1% or 7 single-father households and 3.7% or 12 single-mother households are living below the poverty line. Among single-father households, those with no children have the highest poverty rate, with 7 households (13.5%) experiencing poverty. Likewise, among single-mother households, those with no children have the highest poverty rate, with 12 households (7.6%) falling below the poverty line.
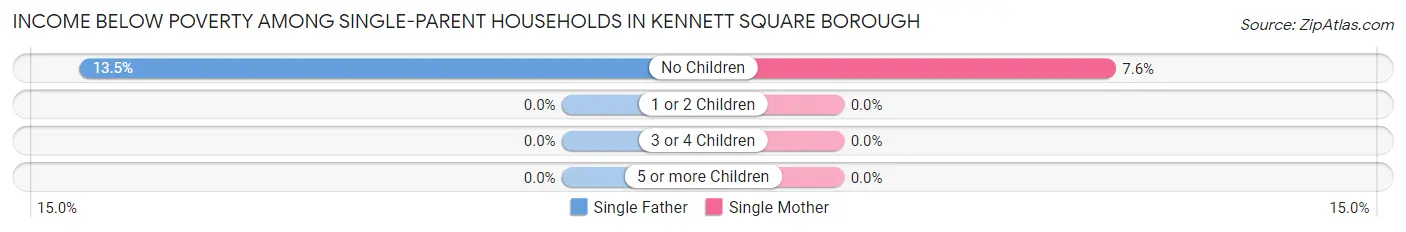
| Children | Single Father | Single Mother |
| No Children | 7 (13.5%) | 12 (7.6%) |
| 1 or 2 Children | 0 (0.0%) | 0 (0.0%) |
| 3 or 4 Children | 0 (0.0%) | 0 (0.0%) |
| 5 or more Children | 0 (0.0%) | 0 (0.0%) |
| Total | 7 (8.1%) | 12 (3.7%) |
Income Below Poverty Among Married-Couple vs Single-Parent Households in Kennett Square borough
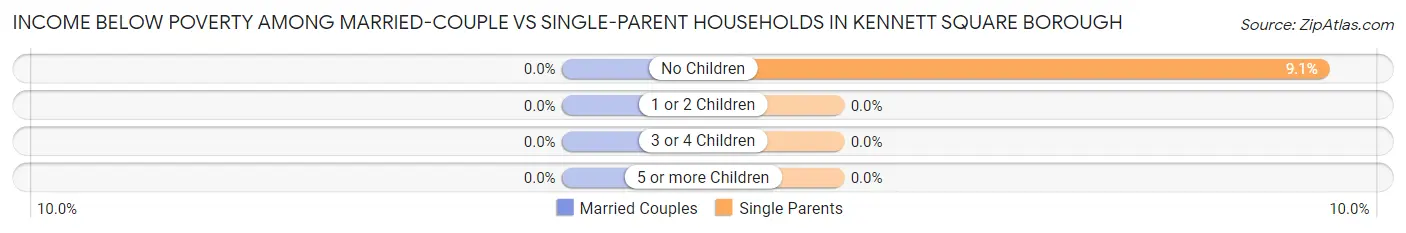
| Children | Married-Couple Families | Single-Parent Households |
| No Children | 0 (0.0%) | 19 (9.0%) |
| 1 or 2 Children | 0 (0.0%) | 0 (0.0%) |
| 3 or 4 Children | 0 (0.0%) | 0 (0.0%) |
| 5 or more Children | 0 (0.0%) | 0 (0.0%) |
| Total | 0 (0.0%) | 19 (4.6%) |
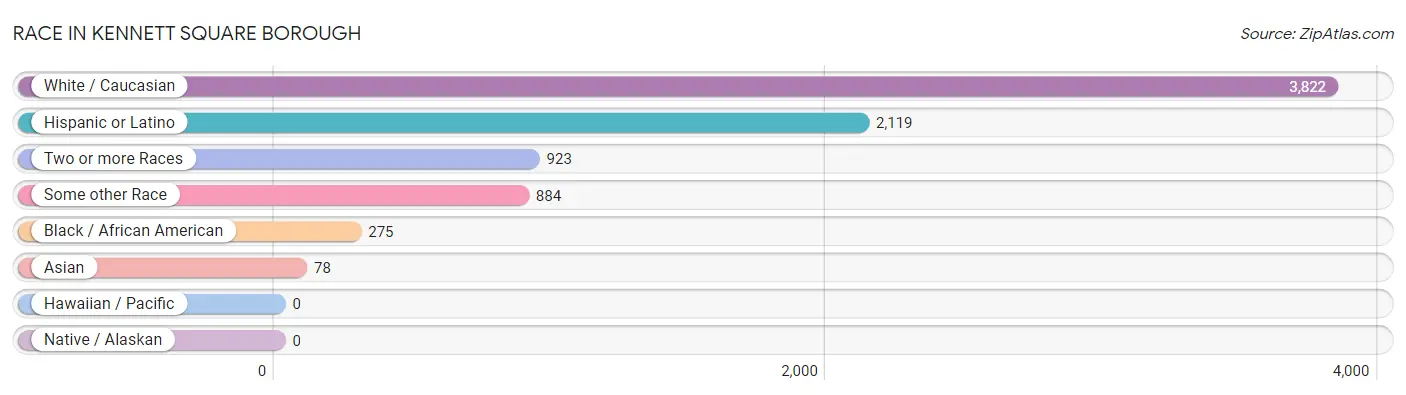
Race in Kennett Square borough
The most populous races in Kennett Square borough are White / Caucasian (3,822 | 63.9%), Hispanic or Latino (2,119 | 35.4%), and Two or more Races (923 | 15.4%).
| Race | # Population | % Population |
| Asian | 78 | 1.3% |
| Black / African American | 275 | 4.6% |
| Hawaiian / Pacific | 0 | 0.0% |
| Hispanic or Latino | 2,119 | 35.4% |
| Native / Alaskan | 0 | 0.0% |
| White / Caucasian | 3,822 | 63.9% |
| Two or more Races | 923 | 15.4% |
| Some other Race | 884 | 14.8% |
| Total | 5,982 | 100.0% |
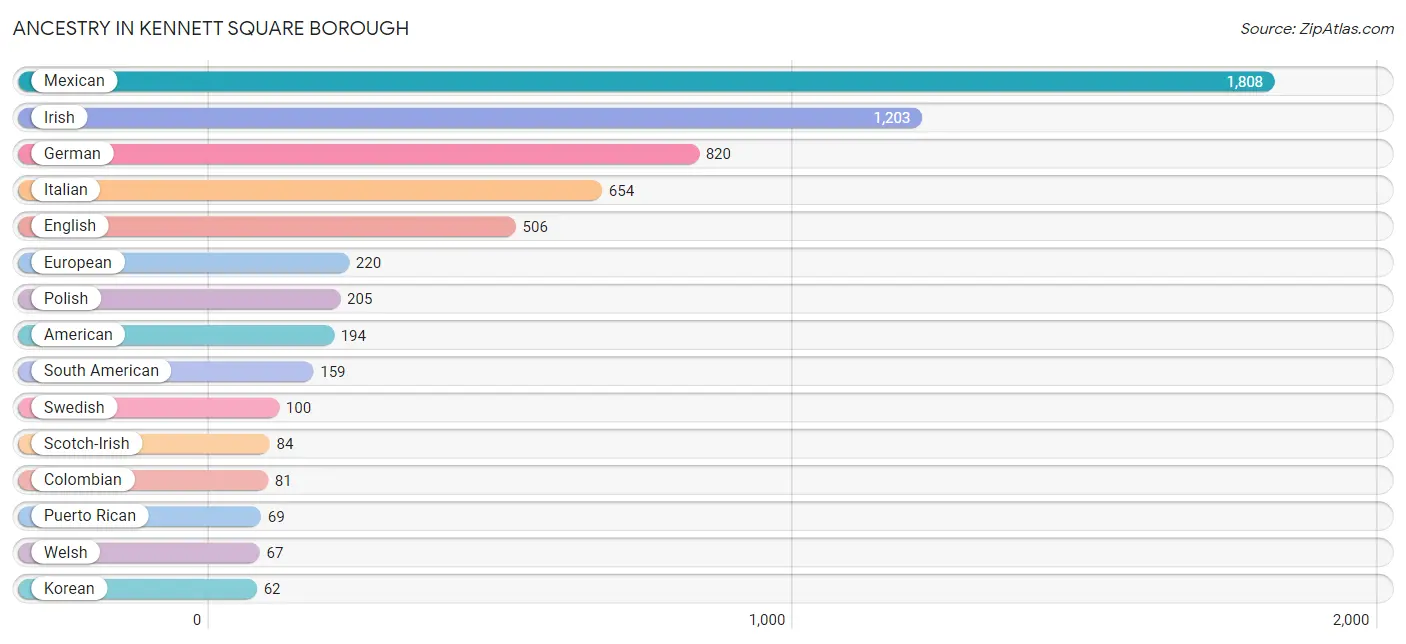
Ancestry in Kennett Square borough
The most populous ancestries reported in Kennett Square borough are Mexican (1,808 | 30.2%), Irish (1,203 | 20.1%), German (820 | 13.7%), Italian (654 | 10.9%), and English (506 | 8.5%), together accounting for 83.4% of all Kennett Square borough residents.
| Ancestry | # Population | % Population |
| African | 17 | 0.3% |
| American | 194 | 3.2% |
| Arab | 12 | 0.2% |
| Belgian | 27 | 0.4% |
| British | 50 | 0.8% |
| Canadian | 5 | 0.1% |
| Chilean | 29 | 0.5% |
| Colombian | 81 | 1.3% |
| Croatian | 22 | 0.4% |
| Cuban | 52 | 0.9% |
| Czech | 13 | 0.2% |
| Czechoslovakian | 7 | 0.1% |
| Danish | 54 | 0.9% |
| Dutch | 48 | 0.8% |
| Eastern European | 16 | 0.3% |
| Ecuadorian | 5 | 0.1% |
| Egyptian | 12 | 0.2% |
| English | 506 | 8.5% |
| European | 220 | 3.7% |
| Finnish | 9 | 0.2% |
| French | 39 | 0.6% |
| French Canadian | 18 | 0.3% |
| German | 820 | 13.7% |
| Greek | 12 | 0.2% |
| Indian (Asian) | 28 | 0.5% |
| Irish | 1,203 | 20.1% |
| Israeli | 11 | 0.2% |
| Italian | 654 | 10.9% |
| Korean | 62 | 1.0% |
| Lithuanian | 31 | 0.5% |
| Malaysian | 41 | 0.7% |
| Mexican | 1,808 | 30.2% |
| Native Hawaiian | 25 | 0.4% |
| Northern European | 11 | 0.2% |
| Norwegian | 31 | 0.5% |
| Polish | 205 | 3.4% |
| Puerto Rican | 69 | 1.1% |
| Scandinavian | 30 | 0.5% |
| Scotch-Irish | 84 | 1.4% |
| Scottish | 22 | 0.4% |
| Slovak | 30 | 0.5% |
| South American | 159 | 2.7% |
| Spaniard | 31 | 0.5% |
| Subsaharan African | 17 | 0.3% |
| Swedish | 100 | 1.7% |
| Venezuelan | 44 | 0.7% |
| Welsh | 67 | 1.1% | View All 47 Rows |
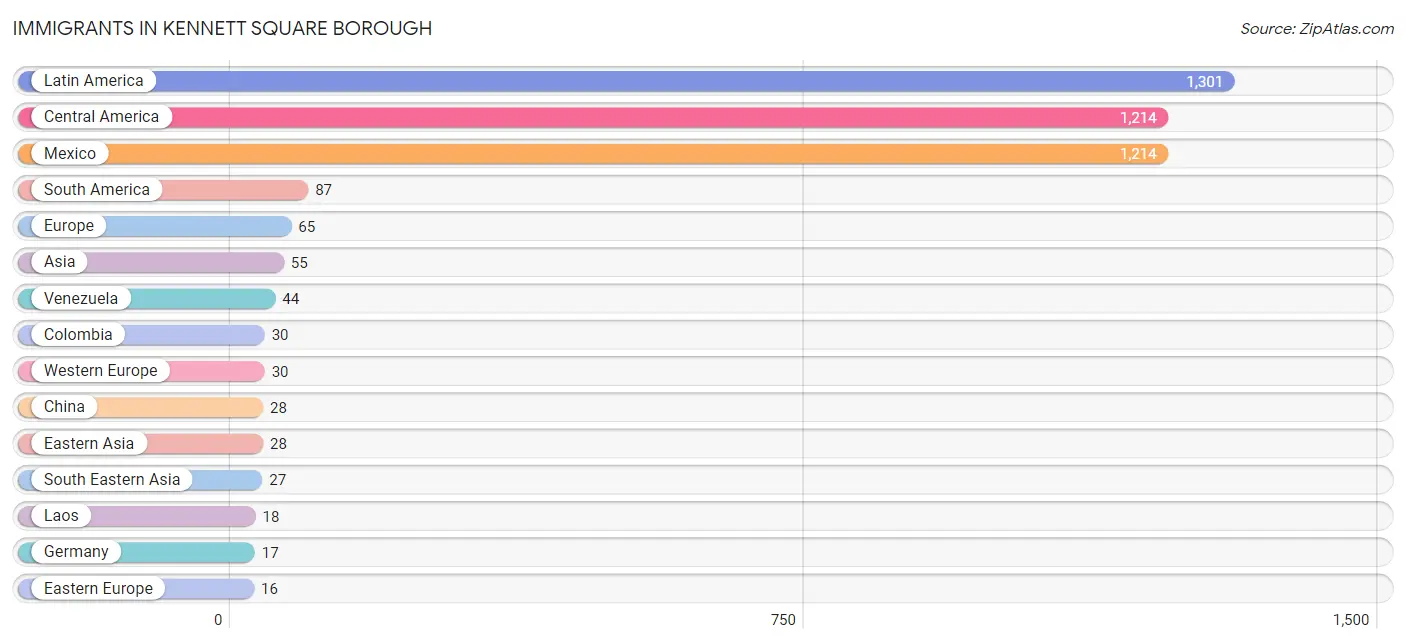
Immigrants in Kennett Square borough
The most numerous immigrant groups reported in Kennett Square borough came from Latin America (1,301 | 21.7%), Central America (1,214 | 20.3%), Mexico (1,214 | 20.3%), South America (87 | 1.5%), and Europe (65 | 1.1%), together accounting for 64.9% of all Kennett Square borough residents.
| Immigration Origin | # Population | % Population |
| Africa | 12 | 0.2% |
| Asia | 55 | 0.9% |
| Belgium | 13 | 0.2% |
| Central America | 1,214 | 20.3% |
| Chile | 8 | 0.1% |
| China | 28 | 0.5% |
| Colombia | 30 | 0.5% |
| Eastern Asia | 28 | 0.5% |
| Eastern Europe | 16 | 0.3% |
| Ecuador | 5 | 0.1% |
| Egypt | 12 | 0.2% |
| Europe | 65 | 1.1% |
| Germany | 17 | 0.3% |
| Ireland | 4 | 0.1% |
| Italy | 11 | 0.2% |
| Laos | 18 | 0.3% |
| Latin America | 1,301 | 21.7% |
| Mexico | 1,214 | 20.3% |
| Northern Africa | 12 | 0.2% |
| Northern Europe | 4 | 0.1% |
| Philippines | 9 | 0.2% |
| Poland | 16 | 0.3% |
| South America | 87 | 1.5% |
| South Eastern Asia | 27 | 0.4% |
| Southern Europe | 15 | 0.3% |
| Spain | 4 | 0.1% |
| Venezuela | 44 | 0.7% |
| Western Europe | 30 | 0.5% | View All 28 Rows |
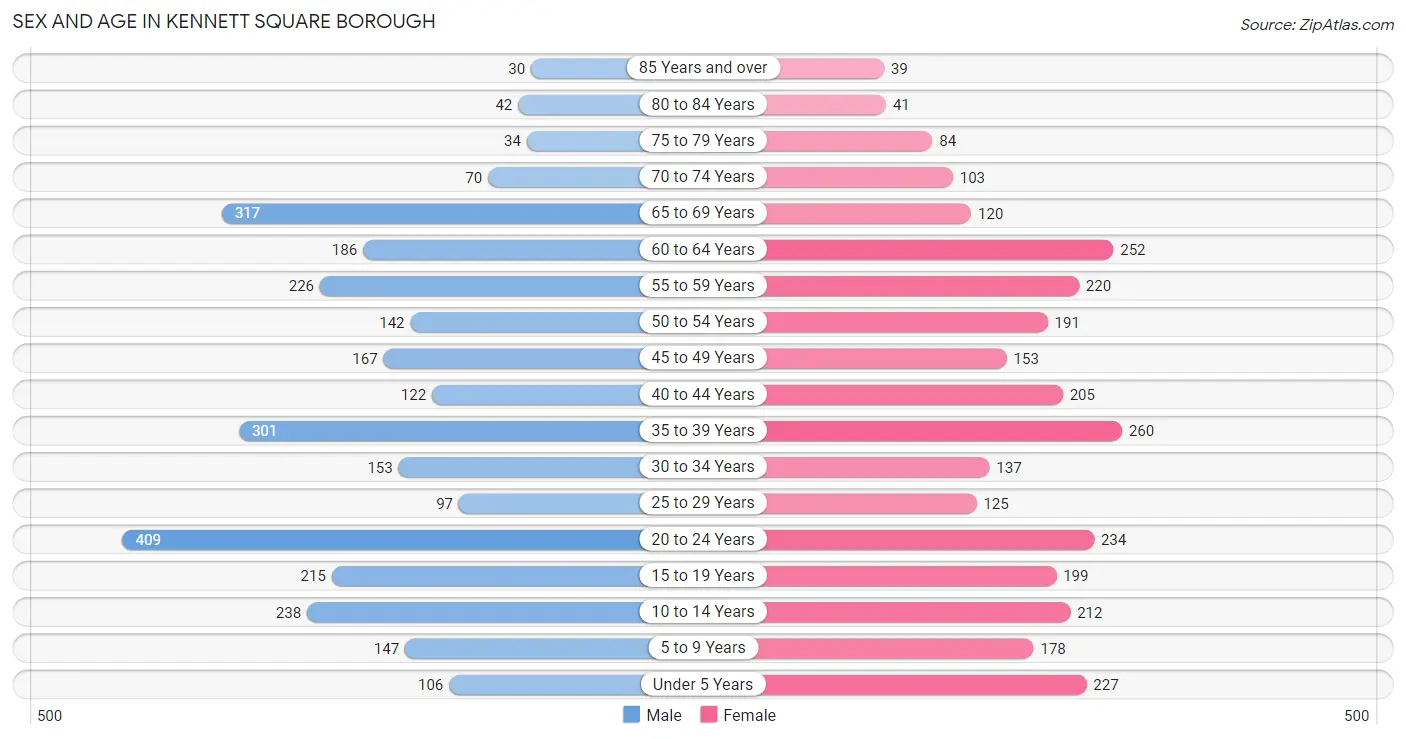
Sex and Age in Kennett Square borough
Sex and Age in Kennett Square borough
The most populous age groups in Kennett Square borough are 20 to 24 Years (409 | 13.6%) for men and 35 to 39 Years (260 | 8.7%) for women.
| Age Bracket | Male | Female |
| Under 5 Years | 106 (3.5%) | 227 (7.6%) |
| 5 to 9 Years | 147 (4.9%) | 178 (6.0%) |
| 10 to 14 Years | 238 (7.9%) | 212 (7.1%) |
| 15 to 19 Years | 215 (7.2%) | 199 (6.7%) |
| 20 to 24 Years | 409 (13.6%) | 234 (7.9%) |
| 25 to 29 Years | 97 (3.2%) | 125 (4.2%) |
| 30 to 34 Years | 153 (5.1%) | 137 (4.6%) |
| 35 to 39 Years | 301 (10.0%) | 260 (8.7%) |
| 40 to 44 Years | 122 (4.1%) | 205 (6.9%) |
| 45 to 49 Years | 167 (5.6%) | 153 (5.1%) |
| 50 to 54 Years | 142 (4.7%) | 191 (6.4%) |
| 55 to 59 Years | 226 (7.5%) | 220 (7.4%) |
| 60 to 64 Years | 186 (6.2%) | 252 (8.5%) |
| 65 to 69 Years | 317 (10.6%) | 120 (4.0%) |
| 70 to 74 Years | 70 (2.3%) | 103 (3.5%) |
| 75 to 79 Years | 34 (1.1%) | 84 (2.8%) |
| 80 to 84 Years | 42 (1.4%) | 41 (1.4%) |
| 85 Years and over | 30 (1.0%) | 39 (1.3%) |
| Total | 3,002 (100.0%) | 2,980 (100.0%) |
Families and Households in Kennett Square borough
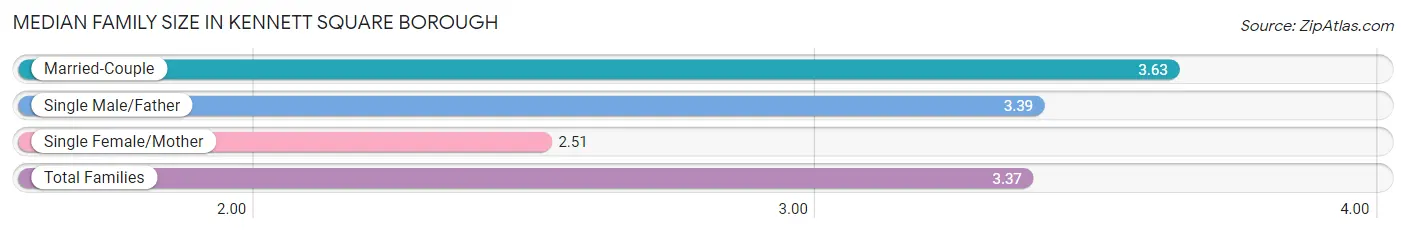
Median Family Size in Kennett Square borough
The median family size in Kennett Square borough is 3.37 persons per family, with married-couple families (1,071 | 72.1%) accounting for the largest median family size of 3.63 persons per family. On the other hand, single female/mother families (327 | 22.0%) represent the smallest median family size with 2.51 persons per family.
| Family Type | # Families | Family Size |
| Married-Couple | 1,071 (72.1%) | 3.63 |
| Single Male/Father | 87 (5.9%) | 3.39 |
| Single Female/Mother | 327 (22.0%) | 2.51 |
| Total Families | 1,485 (100.0%) | 3.37 |
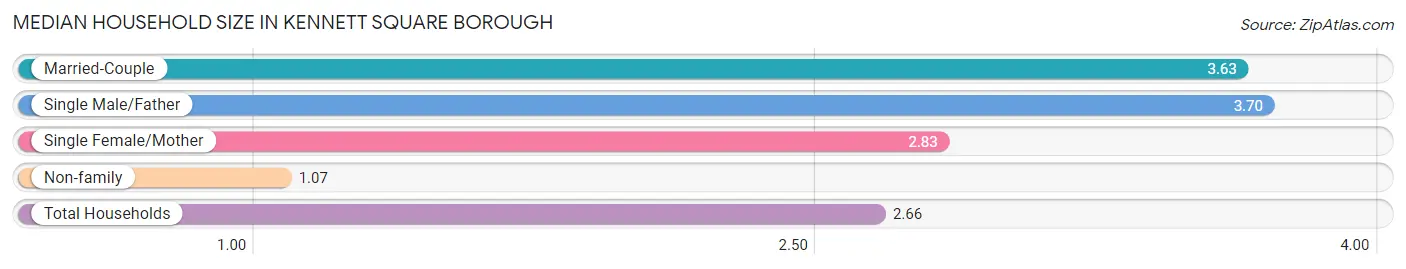
Median Household Size in Kennett Square borough
The median household size in Kennett Square borough is 2.66 persons per household, with single male/father households (87 | 3.9%) accounting for the largest median household size of 3.7 persons per household. non-family households (748 | 33.5%) represent the smallest median household size with 1.07 persons per household.
| Household Type | # Households | Household Size |
| Married-Couple | 1,071 (48.0%) | 3.63 |
| Single Male/Father | 87 (3.9%) | 3.70 |
| Single Female/Mother | 327 (14.6%) | 2.83 |
| Non-family | 748 (33.5%) | 1.07 |
| Total Households | 2,233 (100.0%) | 2.66 |
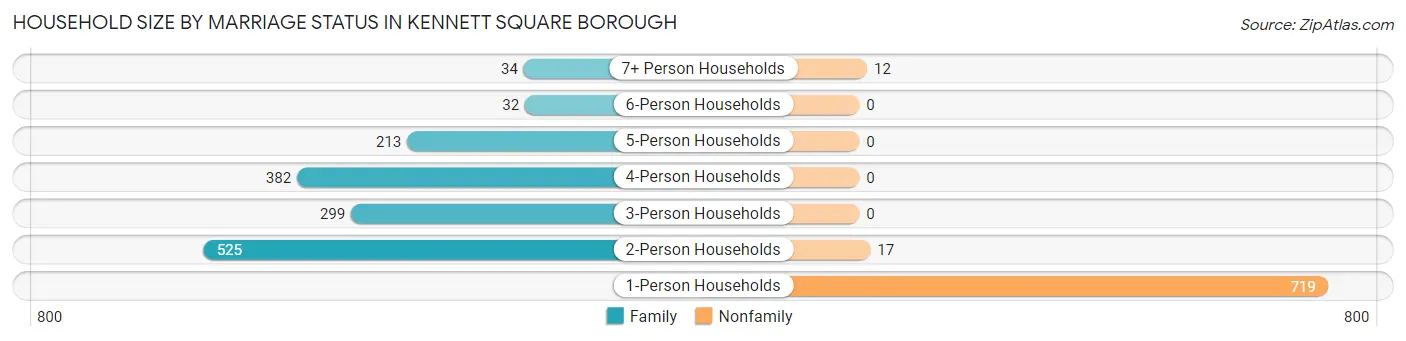
Household Size by Marriage Status in Kennett Square borough
Out of a total of 2,233 households in Kennett Square borough, 1,485 (66.5%) are family households, while 748 (33.5%) are nonfamily households. The most numerous type of family households are 2-person households, comprising 525, and the most common type of nonfamily households are 1-person households, comprising 719.
| Household Size | Family Households | Nonfamily Households |
| 1-Person Households | - | 719 (32.2%) |
| 2-Person Households | 525 (23.5%) | 17 (0.8%) |
| 3-Person Households | 299 (13.4%) | 0 (0.0%) |
| 4-Person Households | 382 (17.1%) | 0 (0.0%) |
| 5-Person Households | 213 (9.5%) | 0 (0.0%) |
| 6-Person Households | 32 (1.4%) | 0 (0.0%) |
| 7+ Person Households | 34 (1.5%) | 12 (0.5%) |
| Total | 1,485 (66.5%) | 748 (33.5%) |
Female Fertility in Kennett Square borough
Fertility by Age in Kennett Square borough
Average fertility rate in Kennett Square borough is 32.0 births per 1,000 women. Women in the age bracket of 35 to 50 years have the highest fertility rate with 63.0 births per 1,000 women. Women in the age bracket of 35 to 50 years acount for 95.5% of all women with births.
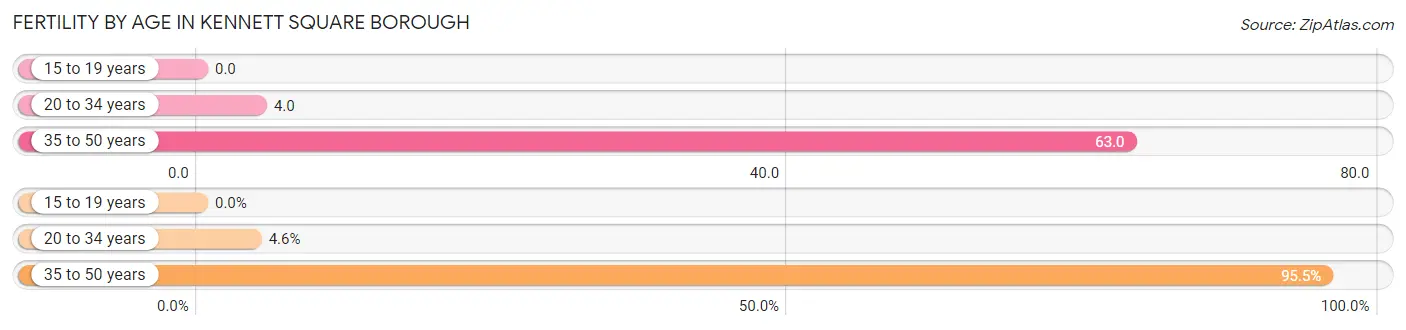
| Age Bracket | Women with Births | Births / 1,000 Women |
| 15 to 19 years | 0 (0.0%) | 0.0 |
| 20 to 34 years | 2 (4.5%) | 4.0 |
| 35 to 50 years | 42 (95.5%) | 63.0 |
| Total | 44 (100.0%) | 32.0 |
Fertility by Age by Marriage Status in Kennett Square borough
95.5% of women with births (44) in Kennett Square borough are married. The highest percentage of unmarried women with births falls into 20 to 34 years age bracket with 100.0% of them unmarried at the time of birth, while the lowest percentage of unmarried women with births belong to 35 to 50 years age bracket with 0.0% of them unmarried.
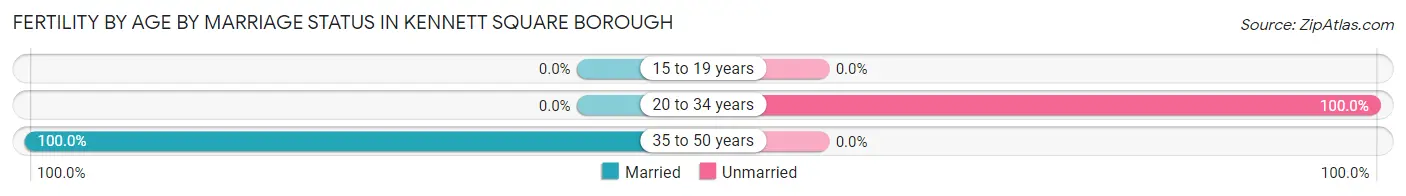
| Age Bracket | Married | Unmarried |
| 15 to 19 years | 0 (0.0%) | 0 (0.0%) |
| 20 to 34 years | 0 (0.0%) | 2 (100.0%) |
| 35 to 50 years | 42 (100.0%) | 0 (0.0%) |
| Total | 42 (95.5%) | 2 (4.5%) |
Fertility by Education in Kennett Square borough
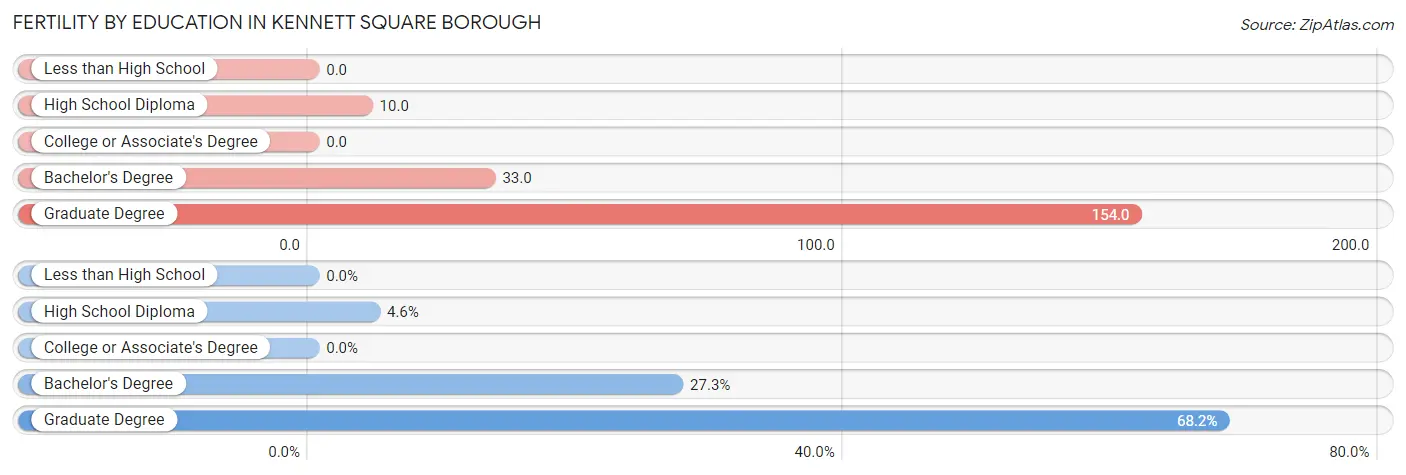
| Educational Attainment | Women with Births | Births / 1,000 Women |
| Less than High School | 0 (0.0%) | 0.0 |
| High School Diploma | 2 (4.5%) | 10.0 |
| College or Associate's Degree | 0 (0.0%) | 0.0 |
| Bachelor's Degree | 12 (27.3%) | 33.0 |
| Graduate Degree | 30 (68.2%) | 154.0 |
| Total | 44 (100.0%) | 32.0 |
Fertility by Education by Marriage Status in Kennett Square borough
4.5% of women with births in Kennett Square borough are unmarried. Women with the educational attainment of bachelor's degree are most likely to be married with 100.0% of them married at childbirth, while women with the educational attainment of high school diploma are least likely to be married with 100.0% of them unmarried at childbirth.
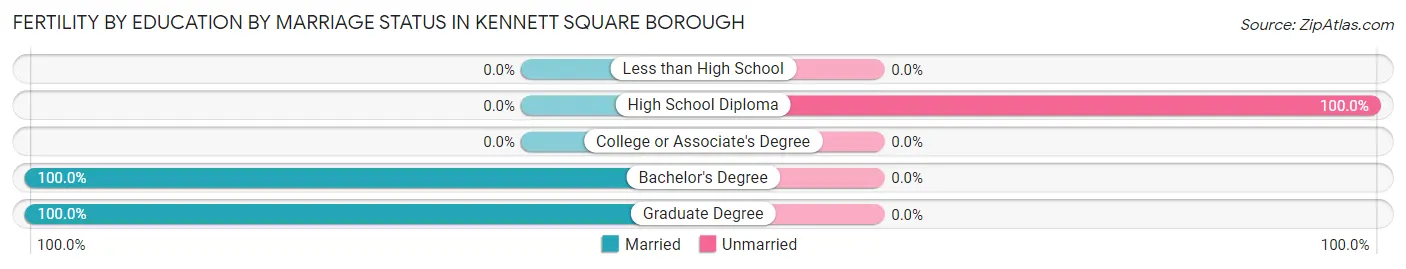
| Educational Attainment | Married | Unmarried |
| Less than High School | 0 (0.0%) | 0 (0.0%) |
| High School Diploma | 0 (0.0%) | 2 (100.0%) |
| College or Associate's Degree | 0 (0.0%) | 0 (0.0%) |
| Bachelor's Degree | 12 (100.0%) | 0 (0.0%) |
| Graduate Degree | 30 (100.0%) | 0 (0.0%) |
| Total | 42 (95.5%) | 2 (4.5%) |
Employment Characteristics in Kennett Square borough
Employment by Class of Employer in Kennett Square borough
Among the 3,219 employed individuals in Kennett Square borough, private company employees (2,356 | 73.2%), not-for-profit organizations (262 | 8.1%), and local government employees (232 | 7.2%) make up the most common classes of employment.
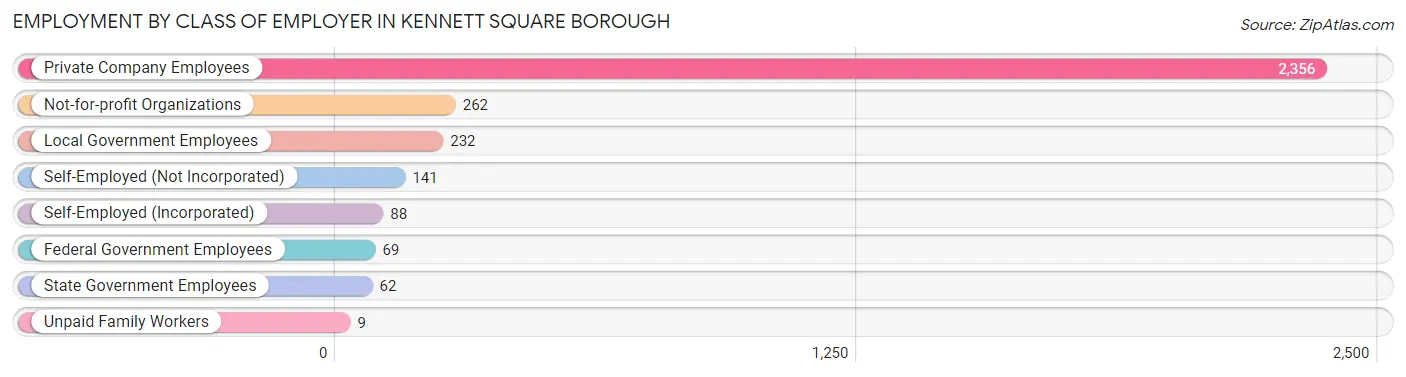
| Employer Class | # Employees | % Employees |
| Private Company Employees | 2,356 | 73.2% |
| Self-Employed (Incorporated) | 88 | 2.7% |
| Self-Employed (Not Incorporated) | 141 | 4.4% |
| Not-for-profit Organizations | 262 | 8.1% |
| Local Government Employees | 232 | 7.2% |
| State Government Employees | 62 | 1.9% |
| Federal Government Employees | 69 | 2.1% |
| Unpaid Family Workers | 9 | 0.3% |
| Total | 3,219 | 100.0% |
Employment Status by Age in Kennett Square borough
According to the labor force statistics for Kennett Square borough, out of the total population over 16 years of age (4,805), 71.5% or 3,436 individuals are in the labor force, with 4.7% or 161 of them unemployed. The age group with the highest labor force participation rate is 25 to 29 years, with 95.9% or 213 individuals in the labor force. Within the labor force, the 30 to 34 years age range has the highest percentage of unemployed individuals, with 15.1% or 37 of them being unemployed.
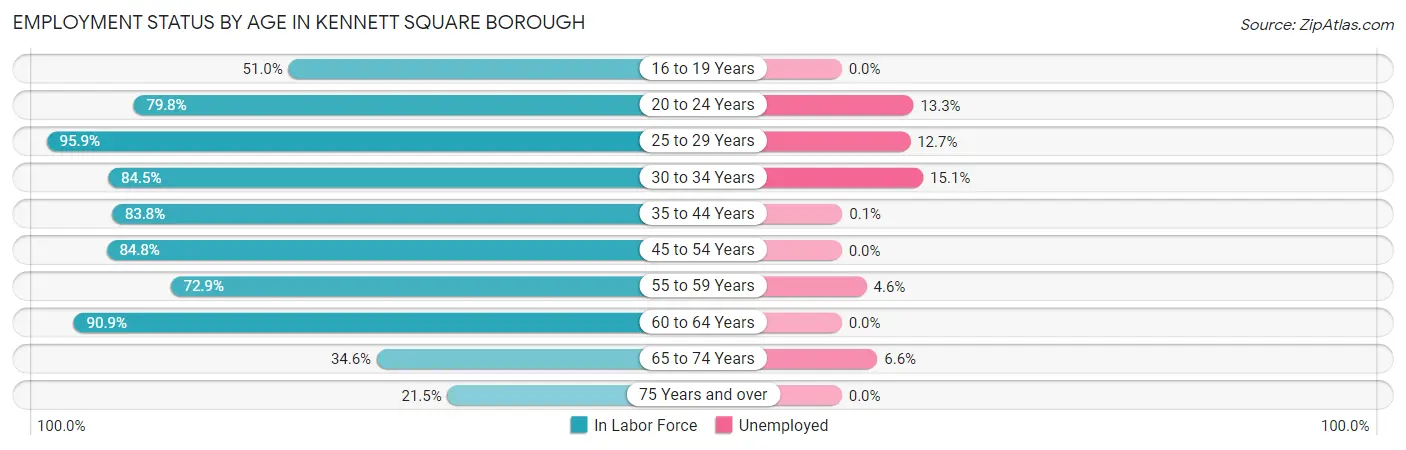
| Age Bracket | In Labor Force | Unemployed |
| 16 to 19 Years | 176 (51.0%) | 0 (0.0%) |
| 20 to 24 Years | 513 (79.8%) | 68 (13.3%) |
| 25 to 29 Years | 213 (95.9%) | 27 (12.7%) |
| 30 to 34 Years | 245 (84.5%) | 37 (15.1%) |
| 35 to 44 Years | 744 (83.8%) | 1 (0.1%) |
| 45 to 54 Years | 554 (84.8%) | 0 (0.0%) |
| 55 to 59 Years | 325 (72.9%) | 15 (4.6%) |
| 60 to 64 Years | 398 (90.9%) | 0 (0.0%) |
| 65 to 74 Years | 211 (34.6%) | 14 (6.6%) |
| 75 Years and over | 58 (21.5%) | 0 (0.0%) |
| Total | 3,436 (71.5%) | 161 (4.7%) |
Employment Status by Educational Attainment in Kennett Square borough
According to labor force statistics for Kennett Square borough, 84.4% of individuals (2,479) out of the total population between 25 and 64 years of age (2,937) are in the labor force, with 3.2% or 79 of them being unemployed. The group with the highest labor force participation rate are those with the educational attainment of college / associate degree, with 93.0% or 515 individuals in the labor force. Within the labor force, individuals with high school diploma education have the highest percentage of unemployment, with 12.1% or 51 of them being unemployed.
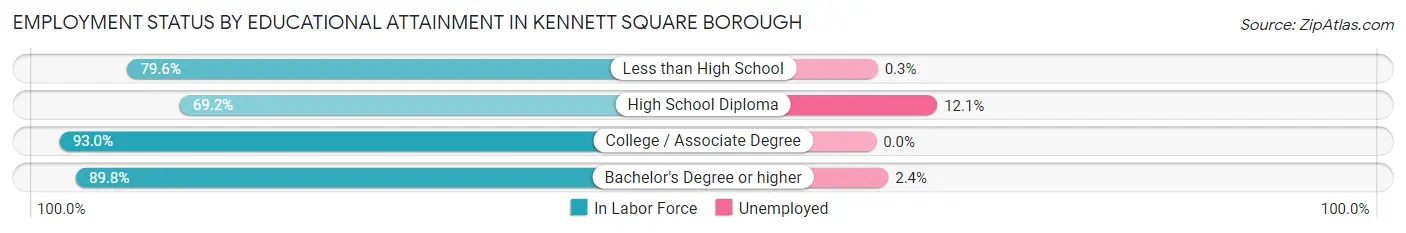
| Educational Attainment | In Labor Force | Unemployed |
| Less than High School | 398 (79.6%) | 2 (0.3%) |
| High School Diploma | 421 (69.2%) | 74 (12.1%) |
| College / Associate Degree | 515 (93.0%) | 0 (0.0%) |
| Bachelor's Degree or higher | 1,145 (89.8%) | 31 (2.4%) |
| Total | 2,479 (84.4%) | 94 (3.2%) |
Employment Occupations by Sex in Kennett Square borough
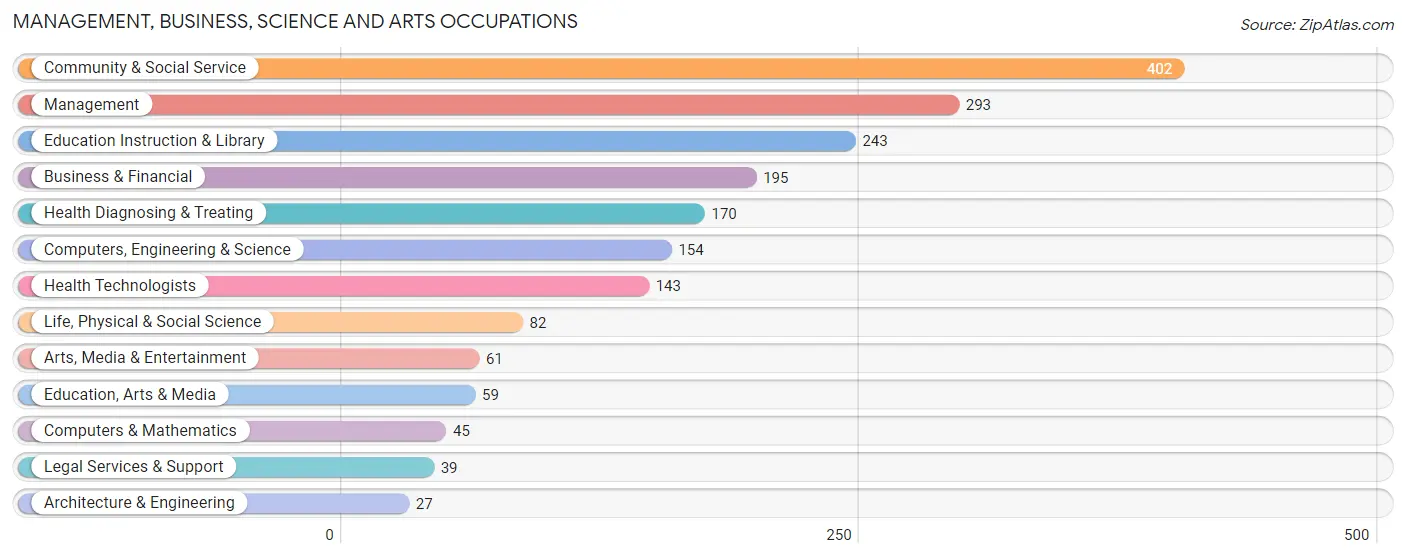
Management, Business, Science and Arts Occupations
The most common Management, Business, Science and Arts occupations in Kennett Square borough are Community & Social Service (402 | 12.3%), Management (293 | 8.9%), Education Instruction & Library (243 | 7.4%), Business & Financial (195 | 6.0%), and Health Diagnosing & Treating (170 | 5.2%).
Management, Business, Science and Arts Occupations by Sex
Within the Management, Business, Science and Arts occupations in Kennett Square borough, the most male-oriented occupations are Architecture & Engineering (100.0%), Legal Services & Support (100.0%), and Computers & Mathematics (88.9%), while the most female-oriented occupations are Education, Arts & Media (88.1%), Health Diagnosing & Treating (76.5%), and Education Instruction & Library (76.1%).
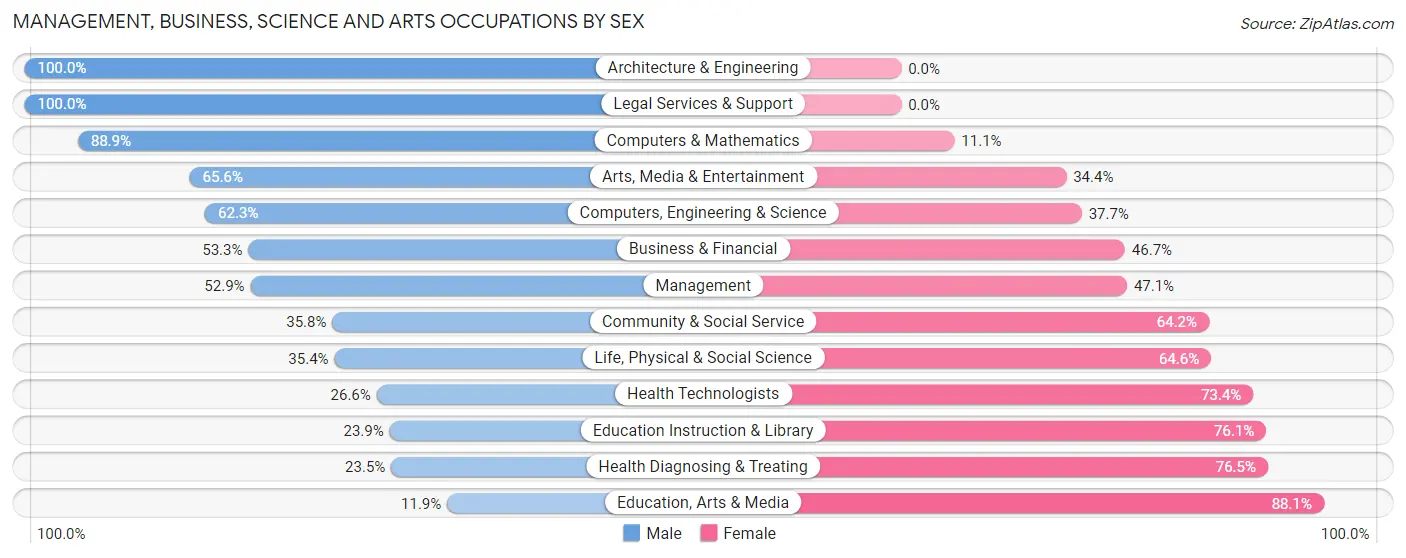
| Occupation | Male | Female |
| Management | 155 (52.9%) | 138 (47.1%) |
| Business & Financial | 104 (53.3%) | 91 (46.7%) |
| Computers, Engineering & Science | 96 (62.3%) | 58 (37.7%) |
| Computers & Mathematics | 40 (88.9%) | 5 (11.1%) |
| Architecture & Engineering | 27 (100.0%) | 0 (0.0%) |
| Life, Physical & Social Science | 29 (35.4%) | 53 (64.6%) |
| Community & Social Service | 144 (35.8%) | 258 (64.2%) |
| Education, Arts & Media | 7 (11.9%) | 52 (88.1%) |
| Legal Services & Support | 39 (100.0%) | 0 (0.0%) |
| Education Instruction & Library | 58 (23.9%) | 185 (76.1%) |
| Arts, Media & Entertainment | 40 (65.6%) | 21 (34.4%) |
| Health Diagnosing & Treating | 40 (23.5%) | 130 (76.5%) |
| Health Technologists | 38 (26.6%) | 105 (73.4%) |
| Total (Category) | 539 (44.4%) | 675 (55.6%) |
| Total (Overall) | 1,722 (52.6%) | 1,551 (47.4%) |
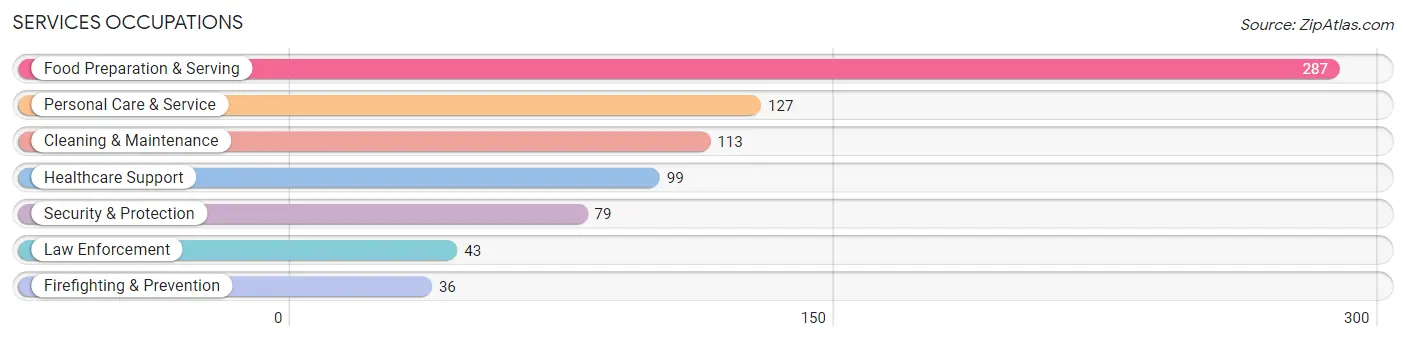
Services Occupations
The most common Services occupations in Kennett Square borough are Food Preparation & Serving (287 | 8.8%), Personal Care & Service (127 | 3.9%), Cleaning & Maintenance (113 | 3.5%), Healthcare Support (99 | 3.0%), and Security & Protection (79 | 2.4%).
Services Occupations by Sex
Within the Services occupations in Kennett Square borough, the most male-oriented occupations are Law Enforcement (100.0%), Security & Protection (92.4%), and Firefighting & Prevention (83.3%), while the most female-oriented occupations are Healthcare Support (90.9%), Personal Care & Service (70.9%), and Food Preparation & Serving (69.0%).
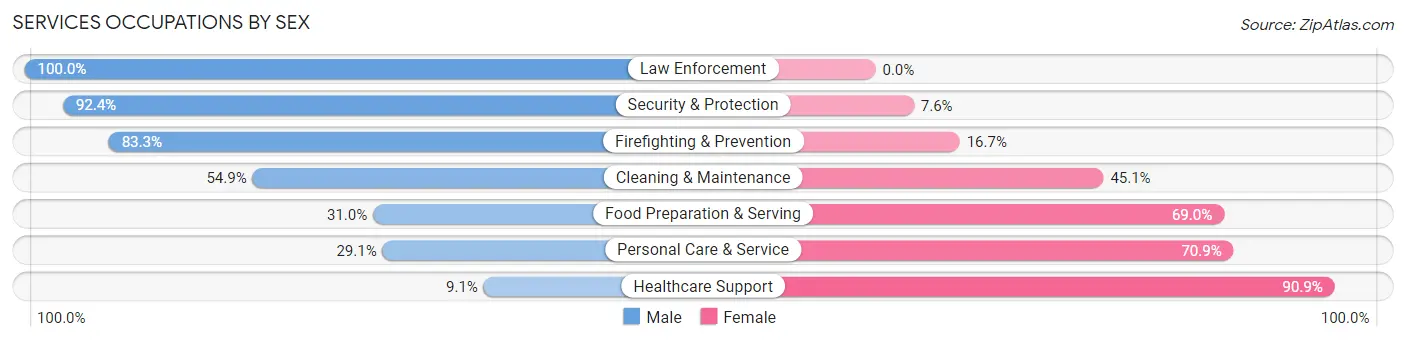
| Occupation | Male | Female |
| Healthcare Support | 9 (9.1%) | 90 (90.9%) |
| Security & Protection | 73 (92.4%) | 6 (7.6%) |
| Firefighting & Prevention | 30 (83.3%) | 6 (16.7%) |
| Law Enforcement | 43 (100.0%) | 0 (0.0%) |
| Food Preparation & Serving | 89 (31.0%) | 198 (69.0%) |
| Cleaning & Maintenance | 62 (54.9%) | 51 (45.1%) |
| Personal Care & Service | 37 (29.1%) | 90 (70.9%) |
| Total (Category) | 270 (38.3%) | 435 (61.7%) |
| Total (Overall) | 1,722 (52.6%) | 1,551 (47.4%) |
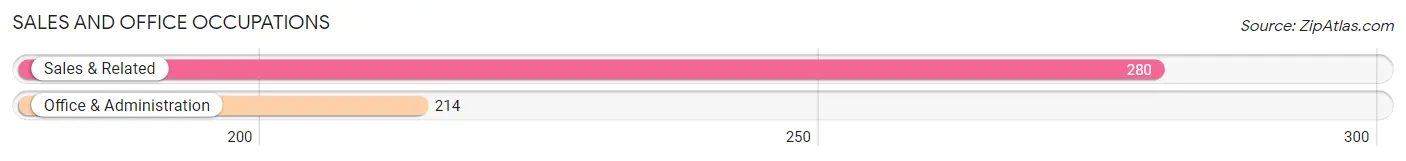
Sales and Office Occupations
The most common Sales and Office occupations in Kennett Square borough are Sales & Related (280 | 8.6%), and Office & Administration (214 | 6.5%).
Sales and Office Occupations by Sex
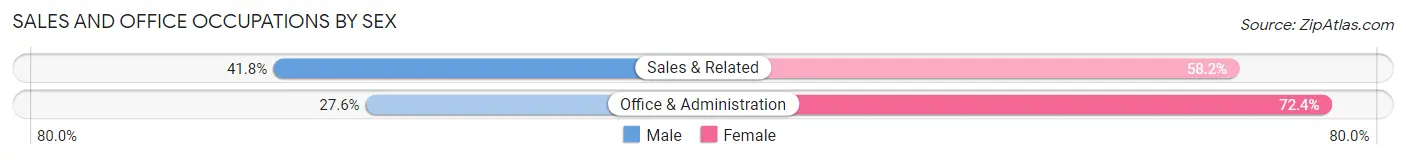
| Occupation | Male | Female |
| Sales & Related | 117 (41.8%) | 163 (58.2%) |
| Office & Administration | 59 (27.6%) | 155 (72.4%) |
| Total (Category) | 176 (35.6%) | 318 (64.4%) |
| Total (Overall) | 1,722 (52.6%) | 1,551 (47.4%) |
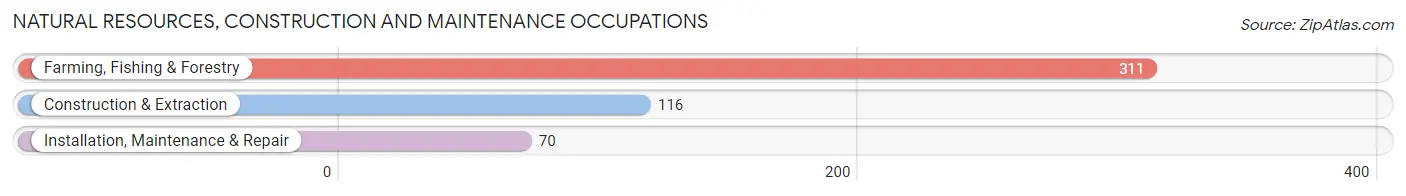
Natural Resources, Construction and Maintenance Occupations
The most common Natural Resources, Construction and Maintenance occupations in Kennett Square borough are Farming, Fishing & Forestry (311 | 9.5%), Construction & Extraction (116 | 3.5%), and Installation, Maintenance & Repair (70 | 2.1%).
Natural Resources, Construction and Maintenance Occupations by Sex
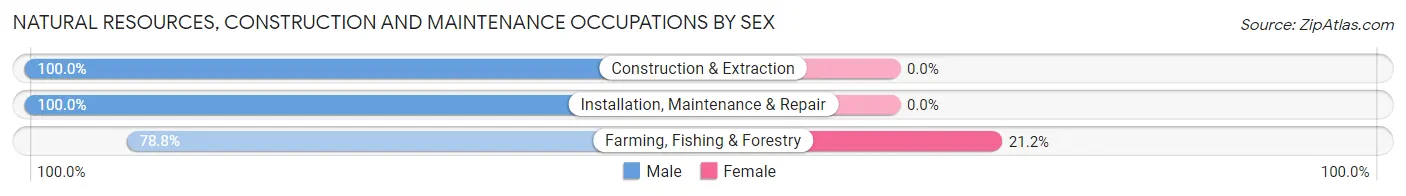
| Occupation | Male | Female |
| Farming, Fishing & Forestry | 245 (78.8%) | 66 (21.2%) |
| Construction & Extraction | 116 (100.0%) | 0 (0.0%) |
| Installation, Maintenance & Repair | 70 (100.0%) | 0 (0.0%) |
| Total (Category) | 431 (86.7%) | 66 (13.3%) |
| Total (Overall) | 1,722 (52.6%) | 1,551 (47.4%) |
Production, Transportation and Moving Occupations
The most common Production, Transportation and Moving occupations in Kennett Square borough are Material Moving (203 | 6.2%), Production (102 | 3.1%), and Transportation (58 | 1.8%).
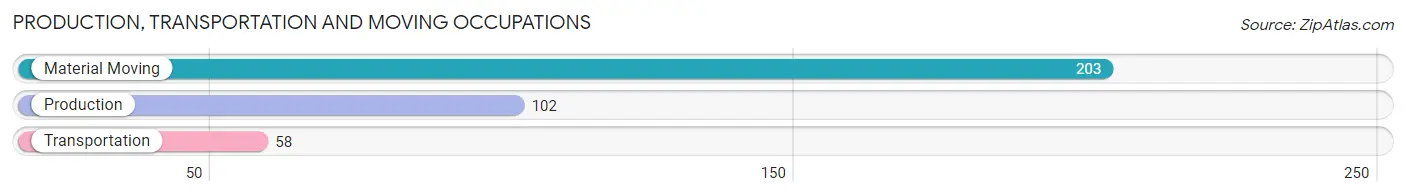
Production, Transportation and Moving Occupations by Sex
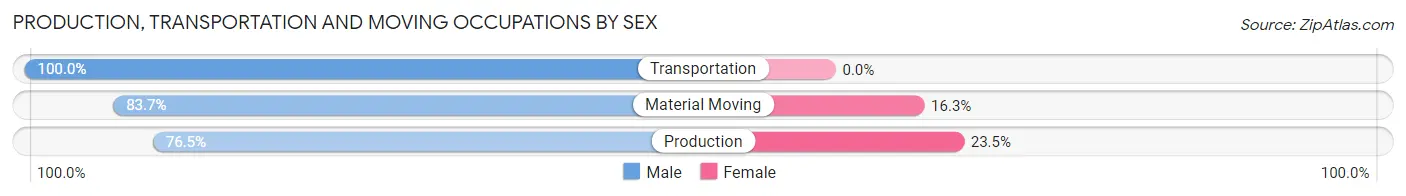
| Occupation | Male | Female |
| Production | 78 (76.5%) | 24 (23.5%) |
| Transportation | 58 (100.0%) | 0 (0.0%) |
| Material Moving | 170 (83.7%) | 33 (16.3%) |
| Total (Category) | 306 (84.3%) | 57 (15.7%) |
| Total (Overall) | 1,722 (52.6%) | 1,551 (47.4%) |
Employment Industries by Sex in Kennett Square borough
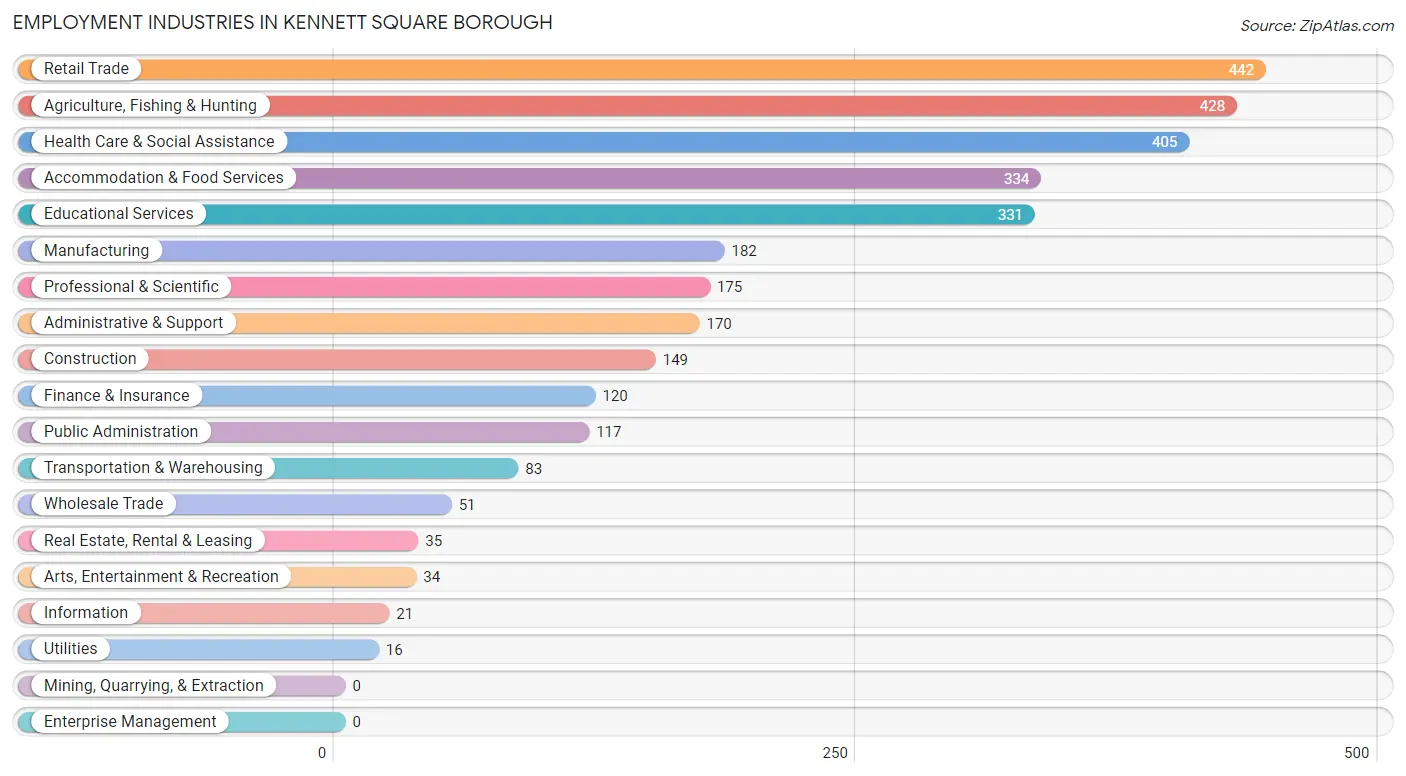
Employment Industries in Kennett Square borough
The major employment industries in Kennett Square borough include Retail Trade (442 | 13.5%), Agriculture, Fishing & Hunting (428 | 13.1%), Health Care & Social Assistance (405 | 12.4%), Accommodation & Food Services (334 | 10.2%), and Educational Services (331 | 10.1%).
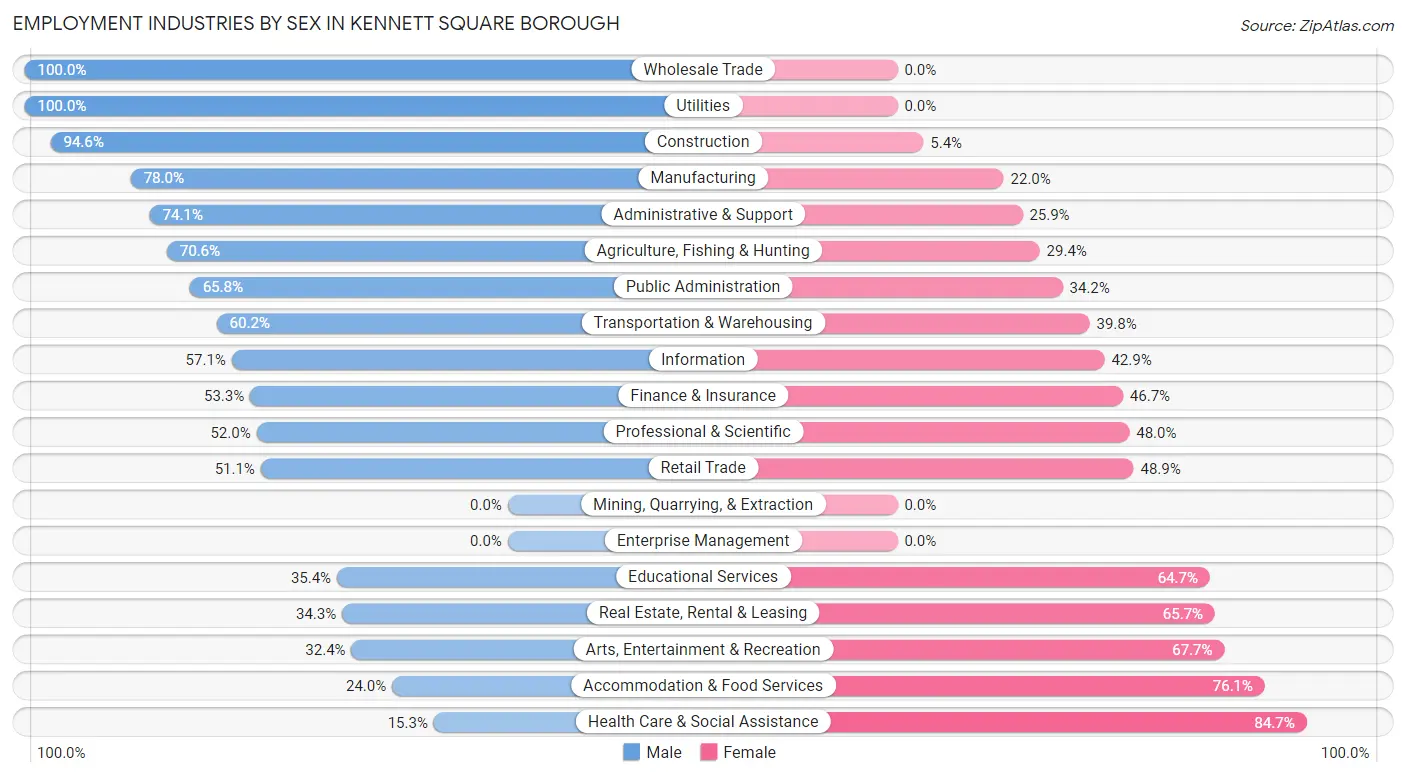
Employment Industries by Sex in Kennett Square borough
The Kennett Square borough industries that see more men than women are Wholesale Trade (100.0%), Utilities (100.0%), and Construction (94.6%), whereas the industries that tend to have a higher number of women are Health Care & Social Assistance (84.7%), Accommodation & Food Services (76.0%), and Arts, Entertainment & Recreation (67.6%).
| Industry | Male | Female |
| Agriculture, Fishing & Hunting | 302 (70.6%) | 126 (29.4%) |
| Mining, Quarrying, & Extraction | 0 (0.0%) | 0 (0.0%) |
| Construction | 141 (94.6%) | 8 (5.4%) |
| Manufacturing | 142 (78.0%) | 40 (22.0%) |
| Wholesale Trade | 51 (100.0%) | 0 (0.0%) |
| Retail Trade | 226 (51.1%) | 216 (48.9%) |
| Transportation & Warehousing | 50 (60.2%) | 33 (39.8%) |
| Utilities | 16 (100.0%) | 0 (0.0%) |
| Information | 12 (57.1%) | 9 (42.9%) |
| Finance & Insurance | 64 (53.3%) | 56 (46.7%) |
| Real Estate, Rental & Leasing | 12 (34.3%) | 23 (65.7%) |
| Professional & Scientific | 91 (52.0%) | 84 (48.0%) |
| Enterprise Management | 0 (0.0%) | 0 (0.0%) |
| Administrative & Support | 126 (74.1%) | 44 (25.9%) |
| Educational Services | 117 (35.3%) | 214 (64.6%) |
| Health Care & Social Assistance | 62 (15.3%) | 343 (84.7%) |
| Arts, Entertainment & Recreation | 11 (32.4%) | 23 (67.6%) |
| Accommodation & Food Services | 80 (23.9%) | 254 (76.0%) |
| Public Administration | 77 (65.8%) | 40 (34.2%) |
| Total | 1,722 (52.6%) | 1,551 (47.4%) |
Education in Kennett Square borough
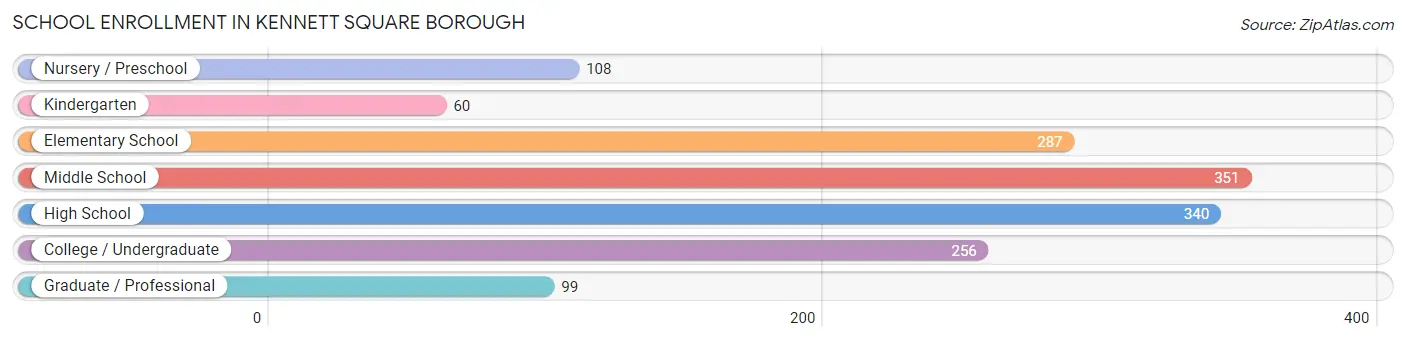
School Enrollment in Kennett Square borough
The most common levels of schooling among the 1,501 students in Kennett Square borough are middle school (351 | 23.4%), high school (340 | 22.7%), and elementary school (287 | 19.1%).
| School Level | # Students | % Students |
| Nursery / Preschool | 108 | 7.2% |
| Kindergarten | 60 | 4.0% |
| Elementary School | 287 | 19.1% |
| Middle School | 351 | 23.4% |
| High School | 340 | 22.7% |
| College / Undergraduate | 256 | 17.1% |
| Graduate / Professional | 99 | 6.6% |
| Total | 1,501 | 100.0% |
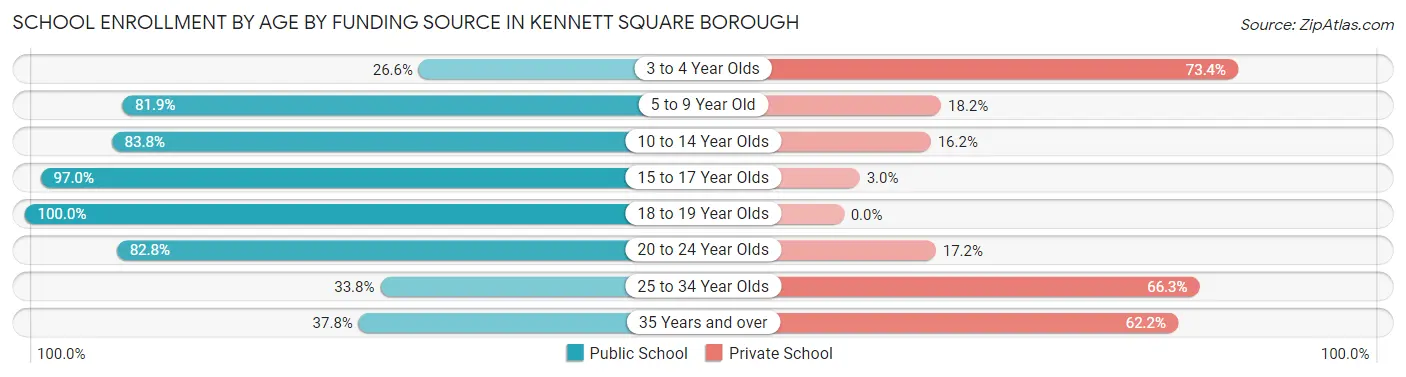
School Enrollment by Age by Funding Source in Kennett Square borough
Out of a total of 1,501 students who are enrolled in schools in Kennett Square borough, 329 (21.9%) attend a private institution, while the remaining 1,172 (78.1%) are enrolled in public schools. The age group of 3 to 4 year olds has the highest likelihood of being enrolled in private schools, with 58 (73.4% in the age bracket) enrolled. Conversely, the age group of 18 to 19 year olds has the lowest likelihood of being enrolled in a private school, with 109 (100.0% in the age bracket) attending a public institution.
| Age Bracket | Public School | Private School |
| 3 to 4 Year Olds | 21 (26.6%) | 58 (73.4%) |
| 5 to 9 Year Old | 266 (81.9%) | 59 (18.1%) |
| 10 to 14 Year Olds | 377 (83.8%) | 73 (16.2%) |
| 15 to 17 Year Olds | 227 (97.0%) | 7 (3.0%) |
| 18 to 19 Year Olds | 109 (100.0%) | 0 (0.0%) |
| 20 to 24 Year Olds | 111 (82.8%) | 23 (17.2%) |
| 25 to 34 Year Olds | 27 (33.8%) | 53 (66.2%) |
| 35 Years and over | 34 (37.8%) | 56 (62.2%) |
| Total | 1,172 (78.1%) | 329 (21.9%) |
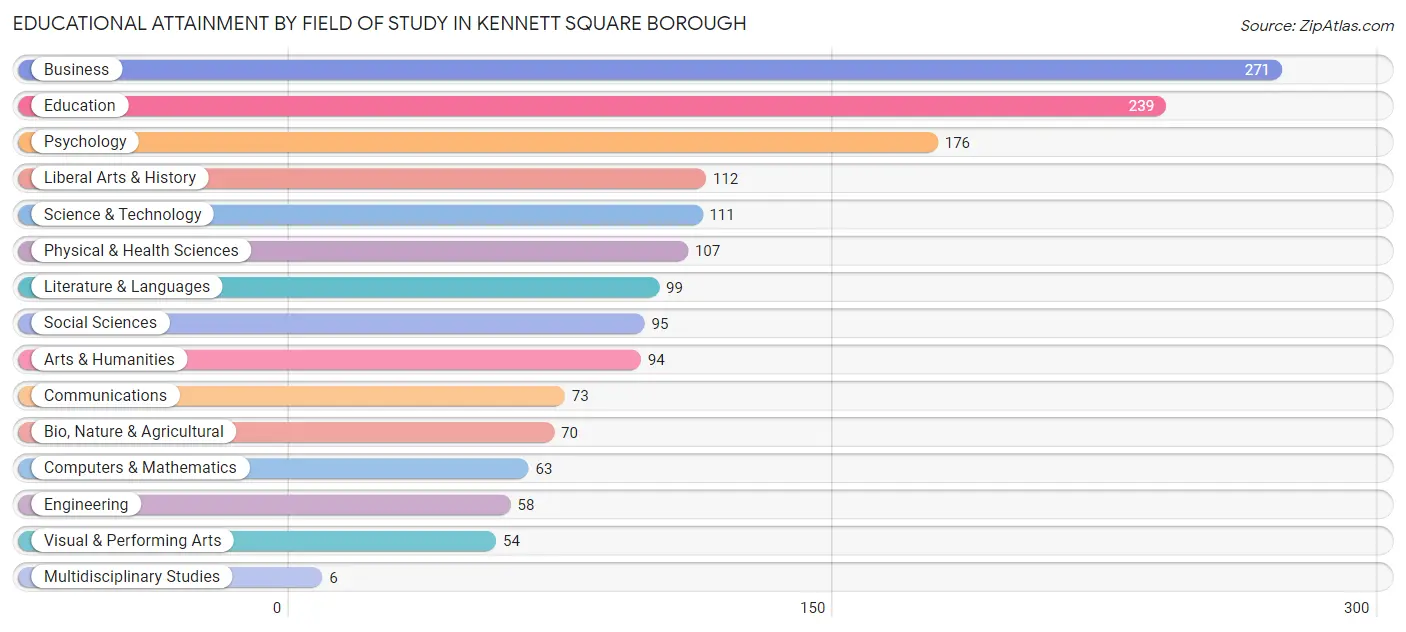
Educational Attainment by Field of Study in Kennett Square borough
Business (271 | 16.7%), education (239 | 14.7%), psychology (176 | 10.8%), liberal arts & history (112 | 6.9%), and science & technology (111 | 6.8%) are the most common fields of study among 1,628 individuals in Kennett Square borough who have obtained a bachelor's degree or higher.
| Field of Study | # Graduates | % Graduates |
| Computers & Mathematics | 63 | 3.9% |
| Bio, Nature & Agricultural | 70 | 4.3% |
| Physical & Health Sciences | 107 | 6.6% |
| Psychology | 176 | 10.8% |
| Social Sciences | 95 | 5.8% |
| Engineering | 58 | 3.6% |
| Multidisciplinary Studies | 6 | 0.4% |
| Science & Technology | 111 | 6.8% |
| Business | 271 | 16.7% |
| Education | 239 | 14.7% |
| Literature & Languages | 99 | 6.1% |
| Liberal Arts & History | 112 | 6.9% |
| Visual & Performing Arts | 54 | 3.3% |
| Communications | 73 | 4.5% |
| Arts & Humanities | 94 | 5.8% |
| Total | 1,628 | 100.0% |
Transportation & Commute in Kennett Square borough
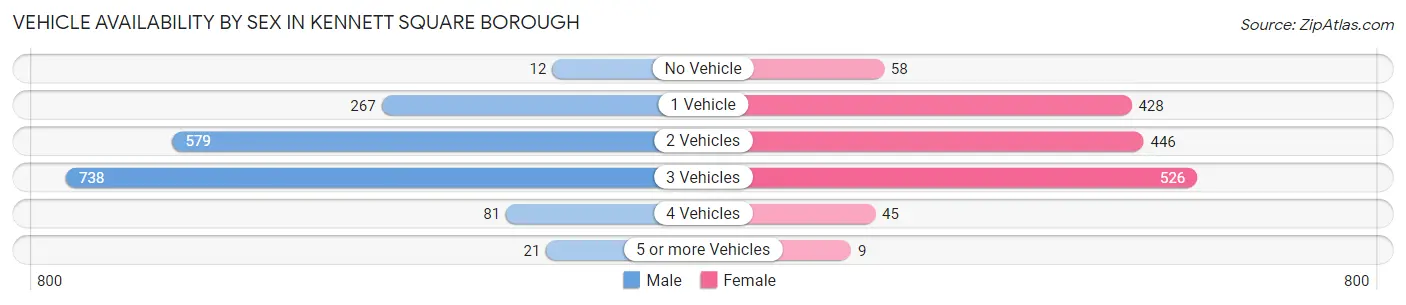
Vehicle Availability by Sex in Kennett Square borough
The most prevalent vehicle ownership categories in Kennett Square borough are males with 3 vehicles (738, accounting for 43.5%) and females with 3 vehicles (526, making up 48.8%).
| Vehicles Available | Male | Female |
| No Vehicle | 12 (0.7%) | 58 (3.8%) |
| 1 Vehicle | 267 (15.7%) | 428 (28.3%) |
| 2 Vehicles | 579 (34.1%) | 446 (29.5%) |
| 3 Vehicles | 738 (43.5%) | 526 (34.8%) |
| 4 Vehicles | 81 (4.8%) | 45 (3.0%) |
| 5 or more Vehicles | 21 (1.2%) | 9 (0.6%) |
| Total | 1,698 (100.0%) | 1,512 (100.0%) |
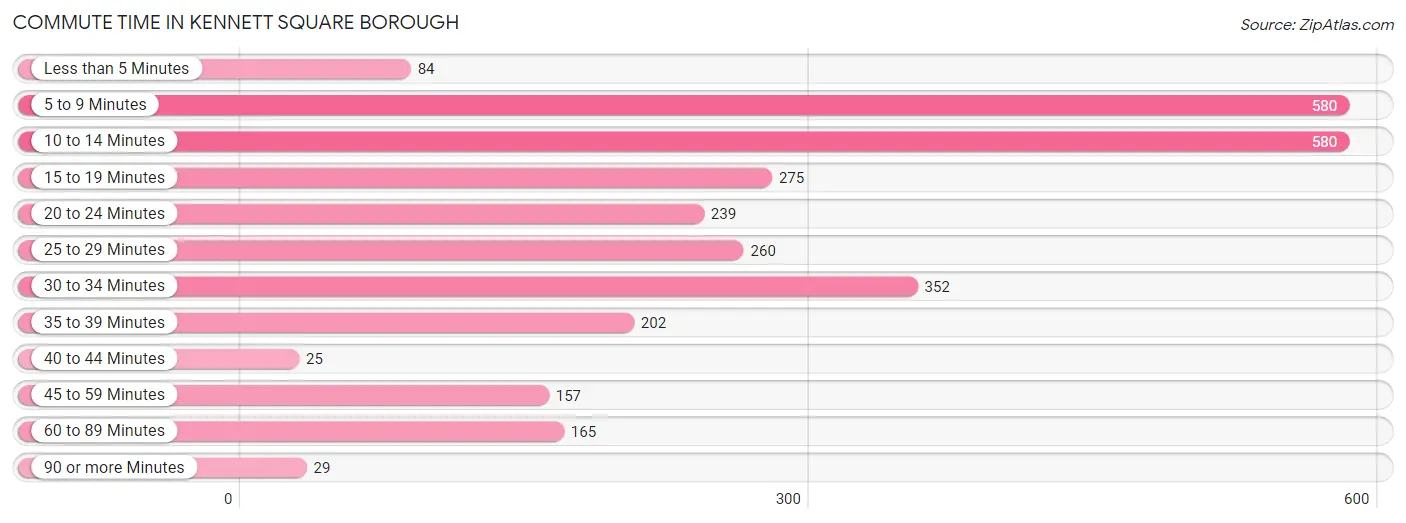
Commute Time in Kennett Square borough
The most frequently occuring commute durations in Kennett Square borough are 5 to 9 minutes (580 commuters, 19.7%), 10 to 14 minutes (580 commuters, 19.7%), and 30 to 34 minutes (352 commuters, 11.9%).
| Commute Time | # Commuters | % Commuters |
| Less than 5 Minutes | 84 | 2.9% |
| 5 to 9 Minutes | 580 | 19.7% |
| 10 to 14 Minutes | 580 | 19.7% |
| 15 to 19 Minutes | 275 | 9.3% |
| 20 to 24 Minutes | 239 | 8.1% |
| 25 to 29 Minutes | 260 | 8.8% |
| 30 to 34 Minutes | 352 | 11.9% |
| 35 to 39 Minutes | 202 | 6.9% |
| 40 to 44 Minutes | 25 | 0.9% |
| 45 to 59 Minutes | 157 | 5.3% |
| 60 to 89 Minutes | 165 | 5.6% |
| 90 or more Minutes | 29 | 1.0% |
Commute Time by Sex in Kennett Square borough
The most common commute times in Kennett Square borough are 10 to 14 minutes (311 commuters, 19.6%) for males and 5 to 9 minutes (274 commuters, 20.2%) for females.
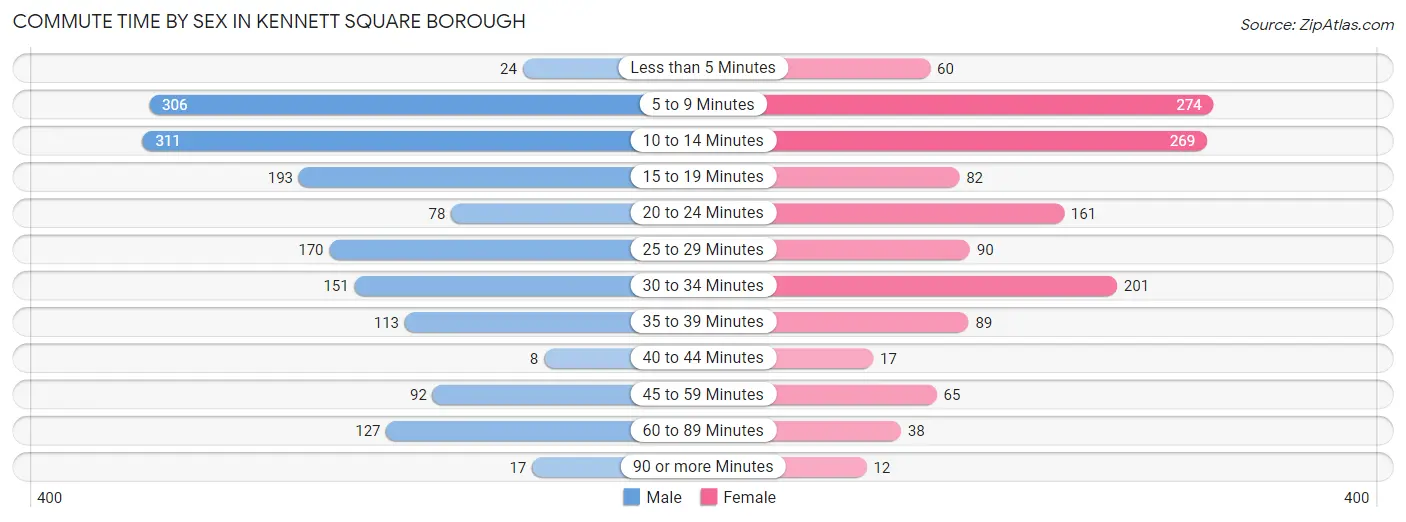
| Commute Time | Male | Female |
| Less than 5 Minutes | 24 (1.5%) | 60 (4.4%) |
| 5 to 9 Minutes | 306 (19.3%) | 274 (20.2%) |
| 10 to 14 Minutes | 311 (19.6%) | 269 (19.8%) |
| 15 to 19 Minutes | 193 (12.1%) | 82 (6.0%) |
| 20 to 24 Minutes | 78 (4.9%) | 161 (11.9%) |
| 25 to 29 Minutes | 170 (10.7%) | 90 (6.6%) |
| 30 to 34 Minutes | 151 (9.5%) | 201 (14.8%) |
| 35 to 39 Minutes | 113 (7.1%) | 89 (6.6%) |
| 40 to 44 Minutes | 8 (0.5%) | 17 (1.3%) |
| 45 to 59 Minutes | 92 (5.8%) | 65 (4.8%) |
| 60 to 89 Minutes | 127 (8.0%) | 38 (2.8%) |
| 90 or more Minutes | 17 (1.1%) | 12 (0.9%) |
Time of Departure to Work by Sex in Kennett Square borough
The most frequent times of departure to work in Kennett Square borough are 4:00 PM to 11:59 PM (299, 18.8%) for males and 7:30 AM to 7:59 AM (240, 17.7%) for females.
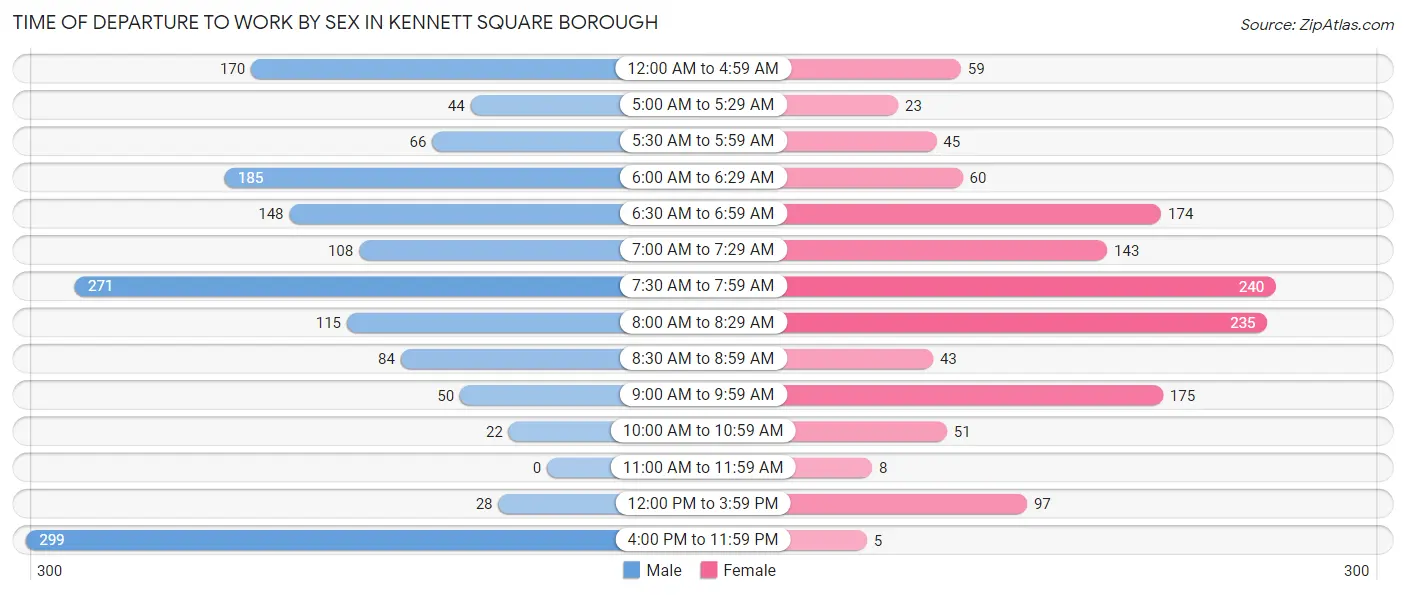
| Time of Departure | Male | Female |
| 12:00 AM to 4:59 AM | 170 (10.7%) | 59 (4.3%) |
| 5:00 AM to 5:29 AM | 44 (2.8%) | 23 (1.7%) |
| 5:30 AM to 5:59 AM | 66 (4.2%) | 45 (3.3%) |
| 6:00 AM to 6:29 AM | 185 (11.6%) | 60 (4.4%) |
| 6:30 AM to 6:59 AM | 148 (9.3%) | 174 (12.8%) |
| 7:00 AM to 7:29 AM | 108 (6.8%) | 143 (10.5%) |
| 7:30 AM to 7:59 AM | 271 (17.0%) | 240 (17.7%) |
| 8:00 AM to 8:29 AM | 115 (7.2%) | 235 (17.3%) |
| 8:30 AM to 8:59 AM | 84 (5.3%) | 43 (3.2%) |
| 9:00 AM to 9:59 AM | 50 (3.1%) | 175 (12.9%) |
| 10:00 AM to 10:59 AM | 22 (1.4%) | 51 (3.8%) |
| 11:00 AM to 11:59 AM | 0 (0.0%) | 8 (0.6%) |
| 12:00 PM to 3:59 PM | 28 (1.8%) | 97 (7.1%) |
| 4:00 PM to 11:59 PM | 299 (18.8%) | 5 (0.4%) |
| Total | 1,590 (100.0%) | 1,358 (100.0%) |
Housing Occupancy in Kennett Square borough
Occupancy by Ownership in Kennett Square borough
Of the total 2,233 dwellings in Kennett Square borough, owner-occupied units account for 1,259 (56.4%), while renter-occupied units make up 974 (43.6%).
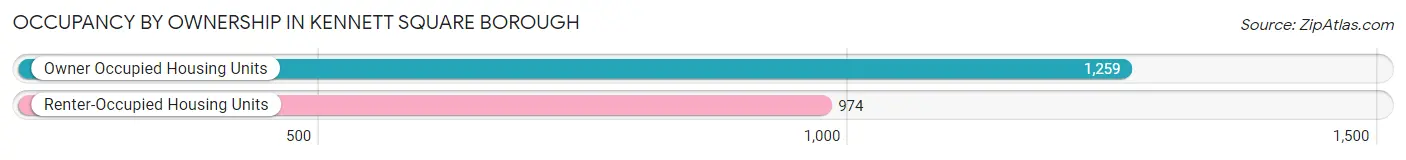
| Occupancy | # Housing Units | % Housing Units |
| Owner Occupied Housing Units | 1,259 | 56.4% |
| Renter-Occupied Housing Units | 974 | 43.6% |
| Total Occupied Housing Units | 2,233 | 100.0% |
Occupancy by Household Size in Kennett Square borough
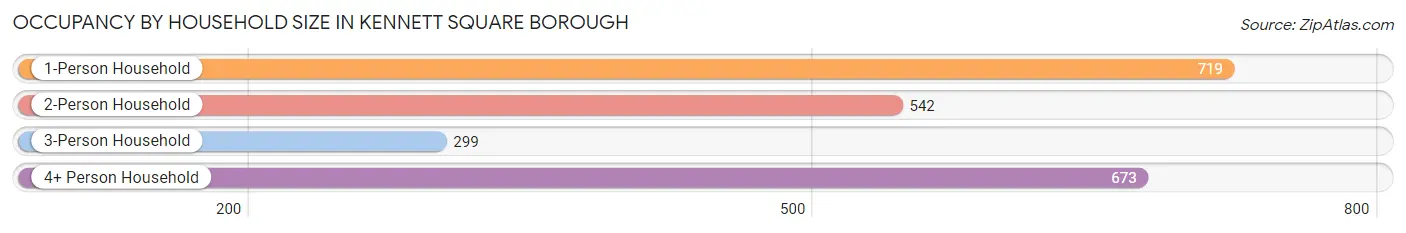
| Household Size | # Housing Units | % Housing Units |
| 1-Person Household | 719 | 32.2% |
| 2-Person Household | 542 | 24.3% |
| 3-Person Household | 299 | 13.4% |
| 4+ Person Household | 673 | 30.1% |
| Total Housing Units | 2,233 | 100.0% |
Occupancy by Ownership by Household Size in Kennett Square borough
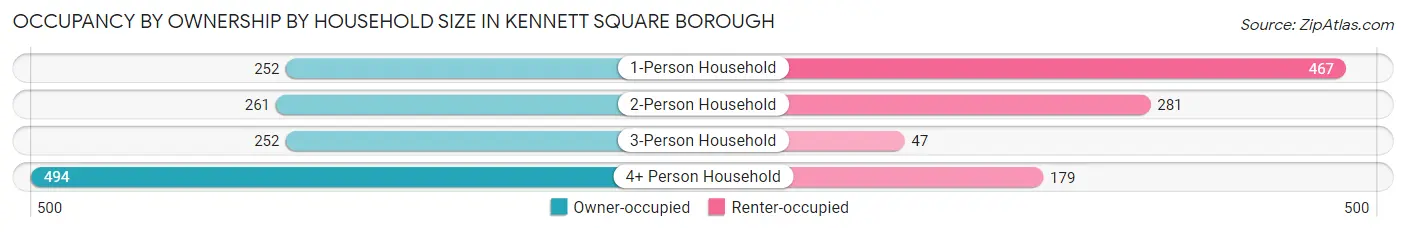
| Household Size | Owner-occupied | Renter-occupied |
| 1-Person Household | 252 (35.0%) | 467 (64.9%) |
| 2-Person Household | 261 (48.1%) | 281 (51.8%) |
| 3-Person Household | 252 (84.3%) | 47 (15.7%) |
| 4+ Person Household | 494 (73.4%) | 179 (26.6%) |
| Total Housing Units | 1,259 (56.4%) | 974 (43.6%) |
Occupancy by Educational Attainment in Kennett Square borough
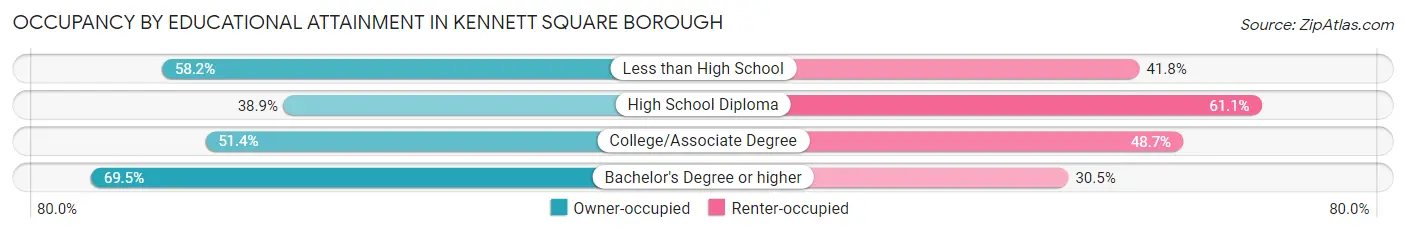
| Household Size | Owner-occupied | Renter-occupied |
| Less than High School | 170 (58.2%) | 122 (41.8%) |
| High School Diploma | 219 (38.9%) | 344 (61.1%) |
| College/Associate Degree | 248 (51.3%) | 235 (48.6%) |
| Bachelor's Degree or higher | 622 (69.5%) | 273 (30.5%) |
Occupancy by Age of Householder in Kennett Square borough
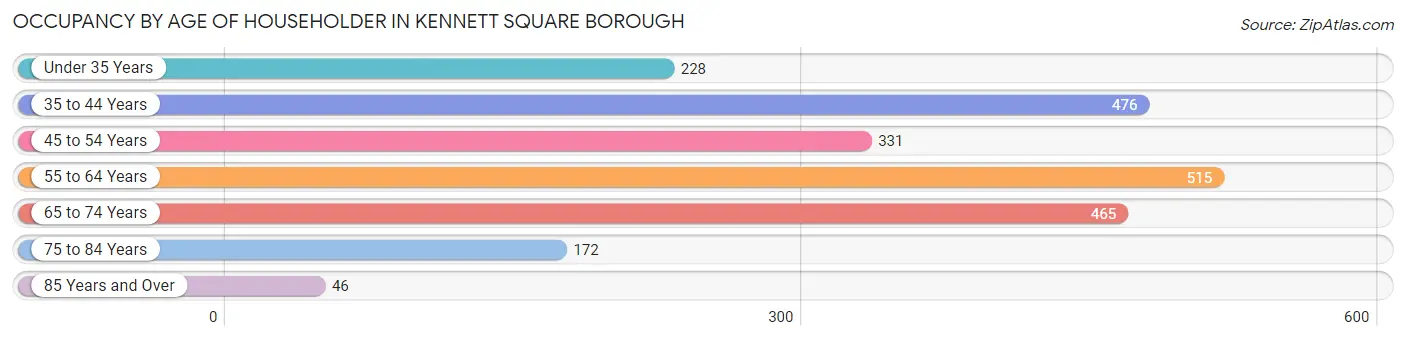
| Age Bracket | # Households | % Households |
| Under 35 Years | 228 | 10.2% |
| 35 to 44 Years | 476 | 21.3% |
| 45 to 54 Years | 331 | 14.8% |
| 55 to 64 Years | 515 | 23.1% |
| 65 to 74 Years | 465 | 20.8% |
| 75 to 84 Years | 172 | 7.7% |
| 85 Years and Over | 46 | 2.1% |
| Total | 2,233 | 100.0% |
Housing Finances in Kennett Square borough
Median Income by Occupancy in Kennett Square borough
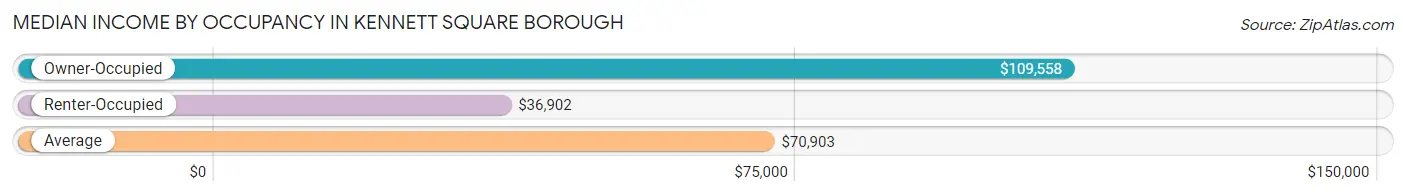
| Occupancy Type | # Households | Median Income |
| Owner-Occupied | 1,259 (56.4%) | $109,558 |
| Renter-Occupied | 974 (43.6%) | $36,902 |
| Average | 2,233 (100.0%) | $70,903 |
Occupancy by Householder Income Bracket in Kennett Square borough
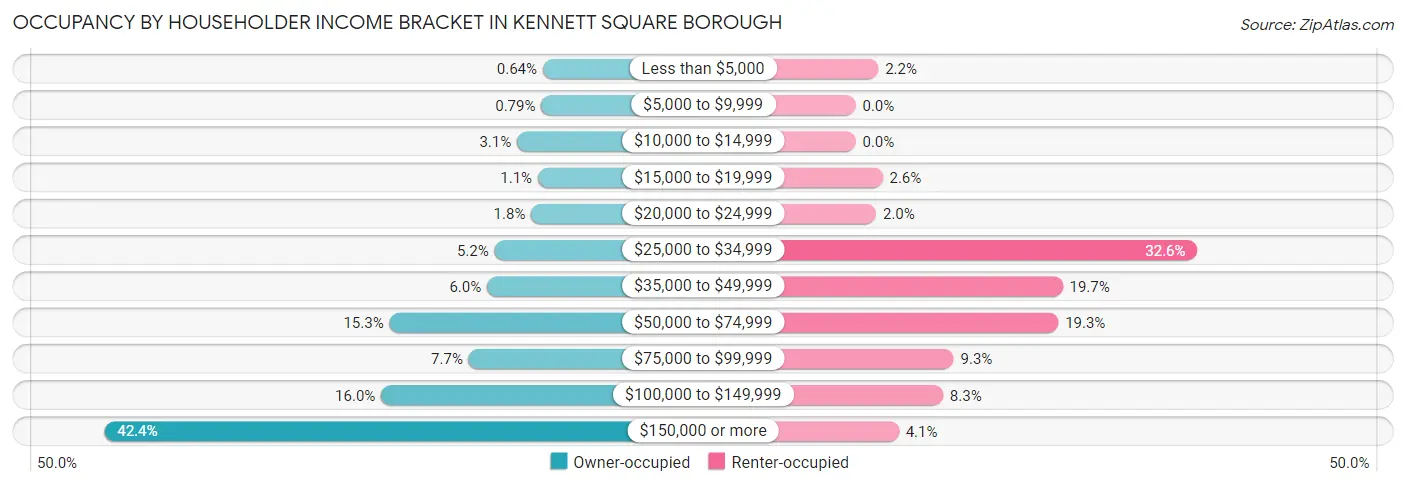
| Income Bracket | Owner-occupied | Renter-occupied |
| Less than $5,000 | 8 (0.6%) | 21 (2.2%) |
| $5,000 to $9,999 | 10 (0.8%) | 0 (0.0%) |
| $10,000 to $14,999 | 39 (3.1%) | 0 (0.0%) |
| $15,000 to $19,999 | 14 (1.1%) | 25 (2.6%) |
| $20,000 to $24,999 | 22 (1.8%) | 19 (1.9%) |
| $25,000 to $34,999 | 66 (5.2%) | 317 (32.6%) |
| $35,000 to $49,999 | 75 (6.0%) | 192 (19.7%) |
| $50,000 to $74,999 | 192 (15.2%) | 188 (19.3%) |
| $75,000 to $99,999 | 97 (7.7%) | 91 (9.3%) |
| $100,000 to $149,999 | 202 (16.0%) | 81 (8.3%) |
| $150,000 or more | 534 (42.4%) | 40 (4.1%) |
| Total | 1,259 (100.0%) | 974 (100.0%) |
Monthly Housing Cost Tiers in Kennett Square borough
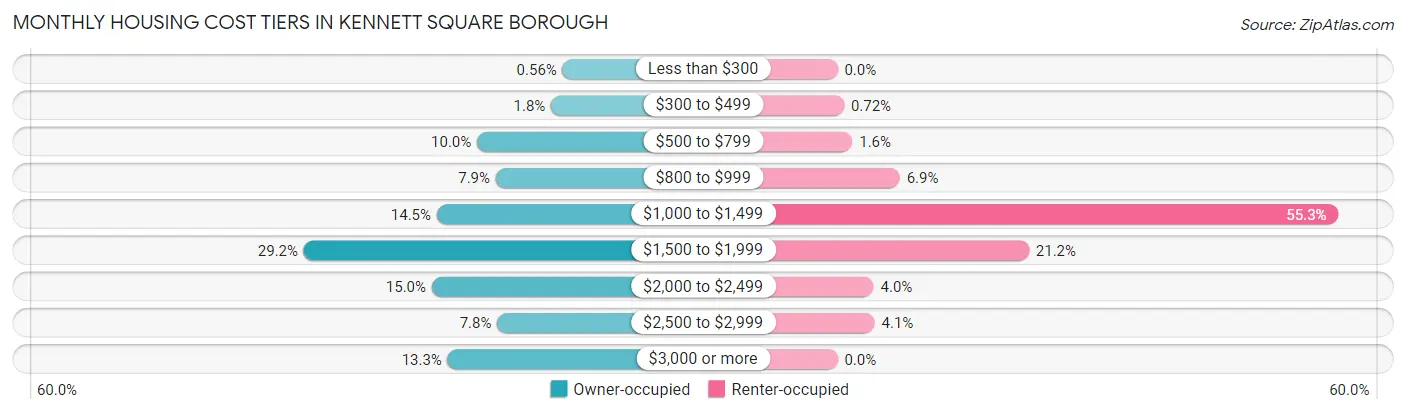
| Monthly Cost | Owner-occupied | Renter-occupied |
| Less than $300 | 7 (0.6%) | 0 (0.0%) |
| $300 to $499 | 23 (1.8%) | 7 (0.7%) |
| $500 to $799 | 126 (10.0%) | 16 (1.6%) |
| $800 to $999 | 100 (7.9%) | 67 (6.9%) |
| $1,000 to $1,499 | 182 (14.5%) | 539 (55.3%) |
| $1,500 to $1,999 | 367 (29.1%) | 206 (21.1%) |
| $2,000 to $2,499 | 189 (15.0%) | 39 (4.0%) |
| $2,500 to $2,999 | 98 (7.8%) | 40 (4.1%) |
| $3,000 or more | 167 (13.3%) | 0 (0.0%) |
| Total | 1,259 (100.0%) | 974 (100.0%) |
Physical Housing Characteristics in Kennett Square borough
Housing Structures in Kennett Square borough
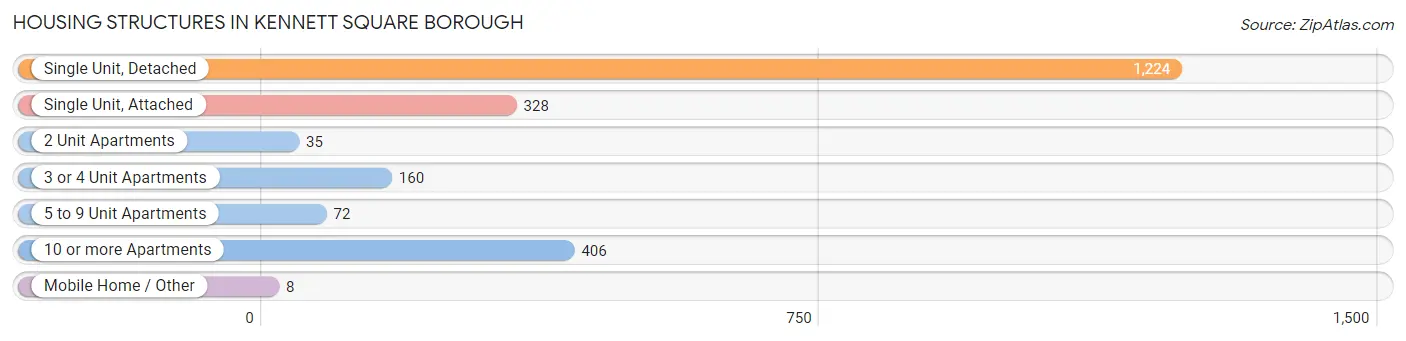
| Structure Type | # Housing Units | % Housing Units |
| Single Unit, Detached | 1,224 | 54.8% |
| Single Unit, Attached | 328 | 14.7% |
| 2 Unit Apartments | 35 | 1.6% |
| 3 or 4 Unit Apartments | 160 | 7.2% |
| 5 to 9 Unit Apartments | 72 | 3.2% |
| 10 or more Apartments | 406 | 18.2% |
| Mobile Home / Other | 8 | 0.4% |
| Total | 2,233 | 100.0% |
Housing Structures by Occupancy in Kennett Square borough
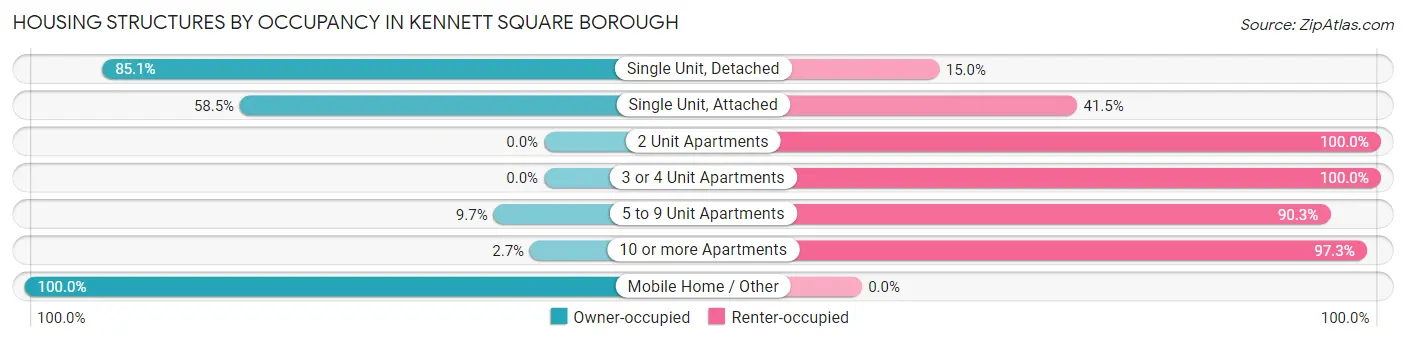
| Structure Type | Owner-occupied | Renter-occupied |
| Single Unit, Detached | 1,041 (85.1%) | 183 (14.9%) |
| Single Unit, Attached | 192 (58.5%) | 136 (41.5%) |
| 2 Unit Apartments | 0 (0.0%) | 35 (100.0%) |
| 3 or 4 Unit Apartments | 0 (0.0%) | 160 (100.0%) |
| 5 to 9 Unit Apartments | 7 (9.7%) | 65 (90.3%) |
| 10 or more Apartments | 11 (2.7%) | 395 (97.3%) |
| Mobile Home / Other | 8 (100.0%) | 0 (0.0%) |
| Total | 1,259 (56.4%) | 974 (43.6%) |
Housing Structures by Number of Rooms in Kennett Square borough
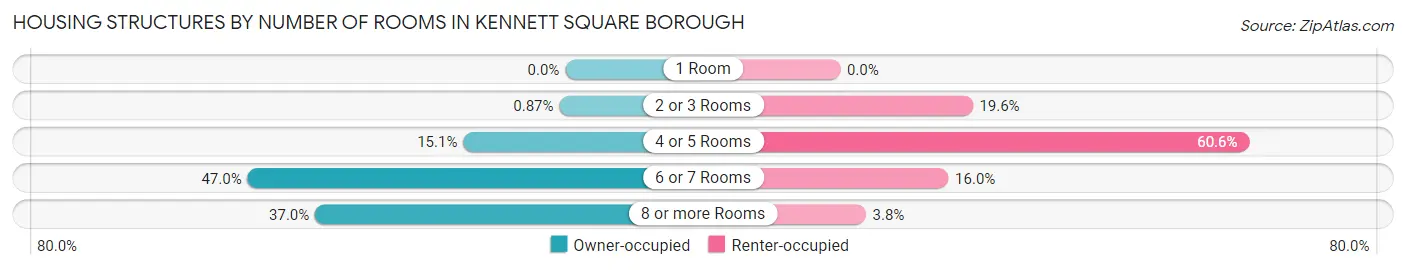
| Number of Rooms | Owner-occupied | Renter-occupied |
| 1 Room | 0 (0.0%) | 0 (0.0%) |
| 2 or 3 Rooms | 11 (0.9%) | 191 (19.6%) |
| 4 or 5 Rooms | 190 (15.1%) | 590 (60.6%) |
| 6 or 7 Rooms | 592 (47.0%) | 156 (16.0%) |
| 8 or more Rooms | 466 (37.0%) | 37 (3.8%) |
| Total | 1,259 (100.0%) | 974 (100.0%) |
Housing Structure by Heating Type in Kennett Square borough
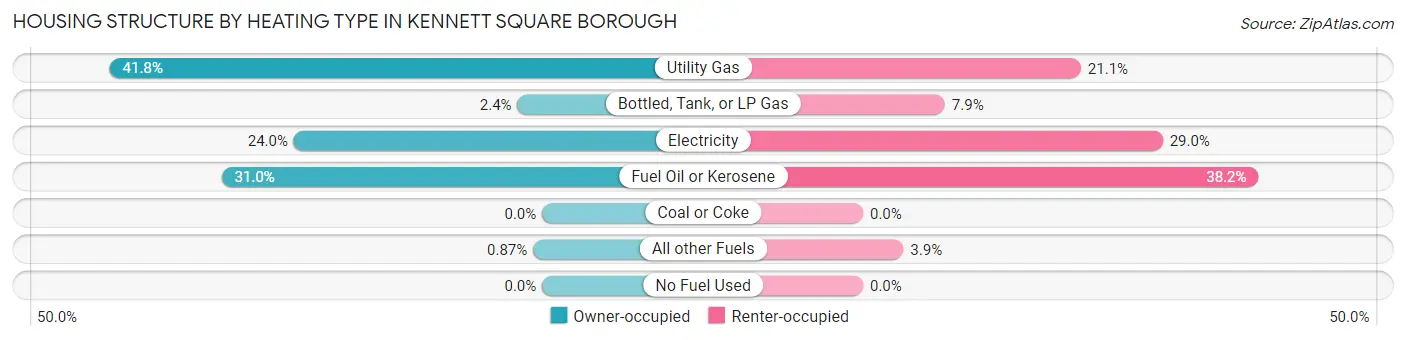
| Heating Type | Owner-occupied | Renter-occupied |
| Utility Gas | 526 (41.8%) | 205 (21.0%) |
| Bottled, Tank, or LP Gas | 30 (2.4%) | 77 (7.9%) |
| Electricity | 302 (24.0%) | 282 (28.9%) |
| Fuel Oil or Kerosene | 390 (31.0%) | 372 (38.2%) |
| Coal or Coke | 0 (0.0%) | 0 (0.0%) |
| All other Fuels | 11 (0.9%) | 38 (3.9%) |
| No Fuel Used | 0 (0.0%) | 0 (0.0%) |
| Total | 1,259 (100.0%) | 974 (100.0%) |
Household Vehicle Usage in Kennett Square borough
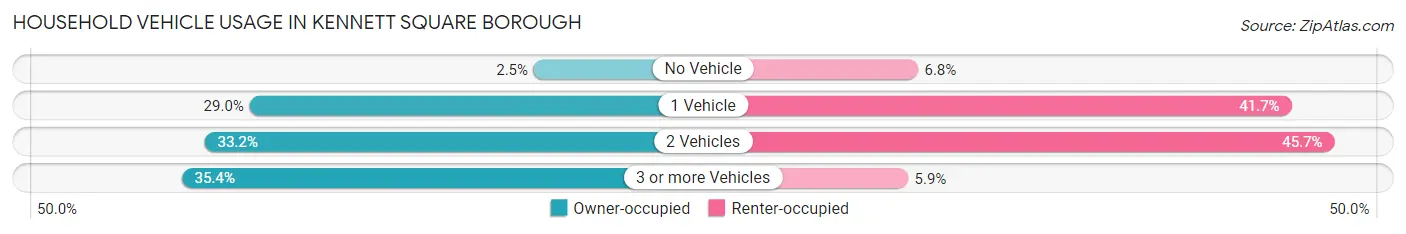
| Vehicles per Household | Owner-occupied | Renter-occupied |
| No Vehicle | 31 (2.5%) | 66 (6.8%) |
| 1 Vehicle | 365 (29.0%) | 406 (41.7%) |
| 2 Vehicles | 418 (33.2%) | 445 (45.7%) |
| 3 or more Vehicles | 445 (35.3%) | 57 (5.9%) |
| Total | 1,259 (100.0%) | 974 (100.0%) |
Real Estate & Mortgages in Kennett Square borough
Real Estate and Mortgage Overview in Kennett Square borough
| Characteristic | Without Mortgage | With Mortgage |
| Housing Units | 344 | 915 |
| Median Property Value | $340,000 | $319,500 |
| Median Household Income | $71,400 | $435 |
| Monthly Housing Costs | $884 | $161 |
| Real Estate Taxes | $4,486 | $31 |
Property Value by Mortgage Status in Kennett Square borough
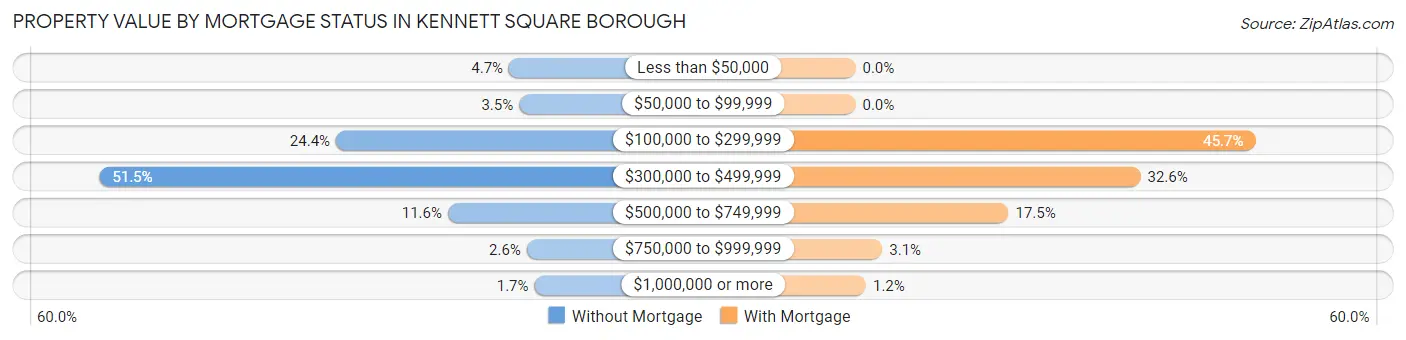
| Property Value | Without Mortgage | With Mortgage |
| Less than $50,000 | 16 (4.6%) | 0 (0.0%) |
| $50,000 to $99,999 | 12 (3.5%) | 0 (0.0%) |
| $100,000 to $299,999 | 84 (24.4%) | 418 (45.7%) |
| $300,000 to $499,999 | 177 (51.4%) | 298 (32.6%) |
| $500,000 to $749,999 | 40 (11.6%) | 160 (17.5%) |
| $750,000 to $999,999 | 9 (2.6%) | 28 (3.1%) |
| $1,000,000 or more | 6 (1.7%) | 11 (1.2%) |
| Total | 344 (100.0%) | 915 (100.0%) |
Household Income by Mortgage Status in Kennett Square borough
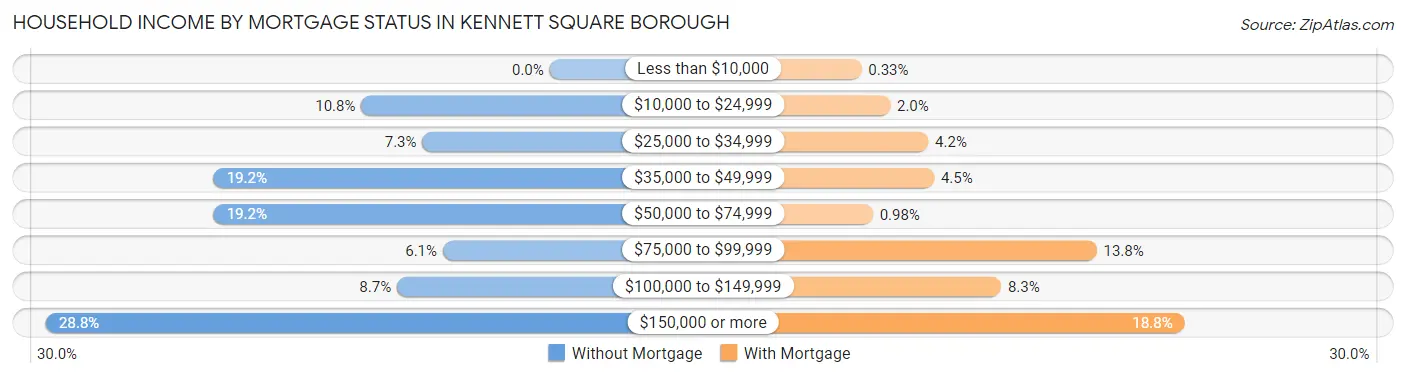
| Household Income | Without Mortgage | With Mortgage |
| Less than $10,000 | 0 (0.0%) | 3 (0.3%) |
| $10,000 to $24,999 | 37 (10.8%) | 18 (2.0%) |
| $25,000 to $34,999 | 25 (7.3%) | 38 (4.2%) |
| $35,000 to $49,999 | 66 (19.2%) | 41 (4.5%) |
| $50,000 to $74,999 | 66 (19.2%) | 9 (1.0%) |
| $75,000 to $99,999 | 21 (6.1%) | 126 (13.8%) |
| $100,000 to $149,999 | 30 (8.7%) | 76 (8.3%) |
| $150,000 or more | 99 (28.8%) | 172 (18.8%) |
| Total | 344 (100.0%) | 915 (100.0%) |
Property Value to Household Income Ratio in Kennett Square borough
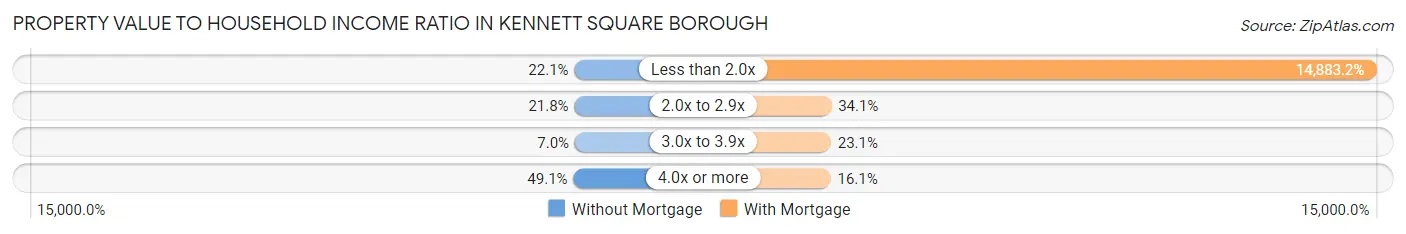
| Value-to-Income Ratio | Without Mortgage | With Mortgage |
| Less than 2.0x | 76 (22.1%) | 136,181 (14,883.2%) |
| 2.0x to 2.9x | 75 (21.8%) | 312 (34.1%) |
| 3.0x to 3.9x | 24 (7.0%) | 211 (23.1%) |
| 4.0x or more | 169 (49.1%) | 147 (16.1%) |
| Total | 344 (100.0%) | 915 (100.0%) |
Real Estate Taxes by Mortgage Status in Kennett Square borough
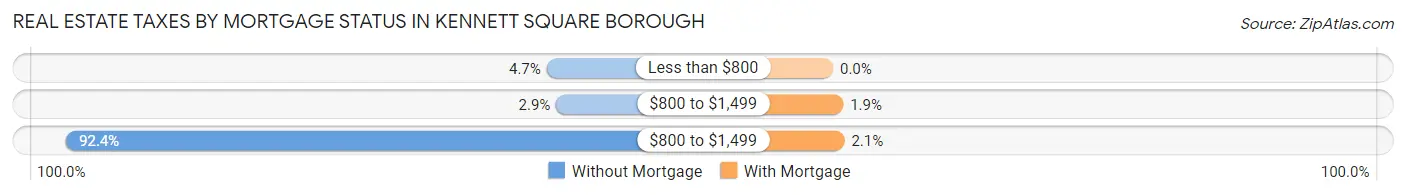
| Property Taxes | Without Mortgage | With Mortgage |
| Less than $800 | 16 (4.6%) | 0 (0.0%) |
| $800 to $1,499 | 10 (2.9%) | 17 (1.9%) |
| $800 to $1,499 | 318 (92.4%) | 19 (2.1%) |
| Total | 344 (100.0%) | 915 (100.0%) |
Health & Disability in Kennett Square borough
Health Insurance Coverage by Age in Kennett Square borough
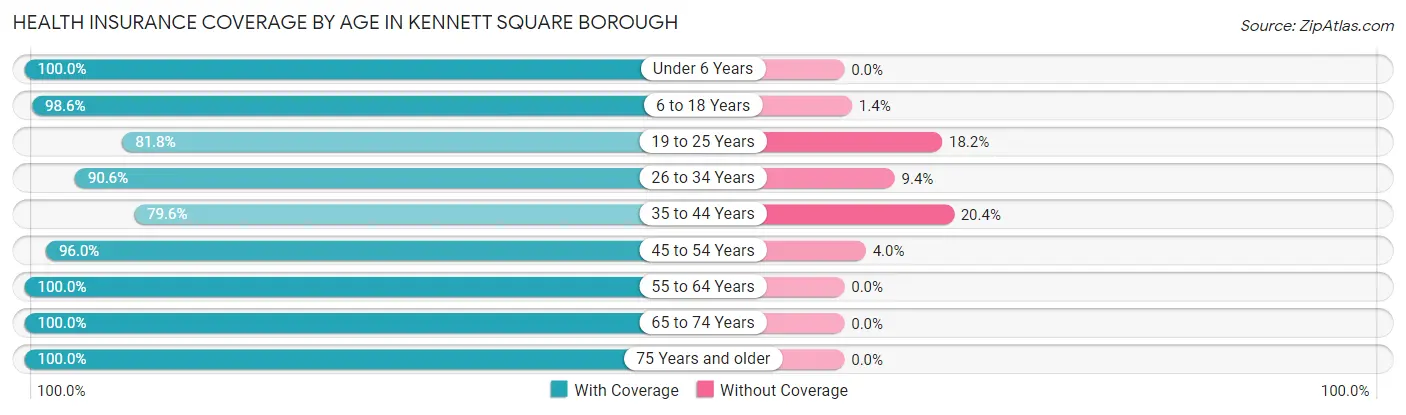
| Age Bracket | With Coverage | Without Coverage |
| Under 6 Years | 373 (100.0%) | 0 (0.0%) |
| 6 to 18 Years | 1,038 (98.6%) | 15 (1.4%) |
| 19 to 25 Years | 637 (81.8%) | 142 (18.2%) |
| 26 to 34 Years | 425 (90.6%) | 44 (9.4%) |
| 35 to 44 Years | 706 (79.6%) | 181 (20.4%) |
| 45 to 54 Years | 625 (96.0%) | 26 (4.0%) |
| 55 to 64 Years | 884 (100.0%) | 0 (0.0%) |
| 65 to 74 Years | 610 (100.0%) | 0 (0.0%) |
| 75 Years and older | 250 (100.0%) | 0 (0.0%) |
| Total | 5,548 (93.1%) | 408 (6.9%) |
Health Insurance Coverage by Citizenship Status in Kennett Square borough
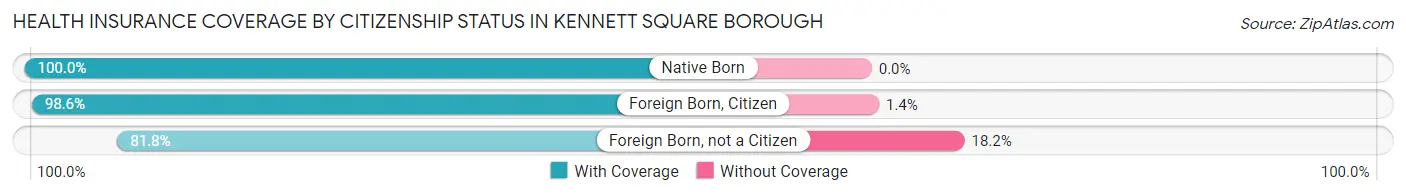
| Citizenship Status | With Coverage | Without Coverage |
| Native Born | 373 (100.0%) | 0 (0.0%) |
| Foreign Born, Citizen | 1,038 (98.6%) | 15 (1.4%) |
| Foreign Born, not a Citizen | 637 (81.8%) | 142 (18.2%) |
Health Insurance Coverage by Household Income in Kennett Square borough
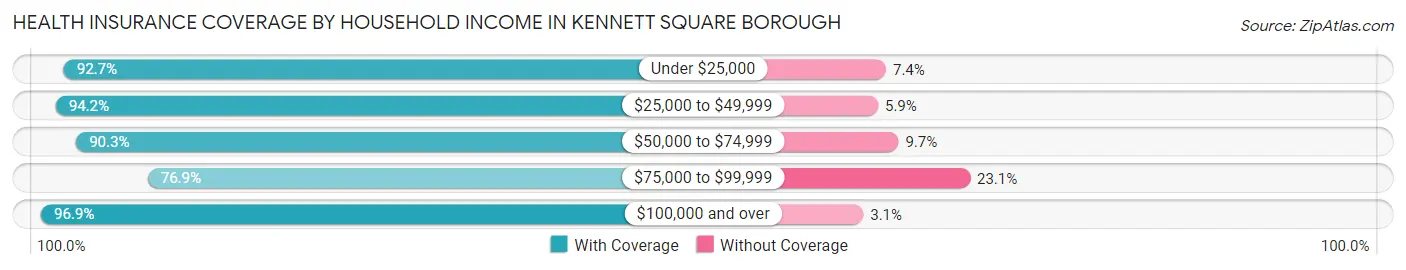
| Household Income | With Coverage | Without Coverage |
| Under $25,000 | 189 (92.6%) | 15 (7.3%) |
| $25,000 to $49,999 | 901 (94.2%) | 56 (5.9%) |
| $50,000 to $74,999 | 952 (90.3%) | 102 (9.7%) |
| $75,000 to $99,999 | 423 (76.9%) | 127 (23.1%) |
| $100,000 and over | 3,077 (96.9%) | 98 (3.1%) |
Public vs Private Health Insurance Coverage by Age in Kennett Square borough
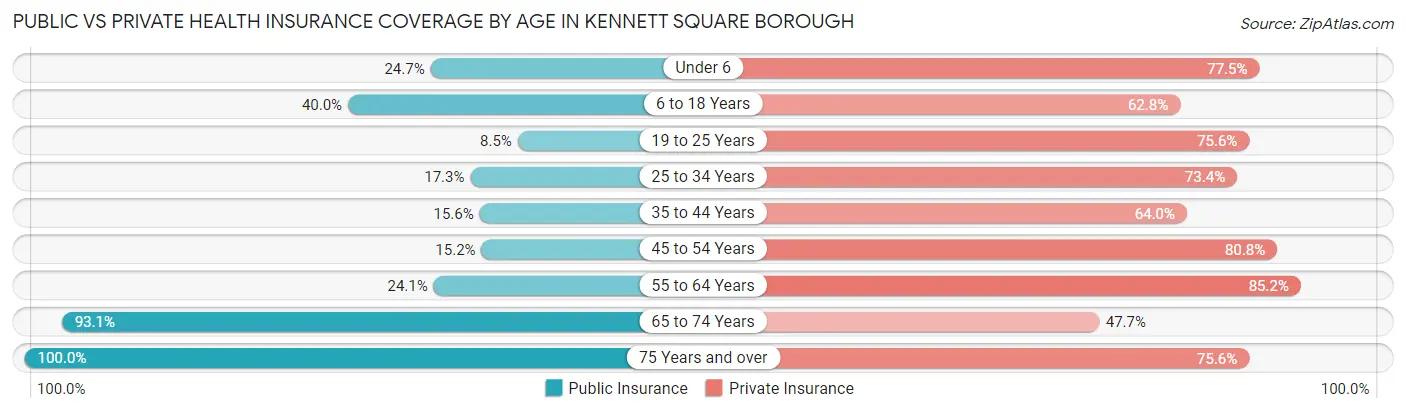
| Age Bracket | Public Insurance | Private Insurance |
| Under 6 | 92 (24.7%) | 289 (77.5%) |
| 6 to 18 Years | 421 (40.0%) | 661 (62.8%) |
| 19 to 25 Years | 66 (8.5%) | 589 (75.6%) |
| 25 to 34 Years | 81 (17.3%) | 344 (73.4%) |
| 35 to 44 Years | 138 (15.6%) | 568 (64.0%) |
| 45 to 54 Years | 99 (15.2%) | 526 (80.8%) |
| 55 to 64 Years | 213 (24.1%) | 753 (85.2%) |
| 65 to 74 Years | 568 (93.1%) | 291 (47.7%) |
| 75 Years and over | 250 (100.0%) | 189 (75.6%) |
| Total | 1,928 (32.4%) | 4,210 (70.7%) |
Disability Status by Sex by Age in Kennett Square borough
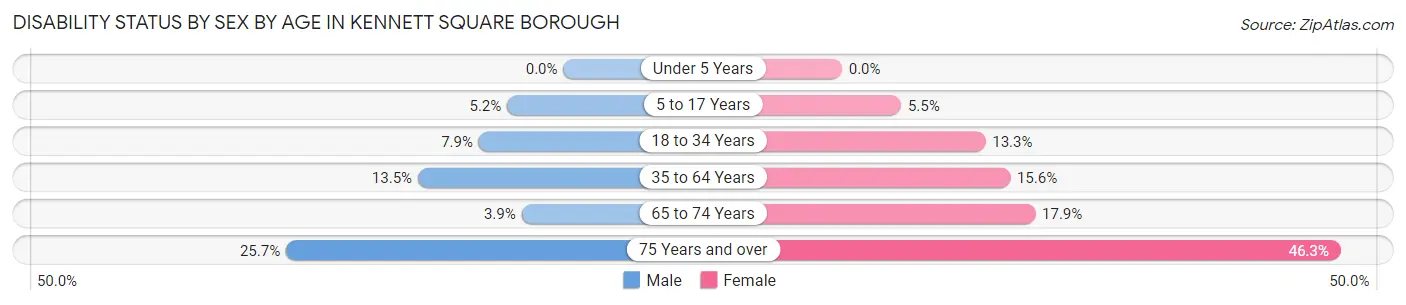
| Age Bracket | Male | Female |
| Under 5 Years | 0 (0.0%) | 0 (0.0%) |
| 5 to 17 Years | 27 (5.2%) | 27 (5.5%) |
| 18 to 34 Years | 58 (7.9%) | 79 (13.3%) |
| 35 to 64 Years | 154 (13.5%) | 200 (15.6%) |
| 65 to 74 Years | 15 (3.9%) | 40 (17.9%) |
| 75 Years and over | 26 (25.7%) | 69 (46.3%) |
Disability Class by Sex by Age in Kennett Square borough
Disability Class: Hearing Difficulty
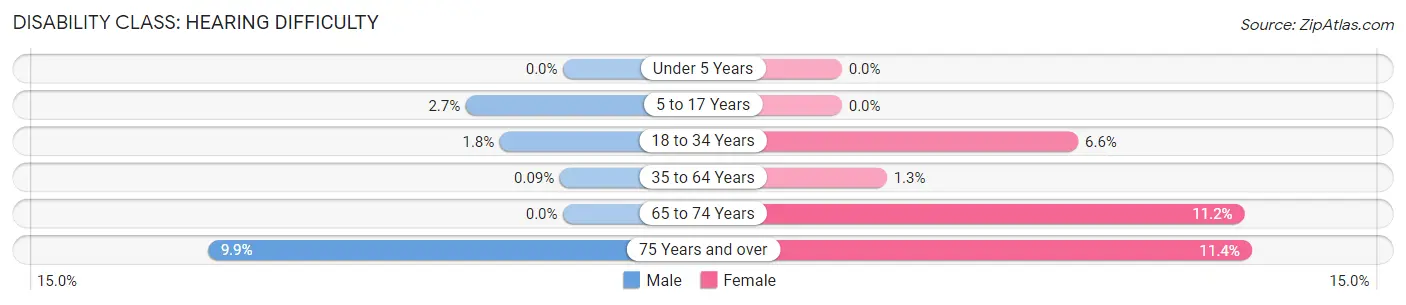
| Age Bracket | Male | Female |
| Under 5 Years | 0 (0.0%) | 0 (0.0%) |
| 5 to 17 Years | 14 (2.7%) | 0 (0.0%) |
| 18 to 34 Years | 13 (1.8%) | 39 (6.6%) |
| 35 to 64 Years | 1 (0.1%) | 16 (1.3%) |
| 65 to 74 Years | 0 (0.0%) | 25 (11.2%) |
| 75 Years and over | 10 (9.9%) | 17 (11.4%) |
Disability Class: Vision Difficulty
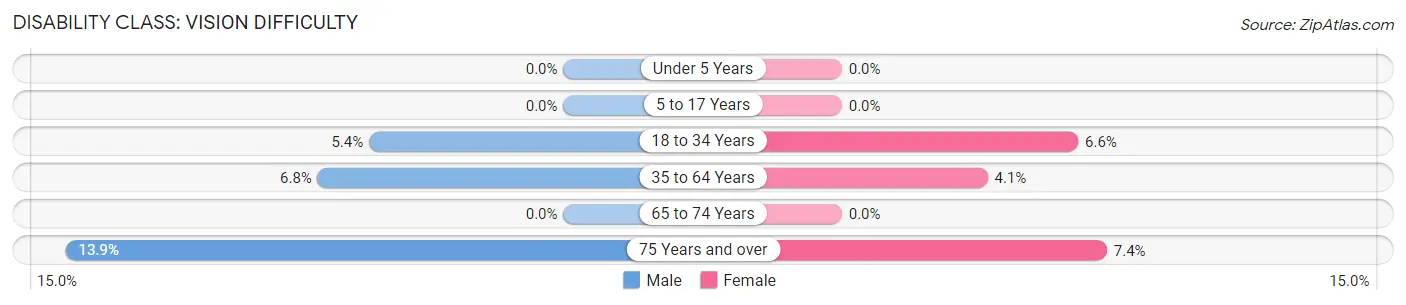
| Age Bracket | Male | Female |
| Under 5 Years | 0 (0.0%) | 0 (0.0%) |
| 5 to 17 Years | 0 (0.0%) | 0 (0.0%) |
| 18 to 34 Years | 40 (5.4%) | 39 (6.6%) |
| 35 to 64 Years | 78 (6.8%) | 52 (4.1%) |
| 65 to 74 Years | 0 (0.0%) | 0 (0.0%) |
| 75 Years and over | 14 (13.9%) | 11 (7.4%) |
Disability Class: Cognitive Difficulty
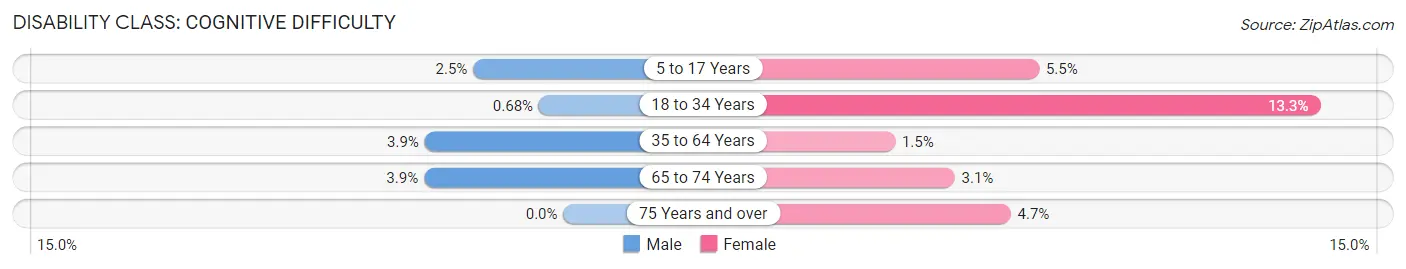
| Age Bracket | Male | Female |
| 5 to 17 Years | 13 (2.5%) | 27 (5.5%) |
| 18 to 34 Years | 5 (0.7%) | 79 (13.3%) |
| 35 to 64 Years | 44 (3.9%) | 19 (1.5%) |
| 65 to 74 Years | 15 (3.9%) | 7 (3.1%) |
| 75 Years and over | 0 (0.0%) | 7 (4.7%) |
Disability Class: Ambulatory Difficulty
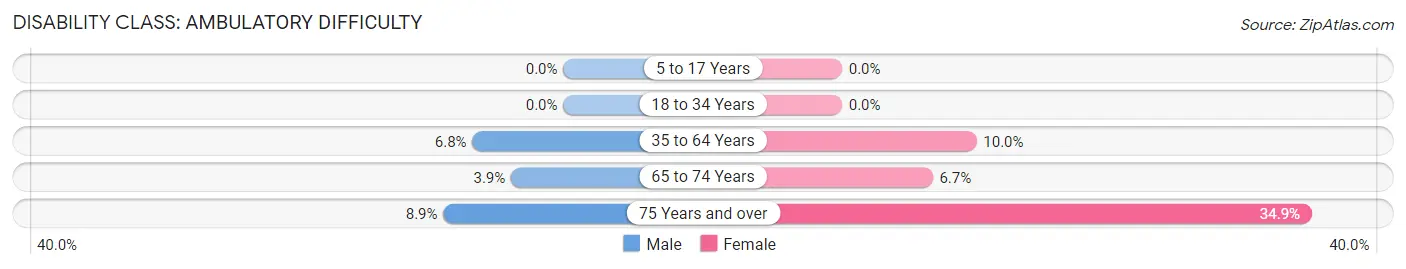
| Age Bracket | Male | Female |
| 5 to 17 Years | 0 (0.0%) | 0 (0.0%) |
| 18 to 34 Years | 0 (0.0%) | 0 (0.0%) |
| 35 to 64 Years | 77 (6.8%) | 128 (10.0%) |
| 65 to 74 Years | 15 (3.9%) | 15 (6.7%) |
| 75 Years and over | 9 (8.9%) | 52 (34.9%) |
Disability Class: Self-Care Difficulty
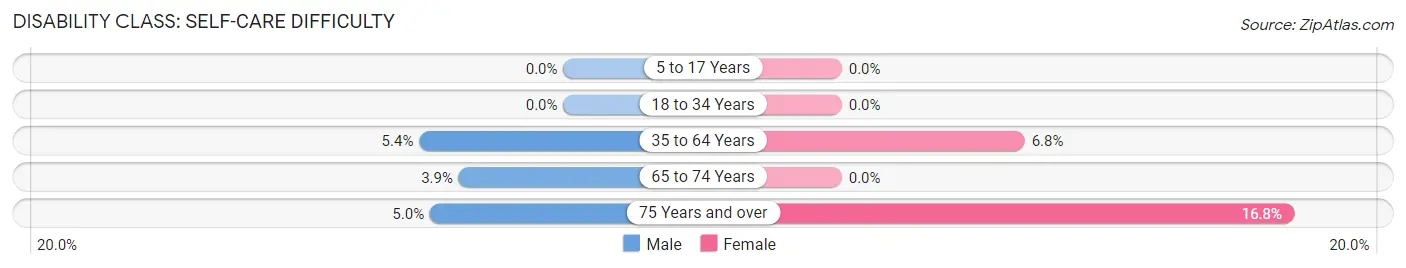
| Age Bracket | Male | Female |
| 5 to 17 Years | 0 (0.0%) | 0 (0.0%) |
| 18 to 34 Years | 0 (0.0%) | 0 (0.0%) |
| 35 to 64 Years | 61 (5.3%) | 87 (6.8%) |
| 65 to 74 Years | 15 (3.9%) | 0 (0.0%) |
| 75 Years and over | 5 (5.0%) | 25 (16.8%) |
Technology Access in Kennett Square borough
Computing Device Access in Kennett Square borough
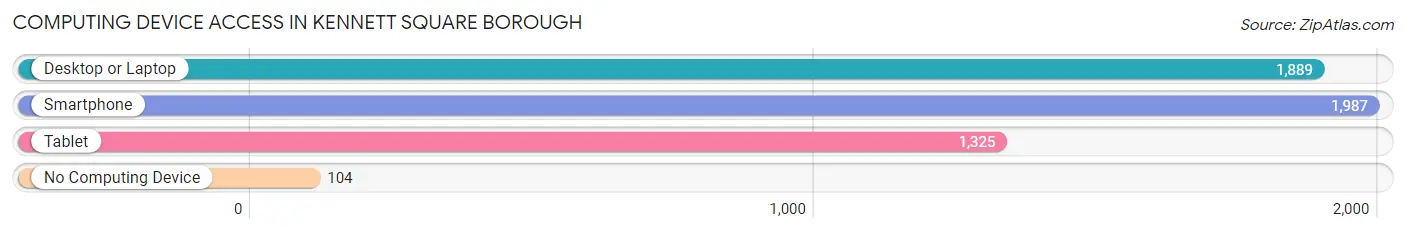
| Device Type | # Households | % Households |
| Desktop or Laptop | 1,889 | 84.6% |
| Smartphone | 1,987 | 89.0% |
| Tablet | 1,325 | 59.3% |
| No Computing Device | 104 | 4.7% |
| Total | 2,233 | 100.0% |
Internet Access in Kennett Square borough
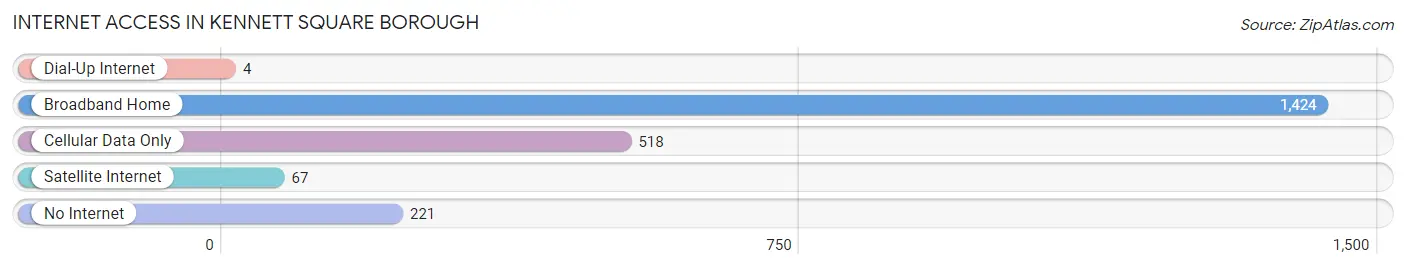
| Internet Type | # Households | % Households |
| Dial-Up Internet | 4 | 0.2% |
| Broadband Home | 1,424 | 63.8% |
| Cellular Data Only | 518 | 23.2% |
| Satellite Internet | 67 | 3.0% |
| No Internet | 221 | 9.9% |
| Total | 2,233 | 100.0% |
Kennett Square borough Summary
Kennett Square Borough is a small borough located in Chester County, Pennsylvania. It is situated in the southeastern corner of the state, approximately 25 miles west of Philadelphia. The borough is home to a population of 6,072 people, according to the 2010 census.
History
The area that is now Kennett Square Borough was first settled in the late 17th century by Swedish and English immigrants. The town was originally known as “Charming Forge” and was a center for iron production. In 1705, the town was renamed “Kennett Square” after the Kennett family, who had purchased the land from William Penn.
In the 19th century, Kennett Square became a center for the production of mushrooms. The town was home to several mushroom farms, and the industry was so successful that it earned Kennett Square the nickname “Mushroom Capital of the World.”
Geography
Kennett Square Borough is located in southeastern Pennsylvania, approximately 25 miles west of Philadelphia. The borough is situated in the Brandywine Valley, which is part of the Piedmont region of the state. The borough is bordered by East Marlborough Township to the north, New Garden Township to the east, Pennsbury Township to the south, and West Marlborough Township to the west.
The borough covers an area of 1.3 square miles, all of which is land. The borough is located at an elevation of approximately 300 feet above sea level. The borough is located in the humid subtropical climate zone, and the average annual temperature is approximately 54 degrees Fahrenheit.
Economy
The economy of Kennett Square Borough is largely based on agriculture and tourism. The borough is home to several mushroom farms, and the industry is still a major contributor to the local economy. The borough is also home to several wineries, which attract tourists from all over the region.
In addition to agriculture and tourism, the borough is home to several small businesses, including restaurants, retail stores, and professional services. The borough is also home to several corporate headquarters, including the corporate headquarters of the mushroom company, Kennett Square Specialties.
Demographics
According to the 2010 census, the population of Kennett Square Borough was 6,072. The racial makeup of the borough was 87.3% White, 5.3% African American, 0.3% Native American, 2.2% Asian, 0.1% Pacific Islander, and 4.8% from other races. Hispanic or Latino of any race were 8.2% of the population.
The median household income in the borough was $60,938, and the median family income was $71,944. The per capita income was $30,945. About 5.3% of families and 7.2% of the population were below the poverty line.
Conclusion
Kennett Square Borough is a small borough located in Chester County, Pennsylvania. It is situated in the southeastern corner of the state, approximately 25 miles west of Philadelphia. The borough is home to a population of 6,072 people, according to the 2010 census. The economy of Kennett Square Borough is largely based on agriculture and tourism, and the borough is home to several mushroom farms and wineries. The racial makeup of the borough is 87.3% White, 5.3% African American, 0.3% Native American, 2.2% Asian, 0.1% Pacific Islander, and 4.8% from other races. The median household income in the borough was $60,938, and the median family income was $71,944.
Common Questions
What is Per Capita Income in Kennett Square borough?
Per Capita income in Kennett Square borough is $43,677.
What is the Median Family Income in Kennett Square borough?
Median Family Income in Kennett Square borough is $102,188.
What is the Median Household income in Kennett Square borough?
Median Household Income in Kennett Square borough is $70,903.
What is Income or Wage Gap in Kennett Square borough?
Income or Wage Gap in Kennett Square borough is 38.2%.
Women in Kennett Square borough earn 61.8 cents for every dollar earned by a man.
What is Inequality or Gini Index in Kennett Square borough?
Inequality or Gini Index in Kennett Square borough is 0.49.
What is the Total Population of Kennett Square borough?
Total Population of Kennett Square borough is 5,982.
What is the Total Male Population of Kennett Square borough?
Total Male Population of Kennett Square borough is 3,002.
What is the Total Female Population of Kennett Square borough?
Total Female Population of Kennett Square borough is 2,980.
What is the Ratio of Males per 100 Females in Kennett Square borough?
There are 100.74 Males per 100 Females in Kennett Square borough.
What is the Ratio of Females per 100 Males in Kennett Square borough?
There are 99.27 Females per 100 Males in Kennett Square borough.
What is the Median Population Age in Kennett Square borough?
Median Population Age in Kennett Square borough is 38.7 Years.
What is the Average Family Size in Kennett Square borough
Average Family Size in Kennett Square borough is 3.4 People.
What is the Average Household Size in Kennett Square borough
Average Household Size in Kennett Square borough is 2.7 People.
How Large is the Labor Force in Kennett Square borough?
There are 3,436 People in the Labor Forcein in Kennett Square borough.
What is the Percentage of People in the Labor Force in Kennett Square borough?
71.5% of People are in the Labor Force in Kennett Square borough.
What is the Unemployment Rate in Kennett Square borough?
Unemployment Rate in Kennett Square borough is 4.7%.