Effort, PA Map & Demographics
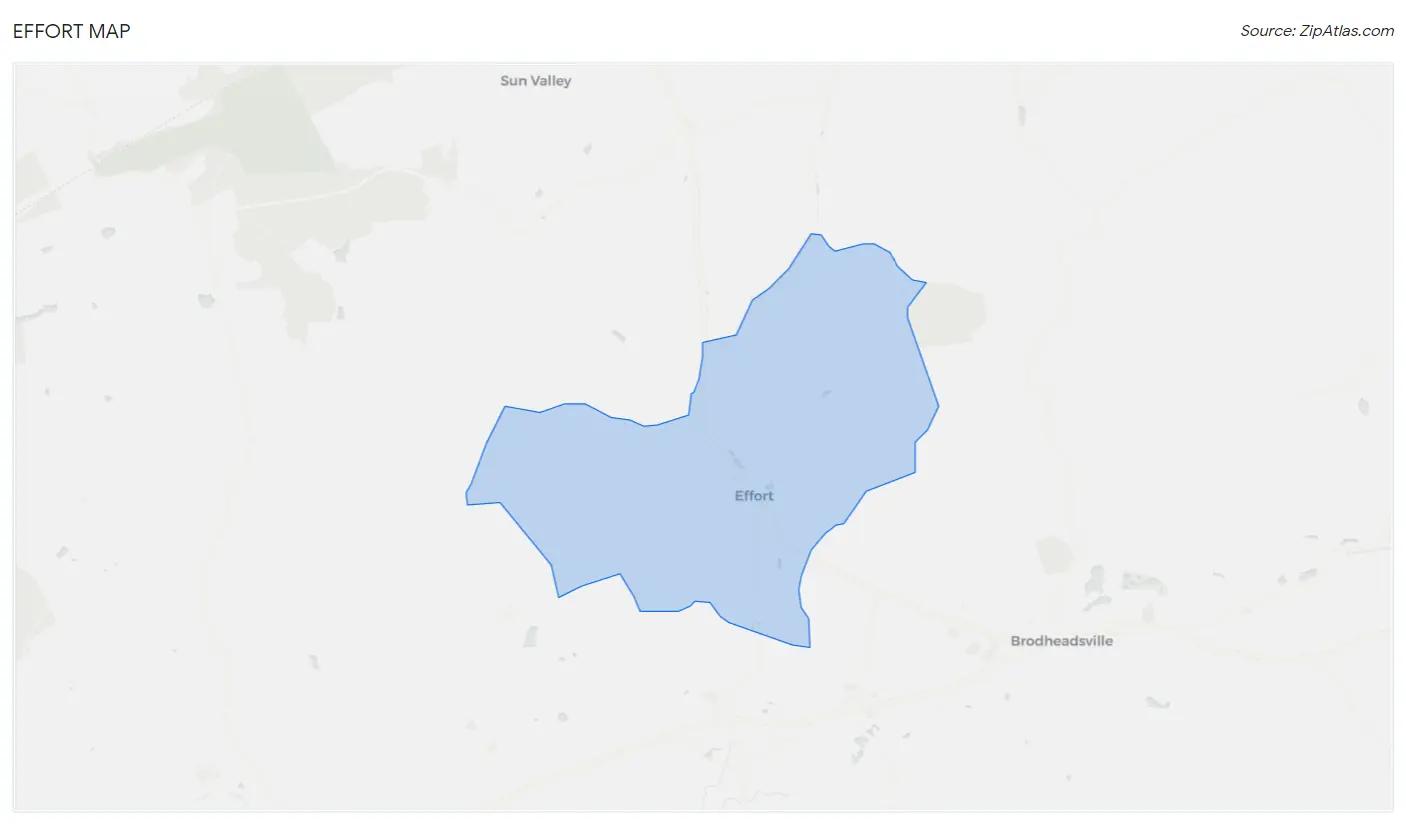
Effort Map
Effort Overview
$41,939
PER CAPITA INCOME
$110,417
AVG FAMILY INCOME
$91,161
AVG HOUSEHOLD INCOME
55.8%
WAGE / INCOME GAP [ % ]
44.2¢/ $1
WAGE / INCOME GAP [ $ ]
0.35
INEQUALITY / GINI INDEX
2,235
TOTAL POPULATION
1,168
MALE POPULATION
1,067
FEMALE POPULATION
109.47
MALES / 100 FEMALES
91.35
FEMALES / 100 MALES
45.4
MEDIAN AGE
3.2
AVG FAMILY SIZE
2.7
AVG HOUSEHOLD SIZE
1,047
LABOR FORCE [ PEOPLE ]
57.3%
PERCENT IN LABOR FORCE
1.7%
UNEMPLOYMENT RATE
Effort Zip Codes
Income in Effort
Income Overview in Effort
Per Capita Income in Effort is $41,939, while median incomes of families and households are $110,417 and $91,161 respectively.
| Characteristic | Number | Measure |
| Per Capita Income | 2,235 | $41,939 |
| Median Family Income | 619 | $110,417 |
| Mean Family Income | 619 | $116,077 |
| Median Household Income | 839 | $91,161 |
| Mean Household Income | 839 | $107,469 |
| Income Deficit | 619 | $0 |
| Wage / Income Gap (%) | 2,235 | 55.75% |
| Wage / Income Gap ($) | 2,235 | 44.25¢ per $1 |
| Gini / Inequality Index | 2,235 | 0.35 |
Earnings by Sex in Effort
Average Earnings in Effort are $51,389, $86,667 for men and $38,350 for women, a difference of 55.7%.
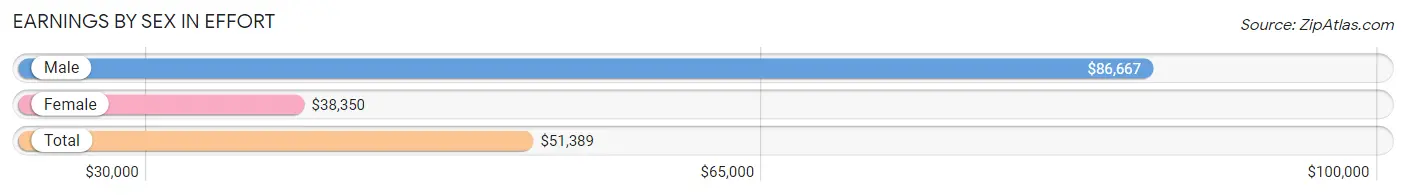
| Sex | Number | Average Earnings |
| Male | 540 (48.6%) | $86,667 |
| Female | 572 (51.4%) | $38,350 |
| Total | 1,112 (100.0%) | $51,389 |
Earnings by Sex by Income Bracket in Effort
The most common earnings brackets in Effort are $100,000+ for men (195 | 36.1%) and $75,000 to $99,999 for women (66 | 11.5%).
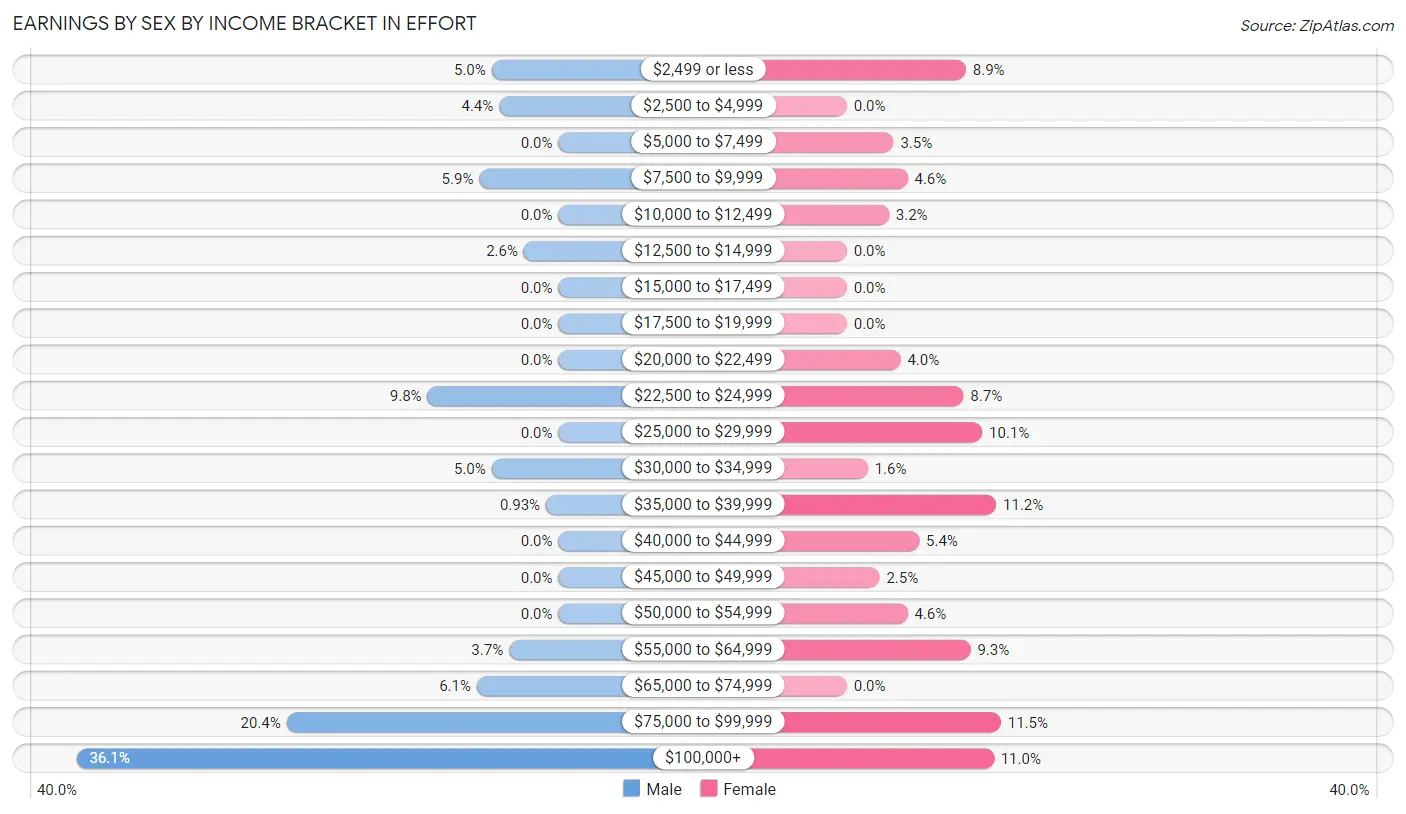
| Income | Male | Female |
| $2,499 or less | 27 (5.0%) | 51 (8.9%) |
| $2,500 to $4,999 | 24 (4.4%) | 0 (0.0%) |
| $5,000 to $7,499 | 0 (0.0%) | 20 (3.5%) |
| $7,500 to $9,999 | 32 (5.9%) | 26 (4.5%) |
| $10,000 to $12,499 | 0 (0.0%) | 18 (3.2%) |
| $12,500 to $14,999 | 14 (2.6%) | 0 (0.0%) |
| $15,000 to $17,499 | 0 (0.0%) | 0 (0.0%) |
| $17,500 to $19,999 | 0 (0.0%) | 0 (0.0%) |
| $20,000 to $22,499 | 0 (0.0%) | 23 (4.0%) |
| $22,500 to $24,999 | 53 (9.8%) | 50 (8.7%) |
| $25,000 to $29,999 | 0 (0.0%) | 58 (10.1%) |
| $30,000 to $34,999 | 27 (5.0%) | 9 (1.6%) |
| $35,000 to $39,999 | 5 (0.9%) | 64 (11.2%) |
| $40,000 to $44,999 | 0 (0.0%) | 31 (5.4%) |
| $45,000 to $49,999 | 0 (0.0%) | 14 (2.5%) |
| $50,000 to $54,999 | 0 (0.0%) | 26 (4.5%) |
| $55,000 to $64,999 | 20 (3.7%) | 53 (9.3%) |
| $65,000 to $74,999 | 33 (6.1%) | 0 (0.0%) |
| $75,000 to $99,999 | 110 (20.4%) | 66 (11.5%) |
| $100,000+ | 195 (36.1%) | 63 (11.0%) |
| Total | 540 (100.0%) | 572 (100.0%) |
Earnings by Sex by Educational Attainment in Effort
Average earnings in Effort are $99,073 for men and $40,227 for women, a difference of 59.4%. Men with an educational attainment of graduate degree enjoy the highest average annual earnings of $164,125, while those with high school diploma education earn the least with $86,771. Women with an educational attainment of graduate degree earn the most with the average annual earnings of $106,389, while those with high school diploma education have the smallest earnings of $23,317.
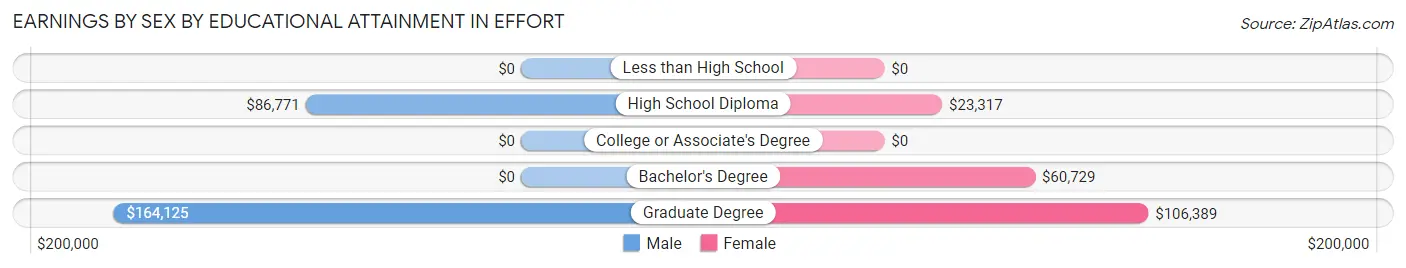
| Educational Attainment | Male Income | Female Income |
| Less than High School | - | - |
| High School Diploma | $86,771 | $23,317 |
| College or Associate's Degree | - | - |
| Bachelor's Degree | - | - |
| Graduate Degree | $164,125 | $106,389 |
| Total | $99,073 | $40,227 |
Family Income in Effort
Family Income Brackets in Effort
According to the Effort family income data, there are 138 families falling into the $100,000 to $149,999 income range, which is the most common income bracket and makes up 22.3% of all families.
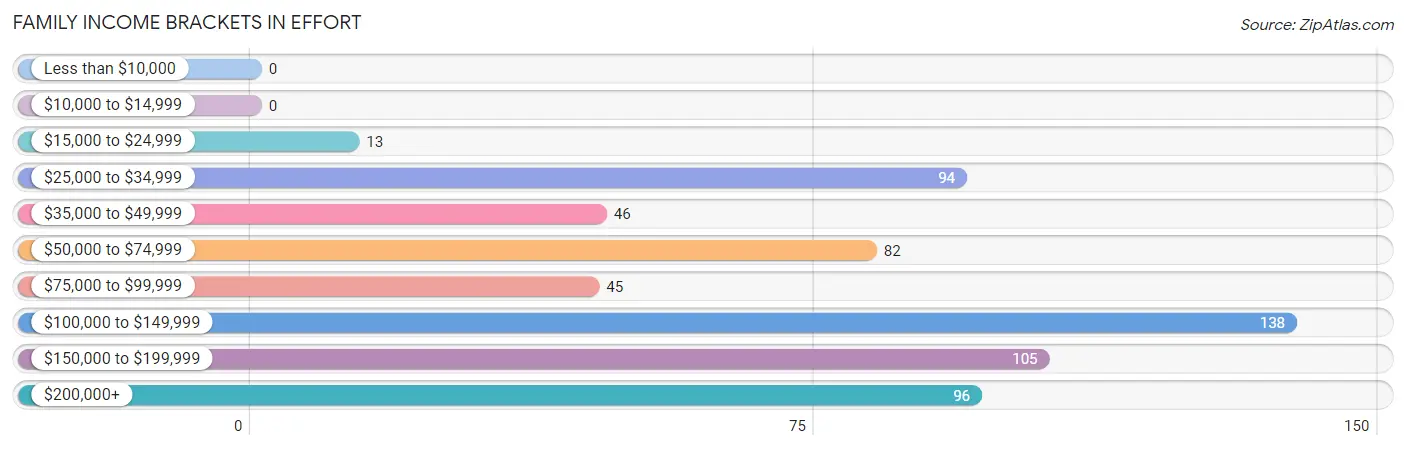
| Income Bracket | # Families | % Families |
| Less than $10,000 | 0 | 0.0% |
| $10,000 to $14,999 | 0 | 0.0% |
| $15,000 to $24,999 | 13 | 2.1% |
| $25,000 to $34,999 | 94 | 15.2% |
| $35,000 to $49,999 | 46 | 7.4% |
| $50,000 to $74,999 | 82 | 13.2% |
| $75,000 to $99,999 | 45 | 7.3% |
| $100,000 to $149,999 | 138 | 22.3% |
| $150,000 to $199,999 | 105 | 17.0% |
| $200,000+ | 96 | 15.5% |
Family Income by Famaliy Size in Effort
3-person families (72 | 11.6%) account for the highest median family income in Effort with $187,568 per family, while 3-person families (72 | 11.6%) have the highest median income of $62,523 per family member.
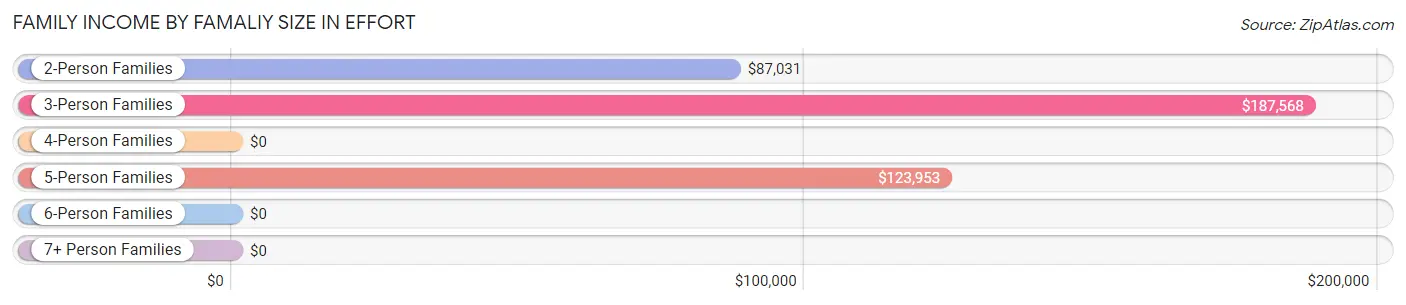
| Income Bracket | # Families | Median Income |
| 2-Person Families | 329 (53.1%) | $87,031 |
| 3-Person Families | 72 (11.6%) | $187,568 |
| 4-Person Families | 111 (17.9%) | $0 |
| 5-Person Families | 107 (17.3%) | $123,953 |
| 6-Person Families | 0 (0.0%) | $0 |
| 7+ Person Families | 0 (0.0%) | $0 |
| Total | 619 (100.0%) | $110,417 |
Family Income by Number of Earners in Effort
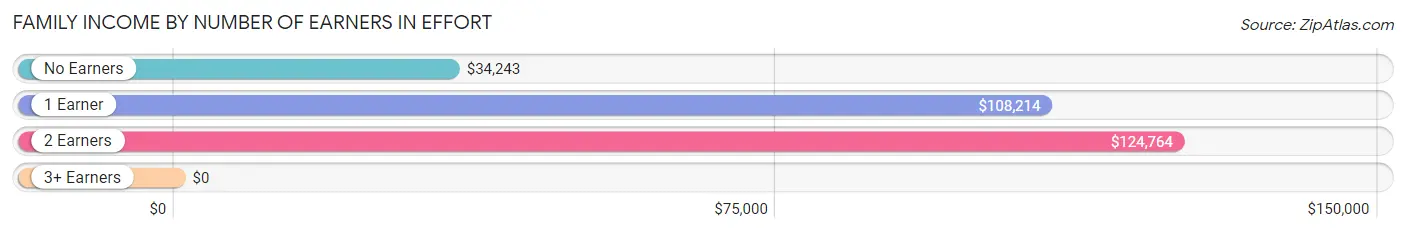
| Number of Earners | # Families | Median Income |
| No Earners | 126 (20.4%) | $34,243 |
| 1 Earner | 184 (29.7%) | $108,214 |
| 2 Earners | 259 (41.8%) | $124,764 |
| 3+ Earners | 50 (8.1%) | $0 |
| Total | 619 (100.0%) | $110,417 |
Household Income in Effort
Household Income Brackets in Effort
With 212 households falling in the category, the $50,000 to $74,999 income range is the most frequent in Effort, accounting for 25.3% of all households.
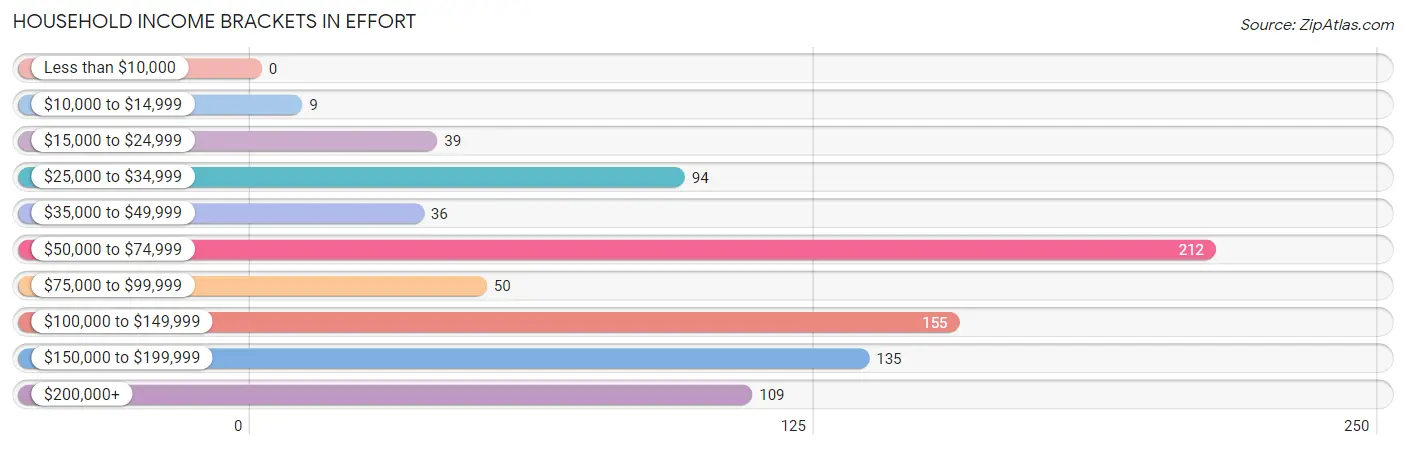
| Income Bracket | # Households | % Households |
| Less than $10,000 | 0 | 0.0% |
| $10,000 to $14,999 | 9 | 1.1% |
| $15,000 to $24,999 | 39 | 4.6% |
| $25,000 to $34,999 | 94 | 11.2% |
| $35,000 to $49,999 | 36 | 4.3% |
| $50,000 to $74,999 | 212 | 25.3% |
| $75,000 to $99,999 | 50 | 6.0% |
| $100,000 to $149,999 | 155 | 18.5% |
| $150,000 to $199,999 | 135 | 16.1% |
| $200,000+ | 109 | 13.0% |
Household Income by Householder Age in Effort
The median household income in Effort is $91,161, with the highest median household income of $162,917 found in the 45 to 64 years age bracket for the primary householder. A total of 412 households (49.1%) fall into this category.
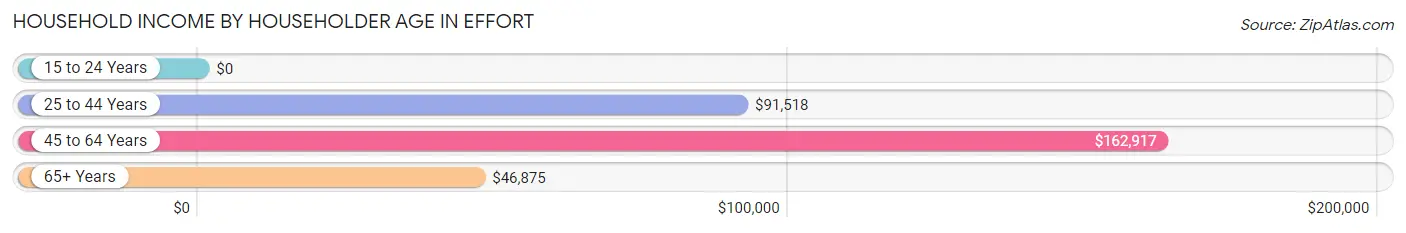
| Income Bracket | # Households | Median Income |
| 15 to 24 Years | 0 (0.0%) | $0 |
| 25 to 44 Years | 155 (18.5%) | $91,518 |
| 45 to 64 Years | 412 (49.1%) | $162,917 |
| 65+ Years | 272 (32.4%) | $46,875 |
| Total | 839 (100.0%) | $91,161 |
Poverty in Effort
Income Below Poverty by Sex and Age in Effort
With 8.7% poverty level for males and 3.2% for females among the residents of Effort, 18 to 24 year old males and 6 to 11 year old females are the most vulnerable to poverty, with 51 males (38.1%) and 12 females (19.1%) in their respective age groups living below the poverty level.
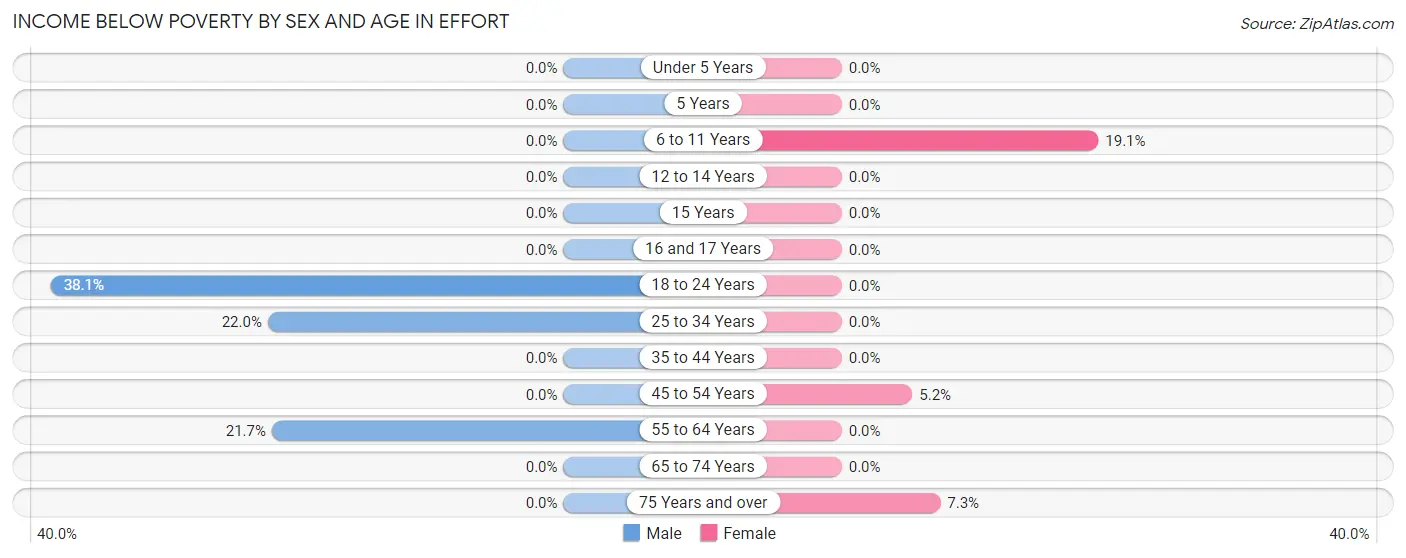
| Age Bracket | Male | Female |
| Under 5 Years | 0 (0.0%) | 0 (0.0%) |
| 5 Years | 0 (0.0%) | 0 (0.0%) |
| 6 to 11 Years | 0 (0.0%) | 12 (19.1%) |
| 12 to 14 Years | 0 (0.0%) | 0 (0.0%) |
| 15 Years | 0 (0.0%) | 0 (0.0%) |
| 16 and 17 Years | 0 (0.0%) | 0 (0.0%) |
| 18 to 24 Years | 51 (38.1%) | 0 (0.0%) |
| 25 to 34 Years | 9 (22.0%) | 0 (0.0%) |
| 35 to 44 Years | 0 (0.0%) | 0 (0.0%) |
| 45 to 54 Years | 0 (0.0%) | 13 (5.2%) |
| 55 to 64 Years | 42 (21.6%) | 0 (0.0%) |
| 65 to 74 Years | 0 (0.0%) | 0 (0.0%) |
| 75 Years and over | 0 (0.0%) | 9 (7.3%) |
| Total | 102 (8.7%) | 34 (3.2%) |
Income Above Poverty by Sex and Age in Effort
According to the poverty statistics in Effort, males aged under 5 years and females aged under 5 years are the age groups that are most secure financially, with 100.0% of males and 100.0% of females in these age groups living above the poverty line.
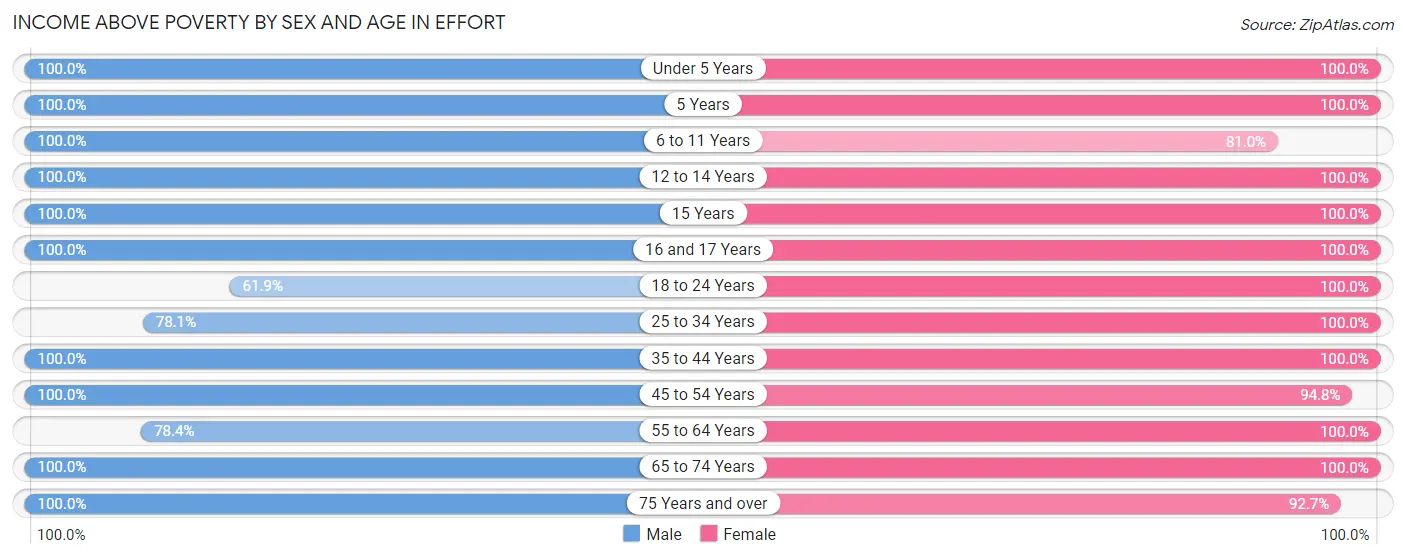
| Age Bracket | Male | Female |
| Under 5 Years | 156 (100.0%) | 6 (100.0%) |
| 5 Years | 7 (100.0%) | 40 (100.0%) |
| 6 to 11 Years | 32 (100.0%) | 51 (80.9%) |
| 12 to 14 Years | 23 (100.0%) | 48 (100.0%) |
| 15 Years | 8 (100.0%) | 24 (100.0%) |
| 16 and 17 Years | 52 (100.0%) | 44 (100.0%) |
| 18 to 24 Years | 83 (61.9%) | 87 (100.0%) |
| 25 to 34 Years | 32 (78.0%) | 106 (100.0%) |
| 35 to 44 Years | 105 (100.0%) | 108 (100.0%) |
| 45 to 54 Years | 201 (100.0%) | 235 (94.8%) |
| 55 to 64 Years | 152 (78.3%) | 119 (100.0%) |
| 65 to 74 Years | 51 (100.0%) | 51 (100.0%) |
| 75 Years and over | 164 (100.0%) | 114 (92.7%) |
| Total | 1,066 (91.3%) | 1,033 (96.8%) |
Income Below Poverty Among Married-Couple Families in Effort
The poverty statistics for married-couple families in Effort show that 2.4% or 13 of the total 548 families live below the poverty line. Families with 1 or 2 children have the highest poverty rate of 9.7%, comprising of 13 families. On the other hand, families with no children have the lowest poverty rate of 0.0%, which includes 0 families.
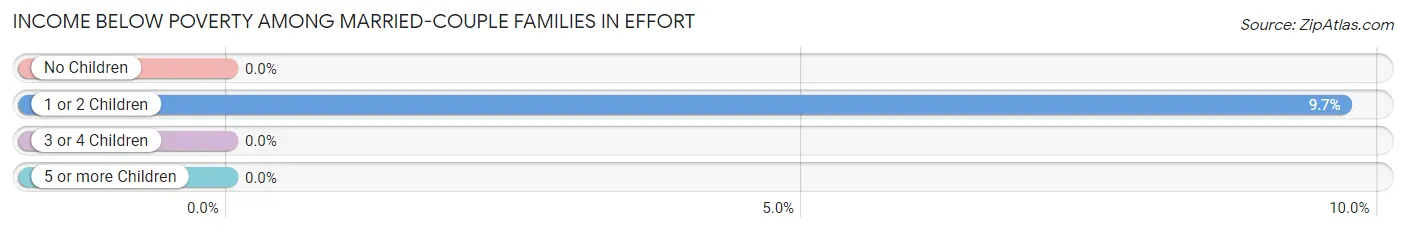
| Children | Above Poverty | Below Poverty |
| No Children | 320 (100.0%) | 0 (0.0%) |
| 1 or 2 Children | 121 (90.3%) | 13 (9.7%) |
| 3 or 4 Children | 94 (100.0%) | 0 (0.0%) |
| 5 or more Children | 0 (0.0%) | 0 (0.0%) |
| Total | 535 (97.6%) | 13 (2.4%) |
Income Below Poverty Among Single-Parent Households in Effort
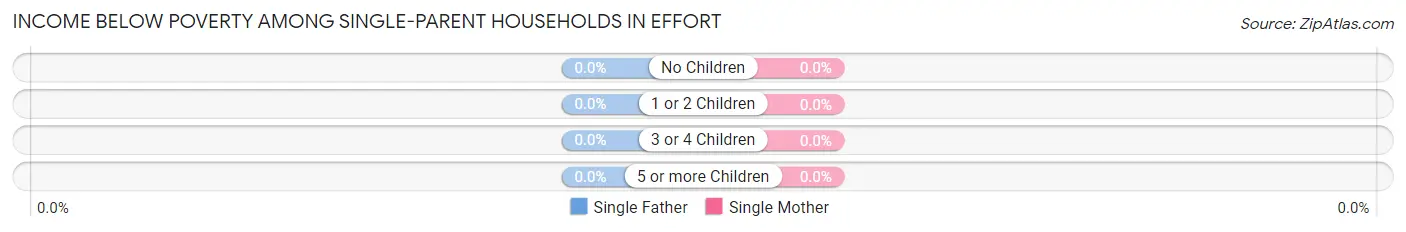
| Children | Single Father | Single Mother |
| No Children | 0 (0.0%) | 0 (0.0%) |
| 1 or 2 Children | 0 (0.0%) | 0 (0.0%) |
| 3 or 4 Children | 0 (0.0%) | 0 (0.0%) |
| 5 or more Children | 0 (0.0%) | 0 (0.0%) |
| Total | 0 (0.0%) | 0 (0.0%) |
Income Below Poverty Among Married-Couple vs Single-Parent Households in Effort
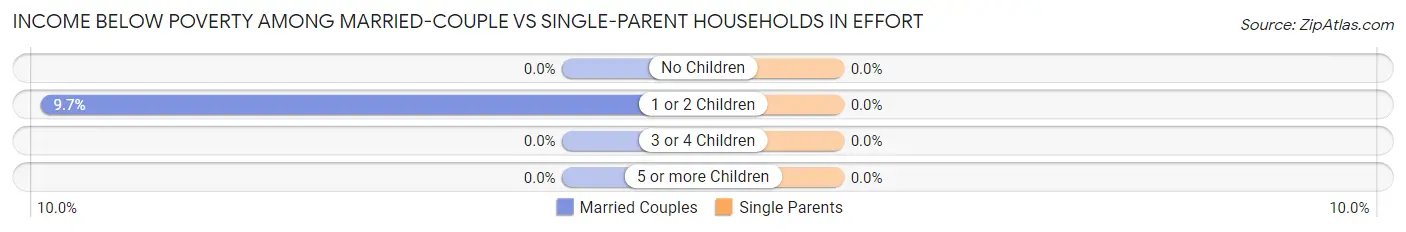
| Children | Married-Couple Families | Single-Parent Households |
| No Children | 0 (0.0%) | 0 (0.0%) |
| 1 or 2 Children | 13 (9.7%) | 0 (0.0%) |
| 3 or 4 Children | 0 (0.0%) | 0 (0.0%) |
| 5 or more Children | 0 (0.0%) | 0 (0.0%) |
| Total | 13 (2.4%) | 0 (0.0%) |
Race in Effort
The most populous races in Effort are White / Caucasian (1,777 | 79.5%), Hispanic or Latino (478 | 21.4%), and Two or more Races (180 | 8.1%).
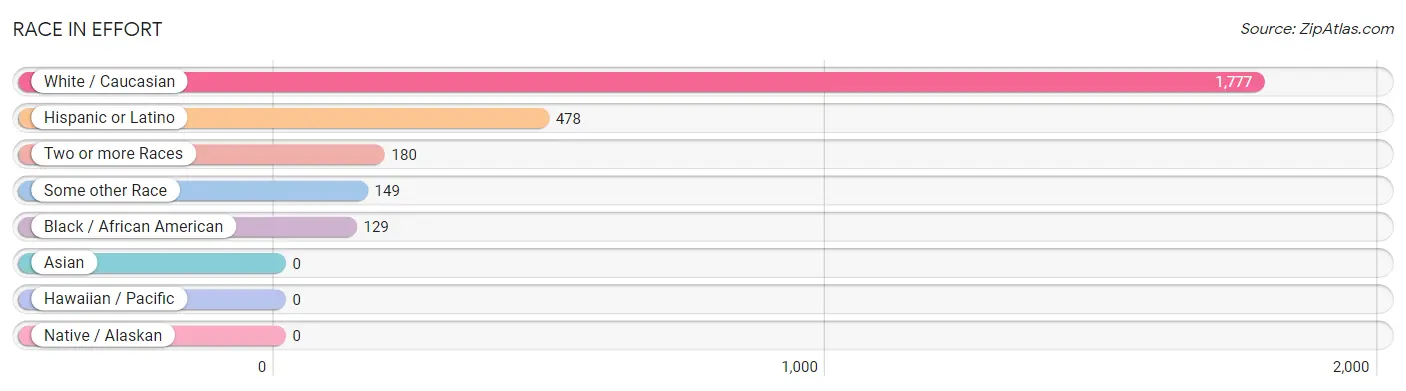
| Race | # Population | % Population |
| Asian | 0 | 0.0% |
| Black / African American | 129 | 5.8% |
| Hawaiian / Pacific | 0 | 0.0% |
| Hispanic or Latino | 478 | 21.4% |
| Native / Alaskan | 0 | 0.0% |
| White / Caucasian | 1,777 | 79.5% |
| Two or more Races | 180 | 8.1% |
| Some other Race | 149 | 6.7% |
| Total | 2,235 | 100.0% |
Ancestry in Effort
The most populous ancestries reported in Effort are German (502 | 22.5%), English (251 | 11.2%), Italian (221 | 9.9%), Pennsylvania German (195 | 8.7%), and Irish (187 | 8.4%), together accounting for 60.7% of all Effort residents.
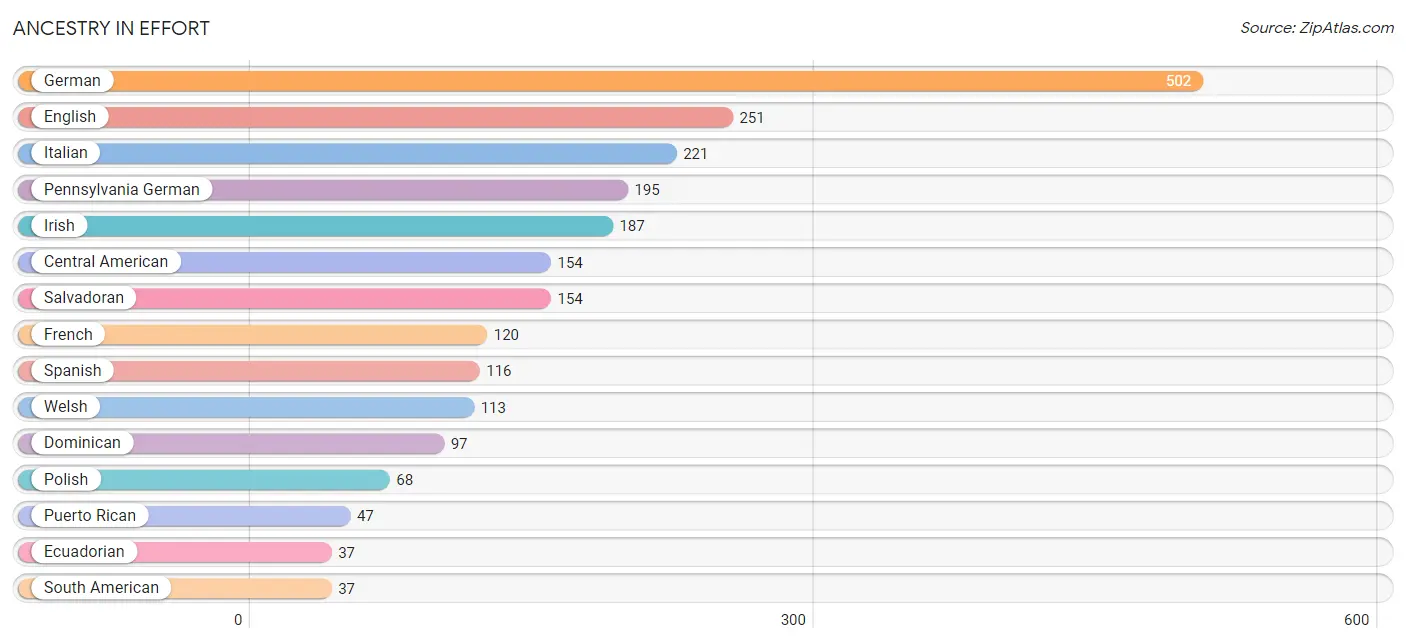
| Ancestry | # Population | % Population |
| Austrian | 6 | 0.3% |
| Brazilian | 26 | 1.2% |
| British | 10 | 0.4% |
| Central American | 154 | 6.9% |
| Cherokee | 21 | 0.9% |
| Czechoslovakian | 8 | 0.4% |
| Dominican | 97 | 4.3% |
| Dutch | 27 | 1.2% |
| Ecuadorian | 37 | 1.7% |
| English | 251 | 11.2% |
| French | 120 | 5.4% |
| German | 502 | 22.5% |
| Irish | 187 | 8.4% |
| Italian | 221 | 9.9% |
| Mexican | 27 | 1.2% |
| Pennsylvania German | 195 | 8.7% |
| Polish | 68 | 3.0% |
| Puerto Rican | 47 | 2.1% |
| Russian | 9 | 0.4% |
| Salvadoran | 154 | 6.9% |
| Scottish | 7 | 0.3% |
| South American | 37 | 1.7% |
| Spanish | 116 | 5.2% |
| Welsh | 113 | 5.1% | View All 24 Rows |
Immigrants in Effort
The most numerous immigrant groups reported in Effort came from Latin America (74 | 3.3%), Central America (30 | 1.3%), El Salvador (30 | 1.3%), Brazil (26 | 1.2%), and South America (26 | 1.2%), together accounting for 8.3% of all Effort residents.
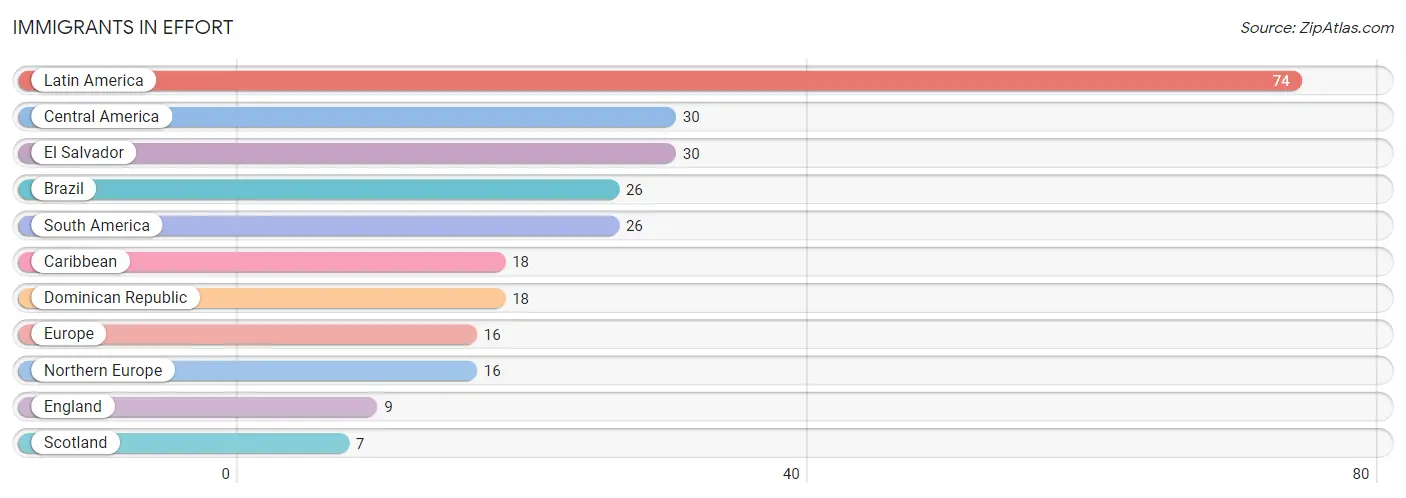
| Immigration Origin | # Population | % Population |
| Brazil | 26 | 1.2% |
| Caribbean | 18 | 0.8% |
| Central America | 30 | 1.3% |
| Dominican Republic | 18 | 0.8% |
| El Salvador | 30 | 1.3% |
| England | 9 | 0.4% |
| Europe | 16 | 0.7% |
| Latin America | 74 | 3.3% |
| Northern Europe | 16 | 0.7% |
| Scotland | 7 | 0.3% |
| South America | 26 | 1.2% | View All 11 Rows |
Sex and Age in Effort
Sex and Age in Effort
The most populous age groups in Effort are 75 to 79 Years (164 | 14.0%) for men and 45 to 49 Years (163 | 15.3%) for women.
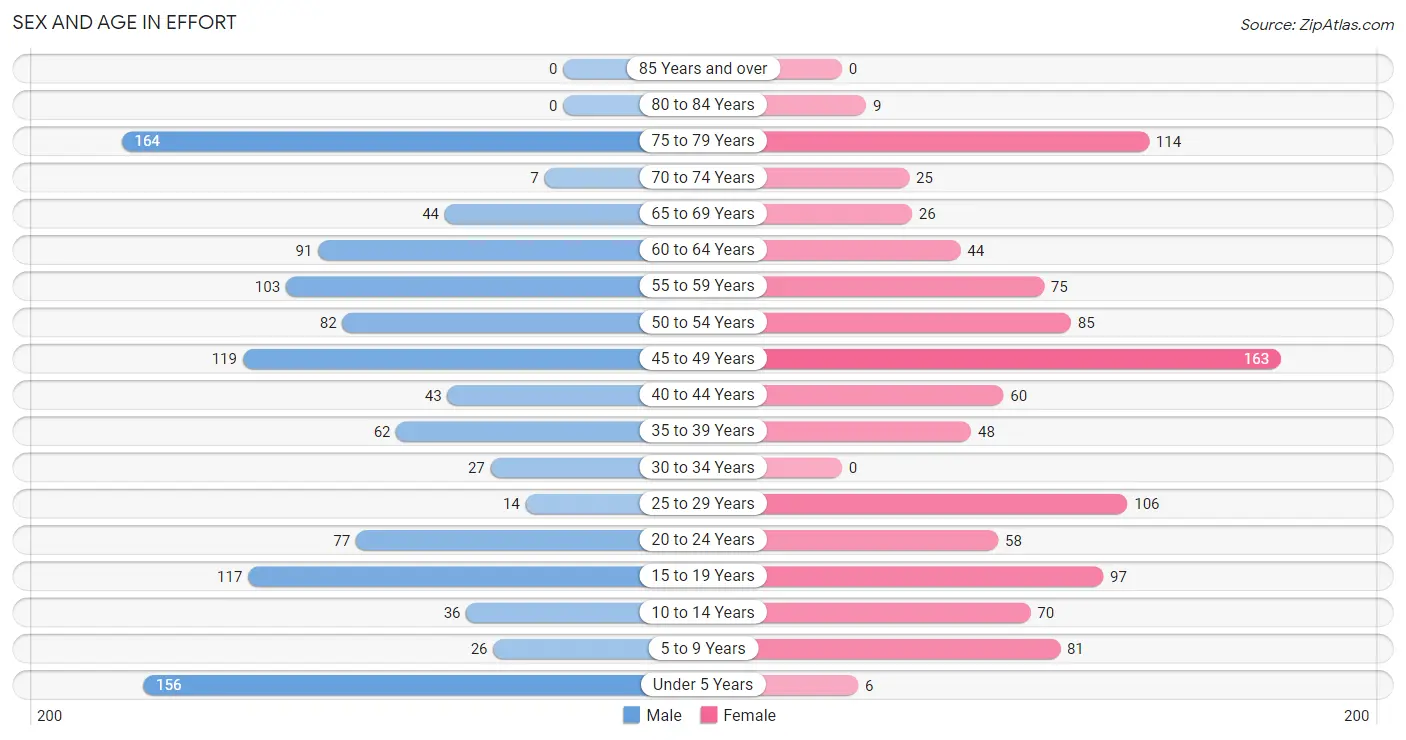
| Age Bracket | Male | Female |
| Under 5 Years | 156 (13.4%) | 6 (0.6%) |
| 5 to 9 Years | 26 (2.2%) | 81 (7.6%) |
| 10 to 14 Years | 36 (3.1%) | 70 (6.6%) |
| 15 to 19 Years | 117 (10.0%) | 97 (9.1%) |
| 20 to 24 Years | 77 (6.6%) | 58 (5.4%) |
| 25 to 29 Years | 14 (1.2%) | 106 (9.9%) |
| 30 to 34 Years | 27 (2.3%) | 0 (0.0%) |
| 35 to 39 Years | 62 (5.3%) | 48 (4.5%) |
| 40 to 44 Years | 43 (3.7%) | 60 (5.6%) |
| 45 to 49 Years | 119 (10.2%) | 163 (15.3%) |
| 50 to 54 Years | 82 (7.0%) | 85 (8.0%) |
| 55 to 59 Years | 103 (8.8%) | 75 (7.0%) |
| 60 to 64 Years | 91 (7.8%) | 44 (4.1%) |
| 65 to 69 Years | 44 (3.8%) | 26 (2.4%) |
| 70 to 74 Years | 7 (0.6%) | 25 (2.3%) |
| 75 to 79 Years | 164 (14.0%) | 114 (10.7%) |
| 80 to 84 Years | 0 (0.0%) | 9 (0.8%) |
| 85 Years and over | 0 (0.0%) | 0 (0.0%) |
| Total | 1,168 (100.0%) | 1,067 (100.0%) |
Families and Households in Effort
Median Family Size in Effort
The median family size in Effort is 3.16 persons per family, with single male/father families (5 | 0.8%) accounting for the largest median family size of 3.6 persons per family. On the other hand, single female/mother families (66 | 10.7%) represent the smallest median family size with 2.33 persons per family.
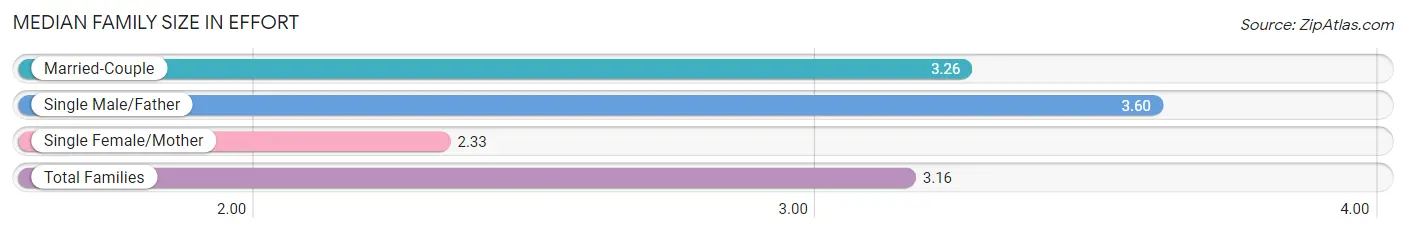
| Family Type | # Families | Family Size |
| Married-Couple | 548 (88.5%) | 3.26 |
| Single Male/Father | 5 (0.8%) | 3.60 |
| Single Female/Mother | 66 (10.7%) | 2.33 |
| Total Families | 619 (100.0%) | 3.16 |
Median Household Size in Effort
The median household size in Effort is 2.66 persons per household, with single male/father households (5 | 0.6%) accounting for the largest median household size of 4.8 persons per household. non-family households (220 | 26.2%) represent the smallest median household size with 1.06 persons per household.
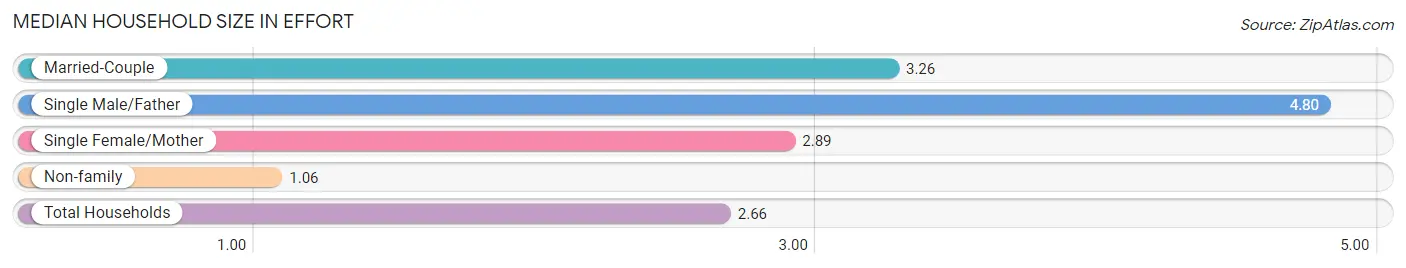
| Household Type | # Households | Household Size |
| Married-Couple | 548 (65.3%) | 3.26 |
| Single Male/Father | 5 (0.6%) | 4.80 |
| Single Female/Mother | 66 (7.9%) | 2.89 |
| Non-family | 220 (26.2%) | 1.06 |
| Total Households | 839 (100.0%) | 2.66 |
Household Size by Marriage Status in Effort
Out of a total of 839 households in Effort, 619 (73.8%) are family households, while 220 (26.2%) are nonfamily households. The most numerous type of family households are 2-person households, comprising 321, and the most common type of nonfamily households are 1-person households, comprising 207.
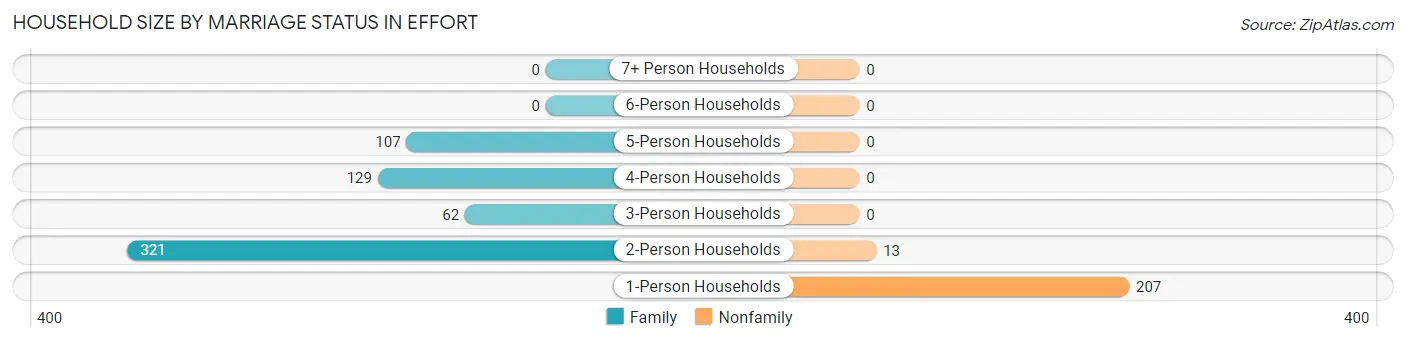
| Household Size | Family Households | Nonfamily Households |
| 1-Person Households | - | 207 (24.7%) |
| 2-Person Households | 321 (38.3%) | 13 (1.5%) |
| 3-Person Households | 62 (7.4%) | 0 (0.0%) |
| 4-Person Households | 129 (15.4%) | 0 (0.0%) |
| 5-Person Households | 107 (12.8%) | 0 (0.0%) |
| 6-Person Households | 0 (0.0%) | 0 (0.0%) |
| 7+ Person Households | 0 (0.0%) | 0 (0.0%) |
| Total | 619 (73.8%) | 220 (26.2%) |
Female Fertility in Effort
Fertility by Age in Effort
| Age Bracket | Women with Births | Births / 1,000 Women |
| 15 to 19 years | 0 (0.0%) | 0.0 |
| 20 to 34 years | 0 (0.0%) | 0.0 |
| 35 to 50 years | 0 (0.0%) | 0.0 |
| Total | 0 (0.0%) | 0.0 |
Fertility by Age by Marriage Status in Effort
| Age Bracket | Married | Unmarried |
| 15 to 19 years | 0 (0.0%) | 0 (0.0%) |
| 20 to 34 years | 0 (0.0%) | 0 (0.0%) |
| 35 to 50 years | 0 (0.0%) | 0 (0.0%) |
| Total | 0 (0.0%) | 0 (0.0%) |
Fertility by Education in Effort
| Educational Attainment | Women with Births | Births / 1,000 Women |
| Less than High School | 0 (0.0%) | 0.0 |
| High School Diploma | 0 (0.0%) | 0.0 |
| College or Associate's Degree | 0 (0.0%) | 0.0 |
| Bachelor's Degree | 0 (0.0%) | 0.0 |
| Graduate Degree | 0 (0.0%) | 0.0 |
| Total | 0 (0.0%) | 0.0 |
Fertility by Education by Marriage Status in Effort
| Educational Attainment | Married | Unmarried |
| Less than High School | 0 (0.0%) | 0 (0.0%) |
| High School Diploma | 0 (0.0%) | 0 (0.0%) |
| College or Associate's Degree | 0 (0.0%) | 0 (0.0%) |
| Bachelor's Degree | 0 (0.0%) | 0 (0.0%) |
| Graduate Degree | 0 (0.0%) | 0 (0.0%) |
| Total | 0 (0.0%) | 0 (0.0%) |
Employment Characteristics in Effort
Employment by Class of Employer in Effort
Among the 1,030 employed individuals in Effort, private company employees (706 | 68.5%), not-for-profit organizations (109 | 10.6%), and state government employees (67 | 6.5%) make up the most common classes of employment.
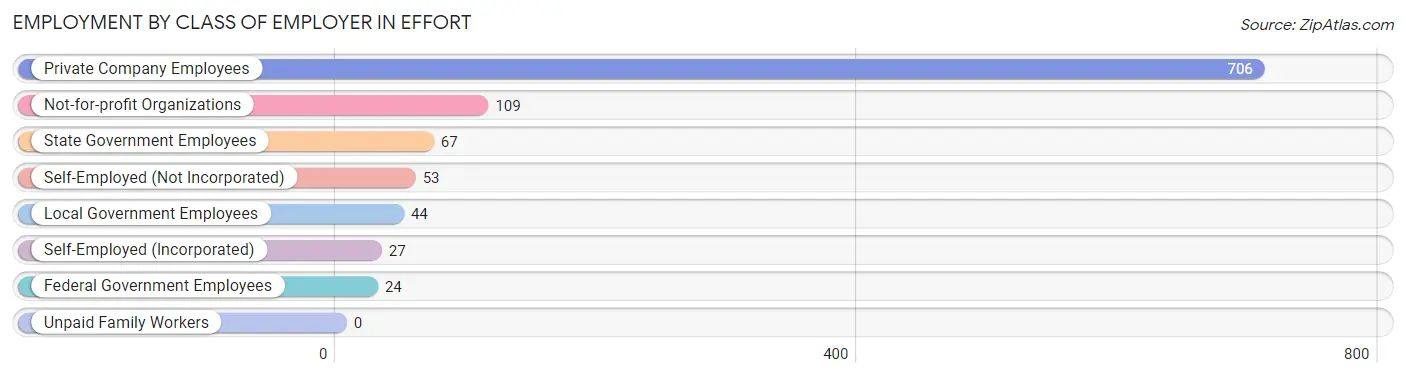
| Employer Class | # Employees | % Employees |
| Private Company Employees | 706 | 68.5% |
| Self-Employed (Incorporated) | 27 | 2.6% |
| Self-Employed (Not Incorporated) | 53 | 5.1% |
| Not-for-profit Organizations | 109 | 10.6% |
| Local Government Employees | 44 | 4.3% |
| State Government Employees | 67 | 6.5% |
| Federal Government Employees | 24 | 2.3% |
| Unpaid Family Workers | 0 | 0.0% |
| Total | 1,030 | 100.0% |
Employment Status by Age in Effort
According to the labor force statistics for Effort, out of the total population over 16 years of age (1,828), 57.3% or 1,047 individuals are in the labor force, with 1.7% or 18 of them unemployed. The age group with the highest labor force participation rate is 20 to 24 years, with 100.0% or 135 individuals in the labor force. Within the labor force, the 16 to 19 years age range has the highest percentage of unemployed individuals, with 60.0% or 18 of them being unemployed.
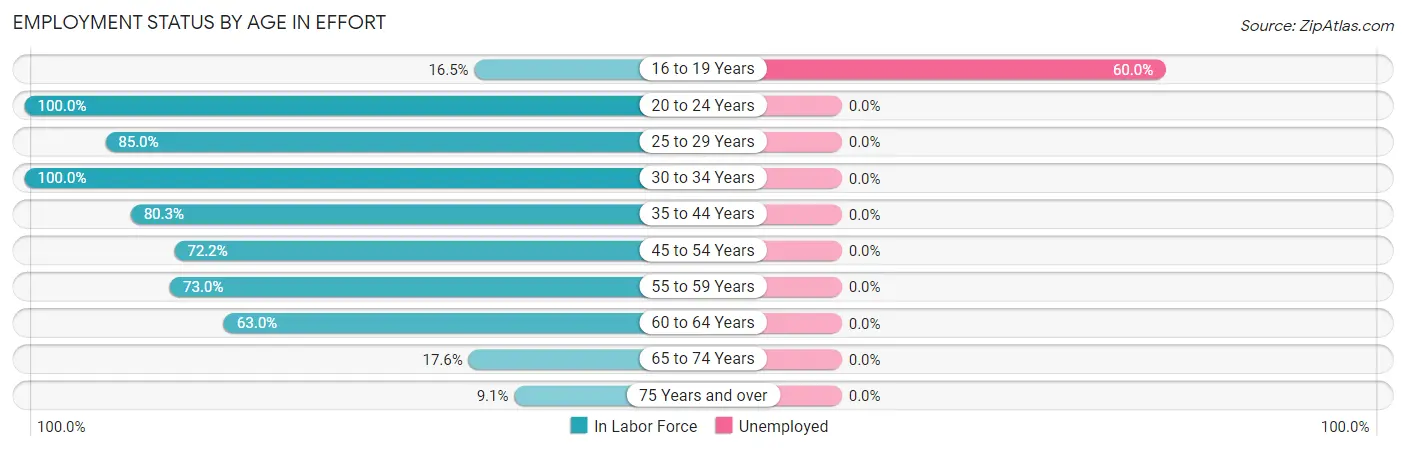
| Age Bracket | In Labor Force | Unemployed |
| 16 to 19 Years | 30 (16.5%) | 18 (60.0%) |
| 20 to 24 Years | 135 (100.0%) | 0 (0.0%) |
| 25 to 29 Years | 102 (85.0%) | 0 (0.0%) |
| 30 to 34 Years | 27 (100.0%) | 0 (0.0%) |
| 35 to 44 Years | 171 (80.3%) | 0 (0.0%) |
| 45 to 54 Years | 324 (72.2%) | 0 (0.0%) |
| 55 to 59 Years | 130 (73.0%) | 0 (0.0%) |
| 60 to 64 Years | 85 (63.0%) | 0 (0.0%) |
| 65 to 74 Years | 18 (17.6%) | 0 (0.0%) |
| 75 Years and over | 26 (9.1%) | 0 (0.0%) |
| Total | 1,047 (57.3%) | 18 (1.7%) |
Employment Status by Educational Attainment in Effort
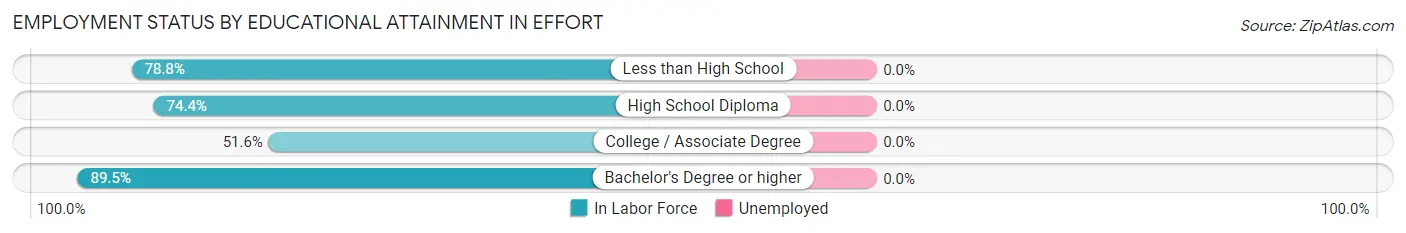
| Educational Attainment | In Labor Force | Unemployed |
| Less than High School | 130 (78.8%) | 0 (0.0%) |
| High School Diploma | 326 (74.4%) | 0 (0.0%) |
| College / Associate Degree | 111 (51.6%) | 0 (0.0%) |
| Bachelor's Degree or higher | 272 (89.5%) | 0 (0.0%) |
| Total | 839 (74.8%) | 0 (0.0%) |
Employment Occupations by Sex in Effort
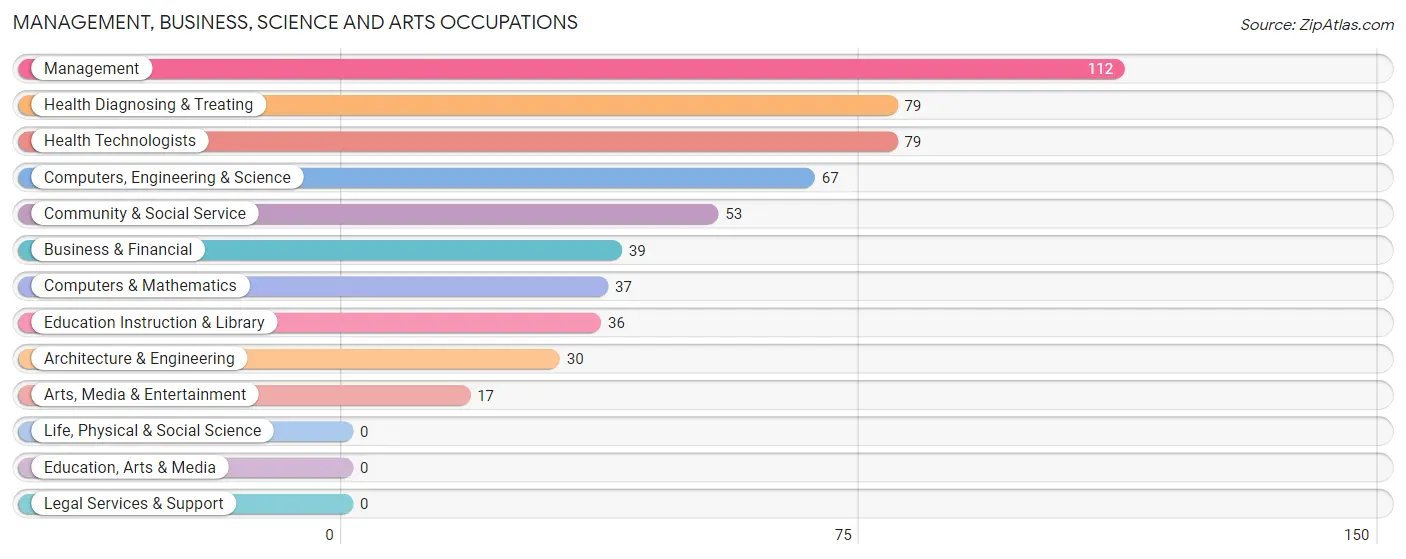
Management, Business, Science and Arts Occupations
The most common Management, Business, Science and Arts occupations in Effort are Management (112 | 10.9%), Health Diagnosing & Treating (79 | 7.7%), Health Technologists (79 | 7.7%), Computers, Engineering & Science (67 | 6.5%), and Community & Social Service (53 | 5.1%).
Management, Business, Science and Arts Occupations by Sex
Within the Management, Business, Science and Arts occupations in Effort, the most male-oriented occupations are Architecture & Engineering (100.0%), Business & Financial (69.2%), and Management (48.2%), while the most female-oriented occupations are Computers & Mathematics (100.0%), Arts, Media & Entertainment (100.0%), and Health Diagnosing & Treating (100.0%).
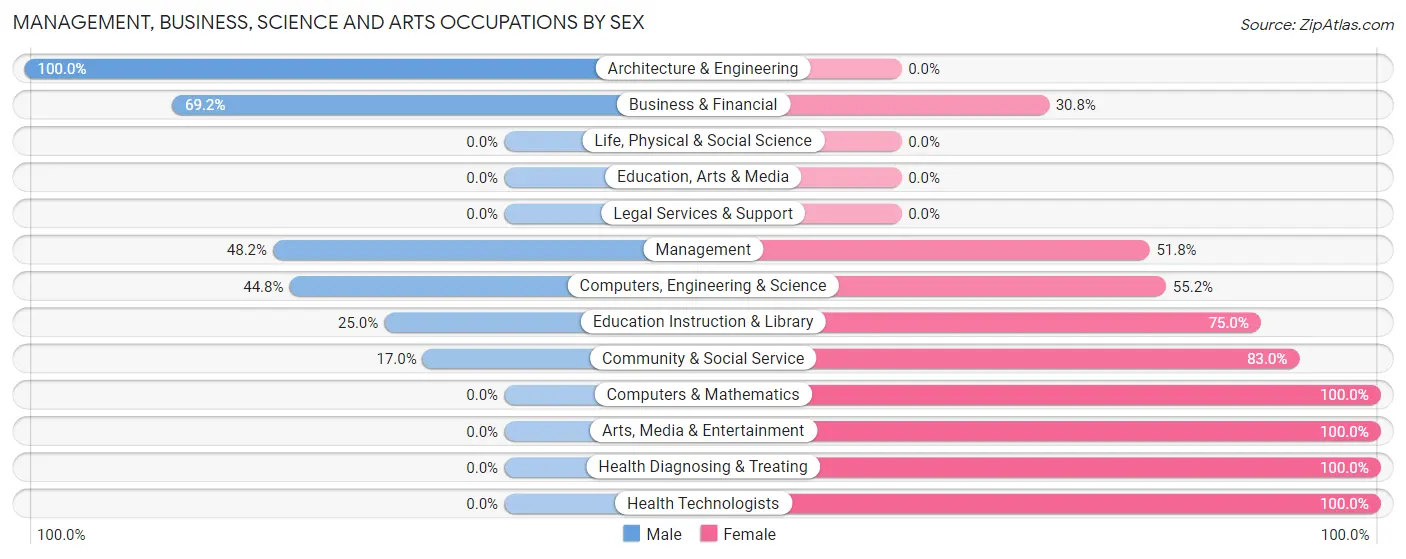
| Occupation | Male | Female |
| Management | 54 (48.2%) | 58 (51.8%) |
| Business & Financial | 27 (69.2%) | 12 (30.8%) |
| Computers, Engineering & Science | 30 (44.8%) | 37 (55.2%) |
| Computers & Mathematics | 0 (0.0%) | 37 (100.0%) |
| Architecture & Engineering | 30 (100.0%) | 0 (0.0%) |
| Life, Physical & Social Science | 0 (0.0%) | 0 (0.0%) |
| Community & Social Service | 9 (17.0%) | 44 (83.0%) |
| Education, Arts & Media | 0 (0.0%) | 0 (0.0%) |
| Legal Services & Support | 0 (0.0%) | 0 (0.0%) |
| Education Instruction & Library | 9 (25.0%) | 27 (75.0%) |
| Arts, Media & Entertainment | 0 (0.0%) | 17 (100.0%) |
| Health Diagnosing & Treating | 0 (0.0%) | 79 (100.0%) |
| Health Technologists | 0 (0.0%) | 79 (100.0%) |
| Total (Category) | 120 (34.3%) | 230 (65.7%) |
| Total (Overall) | 513 (49.8%) | 517 (50.2%) |
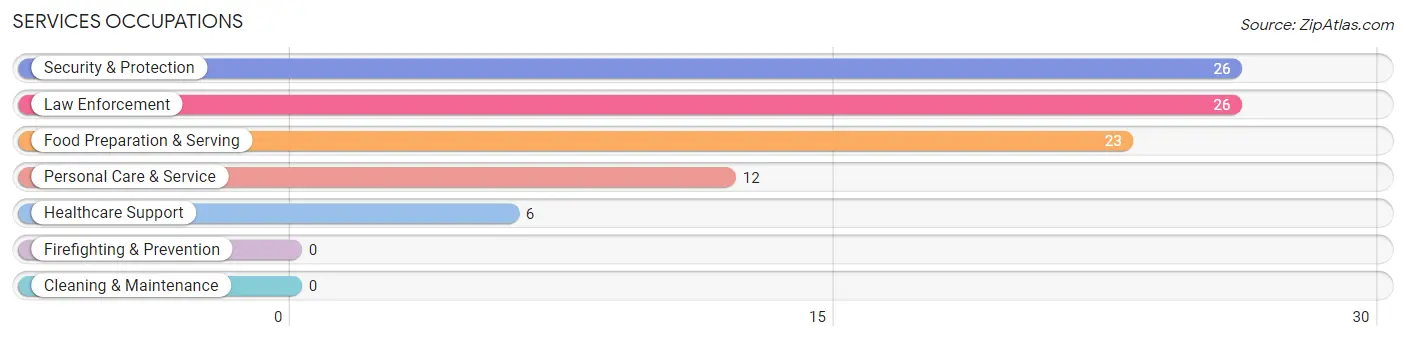
Services Occupations
The most common Services occupations in Effort are Security & Protection (26 | 2.5%), Law Enforcement (26 | 2.5%), Food Preparation & Serving (23 | 2.2%), Personal Care & Service (12 | 1.2%), and Healthcare Support (6 | 0.6%).
Services Occupations by Sex
Within the Services occupations in Effort, the most male-oriented occupations are Security & Protection (100.0%), Law Enforcement (100.0%), and Food Preparation & Serving (60.9%), while the most female-oriented occupations are Healthcare Support (100.0%), Personal Care & Service (100.0%), and Food Preparation & Serving (39.1%).
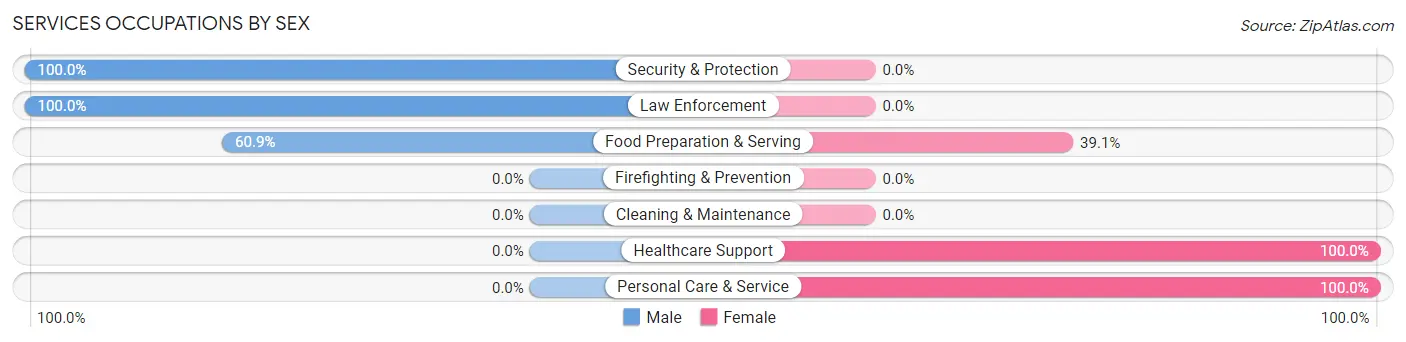
| Occupation | Male | Female |
| Healthcare Support | 0 (0.0%) | 6 (100.0%) |
| Security & Protection | 26 (100.0%) | 0 (0.0%) |
| Firefighting & Prevention | 0 (0.0%) | 0 (0.0%) |
| Law Enforcement | 26 (100.0%) | 0 (0.0%) |
| Food Preparation & Serving | 14 (60.9%) | 9 (39.1%) |
| Cleaning & Maintenance | 0 (0.0%) | 0 (0.0%) |
| Personal Care & Service | 0 (0.0%) | 12 (100.0%) |
| Total (Category) | 40 (59.7%) | 27 (40.3%) |
| Total (Overall) | 513 (49.8%) | 517 (50.2%) |
Sales and Office Occupations
The most common Sales and Office occupations in Effort are Office & Administration (220 | 21.4%), and Sales & Related (103 | 10.0%).
Sales and Office Occupations by Sex
| Occupation | Male | Female |
| Sales & Related | 56 (54.4%) | 47 (45.6%) |
| Office & Administration | 34 (15.4%) | 186 (84.6%) |
| Total (Category) | 90 (27.9%) | 233 (72.1%) |
| Total (Overall) | 513 (49.8%) | 517 (50.2%) |
Natural Resources, Construction and Maintenance Occupations
The most common Natural Resources, Construction and Maintenance occupations in Effort are Installation, Maintenance & Repair (82 | 8.0%), and Construction & Extraction (28 | 2.7%).
Natural Resources, Construction and Maintenance Occupations by Sex
| Occupation | Male | Female |
| Farming, Fishing & Forestry | 0 (0.0%) | 0 (0.0%) |
| Construction & Extraction | 28 (100.0%) | 0 (0.0%) |
| Installation, Maintenance & Repair | 82 (100.0%) | 0 (0.0%) |
| Total (Category) | 110 (100.0%) | 0 (0.0%) |
| Total (Overall) | 513 (49.8%) | 517 (50.2%) |
Production, Transportation and Moving Occupations
The most common Production, Transportation and Moving occupations in Effort are Material Moving (106 | 10.3%), Transportation (61 | 5.9%), and Production (13 | 1.3%).
Production, Transportation and Moving Occupations by Sex
| Occupation | Male | Female |
| Production | 0 (0.0%) | 13 (100.0%) |
| Transportation | 61 (100.0%) | 0 (0.0%) |
| Material Moving | 92 (86.8%) | 14 (13.2%) |
| Total (Category) | 153 (85.0%) | 27 (15.0%) |
| Total (Overall) | 513 (49.8%) | 517 (50.2%) |
Employment Industries by Sex in Effort
Employment Industries in Effort
The major employment industries in Effort include Health Care & Social Assistance (247 | 24.0%), Transportation & Warehousing (117 | 11.4%), Manufacturing (101 | 9.8%), Construction (95 | 9.2%), and Professional & Scientific (94 | 9.1%).
Employment Industries by Sex in Effort
The Effort industries that see more men than women are Construction (100.0%), Transportation & Warehousing (100.0%), and Finance & Insurance (100.0%), whereas the industries that tend to have a higher number of women are Real Estate, Rental & Leasing (100.0%), Educational Services (100.0%), and Arts, Entertainment & Recreation (100.0%).
| Industry | Male | Female |
| Agriculture, Fishing & Hunting | 0 (0.0%) | 0 (0.0%) |
| Mining, Quarrying, & Extraction | 0 (0.0%) | 0 (0.0%) |
| Construction | 95 (100.0%) | 0 (0.0%) |
| Manufacturing | 66 (65.3%) | 35 (34.6%) |
| Wholesale Trade | 23 (65.7%) | 12 (34.3%) |
| Retail Trade | 44 (57.9%) | 32 (42.1%) |
| Transportation & Warehousing | 117 (100.0%) | 0 (0.0%) |
| Utilities | 0 (0.0%) | 0 (0.0%) |
| Information | 0 (0.0%) | 0 (0.0%) |
| Finance & Insurance | 9 (100.0%) | 0 (0.0%) |
| Real Estate, Rental & Leasing | 0 (0.0%) | 17 (100.0%) |
| Professional & Scientific | 25 (26.6%) | 69 (73.4%) |
| Enterprise Management | 0 (0.0%) | 0 (0.0%) |
| Administrative & Support | 39 (60.0%) | 26 (40.0%) |
| Educational Services | 0 (0.0%) | 71 (100.0%) |
| Health Care & Social Assistance | 37 (15.0%) | 210 (85.0%) |
| Arts, Entertainment & Recreation | 0 (0.0%) | 9 (100.0%) |
| Accommodation & Food Services | 14 (100.0%) | 0 (0.0%) |
| Public Administration | 35 (59.3%) | 24 (40.7%) |
| Total | 513 (49.8%) | 517 (50.2%) |
Education in Effort
School Enrollment in Effort
The most common levels of schooling among the 525 students in Effort are high school (163 | 31.0%), middle school (130 | 24.8%), and nursery / preschool (92 | 17.5%).
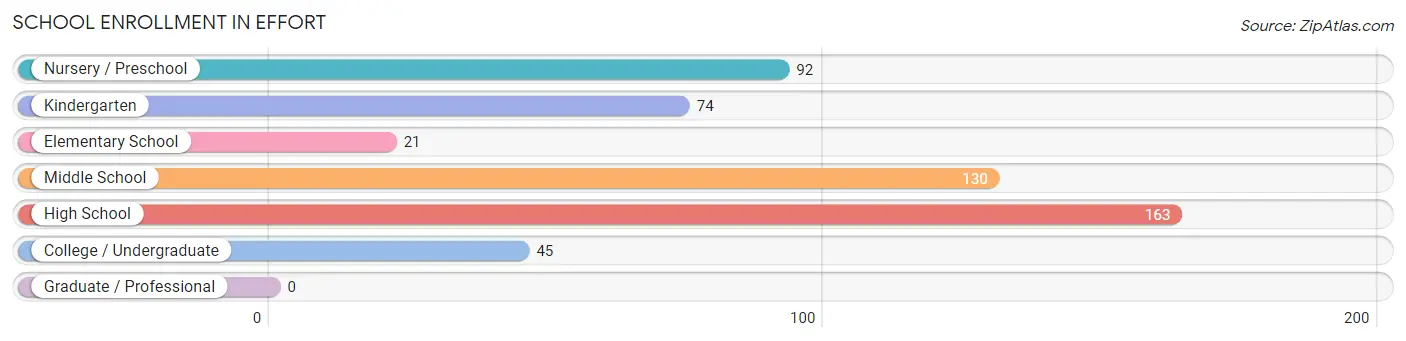
| School Level | # Students | % Students |
| Nursery / Preschool | 92 | 17.5% |
| Kindergarten | 74 | 14.1% |
| Elementary School | 21 | 4.0% |
| Middle School | 130 | 24.8% |
| High School | 163 | 31.0% |
| College / Undergraduate | 45 | 8.6% |
| Graduate / Professional | 0 | 0.0% |
| Total | 525 | 100.0% |
School Enrollment by Age by Funding Source in Effort
Out of a total of 525 students who are enrolled in schools in Effort, 61 (11.6%) attend a private institution, while the remaining 464 (88.4%) are enrolled in public schools. The age group of 3 to 4 year olds has the highest likelihood of being enrolled in private schools, with 34 (37.0% in the age bracket) enrolled. Conversely, the age group of 5 to 9 year old has the lowest likelihood of being enrolled in a private school, with 95 (100.0% in the age bracket) attending a public institution.
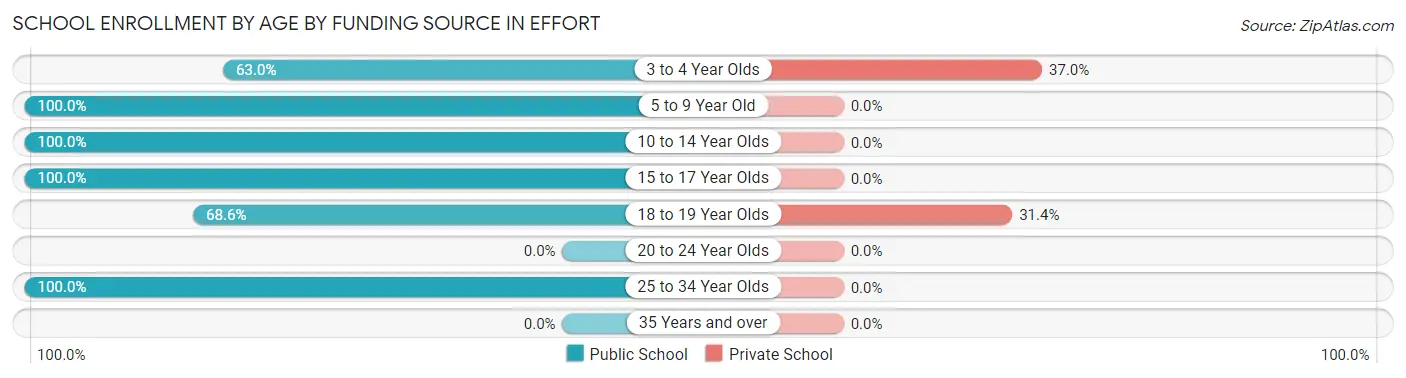
| Age Bracket | Public School | Private School |
| 3 to 4 Year Olds | 58 (63.0%) | 34 (37.0%) |
| 5 to 9 Year Old | 95 (100.0%) | 0 (0.0%) |
| 10 to 14 Year Olds | 106 (100.0%) | 0 (0.0%) |
| 15 to 17 Year Olds | 128 (100.0%) | 0 (0.0%) |
| 18 to 19 Year Olds | 59 (68.6%) | 27 (31.4%) |
| 20 to 24 Year Olds | 0 (0.0%) | 0 (0.0%) |
| 25 to 34 Year Olds | 18 (100.0%) | 0 (0.0%) |
| 35 Years and over | 0 (0.0%) | 0 (0.0%) |
| Total | 464 (88.4%) | 61 (11.6%) |
Educational Attainment by Field of Study in Effort
Liberal arts & history (112 | 26.5%), science & technology (77 | 18.2%), business (68 | 16.1%), education (57 | 13.5%), and social sciences (37 | 8.7%) are the most common fields of study among 423 individuals in Effort who have obtained a bachelor's degree or higher.
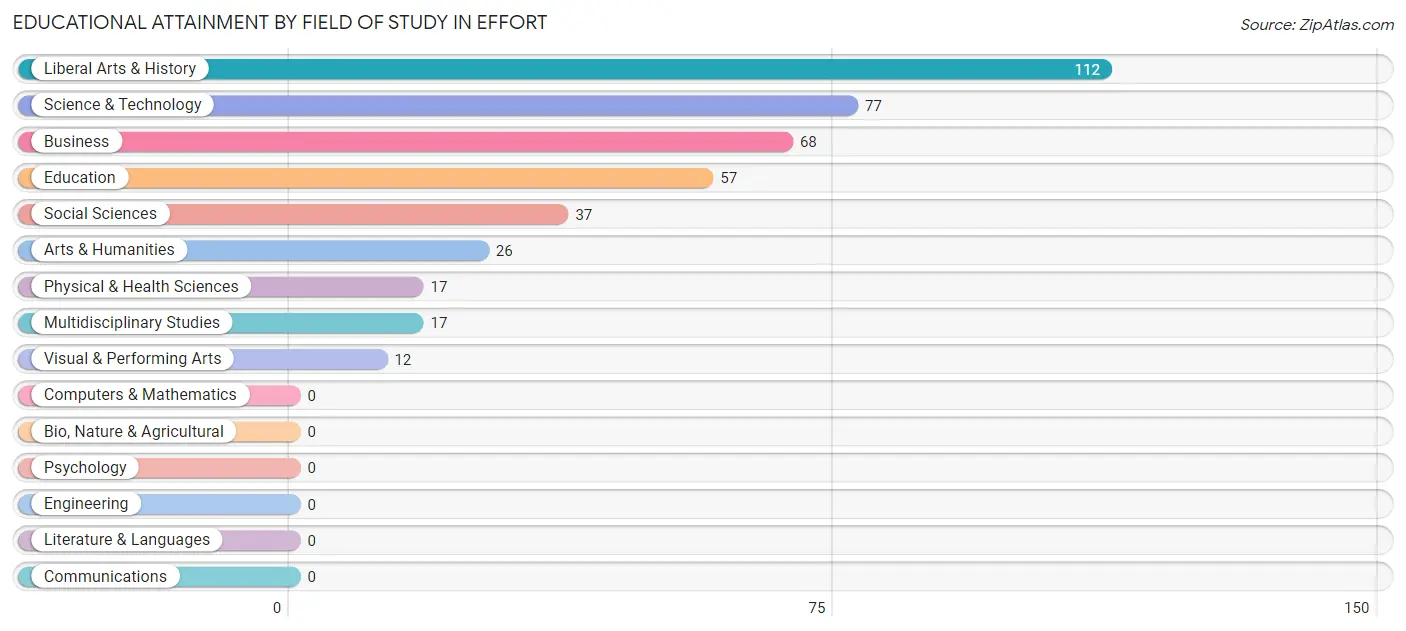
| Field of Study | # Graduates | % Graduates |
| Computers & Mathematics | 0 | 0.0% |
| Bio, Nature & Agricultural | 0 | 0.0% |
| Physical & Health Sciences | 17 | 4.0% |
| Psychology | 0 | 0.0% |
| Social Sciences | 37 | 8.7% |
| Engineering | 0 | 0.0% |
| Multidisciplinary Studies | 17 | 4.0% |
| Science & Technology | 77 | 18.2% |
| Business | 68 | 16.1% |
| Education | 57 | 13.5% |
| Literature & Languages | 0 | 0.0% |
| Liberal Arts & History | 112 | 26.5% |
| Visual & Performing Arts | 12 | 2.8% |
| Communications | 0 | 0.0% |
| Arts & Humanities | 26 | 6.1% |
| Total | 423 | 100.0% |
Transportation & Commute in Effort
Vehicle Availability by Sex in Effort
The most prevalent vehicle ownership categories in Effort are males with 2 vehicles (195, accounting for 38.0%) and females with 2 vehicles (155, making up 37.7%).
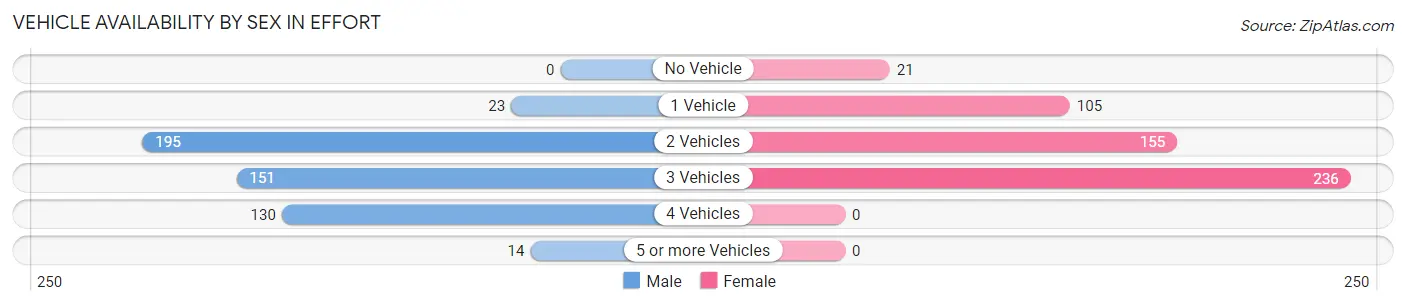
| Vehicles Available | Male | Female |
| No Vehicle | 0 (0.0%) | 21 (4.1%) |
| 1 Vehicle | 23 (4.5%) | 105 (20.3%) |
| 2 Vehicles | 195 (38.0%) | 155 (30.0%) |
| 3 Vehicles | 151 (29.4%) | 236 (45.7%) |
| 4 Vehicles | 130 (25.3%) | 0 (0.0%) |
| 5 or more Vehicles | 14 (2.7%) | 0 (0.0%) |
| Total | 513 (100.0%) | 517 (100.0%) |
Commute Time in Effort
The most frequently occuring commute durations in Effort are 90 or more minutes (162 commuters, 17.1%), 45 to 59 minutes (136 commuters, 14.3%), and 20 to 24 minutes (129 commuters, 13.6%).
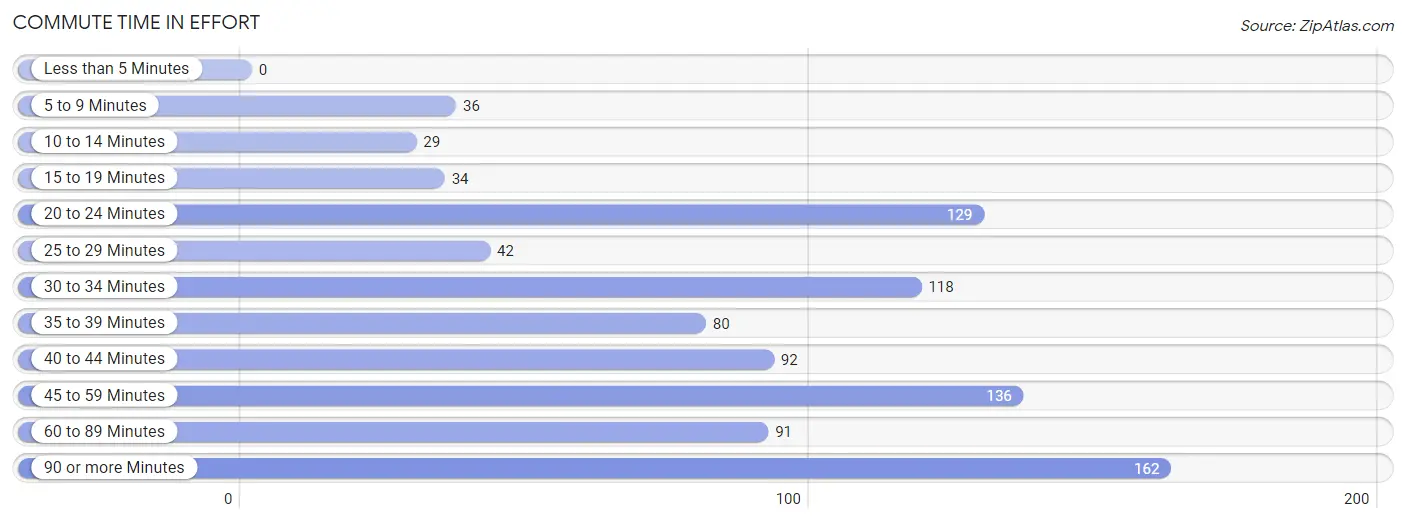
| Commute Time | # Commuters | % Commuters |
| Less than 5 Minutes | 0 | 0.0% |
| 5 to 9 Minutes | 36 | 3.8% |
| 10 to 14 Minutes | 29 | 3.1% |
| 15 to 19 Minutes | 34 | 3.6% |
| 20 to 24 Minutes | 129 | 13.6% |
| 25 to 29 Minutes | 42 | 4.4% |
| 30 to 34 Minutes | 118 | 12.4% |
| 35 to 39 Minutes | 80 | 8.4% |
| 40 to 44 Minutes | 92 | 9.7% |
| 45 to 59 Minutes | 136 | 14.3% |
| 60 to 89 Minutes | 91 | 9.6% |
| 90 or more Minutes | 162 | 17.1% |
Commute Time by Sex in Effort
The most common commute times in Effort are 90 or more minutes (132 commuters, 28.1%) for males and 20 to 24 minutes (100 commuters, 20.9%) for females.
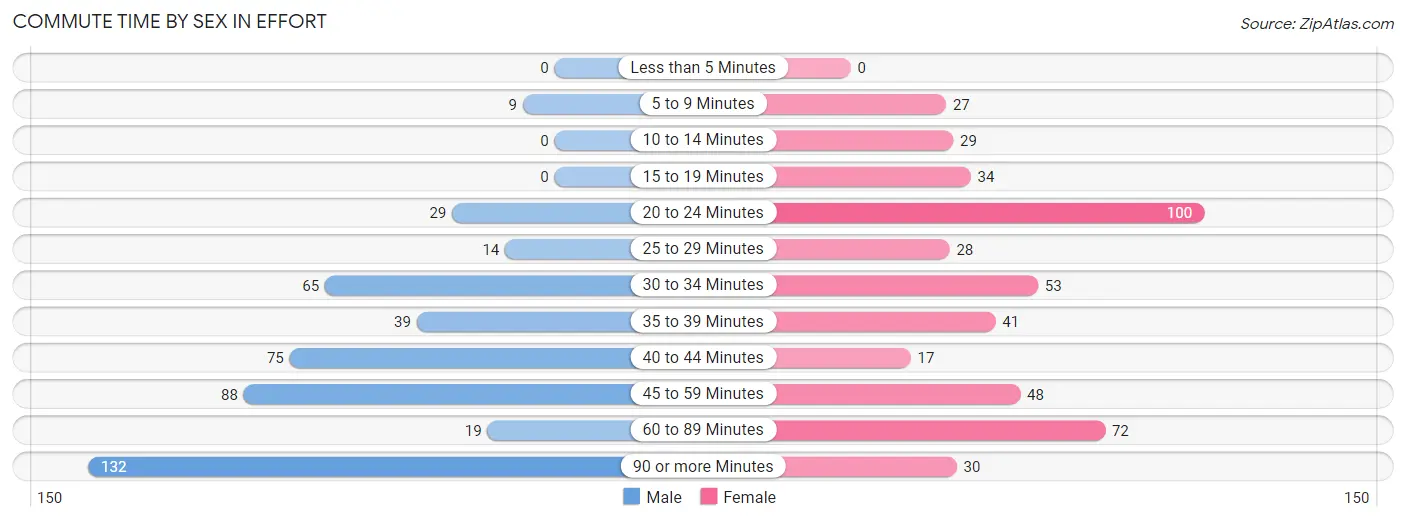
| Commute Time | Male | Female |
| Less than 5 Minutes | 0 (0.0%) | 0 (0.0%) |
| 5 to 9 Minutes | 9 (1.9%) | 27 (5.6%) |
| 10 to 14 Minutes | 0 (0.0%) | 29 (6.0%) |
| 15 to 19 Minutes | 0 (0.0%) | 34 (7.1%) |
| 20 to 24 Minutes | 29 (6.2%) | 100 (20.9%) |
| 25 to 29 Minutes | 14 (3.0%) | 28 (5.9%) |
| 30 to 34 Minutes | 65 (13.8%) | 53 (11.1%) |
| 35 to 39 Minutes | 39 (8.3%) | 41 (8.6%) |
| 40 to 44 Minutes | 75 (16.0%) | 17 (3.5%) |
| 45 to 59 Minutes | 88 (18.7%) | 48 (10.0%) |
| 60 to 89 Minutes | 19 (4.0%) | 72 (15.0%) |
| 90 or more Minutes | 132 (28.1%) | 30 (6.3%) |
Time of Departure to Work by Sex in Effort
The most frequent times of departure to work in Effort are 12:00 AM to 4:59 AM (110, 23.4%) for males and 6:00 AM to 6:29 AM (141, 29.4%) for females.
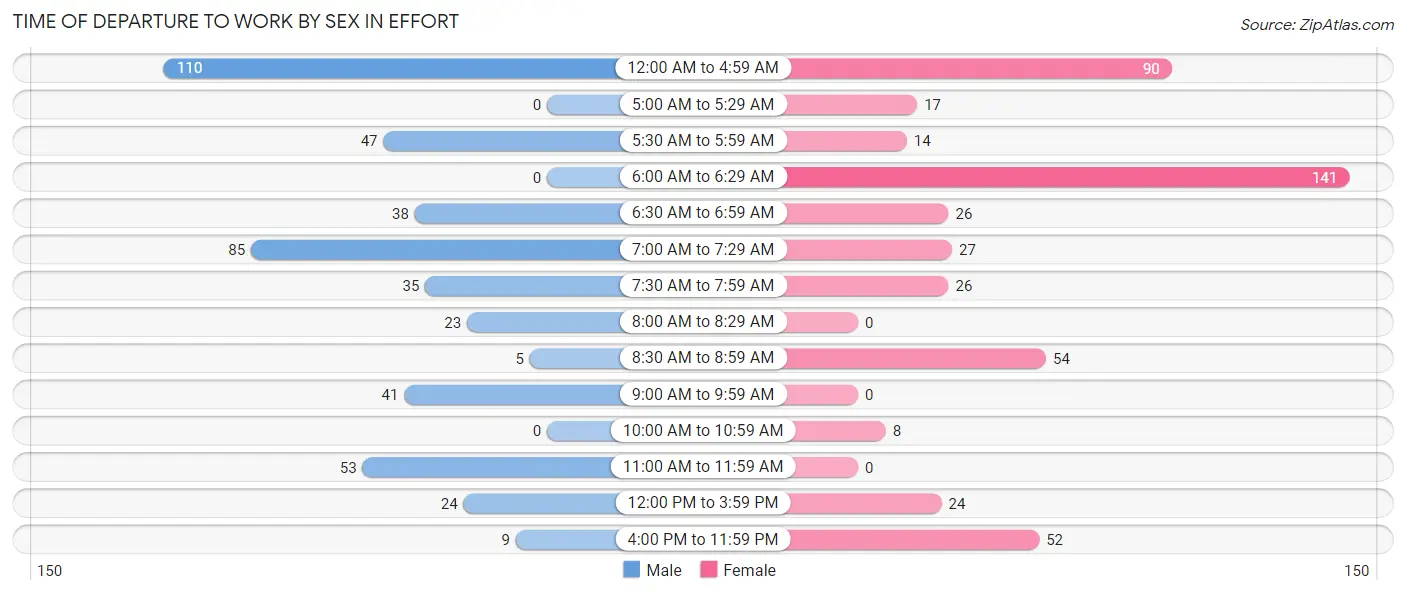
| Time of Departure | Male | Female |
| 12:00 AM to 4:59 AM | 110 (23.4%) | 90 (18.8%) |
| 5:00 AM to 5:29 AM | 0 (0.0%) | 17 (3.5%) |
| 5:30 AM to 5:59 AM | 47 (10.0%) | 14 (2.9%) |
| 6:00 AM to 6:29 AM | 0 (0.0%) | 141 (29.4%) |
| 6:30 AM to 6:59 AM | 38 (8.1%) | 26 (5.4%) |
| 7:00 AM to 7:29 AM | 85 (18.1%) | 27 (5.6%) |
| 7:30 AM to 7:59 AM | 35 (7.4%) | 26 (5.4%) |
| 8:00 AM to 8:29 AM | 23 (4.9%) | 0 (0.0%) |
| 8:30 AM to 8:59 AM | 5 (1.1%) | 54 (11.3%) |
| 9:00 AM to 9:59 AM | 41 (8.7%) | 0 (0.0%) |
| 10:00 AM to 10:59 AM | 0 (0.0%) | 8 (1.7%) |
| 11:00 AM to 11:59 AM | 53 (11.3%) | 0 (0.0%) |
| 12:00 PM to 3:59 PM | 24 (5.1%) | 24 (5.0%) |
| 4:00 PM to 11:59 PM | 9 (1.9%) | 52 (10.9%) |
| Total | 470 (100.0%) | 479 (100.0%) |
Housing Occupancy in Effort
Occupancy by Ownership in Effort
Of the total 839 dwellings in Effort, owner-occupied units account for 672 (80.1%), while renter-occupied units make up 167 (19.9%).
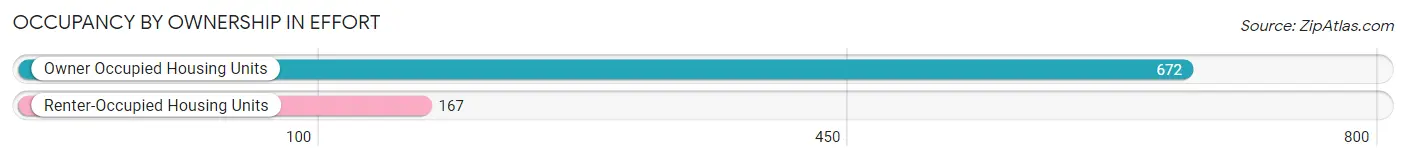
| Occupancy | # Housing Units | % Housing Units |
| Owner Occupied Housing Units | 672 | 80.1% |
| Renter-Occupied Housing Units | 167 | 19.9% |
| Total Occupied Housing Units | 839 | 100.0% |
Occupancy by Household Size in Effort
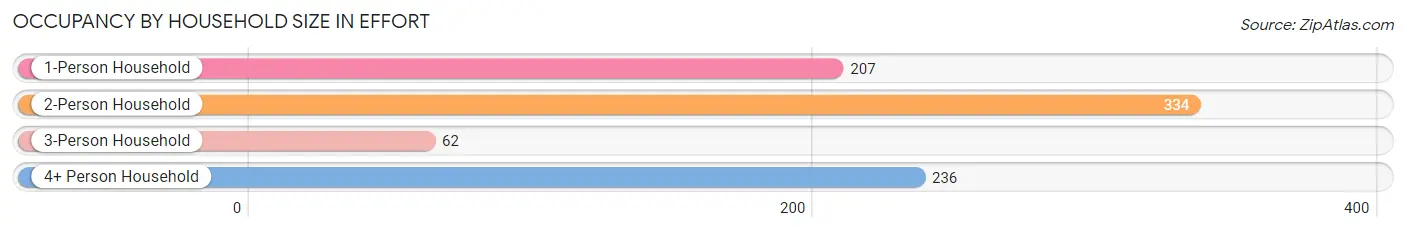
| Household Size | # Housing Units | % Housing Units |
| 1-Person Household | 207 | 24.7% |
| 2-Person Household | 334 | 39.8% |
| 3-Person Household | 62 | 7.4% |
| 4+ Person Household | 236 | 28.1% |
| Total Housing Units | 839 | 100.0% |
Occupancy by Ownership by Household Size in Effort
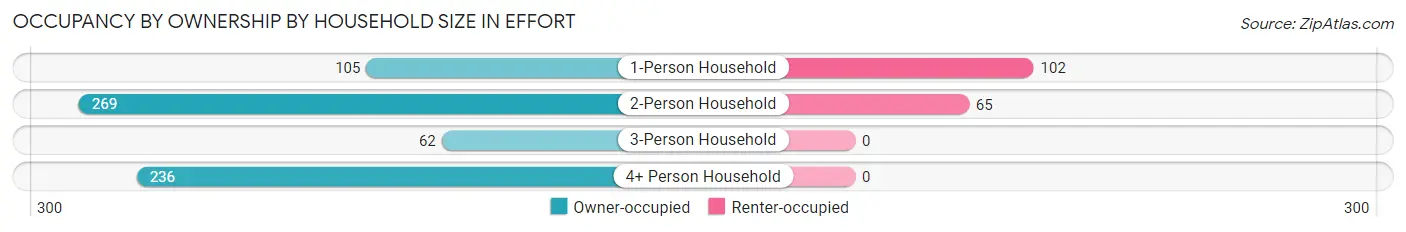
| Household Size | Owner-occupied | Renter-occupied |
| 1-Person Household | 105 (50.7%) | 102 (49.3%) |
| 2-Person Household | 269 (80.5%) | 65 (19.5%) |
| 3-Person Household | 62 (100.0%) | 0 (0.0%) |
| 4+ Person Household | 236 (100.0%) | 0 (0.0%) |
| Total Housing Units | 672 (80.1%) | 167 (19.9%) |
Occupancy by Educational Attainment in Effort
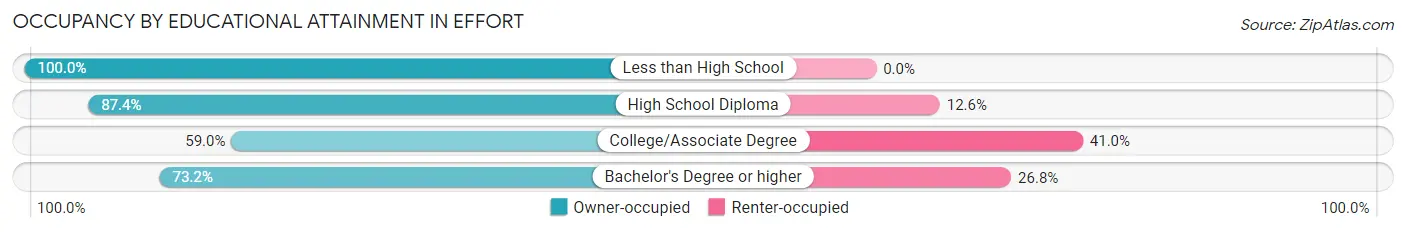
| Household Size | Owner-occupied | Renter-occupied |
| Less than High School | 108 (100.0%) | 0 (0.0%) |
| High School Diploma | 284 (87.4%) | 41 (12.6%) |
| College/Associate Degree | 72 (59.0%) | 50 (41.0%) |
| Bachelor's Degree or higher | 208 (73.2%) | 76 (26.8%) |
Occupancy by Age of Householder in Effort
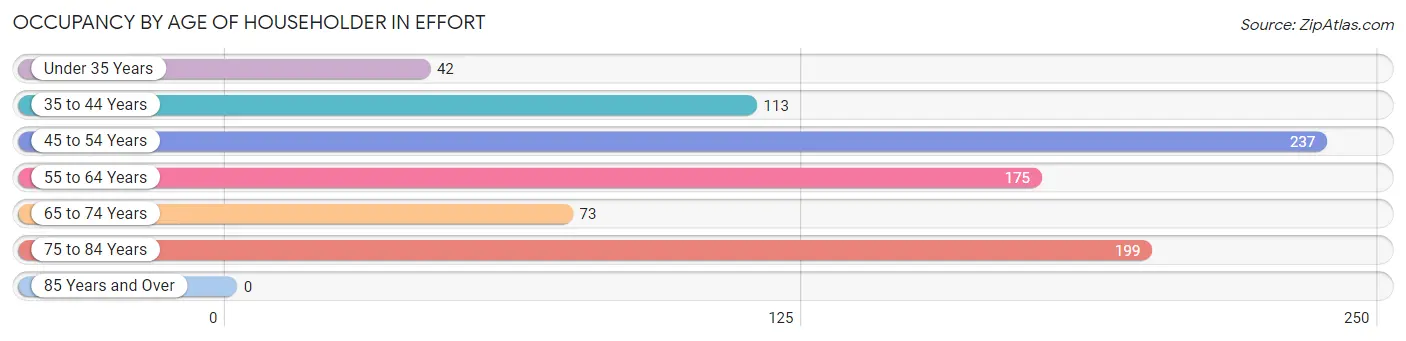
| Age Bracket | # Households | % Households |
| Under 35 Years | 42 | 5.0% |
| 35 to 44 Years | 113 | 13.5% |
| 45 to 54 Years | 237 | 28.2% |
| 55 to 64 Years | 175 | 20.9% |
| 65 to 74 Years | 73 | 8.7% |
| 75 to 84 Years | 199 | 23.7% |
| 85 Years and Over | 0 | 0.0% |
| Total | 839 | 100.0% |
Housing Finances in Effort
Median Income by Occupancy in Effort
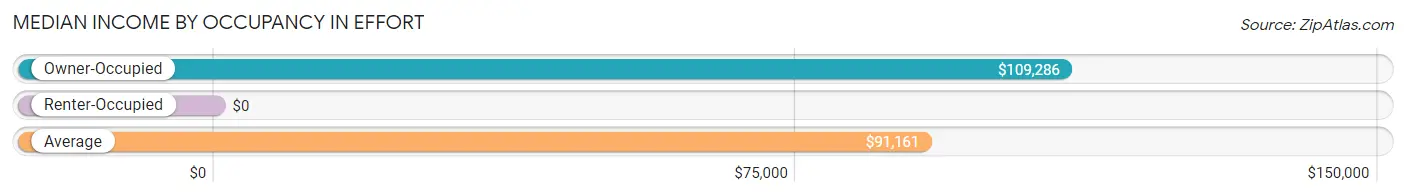
| Occupancy Type | # Households | Median Income |
| Owner-Occupied | 672 (80.1%) | $109,286 |
| Renter-Occupied | 167 (19.9%) | $0 |
| Average | 839 (100.0%) | $91,161 |
Occupancy by Householder Income Bracket in Effort
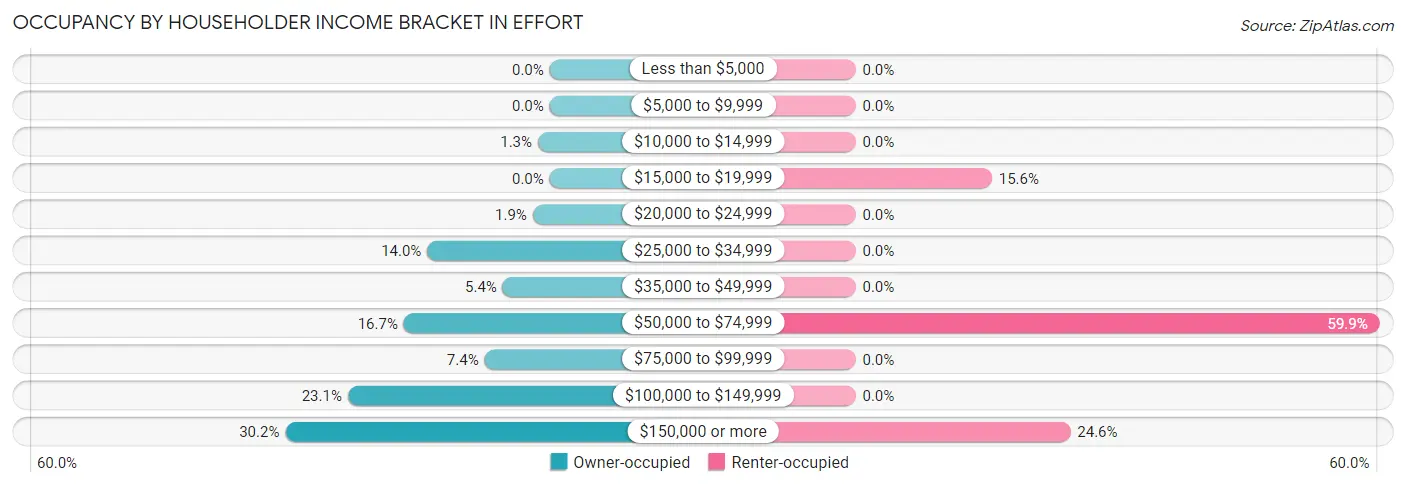
| Income Bracket | Owner-occupied | Renter-occupied |
| Less than $5,000 | 0 (0.0%) | 0 (0.0%) |
| $5,000 to $9,999 | 0 (0.0%) | 0 (0.0%) |
| $10,000 to $14,999 | 9 (1.3%) | 0 (0.0%) |
| $15,000 to $19,999 | 0 (0.0%) | 26 (15.6%) |
| $20,000 to $24,999 | 13 (1.9%) | 0 (0.0%) |
| $25,000 to $34,999 | 94 (14.0%) | 0 (0.0%) |
| $35,000 to $49,999 | 36 (5.4%) | 0 (0.0%) |
| $50,000 to $74,999 | 112 (16.7%) | 100 (59.9%) |
| $75,000 to $99,999 | 50 (7.4%) | 0 (0.0%) |
| $100,000 to $149,999 | 155 (23.1%) | 0 (0.0%) |
| $150,000 or more | 203 (30.2%) | 41 (24.5%) |
| Total | 672 (100.0%) | 167 (100.0%) |
Monthly Housing Cost Tiers in Effort
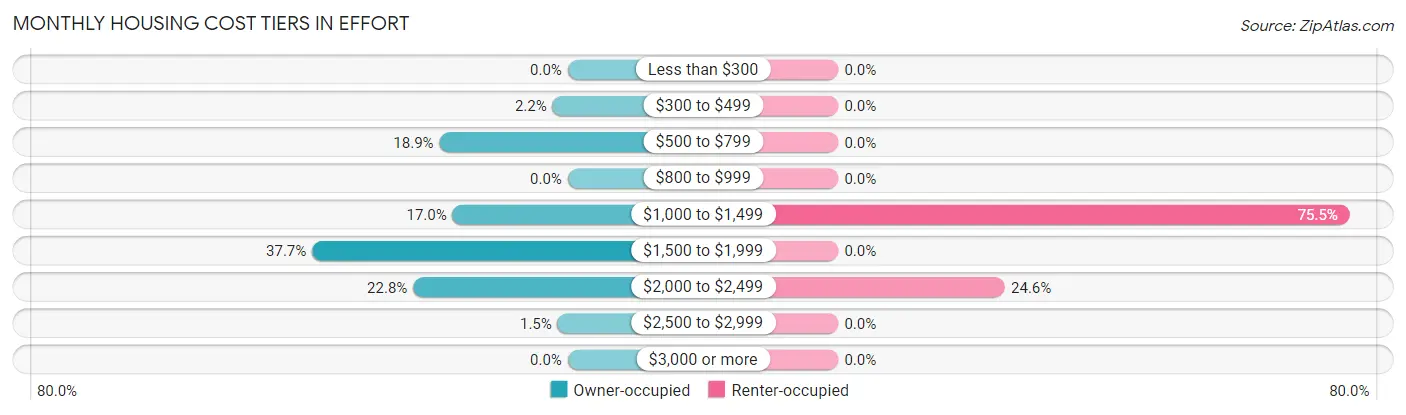
| Monthly Cost | Owner-occupied | Renter-occupied |
| Less than $300 | 0 (0.0%) | 0 (0.0%) |
| $300 to $499 | 15 (2.2%) | 0 (0.0%) |
| $500 to $799 | 127 (18.9%) | 0 (0.0%) |
| $800 to $999 | 0 (0.0%) | 0 (0.0%) |
| $1,000 to $1,499 | 114 (17.0%) | 126 (75.4%) |
| $1,500 to $1,999 | 253 (37.7%) | 0 (0.0%) |
| $2,000 to $2,499 | 153 (22.8%) | 41 (24.5%) |
| $2,500 to $2,999 | 10 (1.5%) | 0 (0.0%) |
| $3,000 or more | 0 (0.0%) | 0 (0.0%) |
| Total | 672 (100.0%) | 167 (100.0%) |
Physical Housing Characteristics in Effort
Housing Structures in Effort
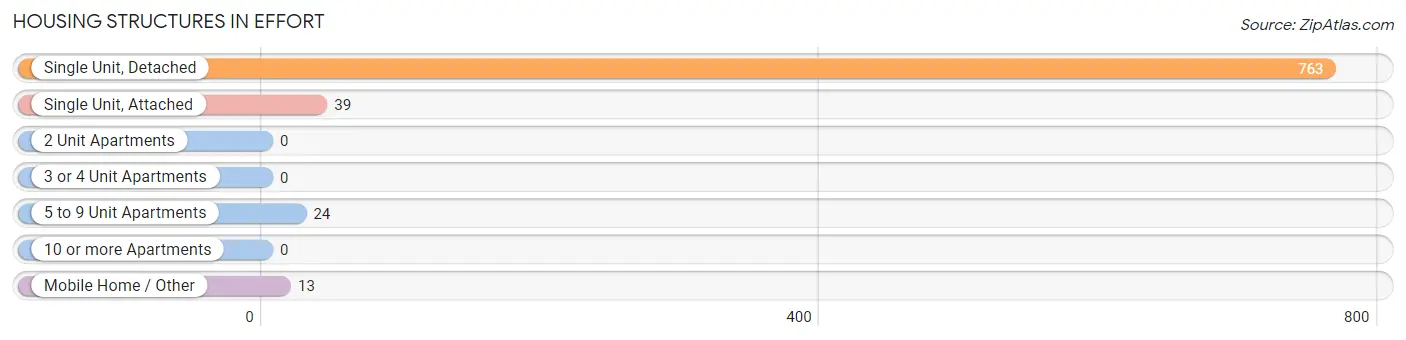
| Structure Type | # Housing Units | % Housing Units |
| Single Unit, Detached | 763 | 90.9% |
| Single Unit, Attached | 39 | 4.6% |
| 2 Unit Apartments | 0 | 0.0% |
| 3 or 4 Unit Apartments | 0 | 0.0% |
| 5 to 9 Unit Apartments | 24 | 2.9% |
| 10 or more Apartments | 0 | 0.0% |
| Mobile Home / Other | 13 | 1.5% |
| Total | 839 | 100.0% |
Housing Structures by Occupancy in Effort
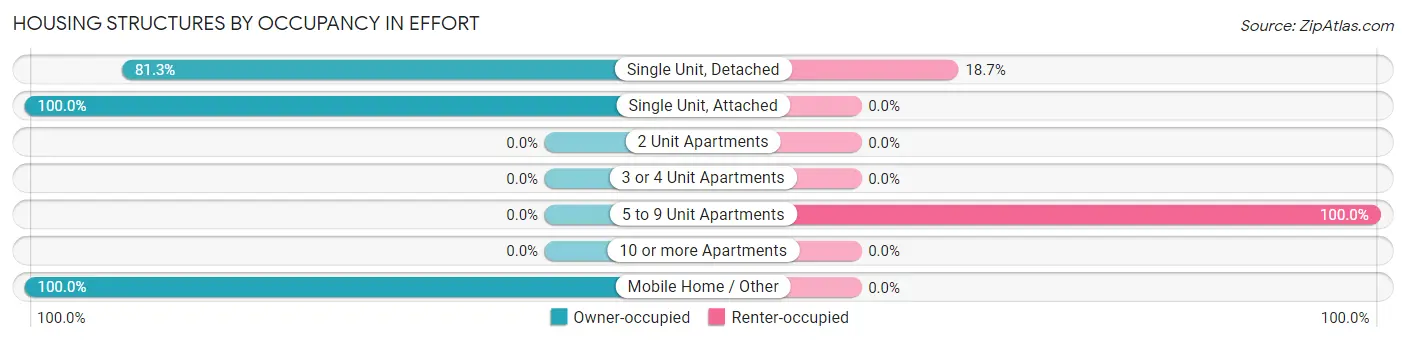
| Structure Type | Owner-occupied | Renter-occupied |
| Single Unit, Detached | 620 (81.3%) | 143 (18.7%) |
| Single Unit, Attached | 39 (100.0%) | 0 (0.0%) |
| 2 Unit Apartments | 0 (0.0%) | 0 (0.0%) |
| 3 or 4 Unit Apartments | 0 (0.0%) | 0 (0.0%) |
| 5 to 9 Unit Apartments | 0 (0.0%) | 24 (100.0%) |
| 10 or more Apartments | 0 (0.0%) | 0 (0.0%) |
| Mobile Home / Other | 13 (100.0%) | 0 (0.0%) |
| Total | 672 (80.1%) | 167 (19.9%) |
Housing Structures by Number of Rooms in Effort
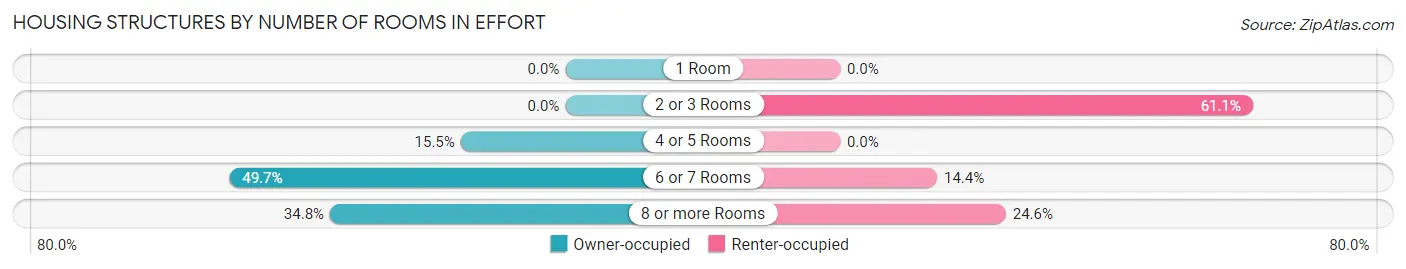
| Number of Rooms | Owner-occupied | Renter-occupied |
| 1 Room | 0 (0.0%) | 0 (0.0%) |
| 2 or 3 Rooms | 0 (0.0%) | 102 (61.1%) |
| 4 or 5 Rooms | 104 (15.5%) | 0 (0.0%) |
| 6 or 7 Rooms | 334 (49.7%) | 24 (14.4%) |
| 8 or more Rooms | 234 (34.8%) | 41 (24.5%) |
| Total | 672 (100.0%) | 167 (100.0%) |
Housing Structure by Heating Type in Effort
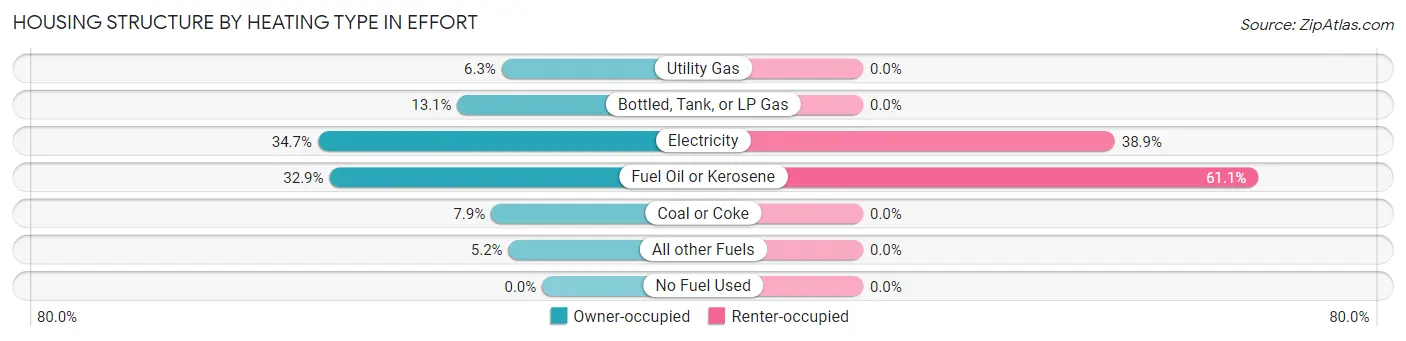
| Heating Type | Owner-occupied | Renter-occupied |
| Utility Gas | 42 (6.2%) | 0 (0.0%) |
| Bottled, Tank, or LP Gas | 88 (13.1%) | 0 (0.0%) |
| Electricity | 233 (34.7%) | 65 (38.9%) |
| Fuel Oil or Kerosene | 221 (32.9%) | 102 (61.1%) |
| Coal or Coke | 53 (7.9%) | 0 (0.0%) |
| All other Fuels | 35 (5.2%) | 0 (0.0%) |
| No Fuel Used | 0 (0.0%) | 0 (0.0%) |
| Total | 672 (100.0%) | 167 (100.0%) |
Household Vehicle Usage in Effort
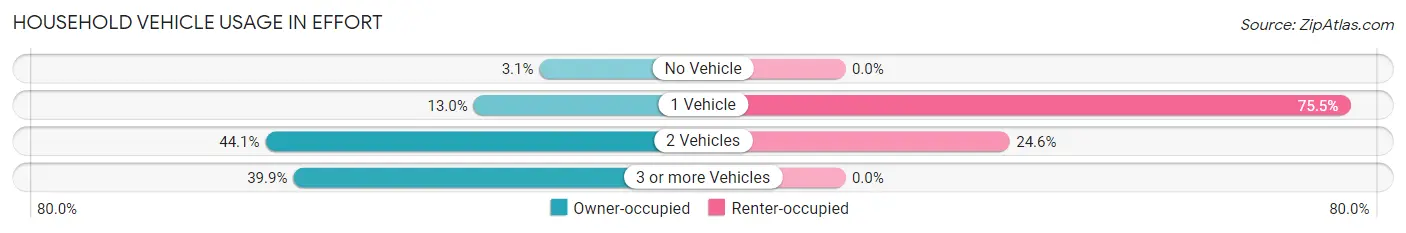
| Vehicles per Household | Owner-occupied | Renter-occupied |
| No Vehicle | 21 (3.1%) | 0 (0.0%) |
| 1 Vehicle | 87 (13.0%) | 126 (75.4%) |
| 2 Vehicles | 296 (44.1%) | 41 (24.5%) |
| 3 or more Vehicles | 268 (39.9%) | 0 (0.0%) |
| Total | 672 (100.0%) | 167 (100.0%) |
Real Estate & Mortgages in Effort
Real Estate and Mortgage Overview in Effort
| Characteristic | Without Mortgage | With Mortgage |
| Housing Units | 131 | 541 |
| Median Property Value | $325,600 | $215,900 |
| Median Household Income | - | - |
| Monthly Housing Costs | $735 | $0 |
| Real Estate Taxes | $5,758 | $0 |
Property Value by Mortgage Status in Effort
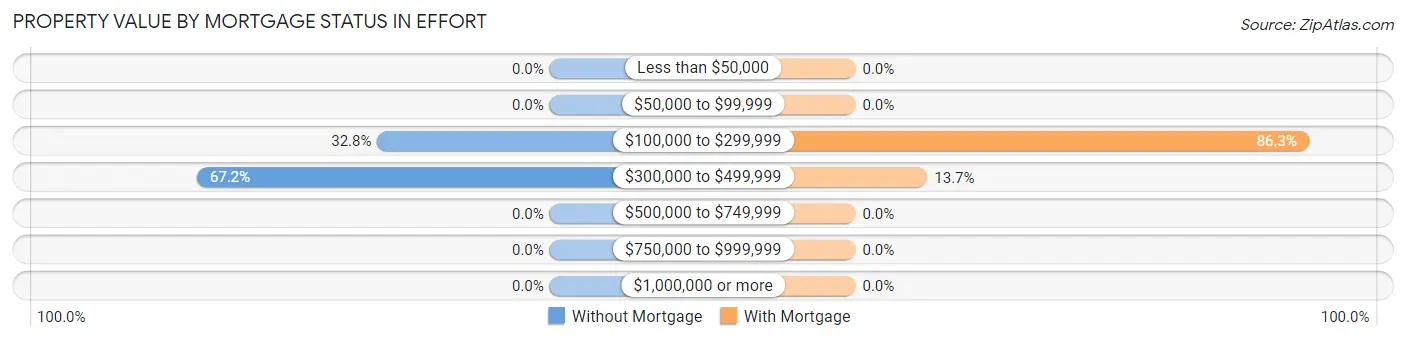
| Property Value | Without Mortgage | With Mortgage |
| Less than $50,000 | 0 (0.0%) | 0 (0.0%) |
| $50,000 to $99,999 | 0 (0.0%) | 0 (0.0%) |
| $100,000 to $299,999 | 43 (32.8%) | 467 (86.3%) |
| $300,000 to $499,999 | 88 (67.2%) | 74 (13.7%) |
| $500,000 to $749,999 | 0 (0.0%) | 0 (0.0%) |
| $750,000 to $999,999 | 0 (0.0%) | 0 (0.0%) |
| $1,000,000 or more | 0 (0.0%) | 0 (0.0%) |
| Total | 131 (100.0%) | 541 (100.0%) |
Household Income by Mortgage Status in Effort
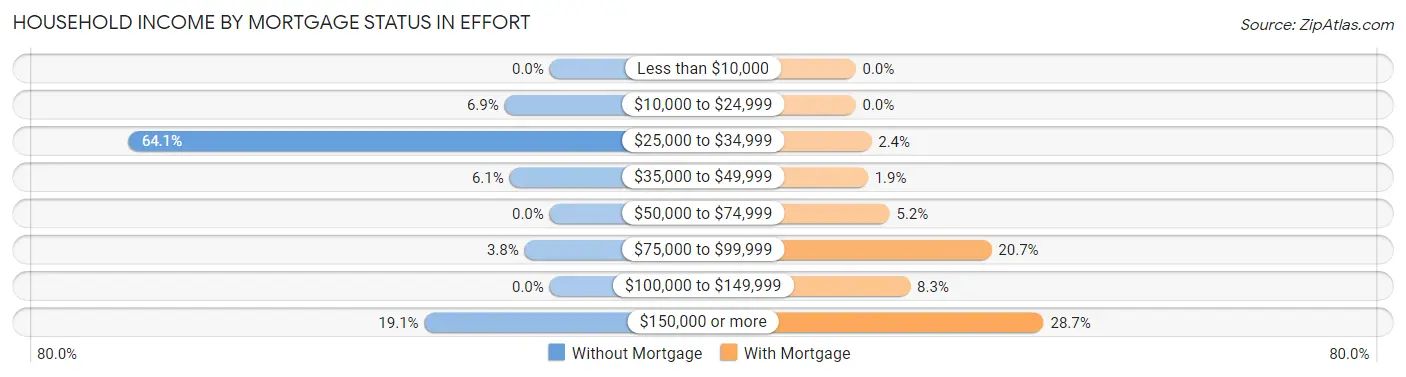
| Household Income | Without Mortgage | With Mortgage |
| Less than $10,000 | 0 (0.0%) | 0 (0.0%) |
| $10,000 to $24,999 | 9 (6.9%) | 0 (0.0%) |
| $25,000 to $34,999 | 84 (64.1%) | 13 (2.4%) |
| $35,000 to $49,999 | 8 (6.1%) | 10 (1.8%) |
| $50,000 to $74,999 | 0 (0.0%) | 28 (5.2%) |
| $75,000 to $99,999 | 5 (3.8%) | 112 (20.7%) |
| $100,000 to $149,999 | 0 (0.0%) | 45 (8.3%) |
| $150,000 or more | 25 (19.1%) | 155 (28.6%) |
| Total | 131 (100.0%) | 541 (100.0%) |
Property Value to Household Income Ratio in Effort
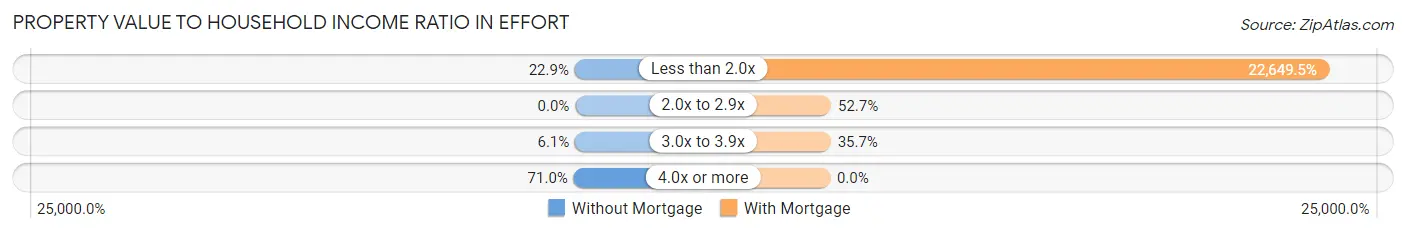
| Value-to-Income Ratio | Without Mortgage | With Mortgage |
| Less than 2.0x | 30 (22.9%) | 122,534 (22,649.5%) |
| 2.0x to 2.9x | 0 (0.0%) | 285 (52.7%) |
| 3.0x to 3.9x | 8 (6.1%) | 193 (35.7%) |
| 4.0x or more | 93 (71.0%) | 0 (0.0%) |
| Total | 131 (100.0%) | 541 (100.0%) |
Real Estate Taxes by Mortgage Status in Effort
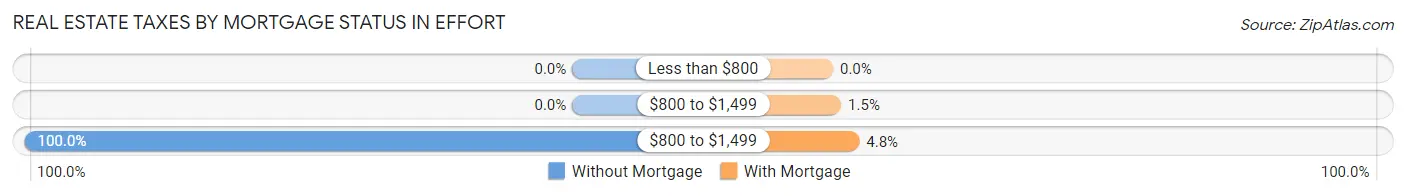
| Property Taxes | Without Mortgage | With Mortgage |
| Less than $800 | 0 (0.0%) | 0 (0.0%) |
| $800 to $1,499 | 0 (0.0%) | 8 (1.5%) |
| $800 to $1,499 | 131 (100.0%) | 26 (4.8%) |
| Total | 131 (100.0%) | 541 (100.0%) |
Health & Disability in Effort
Health Insurance Coverage by Age in Effort
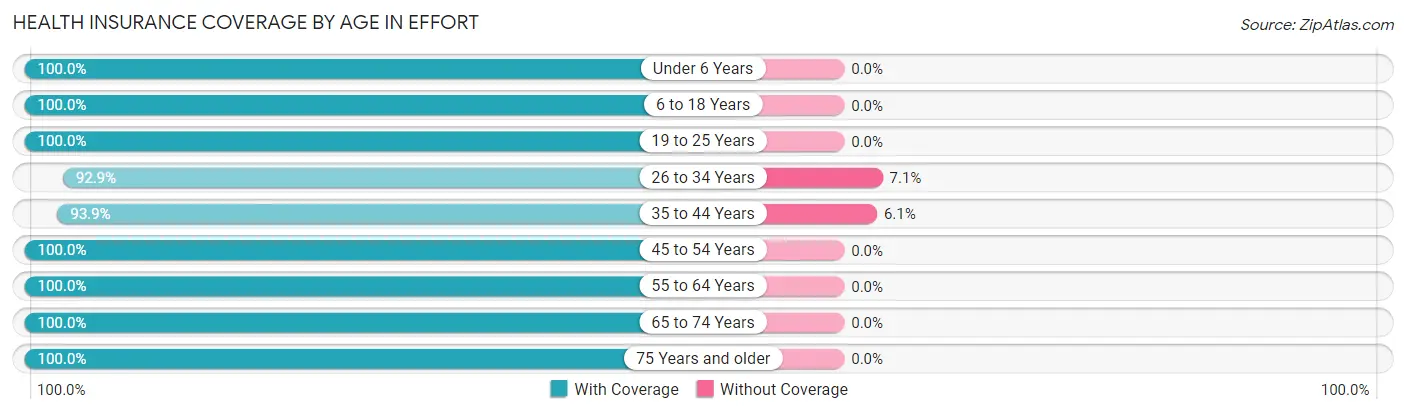
| Age Bracket | With Coverage | Without Coverage |
| Under 6 Years | 209 (100.0%) | 0 (0.0%) |
| 6 to 18 Years | 323 (100.0%) | 0 (0.0%) |
| 19 to 25 Years | 255 (100.0%) | 0 (0.0%) |
| 26 to 34 Years | 78 (92.9%) | 6 (7.1%) |
| 35 to 44 Years | 200 (93.9%) | 13 (6.1%) |
| 45 to 54 Years | 449 (100.0%) | 0 (0.0%) |
| 55 to 64 Years | 313 (100.0%) | 0 (0.0%) |
| 65 to 74 Years | 102 (100.0%) | 0 (0.0%) |
| 75 Years and older | 287 (100.0%) | 0 (0.0%) |
| Total | 2,216 (99.2%) | 19 (0.9%) |
Health Insurance Coverage by Citizenship Status in Effort
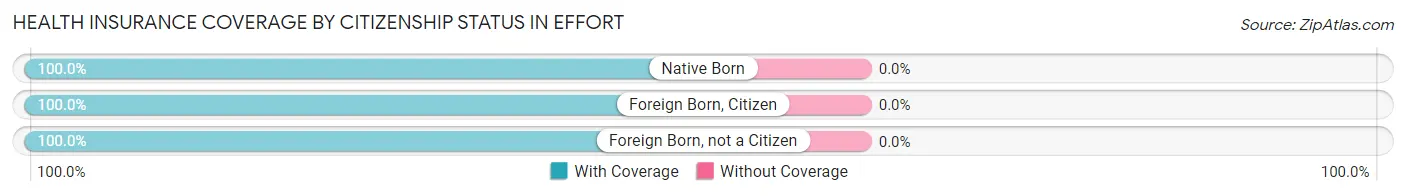
| Citizenship Status | With Coverage | Without Coverage |
| Native Born | 209 (100.0%) | 0 (0.0%) |
| Foreign Born, Citizen | 323 (100.0%) | 0 (0.0%) |
| Foreign Born, not a Citizen | 255 (100.0%) | 0 (0.0%) |
Health Insurance Coverage by Household Income in Effort
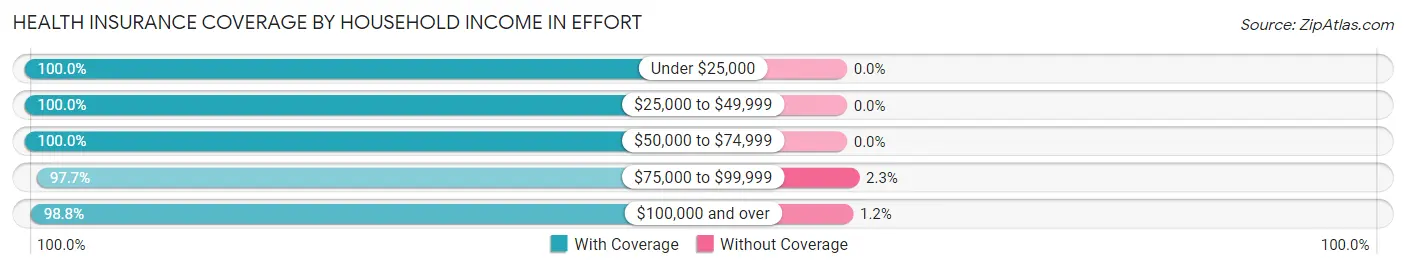
| Household Income | With Coverage | Without Coverage |
| Under $25,000 | 125 (100.0%) | 0 (0.0%) |
| $25,000 to $49,999 | 265 (100.0%) | 0 (0.0%) |
| $50,000 to $74,999 | 476 (100.0%) | 0 (0.0%) |
| $75,000 to $99,999 | 255 (97.7%) | 6 (2.3%) |
| $100,000 and over | 1,095 (98.8%) | 13 (1.2%) |
Public vs Private Health Insurance Coverage by Age in Effort
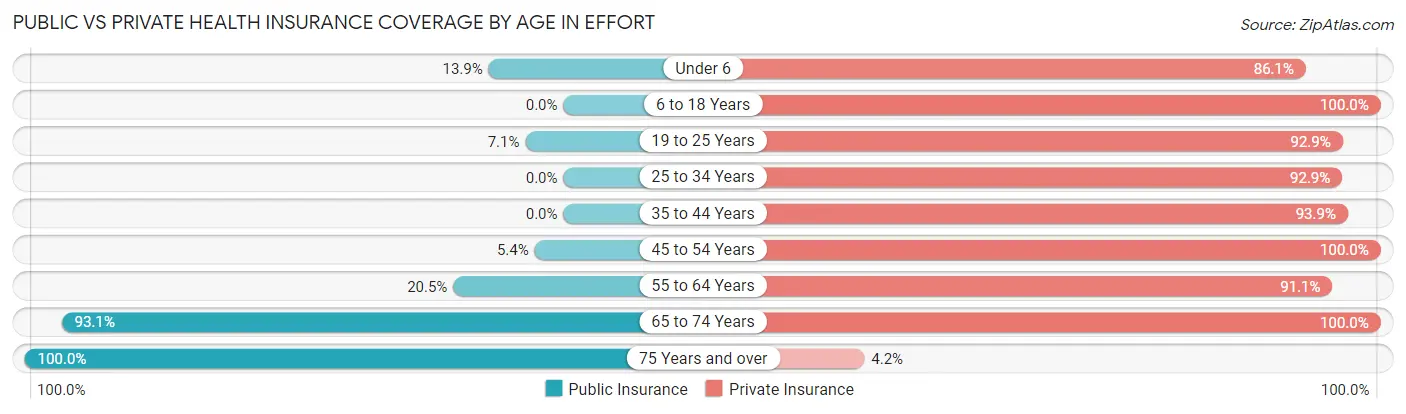
| Age Bracket | Public Insurance | Private Insurance |
| Under 6 | 29 (13.9%) | 180 (86.1%) |
| 6 to 18 Years | 0 (0.0%) | 323 (100.0%) |
| 19 to 25 Years | 18 (7.1%) | 237 (92.9%) |
| 25 to 34 Years | 0 (0.0%) | 78 (92.9%) |
| 35 to 44 Years | 0 (0.0%) | 200 (93.9%) |
| 45 to 54 Years | 24 (5.3%) | 449 (100.0%) |
| 55 to 64 Years | 64 (20.4%) | 285 (91.0%) |
| 65 to 74 Years | 95 (93.1%) | 102 (100.0%) |
| 75 Years and over | 287 (100.0%) | 12 (4.2%) |
| Total | 517 (23.1%) | 1,866 (83.5%) |
Disability Status by Sex by Age in Effort
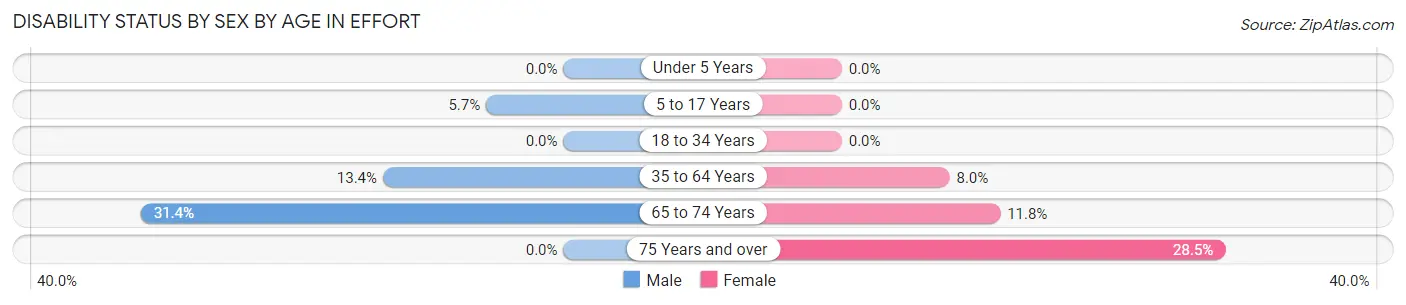
| Age Bracket | Male | Female |
| Under 5 Years | 0 (0.0%) | 0 (0.0%) |
| 5 to 17 Years | 7 (5.7%) | 0 (0.0%) |
| 18 to 34 Years | 0 (0.0%) | 0 (0.0%) |
| 35 to 64 Years | 67 (13.4%) | 38 (8.0%) |
| 65 to 74 Years | 16 (31.4%) | 6 (11.8%) |
| 75 Years and over | 0 (0.0%) | 35 (28.5%) |
Disability Class by Sex by Age in Effort
Disability Class: Hearing Difficulty
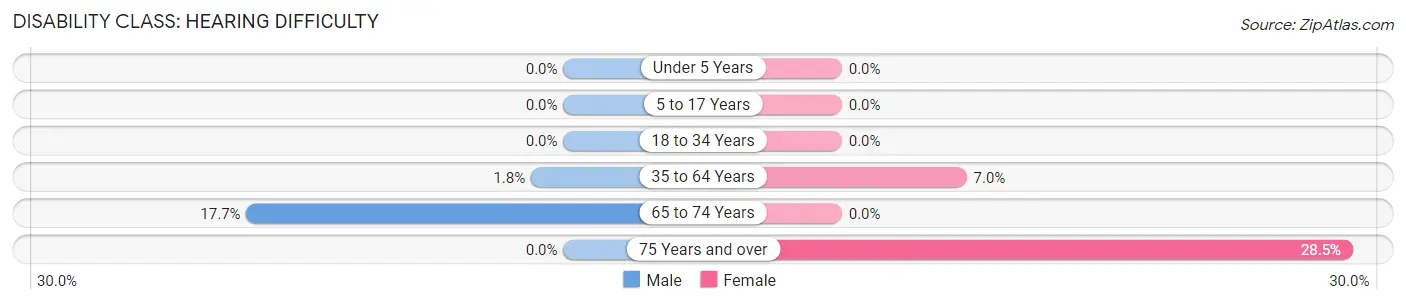
| Age Bracket | Male | Female |
| Under 5 Years | 0 (0.0%) | 0 (0.0%) |
| 5 to 17 Years | 0 (0.0%) | 0 (0.0%) |
| 18 to 34 Years | 0 (0.0%) | 0 (0.0%) |
| 35 to 64 Years | 9 (1.8%) | 33 (7.0%) |
| 65 to 74 Years | 9 (17.6%) | 0 (0.0%) |
| 75 Years and over | 0 (0.0%) | 35 (28.5%) |
Disability Class: Vision Difficulty
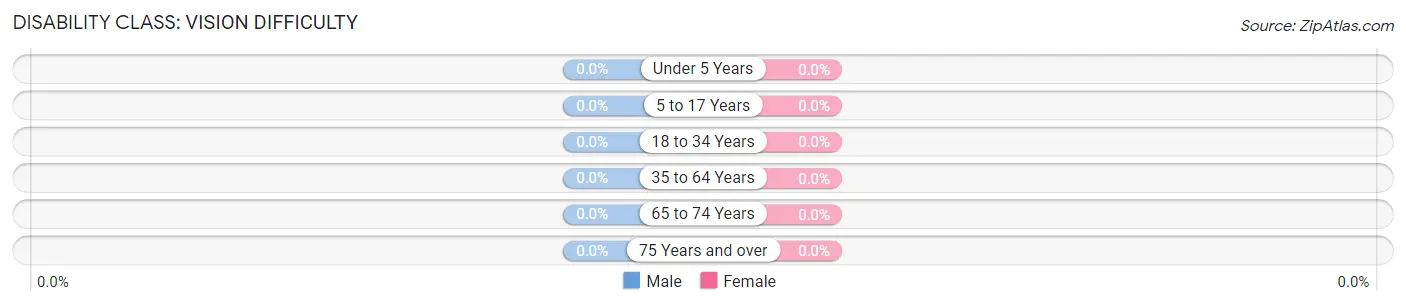
| Age Bracket | Male | Female |
| Under 5 Years | 0 (0.0%) | 0 (0.0%) |
| 5 to 17 Years | 0 (0.0%) | 0 (0.0%) |
| 18 to 34 Years | 0 (0.0%) | 0 (0.0%) |
| 35 to 64 Years | 0 (0.0%) | 0 (0.0%) |
| 65 to 74 Years | 0 (0.0%) | 0 (0.0%) |
| 75 Years and over | 0 (0.0%) | 0 (0.0%) |
Disability Class: Cognitive Difficulty
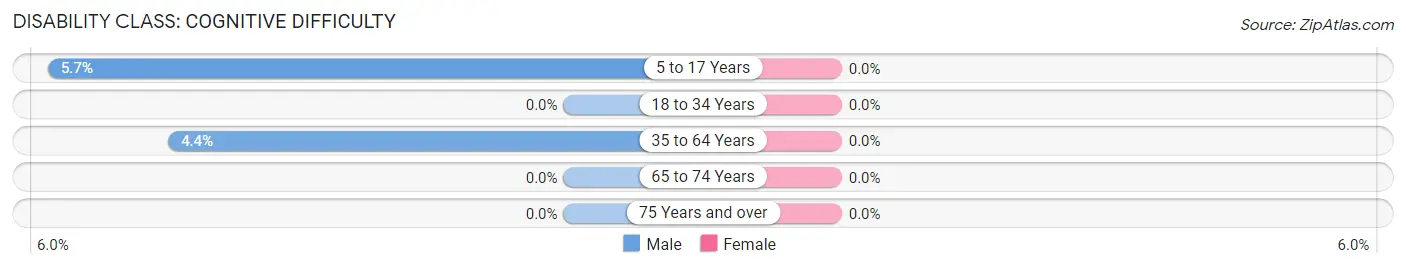
| Age Bracket | Male | Female |
| 5 to 17 Years | 7 (5.7%) | 0 (0.0%) |
| 18 to 34 Years | 0 (0.0%) | 0 (0.0%) |
| 35 to 64 Years | 22 (4.4%) | 0 (0.0%) |
| 65 to 74 Years | 0 (0.0%) | 0 (0.0%) |
| 75 Years and over | 0 (0.0%) | 0 (0.0%) |
Disability Class: Ambulatory Difficulty
| Age Bracket | Male | Female |
| 5 to 17 Years | 0 (0.0%) | 0 (0.0%) |
| 18 to 34 Years | 0 (0.0%) | 0 (0.0%) |
| 35 to 64 Years | 36 (7.2%) | 0 (0.0%) |
| 65 to 74 Years | 7 (13.7%) | 6 (11.8%) |
| 75 Years and over | 0 (0.0%) | 0 (0.0%) |
Disability Class: Self-Care Difficulty
| Age Bracket | Male | Female |
| 5 to 17 Years | 0 (0.0%) | 0 (0.0%) |
| 18 to 34 Years | 0 (0.0%) | 0 (0.0%) |
| 35 to 64 Years | 0 (0.0%) | 0 (0.0%) |
| 65 to 74 Years | 7 (13.7%) | 6 (11.8%) |
| 75 Years and over | 0 (0.0%) | 0 (0.0%) |
Technology Access in Effort
Computing Device Access in Effort
| Device Type | # Households | % Households |
| Desktop or Laptop | 629 | 75.0% |
| Smartphone | 696 | 83.0% |
| Tablet | 533 | 63.5% |
| No Computing Device | 85 | 10.1% |
| Total | 839 | 100.0% |
Internet Access in Effort
| Internet Type | # Households | % Households |
| Dial-Up Internet | 0 | 0.0% |
| Broadband Home | 707 | 84.3% |
| Cellular Data Only | 26 | 3.1% |
| Satellite Internet | 51 | 6.1% |
| No Internet | 94 | 11.2% |
| Total | 839 | 100.0% |
Effort Summary
Pennsylvania, located in the Northeastern United States, is the 33rd most populous state in the country and the 6th most populous state in the Northeast. It is bordered by New York, New Jersey, Delaware, Maryland, West Virginia, and Ohio. Pennsylvania is known for its rich history, diverse geography, and vibrant economy.
History
Pennsylvania was founded in 1681 by William Penn, a Quaker, who was granted a charter by King Charles II of England. Penn named the colony after his father, Admiral William Penn. The colony was initially populated by Quakers, who were seeking religious freedom. Pennsylvania was one of the original 13 colonies that formed the United States of America. During the Revolutionary War, Pennsylvania was a major battleground, and the state was the site of the Battle of Gettysburg, one of the most important battles of the war.
Geography
Pennsylvania is divided into two distinct regions: the Appalachian Mountains in the east and the Allegheny Plateau in the west. The Appalachian Mountains are home to the state’s highest peak, Mount Davis, which stands at 3,213 feet. The Allegheny Plateau is home to the Allegheny National Forest, which is the largest national forest in the state. Pennsylvania is also home to numerous rivers, including the Susquehanna, Delaware, and Allegheny.
Economy
Pennsylvania’s economy is largely based on manufacturing, agriculture, and services. The state is home to numerous large companies, including Hershey, PPG Industries, and GlaxoSmithKline. Pennsylvania is also home to several major universities, including the University of Pennsylvania, Carnegie Mellon University, and the University of Pittsburgh.
Demographics
As of 2020, Pennsylvania had an estimated population of 12.8 million people. The state is home to a diverse population, with the largest ethnic groups being White (78.2%), Black or African American (11.2%), and Hispanic or Latino (7.2%). The median household income in Pennsylvania is $60,872, and the median age is 40.7 years.
Pennsylvania is a diverse and vibrant state with a rich history, diverse geography, and vibrant economy. It is home to numerous large companies, universities, and national forests, and its population is diverse and growing. Pennsylvania is an important part of the United States and is sure to remain a major player in the country’s economy and culture for years to come.
Common Questions
What is Per Capita Income in Effort?
Per Capita income in Effort is $41,939.
What is the Median Family Income in Effort?
Median Family Income in Effort is $110,417.
What is the Median Household income in Effort?
Median Household Income in Effort is $91,161.
What is Income or Wage Gap in Effort?
Income or Wage Gap in Effort is 55.8%.
Women in Effort earn 44.2 cents for every dollar earned by a man.
What is Inequality or Gini Index in Effort?
Inequality or Gini Index in Effort is 0.35.
What is the Total Population of Effort?
Total Population of Effort is 2,235.
What is the Total Male Population of Effort?
Total Male Population of Effort is 1,168.
What is the Total Female Population of Effort?
Total Female Population of Effort is 1,067.
What is the Ratio of Males per 100 Females in Effort?
There are 109.47 Males per 100 Females in Effort.
What is the Ratio of Females per 100 Males in Effort?
There are 91.35 Females per 100 Males in Effort.
What is the Median Population Age in Effort?
Median Population Age in Effort is 45.4 Years.
What is the Average Family Size in Effort
Average Family Size in Effort is 3.2 People.
What is the Average Household Size in Effort
Average Household Size in Effort is 2.7 People.
How Large is the Labor Force in Effort?
There are 1,047 People in the Labor Forcein in Effort.
What is the Percentage of People in the Labor Force in Effort?
57.3% of People are in the Labor Force in Effort.
What is the Unemployment Rate in Effort?
Unemployment Rate in Effort is 1.7%.