Zip Codes with the Highest Percentage of Hispanic or Latino Population in Erie, PA

RELATED REPORTS & OPTIONS

Hispanic or Latino
Population
Families and Households
Female Fertility
Female Fertility (Unmarried)
Race (Community Size)
Race (Percentage)
Ancestry (Community Size)
AfricanAlbanianAmericanArabArmenianAustralianAustrianBasqueBelgianBhutaneseBlackfeetBrazilianBritishBurmeseCambodianCanadianCelticCentral AmericanCentral American IndianCherokeeChickasawChoctawColombianCosta RicanCroatianCubanCzechCzechoslovakianDanishDominicanDutchEastern EuropeanEcuadorianEgyptianEnglishEthiopianEuropeanFilipinoFinnishFrenchFrench CanadianGermanGreekGuatemalanGuyaneseHaitianHonduranHungarianIcelanderIndian (Asian)IranianIraqiIrishIroquoisItalianJamaicanKenyanKoreanLebaneseLithuanianMacedonianMexicanMongolianMoroccanNavajoNigerianNorthern EuropeanNorwegianPakistaniPalestinianPennsylvania GermanPeruvianPolishPortuguesePuerto RicanRomanianRussianSamoanScandinavianScotch-IrishScottishSenegaleseSerbianSiouxSlavicSlovakSloveneSomaliSouth AfricanSouth AmericanSouth American IndianSpaniardSpanishSri LankanSubsaharan AfricanSudaneseSwedishSwissSyrianThaiTlingit-HaidaTurkishUgandanUkrainianVenezuelanVietnameseWelshWest IndianYugoslavian
Ancestry (Percentage)
AfricanAlbanianAmericanArabArmenianAustralianAustrianBasqueBelgianBhutaneseBlackfeetBrazilianBritishBurmeseCambodianCanadianCelticCentral AmericanCentral American IndianCherokeeChickasawChoctawColombianCosta RicanCroatianCubanCzechCzechoslovakianDanishDominicanDutchEastern EuropeanEcuadorianEgyptianEnglishEthiopianEuropeanFilipinoFinnishFrenchFrench CanadianGermanGreekGuatemalanGuyaneseHaitianHonduranHungarianIcelanderIndian (Asian)IranianIraqiIrishIroquoisItalianJamaicanKenyanKoreanLebaneseLithuanianMacedonianMexicanMongolianMoroccanNavajoNigerianNorthern EuropeanNorwegianPakistaniPalestinianPennsylvania GermanPeruvianPolishPortuguesePuerto RicanRomanianRussianSamoanScandinavianScotch-IrishScottishSenegaleseSerbianSiouxSlavicSlovakSloveneSomaliSouth AfricanSouth AmericanSouth American IndianSpaniardSpanishSri LankanSubsaharan AfricanSudaneseSwedishSwissSyrianThaiTlingit-HaidaTurkishUgandanUkrainianVenezuelanVietnameseWelshWest IndianYugoslavian
Immigrant Origin (Total)
Immigrant Origin (Percentage)
Income
Income (Families)
Income (Households)
Poverty
Poverty (Families)
Unemployment
Employment Occupations
Employment Industries
Employer Class
Commute Time
Commute Means
School Enrollment
Education by Degree Field
Occupancy
Finances
Physical Characteristics
Erie
Compare Zip Codes
Comparison Subject

Map of Zip Codes with the Highest Percentage of Hispanic or Latino Population in Erie

1.2%
12.9%
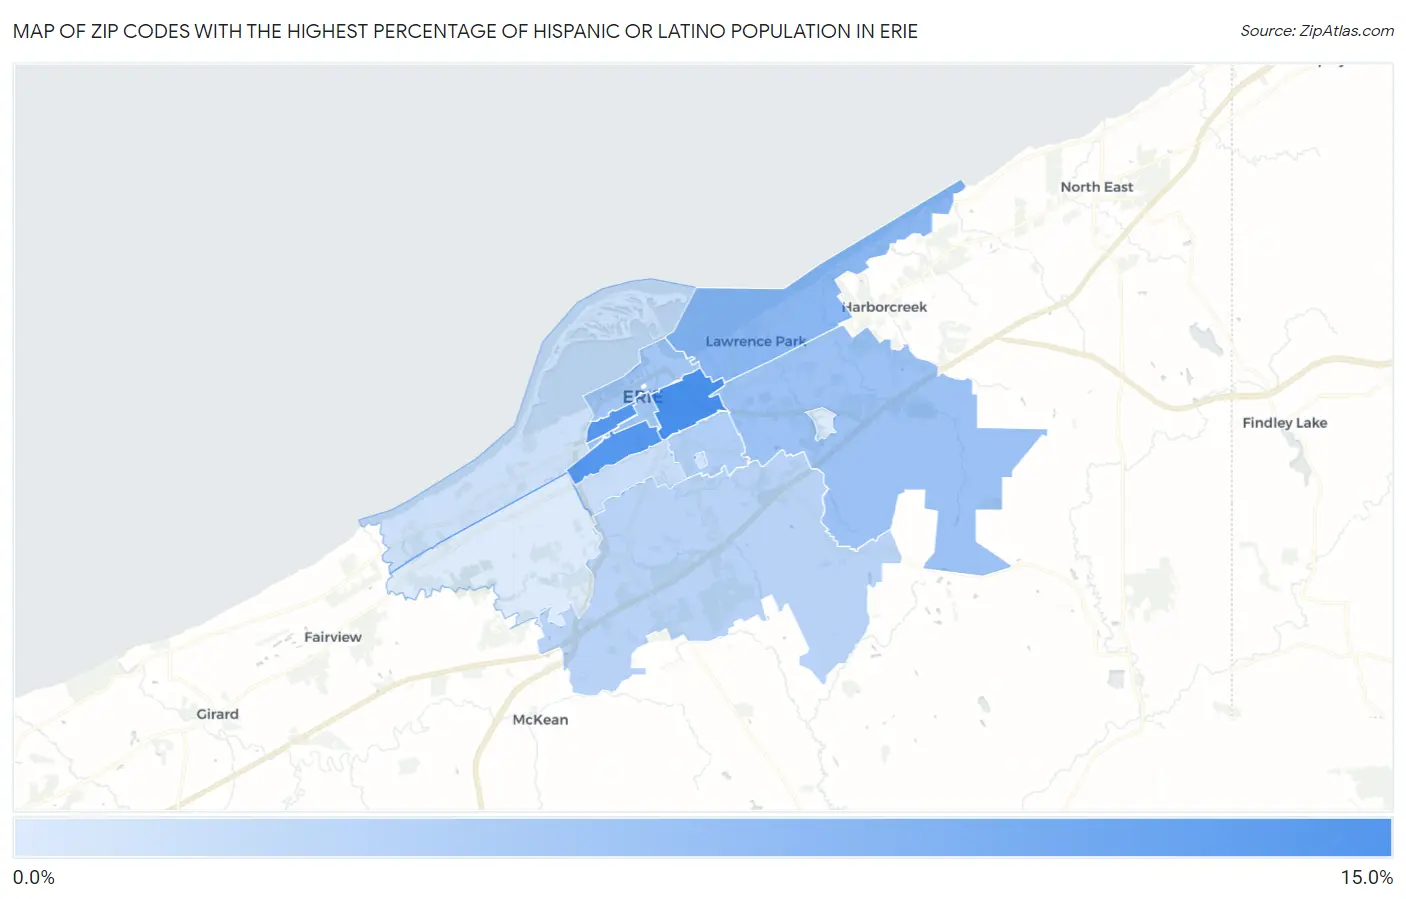
Zip Codes with the Highest Percentage of Hispanic or Latino Population in Erie Map

Zip Codes with the Highest Percentage of Hispanic or Latino Population in Erie, PA

Zip Code Hispanic or Latino vs State vs National
1. 16503 12.9% 8.1% (+4.79)#129 18.7% (-5.74)#7,298
2. 16502 11.8% 8.1% (+3.67)#138 18.7% (-6.86)#7,857
3. 16511 7.6% 8.1% (-0.542)#245 18.7% (-11.1)#10,979
4. 16510 6.2% 8.1% (-1.95)#310 18.7% (-12.5)#12,571
5. 16501 5.8% 8.1% (-2.31)#323 18.7% (-12.8)#13,070
6. 16507 5.6% 8.1% (-2.53)#338 18.7% (-13.1)#13,363
7. 16504 4.5% 8.1% (-3.61)#420 18.7% (-14.1)#15,129
8. 16509 3.9% 8.1% (-4.23)#482 18.7% (-14.8)#16,350
9. 16508 2.8% 8.1% (-5.36)#631 18.7% (-15.9)#18,984
10. 16505 2.4% 8.1% (-5.73)#696 18.7% (-16.3)#19,951
11. 16546 2.1% 8.1% (-6.07)#772 18.7% (-16.6)#20,882
12. 16563 1.2% 8.1% (-6.89)#971 18.7% (-17.4)#23,364
13. 16506 1.2% 8.1% (-6.92)#980 18.7% (-17.4)#23,453

Common Questions

What are the Top 10 Zip Codes with the Highest Percentage of Hispanic or Latino Population in Erie, PA?
Top 10 Zip Codes with the Highest Percentage of Hispanic or Latino Population in Erie, PA are:
#1
12.9%
#2
11.8%
#3
7.6%
#4
6.2%
#5
5.8%
#6
5.6%
#7
4.5%
#8
3.9%
#9
2.8%
#10
2.4%
What zip code has the Highest Percentage of Hispanic or Latino Population in Erie, PA?
16503 has the Highest Percentage of Hispanic or Latino Population in Erie, PA with 12.9%.
What is the Percentage of Hispanic or Latino Population in Erie, PA?
Percentage of Hispanic or Latino Population in Erie is 8.3%.
What is the Percentage of Hispanic or Latino Population in Pennsylvania?
Percentage of Hispanic or Latino Population in Pennsylvania is 8.1%.
What is the Percentage of Hispanic or Latino Population in the United States?
Percentage of Hispanic or Latino Population in the United States is 18.7%.