Hazleton, PA Map & Demographics
Hazleton Map
Hazleton Overview
$21,876
PER CAPITA INCOME
$49,164
AVG FAMILY INCOME
$39,362
AVG HOUSEHOLD INCOME
36.3%
WAGE / INCOME GAP [ % ]
63.7¢/ $1
WAGE / INCOME GAP [ $ ]
$10,296
FAMILY INCOME DEFICIT
0.46
INEQUALITY / GINI INDEX
29,671
TOTAL POPULATION
15,162
MALE POPULATION
14,509
FEMALE POPULATION
104.50
MALES / 100 FEMALES
95.69
FEMALES / 100 MALES
37.1
MEDIAN AGE
3.2
AVG FAMILY SIZE
2.6
AVG HOUSEHOLD SIZE
14,487
LABOR FORCE [ PEOPLE ]
61.8%
PERCENT IN LABOR FORCE
6.9%
UNEMPLOYMENT RATE
Hazleton Area Codes
Income in Hazleton
Income Overview in Hazleton
Per Capita Income in Hazleton is $21,876, while median incomes of families and households are $49,164 and $39,362 respectively.
| Characteristic | Number | Measure |
| Per Capita Income | 29,671 | $21,876 |
| Median Family Income | 6,815 | $49,164 |
| Mean Family Income | 6,815 | $62,169 |
| Median Household Income | 11,333 | $39,362 |
| Mean Household Income | 11,333 | $54,752 |
| Income Deficit | 6,815 | $10,296 |
| Wage / Income Gap (%) | 29,671 | 36.26% |
| Wage / Income Gap ($) | 29,671 | 63.74¢ per $1 |
| Gini / Inequality Index | 29,671 | 0.46 |
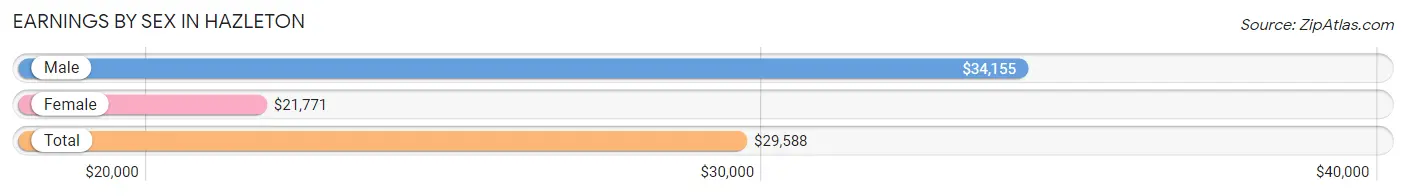
Earnings by Sex in Hazleton
Average Earnings in Hazleton are $29,588, $34,155 for men and $21,771 for women, a difference of 36.3%.
| Sex | Number | Average Earnings |
| Male | 8,132 (53.8%) | $34,155 |
| Female | 6,980 (46.2%) | $21,771 |
| Total | 15,112 (100.0%) | $29,588 |
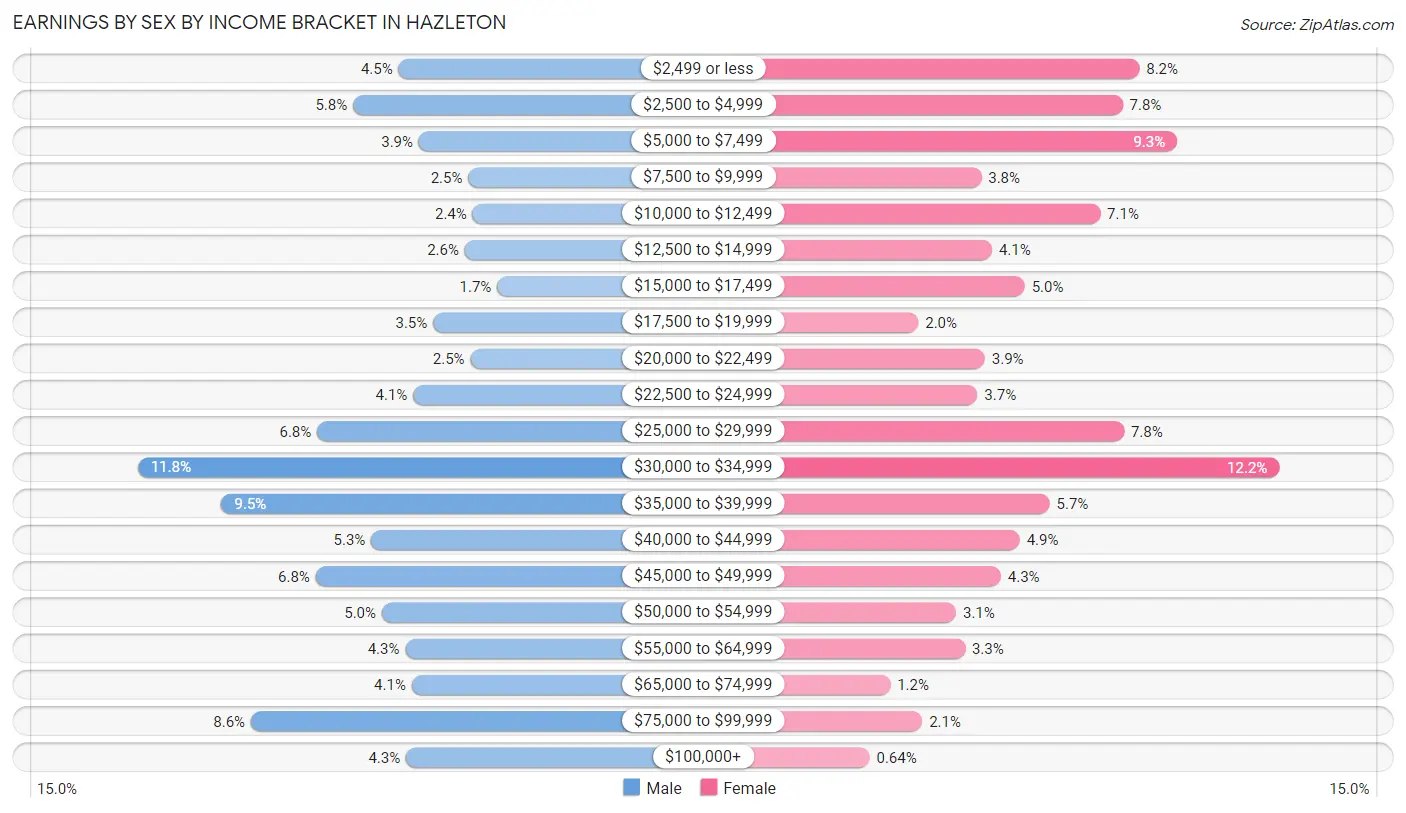
Earnings by Sex by Income Bracket in Hazleton
The most common earnings brackets in Hazleton are $30,000 to $34,999 for men (961 | 11.8%) and $30,000 to $34,999 for women (848 | 12.1%).
| Income | Male | Female |
| $2,499 or less | 365 (4.5%) | 574 (8.2%) |
| $2,500 to $4,999 | 469 (5.8%) | 541 (7.7%) |
| $5,000 to $7,499 | 319 (3.9%) | 648 (9.3%) |
| $7,500 to $9,999 | 206 (2.5%) | 264 (3.8%) |
| $10,000 to $12,499 | 196 (2.4%) | 497 (7.1%) |
| $12,500 to $14,999 | 214 (2.6%) | 285 (4.1%) |
| $15,000 to $17,499 | 140 (1.7%) | 349 (5.0%) |
| $17,500 to $19,999 | 286 (3.5%) | 140 (2.0%) |
| $20,000 to $22,499 | 201 (2.5%) | 271 (3.9%) |
| $22,500 to $24,999 | 332 (4.1%) | 256 (3.7%) |
| $25,000 to $29,999 | 551 (6.8%) | 544 (7.8%) |
| $30,000 to $34,999 | 961 (11.8%) | 848 (12.1%) |
| $35,000 to $39,999 | 770 (9.5%) | 398 (5.7%) |
| $40,000 to $44,999 | 428 (5.3%) | 339 (4.9%) |
| $45,000 to $49,999 | 555 (6.8%) | 302 (4.3%) |
| $50,000 to $54,999 | 403 (5.0%) | 214 (3.1%) |
| $55,000 to $64,999 | 350 (4.3%) | 232 (3.3%) |
| $65,000 to $74,999 | 335 (4.1%) | 85 (1.2%) |
| $75,000 to $99,999 | 703 (8.6%) | 148 (2.1%) |
| $100,000+ | 348 (4.3%) | 45 (0.6%) |
| Total | 8,132 (100.0%) | 6,980 (100.0%) |
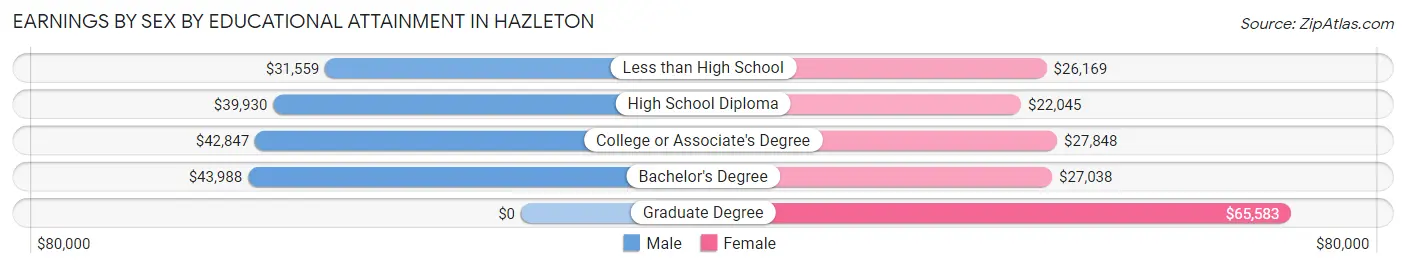
Earnings by Sex by Educational Attainment in Hazleton
Average earnings in Hazleton are $38,232 for men and $26,153 for women, a difference of 31.6%. Men with an educational attainment of bachelor's degree enjoy the highest average annual earnings of $43,988, while those with less than high school education earn the least with $31,559. Women with an educational attainment of graduate degree earn the most with the average annual earnings of $65,583, while those with high school diploma education have the smallest earnings of $22,045.
| Educational Attainment | Male Income | Female Income |
| Less than High School | $31,559 | $26,169 |
| High School Diploma | $39,930 | $22,045 |
| College or Associate's Degree | $42,847 | $27,848 |
| Bachelor's Degree | $43,988 | $27,038 |
| Graduate Degree | - | - |
| Total | $38,232 | $26,153 |
Family Income in Hazleton
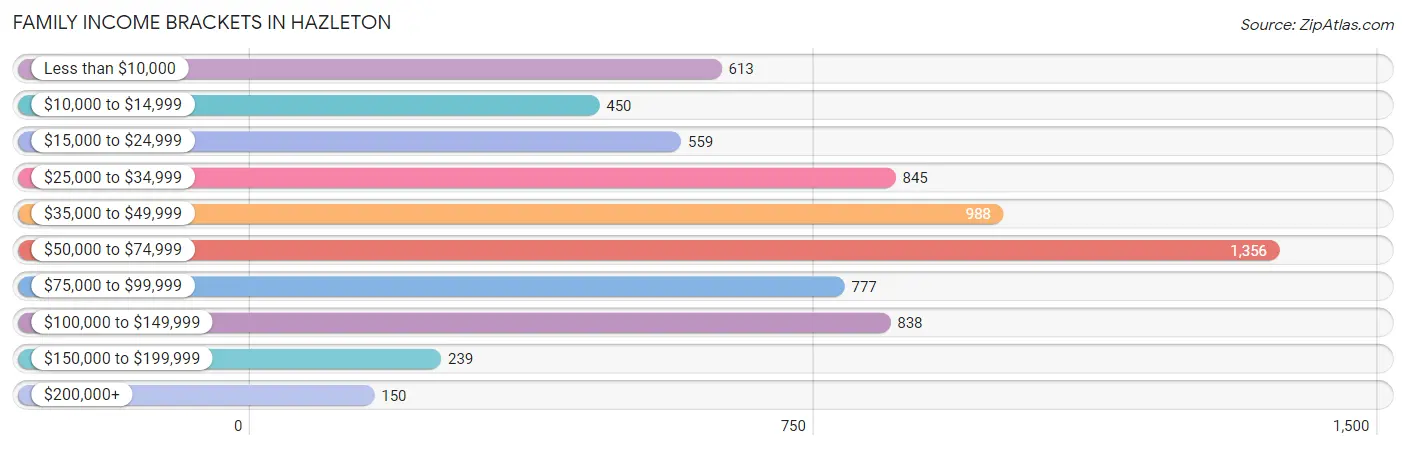
Family Income Brackets in Hazleton
According to the Hazleton family income data, there are 1,356 families falling into the $50,000 to $74,999 income range, which is the most common income bracket and makes up 19.9% of all families. Conversely, the $200,000+ income bracket is the least frequent group with only 150 families (2.2%) belonging to this category.
| Income Bracket | # Families | % Families |
| Less than $10,000 | 613 | 9.0% |
| $10,000 to $14,999 | 450 | 6.6% |
| $15,000 to $24,999 | 559 | 8.2% |
| $25,000 to $34,999 | 845 | 12.4% |
| $35,000 to $49,999 | 988 | 14.5% |
| $50,000 to $74,999 | 1,356 | 19.9% |
| $75,000 to $99,999 | 777 | 11.4% |
| $100,000 to $149,999 | 838 | 12.3% |
| $150,000 to $199,999 | 239 | 3.5% |
| $200,000+ | 150 | 2.2% |
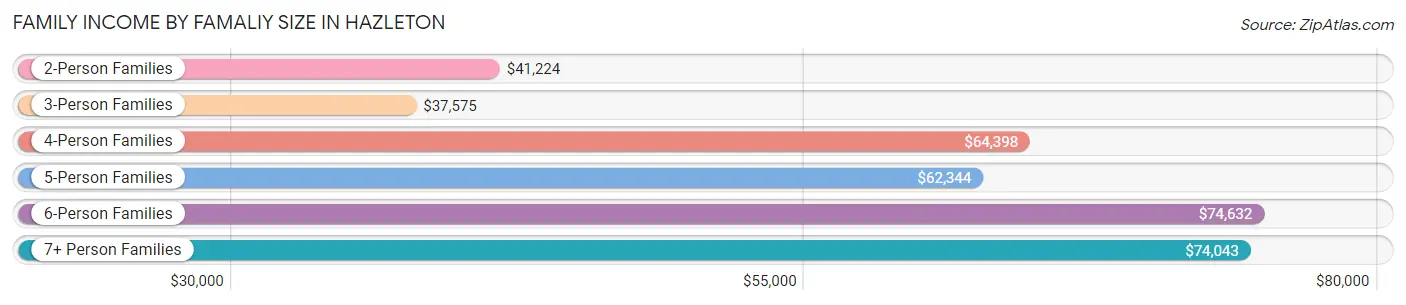
Family Income by Famaliy Size in Hazleton
6-person families (355 | 5.2%) account for the highest median family income in Hazleton with $74,632 per family, while 2-person families (2,985 | 43.8%) have the highest median income of $20,612 per family member.
| Income Bracket | # Families | Median Income |
| 2-Person Families | 2,985 (43.8%) | $41,224 |
| 3-Person Families | 1,775 (26.1%) | $37,575 |
| 4-Person Families | 839 (12.3%) | $64,398 |
| 5-Person Families | 643 (9.4%) | $62,344 |
| 6-Person Families | 355 (5.2%) | $74,632 |
| 7+ Person Families | 218 (3.2%) | $74,043 |
| Total | 6,815 (100.0%) | $49,164 |
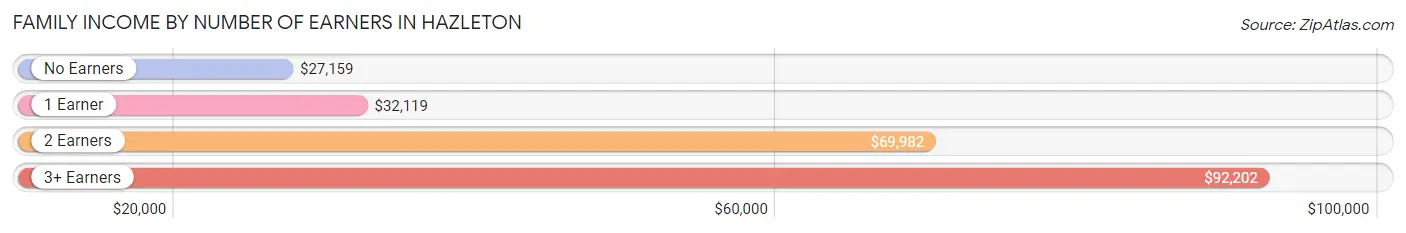
Family Income by Number of Earners in Hazleton
The median family income in Hazleton is $49,164, with families comprising 3+ earners (1,211) having the highest median family income of $92,202, while families with no earners (1,097) have the lowest median family income of $27,159, accounting for 17.8% and 16.1% of families, respectively.
| Number of Earners | # Families | Median Income |
| No Earners | 1,097 (16.1%) | $27,159 |
| 1 Earner | 2,663 (39.1%) | $32,119 |
| 2 Earners | 1,844 (27.1%) | $69,982 |
| 3+ Earners | 1,211 (17.8%) | $92,202 |
| Total | 6,815 (100.0%) | $49,164 |
Household Income in Hazleton
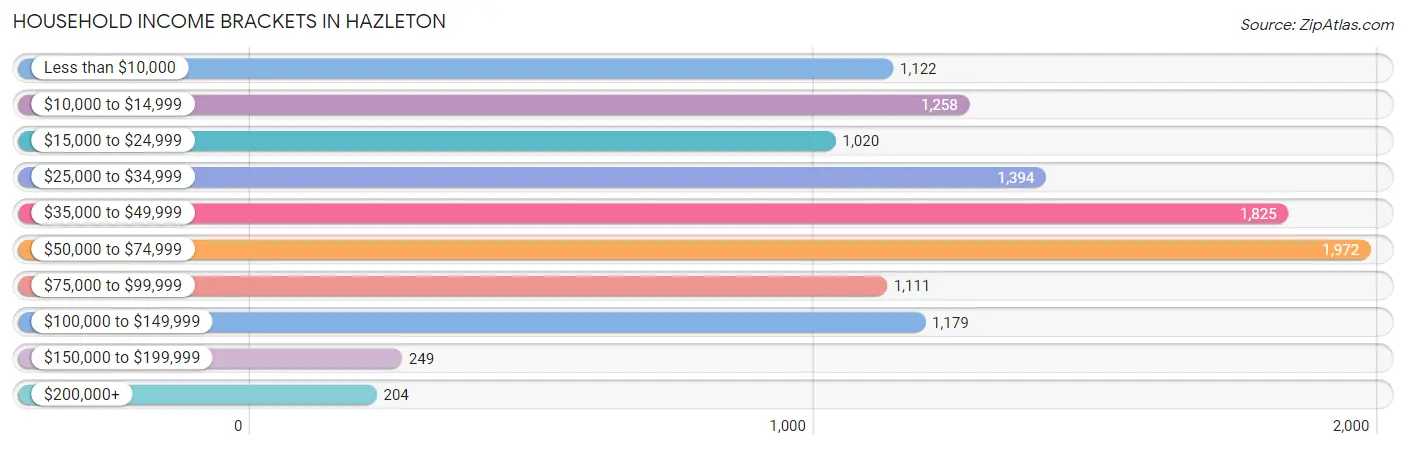
Household Income Brackets in Hazleton
With 1,972 households falling in the category, the $50,000 to $74,999 income range is the most frequent in Hazleton, accounting for 17.4% of all households. In contrast, only 204 households (1.8%) fall into the $200,000+ income bracket, making it the least populous group.
| Income Bracket | # Households | % Households |
| Less than $10,000 | 1,122 | 9.9% |
| $10,000 to $14,999 | 1,258 | 11.1% |
| $15,000 to $24,999 | 1,020 | 9.0% |
| $25,000 to $34,999 | 1,394 | 12.3% |
| $35,000 to $49,999 | 1,825 | 16.1% |
| $50,000 to $74,999 | 1,972 | 17.4% |
| $75,000 to $99,999 | 1,111 | 9.8% |
| $100,000 to $149,999 | 1,179 | 10.4% |
| $150,000 to $199,999 | 249 | 2.2% |
| $200,000+ | 204 | 1.8% |
Household Income by Householder Age in Hazleton
The median household income in Hazleton is $39,362, with the highest median household income of $52,083 found in the 25 to 44 years age bracket for the primary householder. A total of 3,422 households (30.2%) fall into this category. Meanwhile, the 15 to 24 years age bracket for the primary householder has the lowest median household income of $31,250, with 519 households (4.6%) in this group.
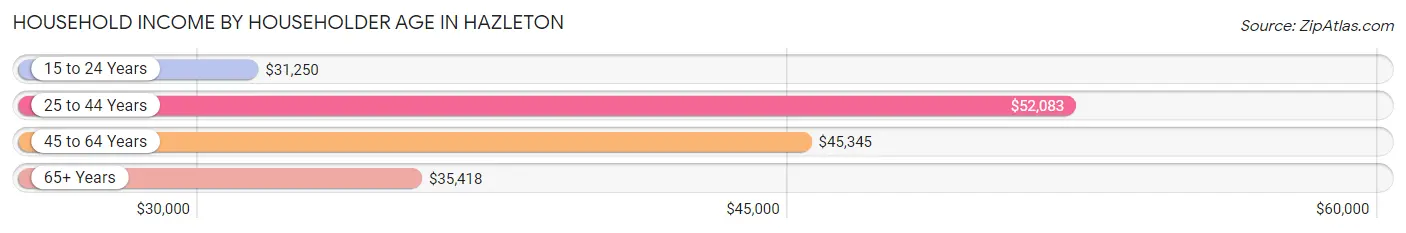
| Income Bracket | # Households | Median Income |
| 15 to 24 Years | 519 (4.6%) | $31,250 |
| 25 to 44 Years | 3,422 (30.2%) | $52,083 |
| 45 to 64 Years | 4,280 (37.8%) | $45,345 |
| 65+ Years | 3,112 (27.5%) | $35,418 |
| Total | 11,333 (100.0%) | $39,362 |
Poverty in Hazleton
Income Below Poverty by Sex and Age in Hazleton
With 22.9% poverty level for males and 28.6% for females among the residents of Hazleton, 15 year old males and 16 and 17 year old females are the most vulnerable to poverty, with 65 males (51.2%) and 209 females (51.3%) in their respective age groups living below the poverty level.
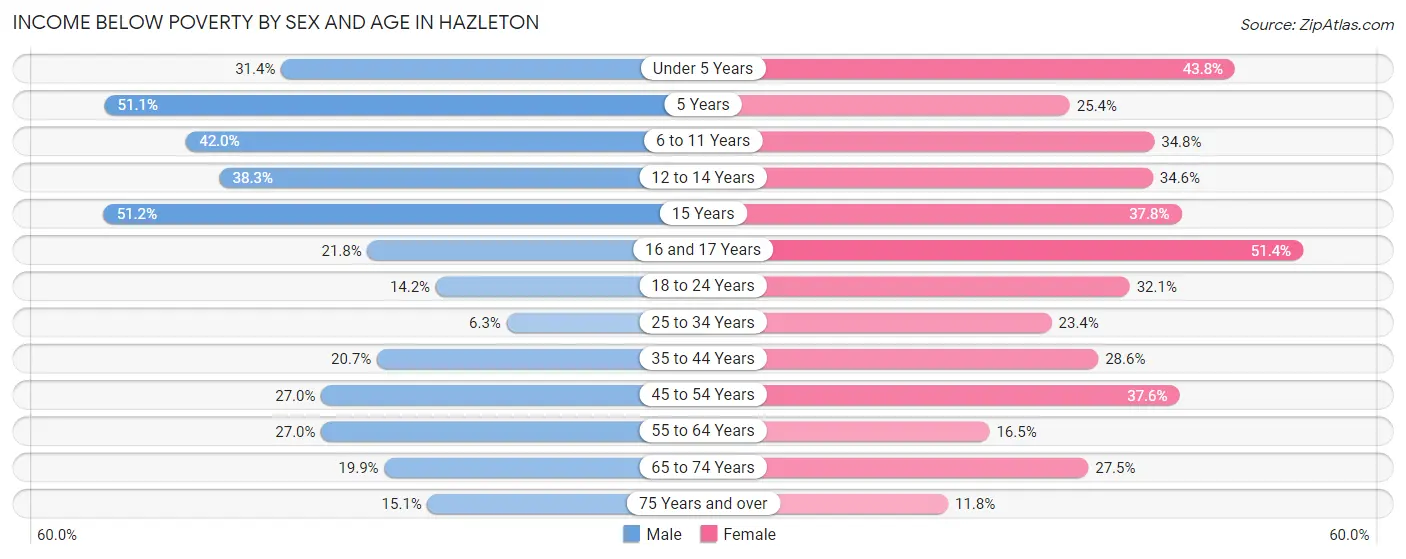
| Age Bracket | Male | Female |
| Under 5 Years | 317 (31.4%) | 359 (43.8%) |
| 5 Years | 118 (51.1%) | 48 (25.4%) |
| 6 to 11 Years | 451 (42.0%) | 364 (34.8%) |
| 12 to 14 Years | 232 (38.3%) | 141 (34.6%) |
| 15 Years | 65 (51.2%) | 79 (37.8%) |
| 16 and 17 Years | 130 (21.8%) | 209 (51.3%) |
| 18 to 24 Years | 269 (14.2%) | 465 (32.1%) |
| 25 to 34 Years | 115 (6.3%) | 390 (23.4%) |
| 35 to 44 Years | 419 (20.7%) | 471 (28.6%) |
| 45 to 54 Years | 495 (27.0%) | 728 (37.6%) |
| 55 to 64 Years | 474 (27.0%) | 285 (16.5%) |
| 65 to 74 Years | 176 (19.9%) | 311 (27.5%) |
| 75 Years and over | 160 (15.1%) | 160 (11.8%) |
| Total | 3,421 (22.9%) | 4,010 (28.6%) |
Income Above Poverty by Sex and Age in Hazleton
According to the poverty statistics in Hazleton, males aged 25 to 34 years and females aged 75 years and over are the age groups that are most secure financially, with 93.7% of males and 88.2% of females in these age groups living above the poverty line.
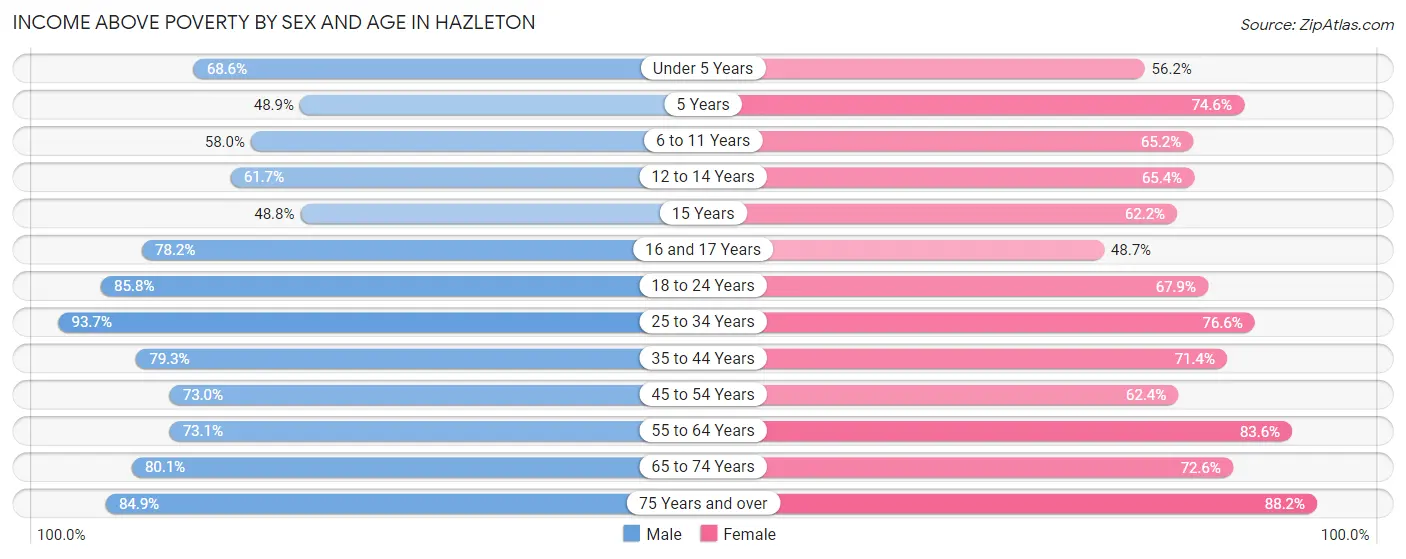
| Age Bracket | Male | Female |
| Under 5 Years | 692 (68.6%) | 461 (56.2%) |
| 5 Years | 113 (48.9%) | 141 (74.6%) |
| 6 to 11 Years | 623 (58.0%) | 682 (65.2%) |
| 12 to 14 Years | 374 (61.7%) | 266 (65.4%) |
| 15 Years | 62 (48.8%) | 130 (62.2%) |
| 16 and 17 Years | 466 (78.2%) | 198 (48.6%) |
| 18 to 24 Years | 1,627 (85.8%) | 985 (67.9%) |
| 25 to 34 Years | 1,708 (93.7%) | 1,279 (76.6%) |
| 35 to 44 Years | 1,601 (79.3%) | 1,178 (71.4%) |
| 45 to 54 Years | 1,341 (73.0%) | 1,209 (62.4%) |
| 55 to 64 Years | 1,285 (73.1%) | 1,447 (83.6%) |
| 65 to 74 Years | 707 (80.1%) | 822 (72.6%) |
| 75 Years and over | 899 (84.9%) | 1,192 (88.2%) |
| Total | 11,498 (77.1%) | 9,990 (71.4%) |
Income Below Poverty Among Married-Couple Families in Hazleton
The poverty statistics for married-couple families in Hazleton show that 11.1% or 411 of the total 3,702 families live below the poverty line. Families with no children have the highest poverty rate of 12.2%, comprising of 276 families. On the other hand, families with 5 or more children have the lowest poverty rate of 0.0%, which includes 0 families.
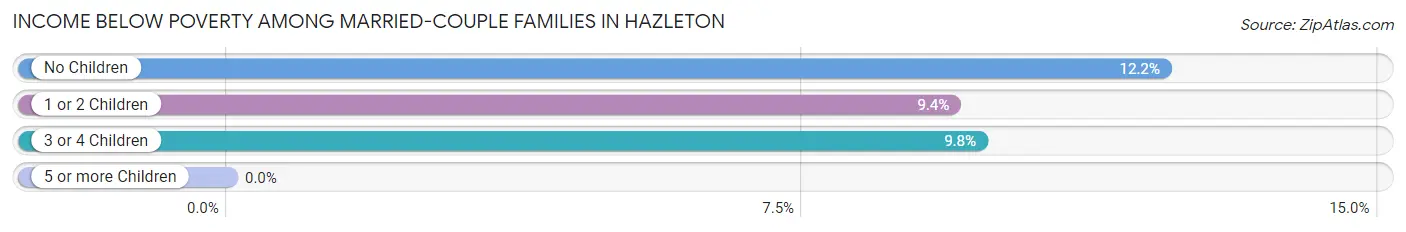
| Children | Above Poverty | Below Poverty |
| No Children | 1,988 (87.8%) | 276 (12.2%) |
| 1 or 2 Children | 978 (90.6%) | 102 (9.4%) |
| 3 or 4 Children | 304 (90.2%) | 33 (9.8%) |
| 5 or more Children | 21 (100.0%) | 0 (0.0%) |
| Total | 3,291 (88.9%) | 411 (11.1%) |
Income Below Poverty Among Single-Parent Households in Hazleton
According to the poverty data in Hazleton, 32.2% or 339 single-father households and 43.6% or 897 single-mother households are living below the poverty line. Among single-father households, those with 1 or 2 children have the highest poverty rate, with 215 households (43.8%) experiencing poverty. Likewise, among single-mother households, those with 5 or more children have the highest poverty rate, with 92 households (100.0%) falling below the poverty line.
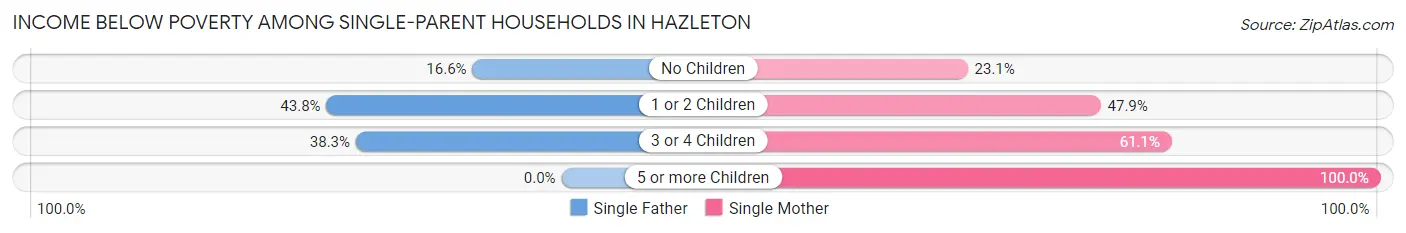
| Children | Single Father | Single Mother |
| No Children | 70 (16.6%) | 147 (23.1%) |
| 1 or 2 Children | 215 (43.8%) | 559 (47.9%) |
| 3 or 4 Children | 54 (38.3%) | 99 (61.1%) |
| 5 or more Children | 0 (0.0%) | 92 (100.0%) |
| Total | 339 (32.2%) | 897 (43.6%) |
Income Below Poverty Among Married-Couple vs Single-Parent Households in Hazleton
The poverty data for Hazleton shows that 411 of the married-couple family households (11.1%) and 1,236 of the single-parent households (39.7%) are living below the poverty level. Within the married-couple family households, those with no children have the highest poverty rate, with 276 households (12.2%) falling below the poverty line. Among the single-parent households, those with 5 or more children have the highest poverty rate, with 92 household (100.0%) living below poverty.
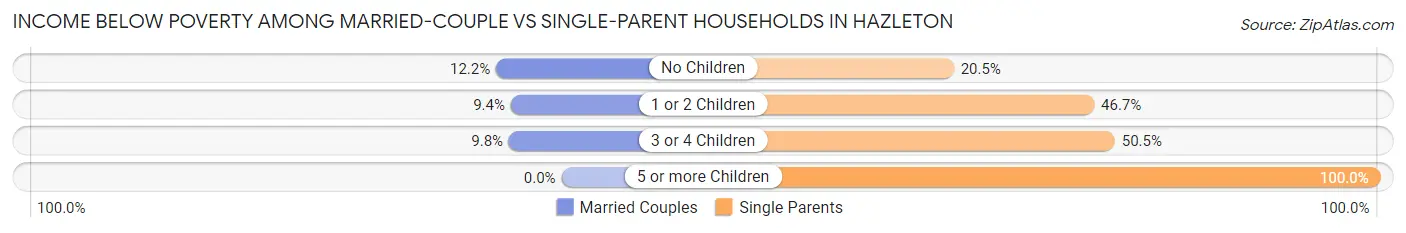
| Children | Married-Couple Families | Single-Parent Households |
| No Children | 276 (12.2%) | 217 (20.5%) |
| 1 or 2 Children | 102 (9.4%) | 774 (46.7%) |
| 3 or 4 Children | 33 (9.8%) | 153 (50.5%) |
| 5 or more Children | 0 (0.0%) | 92 (100.0%) |
| Total | 411 (11.1%) | 1,236 (39.7%) |
Race in Hazleton
The most populous races in Hazleton are Hispanic or Latino (18,461 | 62.2%), White / Caucasian (14,558 | 49.1%), and Some other Race (8,528 | 28.7%).
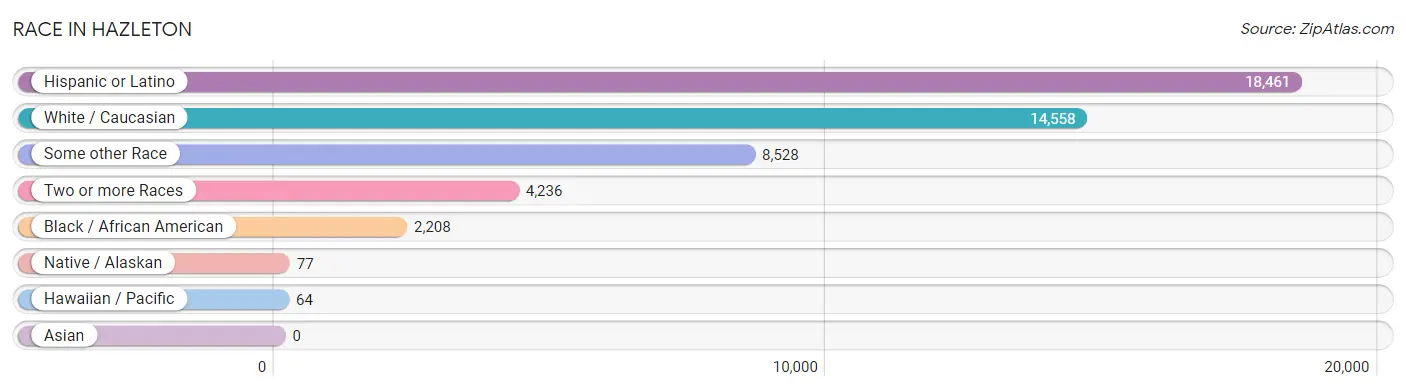
| Race | # Population | % Population |
| Asian | 0 | 0.0% |
| Black / African American | 2,208 | 7.4% |
| Hawaiian / Pacific | 64 | 0.2% |
| Hispanic or Latino | 18,461 | 62.2% |
| Native / Alaskan | 77 | 0.3% |
| White / Caucasian | 14,558 | 49.1% |
| Two or more Races | 4,236 | 14.3% |
| Some other Race | 8,528 | 28.7% |
| Total | 29,671 | 100.0% |
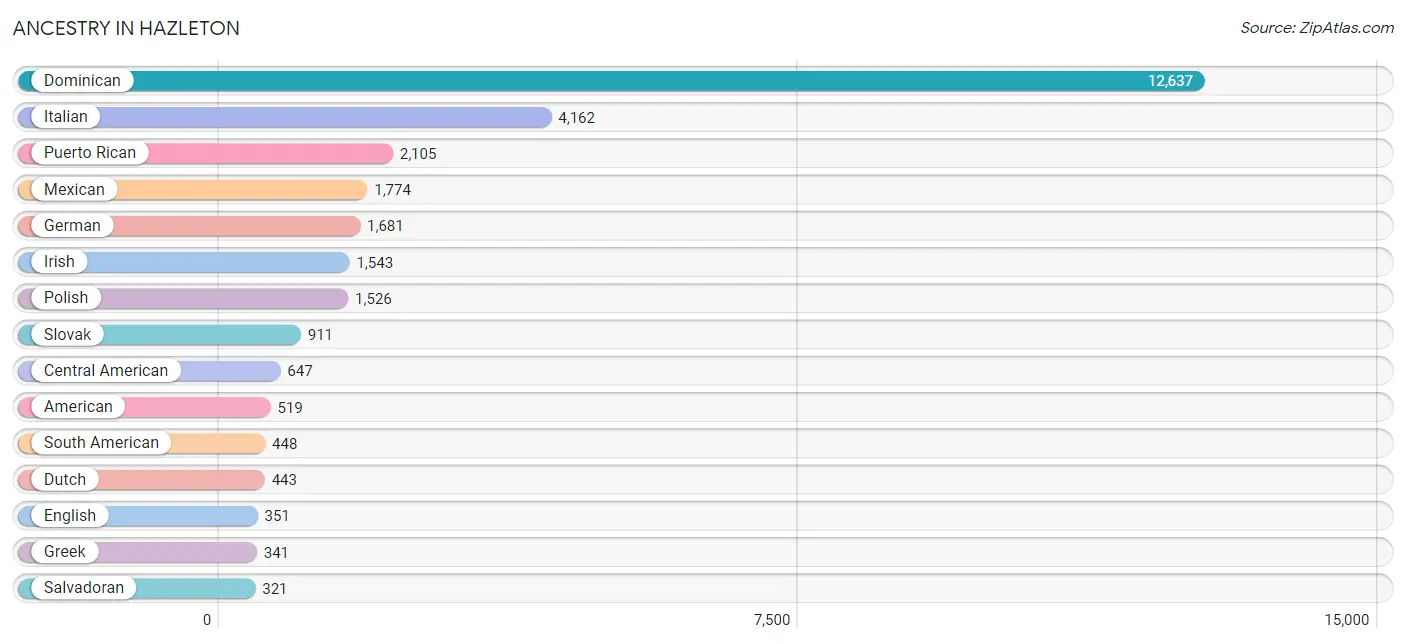
Ancestry in Hazleton
The most populous ancestries reported in Hazleton are Dominican (12,637 | 42.6%), Italian (4,162 | 14.0%), Puerto Rican (2,105 | 7.1%), Mexican (1,774 | 6.0%), and German (1,681 | 5.7%), together accounting for 75.4% of all Hazleton residents.
| Ancestry | # Population | % Population |
| African | 195 | 0.7% |
| Albanian | 75 | 0.3% |
| American | 519 | 1.8% |
| Arab | 132 | 0.4% |
| Argentinean | 25 | 0.1% |
| Australian | 15 | 0.1% |
| Austrian | 262 | 0.9% |
| Belgian | 10 | 0.0% |
| Bhutanese | 38 | 0.1% |
| Brazilian | 55 | 0.2% |
| British | 12 | 0.0% |
| British West Indian | 18 | 0.1% |
| Burmese | 24 | 0.1% |
| Canadian | 26 | 0.1% |
| Carpatho Rusyn | 8 | 0.0% |
| Central American | 647 | 2.2% |
| Central American Indian | 85 | 0.3% |
| Cherokee | 1 | 0.0% |
| Colombian | 29 | 0.1% |
| Cuban | 26 | 0.1% |
| Czech | 26 | 0.1% |
| Czechoslovakian | 191 | 0.6% |
| Danish | 33 | 0.1% |
| Dominican | 12,637 | 42.6% |
| Dutch | 443 | 1.5% |
| Eastern European | 157 | 0.5% |
| Ecuadorian | 161 | 0.5% |
| English | 351 | 1.2% |
| European | 162 | 0.5% |
| French | 67 | 0.2% |
| French Canadian | 29 | 0.1% |
| German | 1,681 | 5.7% |
| Greek | 341 | 1.1% |
| Guamanian / Chamorro | 64 | 0.2% |
| Guatemalan | 181 | 0.6% |
| Haitian | 40 | 0.1% |
| Hungarian | 49 | 0.2% |
| Irish | 1,543 | 5.2% |
| Iroquois | 6 | 0.0% |
| Italian | 4,162 | 14.0% |
| Jamaican | 53 | 0.2% |
| Jordanian | 32 | 0.1% |
| Lebanese | 54 | 0.2% |
| Lithuanian | 136 | 0.5% |
| Mexican | 1,774 | 6.0% |
| Moroccan | 1 | 0.0% |
| Norwegian | 38 | 0.1% |
| Pennsylvania German | 46 | 0.2% |
| Peruvian | 18 | 0.1% |
| Polish | 1,526 | 5.1% |
| Portuguese | 229 | 0.8% |
| Puerto Rican | 2,105 | 7.1% |
| Romanian | 153 | 0.5% |
| Russian | 103 | 0.4% |
| Salvadoran | 321 | 1.1% |
| Scotch-Irish | 14 | 0.1% |
| Scottish | 18 | 0.1% |
| Serbian | 199 | 0.7% |
| Slavic | 49 | 0.2% |
| Slovak | 911 | 3.1% |
| Slovene | 12 | 0.0% |
| South American | 448 | 1.5% |
| Spaniard | 73 | 0.3% |
| Spanish | 106 | 0.4% |
| Subsaharan African | 195 | 0.7% |
| Swiss | 3 | 0.0% |
| Syrian | 8 | 0.0% |
| Ukrainian | 18 | 0.1% |
| Venezuelan | 215 | 0.7% |
| Welsh | 90 | 0.3% |
| Yugoslavian | 222 | 0.7% | View All 71 Rows |
Immigrants in Hazleton
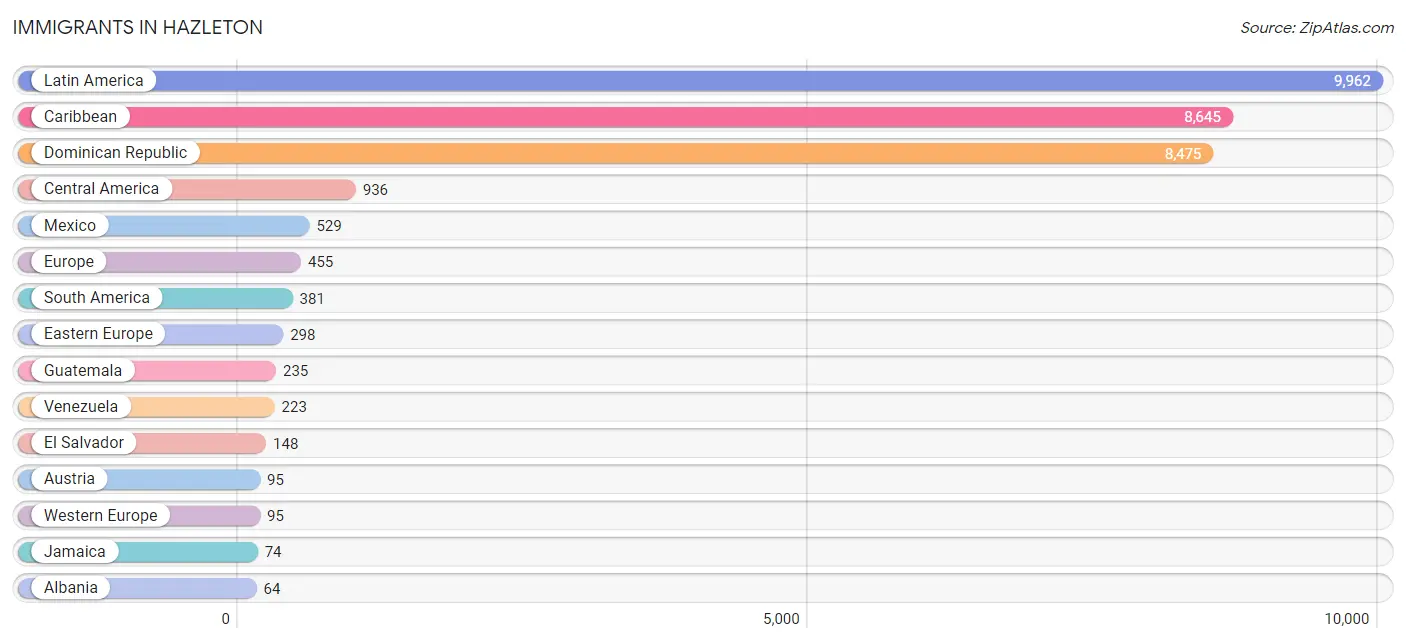
The most numerous immigrant groups reported in Hazleton came from Latin America (9,962 | 33.6%), Caribbean (8,645 | 29.1%), Dominican Republic (8,475 | 28.6%), Central America (936 | 3.2%), and Mexico (529 | 1.8%), together accounting for 96.2% of all Hazleton residents.
| Immigration Origin | # Population | % Population |
| Albania | 64 | 0.2% |
| Argentina | 25 | 0.1% |
| Asia | 8 | 0.0% |
| Austria | 95 | 0.3% |
| Brazil | 19 | 0.1% |
| Canada | 26 | 0.1% |
| Caribbean | 8,645 | 29.1% |
| Central America | 936 | 3.2% |
| Colombia | 37 | 0.1% |
| Dominica | 62 | 0.2% |
| Dominican Republic | 8,475 | 28.6% |
| Eastern Europe | 298 | 1.0% |
| Ecuador | 60 | 0.2% |
| El Salvador | 148 | 0.5% |
| England | 16 | 0.1% |
| Europe | 455 | 1.5% |
| Guatemala | 235 | 0.8% |
| Haiti | 1 | 0.0% |
| Italy | 39 | 0.1% |
| Jamaica | 74 | 0.3% |
| Latin America | 9,962 | 33.6% |
| Mexico | 529 | 1.8% |
| Northern Europe | 23 | 0.1% |
| Norway | 7 | 0.0% |
| Panama | 24 | 0.1% |
| Peru | 17 | 0.1% |
| Romania | 28 | 0.1% |
| Russia | 5 | 0.0% |
| Serbia | 54 | 0.2% |
| South America | 381 | 1.3% |
| Southern Europe | 39 | 0.1% |
| Syria | 8 | 0.0% |
| Venezuela | 223 | 0.7% |
| Western Asia | 8 | 0.0% |
| Western Europe | 95 | 0.3% | View All 35 Rows |
Sex and Age in Hazleton
Sex and Age in Hazleton
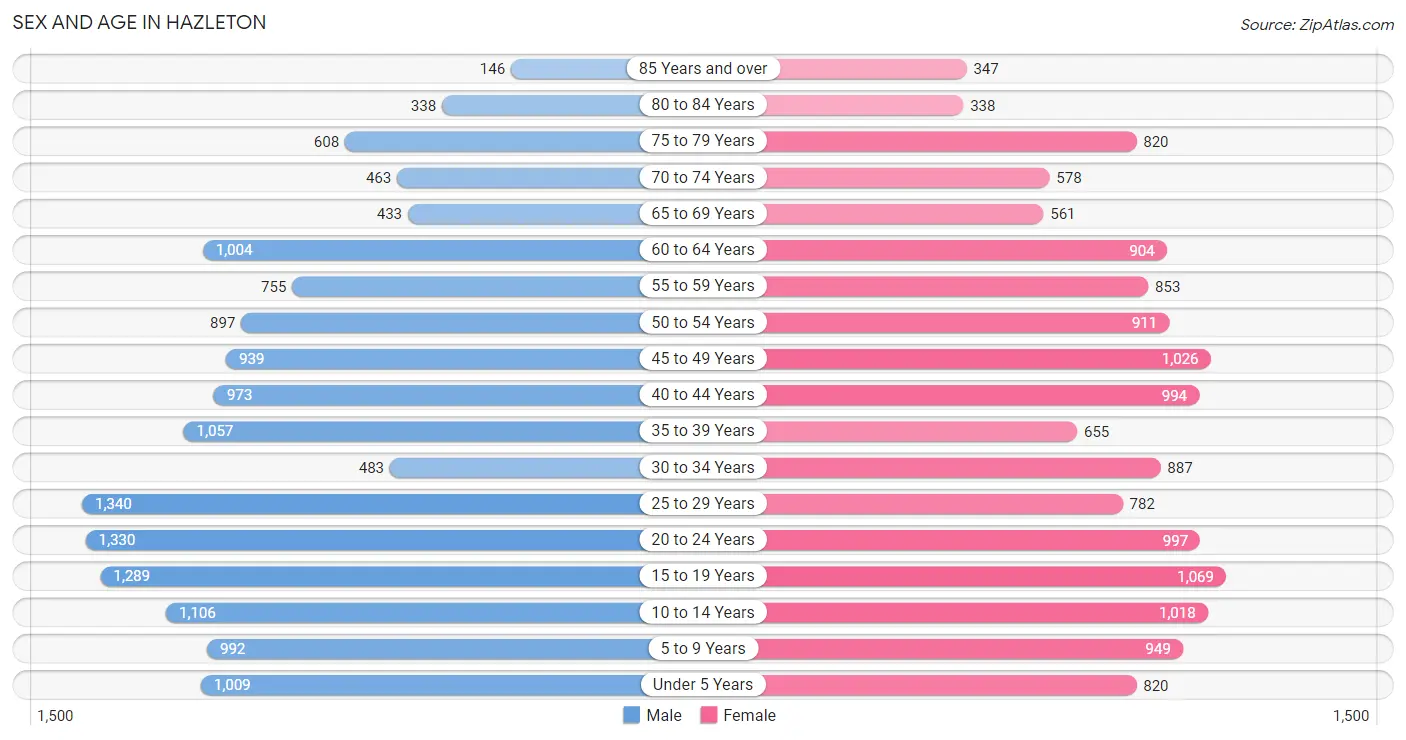
The most populous age groups in Hazleton are 25 to 29 Years (1,340 | 8.8%) for men and 15 to 19 Years (1,069 | 7.4%) for women.
| Age Bracket | Male | Female |
| Under 5 Years | 1,009 (6.7%) | 820 (5.7%) |
| 5 to 9 Years | 992 (6.5%) | 949 (6.5%) |
| 10 to 14 Years | 1,106 (7.3%) | 1,018 (7.0%) |
| 15 to 19 Years | 1,289 (8.5%) | 1,069 (7.4%) |
| 20 to 24 Years | 1,330 (8.8%) | 997 (6.9%) |
| 25 to 29 Years | 1,340 (8.8%) | 782 (5.4%) |
| 30 to 34 Years | 483 (3.2%) | 887 (6.1%) |
| 35 to 39 Years | 1,057 (7.0%) | 655 (4.5%) |
| 40 to 44 Years | 973 (6.4%) | 994 (6.9%) |
| 45 to 49 Years | 939 (6.2%) | 1,026 (7.1%) |
| 50 to 54 Years | 897 (5.9%) | 911 (6.3%) |
| 55 to 59 Years | 755 (5.0%) | 853 (5.9%) |
| 60 to 64 Years | 1,004 (6.6%) | 904 (6.2%) |
| 65 to 69 Years | 433 (2.9%) | 561 (3.9%) |
| 70 to 74 Years | 463 (3.0%) | 578 (4.0%) |
| 75 to 79 Years | 608 (4.0%) | 820 (5.7%) |
| 80 to 84 Years | 338 (2.2%) | 338 (2.3%) |
| 85 Years and over | 146 (1.0%) | 347 (2.4%) |
| Total | 15,162 (100.0%) | 14,509 (100.0%) |
Families and Households in Hazleton
Median Family Size in Hazleton
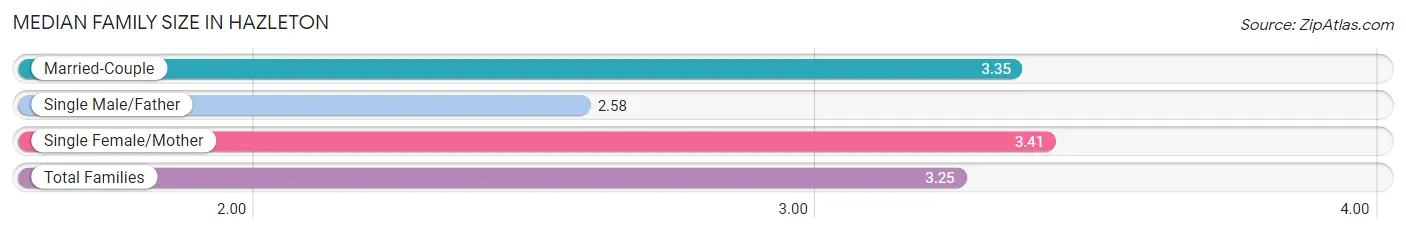
The median family size in Hazleton is 3.25 persons per family, with single female/mother families (2,059 | 30.2%) accounting for the largest median family size of 3.41 persons per family. On the other hand, single male/father families (1,054 | 15.5%) represent the smallest median family size with 2.58 persons per family.
| Family Type | # Families | Family Size |
| Married-Couple | 3,702 (54.3%) | 3.35 |
| Single Male/Father | 1,054 (15.5%) | 2.58 |
| Single Female/Mother | 2,059 (30.2%) | 3.41 |
| Total Families | 6,815 (100.0%) | 3.25 |
Median Household Size in Hazleton
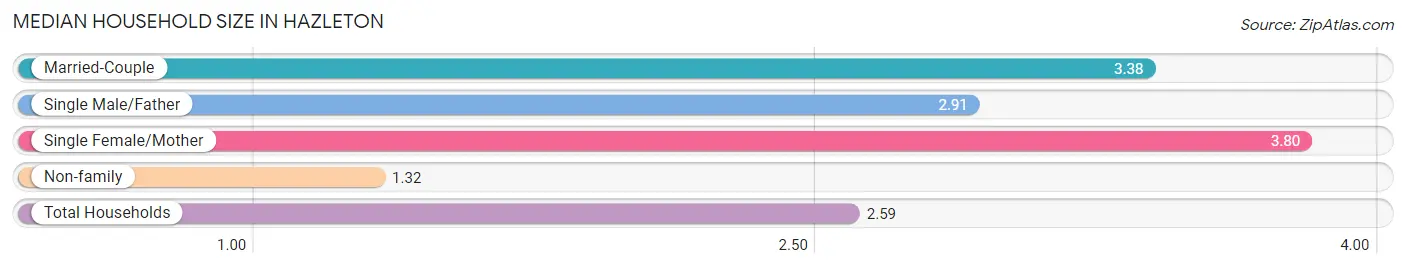
The median household size in Hazleton is 2.59 persons per household, with single female/mother households (2,059 | 18.2%) accounting for the largest median household size of 3.8 persons per household. non-family households (4,518 | 39.9%) represent the smallest median household size with 1.32 persons per household.
| Household Type | # Households | Household Size |
| Married-Couple | 3,702 (32.7%) | 3.38 |
| Single Male/Father | 1,054 (9.3%) | 2.91 |
| Single Female/Mother | 2,059 (18.2%) | 3.80 |
| Non-family | 4,518 (39.9%) | 1.32 |
| Total Households | 11,333 (100.0%) | 2.59 |
Household Size by Marriage Status in Hazleton
Out of a total of 11,333 households in Hazleton, 6,815 (60.1%) are family households, while 4,518 (39.9%) are nonfamily households. The most numerous type of family households are 2-person households, comprising 2,659, and the most common type of nonfamily households are 1-person households, comprising 3,899.
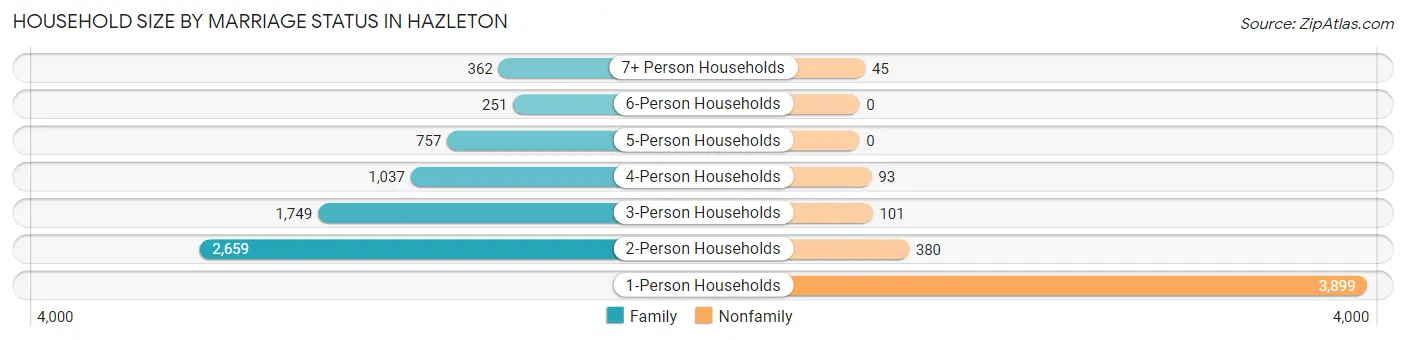
| Household Size | Family Households | Nonfamily Households |
| 1-Person Households | - | 3,899 (34.4%) |
| 2-Person Households | 2,659 (23.5%) | 380 (3.4%) |
| 3-Person Households | 1,749 (15.4%) | 101 (0.9%) |
| 4-Person Households | 1,037 (9.1%) | 93 (0.8%) |
| 5-Person Households | 757 (6.7%) | 0 (0.0%) |
| 6-Person Households | 251 (2.2%) | 0 (0.0%) |
| 7+ Person Households | 362 (3.2%) | 45 (0.4%) |
| Total | 6,815 (60.1%) | 4,518 (39.9%) |
Female Fertility in Hazleton
Fertility by Age in Hazleton
Average fertility rate in Hazleton is 69.0 births per 1,000 women. Women in the age bracket of 20 to 34 years have the highest fertility rate with 137.0 births per 1,000 women. Women in the age bracket of 20 to 34 years acount for 79.0% of all women with births.
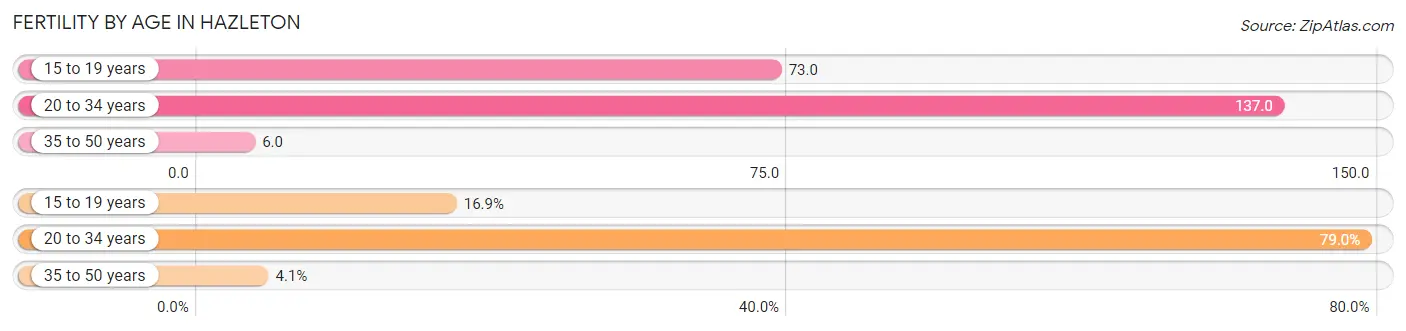
| Age Bracket | Women with Births | Births / 1,000 Women |
| 15 to 19 years | 78 (16.9%) | 73.0 |
| 20 to 34 years | 365 (79.0%) | 137.0 |
| 35 to 50 years | 19 (4.1%) | 6.0 |
| Total | 462 (100.0%) | 69.0 |
Fertility by Age by Marriage Status in Hazleton
22.7% of women with births (462) in Hazleton are married. The highest percentage of unmarried women with births falls into 20 to 34 years age bracket with 80.8% of them unmarried at the time of birth, while the lowest percentage of unmarried women with births belong to 35 to 50 years age bracket with 0.0% of them unmarried.
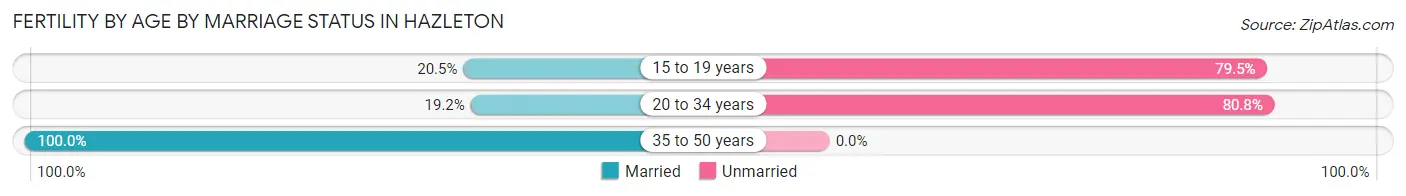
| Age Bracket | Married | Unmarried |
| 15 to 19 years | 16 (20.5%) | 62 (79.5%) |
| 20 to 34 years | 70 (19.2%) | 295 (80.8%) |
| 35 to 50 years | 19 (100.0%) | 0 (0.0%) |
| Total | 105 (22.7%) | 357 (77.3%) |
Fertility by Education in Hazleton
Average fertility rate in Hazleton is 69.0 births per 1,000 women. Women with the education attainment of graduate degree have the highest fertility rate of 203.0 births per 1,000 women, while women with the education attainment of bachelor's degree have the lowest fertility at 42.0 births per 1,000 women. Women with the education attainment of high school diploma represent 32.5% of all women with births.
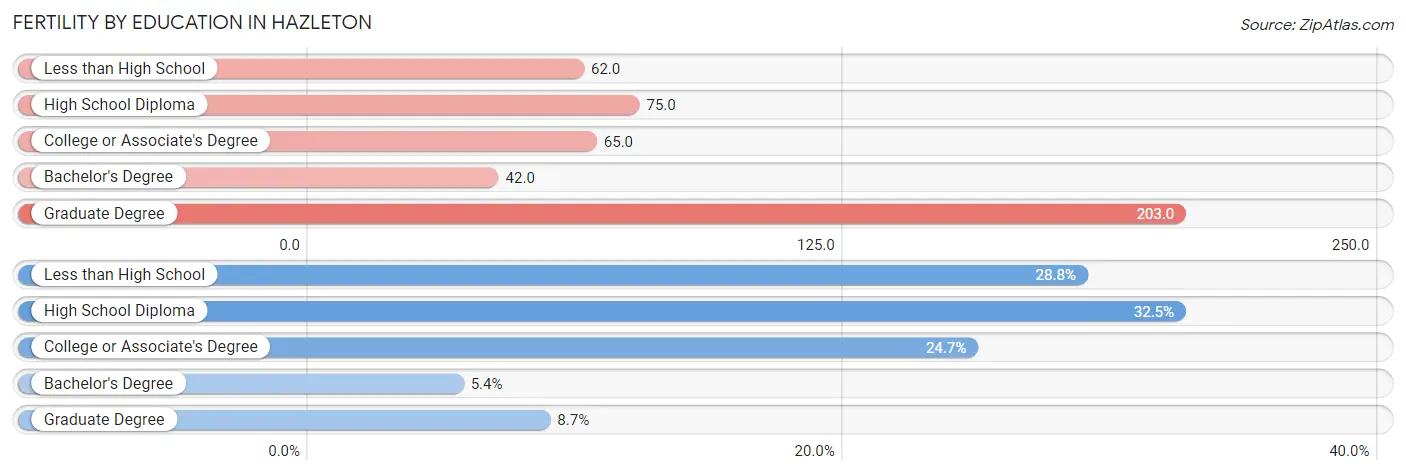
| Educational Attainment | Women with Births | Births / 1,000 Women |
| Less than High School | 133 (28.8%) | 62.0 |
| High School Diploma | 150 (32.5%) | 75.0 |
| College or Associate's Degree | 114 (24.7%) | 65.0 |
| Bachelor's Degree | 25 (5.4%) | 42.0 |
| Graduate Degree | 40 (8.7%) | 203.0 |
| Total | 462 (100.0%) | 69.0 |
Fertility by Education by Marriage Status in Hazleton
77.3% of women with births in Hazleton are unmarried. Women with the educational attainment of less than high school are most likely to be married with 32.3% of them married at childbirth, while women with the educational attainment of bachelor's degree are least likely to be married with 100.0% of them unmarried at childbirth.
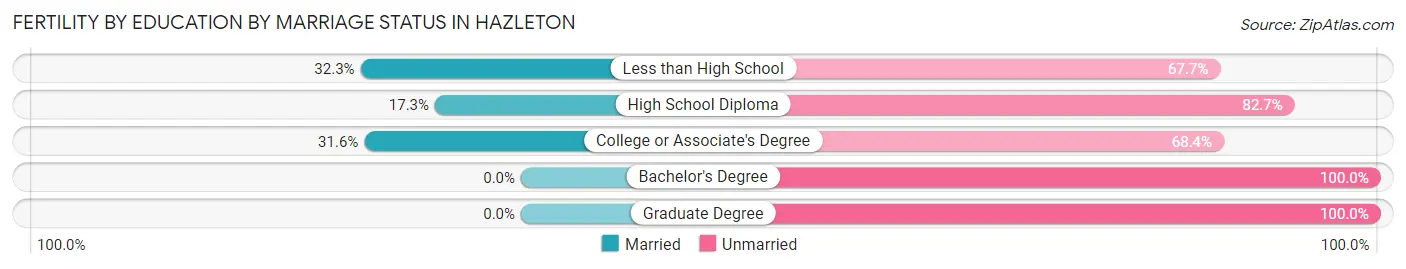
| Educational Attainment | Married | Unmarried |
| Less than High School | 43 (32.3%) | 90 (67.7%) |
| High School Diploma | 26 (17.3%) | 124 (82.7%) |
| College or Associate's Degree | 36 (31.6%) | 78 (68.4%) |
| Bachelor's Degree | 0 (0.0%) | 25 (100.0%) |
| Graduate Degree | 0 (0.0%) | 40 (100.0%) |
| Total | 105 (22.7%) | 357 (77.3%) |
Employment Characteristics in Hazleton
Employment by Class of Employer in Hazleton
Among the 13,141 employed individuals in Hazleton, private company employees (10,606 | 80.7%), self-employed (not incorporated) (873 | 6.6%), and not-for-profit organizations (725 | 5.5%) make up the most common classes of employment.
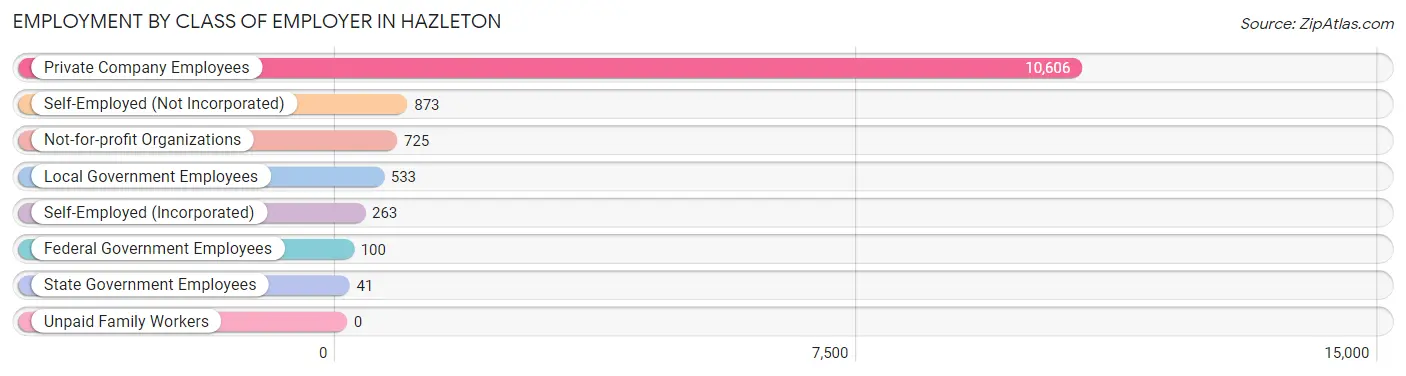
| Employer Class | # Employees | % Employees |
| Private Company Employees | 10,606 | 80.7% |
| Self-Employed (Incorporated) | 263 | 2.0% |
| Self-Employed (Not Incorporated) | 873 | 6.6% |
| Not-for-profit Organizations | 725 | 5.5% |
| Local Government Employees | 533 | 4.1% |
| State Government Employees | 41 | 0.3% |
| Federal Government Employees | 100 | 0.8% |
| Unpaid Family Workers | 0 | 0.0% |
| Total | 13,141 | 100.0% |
Employment Status by Age in Hazleton
According to the labor force statistics for Hazleton, out of the total population over 16 years of age (23,441), 61.8% or 14,487 individuals are in the labor force, with 6.9% or 1,000 of them unemployed. The age group with the highest labor force participation rate is 25 to 29 years, with 90.7% or 1,925 individuals in the labor force. Within the labor force, the 16 to 19 years age range has the highest percentage of unemployed individuals, with 28.7% or 287 of them being unemployed.
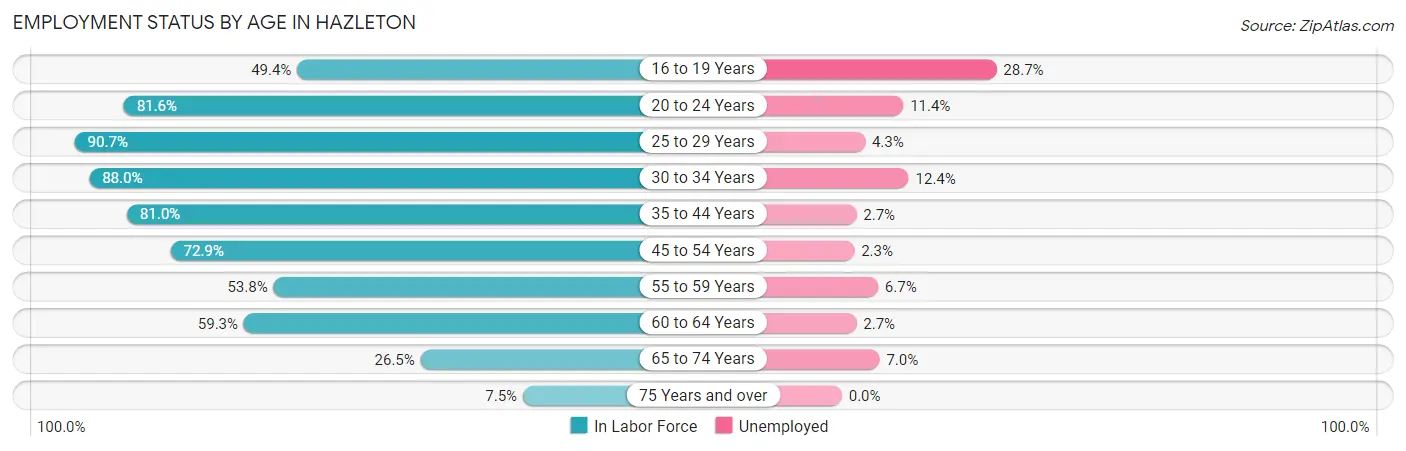
| Age Bracket | In Labor Force | Unemployed |
| 16 to 19 Years | 999 (49.4%) | 287 (28.7%) |
| 20 to 24 Years | 1,899 (81.6%) | 216 (11.4%) |
| 25 to 29 Years | 1,925 (90.7%) | 83 (4.3%) |
| 30 to 34 Years | 1,206 (88.0%) | 150 (12.4%) |
| 35 to 44 Years | 2,980 (81.0%) | 80 (2.7%) |
| 45 to 54 Years | 2,751 (72.9%) | 63 (2.3%) |
| 55 to 59 Years | 865 (53.8%) | 58 (6.7%) |
| 60 to 64 Years | 1,131 (59.3%) | 31 (2.7%) |
| 65 to 74 Years | 539 (26.5%) | 38 (7.0%) |
| 75 Years and over | 195 (7.5%) | 0 (0.0%) |
| Total | 14,487 (61.8%) | 1,000 (6.9%) |
Employment Status by Educational Attainment in Hazleton
According to labor force statistics for Hazleton, 75.1% of individuals (10,859) out of the total population between 25 and 64 years of age (14,460) are in the labor force, with 4.3% or 467 of them being unemployed. The group with the highest labor force participation rate are those with the educational attainment of bachelor's degree or higher, with 84.7% or 1,345 individuals in the labor force. Within the labor force, individuals with less than high school education have the highest percentage of unemployment, with 10.5% or 279 of them being unemployed.
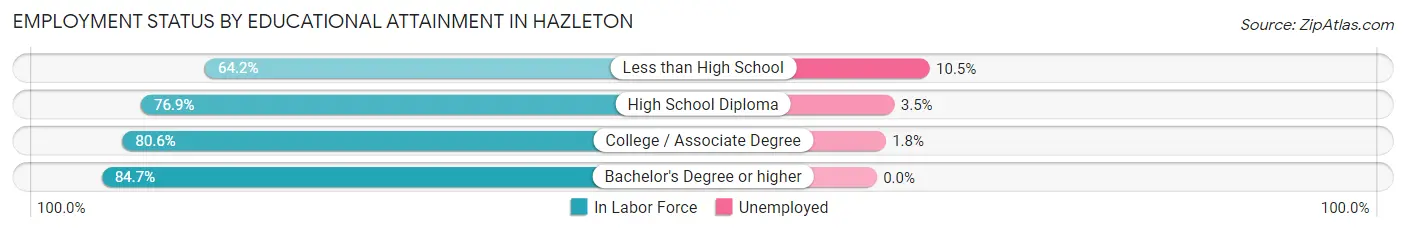
| Educational Attainment | In Labor Force | Unemployed |
| Less than High School | 2,655 (64.2%) | 434 (10.5%) |
| High School Diploma | 3,752 (76.9%) | 171 (3.5%) |
| College / Associate Degree | 3,110 (80.6%) | 69 (1.8%) |
| Bachelor's Degree or higher | 1,345 (84.7%) | 0 (0.0%) |
| Total | 10,859 (75.1%) | 622 (4.3%) |
Employment Occupations by Sex in Hazleton
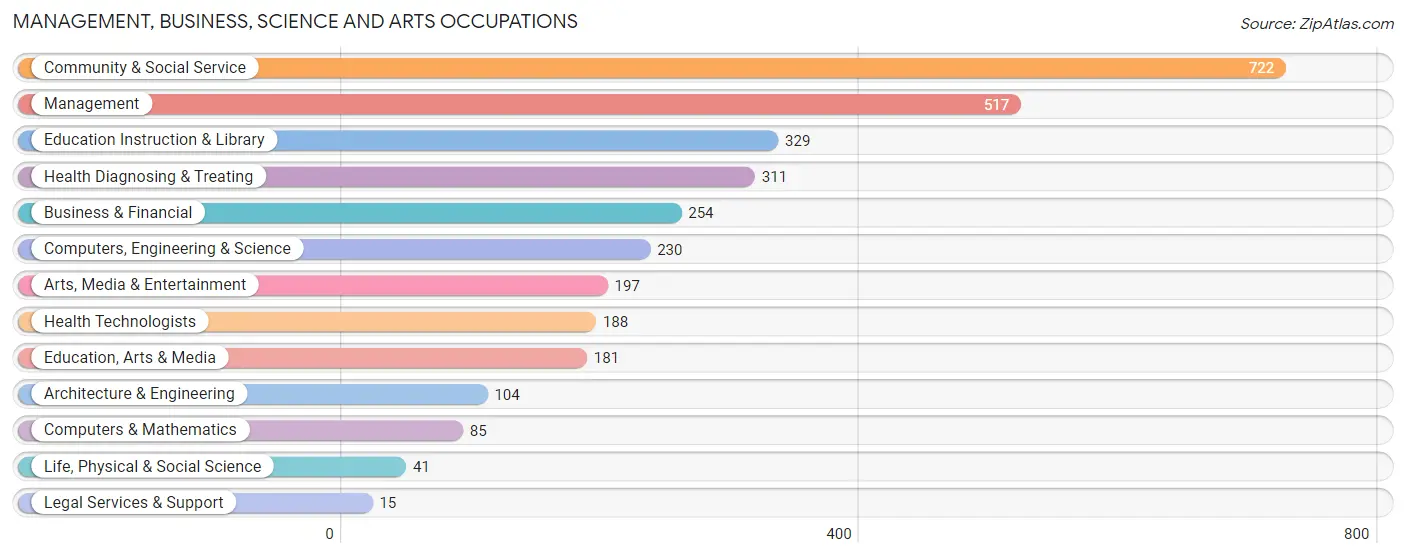
Management, Business, Science and Arts Occupations
The most common Management, Business, Science and Arts occupations in Hazleton are Community & Social Service (722 | 5.3%), Management (517 | 3.8%), Education Instruction & Library (329 | 2.4%), Health Diagnosing & Treating (311 | 2.3%), and Business & Financial (254 | 1.9%).
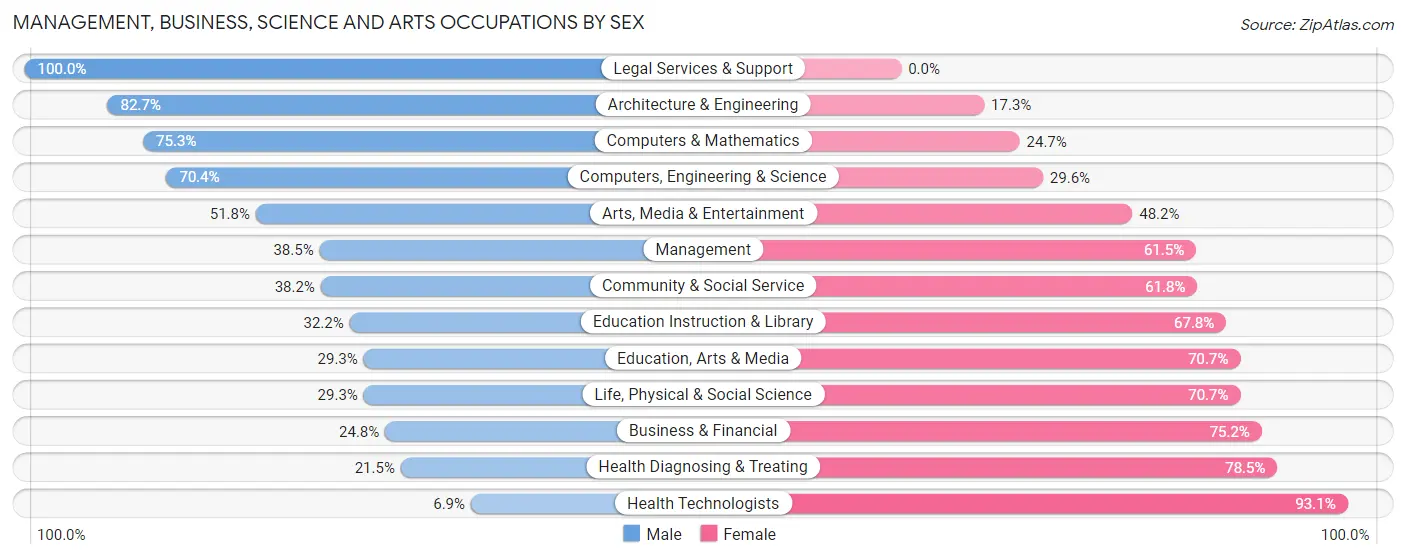
Management, Business, Science and Arts Occupations by Sex
Within the Management, Business, Science and Arts occupations in Hazleton, the most male-oriented occupations are Legal Services & Support (100.0%), Architecture & Engineering (82.7%), and Computers & Mathematics (75.3%), while the most female-oriented occupations are Health Technologists (93.1%), Health Diagnosing & Treating (78.5%), and Business & Financial (75.2%).
| Occupation | Male | Female |
| Management | 199 (38.5%) | 318 (61.5%) |
| Business & Financial | 63 (24.8%) | 191 (75.2%) |
| Computers, Engineering & Science | 162 (70.4%) | 68 (29.6%) |
| Computers & Mathematics | 64 (75.3%) | 21 (24.7%) |
| Architecture & Engineering | 86 (82.7%) | 18 (17.3%) |
| Life, Physical & Social Science | 12 (29.3%) | 29 (70.7%) |
| Community & Social Service | 276 (38.2%) | 446 (61.8%) |
| Education, Arts & Media | 53 (29.3%) | 128 (70.7%) |
| Legal Services & Support | 15 (100.0%) | 0 (0.0%) |
| Education Instruction & Library | 106 (32.2%) | 223 (67.8%) |
| Arts, Media & Entertainment | 102 (51.8%) | 95 (48.2%) |
| Health Diagnosing & Treating | 67 (21.5%) | 244 (78.5%) |
| Health Technologists | 13 (6.9%) | 175 (93.1%) |
| Total (Category) | 767 (37.7%) | 1,267 (62.3%) |
| Total (Overall) | 7,269 (53.9%) | 6,216 (46.1%) |
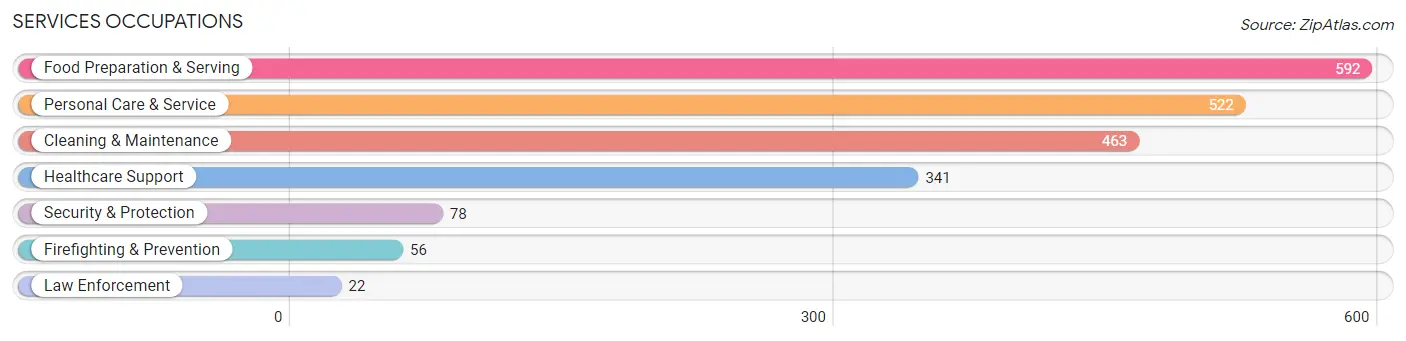
Services Occupations
The most common Services occupations in Hazleton are Food Preparation & Serving (592 | 4.4%), Personal Care & Service (522 | 3.9%), Cleaning & Maintenance (463 | 3.4%), Healthcare Support (341 | 2.5%), and Security & Protection (78 | 0.6%).
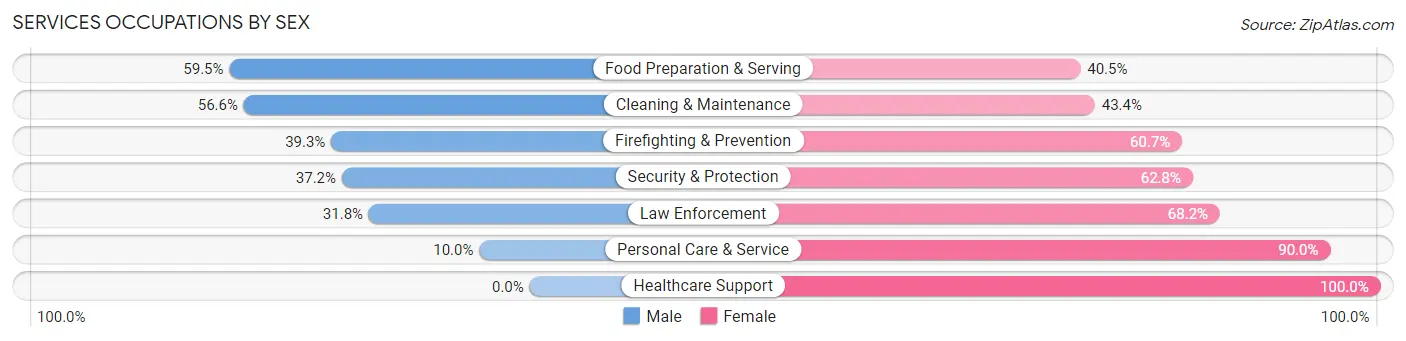
Services Occupations by Sex
Within the Services occupations in Hazleton, the most male-oriented occupations are Food Preparation & Serving (59.5%), Cleaning & Maintenance (56.6%), and Firefighting & Prevention (39.3%), while the most female-oriented occupations are Healthcare Support (100.0%), Personal Care & Service (90.0%), and Law Enforcement (68.2%).
| Occupation | Male | Female |
| Healthcare Support | 0 (0.0%) | 341 (100.0%) |
| Security & Protection | 29 (37.2%) | 49 (62.8%) |
| Firefighting & Prevention | 22 (39.3%) | 34 (60.7%) |
| Law Enforcement | 7 (31.8%) | 15 (68.2%) |
| Food Preparation & Serving | 352 (59.5%) | 240 (40.5%) |
| Cleaning & Maintenance | 262 (56.6%) | 201 (43.4%) |
| Personal Care & Service | 52 (10.0%) | 470 (90.0%) |
| Total (Category) | 695 (34.8%) | 1,301 (65.2%) |
| Total (Overall) | 7,269 (53.9%) | 6,216 (46.1%) |
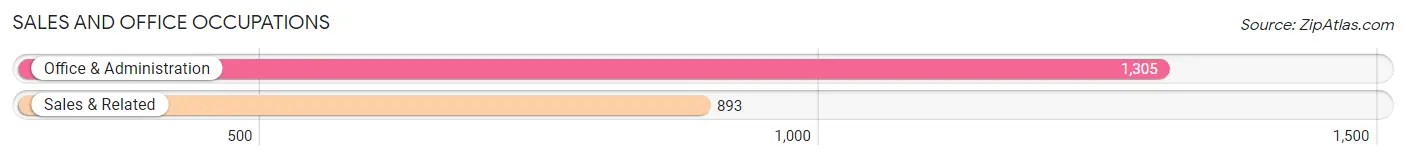
Sales and Office Occupations
The most common Sales and Office occupations in Hazleton are Office & Administration (1,305 | 9.7%), and Sales & Related (893 | 6.6%).
Sales and Office Occupations by Sex
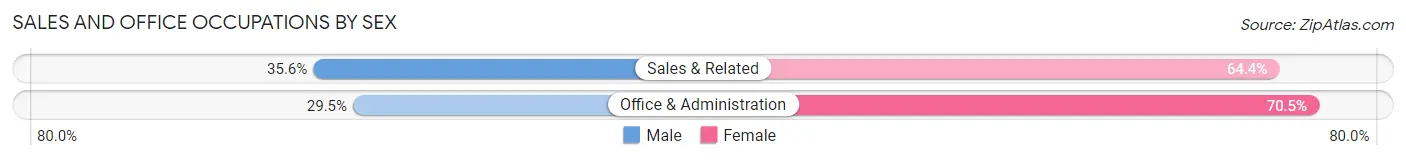
| Occupation | Male | Female |
| Sales & Related | 318 (35.6%) | 575 (64.4%) |
| Office & Administration | 385 (29.5%) | 920 (70.5%) |
| Total (Category) | 703 (32.0%) | 1,495 (68.0%) |
| Total (Overall) | 7,269 (53.9%) | 6,216 (46.1%) |
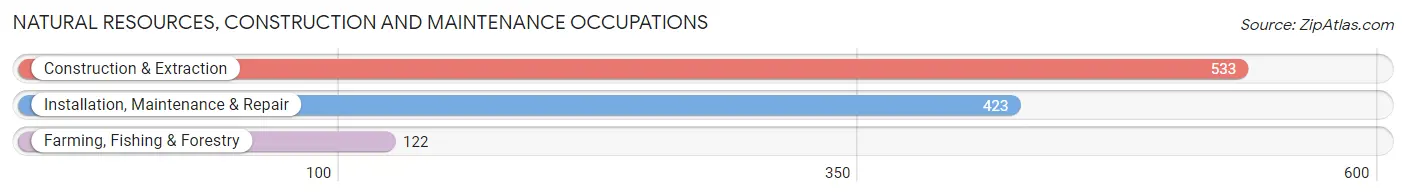
Natural Resources, Construction and Maintenance Occupations
The most common Natural Resources, Construction and Maintenance occupations in Hazleton are Construction & Extraction (533 | 4.0%), Installation, Maintenance & Repair (423 | 3.1%), and Farming, Fishing & Forestry (122 | 0.9%).
Natural Resources, Construction and Maintenance Occupations by Sex
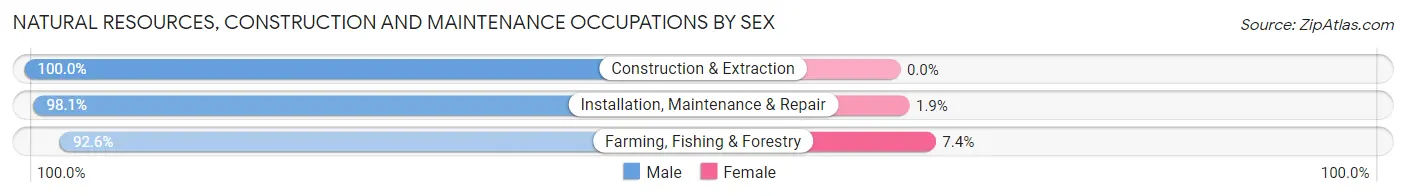
| Occupation | Male | Female |
| Farming, Fishing & Forestry | 113 (92.6%) | 9 (7.4%) |
| Construction & Extraction | 533 (100.0%) | 0 (0.0%) |
| Installation, Maintenance & Repair | 415 (98.1%) | 8 (1.9%) |
| Total (Category) | 1,061 (98.4%) | 17 (1.6%) |
| Total (Overall) | 7,269 (53.9%) | 6,216 (46.1%) |
Production, Transportation and Moving Occupations
The most common Production, Transportation and Moving occupations in Hazleton are Material Moving (3,332 | 24.7%), Production (2,154 | 16.0%), and Transportation (693 | 5.1%).
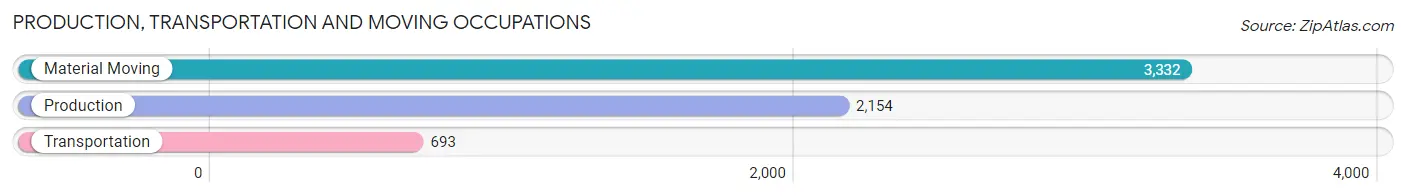
Production, Transportation and Moving Occupations by Sex
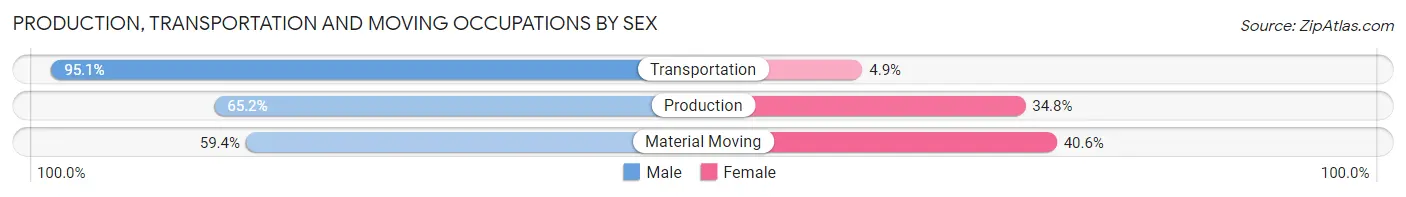
| Occupation | Male | Female |
| Production | 1,404 (65.2%) | 750 (34.8%) |
| Transportation | 659 (95.1%) | 34 (4.9%) |
| Material Moving | 1,980 (59.4%) | 1,352 (40.6%) |
| Total (Category) | 4,043 (65.4%) | 2,136 (34.6%) |
| Total (Overall) | 7,269 (53.9%) | 6,216 (46.1%) |
Employment Industries by Sex in Hazleton
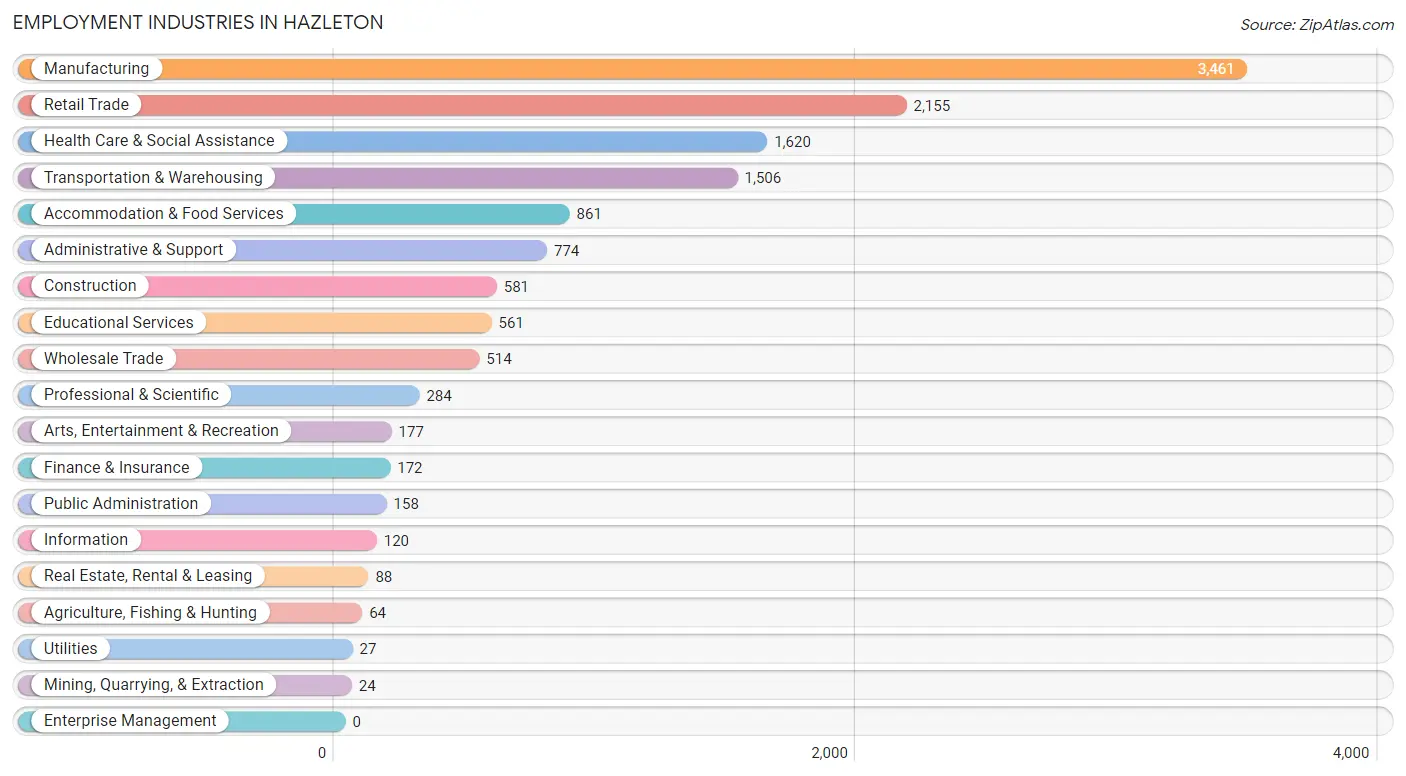
Employment Industries in Hazleton
The major employment industries in Hazleton include Manufacturing (3,461 | 25.7%), Retail Trade (2,155 | 16.0%), Health Care & Social Assistance (1,620 | 12.0%), Transportation & Warehousing (1,506 | 11.2%), and Accommodation & Food Services (861 | 6.4%).
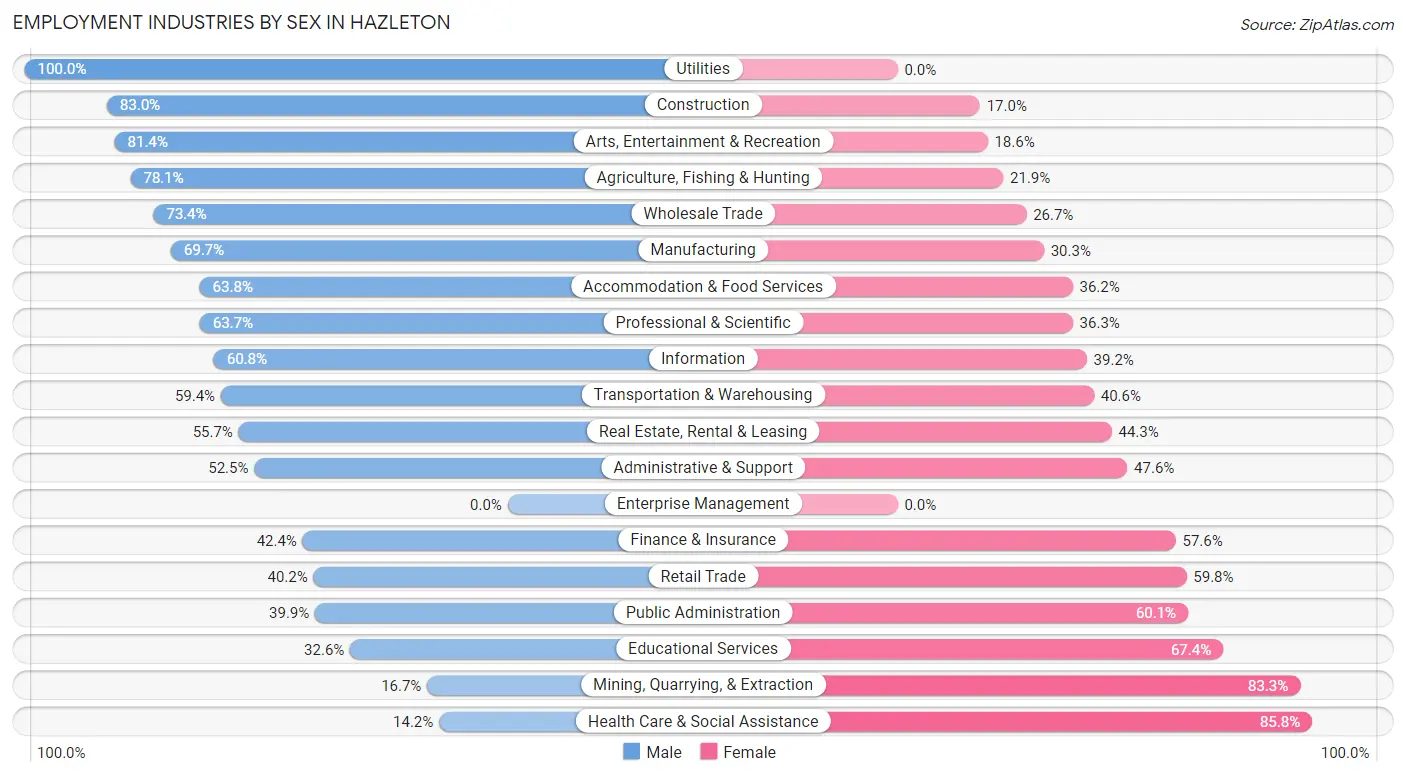
Employment Industries by Sex in Hazleton
The Hazleton industries that see more men than women are Utilities (100.0%), Construction (83.0%), and Arts, Entertainment & Recreation (81.4%), whereas the industries that tend to have a higher number of women are Health Care & Social Assistance (85.8%), Mining, Quarrying, & Extraction (83.3%), and Educational Services (67.4%).
| Industry | Male | Female |
| Agriculture, Fishing & Hunting | 50 (78.1%) | 14 (21.9%) |
| Mining, Quarrying, & Extraction | 4 (16.7%) | 20 (83.3%) |
| Construction | 482 (83.0%) | 99 (17.0%) |
| Manufacturing | 2,413 (69.7%) | 1,048 (30.3%) |
| Wholesale Trade | 377 (73.4%) | 137 (26.7%) |
| Retail Trade | 866 (40.2%) | 1,289 (59.8%) |
| Transportation & Warehousing | 894 (59.4%) | 612 (40.6%) |
| Utilities | 27 (100.0%) | 0 (0.0%) |
| Information | 73 (60.8%) | 47 (39.2%) |
| Finance & Insurance | 73 (42.4%) | 99 (57.6%) |
| Real Estate, Rental & Leasing | 49 (55.7%) | 39 (44.3%) |
| Professional & Scientific | 181 (63.7%) | 103 (36.3%) |
| Enterprise Management | 0 (0.0%) | 0 (0.0%) |
| Administrative & Support | 406 (52.4%) | 368 (47.5%) |
| Educational Services | 183 (32.6%) | 378 (67.4%) |
| Health Care & Social Assistance | 230 (14.2%) | 1,390 (85.8%) |
| Arts, Entertainment & Recreation | 144 (81.4%) | 33 (18.6%) |
| Accommodation & Food Services | 549 (63.8%) | 312 (36.2%) |
| Public Administration | 63 (39.9%) | 95 (60.1%) |
| Total | 7,269 (53.9%) | 6,216 (46.1%) |
Education in Hazleton
School Enrollment in Hazleton
The most common levels of schooling among the 6,933 students in Hazleton are middle school (1,928 | 27.8%), high school (1,484 | 21.4%), and college / undergraduate (1,480 | 21.3%).
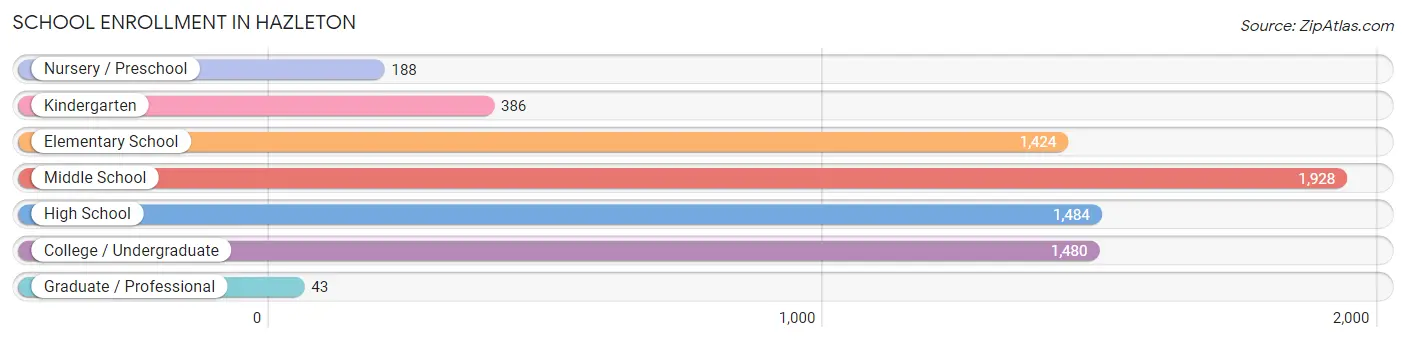
| School Level | # Students | % Students |
| Nursery / Preschool | 188 | 2.7% |
| Kindergarten | 386 | 5.6% |
| Elementary School | 1,424 | 20.5% |
| Middle School | 1,928 | 27.8% |
| High School | 1,484 | 21.4% |
| College / Undergraduate | 1,480 | 21.3% |
| Graduate / Professional | 43 | 0.6% |
| Total | 6,933 | 100.0% |
School Enrollment by Age by Funding Source in Hazleton
Out of a total of 6,933 students who are enrolled in schools in Hazleton, 742 (10.7%) attend a private institution, while the remaining 6,191 (89.3%) are enrolled in public schools. The age group of 35 years and over has the highest likelihood of being enrolled in private schools, with 174 (52.6% in the age bracket) enrolled. Conversely, the age group of 3 to 4 year olds has the lowest likelihood of being enrolled in a private school, with 77 (100.0% in the age bracket) attending a public institution.
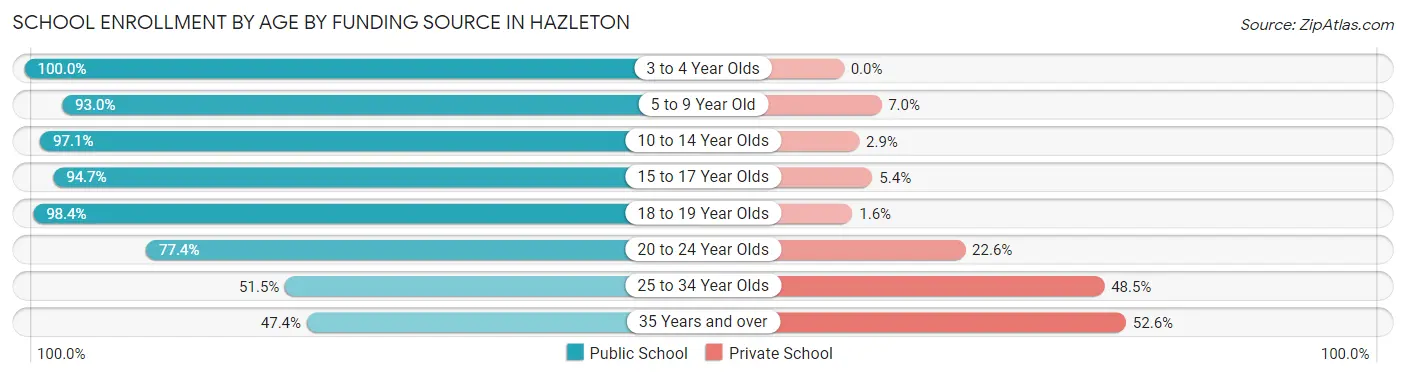
| Age Bracket | Public School | Private School |
| 3 to 4 Year Olds | 77 (100.0%) | 0 (0.0%) |
| 5 to 9 Year Old | 1,677 (93.0%) | 126 (7.0%) |
| 10 to 14 Year Olds | 2,029 (97.1%) | 60 (2.9%) |
| 15 to 17 Year Olds | 1,185 (94.7%) | 67 (5.3%) |
| 18 to 19 Year Olds | 429 (98.4%) | 7 (1.6%) |
| 20 to 24 Year Olds | 441 (77.4%) | 129 (22.6%) |
| 25 to 34 Year Olds | 193 (51.5%) | 182 (48.5%) |
| 35 Years and over | 157 (47.4%) | 174 (52.6%) |
| Total | 6,191 (89.3%) | 742 (10.7%) |
Educational Attainment by Field of Study in Hazleton
Business (694 | 29.8%), education (388 | 16.7%), science & technology (209 | 9.0%), liberal arts & history (141 | 6.0%), and arts & humanities (130 | 5.6%) are the most common fields of study among 2,330 individuals in Hazleton who have obtained a bachelor's degree or higher.
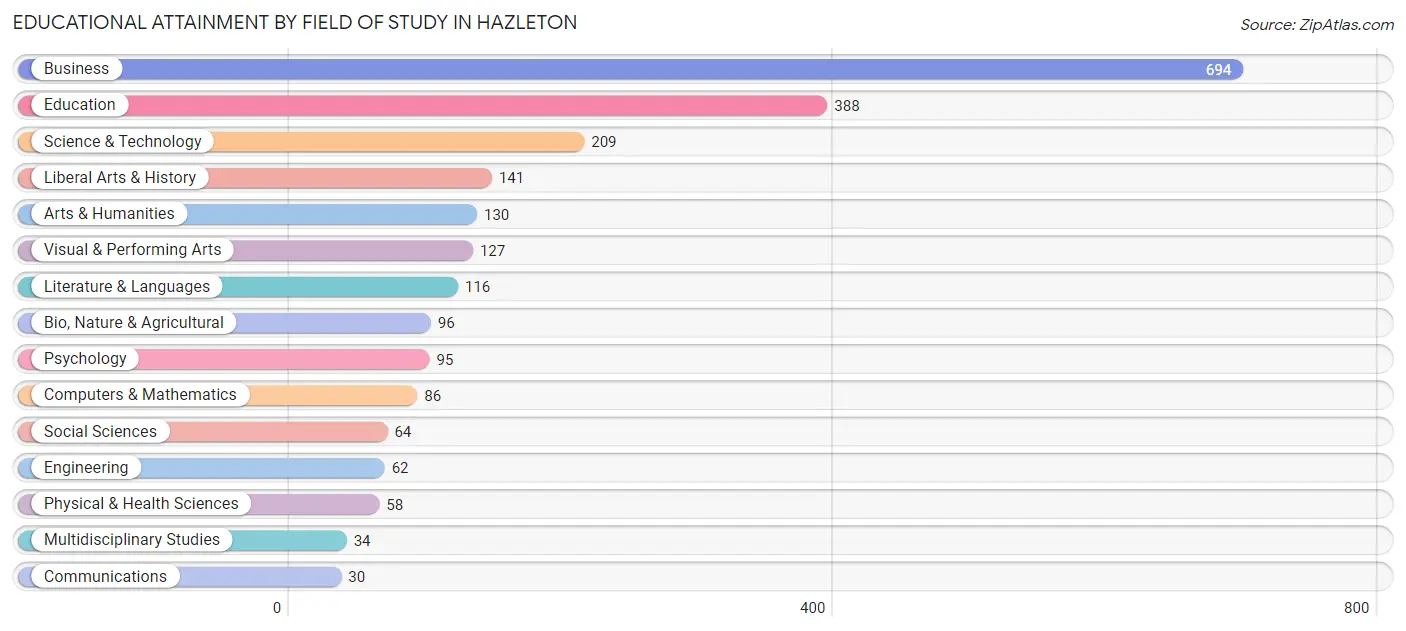
| Field of Study | # Graduates | % Graduates |
| Computers & Mathematics | 86 | 3.7% |
| Bio, Nature & Agricultural | 96 | 4.1% |
| Physical & Health Sciences | 58 | 2.5% |
| Psychology | 95 | 4.1% |
| Social Sciences | 64 | 2.8% |
| Engineering | 62 | 2.7% |
| Multidisciplinary Studies | 34 | 1.5% |
| Science & Technology | 209 | 9.0% |
| Business | 694 | 29.8% |
| Education | 388 | 16.7% |
| Literature & Languages | 116 | 5.0% |
| Liberal Arts & History | 141 | 6.0% |
| Visual & Performing Arts | 127 | 5.4% |
| Communications | 30 | 1.3% |
| Arts & Humanities | 130 | 5.6% |
| Total | 2,330 | 100.0% |
Transportation & Commute in Hazleton
Vehicle Availability by Sex in Hazleton
The most prevalent vehicle ownership categories in Hazleton are males with 2 vehicles (2,443, accounting for 34.5%) and females with 2 vehicles (2,025, making up 40.4%).
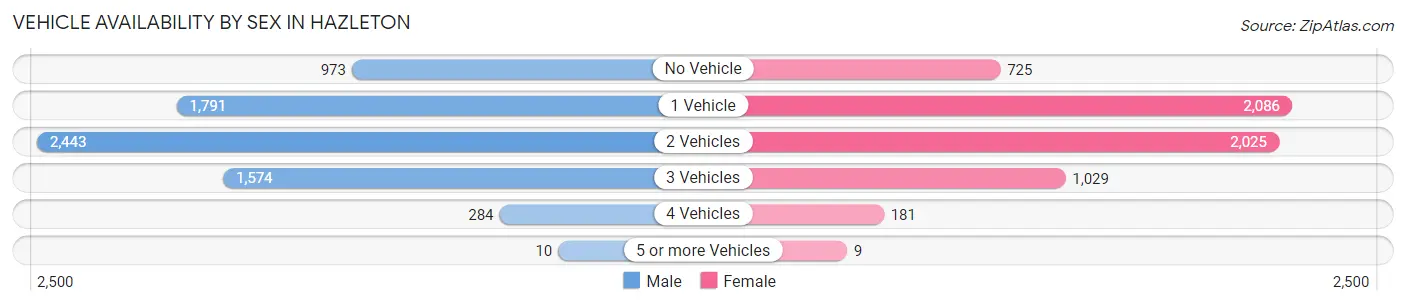
| Vehicles Available | Male | Female |
| No Vehicle | 973 (13.8%) | 725 (12.0%) |
| 1 Vehicle | 1,791 (25.3%) | 2,086 (34.4%) |
| 2 Vehicles | 2,443 (34.5%) | 2,025 (33.4%) |
| 3 Vehicles | 1,574 (22.3%) | 1,029 (17.0%) |
| 4 Vehicles | 284 (4.0%) | 181 (3.0%) |
| 5 or more Vehicles | 10 (0.1%) | 9 (0.2%) |
| Total | 7,075 (100.0%) | 6,055 (100.0%) |
Commute Time in Hazleton
The most frequently occuring commute durations in Hazleton are 15 to 19 minutes (3,016 commuters, 23.7%), 10 to 14 minutes (2,517 commuters, 19.8%), and 20 to 24 minutes (2,123 commuters, 16.7%).
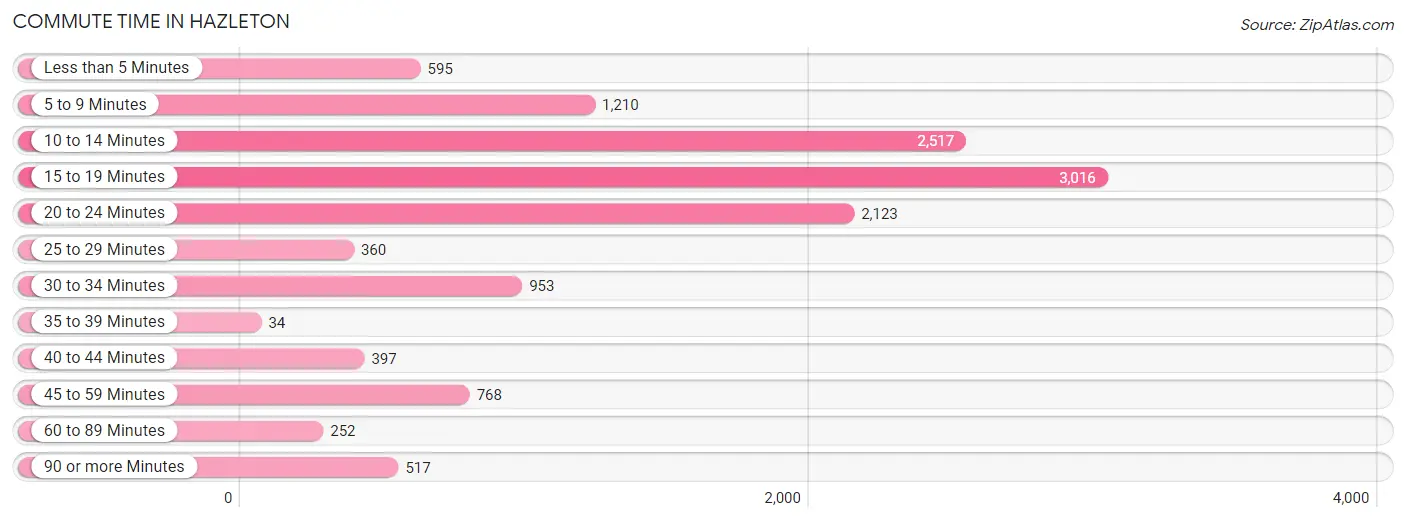
| Commute Time | # Commuters | % Commuters |
| Less than 5 Minutes | 595 | 4.7% |
| 5 to 9 Minutes | 1,210 | 9.5% |
| 10 to 14 Minutes | 2,517 | 19.8% |
| 15 to 19 Minutes | 3,016 | 23.7% |
| 20 to 24 Minutes | 2,123 | 16.7% |
| 25 to 29 Minutes | 360 | 2.8% |
| 30 to 34 Minutes | 953 | 7.5% |
| 35 to 39 Minutes | 34 | 0.3% |
| 40 to 44 Minutes | 397 | 3.1% |
| 45 to 59 Minutes | 768 | 6.0% |
| 60 to 89 Minutes | 252 | 2.0% |
| 90 or more Minutes | 517 | 4.1% |
Commute Time by Sex in Hazleton
The most common commute times in Hazleton are 15 to 19 minutes (1,676 commuters, 24.0%) for males and 15 to 19 minutes (1,340 commuters, 23.2%) for females.
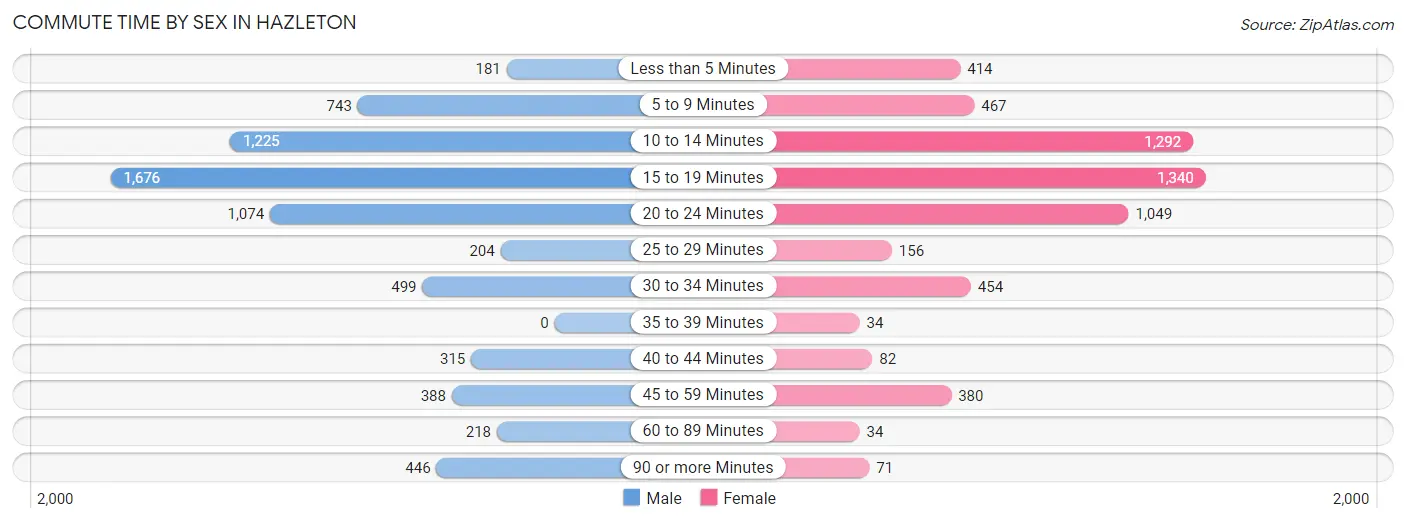
| Commute Time | Male | Female |
| Less than 5 Minutes | 181 (2.6%) | 414 (7.2%) |
| 5 to 9 Minutes | 743 (10.7%) | 467 (8.1%) |
| 10 to 14 Minutes | 1,225 (17.6%) | 1,292 (22.4%) |
| 15 to 19 Minutes | 1,676 (24.0%) | 1,340 (23.2%) |
| 20 to 24 Minutes | 1,074 (15.4%) | 1,049 (18.2%) |
| 25 to 29 Minutes | 204 (2.9%) | 156 (2.7%) |
| 30 to 34 Minutes | 499 (7.2%) | 454 (7.9%) |
| 35 to 39 Minutes | 0 (0.0%) | 34 (0.6%) |
| 40 to 44 Minutes | 315 (4.5%) | 82 (1.4%) |
| 45 to 59 Minutes | 388 (5.6%) | 380 (6.6%) |
| 60 to 89 Minutes | 218 (3.1%) | 34 (0.6%) |
| 90 or more Minutes | 446 (6.4%) | 71 (1.2%) |
Time of Departure to Work by Sex in Hazleton
The most frequent times of departure to work in Hazleton are 12:00 PM to 3:59 PM (1,387, 19.9%) for males and 12:00 PM to 3:59 PM (947, 16.4%) for females.
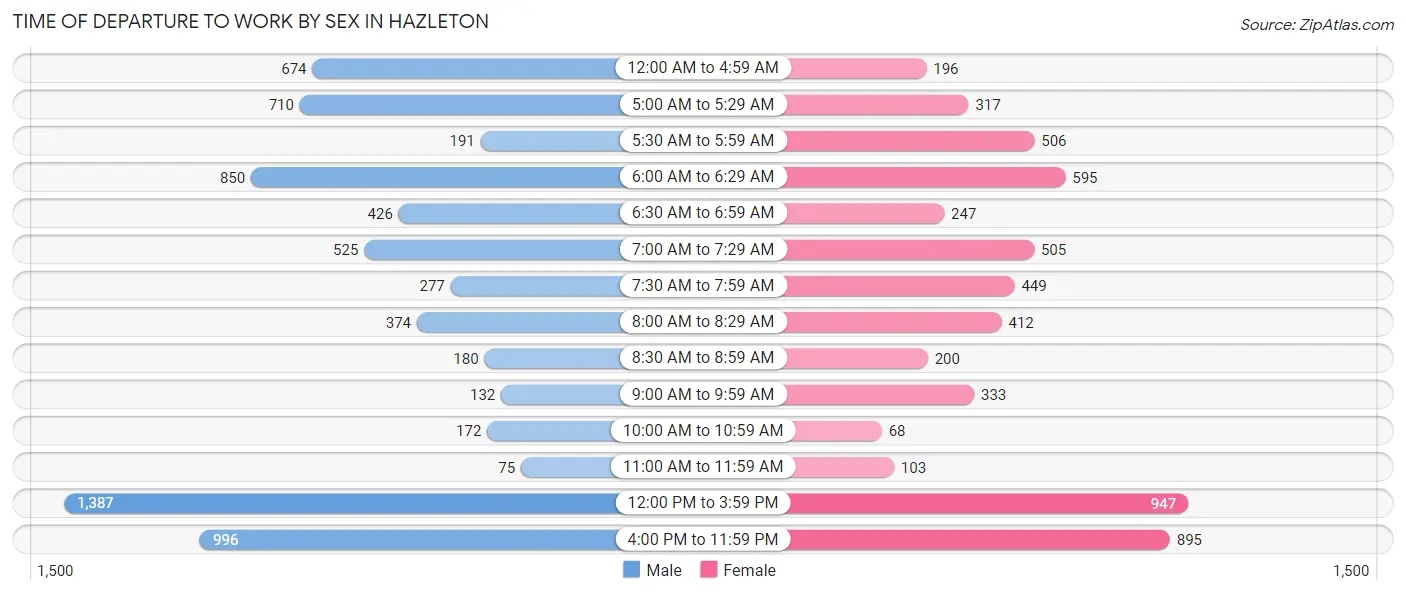
| Time of Departure | Male | Female |
| 12:00 AM to 4:59 AM | 674 (9.7%) | 196 (3.4%) |
| 5:00 AM to 5:29 AM | 710 (10.2%) | 317 (5.5%) |
| 5:30 AM to 5:59 AM | 191 (2.7%) | 506 (8.8%) |
| 6:00 AM to 6:29 AM | 850 (12.2%) | 595 (10.3%) |
| 6:30 AM to 6:59 AM | 426 (6.1%) | 247 (4.3%) |
| 7:00 AM to 7:29 AM | 525 (7.5%) | 505 (8.7%) |
| 7:30 AM to 7:59 AM | 277 (4.0%) | 449 (7.8%) |
| 8:00 AM to 8:29 AM | 374 (5.4%) | 412 (7.1%) |
| 8:30 AM to 8:59 AM | 180 (2.6%) | 200 (3.5%) |
| 9:00 AM to 9:59 AM | 132 (1.9%) | 333 (5.8%) |
| 10:00 AM to 10:59 AM | 172 (2.5%) | 68 (1.2%) |
| 11:00 AM to 11:59 AM | 75 (1.1%) | 103 (1.8%) |
| 12:00 PM to 3:59 PM | 1,387 (19.9%) | 947 (16.4%) |
| 4:00 PM to 11:59 PM | 996 (14.3%) | 895 (15.5%) |
| Total | 6,969 (100.0%) | 5,773 (100.0%) |
Housing Occupancy in Hazleton
Occupancy by Ownership in Hazleton
Of the total 11,333 dwellings in Hazleton, owner-occupied units account for 5,263 (46.4%), while renter-occupied units make up 6,070 (53.6%).
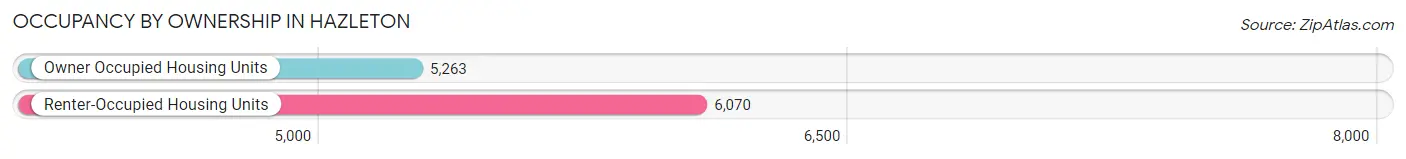
| Occupancy | # Housing Units | % Housing Units |
| Owner Occupied Housing Units | 5,263 | 46.4% |
| Renter-Occupied Housing Units | 6,070 | 53.6% |
| Total Occupied Housing Units | 11,333 | 100.0% |
Occupancy by Household Size in Hazleton
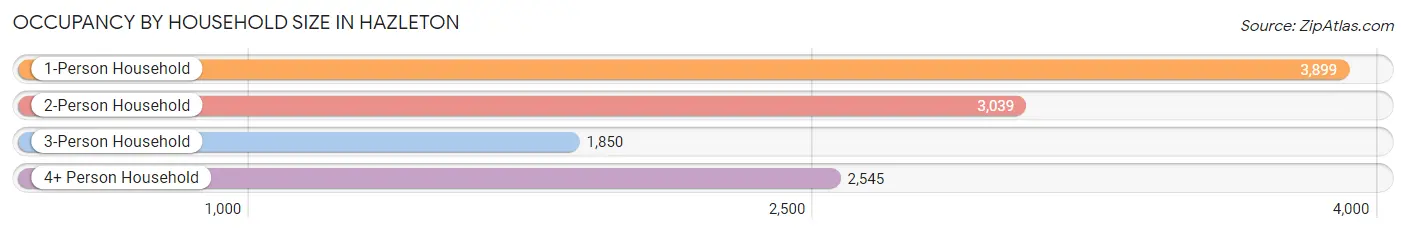
| Household Size | # Housing Units | % Housing Units |
| 1-Person Household | 3,899 | 34.4% |
| 2-Person Household | 3,039 | 26.8% |
| 3-Person Household | 1,850 | 16.3% |
| 4+ Person Household | 2,545 | 22.5% |
| Total Housing Units | 11,333 | 100.0% |
Occupancy by Ownership by Household Size in Hazleton
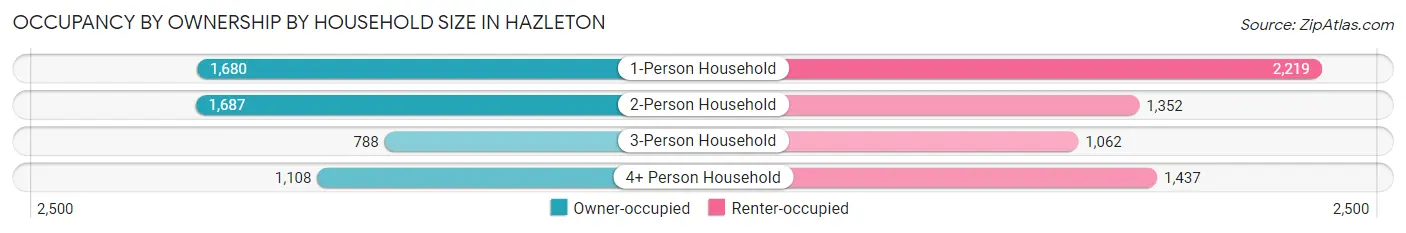
| Household Size | Owner-occupied | Renter-occupied |
| 1-Person Household | 1,680 (43.1%) | 2,219 (56.9%) |
| 2-Person Household | 1,687 (55.5%) | 1,352 (44.5%) |
| 3-Person Household | 788 (42.6%) | 1,062 (57.4%) |
| 4+ Person Household | 1,108 (43.5%) | 1,437 (56.5%) |
| Total Housing Units | 5,263 (46.4%) | 6,070 (53.6%) |
Occupancy by Educational Attainment in Hazleton
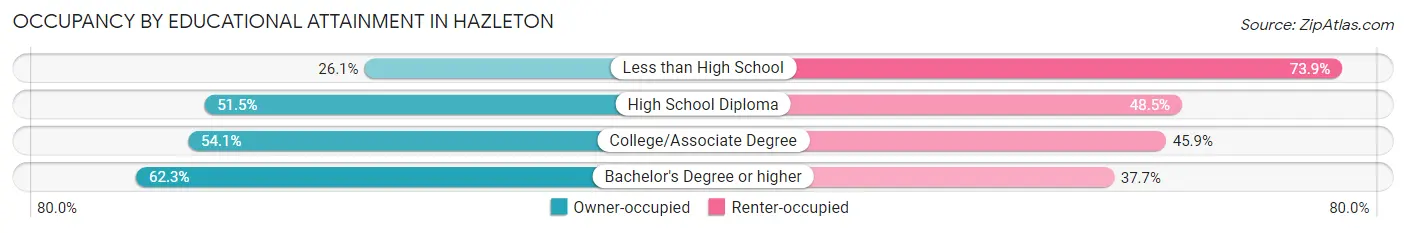
| Household Size | Owner-occupied | Renter-occupied |
| Less than High School | 810 (26.1%) | 2,292 (73.9%) |
| High School Diploma | 2,144 (51.5%) | 2,018 (48.5%) |
| College/Associate Degree | 1,484 (54.1%) | 1,261 (45.9%) |
| Bachelor's Degree or higher | 825 (62.3%) | 499 (37.7%) |
Occupancy by Age of Householder in Hazleton
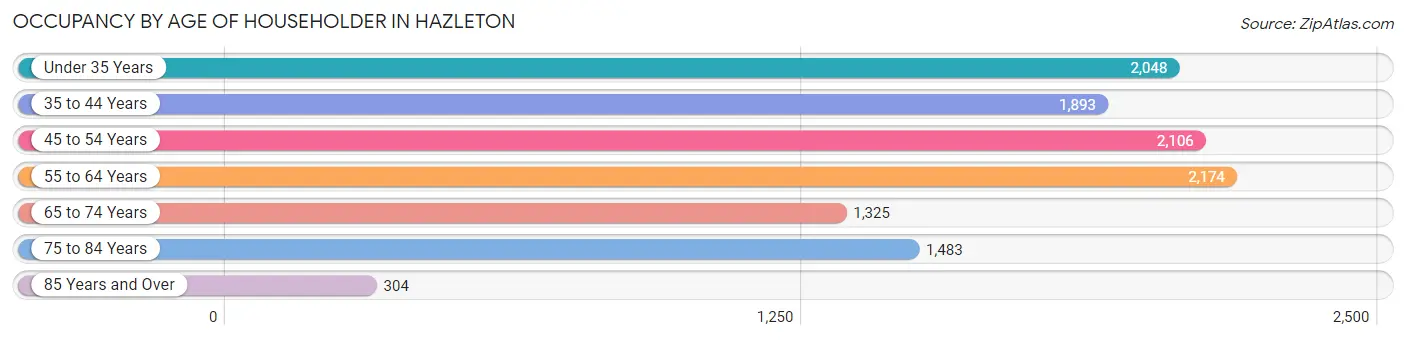
| Age Bracket | # Households | % Households |
| Under 35 Years | 2,048 | 18.1% |
| 35 to 44 Years | 1,893 | 16.7% |
| 45 to 54 Years | 2,106 | 18.6% |
| 55 to 64 Years | 2,174 | 19.2% |
| 65 to 74 Years | 1,325 | 11.7% |
| 75 to 84 Years | 1,483 | 13.1% |
| 85 Years and Over | 304 | 2.7% |
| Total | 11,333 | 100.0% |
Housing Finances in Hazleton
Median Income by Occupancy in Hazleton
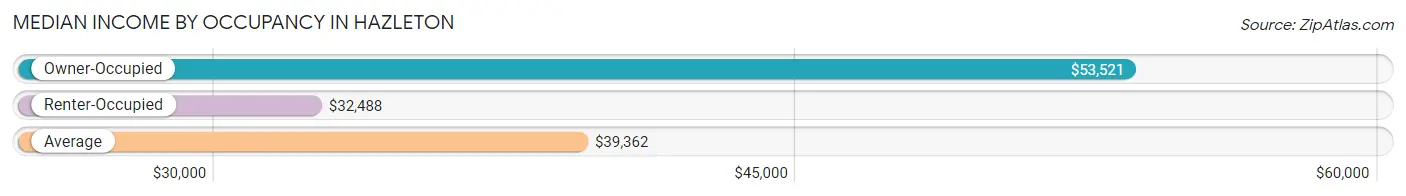
| Occupancy Type | # Households | Median Income |
| Owner-Occupied | 5,263 (46.4%) | $53,521 |
| Renter-Occupied | 6,070 (53.6%) | $32,488 |
| Average | 11,333 (100.0%) | $39,362 |
Occupancy by Householder Income Bracket in Hazleton
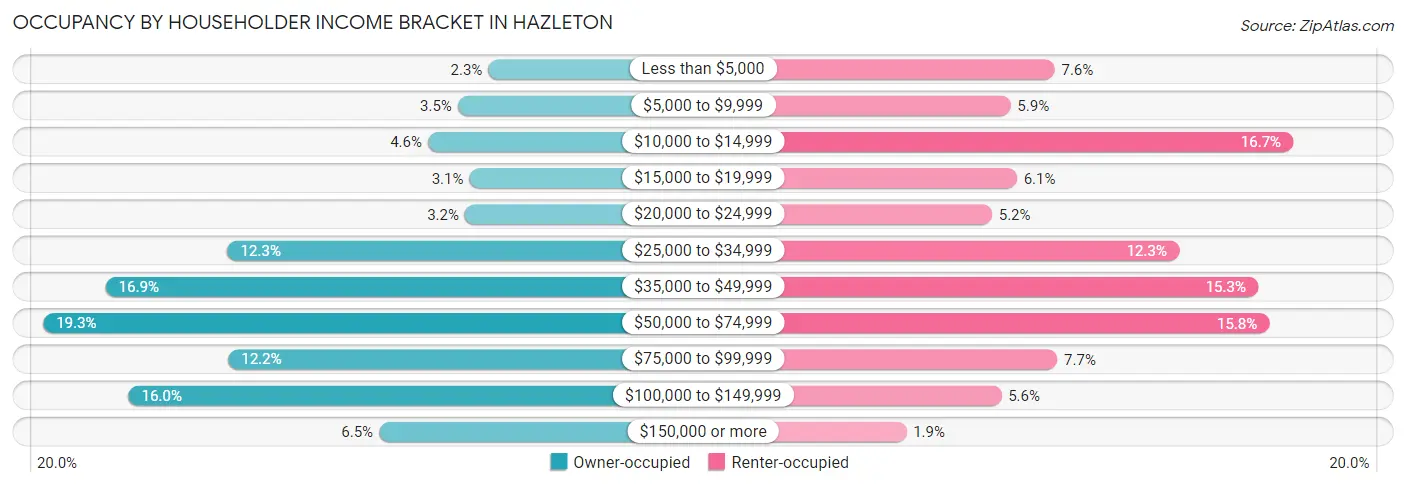
| Income Bracket | Owner-occupied | Renter-occupied |
| Less than $5,000 | 123 (2.3%) | 460 (7.6%) |
| $5,000 to $9,999 | 184 (3.5%) | 358 (5.9%) |
| $10,000 to $14,999 | 244 (4.6%) | 1,011 (16.7%) |
| $15,000 to $19,999 | 161 (3.1%) | 373 (6.1%) |
| $20,000 to $24,999 | 170 (3.2%) | 315 (5.2%) |
| $25,000 to $34,999 | 646 (12.3%) | 747 (12.3%) |
| $35,000 to $49,999 | 890 (16.9%) | 930 (15.3%) |
| $50,000 to $74,999 | 1,015 (19.3%) | 956 (15.8%) |
| $75,000 to $99,999 | 644 (12.2%) | 466 (7.7%) |
| $100,000 to $149,999 | 844 (16.0%) | 337 (5.6%) |
| $150,000 or more | 342 (6.5%) | 117 (1.9%) |
| Total | 5,263 (100.0%) | 6,070 (100.0%) |
Monthly Housing Cost Tiers in Hazleton
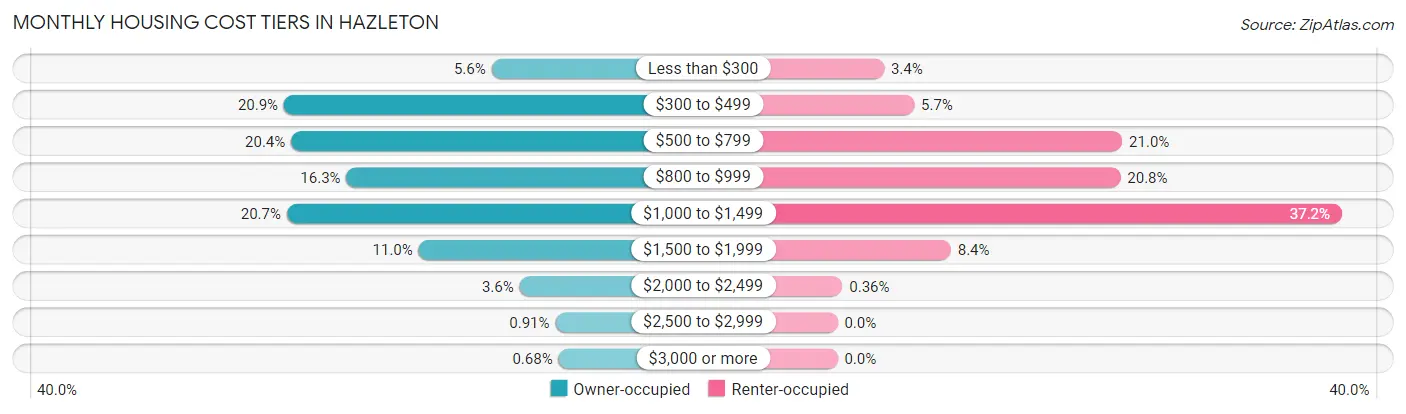
| Monthly Cost | Owner-occupied | Renter-occupied |
| Less than $300 | 295 (5.6%) | 208 (3.4%) |
| $300 to $499 | 1,100 (20.9%) | 343 (5.7%) |
| $500 to $799 | 1,072 (20.4%) | 1,273 (21.0%) |
| $800 to $999 | 858 (16.3%) | 1,265 (20.8%) |
| $1,000 to $1,499 | 1,089 (20.7%) | 2,255 (37.1%) |
| $1,500 to $1,999 | 578 (11.0%) | 507 (8.4%) |
| $2,000 to $2,499 | 187 (3.5%) | 22 (0.4%) |
| $2,500 to $2,999 | 48 (0.9%) | 0 (0.0%) |
| $3,000 or more | 36 (0.7%) | 0 (0.0%) |
| Total | 5,263 (100.0%) | 6,070 (100.0%) |
Physical Housing Characteristics in Hazleton
Housing Structures in Hazleton
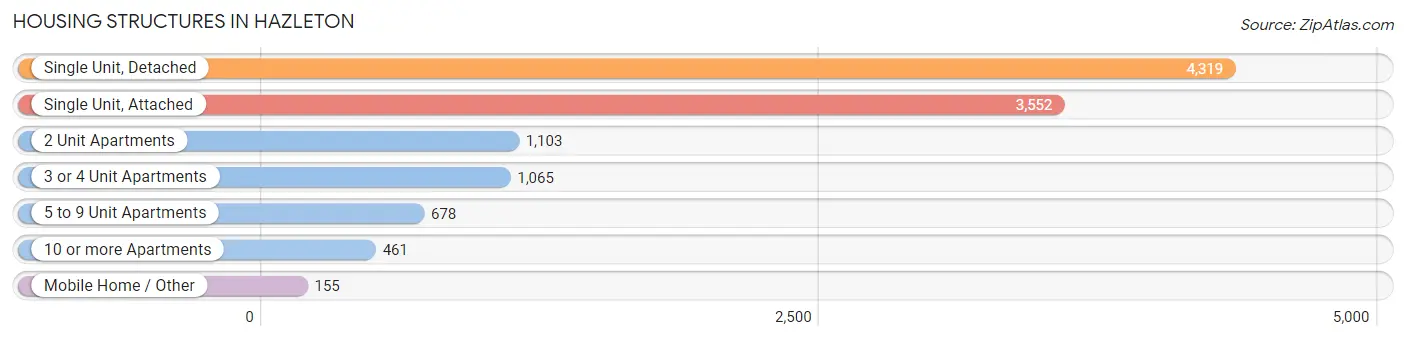
| Structure Type | # Housing Units | % Housing Units |
| Single Unit, Detached | 4,319 | 38.1% |
| Single Unit, Attached | 3,552 | 31.3% |
| 2 Unit Apartments | 1,103 | 9.7% |
| 3 or 4 Unit Apartments | 1,065 | 9.4% |
| 5 to 9 Unit Apartments | 678 | 6.0% |
| 10 or more Apartments | 461 | 4.1% |
| Mobile Home / Other | 155 | 1.4% |
| Total | 11,333 | 100.0% |
Housing Structures by Occupancy in Hazleton
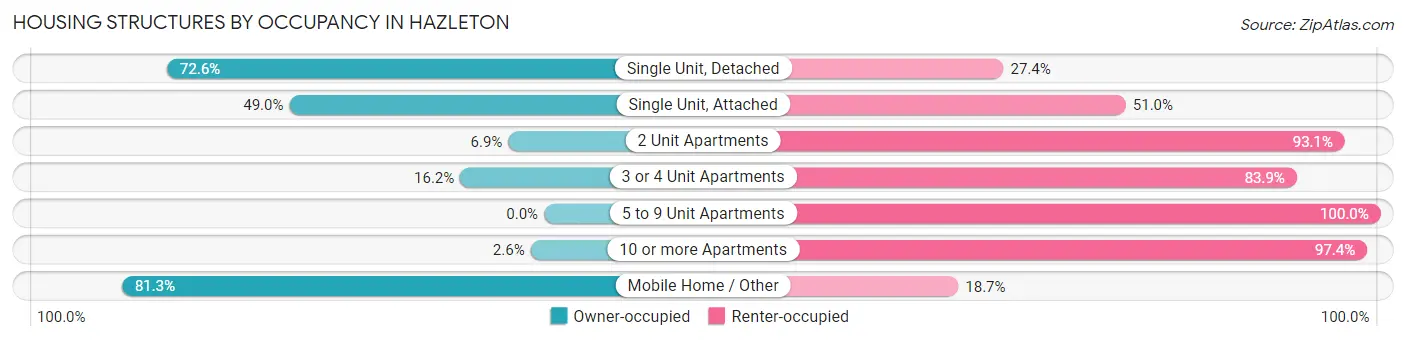
| Structure Type | Owner-occupied | Renter-occupied |
| Single Unit, Detached | 3,135 (72.6%) | 1,184 (27.4%) |
| Single Unit, Attached | 1,742 (49.0%) | 1,810 (51.0%) |
| 2 Unit Apartments | 76 (6.9%) | 1,027 (93.1%) |
| 3 or 4 Unit Apartments | 172 (16.2%) | 893 (83.9%) |
| 5 to 9 Unit Apartments | 0 (0.0%) | 678 (100.0%) |
| 10 or more Apartments | 12 (2.6%) | 449 (97.4%) |
| Mobile Home / Other | 126 (81.3%) | 29 (18.7%) |
| Total | 5,263 (46.4%) | 6,070 (53.6%) |
Housing Structures by Number of Rooms in Hazleton
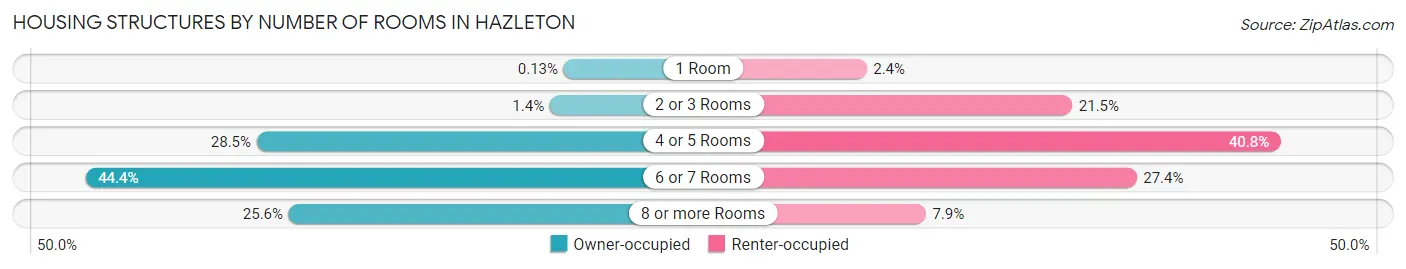
| Number of Rooms | Owner-occupied | Renter-occupied |
| 1 Room | 7 (0.1%) | 148 (2.4%) |
| 2 or 3 Rooms | 74 (1.4%) | 1,302 (21.4%) |
| 4 or 5 Rooms | 1,501 (28.5%) | 2,476 (40.8%) |
| 6 or 7 Rooms | 2,336 (44.4%) | 1,664 (27.4%) |
| 8 or more Rooms | 1,345 (25.6%) | 480 (7.9%) |
| Total | 5,263 (100.0%) | 6,070 (100.0%) |
Housing Structure by Heating Type in Hazleton
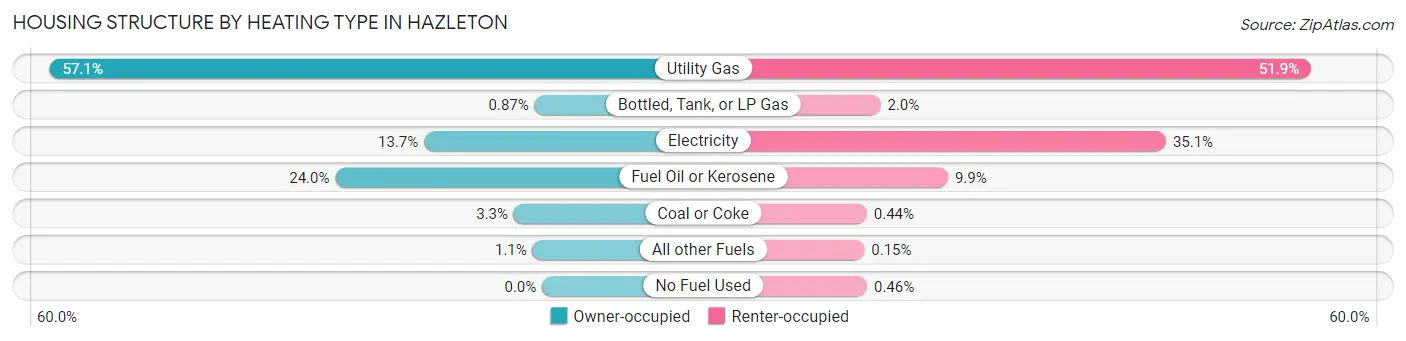
| Heating Type | Owner-occupied | Renter-occupied |
| Utility Gas | 3,005 (57.1%) | 3,153 (51.9%) |
| Bottled, Tank, or LP Gas | 46 (0.9%) | 123 (2.0%) |
| Electricity | 720 (13.7%) | 2,132 (35.1%) |
| Fuel Oil or Kerosene | 1,262 (24.0%) | 598 (9.9%) |
| Coal or Coke | 172 (3.3%) | 27 (0.4%) |
| All other Fuels | 58 (1.1%) | 9 (0.2%) |
| No Fuel Used | 0 (0.0%) | 28 (0.5%) |
| Total | 5,263 (100.0%) | 6,070 (100.0%) |
Household Vehicle Usage in Hazleton
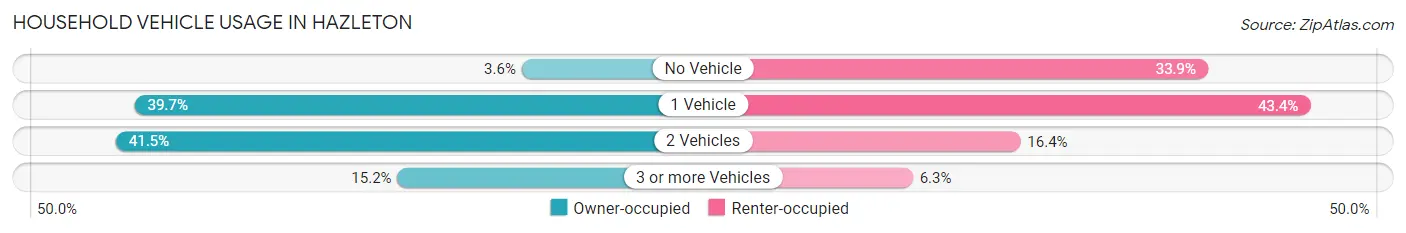
| Vehicles per Household | Owner-occupied | Renter-occupied |
| No Vehicle | 189 (3.6%) | 2,056 (33.9%) |
| 1 Vehicle | 2,091 (39.7%) | 2,636 (43.4%) |
| 2 Vehicles | 2,183 (41.5%) | 994 (16.4%) |
| 3 or more Vehicles | 800 (15.2%) | 384 (6.3%) |
| Total | 5,263 (100.0%) | 6,070 (100.0%) |
Real Estate & Mortgages in Hazleton
Real Estate and Mortgage Overview in Hazleton
| Characteristic | Without Mortgage | With Mortgage |
| Housing Units | 2,749 | 2,514 |
| Median Property Value | $106,400 | $130,900 |
| Median Household Income | $44,868 | $207 |
| Monthly Housing Costs | $497 | $18 |
| Real Estate Taxes | $1,477 | $41 |
Property Value by Mortgage Status in Hazleton
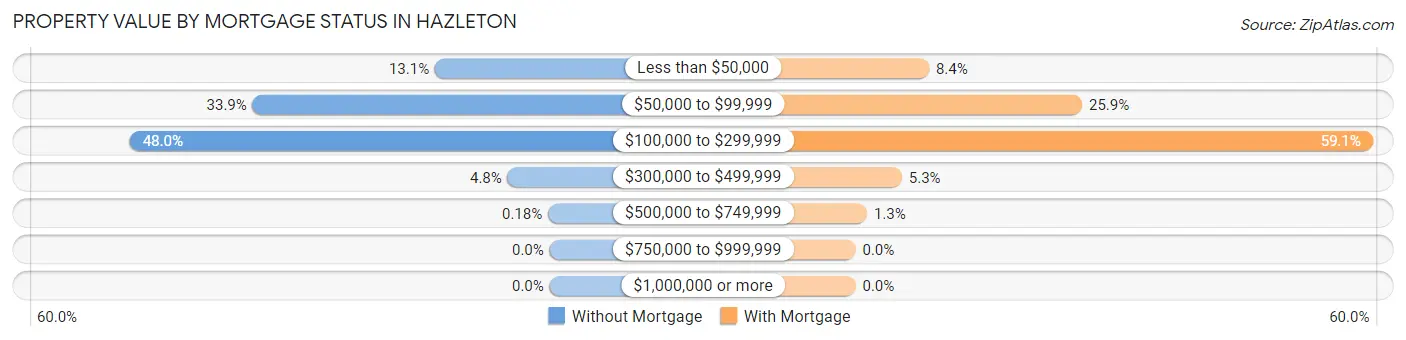
| Property Value | Without Mortgage | With Mortgage |
| Less than $50,000 | 360 (13.1%) | 211 (8.4%) |
| $50,000 to $99,999 | 933 (33.9%) | 651 (25.9%) |
| $100,000 to $299,999 | 1,319 (48.0%) | 1,486 (59.1%) |
| $300,000 to $499,999 | 132 (4.8%) | 133 (5.3%) |
| $500,000 to $749,999 | 5 (0.2%) | 33 (1.3%) |
| $750,000 to $999,999 | 0 (0.0%) | 0 (0.0%) |
| $1,000,000 or more | 0 (0.0%) | 0 (0.0%) |
| Total | 2,749 (100.0%) | 2,514 (100.0%) |
Household Income by Mortgage Status in Hazleton
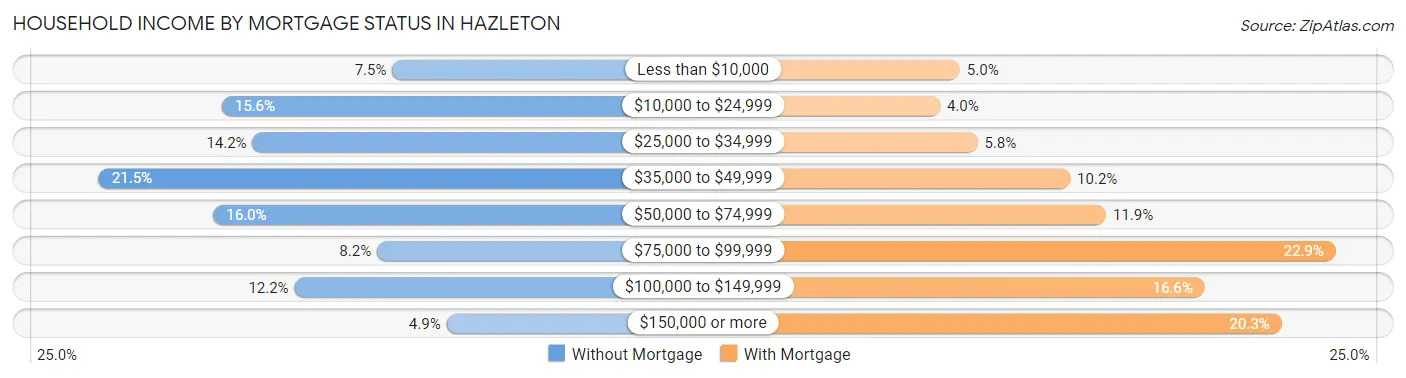
| Household Income | Without Mortgage | With Mortgage |
| Less than $10,000 | 206 (7.5%) | 125 (5.0%) |
| $10,000 to $24,999 | 429 (15.6%) | 101 (4.0%) |
| $25,000 to $34,999 | 389 (14.1%) | 146 (5.8%) |
| $35,000 to $49,999 | 590 (21.5%) | 257 (10.2%) |
| $50,000 to $74,999 | 440 (16.0%) | 300 (11.9%) |
| $75,000 to $99,999 | 226 (8.2%) | 575 (22.9%) |
| $100,000 to $149,999 | 334 (12.1%) | 418 (16.6%) |
| $150,000 or more | 135 (4.9%) | 510 (20.3%) |
| Total | 2,749 (100.0%) | 2,514 (100.0%) |
Property Value to Household Income Ratio in Hazleton
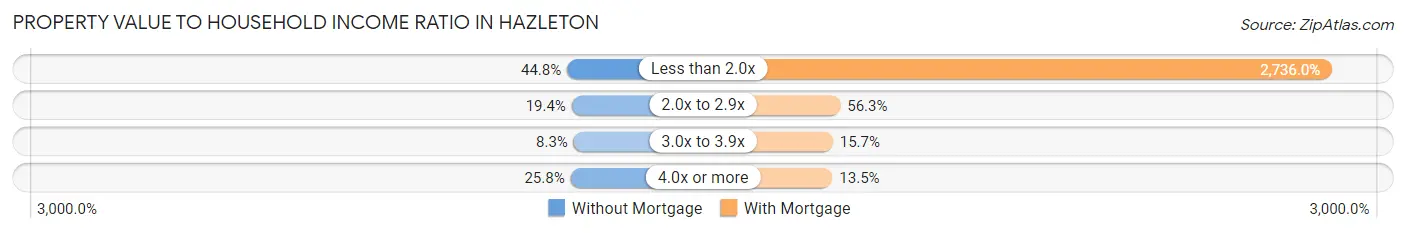
| Value-to-Income Ratio | Without Mortgage | With Mortgage |
| Less than 2.0x | 1,231 (44.8%) | 68,783 (2,736.0%) |
| 2.0x to 2.9x | 532 (19.4%) | 1,416 (56.3%) |
| 3.0x to 3.9x | 228 (8.3%) | 395 (15.7%) |
| 4.0x or more | 710 (25.8%) | 340 (13.5%) |
| Total | 2,749 (100.0%) | 2,514 (100.0%) |
Real Estate Taxes by Mortgage Status in Hazleton
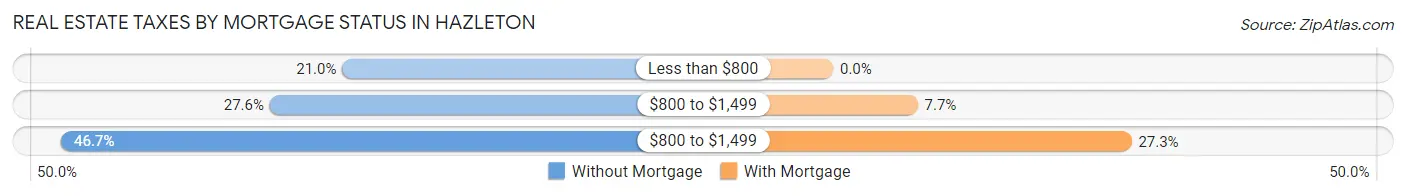
| Property Taxes | Without Mortgage | With Mortgage |
| Less than $800 | 577 (21.0%) | 0 (0.0%) |
| $800 to $1,499 | 759 (27.6%) | 194 (7.7%) |
| $800 to $1,499 | 1,283 (46.7%) | 685 (27.3%) |
| Total | 2,749 (100.0%) | 2,514 (100.0%) |
Health & Disability in Hazleton
Health Insurance Coverage by Age in Hazleton
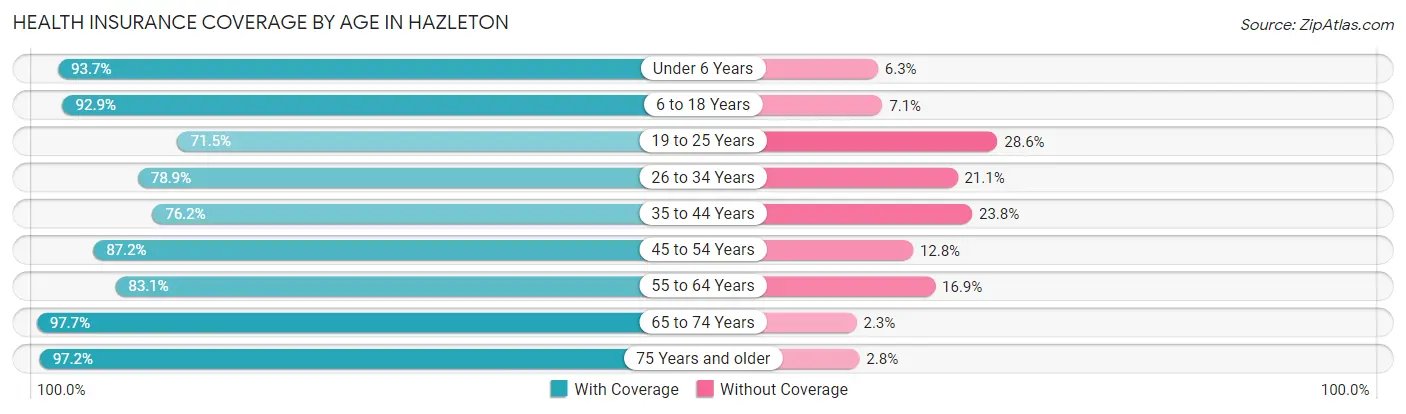
| Age Bracket | With Coverage | Without Coverage |
| Under 6 Years | 2,173 (93.7%) | 145 (6.3%) |
| 6 to 18 Years | 5,001 (92.9%) | 382 (7.1%) |
| 19 to 25 Years | 2,250 (71.5%) | 899 (28.5%) |
| 26 to 34 Years | 2,541 (78.9%) | 680 (21.1%) |
| 35 to 44 Years | 2,795 (76.2%) | 874 (23.8%) |
| 45 to 54 Years | 3,290 (87.2%) | 483 (12.8%) |
| 55 to 64 Years | 2,900 (83.1%) | 591 (16.9%) |
| 65 to 74 Years | 1,970 (97.7%) | 46 (2.3%) |
| 75 Years and older | 2,343 (97.2%) | 68 (2.8%) |
| Total | 25,263 (85.8%) | 4,168 (14.2%) |
Health Insurance Coverage by Citizenship Status in Hazleton
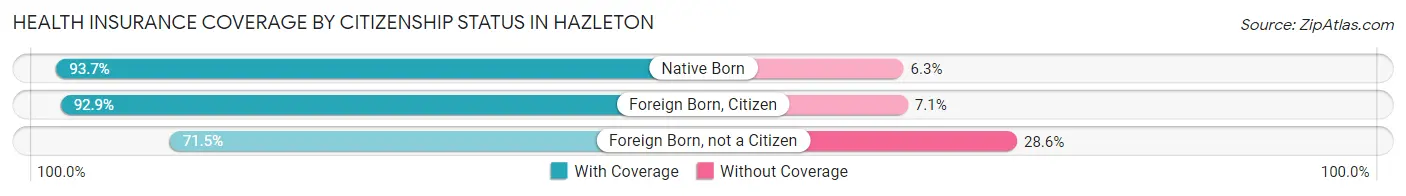
| Citizenship Status | With Coverage | Without Coverage |
| Native Born | 2,173 (93.7%) | 145 (6.3%) |
| Foreign Born, Citizen | 5,001 (92.9%) | 382 (7.1%) |
| Foreign Born, not a Citizen | 2,250 (71.5%) | 899 (28.5%) |
Health Insurance Coverage by Household Income in Hazleton
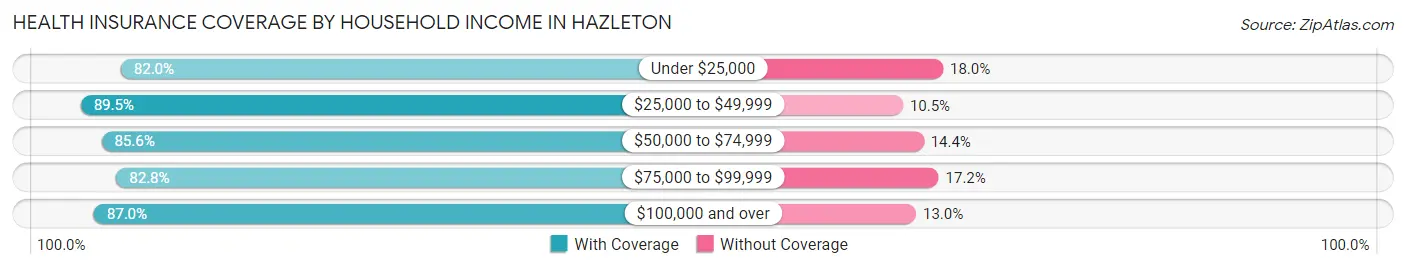
| Household Income | With Coverage | Without Coverage |
| Under $25,000 | 4,875 (82.0%) | 1,073 (18.0%) |
| $25,000 to $49,999 | 6,565 (89.5%) | 772 (10.5%) |
| $50,000 to $74,999 | 5,470 (85.6%) | 921 (14.4%) |
| $75,000 to $99,999 | 2,758 (82.8%) | 573 (17.2%) |
| $100,000 and over | 5,546 (87.0%) | 827 (13.0%) |
Public vs Private Health Insurance Coverage by Age in Hazleton
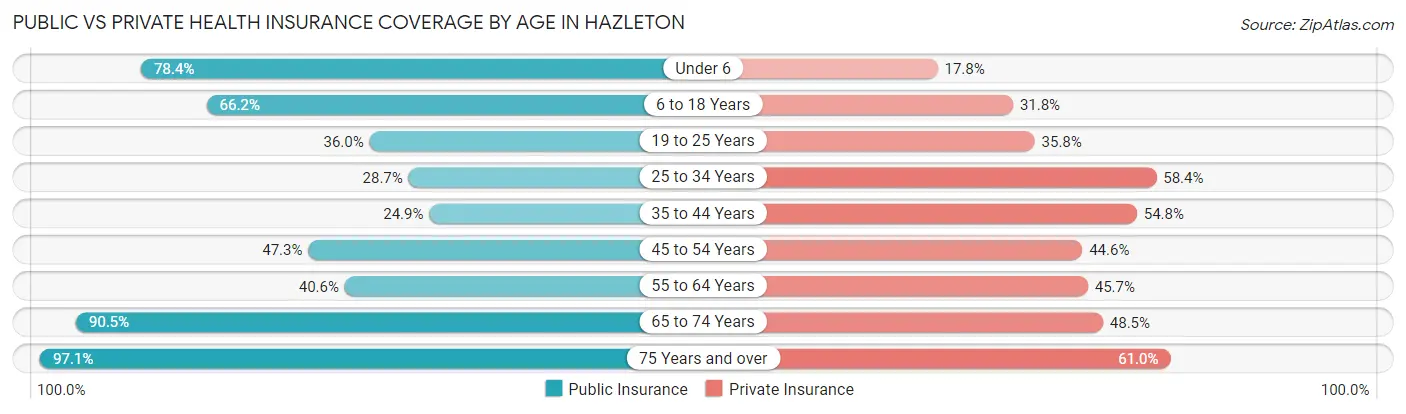
| Age Bracket | Public Insurance | Private Insurance |
| Under 6 | 1,817 (78.4%) | 412 (17.8%) |
| 6 to 18 Years | 3,564 (66.2%) | 1,710 (31.8%) |
| 19 to 25 Years | 1,133 (36.0%) | 1,127 (35.8%) |
| 25 to 34 Years | 925 (28.7%) | 1,880 (58.4%) |
| 35 to 44 Years | 913 (24.9%) | 2,009 (54.8%) |
| 45 to 54 Years | 1,786 (47.3%) | 1,684 (44.6%) |
| 55 to 64 Years | 1,416 (40.6%) | 1,594 (45.7%) |
| 65 to 74 Years | 1,824 (90.5%) | 977 (48.5%) |
| 75 Years and over | 2,342 (97.1%) | 1,470 (61.0%) |
| Total | 15,720 (53.4%) | 12,863 (43.7%) |
Disability Status by Sex by Age in Hazleton
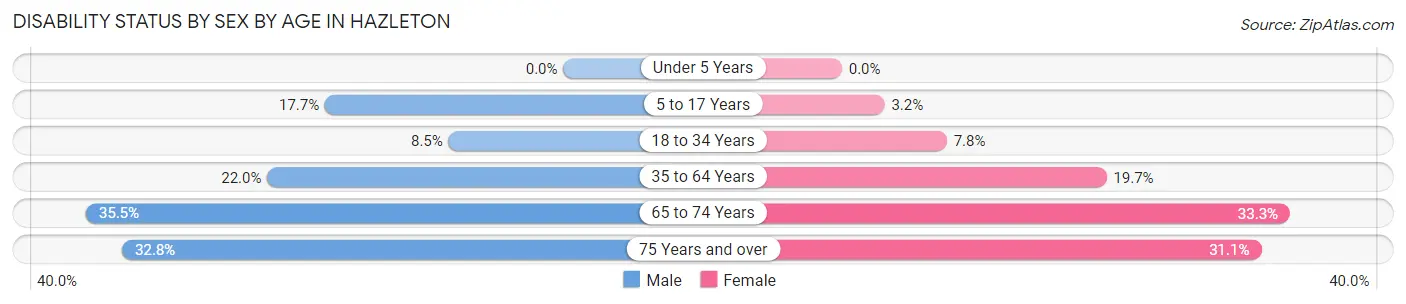
| Age Bracket | Male | Female |
| Under 5 Years | 0 (0.0%) | 0 (0.0%) |
| 5 to 17 Years | 499 (17.7%) | 82 (3.2%) |
| 18 to 34 Years | 317 (8.5%) | 243 (7.8%) |
| 35 to 64 Years | 1,234 (22.0%) | 1,045 (19.7%) |
| 65 to 74 Years | 313 (35.4%) | 377 (33.3%) |
| 75 Years and over | 347 (32.8%) | 421 (31.1%) |
Disability Class by Sex by Age in Hazleton
Disability Class: Hearing Difficulty
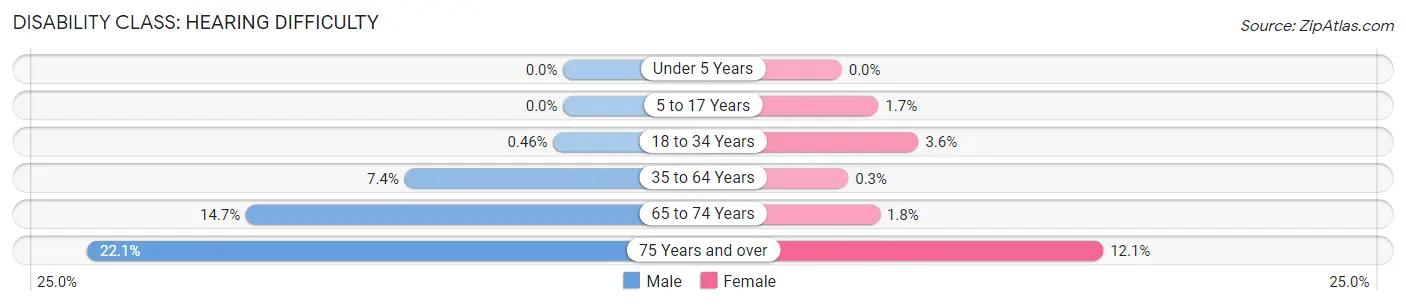
| Age Bracket | Male | Female |
| Under 5 Years | 0 (0.0%) | 0 (0.0%) |
| 5 to 17 Years | 0 (0.0%) | 44 (1.7%) |
| 18 to 34 Years | 17 (0.5%) | 111 (3.6%) |
| 35 to 64 Years | 413 (7.4%) | 16 (0.3%) |
| 65 to 74 Years | 130 (14.7%) | 20 (1.8%) |
| 75 Years and over | 234 (22.1%) | 164 (12.1%) |
Disability Class: Vision Difficulty
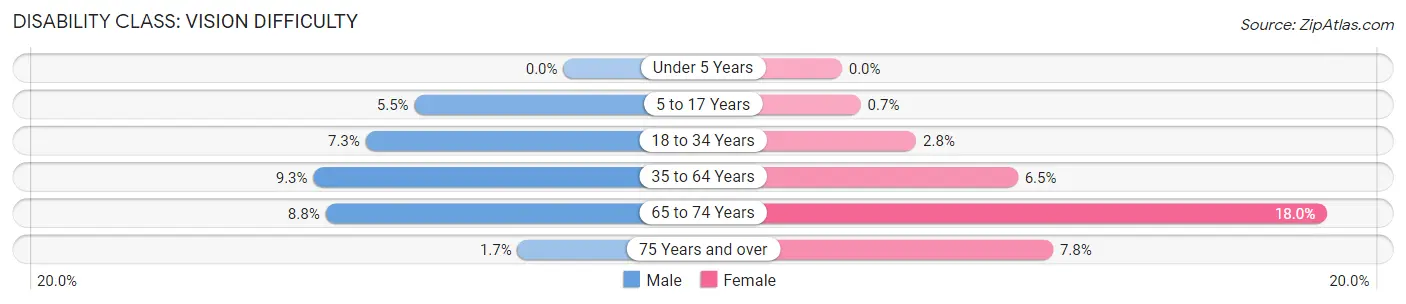
| Age Bracket | Male | Female |
| Under 5 Years | 0 (0.0%) | 0 (0.0%) |
| 5 to 17 Years | 156 (5.5%) | 18 (0.7%) |
| 18 to 34 Years | 273 (7.3%) | 86 (2.8%) |
| 35 to 64 Years | 521 (9.3%) | 347 (6.5%) |
| 65 to 74 Years | 78 (8.8%) | 204 (18.0%) |
| 75 Years and over | 18 (1.7%) | 106 (7.8%) |
Disability Class: Cognitive Difficulty
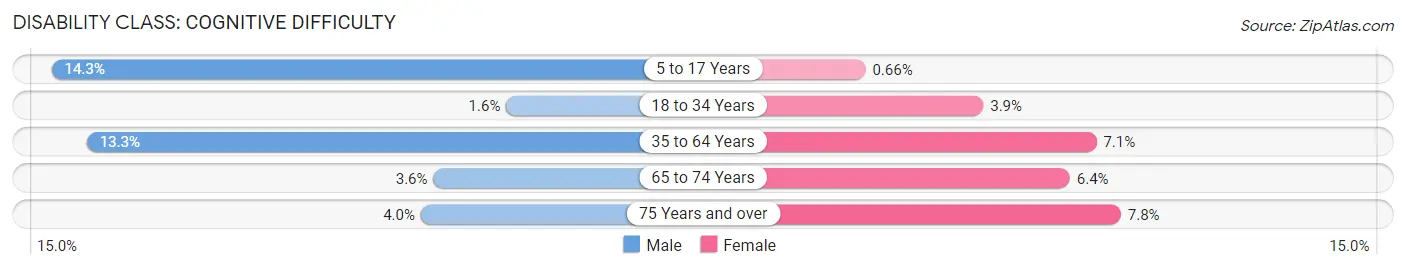
| Age Bracket | Male | Female |
| 5 to 17 Years | 402 (14.2%) | 17 (0.7%) |
| 18 to 34 Years | 59 (1.6%) | 123 (3.9%) |
| 35 to 64 Years | 745 (13.3%) | 377 (7.1%) |
| 65 to 74 Years | 32 (3.6%) | 72 (6.4%) |
| 75 Years and over | 42 (4.0%) | 105 (7.8%) |
Disability Class: Ambulatory Difficulty
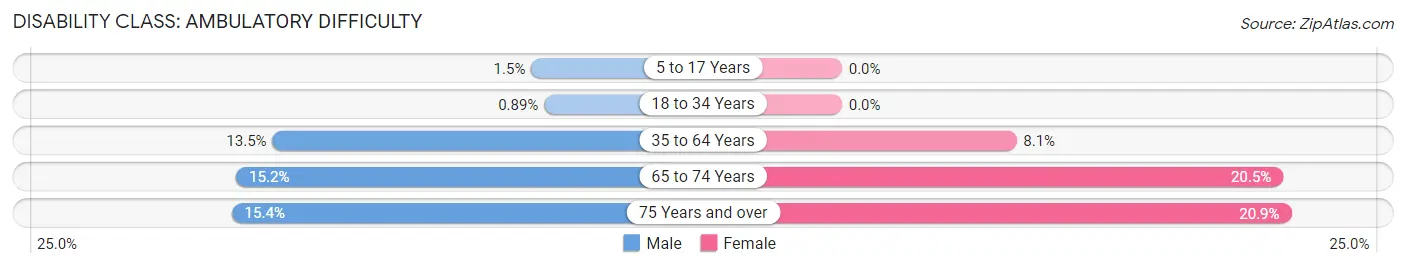
| Age Bracket | Male | Female |
| 5 to 17 Years | 42 (1.5%) | 0 (0.0%) |
| 18 to 34 Years | 33 (0.9%) | 0 (0.0%) |
| 35 to 64 Years | 758 (13.5%) | 431 (8.1%) |
| 65 to 74 Years | 134 (15.2%) | 232 (20.5%) |
| 75 Years and over | 163 (15.4%) | 282 (20.9%) |
Disability Class: Self-Care Difficulty
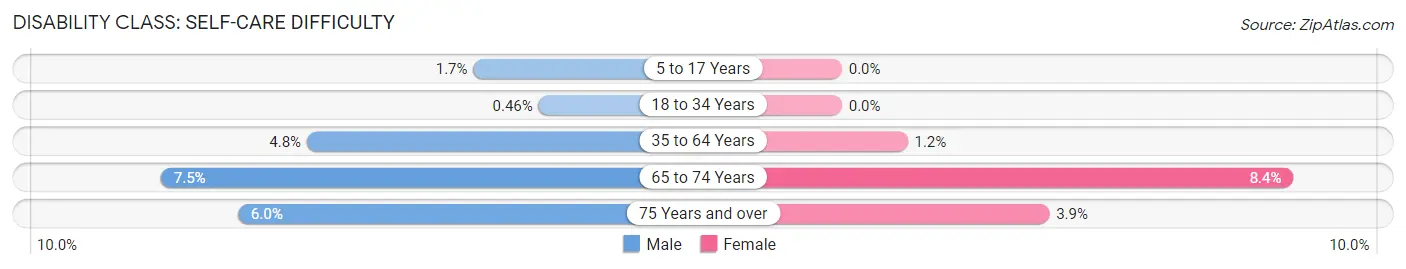
| Age Bracket | Male | Female |
| 5 to 17 Years | 47 (1.7%) | 0 (0.0%) |
| 18 to 34 Years | 17 (0.5%) | 0 (0.0%) |
| 35 to 64 Years | 267 (4.8%) | 65 (1.2%) |
| 65 to 74 Years | 66 (7.5%) | 95 (8.4%) |
| 75 Years and over | 64 (6.0%) | 52 (3.8%) |
Technology Access in Hazleton
Computing Device Access in Hazleton
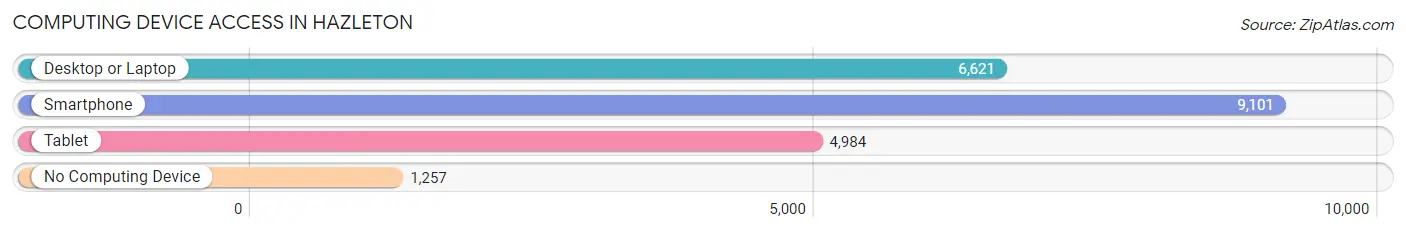
| Device Type | # Households | % Households |
| Desktop or Laptop | 6,621 | 58.4% |
| Smartphone | 9,101 | 80.3% |
| Tablet | 4,984 | 44.0% |
| No Computing Device | 1,257 | 11.1% |
| Total | 11,333 | 100.0% |
Internet Access in Hazleton
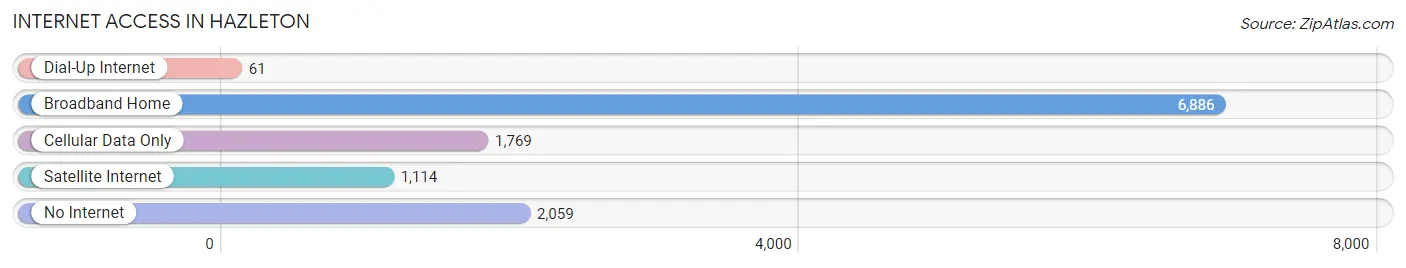
| Internet Type | # Households | % Households |
| Dial-Up Internet | 61 | 0.5% |
| Broadband Home | 6,886 | 60.8% |
| Cellular Data Only | 1,769 | 15.6% |
| Satellite Internet | 1,114 | 9.8% |
| No Internet | 2,059 | 18.2% |
| Total | 11,333 | 100.0% |
Hazleton Summary
Hazleton, Pennsylvania is a city located in Luzerne County in the northeastern part of the state. It is situated in the foothills of the Pocono Mountains and is part of the Scranton-Wilkes-Barre metropolitan area. The city has a population of approximately 25,000 people and is the second largest city in Luzerne County.
Geography
Hazleton is located in the foothills of the Pocono Mountains in northeastern Pennsylvania. The city is situated in the Hazleton-West Hazleton area, which is part of the larger Scranton-Wilkes-Barre metropolitan area. The city is located at an elevation of 1,400 feet above sea level and is surrounded by mountains on all sides. The city is located in the Susquehanna River Valley and is bordered by the Lehigh River to the east and the Lackawanna River to the west.
The city is divided into two sections, the East Side and the West Side. The East Side is the older part of the city and is home to the downtown area. The West Side is the newer part of the city and is home to the Hazleton Mall and other shopping centers.
History
Hazleton was founded in 1856 by William H. Hazleton, a coal miner from England. The city was originally known as Hazle Township and was incorporated as a borough in 1866. The city was named after William H. Hazleton and was the first city in the United States to be named after an individual.
The city grew rapidly in the late 19th and early 20th centuries due to the coal mining industry. The city was home to several large coal mines, including the Hazleton Coal Company, the Lehigh Valley Coal Company, and the Hazleton Coal and Iron Company. The city was also home to several large manufacturing companies, including the Hazleton Shoe Company and the Hazleton Textile Company.
The city experienced a decline in the mid-20th century due to the decline of the coal mining industry and the closure of many of the city’s manufacturing companies. The city has since experienced a resurgence in recent years due to the growth of the service industry and the development of the Hazleton Area School District.
Economy
Hazleton’s economy is largely based on the service industry. The city is home to several large employers, including the Hazleton Area School District, Lehigh Valley Health Network, and the Hazleton Area Public Library. The city is also home to several retail stores, restaurants, and other businesses.
The city is also home to several manufacturing companies, including the Hazleton Shoe Company and the Hazleton Textile Company. The city is also home to several coal mines, including the Hazleton Coal Company, the Lehigh Valley Coal Company, and the Hazleton Coal and Iron Company.
Demographics
As of the 2010 census, the population of Hazleton was 25,340. The city has a population density of 1,845 people per square mile. The racial makeup of the city is 87.3% White, 5.3% African American, 0.3% Native American, 0.7% Asian, 0.1% Pacific Islander, 4.2% from other races, and 2.2% from two or more races.
The median household income in Hazleton is $35,945 and the median family income is $41,945. The per capita income in Hazleton is $17,845. The city has a poverty rate of 28.3%.
Conclusion
Hazleton, Pennsylvania is a city located in Luzerne County in the northeastern part of the state. It is situated in the foothills of the Pocono Mountains and is part of the Scranton-Wilkes-Barre metropolitan area. The city has a population of approximately 25,000 people and is the second largest city in Luzerne County. The city’s economy is largely based on the service industry and the city is home to several large employers, including the Hazleton Area School District, Lehigh Valley Health Network, and the Hazleton Area Public Library. The city has a population that is 87.3% White, 5.3% African American, 0.3% Native American, 0.7% Asian, 0.1% Pacific Islander, 4.2% from other races, and 2.2% from two or more races. The median household income in Hazleton is $35,945 and the median family income is $41,945. The per capita income in Hazleton is $17,845. The city has a poverty rate of 28.3%.
Common Questions
What is Per Capita Income in Hazleton?
Per Capita income in Hazleton is $21,876.
What is the Median Family Income in Hazleton?
Median Family Income in Hazleton is $49,164.
What is the Median Household income in Hazleton?
Median Household Income in Hazleton is $39,362.
What is Income or Wage Gap in Hazleton?
Income or Wage Gap in Hazleton is 36.3%.
Women in Hazleton earn 63.7 cents for every dollar earned by a man.
What is Family Income Deficit in Hazleton?
Family Income Deficit in Hazleton is $10,296.
Families that are below poverty line in Hazleton earn $10,296 less on average than the poverty threshold level.
What is Inequality or Gini Index in Hazleton?
Inequality or Gini Index in Hazleton is 0.46.
What is the Total Population of Hazleton?
Total Population of Hazleton is 29,671.
What is the Total Male Population of Hazleton?
Total Male Population of Hazleton is 15,162.
What is the Total Female Population of Hazleton?
Total Female Population of Hazleton is 14,509.
What is the Ratio of Males per 100 Females in Hazleton?
There are 104.50 Males per 100 Females in Hazleton.
What is the Ratio of Females per 100 Males in Hazleton?
There are 95.69 Females per 100 Males in Hazleton.
What is the Median Population Age in Hazleton?
Median Population Age in Hazleton is 37.1 Years.
What is the Average Family Size in Hazleton
Average Family Size in Hazleton is 3.2 People.
What is the Average Household Size in Hazleton
Average Household Size in Hazleton is 2.6 People.
How Large is the Labor Force in Hazleton?
There are 14,487 People in the Labor Forcein in Hazleton.
What is the Percentage of People in the Labor Force in Hazleton?
61.8% of People are in the Labor Force in Hazleton.
What is the Unemployment Rate in Hazleton?
Unemployment Rate in Hazleton is 6.9%.