Avon, PA Map & Demographics
Avon Map
Avon Overview
$32,800
PER CAPITA INCOME
$85,833
AVG FAMILY INCOME
$63,672
AVG HOUSEHOLD INCOME
19.4%
WAGE / INCOME GAP [ % ]
80.6¢/ $1
WAGE / INCOME GAP [ $ ]
0.36
INEQUALITY / GINI INDEX
1,401
TOTAL POPULATION
677
MALE POPULATION
724
FEMALE POPULATION
93.51
MALES / 100 FEMALES
106.94
FEMALES / 100 MALES
50.3
MEDIAN AGE
2.8
AVG FAMILY SIZE
2.3
AVG HOUSEHOLD SIZE
779
LABOR FORCE [ PEOPLE ]
64.3%
PERCENT IN LABOR FORCE
3.1%
UNEMPLOYMENT RATE
Income in Avon
Income Overview in Avon
Per Capita Income in Avon is $32,800, while median incomes of families and households are $85,833 and $63,672 respectively.
| Characteristic | Number | Measure |
| Per Capita Income | 1,401 | $32,800 |
| Median Family Income | 384 | $85,833 |
| Mean Family Income | 384 | $91,927 |
| Median Household Income | 601 | $63,672 |
| Mean Household Income | 601 | $74,070 |
| Income Deficit | 384 | $0 |
| Wage / Income Gap (%) | 1,401 | 19.43% |
| Wage / Income Gap ($) | 1,401 | 80.57¢ per $1 |
| Gini / Inequality Index | 1,401 | 0.36 |
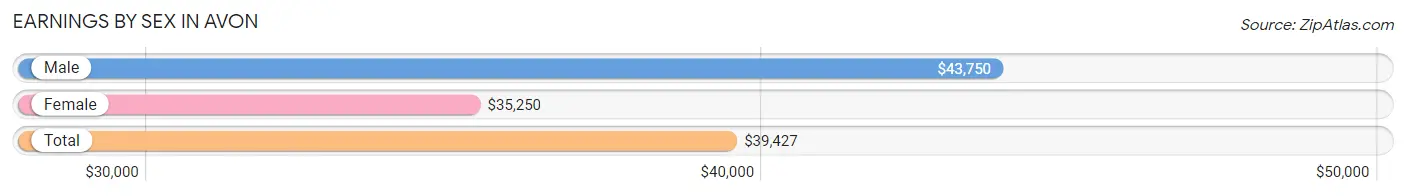
Earnings by Sex in Avon
Average Earnings in Avon are $39,427, $43,750 for men and $35,250 for women, a difference of 19.4%.
| Sex | Number | Average Earnings |
| Male | 464 (56.4%) | $43,750 |
| Female | 359 (43.6%) | $35,250 |
| Total | 823 (100.0%) | $39,427 |
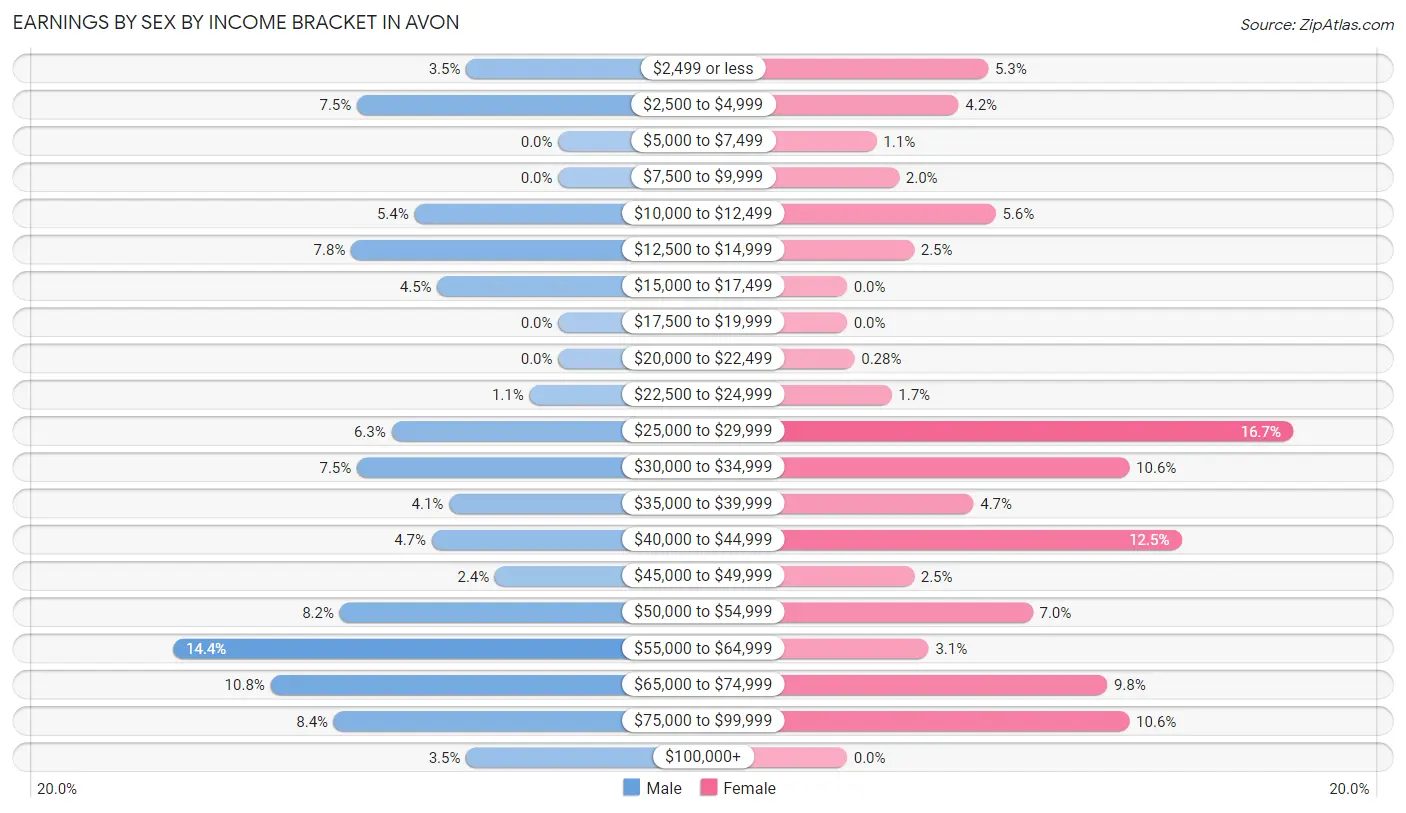
Earnings by Sex by Income Bracket in Avon
The most common earnings brackets in Avon are $55,000 to $64,999 for men (67 | 14.4%) and $25,000 to $29,999 for women (60 | 16.7%).
| Income | Male | Female |
| $2,499 or less | 16 (3.5%) | 19 (5.3%) |
| $2,500 to $4,999 | 35 (7.5%) | 15 (4.2%) |
| $5,000 to $7,499 | 0 (0.0%) | 4 (1.1%) |
| $7,500 to $9,999 | 0 (0.0%) | 7 (1.9%) |
| $10,000 to $12,499 | 25 (5.4%) | 20 (5.6%) |
| $12,500 to $14,999 | 36 (7.8%) | 9 (2.5%) |
| $15,000 to $17,499 | 21 (4.5%) | 0 (0.0%) |
| $17,500 to $19,999 | 0 (0.0%) | 0 (0.0%) |
| $20,000 to $22,499 | 0 (0.0%) | 1 (0.3%) |
| $22,500 to $24,999 | 5 (1.1%) | 6 (1.7%) |
| $25,000 to $29,999 | 29 (6.2%) | 60 (16.7%) |
| $30,000 to $34,999 | 35 (7.5%) | 38 (10.6%) |
| $35,000 to $39,999 | 19 (4.1%) | 17 (4.7%) |
| $40,000 to $44,999 | 22 (4.7%) | 45 (12.5%) |
| $45,000 to $49,999 | 11 (2.4%) | 9 (2.5%) |
| $50,000 to $54,999 | 38 (8.2%) | 25 (7.0%) |
| $55,000 to $64,999 | 67 (14.4%) | 11 (3.1%) |
| $65,000 to $74,999 | 50 (10.8%) | 35 (9.8%) |
| $75,000 to $99,999 | 39 (8.4%) | 38 (10.6%) |
| $100,000+ | 16 (3.5%) | 0 (0.0%) |
| Total | 464 (100.0%) | 359 (100.0%) |
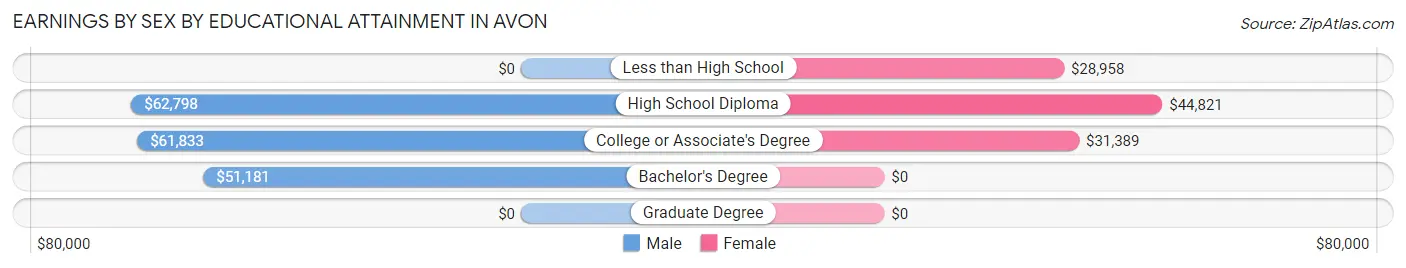
Earnings by Sex by Educational Attainment in Avon
Average earnings in Avon are $52,072 for men and $39,271 for women, a difference of 24.6%. Men with an educational attainment of high school diploma enjoy the highest average annual earnings of $62,798, while those with bachelor's degree education earn the least with $51,181. Women with an educational attainment of high school diploma earn the most with the average annual earnings of $44,821, while those with less than high school education have the smallest earnings of $28,958.
| Educational Attainment | Male Income | Female Income |
| Less than High School | - | - |
| High School Diploma | $62,798 | $44,821 |
| College or Associate's Degree | $61,833 | $31,389 |
| Bachelor's Degree | $51,181 | $0 |
| Graduate Degree | - | - |
| Total | $52,072 | $39,271 |
Family Income in Avon
Family Income Brackets in Avon
According to the Avon family income data, there are 129 families falling into the $100,000 to $149,999 income range, which is the most common income bracket and makes up 33.6% of all families.
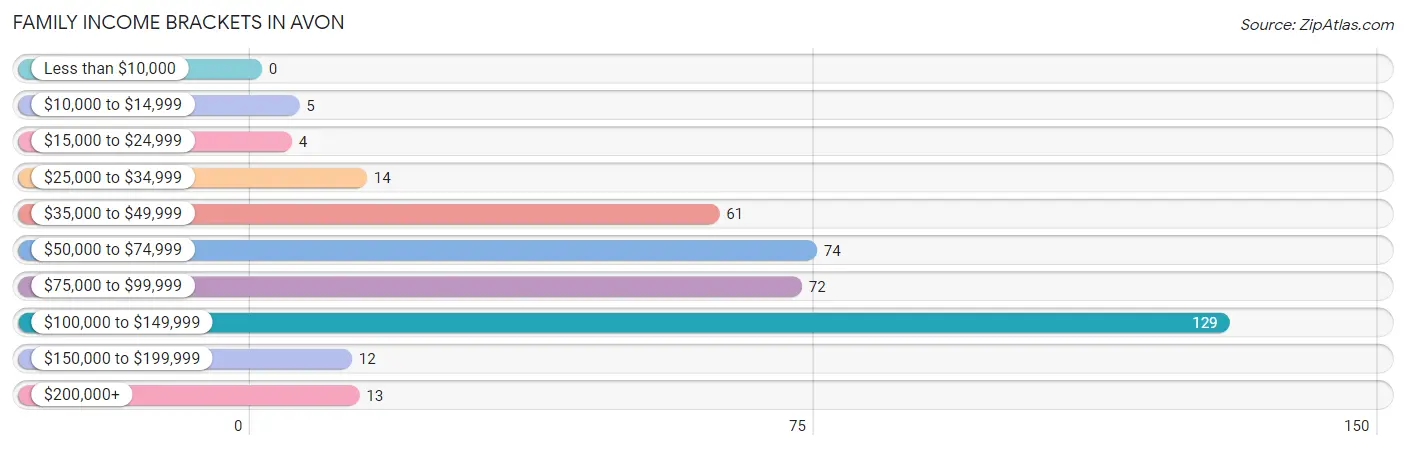
| Income Bracket | # Families | % Families |
| Less than $10,000 | 0 | 0.0% |
| $10,000 to $14,999 | 5 | 1.3% |
| $15,000 to $24,999 | 4 | 1.0% |
| $25,000 to $34,999 | 14 | 3.6% |
| $35,000 to $49,999 | 61 | 15.9% |
| $50,000 to $74,999 | 74 | 19.3% |
| $75,000 to $99,999 | 72 | 18.8% |
| $100,000 to $149,999 | 129 | 33.6% |
| $150,000 to $199,999 | 12 | 3.1% |
| $200,000+ | 13 | 3.4% |
Family Income by Famaliy Size in Avon
4-person families (43 | 11.2%) account for the highest median family income in Avon with $112,250 per family, while 3-person families (67 | 17.4%) have the highest median income of $35,720 per family member.
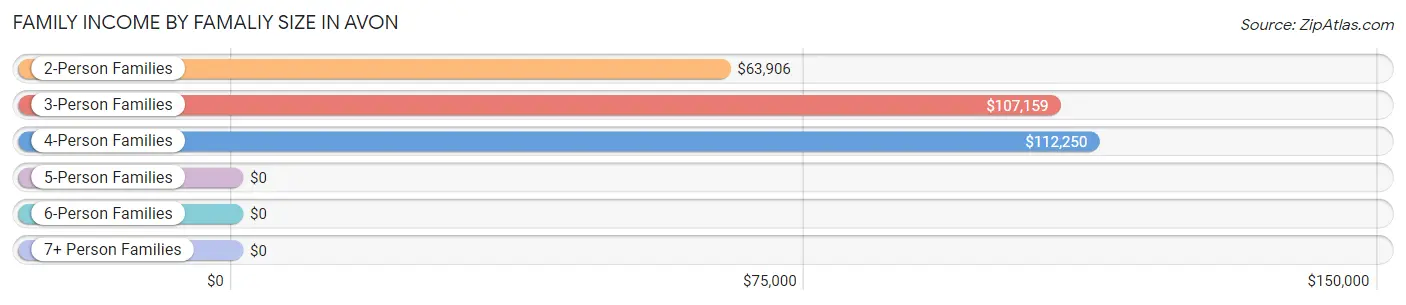
| Income Bracket | # Families | Median Income |
| 2-Person Families | 250 (65.1%) | $63,906 |
| 3-Person Families | 67 (17.4%) | $107,159 |
| 4-Person Families | 43 (11.2%) | $112,250 |
| 5-Person Families | 4 (1.0%) | $0 |
| 6-Person Families | 16 (4.2%) | $0 |
| 7+ Person Families | 4 (1.0%) | $0 |
| Total | 384 (100.0%) | $85,833 |
Family Income by Number of Earners in Avon
The median family income in Avon is $85,833, with families comprising 3+ earners (41) having the highest median family income of $129,792, while families with no earners (62) have the lowest median family income of $52,857, accounting for 10.7% and 16.2% of families, respectively.
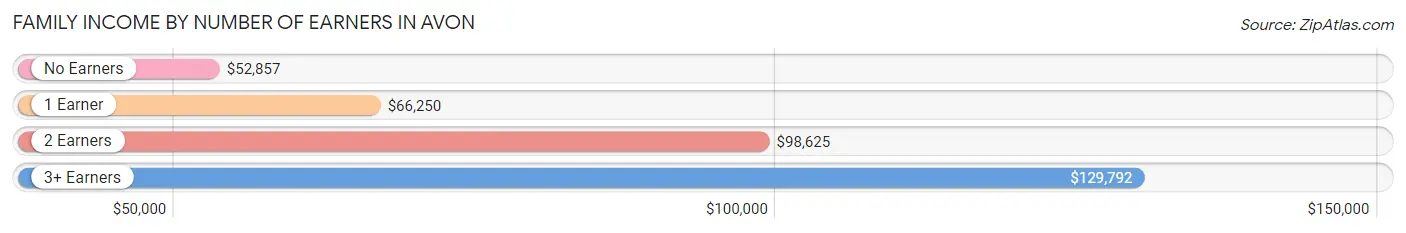
| Number of Earners | # Families | Median Income |
| No Earners | 62 (16.2%) | $52,857 |
| 1 Earner | 68 (17.7%) | $66,250 |
| 2 Earners | 213 (55.5%) | $98,625 |
| 3+ Earners | 41 (10.7%) | $129,792 |
| Total | 384 (100.0%) | $85,833 |
Household Income in Avon
Household Income Brackets in Avon
With 145 households falling in the category, the $100,000 to $149,999 income range is the most frequent in Avon, accounting for 24.1% of all households. In contrast, only 5 households (0.8%) fall into the less than $10,000 income bracket, making it the least populous group.
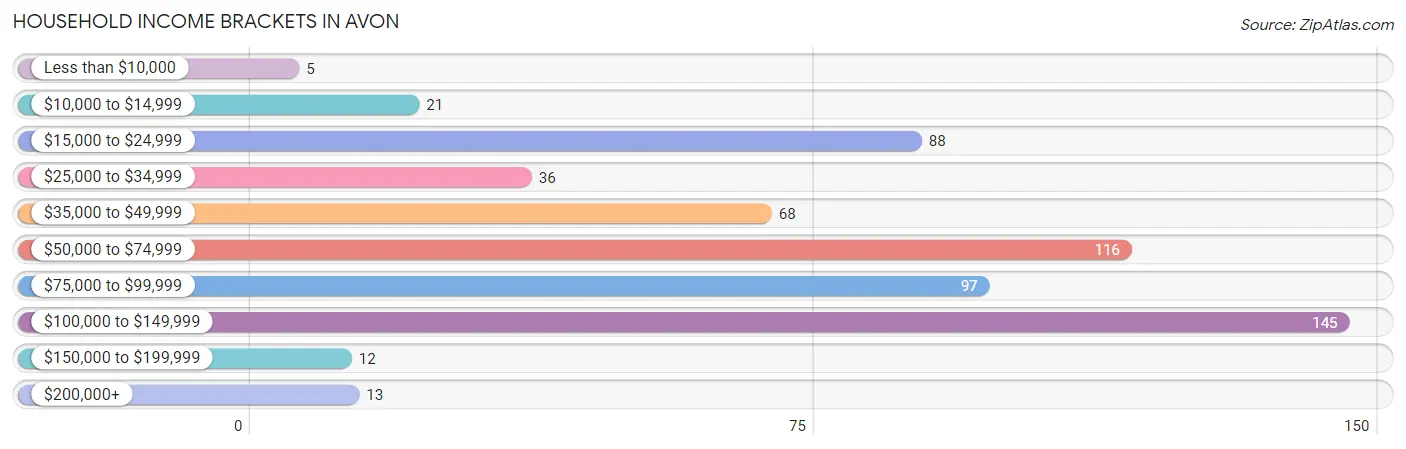
| Income Bracket | # Households | % Households |
| Less than $10,000 | 5 | 0.8% |
| $10,000 to $14,999 | 21 | 3.5% |
| $15,000 to $24,999 | 88 | 14.6% |
| $25,000 to $34,999 | 36 | 6.0% |
| $35,000 to $49,999 | 68 | 11.3% |
| $50,000 to $74,999 | 116 | 19.3% |
| $75,000 to $99,999 | 97 | 16.1% |
| $100,000 to $149,999 | 145 | 24.1% |
| $150,000 to $199,999 | 12 | 2.0% |
| $200,000+ | 13 | 2.2% |
Household Income by Householder Age in Avon
The median household income in Avon is $63,672, with the highest median household income of $103,750 found in the 25 to 44 years age bracket for the primary householder. A total of 103 households (17.1%) fall into this category. Meanwhile, the 15 to 24 years age bracket for the primary householder has the lowest median household income of $0, with 17 households (2.8%) in this group.
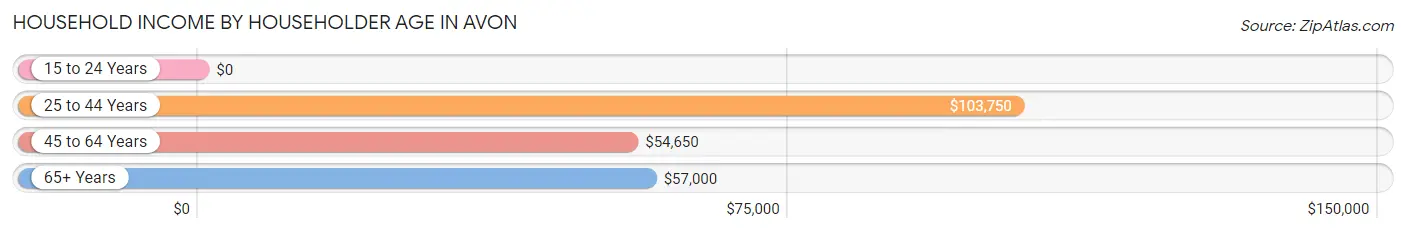
| Income Bracket | # Households | Median Income |
| 15 to 24 Years | 17 (2.8%) | $0 |
| 25 to 44 Years | 103 (17.1%) | $103,750 |
| 45 to 64 Years | 315 (52.4%) | $54,650 |
| 65+ Years | 166 (27.6%) | $57,000 |
| Total | 601 (100.0%) | $63,672 |
Poverty in Avon
Income Below Poverty by Sex and Age in Avon
With 7.8% poverty level for males and 5.1% for females among the residents of Avon, 18 to 24 year old males and 16 and 17 year old females are the most vulnerable to poverty, with 36 males (42.9%) and 5 females (41.7%) in their respective age groups living below the poverty level.
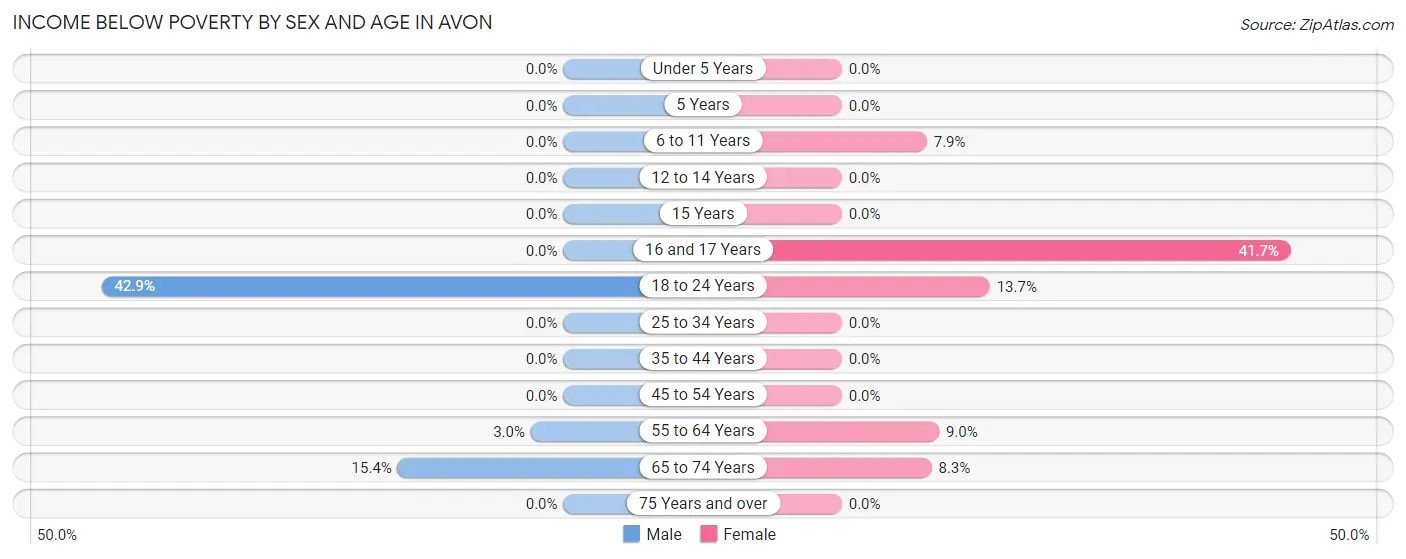
| Age Bracket | Male | Female |
| Under 5 Years | 0 (0.0%) | 0 (0.0%) |
| 5 Years | 0 (0.0%) | 0 (0.0%) |
| 6 to 11 Years | 0 (0.0%) | 6 (7.9%) |
| 12 to 14 Years | 0 (0.0%) | 0 (0.0%) |
| 15 Years | 0 (0.0%) | 0 (0.0%) |
| 16 and 17 Years | 0 (0.0%) | 5 (41.7%) |
| 18 to 24 Years | 36 (42.9%) | 7 (13.7%) |
| 25 to 34 Years | 0 (0.0%) | 0 (0.0%) |
| 35 to 44 Years | 0 (0.0%) | 0 (0.0%) |
| 45 to 54 Years | 0 (0.0%) | 0 (0.0%) |
| 55 to 64 Years | 6 (3.0%) | 11 (9.0%) |
| 65 to 74 Years | 10 (15.4%) | 8 (8.3%) |
| 75 Years and over | 0 (0.0%) | 0 (0.0%) |
| Total | 52 (7.8%) | 37 (5.1%) |
Income Above Poverty by Sex and Age in Avon
According to the poverty statistics in Avon, males aged under 5 years and females aged under 5 years are the age groups that are most secure financially, with 100.0% of males and 100.0% of females in these age groups living above the poverty line.
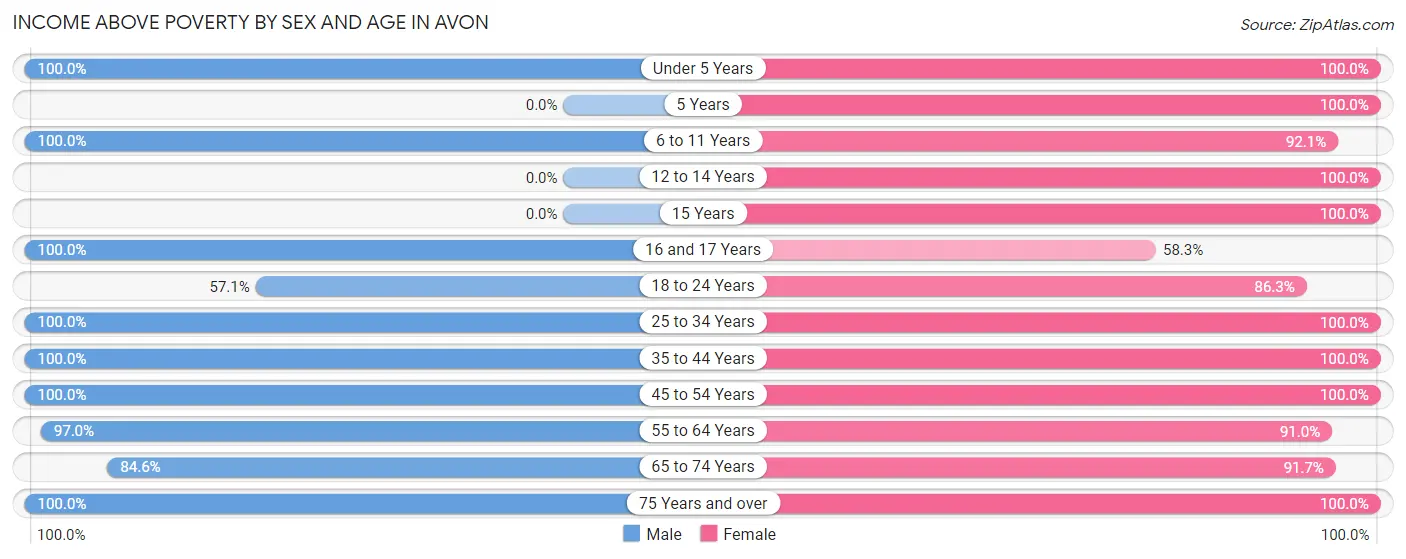
| Age Bracket | Male | Female |
| Under 5 Years | 11 (100.0%) | 24 (100.0%) |
| 5 Years | 0 (0.0%) | 5 (100.0%) |
| 6 to 11 Years | 11 (100.0%) | 70 (92.1%) |
| 12 to 14 Years | 0 (0.0%) | 37 (100.0%) |
| 15 Years | 0 (0.0%) | 10 (100.0%) |
| 16 and 17 Years | 25 (100.0%) | 7 (58.3%) |
| 18 to 24 Years | 48 (57.1%) | 44 (86.3%) |
| 25 to 34 Years | 74 (100.0%) | 64 (100.0%) |
| 35 to 44 Years | 42 (100.0%) | 52 (100.0%) |
| 45 to 54 Years | 97 (100.0%) | 94 (100.0%) |
| 55 to 64 Years | 193 (97.0%) | 111 (91.0%) |
| 65 to 74 Years | 55 (84.6%) | 88 (91.7%) |
| 75 Years and over | 59 (100.0%) | 75 (100.0%) |
| Total | 615 (92.2%) | 681 (94.9%) |
Income Below Poverty Among Married-Couple Families in Avon
The poverty statistics for married-couple families in Avon show that 1.2% or 4 of the total 327 families live below the poverty line. Families with no children have the highest poverty rate of 1.7%, comprising of 4 families. On the other hand, families with 1 or 2 children have the lowest poverty rate of 0.0%, which includes 0 families.
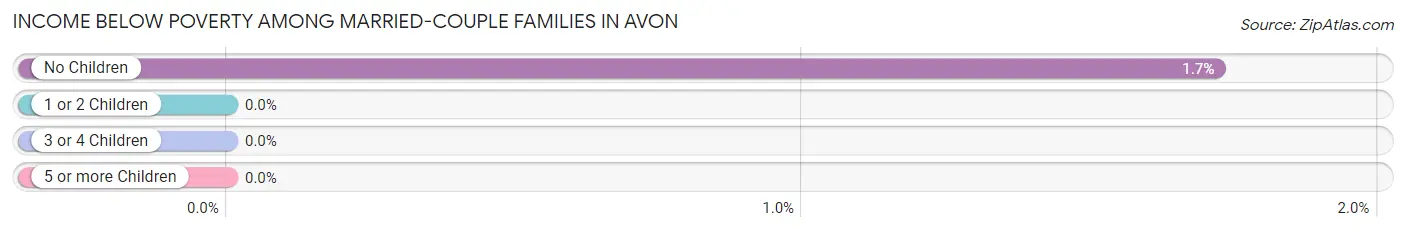
| Children | Above Poverty | Below Poverty |
| No Children | 228 (98.3%) | 4 (1.7%) |
| 1 or 2 Children | 74 (100.0%) | 0 (0.0%) |
| 3 or 4 Children | 21 (100.0%) | 0 (0.0%) |
| 5 or more Children | 0 (0.0%) | 0 (0.0%) |
| Total | 323 (98.8%) | 4 (1.2%) |
Income Below Poverty Among Single-Parent Households in Avon
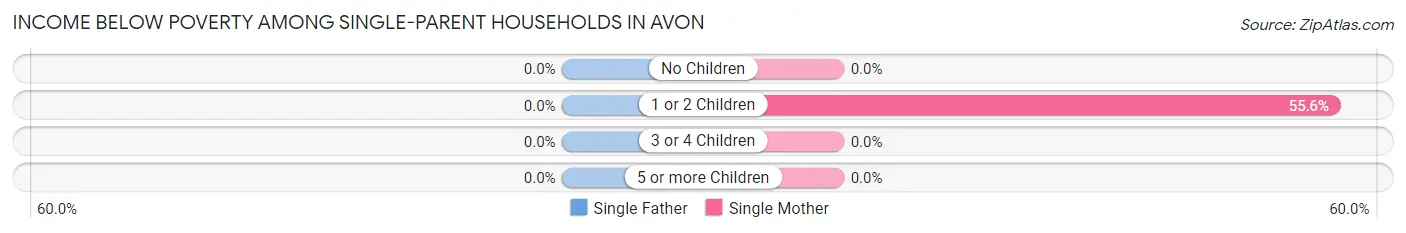
| Children | Single Father | Single Mother |
| No Children | 0 (0.0%) | 0 (0.0%) |
| 1 or 2 Children | 0 (0.0%) | 5 (55.6%) |
| 3 or 4 Children | 0 (0.0%) | 0 (0.0%) |
| 5 or more Children | 0 (0.0%) | 0 (0.0%) |
| Total | 0 (0.0%) | 5 (9.6%) |
Income Below Poverty Among Married-Couple vs Single-Parent Households in Avon
The poverty data for Avon shows that 4 of the married-couple family households (1.2%) and 5 of the single-parent households (8.8%) are living below the poverty level. Within the married-couple family households, those with no children have the highest poverty rate, with 4 households (1.7%) falling below the poverty line. Among the single-parent households, those with 1 or 2 children have the highest poverty rate, with 5 household (55.6%) living below poverty.
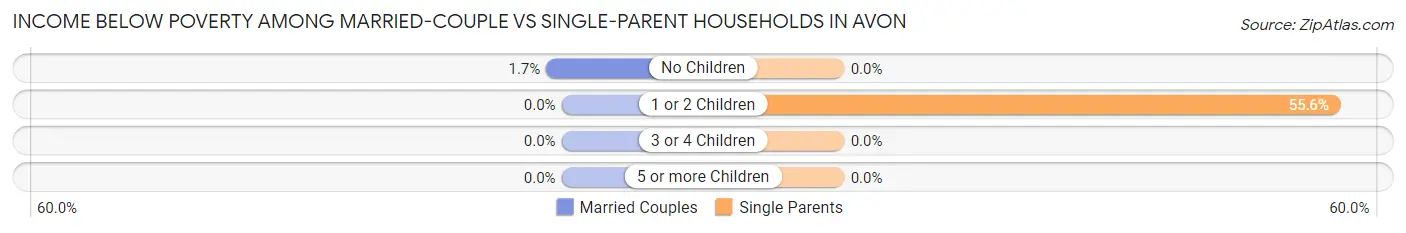
| Children | Married-Couple Families | Single-Parent Households |
| No Children | 4 (1.7%) | 0 (0.0%) |
| 1 or 2 Children | 0 (0.0%) | 5 (55.6%) |
| 3 or 4 Children | 0 (0.0%) | 0 (0.0%) |
| 5 or more Children | 0 (0.0%) | 0 (0.0%) |
| Total | 4 (1.2%) | 5 (8.8%) |
Race in Avon
The most populous races in Avon are White / Caucasian (1,053 | 75.2%), Hispanic or Latino (262 | 18.7%), and Two or more Races (217 | 15.5%).
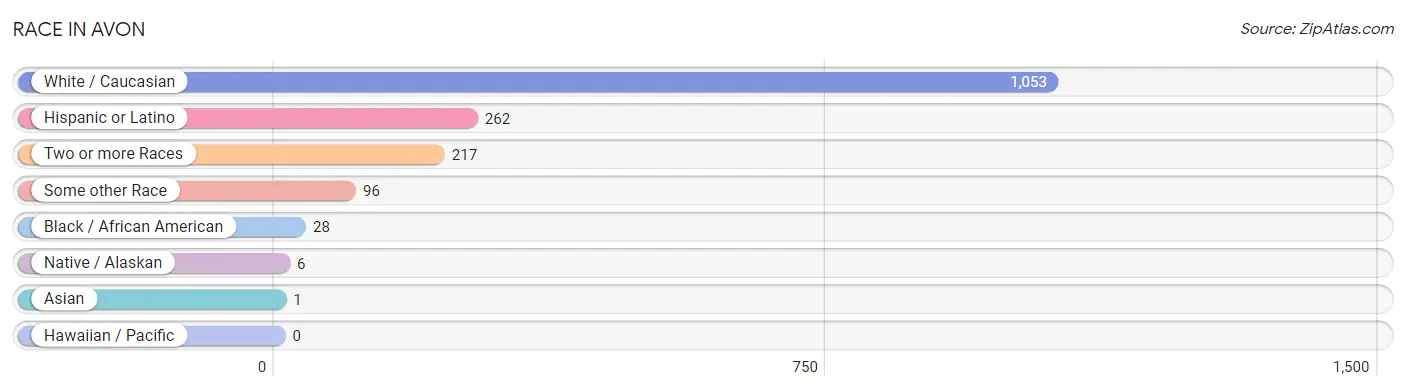
| Race | # Population | % Population |
| Asian | 1 | 0.1% |
| Black / African American | 28 | 2.0% |
| Hawaiian / Pacific | 0 | 0.0% |
| Hispanic or Latino | 262 | 18.7% |
| Native / Alaskan | 6 | 0.4% |
| White / Caucasian | 1,053 | 75.2% |
| Two or more Races | 217 | 15.5% |
| Some other Race | 96 | 6.9% |
| Total | 1,401 | 100.0% |
Ancestry in Avon
The most populous ancestries reported in Avon are German (486 | 34.7%), Puerto Rican (195 | 13.9%), American (134 | 9.6%), Irish (96 | 6.9%), and English (90 | 6.4%), together accounting for 71.4% of all Avon residents.
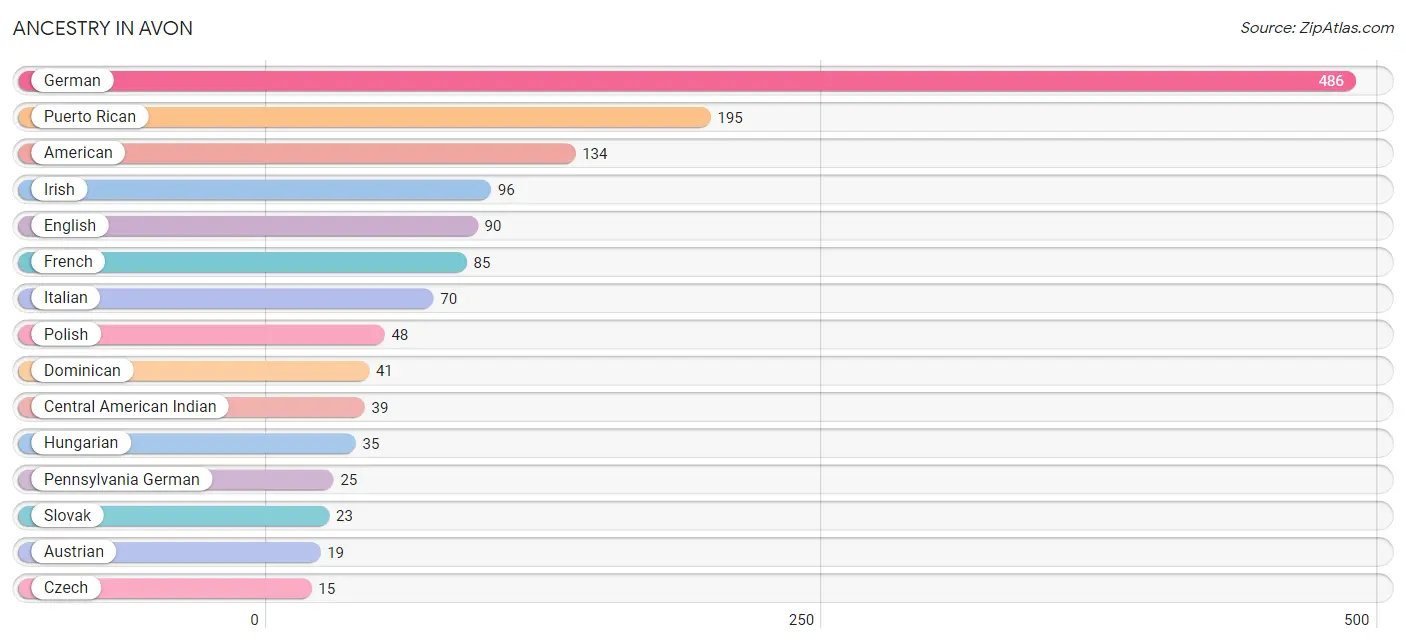
| Ancestry | # Population | % Population |
| American | 134 | 9.6% |
| Austrian | 19 | 1.4% |
| British | 6 | 0.4% |
| Canadian | 5 | 0.4% |
| Central American Indian | 39 | 2.8% |
| Czech | 15 | 1.1% |
| Dominican | 41 | 2.9% |
| Dutch | 12 | 0.9% |
| English | 90 | 6.4% |
| French | 85 | 6.1% |
| French Canadian | 13 | 0.9% |
| German | 486 | 34.7% |
| Hungarian | 35 | 2.5% |
| Indian (Asian) | 7 | 0.5% |
| Irish | 96 | 6.9% |
| Italian | 70 | 5.0% |
| Mexican | 11 | 0.8% |
| Norwegian | 6 | 0.4% |
| Pennsylvania German | 25 | 1.8% |
| Polish | 48 | 3.4% |
| Puerto Rican | 195 | 13.9% |
| Scottish | 11 | 0.8% |
| Slovak | 23 | 1.6% |
| Spaniard | 15 | 1.1% |
| Swedish | 8 | 0.6% |
| Swiss | 9 | 0.6% |
| Welsh | 7 | 0.5% |
| Yugoslavian | 9 | 0.6% | View All 28 Rows |
Immigrants in Avon
The most numerous immigrant groups reported in Avon came from Caribbean (18 | 1.3%), Dominican Republic (18 | 1.3%), Latin America (18 | 1.3%), Canada (5 | 0.4%), and Asia (1 | 0.1%), together accounting for 4.3% of all Avon residents.
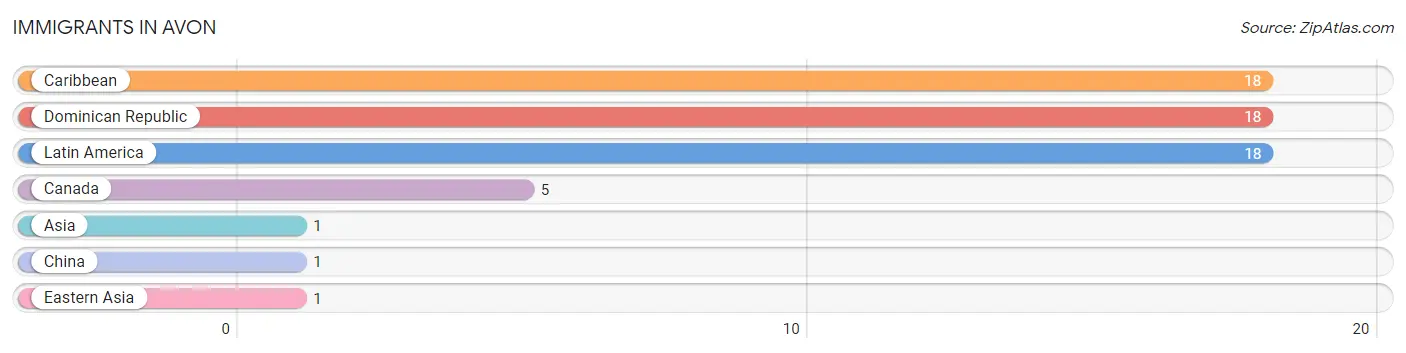
| Immigration Origin | # Population | % Population |
| Asia | 1 | 0.1% |
| Canada | 5 | 0.4% |
| Caribbean | 18 | 1.3% |
| China | 1 | 0.1% |
| Dominican Republic | 18 | 1.3% |
| Eastern Asia | 1 | 0.1% |
| Latin America | 18 | 1.3% | View All 7 Rows |
Sex and Age in Avon
Sex and Age in Avon
The most populous age groups in Avon are 60 to 64 Years (144 | 21.3%) for men and 60 to 64 Years (71 | 9.8%) for women.
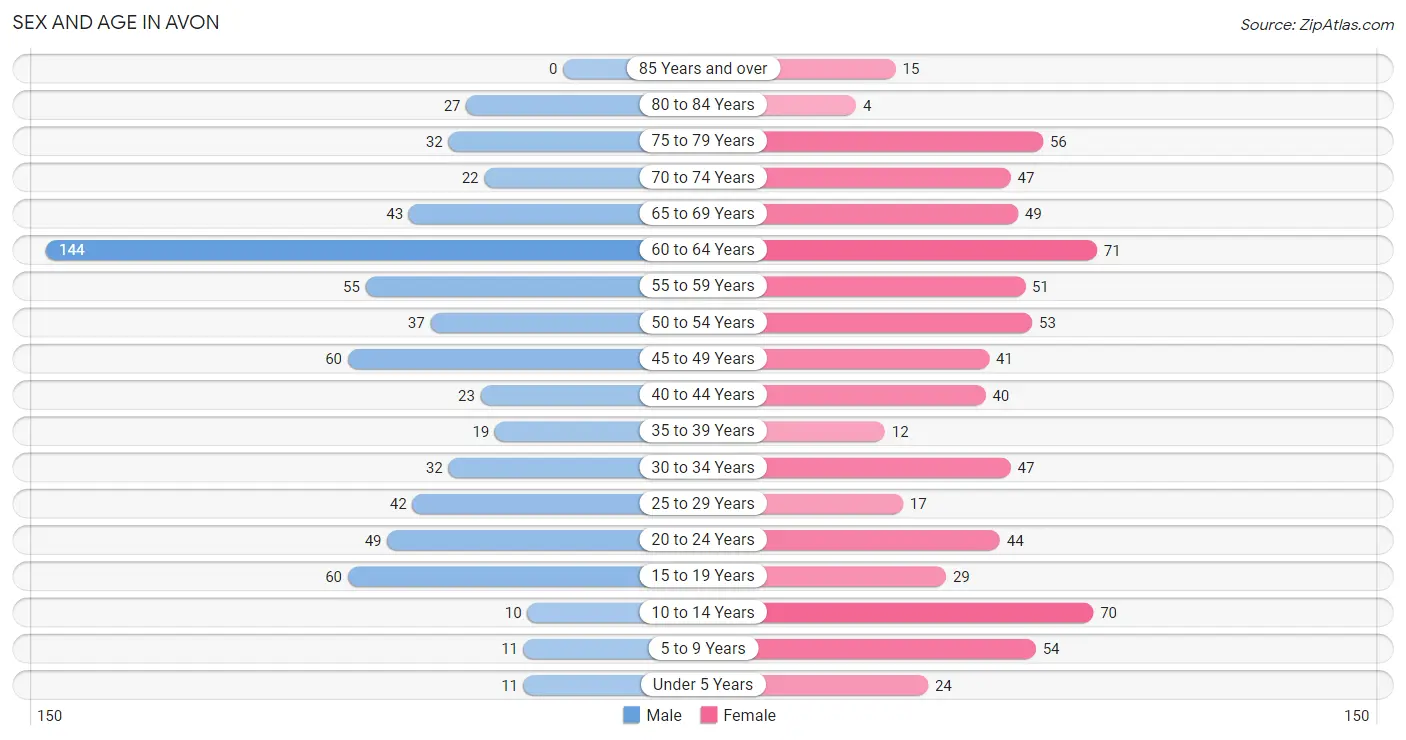
| Age Bracket | Male | Female |
| Under 5 Years | 11 (1.6%) | 24 (3.3%) |
| 5 to 9 Years | 11 (1.6%) | 54 (7.5%) |
| 10 to 14 Years | 10 (1.5%) | 70 (9.7%) |
| 15 to 19 Years | 60 (8.9%) | 29 (4.0%) |
| 20 to 24 Years | 49 (7.2%) | 44 (6.1%) |
| 25 to 29 Years | 42 (6.2%) | 17 (2.4%) |
| 30 to 34 Years | 32 (4.7%) | 47 (6.5%) |
| 35 to 39 Years | 19 (2.8%) | 12 (1.7%) |
| 40 to 44 Years | 23 (3.4%) | 40 (5.5%) |
| 45 to 49 Years | 60 (8.9%) | 41 (5.7%) |
| 50 to 54 Years | 37 (5.5%) | 53 (7.3%) |
| 55 to 59 Years | 55 (8.1%) | 51 (7.0%) |
| 60 to 64 Years | 144 (21.3%) | 71 (9.8%) |
| 65 to 69 Years | 43 (6.4%) | 49 (6.8%) |
| 70 to 74 Years | 22 (3.3%) | 47 (6.5%) |
| 75 to 79 Years | 32 (4.7%) | 56 (7.7%) |
| 80 to 84 Years | 27 (4.0%) | 4 (0.5%) |
| 85 Years and over | 0 (0.0%) | 15 (2.1%) |
| Total | 677 (100.0%) | 724 (100.0%) |
Families and Households in Avon
Median Family Size in Avon
The median family size in Avon is 2.82 persons per family, with married-couple families (327 | 85.2%) accounting for the largest median family size of 2.93 persons per family. On the other hand, single female/mother families (52 | 13.5%) represent the smallest median family size with 2.15 persons per family.
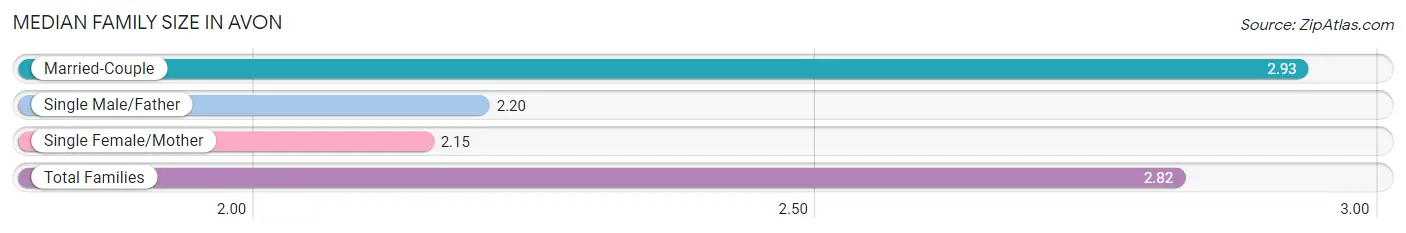
| Family Type | # Families | Family Size |
| Married-Couple | 327 (85.2%) | 2.93 |
| Single Male/Father | 5 (1.3%) | 2.20 |
| Single Female/Mother | 52 (13.5%) | 2.15 |
| Total Families | 384 (100.0%) | 2.82 |
Median Household Size in Avon
The median household size in Avon is 2.33 persons per household, with married-couple households (327 | 54.4%) accounting for the largest median household size of 3.09 persons per household. non-family households (217 | 36.1%) represent the smallest median household size with 1.22 persons per household.
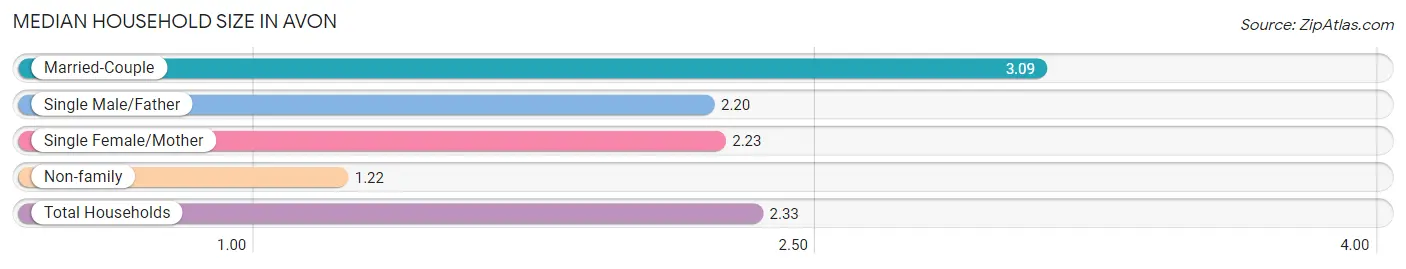
| Household Type | # Households | Household Size |
| Married-Couple | 327 (54.4%) | 3.09 |
| Single Male/Father | 5 (0.8%) | 2.20 |
| Single Female/Mother | 52 (8.6%) | 2.23 |
| Non-family | 217 (36.1%) | 1.22 |
| Total Households | 601 (100.0%) | 2.33 |
Household Size by Marriage Status in Avon
Out of a total of 601 households in Avon, 384 (63.9%) are family households, while 217 (36.1%) are nonfamily households. The most numerous type of family households are 2-person households, comprising 235, and the most common type of nonfamily households are 1-person households, comprising 179.
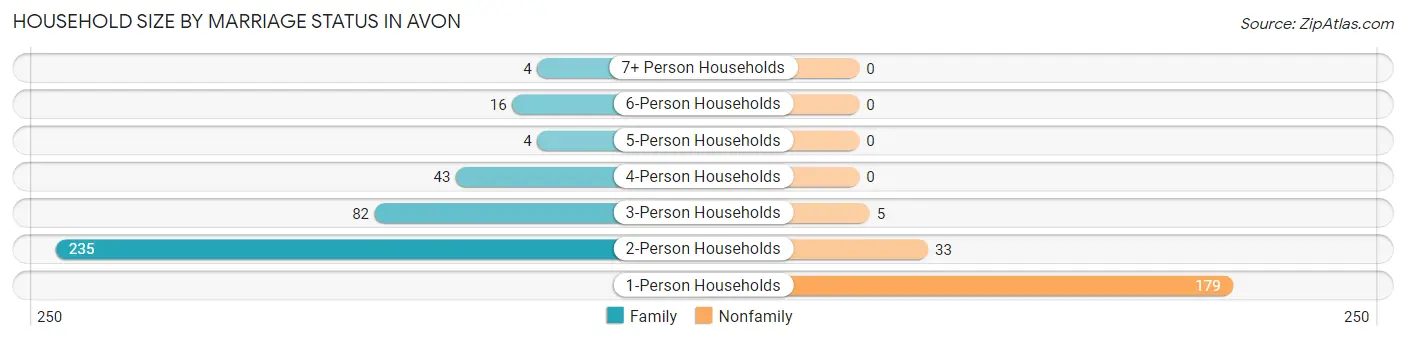
| Household Size | Family Households | Nonfamily Households |
| 1-Person Households | - | 179 (29.8%) |
| 2-Person Households | 235 (39.1%) | 33 (5.5%) |
| 3-Person Households | 82 (13.6%) | 5 (0.8%) |
| 4-Person Households | 43 (7.1%) | 0 (0.0%) |
| 5-Person Households | 4 (0.7%) | 0 (0.0%) |
| 6-Person Households | 16 (2.7%) | 0 (0.0%) |
| 7+ Person Households | 4 (0.7%) | 0 (0.0%) |
| Total | 384 (63.9%) | 217 (36.1%) |
Female Fertility in Avon
Fertility by Age in Avon
Average fertility rate in Avon is 4.0 births per 1,000 women. Women in the age bracket of 20 to 34 years have the highest fertility rate with 9.0 births per 1,000 women. Women in the age bracket of 20 to 34 years acount for 100.0% of all women with births.
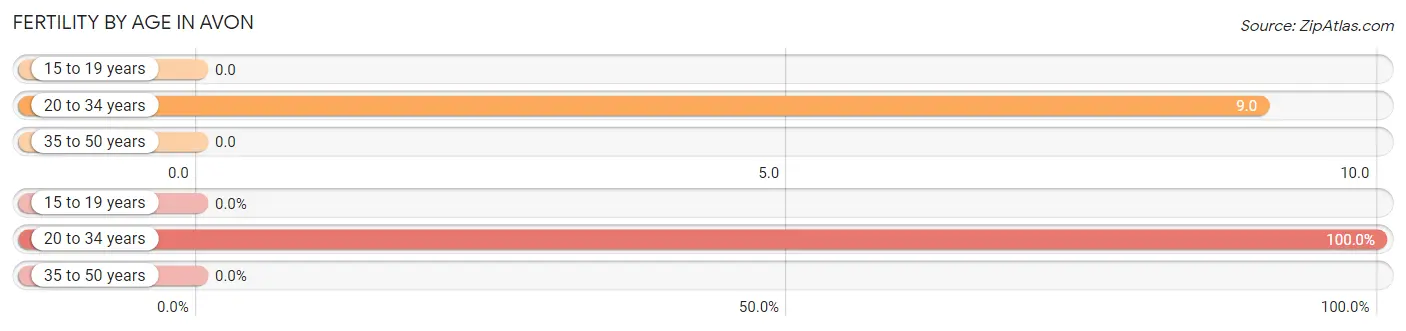
| Age Bracket | Women with Births | Births / 1,000 Women |
| 15 to 19 years | 0 (0.0%) | 0.0 |
| 20 to 34 years | 1 (100.0%) | 9.0 |
| 35 to 50 years | 0 (0.0%) | 0.0 |
| Total | 1 (100.0%) | 4.0 |
Fertility by Age by Marriage Status in Avon
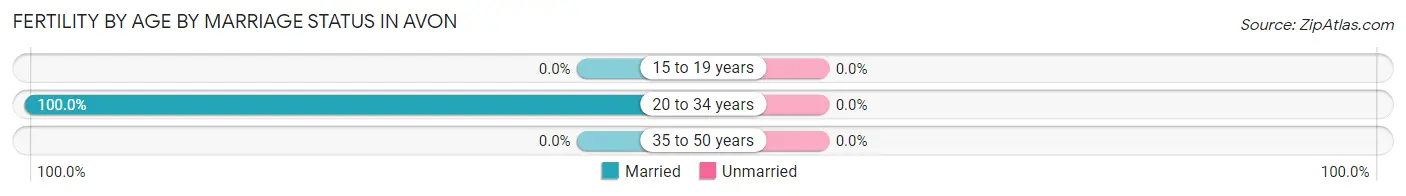
| Age Bracket | Married | Unmarried |
| 15 to 19 years | 0 (0.0%) | 0 (0.0%) |
| 20 to 34 years | 1 (100.0%) | 0 (0.0%) |
| 35 to 50 years | 0 (0.0%) | 0 (0.0%) |
| Total | 1 (100.0%) | 0 (0.0%) |
Fertility by Education in Avon
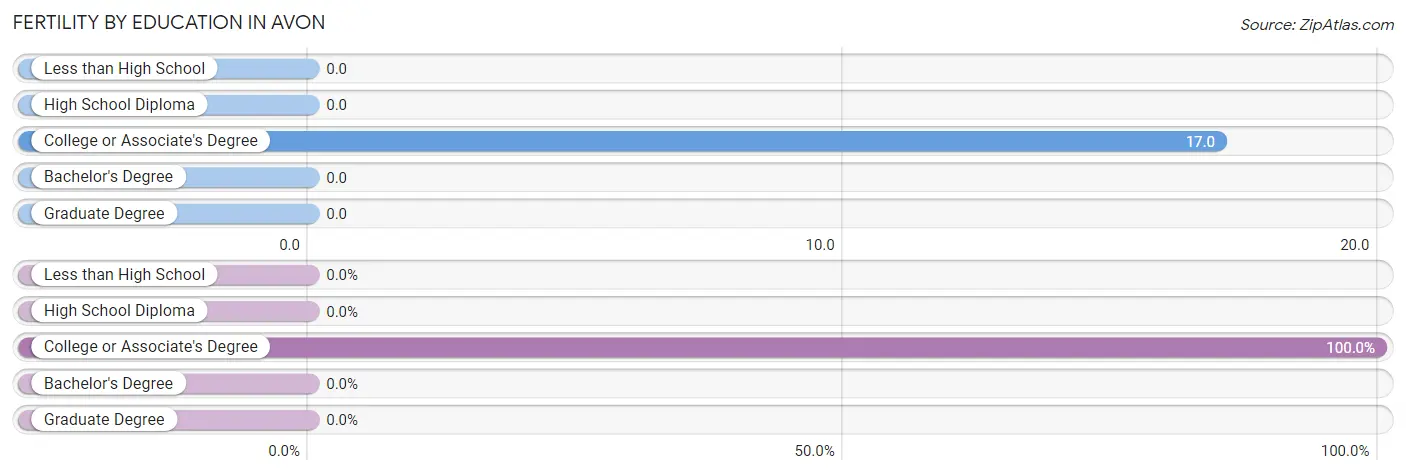
| Educational Attainment | Women with Births | Births / 1,000 Women |
| Less than High School | 0 (0.0%) | 0.0 |
| High School Diploma | 0 (0.0%) | 0.0 |
| College or Associate's Degree | 1 (100.0%) | 17.0 |
| Bachelor's Degree | 0 (0.0%) | 0.0 |
| Graduate Degree | 0 (0.0%) | 0.0 |
| Total | 1 (100.0%) | 4.0 |
Fertility by Education by Marriage Status in Avon
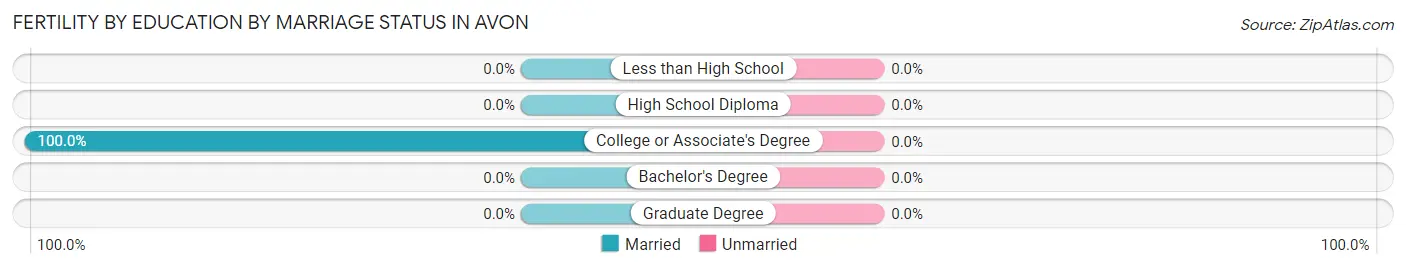
| Educational Attainment | Married | Unmarried |
| Less than High School | 0 (0.0%) | 0 (0.0%) |
| High School Diploma | 0 (0.0%) | 0 (0.0%) |
| College or Associate's Degree | 1 (100.0%) | 0 (0.0%) |
| Bachelor's Degree | 0 (0.0%) | 0 (0.0%) |
| Graduate Degree | 0 (0.0%) | 0 (0.0%) |
| Total | 1 (100.0%) | 0 (0.0%) |
Employment Characteristics in Avon
Employment by Class of Employer in Avon
Among the 755 employed individuals in Avon, private company employees (603 | 79.9%), local government employees (57 | 7.5%), and not-for-profit organizations (53 | 7.0%) make up the most common classes of employment.
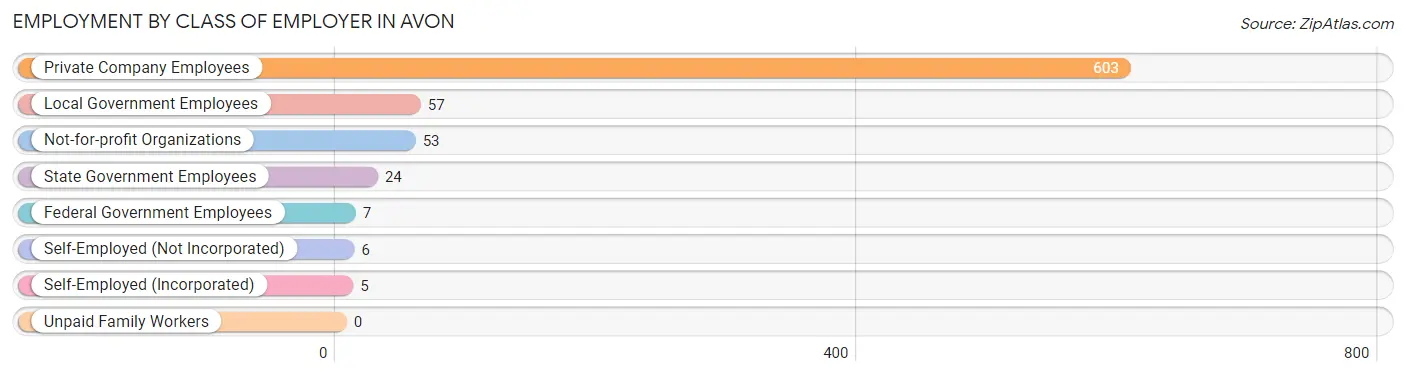
| Employer Class | # Employees | % Employees |
| Private Company Employees | 603 | 79.9% |
| Self-Employed (Incorporated) | 5 | 0.7% |
| Self-Employed (Not Incorporated) | 6 | 0.8% |
| Not-for-profit Organizations | 53 | 7.0% |
| Local Government Employees | 57 | 7.5% |
| State Government Employees | 24 | 3.2% |
| Federal Government Employees | 7 | 0.9% |
| Unpaid Family Workers | 0 | 0.0% |
| Total | 755 | 100.0% |
Employment Status by Age in Avon
According to the labor force statistics for Avon, out of the total population over 16 years of age (1,211), 64.3% or 779 individuals are in the labor force, with 3.1% or 24 of them unemployed. The age group with the highest labor force participation rate is 55 to 59 years, with 100.0% or 106 individuals in the labor force. Within the labor force, the 65 to 74 years age range has the highest percentage of unemployed individuals, with 14.6% or 6 of them being unemployed.
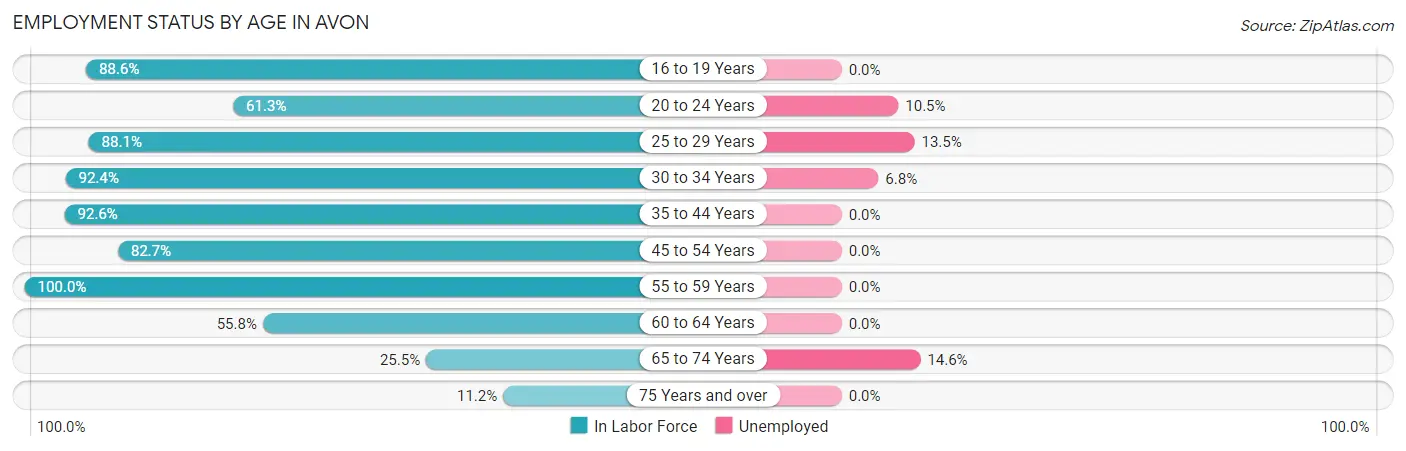
| Age Bracket | In Labor Force | Unemployed |
| 16 to 19 Years | 70 (88.6%) | 0 (0.0%) |
| 20 to 24 Years | 57 (61.3%) | 6 (10.5%) |
| 25 to 29 Years | 52 (88.1%) | 7 (13.5%) |
| 30 to 34 Years | 73 (92.4%) | 5 (6.8%) |
| 35 to 44 Years | 87 (92.6%) | 0 (0.0%) |
| 45 to 54 Years | 158 (82.7%) | 0 (0.0%) |
| 55 to 59 Years | 106 (100.0%) | 0 (0.0%) |
| 60 to 64 Years | 120 (55.8%) | 0 (0.0%) |
| 65 to 74 Years | 41 (25.5%) | 6 (14.6%) |
| 75 Years and over | 15 (11.2%) | 0 (0.0%) |
| Total | 779 (64.3%) | 24 (3.1%) |
Employment Status by Educational Attainment in Avon
According to labor force statistics for Avon, 80.1% of individuals (596) out of the total population between 25 and 64 years of age (744) are in the labor force, with 2.0% or 12 of them being unemployed. The group with the highest labor force participation rate are those with the educational attainment of bachelor's degree or higher, with 100.0% or 61 individuals in the labor force. Within the labor force, individuals with high school diploma education have the highest percentage of unemployment, with 3.9% or 12 of them being unemployed.
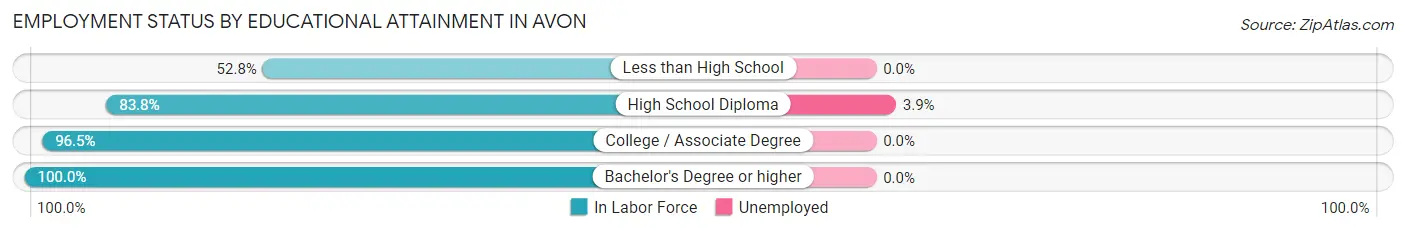
| Educational Attainment | In Labor Force | Unemployed |
| Less than High School | 94 (52.8%) | 0 (0.0%) |
| High School Diploma | 305 (83.8%) | 14 (3.9%) |
| College / Associate Degree | 136 (96.5%) | 0 (0.0%) |
| Bachelor's Degree or higher | 61 (100.0%) | 0 (0.0%) |
| Total | 596 (80.1%) | 15 (2.0%) |
Employment Occupations by Sex in Avon
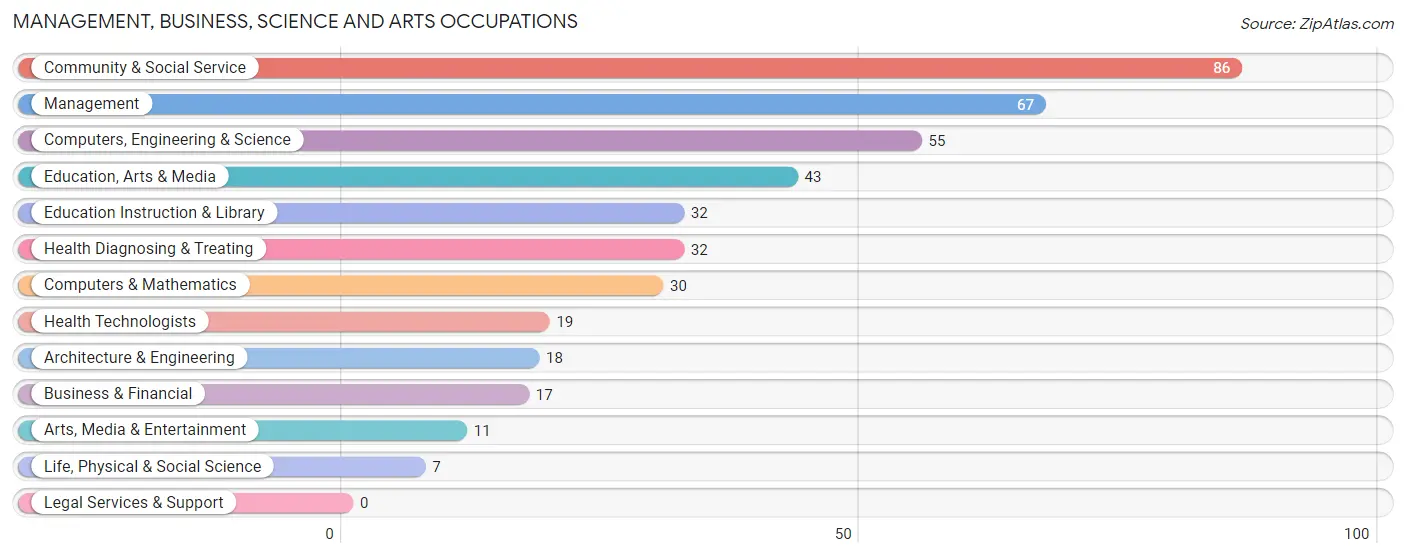
Management, Business, Science and Arts Occupations
The most common Management, Business, Science and Arts occupations in Avon are Community & Social Service (86 | 11.4%), Management (67 | 8.9%), Computers, Engineering & Science (55 | 7.3%), Education, Arts & Media (43 | 5.7%), and Education Instruction & Library (32 | 4.2%).
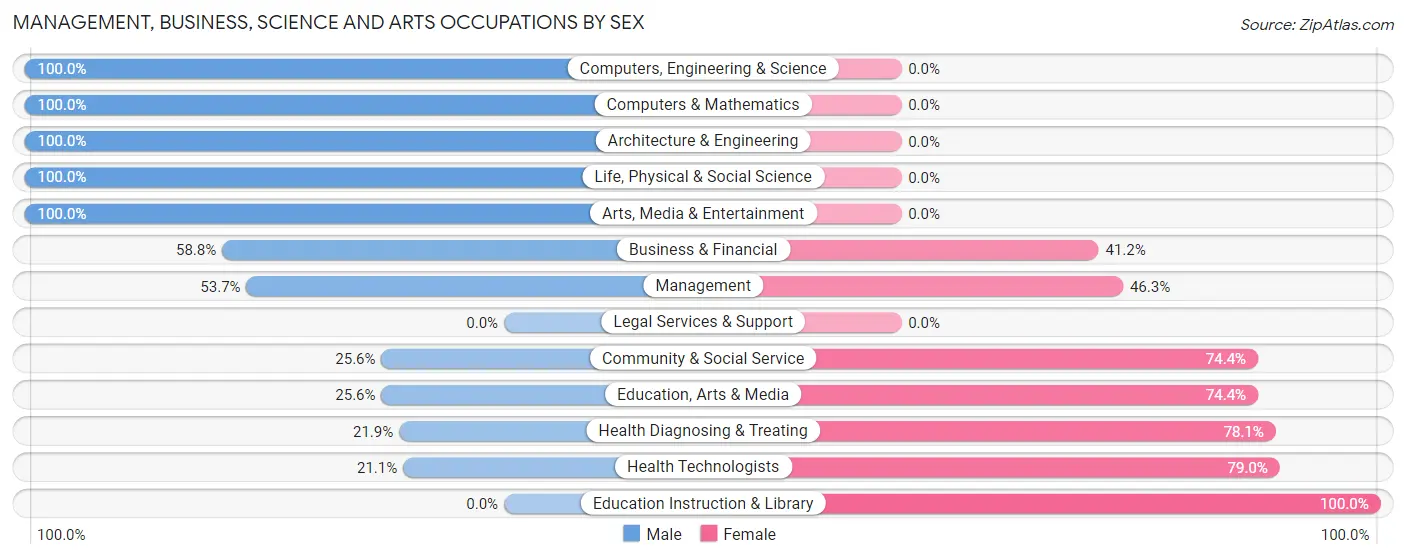
Management, Business, Science and Arts Occupations by Sex
Within the Management, Business, Science and Arts occupations in Avon, the most male-oriented occupations are Computers, Engineering & Science (100.0%), Computers & Mathematics (100.0%), and Architecture & Engineering (100.0%), while the most female-oriented occupations are Education Instruction & Library (100.0%), Health Technologists (78.9%), and Health Diagnosing & Treating (78.1%).
| Occupation | Male | Female |
| Management | 36 (53.7%) | 31 (46.3%) |
| Business & Financial | 10 (58.8%) | 7 (41.2%) |
| Computers, Engineering & Science | 55 (100.0%) | 0 (0.0%) |
| Computers & Mathematics | 30 (100.0%) | 0 (0.0%) |
| Architecture & Engineering | 18 (100.0%) | 0 (0.0%) |
| Life, Physical & Social Science | 7 (100.0%) | 0 (0.0%) |
| Community & Social Service | 22 (25.6%) | 64 (74.4%) |
| Education, Arts & Media | 11 (25.6%) | 32 (74.4%) |
| Legal Services & Support | 0 (0.0%) | 0 (0.0%) |
| Education Instruction & Library | 0 (0.0%) | 32 (100.0%) |
| Arts, Media & Entertainment | 11 (100.0%) | 0 (0.0%) |
| Health Diagnosing & Treating | 7 (21.9%) | 25 (78.1%) |
| Health Technologists | 4 (21.0%) | 15 (78.9%) |
| Total (Category) | 130 (50.6%) | 127 (49.4%) |
| Total (Overall) | 416 (55.1%) | 339 (44.9%) |
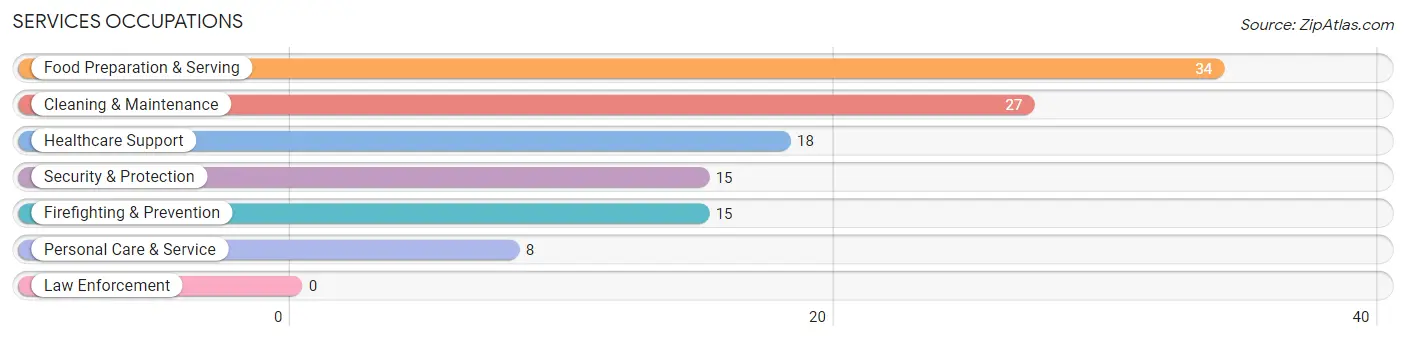
Services Occupations
The most common Services occupations in Avon are Food Preparation & Serving (34 | 4.5%), Cleaning & Maintenance (27 | 3.6%), Healthcare Support (18 | 2.4%), Security & Protection (15 | 2.0%), and Firefighting & Prevention (15 | 2.0%).
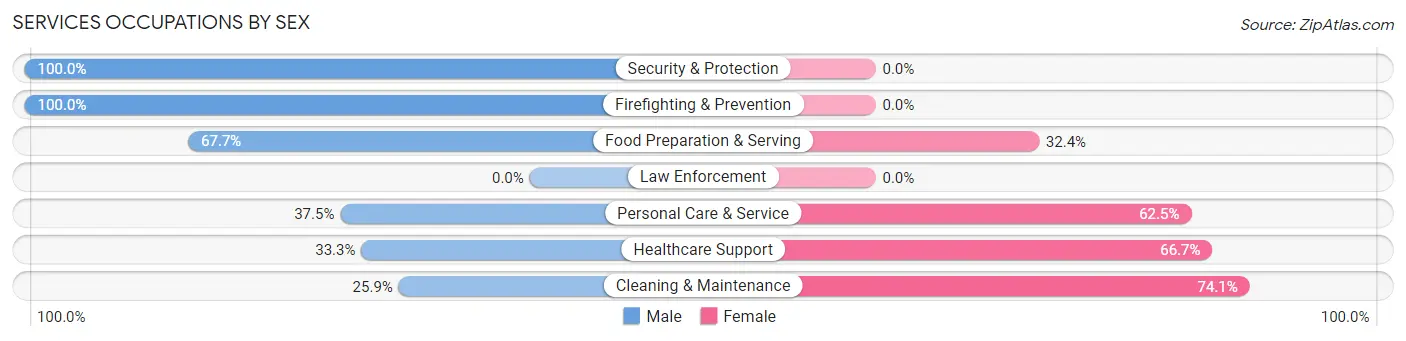
Services Occupations by Sex
Within the Services occupations in Avon, the most male-oriented occupations are Security & Protection (100.0%), Firefighting & Prevention (100.0%), and Food Preparation & Serving (67.6%), while the most female-oriented occupations are Cleaning & Maintenance (74.1%), Healthcare Support (66.7%), and Personal Care & Service (62.5%).
| Occupation | Male | Female |
| Healthcare Support | 6 (33.3%) | 12 (66.7%) |
| Security & Protection | 15 (100.0%) | 0 (0.0%) |
| Firefighting & Prevention | 15 (100.0%) | 0 (0.0%) |
| Law Enforcement | 0 (0.0%) | 0 (0.0%) |
| Food Preparation & Serving | 23 (67.6%) | 11 (32.4%) |
| Cleaning & Maintenance | 7 (25.9%) | 20 (74.1%) |
| Personal Care & Service | 3 (37.5%) | 5 (62.5%) |
| Total (Category) | 54 (52.9%) | 48 (47.1%) |
| Total (Overall) | 416 (55.1%) | 339 (44.9%) |
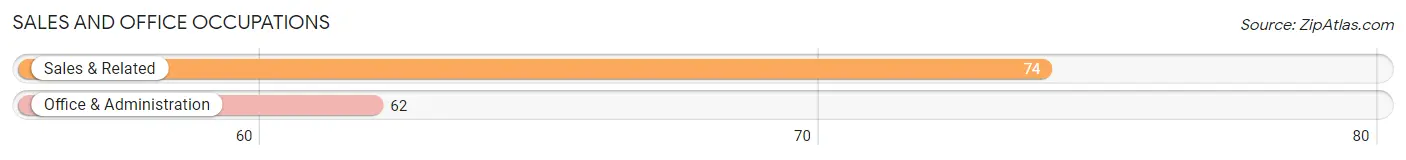
Sales and Office Occupations
The most common Sales and Office occupations in Avon are Sales & Related (74 | 9.8%), and Office & Administration (62 | 8.2%).
Sales and Office Occupations by Sex
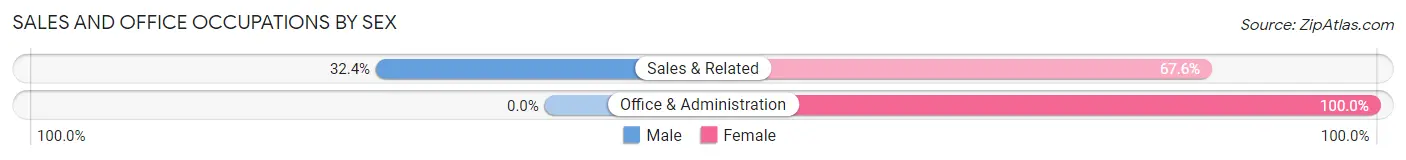
| Occupation | Male | Female |
| Sales & Related | 24 (32.4%) | 50 (67.6%) |
| Office & Administration | 0 (0.0%) | 62 (100.0%) |
| Total (Category) | 24 (17.6%) | 112 (82.4%) |
| Total (Overall) | 416 (55.1%) | 339 (44.9%) |
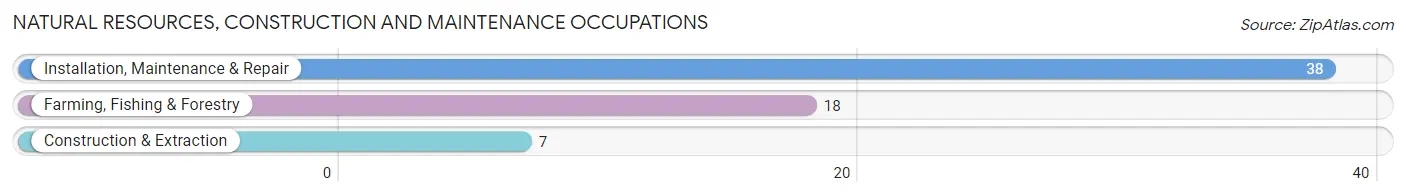
Natural Resources, Construction and Maintenance Occupations
The most common Natural Resources, Construction and Maintenance occupations in Avon are Installation, Maintenance & Repair (38 | 5.0%), Farming, Fishing & Forestry (18 | 2.4%), and Construction & Extraction (7 | 0.9%).
Natural Resources, Construction and Maintenance Occupations by Sex
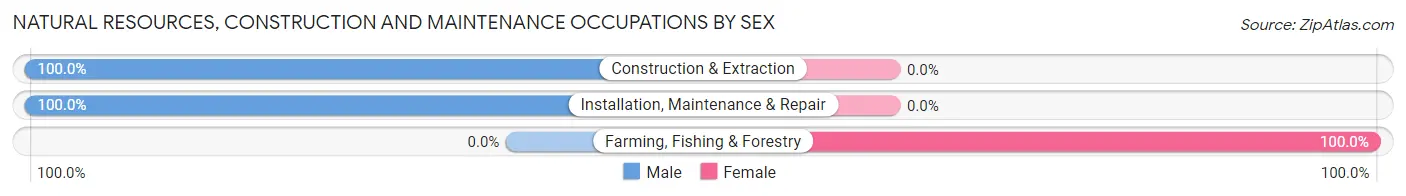
| Occupation | Male | Female |
| Farming, Fishing & Forestry | 0 (0.0%) | 18 (100.0%) |
| Construction & Extraction | 7 (100.0%) | 0 (0.0%) |
| Installation, Maintenance & Repair | 38 (100.0%) | 0 (0.0%) |
| Total (Category) | 45 (71.4%) | 18 (28.6%) |
| Total (Overall) | 416 (55.1%) | 339 (44.9%) |
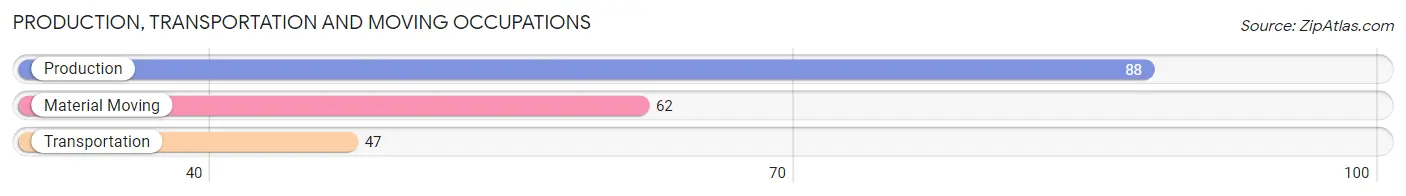
Production, Transportation and Moving Occupations
The most common Production, Transportation and Moving occupations in Avon are Production (88 | 11.7%), Material Moving (62 | 8.2%), and Transportation (47 | 6.2%).
Production, Transportation and Moving Occupations by Sex
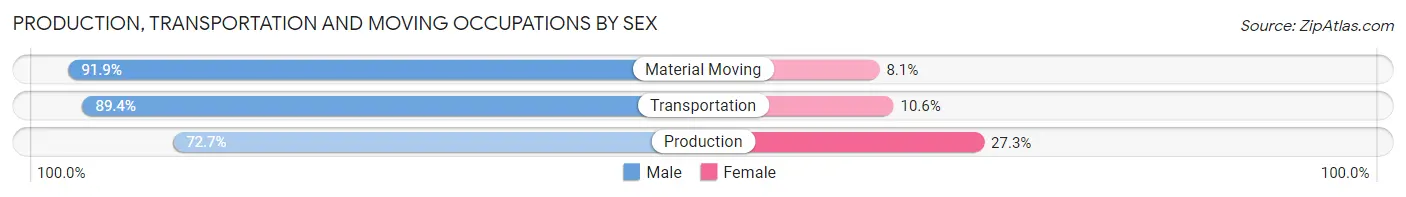
| Occupation | Male | Female |
| Production | 64 (72.7%) | 24 (27.3%) |
| Transportation | 42 (89.4%) | 5 (10.6%) |
| Material Moving | 57 (91.9%) | 5 (8.1%) |
| Total (Category) | 163 (82.7%) | 34 (17.3%) |
| Total (Overall) | 416 (55.1%) | 339 (44.9%) |
Employment Industries by Sex in Avon
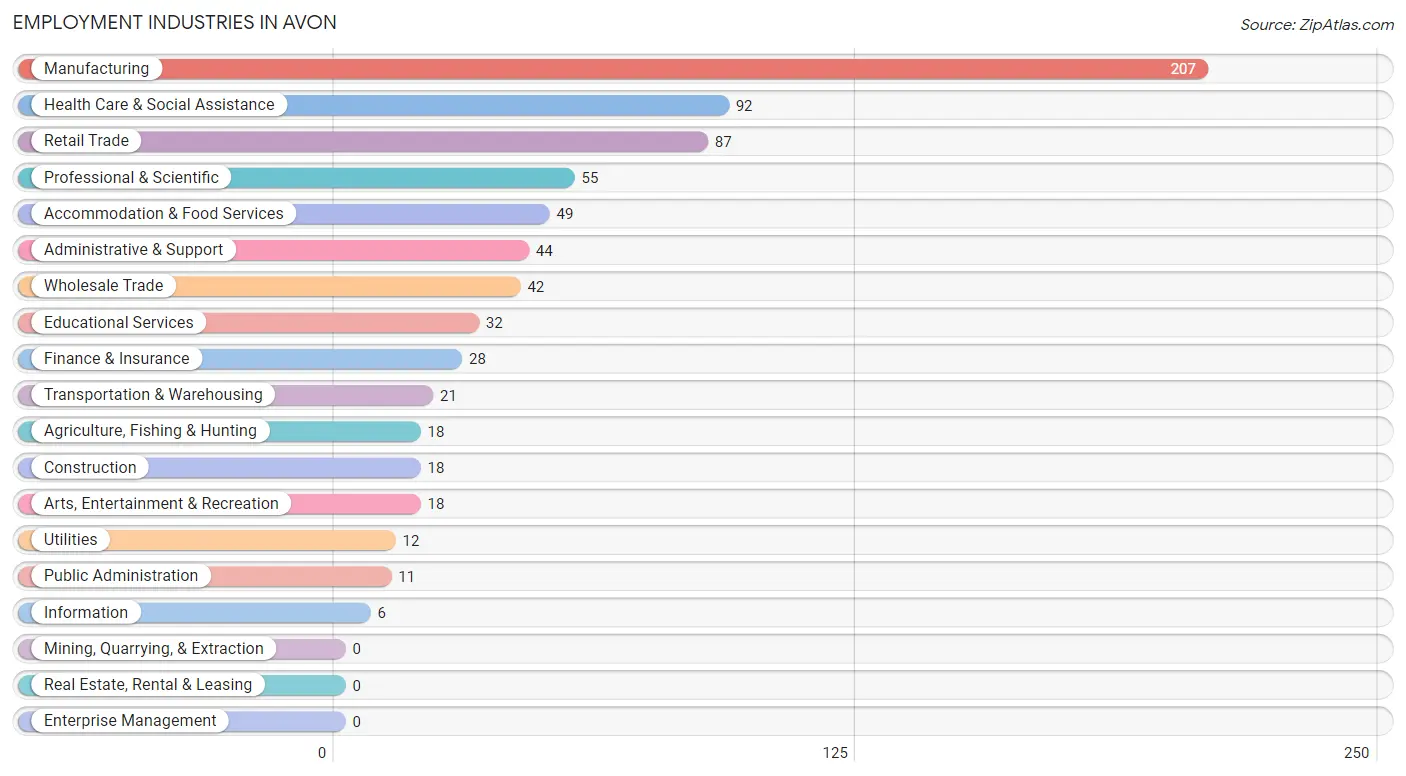
Employment Industries in Avon
The major employment industries in Avon include Manufacturing (207 | 27.4%), Health Care & Social Assistance (92 | 12.2%), Retail Trade (87 | 11.5%), Professional & Scientific (55 | 7.3%), and Accommodation & Food Services (49 | 6.5%).
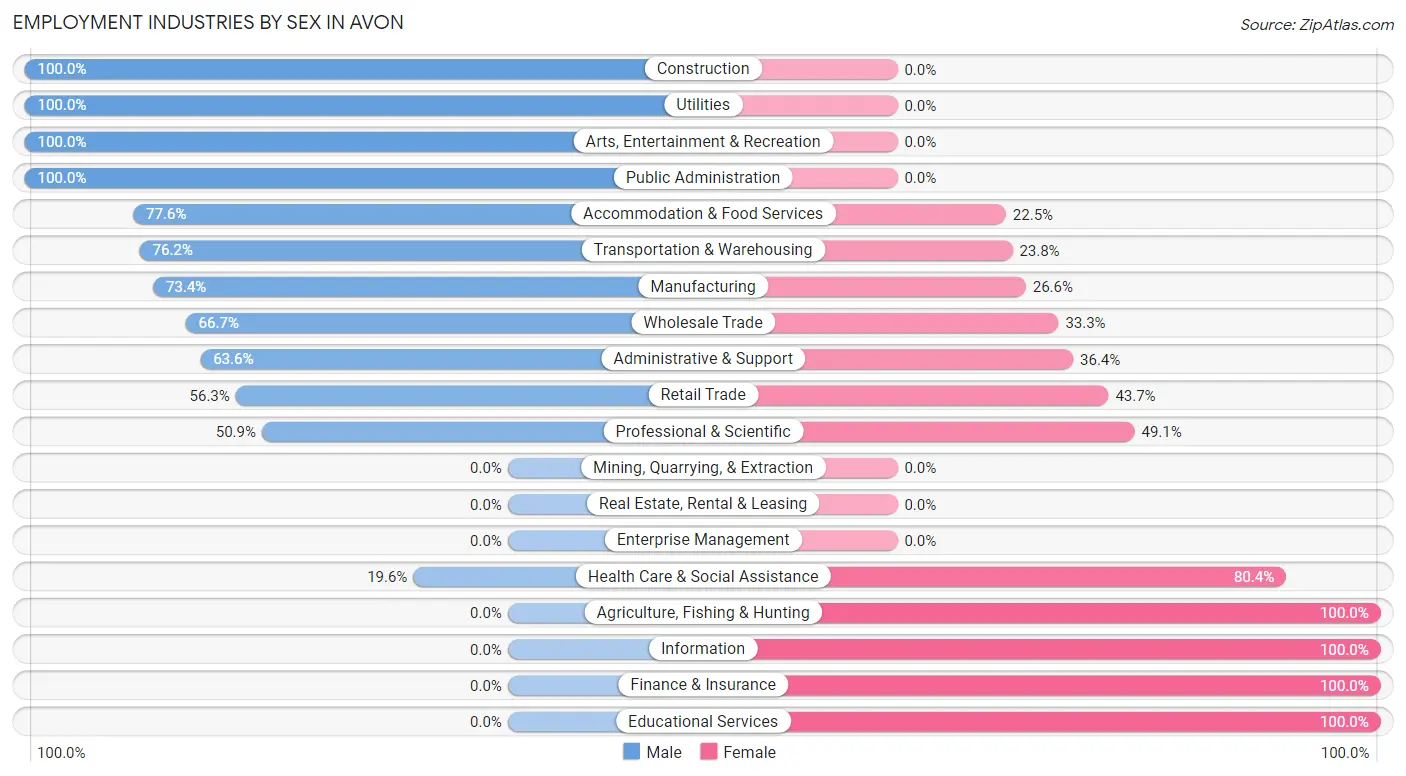
Employment Industries by Sex in Avon
The Avon industries that see more men than women are Construction (100.0%), Utilities (100.0%), and Arts, Entertainment & Recreation (100.0%), whereas the industries that tend to have a higher number of women are Agriculture, Fishing & Hunting (100.0%), Information (100.0%), and Finance & Insurance (100.0%).
| Industry | Male | Female |
| Agriculture, Fishing & Hunting | 0 (0.0%) | 18 (100.0%) |
| Mining, Quarrying, & Extraction | 0 (0.0%) | 0 (0.0%) |
| Construction | 18 (100.0%) | 0 (0.0%) |
| Manufacturing | 152 (73.4%) | 55 (26.6%) |
| Wholesale Trade | 28 (66.7%) | 14 (33.3%) |
| Retail Trade | 49 (56.3%) | 38 (43.7%) |
| Transportation & Warehousing | 16 (76.2%) | 5 (23.8%) |
| Utilities | 12 (100.0%) | 0 (0.0%) |
| Information | 0 (0.0%) | 6 (100.0%) |
| Finance & Insurance | 0 (0.0%) | 28 (100.0%) |
| Real Estate, Rental & Leasing | 0 (0.0%) | 0 (0.0%) |
| Professional & Scientific | 28 (50.9%) | 27 (49.1%) |
| Enterprise Management | 0 (0.0%) | 0 (0.0%) |
| Administrative & Support | 28 (63.6%) | 16 (36.4%) |
| Educational Services | 0 (0.0%) | 32 (100.0%) |
| Health Care & Social Assistance | 18 (19.6%) | 74 (80.4%) |
| Arts, Entertainment & Recreation | 18 (100.0%) | 0 (0.0%) |
| Accommodation & Food Services | 38 (77.5%) | 11 (22.5%) |
| Public Administration | 11 (100.0%) | 0 (0.0%) |
| Total | 416 (55.1%) | 339 (44.9%) |
Education in Avon
School Enrollment in Avon
The most common levels of schooling among the 229 students in Avon are high school (83 | 36.2%), elementary school (62 | 27.1%), and middle school (59 | 25.8%).
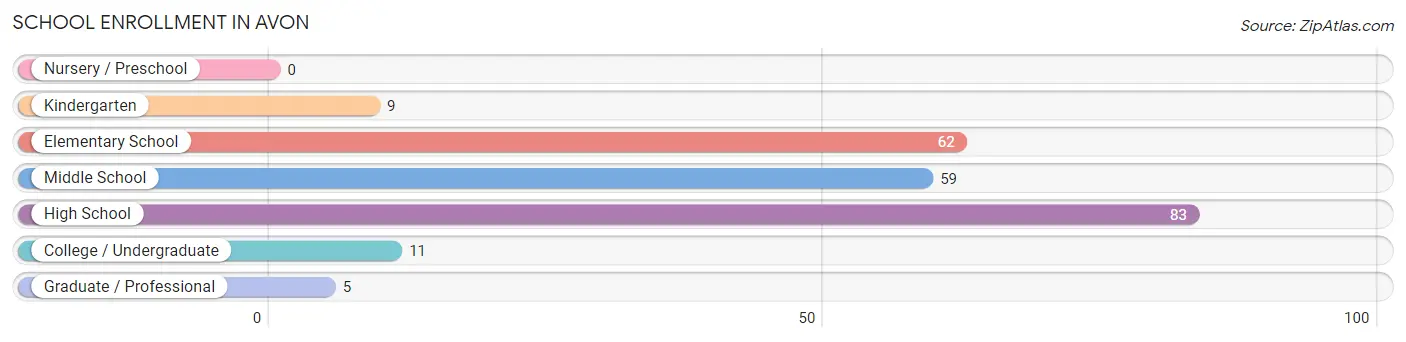
| School Level | # Students | % Students |
| Nursery / Preschool | 0 | 0.0% |
| Kindergarten | 9 | 3.9% |
| Elementary School | 62 | 27.1% |
| Middle School | 59 | 25.8% |
| High School | 83 | 36.2% |
| College / Undergraduate | 11 | 4.8% |
| Graduate / Professional | 5 | 2.2% |
| Total | 229 | 100.0% |
School Enrollment by Age by Funding Source in Avon
Out of a total of 229 students who are enrolled in schools in Avon, 23 (10.0%) attend a private institution, while the remaining 206 (90.0%) are enrolled in public schools. The age group of 20 to 24 year olds has the highest likelihood of being enrolled in private schools, with 3 (100.0% in the age bracket) enrolled. Conversely, the age group of 15 to 17 year olds has the lowest likelihood of being enrolled in a private school, with 42 (100.0% in the age bracket) attending a public institution.
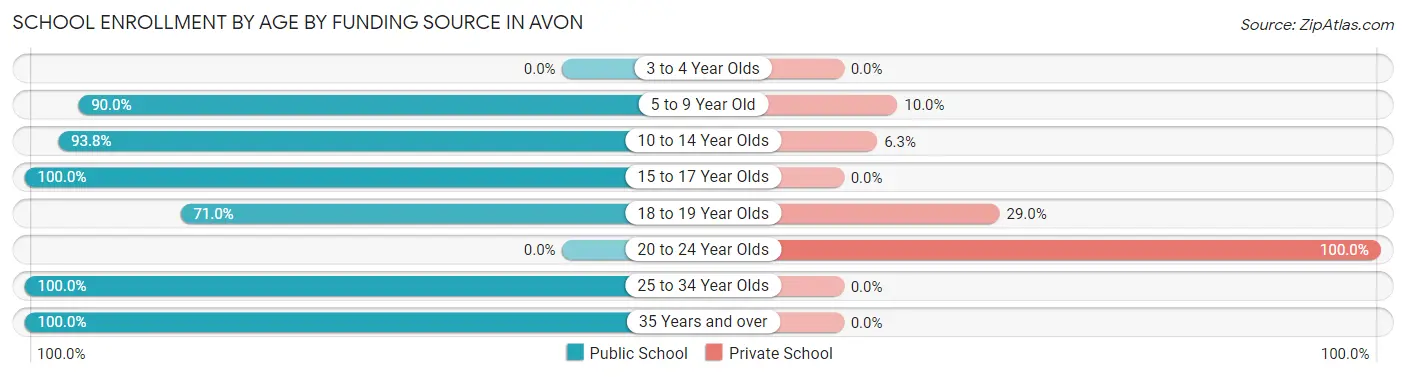
| Age Bracket | Public School | Private School |
| 3 to 4 Year Olds | 0 (0.0%) | 0 (0.0%) |
| 5 to 9 Year Old | 54 (90.0%) | 6 (10.0%) |
| 10 to 14 Year Olds | 75 (93.8%) | 5 (6.2%) |
| 15 to 17 Year Olds | 42 (100.0%) | 0 (0.0%) |
| 18 to 19 Year Olds | 22 (71.0%) | 9 (29.0%) |
| 20 to 24 Year Olds | 0 (0.0%) | 3 (100.0%) |
| 25 to 34 Year Olds | 1 (100.0%) | 0 (0.0%) |
| 35 Years and over | 12 (100.0%) | 0 (0.0%) |
| Total | 206 (90.0%) | 23 (10.0%) |
Educational Attainment by Field of Study in Avon
Education (22 | 20.2%), engineering (18 | 16.5%), liberal arts & history (14 | 12.8%), psychology (13 | 11.9%), and arts & humanities (13 | 11.9%) are the most common fields of study among 109 individuals in Avon who have obtained a bachelor's degree or higher.
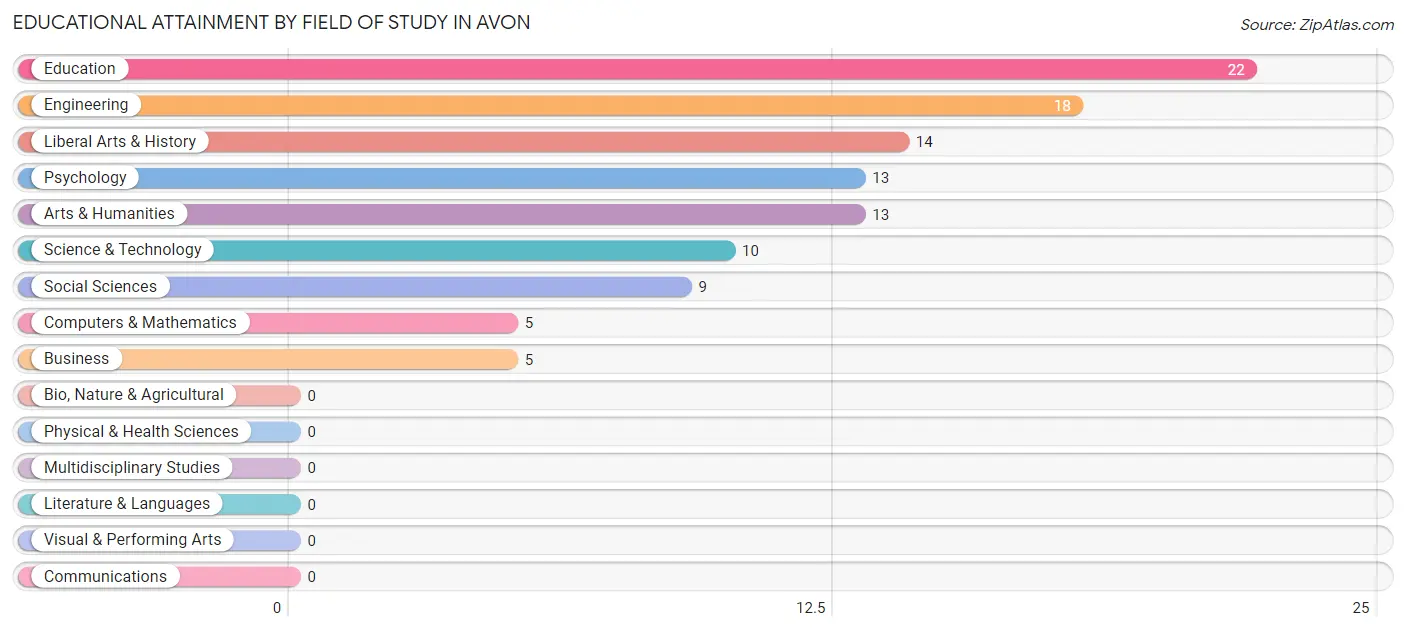
| Field of Study | # Graduates | % Graduates |
| Computers & Mathematics | 5 | 4.6% |
| Bio, Nature & Agricultural | 0 | 0.0% |
| Physical & Health Sciences | 0 | 0.0% |
| Psychology | 13 | 11.9% |
| Social Sciences | 9 | 8.3% |
| Engineering | 18 | 16.5% |
| Multidisciplinary Studies | 0 | 0.0% |
| Science & Technology | 10 | 9.2% |
| Business | 5 | 4.6% |
| Education | 22 | 20.2% |
| Literature & Languages | 0 | 0.0% |
| Liberal Arts & History | 14 | 12.8% |
| Visual & Performing Arts | 0 | 0.0% |
| Communications | 0 | 0.0% |
| Arts & Humanities | 13 | 11.9% |
| Total | 109 | 100.0% |
Transportation & Commute in Avon
Vehicle Availability by Sex in Avon
The most prevalent vehicle ownership categories in Avon are males with 2 vehicles (151, accounting for 36.3%) and females with 2 vehicles (164, making up 44.5%).
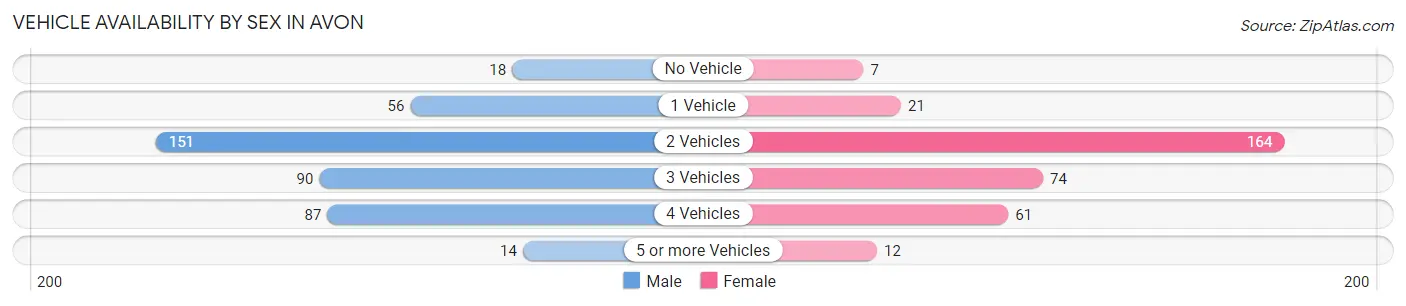
| Vehicles Available | Male | Female |
| No Vehicle | 18 (4.3%) | 7 (2.1%) |
| 1 Vehicle | 56 (13.5%) | 21 (6.2%) |
| 2 Vehicles | 151 (36.3%) | 164 (48.4%) |
| 3 Vehicles | 90 (21.6%) | 74 (21.8%) |
| 4 Vehicles | 87 (20.9%) | 61 (18.0%) |
| 5 or more Vehicles | 14 (3.4%) | 12 (3.5%) |
| Total | 416 (100.0%) | 339 (100.0%) |
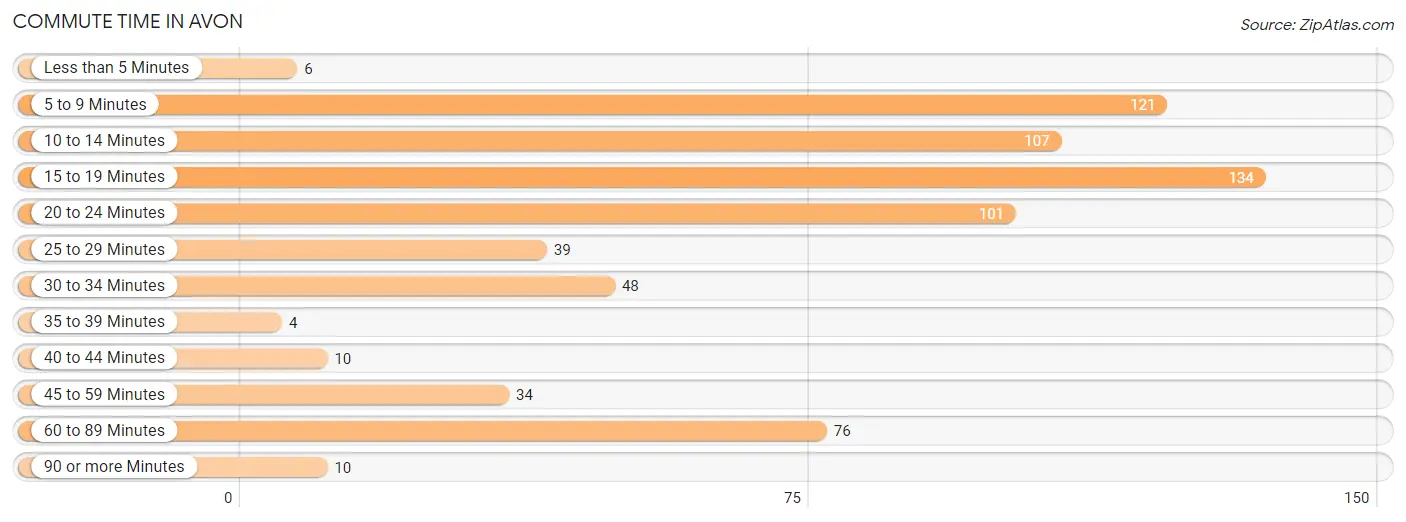
Commute Time in Avon
The most frequently occuring commute durations in Avon are 15 to 19 minutes (134 commuters, 19.4%), 5 to 9 minutes (121 commuters, 17.5%), and 10 to 14 minutes (107 commuters, 15.5%).
| Commute Time | # Commuters | % Commuters |
| Less than 5 Minutes | 6 | 0.9% |
| 5 to 9 Minutes | 121 | 17.5% |
| 10 to 14 Minutes | 107 | 15.5% |
| 15 to 19 Minutes | 134 | 19.4% |
| 20 to 24 Minutes | 101 | 14.6% |
| 25 to 29 Minutes | 39 | 5.7% |
| 30 to 34 Minutes | 48 | 7.0% |
| 35 to 39 Minutes | 4 | 0.6% |
| 40 to 44 Minutes | 10 | 1.5% |
| 45 to 59 Minutes | 34 | 4.9% |
| 60 to 89 Minutes | 76 | 11.0% |
| 90 or more Minutes | 10 | 1.5% |
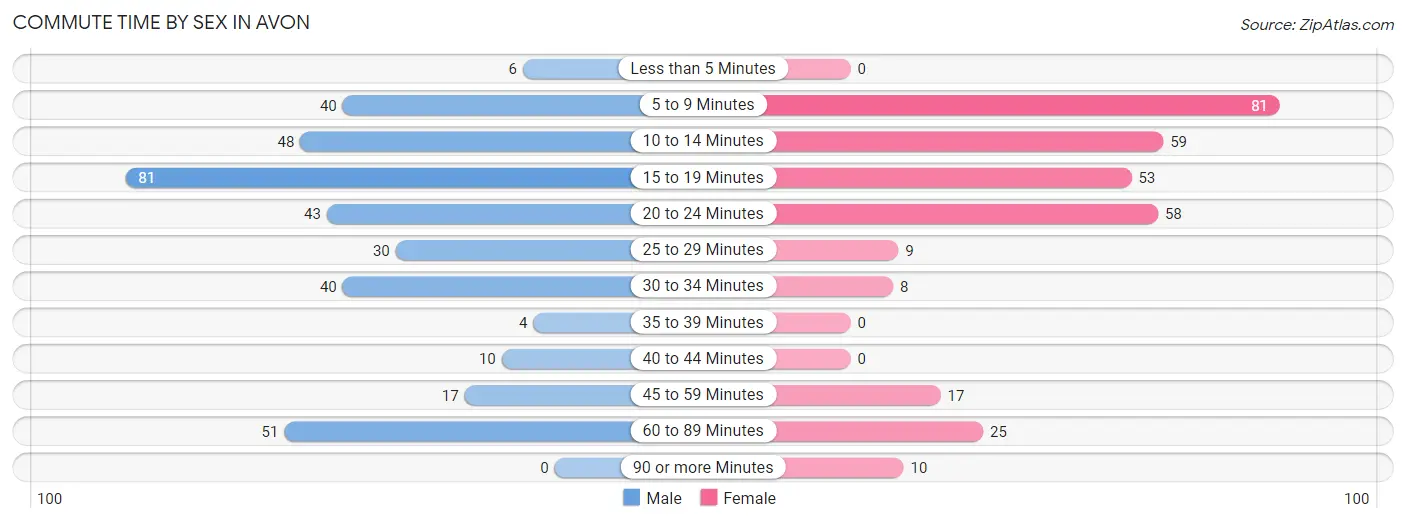
Commute Time by Sex in Avon
The most common commute times in Avon are 15 to 19 minutes (81 commuters, 21.9%) for males and 5 to 9 minutes (81 commuters, 25.3%) for females.
| Commute Time | Male | Female |
| Less than 5 Minutes | 6 (1.6%) | 0 (0.0%) |
| 5 to 9 Minutes | 40 (10.8%) | 81 (25.3%) |
| 10 to 14 Minutes | 48 (13.0%) | 59 (18.4%) |
| 15 to 19 Minutes | 81 (21.9%) | 53 (16.6%) |
| 20 to 24 Minutes | 43 (11.6%) | 58 (18.1%) |
| 25 to 29 Minutes | 30 (8.1%) | 9 (2.8%) |
| 30 to 34 Minutes | 40 (10.8%) | 8 (2.5%) |
| 35 to 39 Minutes | 4 (1.1%) | 0 (0.0%) |
| 40 to 44 Minutes | 10 (2.7%) | 0 (0.0%) |
| 45 to 59 Minutes | 17 (4.6%) | 17 (5.3%) |
| 60 to 89 Minutes | 51 (13.8%) | 25 (7.8%) |
| 90 or more Minutes | 0 (0.0%) | 10 (3.1%) |
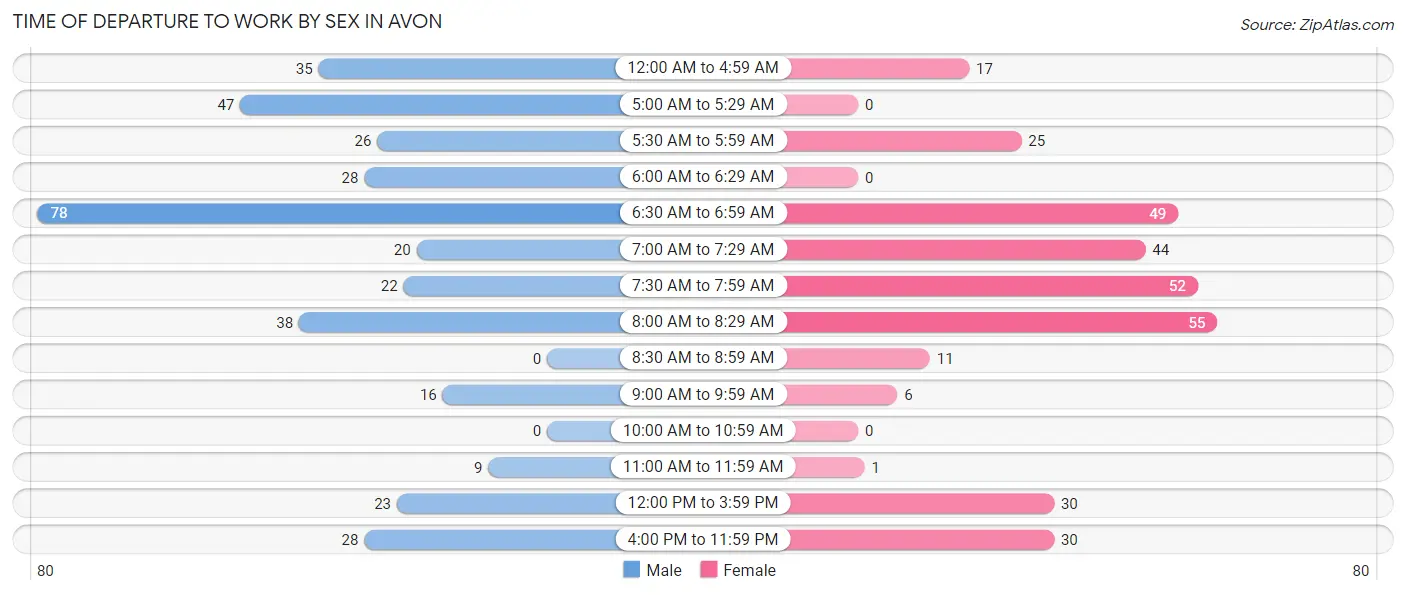
Time of Departure to Work by Sex in Avon
The most frequent times of departure to work in Avon are 6:30 AM to 6:59 AM (78, 21.1%) for males and 8:00 AM to 8:29 AM (55, 17.2%) for females.
| Time of Departure | Male | Female |
| 12:00 AM to 4:59 AM | 35 (9.5%) | 17 (5.3%) |
| 5:00 AM to 5:29 AM | 47 (12.7%) | 0 (0.0%) |
| 5:30 AM to 5:59 AM | 26 (7.0%) | 25 (7.8%) |
| 6:00 AM to 6:29 AM | 28 (7.6%) | 0 (0.0%) |
| 6:30 AM to 6:59 AM | 78 (21.1%) | 49 (15.3%) |
| 7:00 AM to 7:29 AM | 20 (5.4%) | 44 (13.8%) |
| 7:30 AM to 7:59 AM | 22 (5.9%) | 52 (16.3%) |
| 8:00 AM to 8:29 AM | 38 (10.3%) | 55 (17.2%) |
| 8:30 AM to 8:59 AM | 0 (0.0%) | 11 (3.4%) |
| 9:00 AM to 9:59 AM | 16 (4.3%) | 6 (1.9%) |
| 10:00 AM to 10:59 AM | 0 (0.0%) | 0 (0.0%) |
| 11:00 AM to 11:59 AM | 9 (2.4%) | 1 (0.3%) |
| 12:00 PM to 3:59 PM | 23 (6.2%) | 30 (9.4%) |
| 4:00 PM to 11:59 PM | 28 (7.6%) | 30 (9.4%) |
| Total | 370 (100.0%) | 320 (100.0%) |
Housing Occupancy in Avon
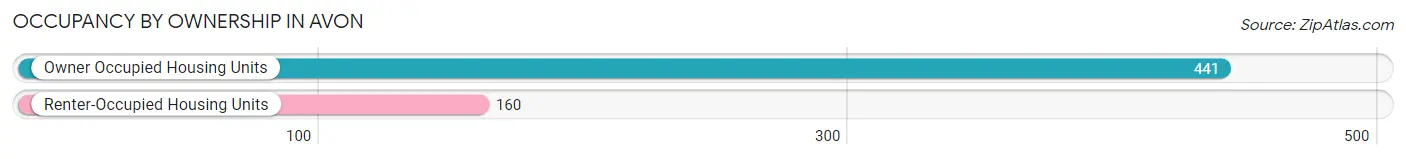
Occupancy by Ownership in Avon
Of the total 601 dwellings in Avon, owner-occupied units account for 441 (73.4%), while renter-occupied units make up 160 (26.6%).
| Occupancy | # Housing Units | % Housing Units |
| Owner Occupied Housing Units | 441 | 73.4% |
| Renter-Occupied Housing Units | 160 | 26.6% |
| Total Occupied Housing Units | 601 | 100.0% |
Occupancy by Household Size in Avon
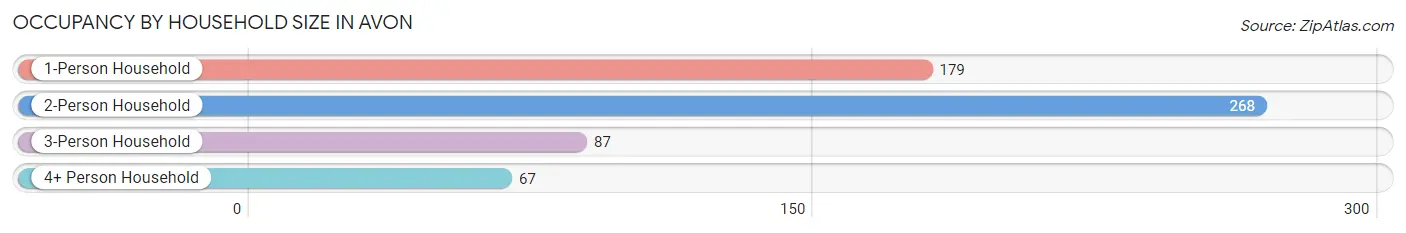
| Household Size | # Housing Units | % Housing Units |
| 1-Person Household | 179 | 29.8% |
| 2-Person Household | 268 | 44.6% |
| 3-Person Household | 87 | 14.5% |
| 4+ Person Household | 67 | 11.2% |
| Total Housing Units | 601 | 100.0% |
Occupancy by Ownership by Household Size in Avon
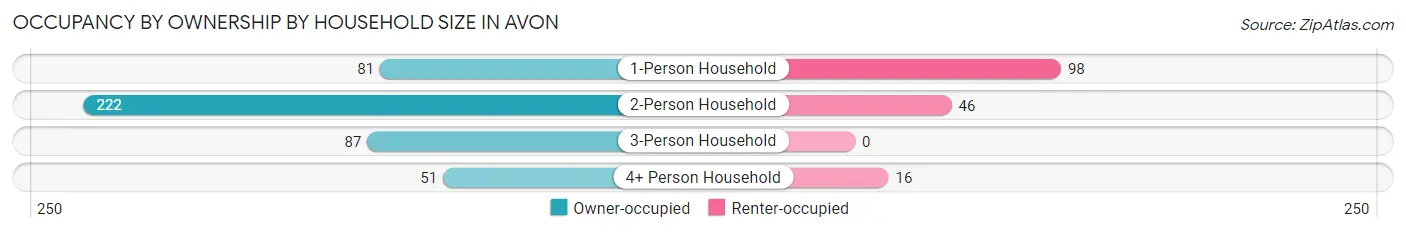
| Household Size | Owner-occupied | Renter-occupied |
| 1-Person Household | 81 (45.3%) | 98 (54.7%) |
| 2-Person Household | 222 (82.8%) | 46 (17.2%) |
| 3-Person Household | 87 (100.0%) | 0 (0.0%) |
| 4+ Person Household | 51 (76.1%) | 16 (23.9%) |
| Total Housing Units | 441 (73.4%) | 160 (26.6%) |
Occupancy by Educational Attainment in Avon
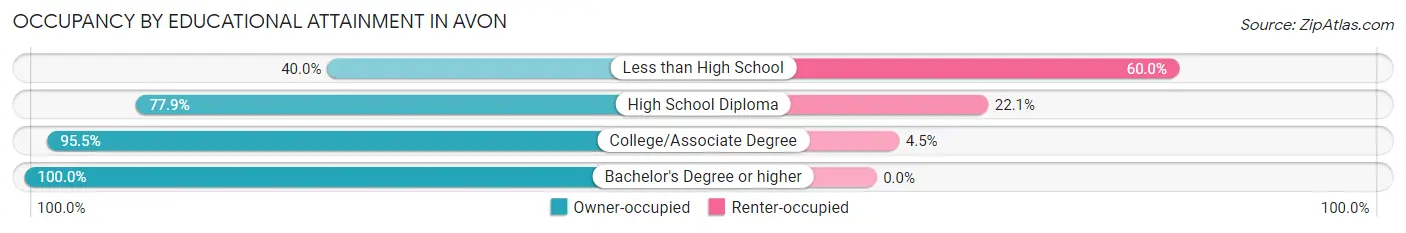
| Household Size | Owner-occupied | Renter-occupied |
| Less than High School | 62 (40.0%) | 93 (60.0%) |
| High School Diploma | 218 (77.9%) | 62 (22.1%) |
| College/Associate Degree | 106 (95.5%) | 5 (4.5%) |
| Bachelor's Degree or higher | 55 (100.0%) | 0 (0.0%) |
Occupancy by Age of Householder in Avon
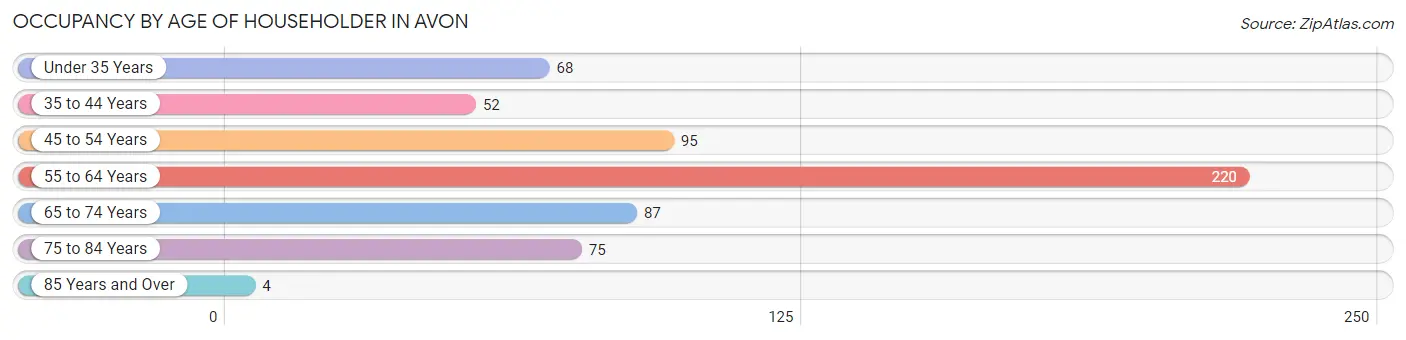
| Age Bracket | # Households | % Households |
| Under 35 Years | 68 | 11.3% |
| 35 to 44 Years | 52 | 8.6% |
| 45 to 54 Years | 95 | 15.8% |
| 55 to 64 Years | 220 | 36.6% |
| 65 to 74 Years | 87 | 14.5% |
| 75 to 84 Years | 75 | 12.5% |
| 85 Years and Over | 4 | 0.7% |
| Total | 601 | 100.0% |
Housing Finances in Avon
Median Income by Occupancy in Avon
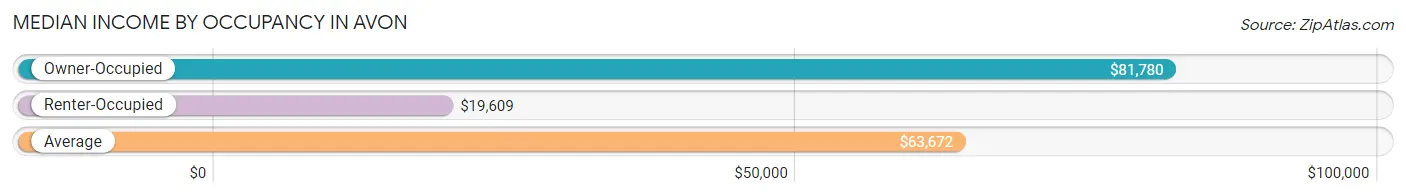
| Occupancy Type | # Households | Median Income |
| Owner-Occupied | 441 (73.4%) | $81,780 |
| Renter-Occupied | 160 (26.6%) | $19,609 |
| Average | 601 (100.0%) | $63,672 |
Occupancy by Householder Income Bracket in Avon
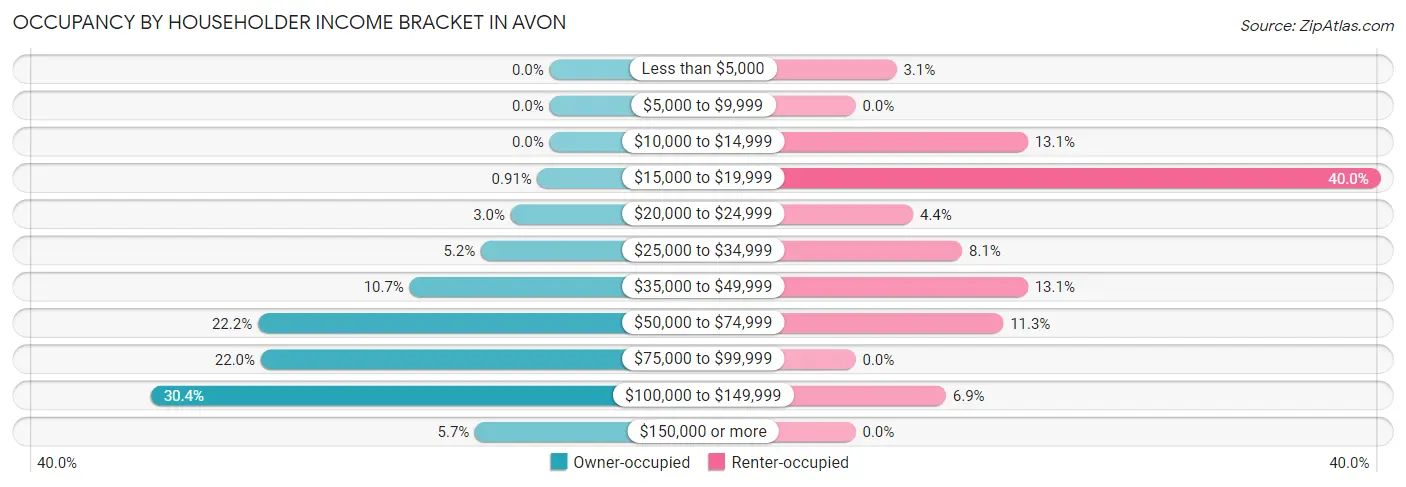
| Income Bracket | Owner-occupied | Renter-occupied |
| Less than $5,000 | 0 (0.0%) | 5 (3.1%) |
| $5,000 to $9,999 | 0 (0.0%) | 0 (0.0%) |
| $10,000 to $14,999 | 0 (0.0%) | 21 (13.1%) |
| $15,000 to $19,999 | 4 (0.9%) | 64 (40.0%) |
| $20,000 to $24,999 | 13 (2.9%) | 7 (4.4%) |
| $25,000 to $34,999 | 23 (5.2%) | 13 (8.1%) |
| $35,000 to $49,999 | 47 (10.7%) | 21 (13.1%) |
| $50,000 to $74,999 | 98 (22.2%) | 18 (11.3%) |
| $75,000 to $99,999 | 97 (22.0%) | 0 (0.0%) |
| $100,000 to $149,999 | 134 (30.4%) | 11 (6.9%) |
| $150,000 or more | 25 (5.7%) | 0 (0.0%) |
| Total | 441 (100.0%) | 160 (100.0%) |
Monthly Housing Cost Tiers in Avon
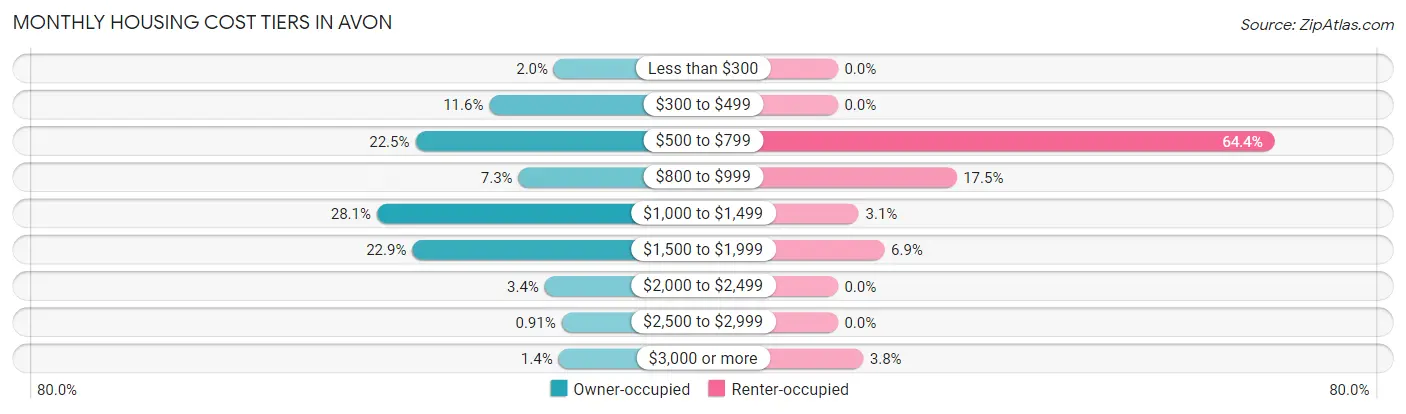
| Monthly Cost | Owner-occupied | Renter-occupied |
| Less than $300 | 9 (2.0%) | 0 (0.0%) |
| $300 to $499 | 51 (11.6%) | 0 (0.0%) |
| $500 to $799 | 99 (22.5%) | 103 (64.4%) |
| $800 to $999 | 32 (7.3%) | 28 (17.5%) |
| $1,000 to $1,499 | 124 (28.1%) | 5 (3.1%) |
| $1,500 to $1,999 | 101 (22.9%) | 11 (6.9%) |
| $2,000 to $2,499 | 15 (3.4%) | 0 (0.0%) |
| $2,500 to $2,999 | 4 (0.9%) | 0 (0.0%) |
| $3,000 or more | 6 (1.4%) | 6 (3.7%) |
| Total | 441 (100.0%) | 160 (100.0%) |
Physical Housing Characteristics in Avon
Housing Structures in Avon
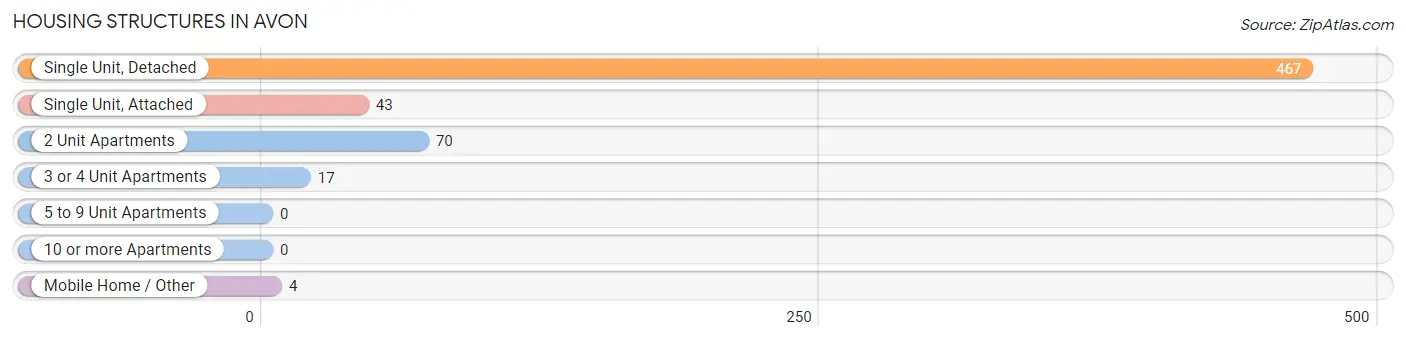
| Structure Type | # Housing Units | % Housing Units |
| Single Unit, Detached | 467 | 77.7% |
| Single Unit, Attached | 43 | 7.1% |
| 2 Unit Apartments | 70 | 11.7% |
| 3 or 4 Unit Apartments | 17 | 2.8% |
| 5 to 9 Unit Apartments | 0 | 0.0% |
| 10 or more Apartments | 0 | 0.0% |
| Mobile Home / Other | 4 | 0.7% |
| Total | 601 | 100.0% |
Housing Structures by Occupancy in Avon
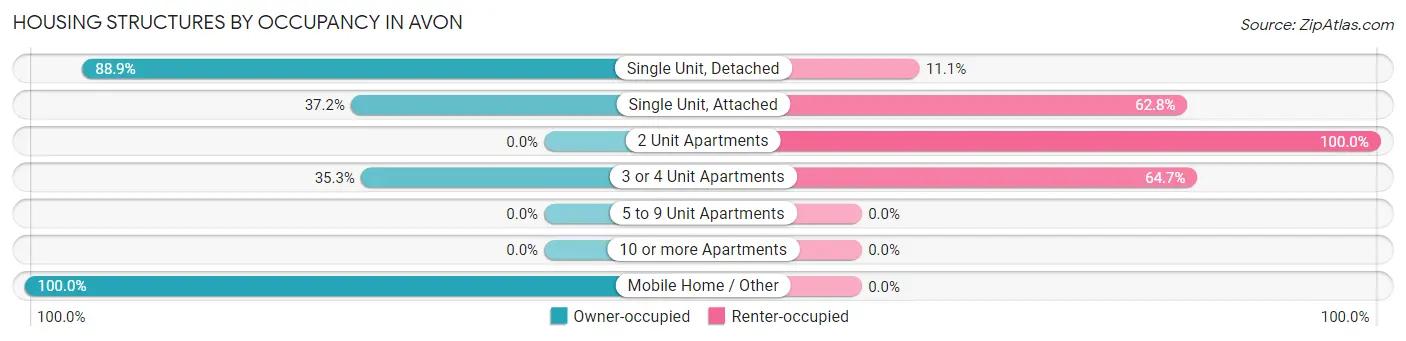
| Structure Type | Owner-occupied | Renter-occupied |
| Single Unit, Detached | 415 (88.9%) | 52 (11.1%) |
| Single Unit, Attached | 16 (37.2%) | 27 (62.8%) |
| 2 Unit Apartments | 0 (0.0%) | 70 (100.0%) |
| 3 or 4 Unit Apartments | 6 (35.3%) | 11 (64.7%) |
| 5 to 9 Unit Apartments | 0 (0.0%) | 0 (0.0%) |
| 10 or more Apartments | 0 (0.0%) | 0 (0.0%) |
| Mobile Home / Other | 4 (100.0%) | 0 (0.0%) |
| Total | 441 (73.4%) | 160 (26.6%) |
Housing Structures by Number of Rooms in Avon
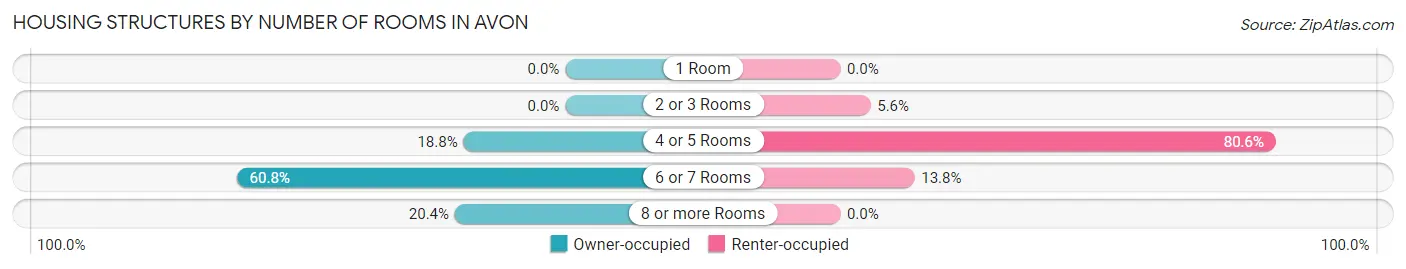
| Number of Rooms | Owner-occupied | Renter-occupied |
| 1 Room | 0 (0.0%) | 0 (0.0%) |
| 2 or 3 Rooms | 0 (0.0%) | 9 (5.6%) |
| 4 or 5 Rooms | 83 (18.8%) | 129 (80.6%) |
| 6 or 7 Rooms | 268 (60.8%) | 22 (13.8%) |
| 8 or more Rooms | 90 (20.4%) | 0 (0.0%) |
| Total | 441 (100.0%) | 160 (100.0%) |
Housing Structure by Heating Type in Avon
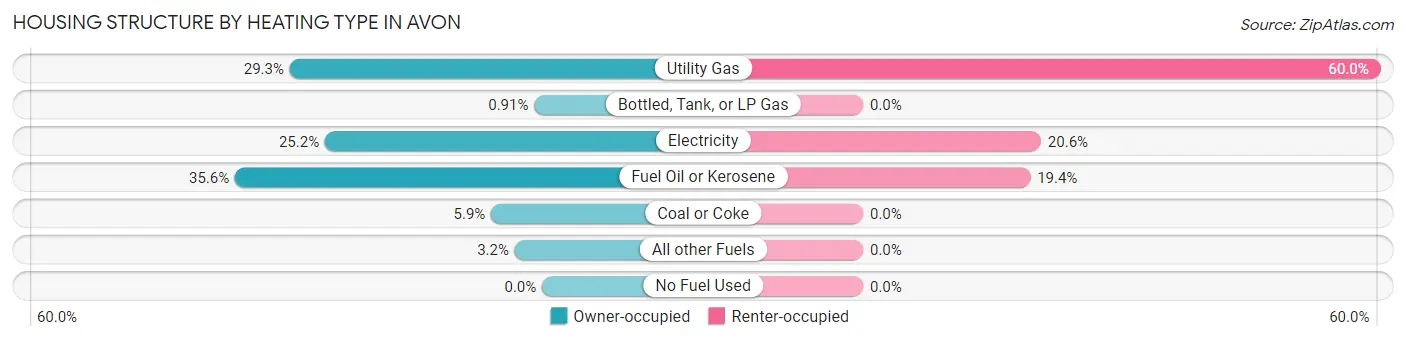
| Heating Type | Owner-occupied | Renter-occupied |
| Utility Gas | 129 (29.2%) | 96 (60.0%) |
| Bottled, Tank, or LP Gas | 4 (0.9%) | 0 (0.0%) |
| Electricity | 111 (25.2%) | 33 (20.6%) |
| Fuel Oil or Kerosene | 157 (35.6%) | 31 (19.4%) |
| Coal or Coke | 26 (5.9%) | 0 (0.0%) |
| All other Fuels | 14 (3.2%) | 0 (0.0%) |
| No Fuel Used | 0 (0.0%) | 0 (0.0%) |
| Total | 441 (100.0%) | 160 (100.0%) |
Household Vehicle Usage in Avon
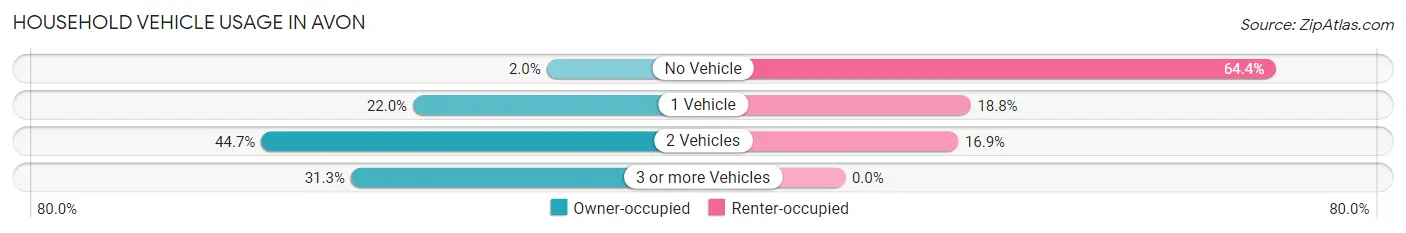
| Vehicles per Household | Owner-occupied | Renter-occupied |
| No Vehicle | 9 (2.0%) | 103 (64.4%) |
| 1 Vehicle | 97 (22.0%) | 30 (18.8%) |
| 2 Vehicles | 197 (44.7%) | 27 (16.9%) |
| 3 or more Vehicles | 138 (31.3%) | 0 (0.0%) |
| Total | 441 (100.0%) | 160 (100.0%) |
Real Estate & Mortgages in Avon
Real Estate and Mortgage Overview in Avon
| Characteristic | Without Mortgage | With Mortgage |
| Housing Units | 151 | 290 |
| Median Property Value | $212,300 | $188,800 |
| Median Household Income | $63,047 | $20 |
| Monthly Housing Costs | $541 | $6 |
| Real Estate Taxes | $2,456 | $0 |
Property Value by Mortgage Status in Avon
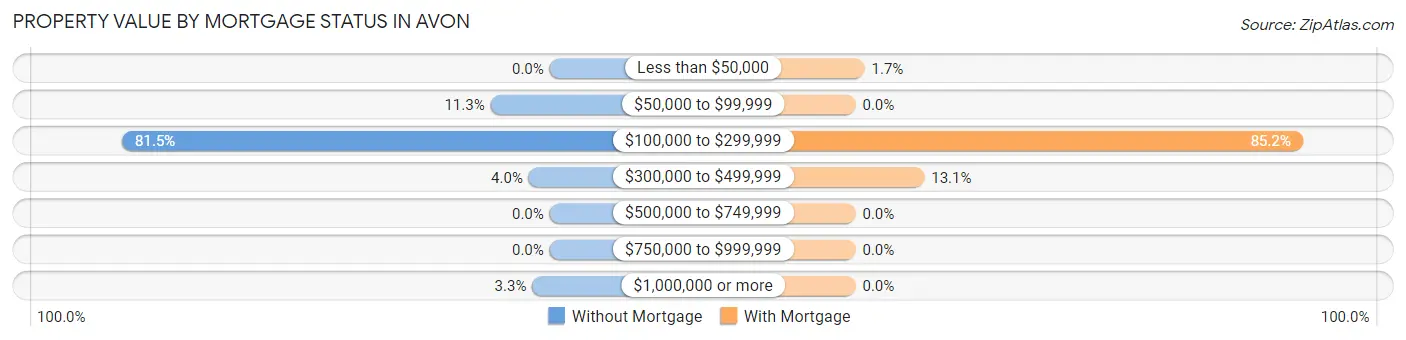
| Property Value | Without Mortgage | With Mortgage |
| Less than $50,000 | 0 (0.0%) | 5 (1.7%) |
| $50,000 to $99,999 | 17 (11.3%) | 0 (0.0%) |
| $100,000 to $299,999 | 123 (81.5%) | 247 (85.2%) |
| $300,000 to $499,999 | 6 (4.0%) | 38 (13.1%) |
| $500,000 to $749,999 | 0 (0.0%) | 0 (0.0%) |
| $750,000 to $999,999 | 0 (0.0%) | 0 (0.0%) |
| $1,000,000 or more | 5 (3.3%) | 0 (0.0%) |
| Total | 151 (100.0%) | 290 (100.0%) |
Household Income by Mortgage Status in Avon
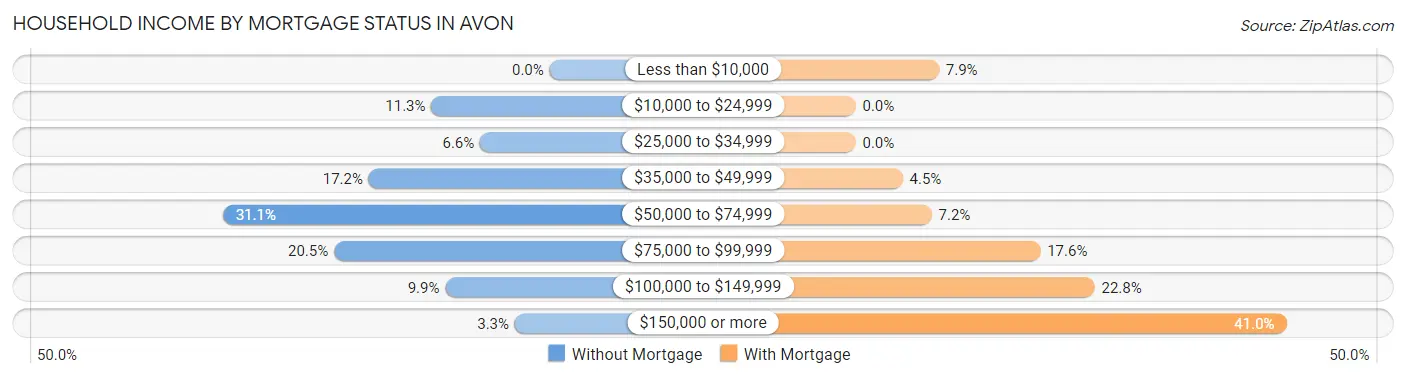
| Household Income | Without Mortgage | With Mortgage |
| Less than $10,000 | 0 (0.0%) | 23 (7.9%) |
| $10,000 to $24,999 | 17 (11.3%) | 0 (0.0%) |
| $25,000 to $34,999 | 10 (6.6%) | 0 (0.0%) |
| $35,000 to $49,999 | 26 (17.2%) | 13 (4.5%) |
| $50,000 to $74,999 | 47 (31.1%) | 21 (7.2%) |
| $75,000 to $99,999 | 31 (20.5%) | 51 (17.6%) |
| $100,000 to $149,999 | 15 (9.9%) | 66 (22.8%) |
| $150,000 or more | 5 (3.3%) | 119 (41.0%) |
| Total | 151 (100.0%) | 290 (100.0%) |
Property Value to Household Income Ratio in Avon
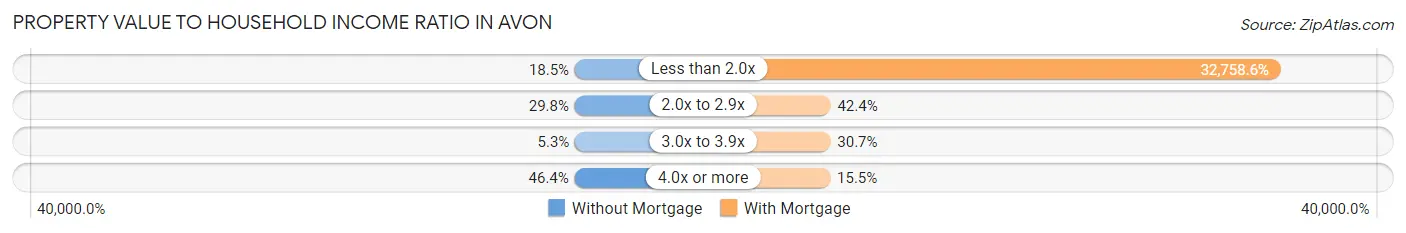
| Value-to-Income Ratio | Without Mortgage | With Mortgage |
| Less than 2.0x | 28 (18.5%) | 95,000 (32,758.6%) |
| 2.0x to 2.9x | 45 (29.8%) | 123 (42.4%) |
| 3.0x to 3.9x | 8 (5.3%) | 89 (30.7%) |
| 4.0x or more | 70 (46.4%) | 45 (15.5%) |
| Total | 151 (100.0%) | 290 (100.0%) |
Real Estate Taxes by Mortgage Status in Avon
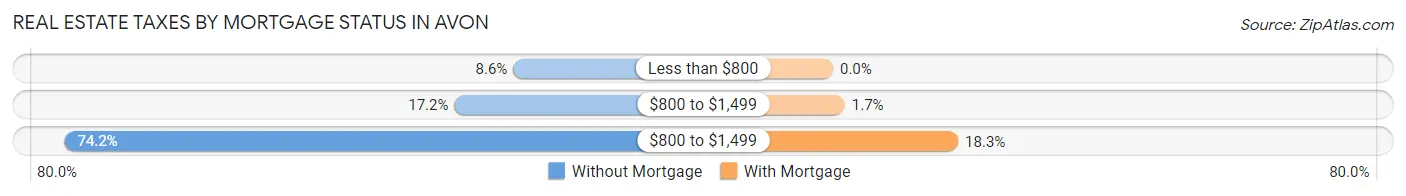
| Property Taxes | Without Mortgage | With Mortgage |
| Less than $800 | 13 (8.6%) | 0 (0.0%) |
| $800 to $1,499 | 26 (17.2%) | 5 (1.7%) |
| $800 to $1,499 | 112 (74.2%) | 53 (18.3%) |
| Total | 151 (100.0%) | 290 (100.0%) |
Health & Disability in Avon
Health Insurance Coverage by Age in Avon
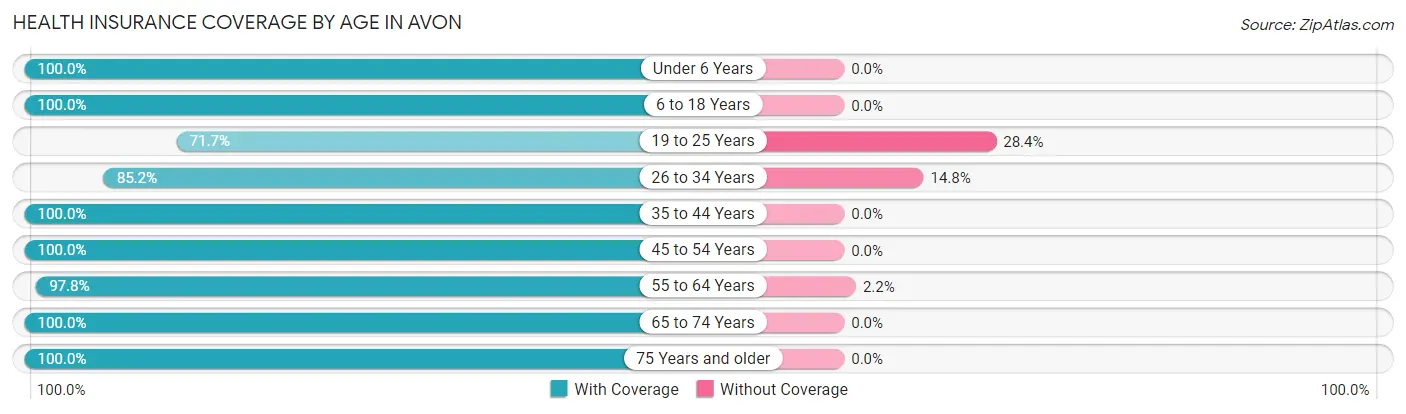
| Age Bracket | With Coverage | Without Coverage |
| Under 6 Years | 40 (100.0%) | 0 (0.0%) |
| 6 to 18 Years | 218 (100.0%) | 0 (0.0%) |
| 19 to 25 Years | 91 (71.7%) | 36 (28.3%) |
| 26 to 34 Years | 98 (85.2%) | 17 (14.8%) |
| 35 to 44 Years | 94 (100.0%) | 0 (0.0%) |
| 45 to 54 Years | 191 (100.0%) | 0 (0.0%) |
| 55 to 64 Years | 314 (97.8%) | 7 (2.2%) |
| 65 to 74 Years | 161 (100.0%) | 0 (0.0%) |
| 75 Years and older | 134 (100.0%) | 0 (0.0%) |
| Total | 1,341 (95.7%) | 60 (4.3%) |
Health Insurance Coverage by Citizenship Status in Avon
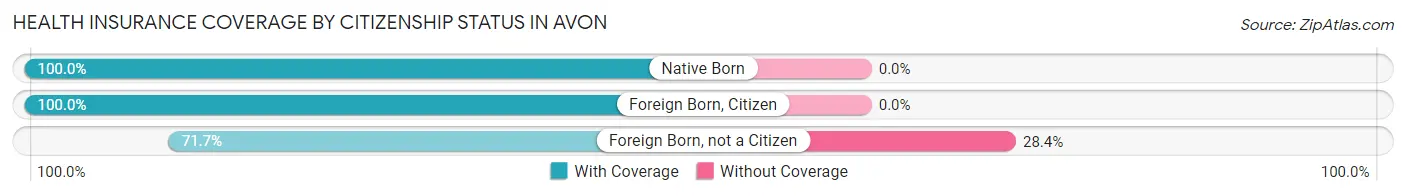
| Citizenship Status | With Coverage | Without Coverage |
| Native Born | 40 (100.0%) | 0 (0.0%) |
| Foreign Born, Citizen | 218 (100.0%) | 0 (0.0%) |
| Foreign Born, not a Citizen | 91 (71.7%) | 36 (28.3%) |
Health Insurance Coverage by Household Income in Avon
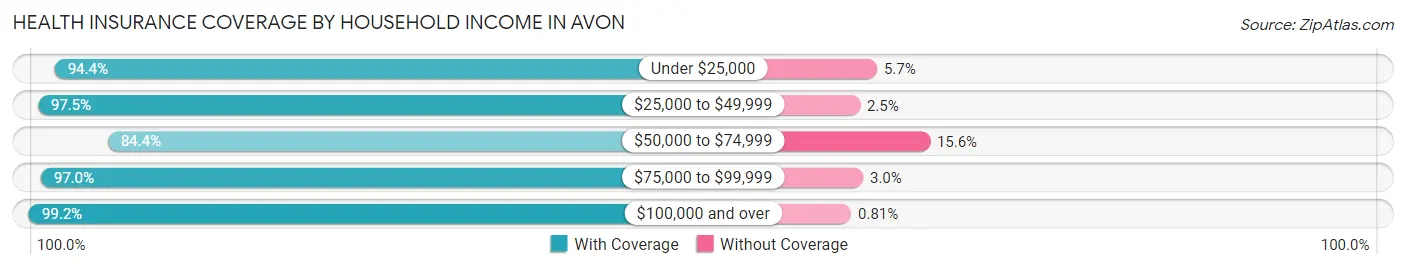
| Household Income | With Coverage | Without Coverage |
| Under $25,000 | 117 (94.4%) | 7 (5.7%) |
| $25,000 to $49,999 | 197 (97.5%) | 5 (2.5%) |
| $50,000 to $74,999 | 195 (84.4%) | 36 (15.6%) |
| $75,000 to $99,999 | 223 (97.0%) | 7 (3.0%) |
| $100,000 and over | 609 (99.2%) | 5 (0.8%) |
Public vs Private Health Insurance Coverage by Age in Avon
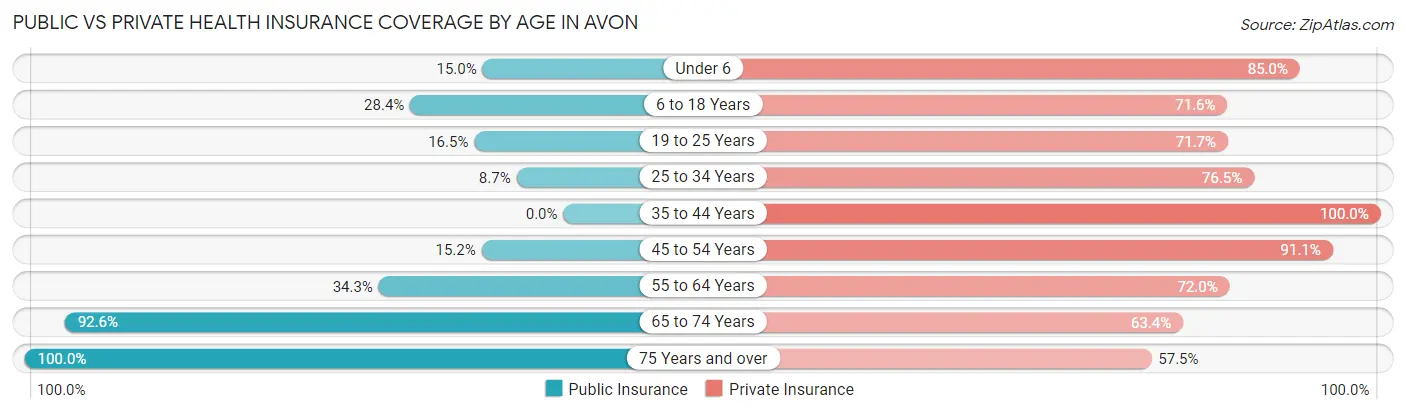
| Age Bracket | Public Insurance | Private Insurance |
| Under 6 | 6 (15.0%) | 34 (85.0%) |
| 6 to 18 Years | 62 (28.4%) | 156 (71.6%) |
| 19 to 25 Years | 21 (16.5%) | 91 (71.7%) |
| 25 to 34 Years | 10 (8.7%) | 88 (76.5%) |
| 35 to 44 Years | 0 (0.0%) | 94 (100.0%) |
| 45 to 54 Years | 29 (15.2%) | 174 (91.1%) |
| 55 to 64 Years | 110 (34.3%) | 231 (72.0%) |
| 65 to 74 Years | 149 (92.5%) | 102 (63.3%) |
| 75 Years and over | 134 (100.0%) | 77 (57.5%) |
| Total | 521 (37.2%) | 1,047 (74.7%) |
Disability Status by Sex by Age in Avon
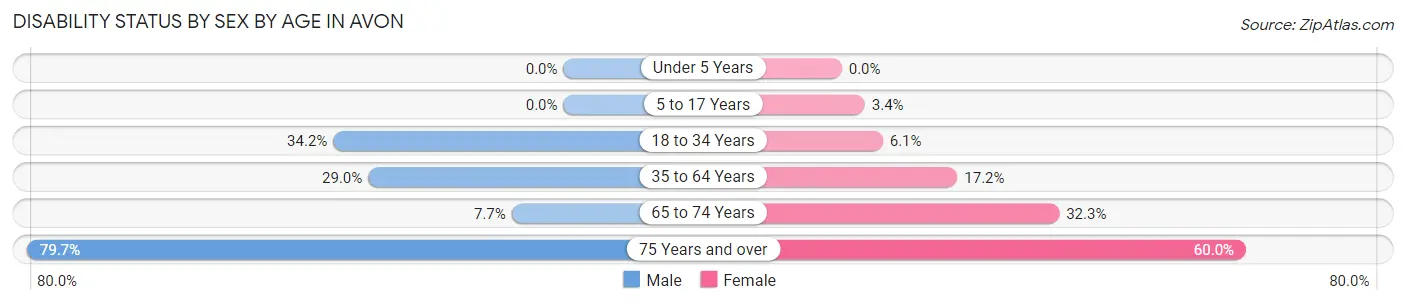
| Age Bracket | Male | Female |
| Under 5 Years | 0 (0.0%) | 0 (0.0%) |
| 5 to 17 Years | 0 (0.0%) | 5 (3.4%) |
| 18 to 34 Years | 54 (34.2%) | 7 (6.1%) |
| 35 to 64 Years | 98 (29.0%) | 46 (17.2%) |
| 65 to 74 Years | 5 (7.7%) | 31 (32.3%) |
| 75 Years and over | 47 (79.7%) | 45 (60.0%) |
Disability Class by Sex by Age in Avon
Disability Class: Hearing Difficulty
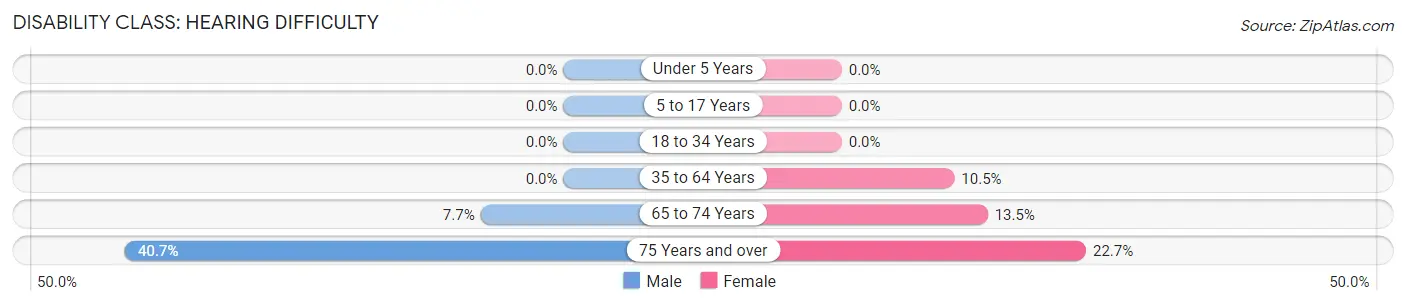
| Age Bracket | Male | Female |
| Under 5 Years | 0 (0.0%) | 0 (0.0%) |
| 5 to 17 Years | 0 (0.0%) | 0 (0.0%) |
| 18 to 34 Years | 0 (0.0%) | 0 (0.0%) |
| 35 to 64 Years | 0 (0.0%) | 28 (10.4%) |
| 65 to 74 Years | 5 (7.7%) | 13 (13.5%) |
| 75 Years and over | 24 (40.7%) | 17 (22.7%) |
Disability Class: Vision Difficulty
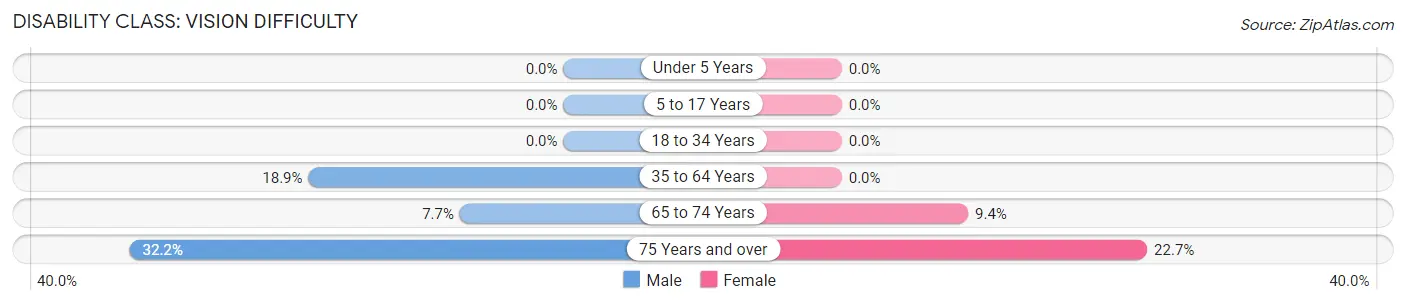
| Age Bracket | Male | Female |
| Under 5 Years | 0 (0.0%) | 0 (0.0%) |
| 5 to 17 Years | 0 (0.0%) | 0 (0.0%) |
| 18 to 34 Years | 0 (0.0%) | 0 (0.0%) |
| 35 to 64 Years | 64 (18.9%) | 0 (0.0%) |
| 65 to 74 Years | 5 (7.7%) | 9 (9.4%) |
| 75 Years and over | 19 (32.2%) | 17 (22.7%) |
Disability Class: Cognitive Difficulty
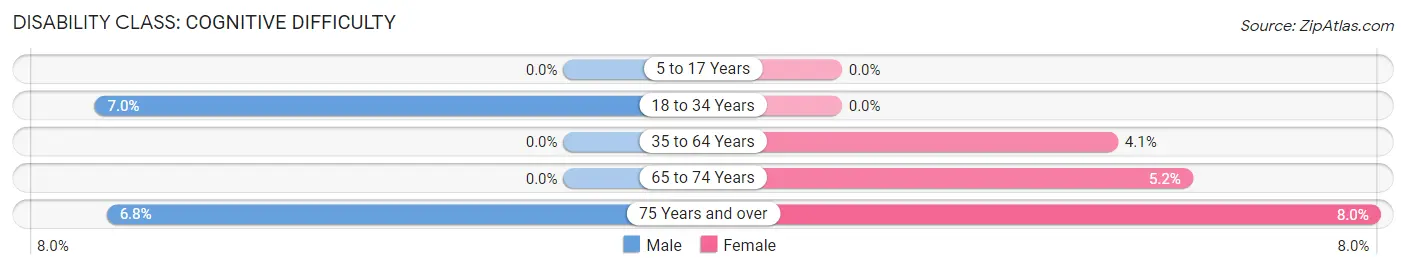
| Age Bracket | Male | Female |
| 5 to 17 Years | 0 (0.0%) | 0 (0.0%) |
| 18 to 34 Years | 11 (7.0%) | 0 (0.0%) |
| 35 to 64 Years | 0 (0.0%) | 11 (4.1%) |
| 65 to 74 Years | 0 (0.0%) | 5 (5.2%) |
| 75 Years and over | 4 (6.8%) | 6 (8.0%) |
Disability Class: Ambulatory Difficulty
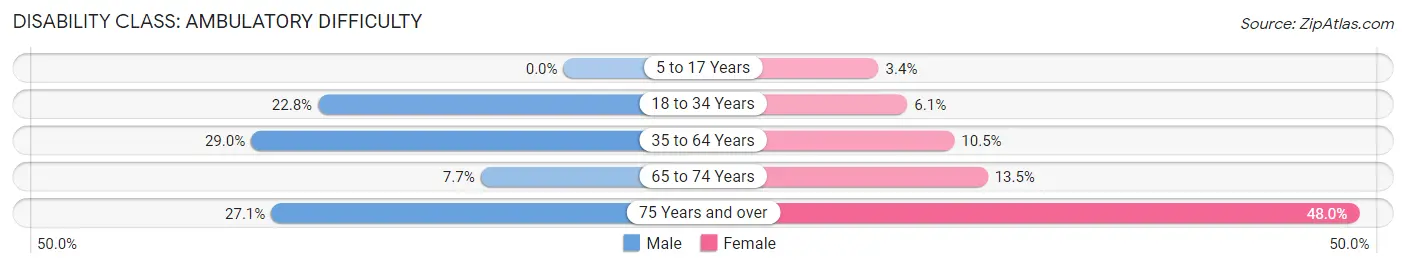
| Age Bracket | Male | Female |
| 5 to 17 Years | 0 (0.0%) | 5 (3.4%) |
| 18 to 34 Years | 36 (22.8%) | 7 (6.1%) |
| 35 to 64 Years | 98 (29.0%) | 28 (10.4%) |
| 65 to 74 Years | 5 (7.7%) | 13 (13.5%) |
| 75 Years and over | 16 (27.1%) | 36 (48.0%) |
Disability Class: Self-Care Difficulty
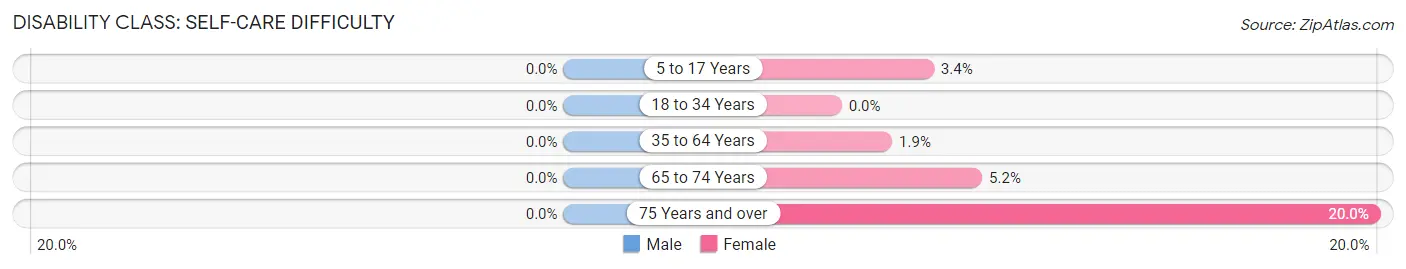
| Age Bracket | Male | Female |
| 5 to 17 Years | 0 (0.0%) | 5 (3.4%) |
| 18 to 34 Years | 0 (0.0%) | 0 (0.0%) |
| 35 to 64 Years | 0 (0.0%) | 5 (1.9%) |
| 65 to 74 Years | 0 (0.0%) | 5 (5.2%) |
| 75 Years and over | 0 (0.0%) | 15 (20.0%) |
Technology Access in Avon
Computing Device Access in Avon
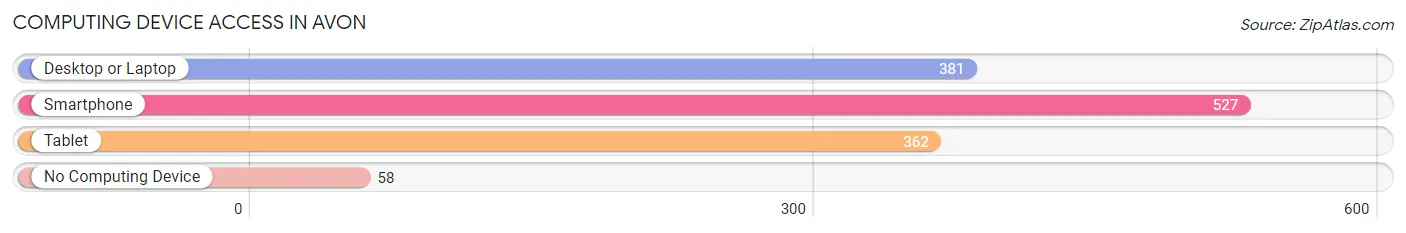
| Device Type | # Households | % Households |
| Desktop or Laptop | 381 | 63.4% |
| Smartphone | 527 | 87.7% |
| Tablet | 362 | 60.2% |
| No Computing Device | 58 | 9.7% |
| Total | 601 | 100.0% |
Internet Access in Avon
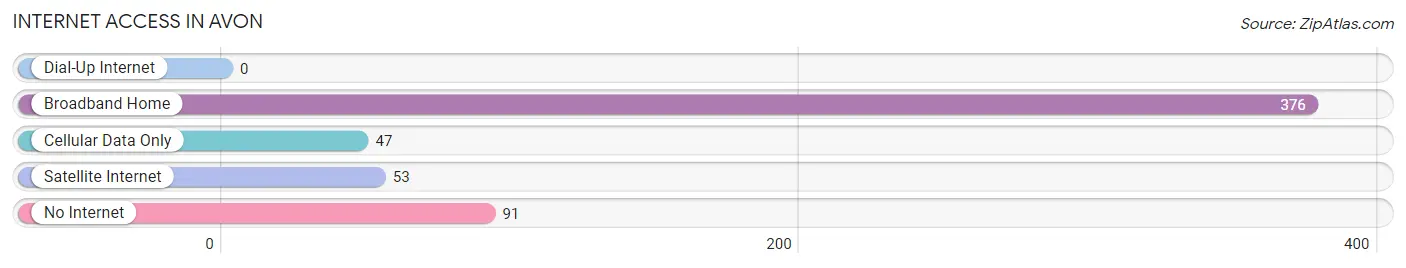
| Internet Type | # Households | % Households |
| Dial-Up Internet | 0 | 0.0% |
| Broadband Home | 376 | 62.6% |
| Cellular Data Only | 47 | 7.8% |
| Satellite Internet | 53 | 8.8% |
| No Internet | 91 | 15.1% |
| Total | 601 | 100.0% |
Avon Summary
Avon, Pennsylvania is a small borough located in the western part of the state, in the county of Lancaster. It is situated in the Susquehanna Valley, and is part of the Lancaster Metropolitan Statistical Area. The population of Avon was 1,845 as of the 2010 census.
History
Avon was founded in 1790 by a group of settlers from Lancaster County. The town was named after the Avon River in England. The first settlers were mostly of German descent, and the town was originally known as “New Berlin”. The town was officially incorporated in 1845.
Avon was a farming community for many years, and the town was known for its production of wheat, corn, and other grains. In the late 19th century, the town began to industrialize, and several factories were built in the area. The most notable of these was the Avon Iron Works, which was established in 1891 and produced a variety of products, including railroad cars and bridges.
Geography
Avon is located in western Lancaster County, in the Susquehanna Valley. The borough is situated on the banks of the Conestoga River, and is bordered by the towns of East Petersburg, Manheim, and Mount Joy. The town covers an area of 0.7 square miles, and has a total population of 1,845 as of the 2010 census.
The climate in Avon is typical of the mid-Atlantic region, with hot summers and cold winters. The average annual temperature is around 50 degrees Fahrenheit, and the average annual precipitation is around 40 inches.
Economy
Avon’s economy is largely based on agriculture and manufacturing. The town is home to several small businesses, including a variety of restaurants, shops, and services. The town is also home to several industrial parks, which are home to a variety of manufacturing companies.
The largest employer in Avon is the Avon Iron Works, which produces a variety of products, including railroad cars and bridges. Other major employers in the area include the Lancaster County Prison, the Lancaster County Courthouse, and the Lancaster County Hospital.
Demographics
As of the 2010 census, the population of Avon was 1,845. The racial makeup of the town was 94.3% White, 2.2% African American, 0.3% Native American, 0.7% Asian, 0.1% Pacific Islander, and 2.4% from other races. The median household income in Avon was $45,938, and the median family income was $51,938.
Avon is a predominantly Christian town, with the majority of the population identifying as Protestant. The town is also home to a small Jewish community, as well as a small Muslim community.
Avon is a small but vibrant town, with a rich history and a diverse population. The town is home to a variety of businesses and industries, and is a great place to live and work.
Common Questions
What is Per Capita Income in Avon?
Per Capita income in Avon is $32,800.
What is the Median Family Income in Avon?
Median Family Income in Avon is $85,833.
What is the Median Household income in Avon?
Median Household Income in Avon is $63,672.
What is Income or Wage Gap in Avon?
Income or Wage Gap in Avon is 19.4%.
Women in Avon earn 80.6 cents for every dollar earned by a man.
What is Inequality or Gini Index in Avon?
Inequality or Gini Index in Avon is 0.36.
What is the Total Population of Avon?
Total Population of Avon is 1,401.
What is the Total Male Population of Avon?
Total Male Population of Avon is 677.
What is the Total Female Population of Avon?
Total Female Population of Avon is 724.
What is the Ratio of Males per 100 Females in Avon?
There are 93.51 Males per 100 Females in Avon.
What is the Ratio of Females per 100 Males in Avon?
There are 106.94 Females per 100 Males in Avon.
What is the Median Population Age in Avon?
Median Population Age in Avon is 50.3 Years.
What is the Average Family Size in Avon
Average Family Size in Avon is 2.8 People.
What is the Average Household Size in Avon
Average Household Size in Avon is 2.3 People.
How Large is the Labor Force in Avon?
There are 779 People in the Labor Forcein in Avon.
What is the Percentage of People in the Labor Force in Avon?
64.3% of People are in the Labor Force in Avon.
What is the Unemployment Rate in Avon?
Unemployment Rate in Avon is 3.1%.