Breinigsville, PA Map & Demographics
Breinigsville Map
Breinigsville Overview
$56,530
PER CAPITA INCOME
$130,020
AVG FAMILY INCOME
$99,306
AVG HOUSEHOLD INCOME
43.5%
WAGE / INCOME GAP [ % ]
56.5¢/ $1
WAGE / INCOME GAP [ $ ]
0.48
INEQUALITY / GINI INDEX
9,035
TOTAL POPULATION
4,000
MALE POPULATION
5,035
FEMALE POPULATION
79.44
MALES / 100 FEMALES
125.88
FEMALES / 100 MALES
38.4
MEDIAN AGE
3.4
AVG FAMILY SIZE
3.1
AVG HOUSEHOLD SIZE
4,336
LABOR FORCE [ PEOPLE ]
67.8%
PERCENT IN LABOR FORCE
4.8%
UNEMPLOYMENT RATE
Breinigsville Zip Codes
Breinigsville Area Codes
Income in Breinigsville
Income Overview in Breinigsville
Per Capita Income in Breinigsville is $56,530, while median incomes of families and households are $130,020 and $99,306 respectively.
| Characteristic | Number | Measure |
| Per Capita Income | 9,035 | $56,530 |
| Median Family Income | 2,443 | $130,020 |
| Mean Family Income | 2,443 | $186,967 |
| Median Household Income | 2,899 | $99,306 |
| Mean Household Income | 2,899 | $175,401 |
| Income Deficit | 2,443 | $0 |
| Wage / Income Gap (%) | 9,035 | 43.49% |
| Wage / Income Gap ($) | 9,035 | 56.51¢ per $1 |
| Gini / Inequality Index | 9,035 | 0.48 |
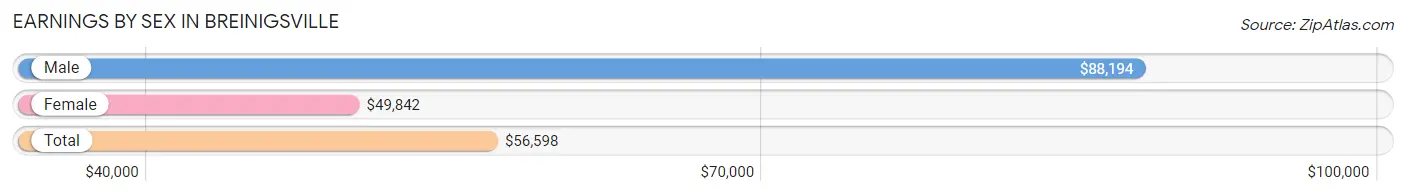
Earnings by Sex in Breinigsville
Average Earnings in Breinigsville are $56,598, $88,194 for men and $49,842 for women, a difference of 43.5%.
| Sex | Number | Average Earnings |
| Male | 2,350 (50.8%) | $88,194 |
| Female | 2,279 (49.2%) | $49,842 |
| Total | 4,629 (100.0%) | $56,598 |
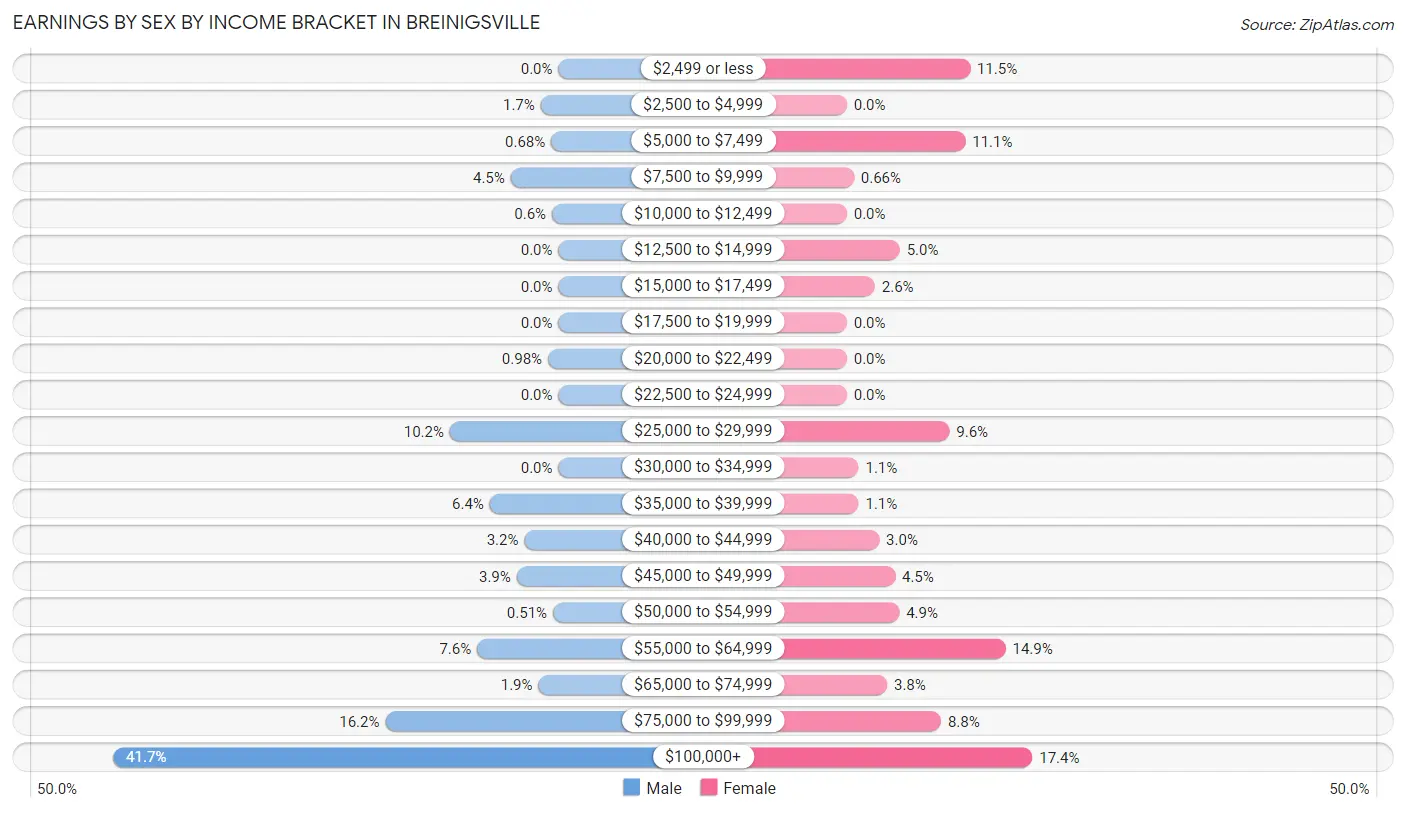
Earnings by Sex by Income Bracket in Breinigsville
The most common earnings brackets in Breinigsville are $100,000+ for men (980 | 41.7%) and $100,000+ for women (396 | 17.4%).
| Income | Male | Female |
| $2,499 or less | 0 (0.0%) | 263 (11.5%) |
| $2,500 to $4,999 | 39 (1.7%) | 0 (0.0%) |
| $5,000 to $7,499 | 16 (0.7%) | 253 (11.1%) |
| $7,500 to $9,999 | 105 (4.5%) | 15 (0.7%) |
| $10,000 to $12,499 | 14 (0.6%) | 0 (0.0%) |
| $12,500 to $14,999 | 0 (0.0%) | 113 (5.0%) |
| $15,000 to $17,499 | 0 (0.0%) | 60 (2.6%) |
| $17,500 to $19,999 | 0 (0.0%) | 0 (0.0%) |
| $20,000 to $22,499 | 23 (1.0%) | 0 (0.0%) |
| $22,500 to $24,999 | 0 (0.0%) | 0 (0.0%) |
| $25,000 to $29,999 | 239 (10.2%) | 219 (9.6%) |
| $30,000 to $34,999 | 0 (0.0%) | 25 (1.1%) |
| $35,000 to $39,999 | 151 (6.4%) | 25 (1.1%) |
| $40,000 to $44,999 | 75 (3.2%) | 69 (3.0%) |
| $45,000 to $49,999 | 92 (3.9%) | 103 (4.5%) |
| $50,000 to $54,999 | 12 (0.5%) | 112 (4.9%) |
| $55,000 to $64,999 | 179 (7.6%) | 339 (14.9%) |
| $65,000 to $74,999 | 44 (1.9%) | 86 (3.8%) |
| $75,000 to $99,999 | 381 (16.2%) | 201 (8.8%) |
| $100,000+ | 980 (41.7%) | 396 (17.4%) |
| Total | 2,350 (100.0%) | 2,279 (100.0%) |
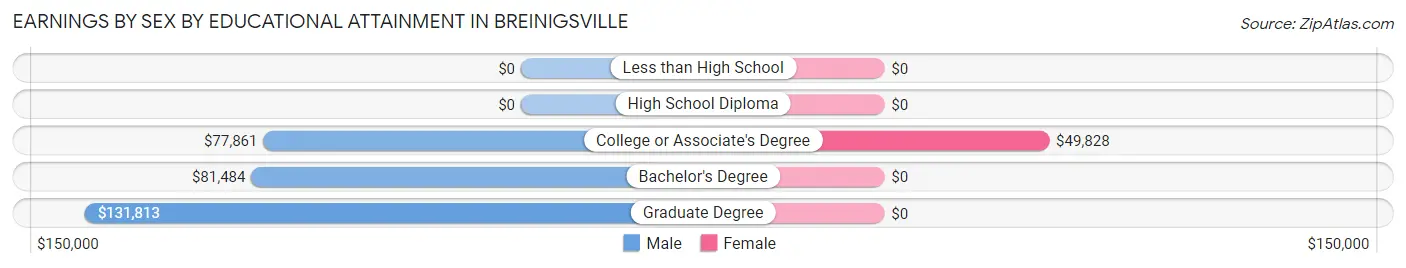
Earnings by Sex by Educational Attainment in Breinigsville
Average earnings in Breinigsville are $93,371 for men and $50,871 for women, a difference of 45.5%. Men with an educational attainment of graduate degree enjoy the highest average annual earnings of $131,813, while those with college or associate's degree education earn the least with $77,861. Women with an educational attainment of college or associate's degree earn the most with the average annual earnings of $49,828, while those with college or associate's degree education have the smallest earnings of $49,828.
| Educational Attainment | Male Income | Female Income |
| Less than High School | - | - |
| High School Diploma | - | - |
| College or Associate's Degree | $77,861 | $49,828 |
| Bachelor's Degree | $81,484 | $0 |
| Graduate Degree | $131,813 | $0 |
| Total | $93,371 | $50,871 |
Family Income in Breinigsville
Family Income Brackets in Breinigsville
According to the Breinigsville family income data, there are 762 families falling into the $200,000+ income range, which is the most common income bracket and makes up 31.2% of all families.
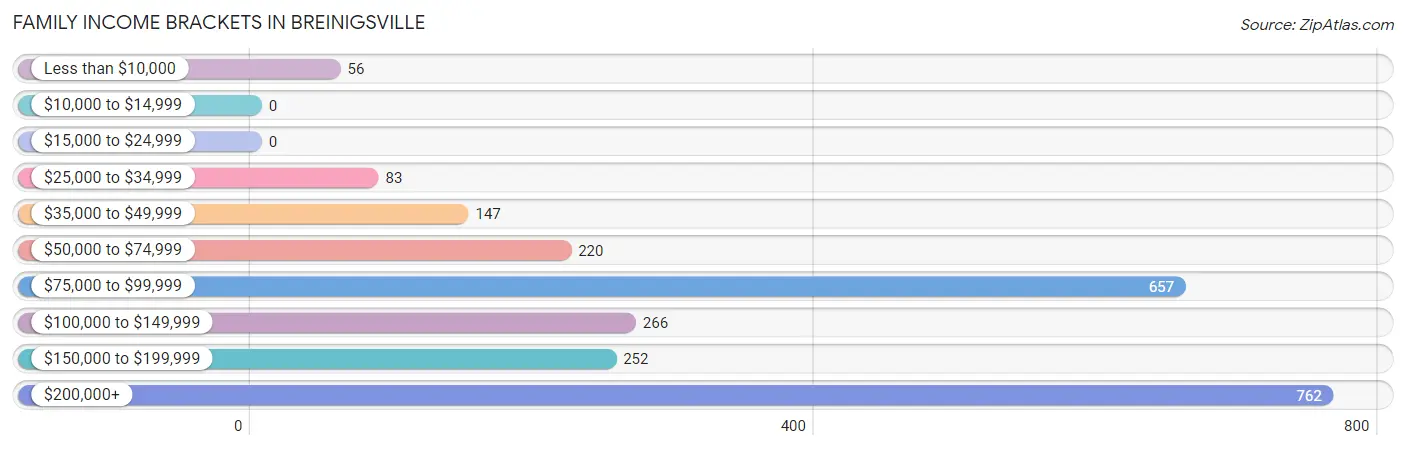
| Income Bracket | # Families | % Families |
| Less than $10,000 | 56 | 2.3% |
| $10,000 to $14,999 | 0 | 0.0% |
| $15,000 to $24,999 | 0 | 0.0% |
| $25,000 to $34,999 | 83 | 3.4% |
| $35,000 to $49,999 | 147 | 6.0% |
| $50,000 to $74,999 | 220 | 9.0% |
| $75,000 to $99,999 | 657 | 26.9% |
| $100,000 to $149,999 | 266 | 10.9% |
| $150,000 to $199,999 | 252 | 10.3% |
| $200,000+ | 762 | 31.2% |
Family Income by Famaliy Size in Breinigsville
4-person families (402 | 16.5%) account for the highest median family income in Breinigsville with $232,500 per family, while 4-person families (402 | 16.5%) have the highest median income of $58,125 per family member.
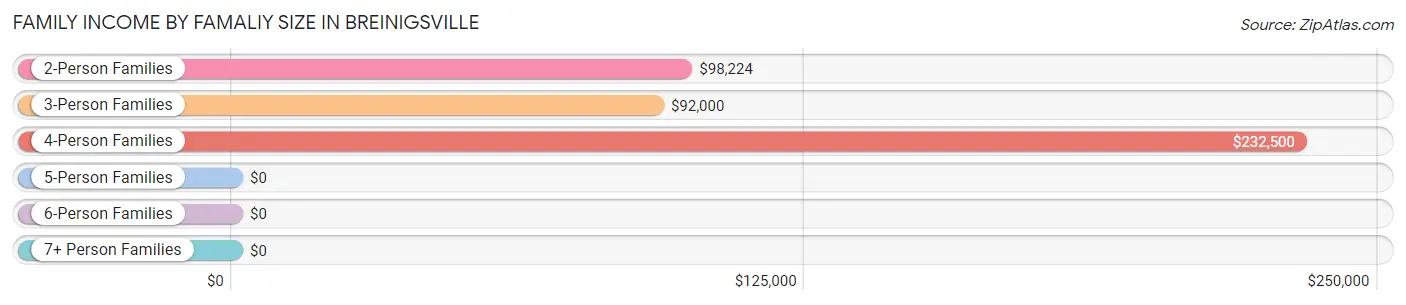
| Income Bracket | # Families | Median Income |
| 2-Person Families | 922 (37.7%) | $98,224 |
| 3-Person Families | 562 (23.0%) | $92,000 |
| 4-Person Families | 402 (16.5%) | $232,500 |
| 5-Person Families | 408 (16.7%) | $0 |
| 6-Person Families | 137 (5.6%) | $0 |
| 7+ Person Families | 12 (0.5%) | $0 |
| Total | 2,443 (100.0%) | $130,020 |
Family Income by Number of Earners in Breinigsville
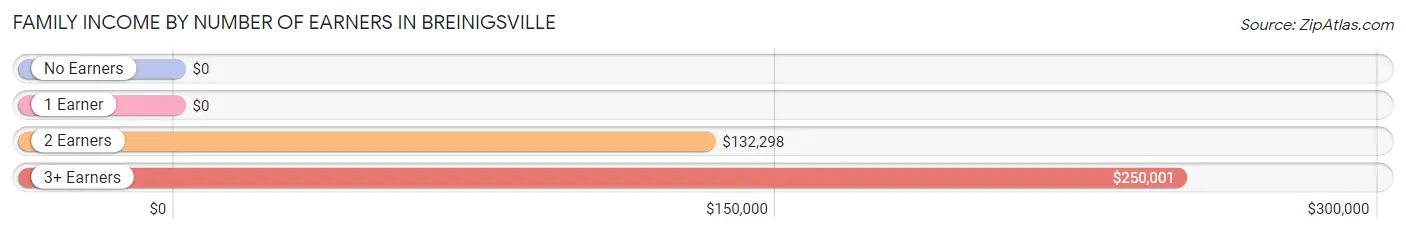
| Number of Earners | # Families | Median Income |
| No Earners | 252 (10.3%) | $0 |
| 1 Earner | 618 (25.3%) | $0 |
| 2 Earners | 1,397 (57.2%) | $132,298 |
| 3+ Earners | 176 (7.2%) | $250,001 |
| Total | 2,443 (100.0%) | $130,020 |
Household Income in Breinigsville
Household Income Brackets in Breinigsville
With 783 households falling in the category, the $200,000+ income range is the most frequent in Breinigsville, accounting for 27.0% of all households.
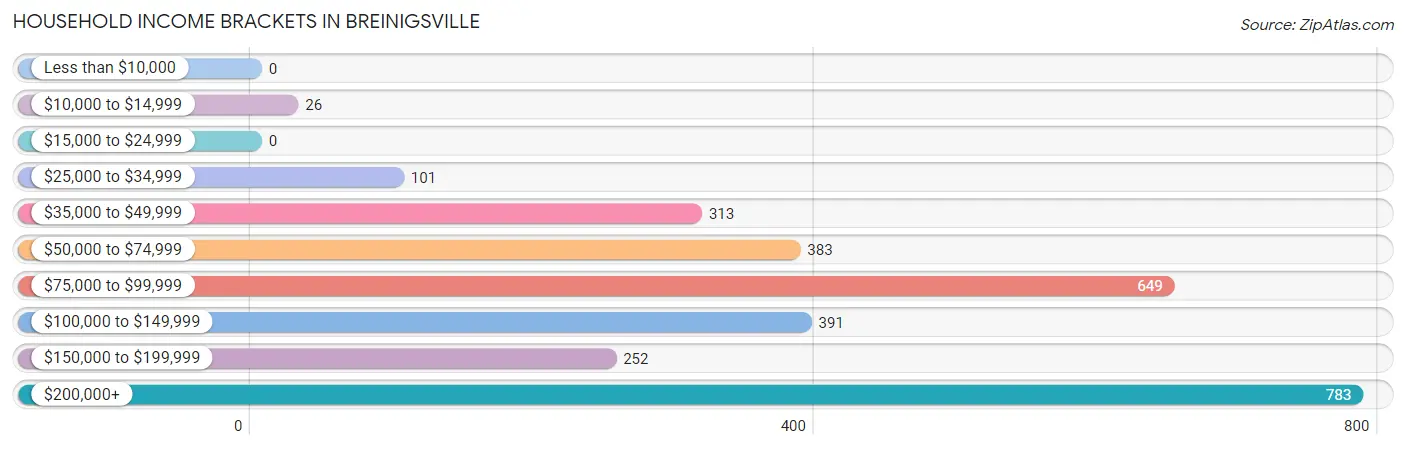
| Income Bracket | # Households | % Households |
| Less than $10,000 | 0 | 0.0% |
| $10,000 to $14,999 | 26 | 0.9% |
| $15,000 to $24,999 | 0 | 0.0% |
| $25,000 to $34,999 | 101 | 3.5% |
| $35,000 to $49,999 | 313 | 10.8% |
| $50,000 to $74,999 | 383 | 13.2% |
| $75,000 to $99,999 | 649 | 22.4% |
| $100,000 to $149,999 | 391 | 13.5% |
| $150,000 to $199,999 | 252 | 8.7% |
| $200,000+ | 783 | 27.0% |
Household Income by Householder Age in Breinigsville
The median household income in Breinigsville is $99,306, with the highest median household income of $131,222 found in the 25 to 44 years age bracket for the primary householder. A total of 1,196 households (41.3%) fall into this category.
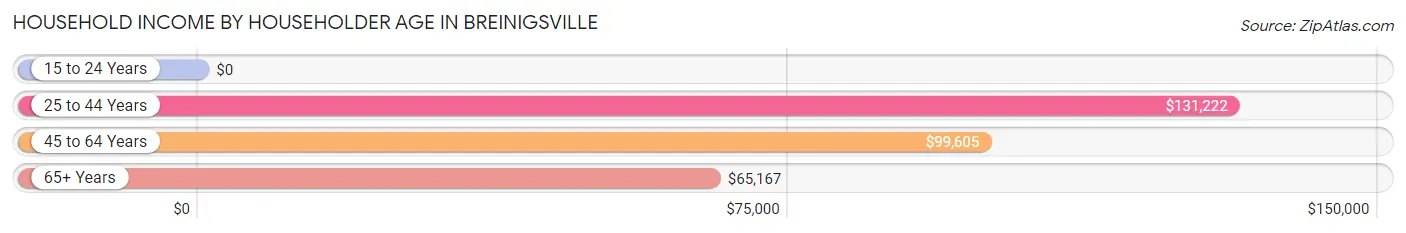
| Income Bracket | # Households | Median Income |
| 15 to 24 Years | 0 (0.0%) | $0 |
| 25 to 44 Years | 1,196 (41.3%) | $131,222 |
| 45 to 64 Years | 1,280 (44.2%) | $99,605 |
| 65+ Years | 423 (14.6%) | $65,167 |
| Total | 2,899 (100.0%) | $99,306 |
Poverty in Breinigsville
Income Below Poverty by Sex and Age in Breinigsville
With 6.4% poverty level for males and 2.2% for females among the residents of Breinigsville, under 5 year old males and 25 to 34 year old females are the most vulnerable to poverty, with 155 males (34.1%) and 55 females (11.9%) in their respective age groups living below the poverty level.
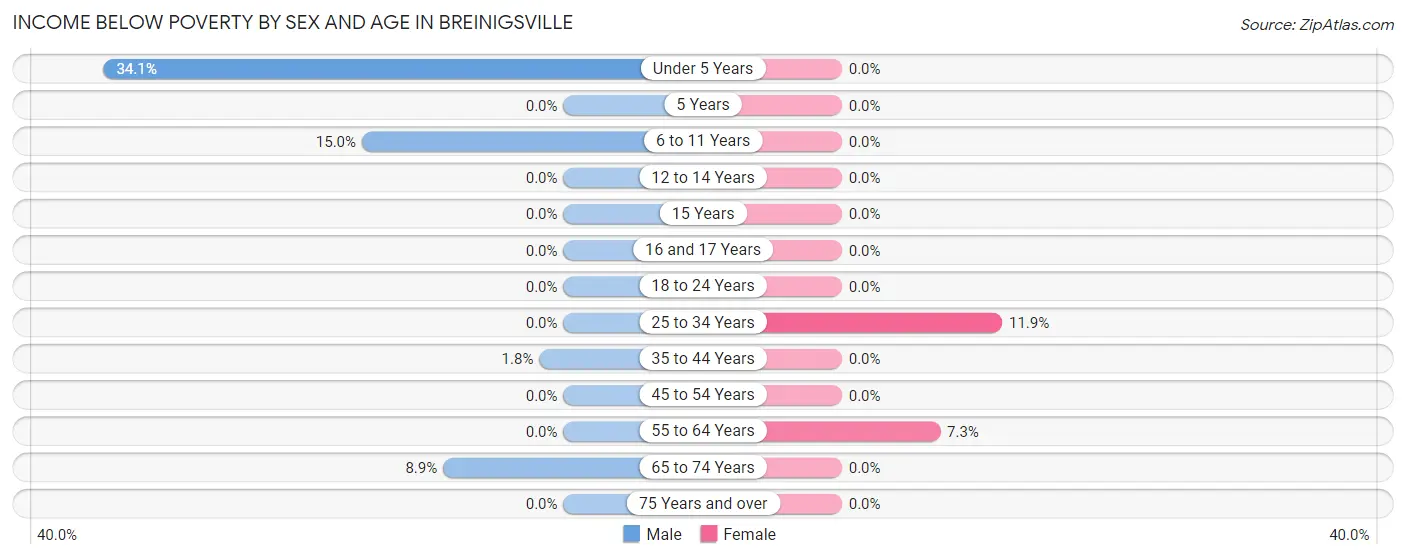
| Age Bracket | Male | Female |
| Under 5 Years | 155 (34.1%) | 0 (0.0%) |
| 5 Years | 0 (0.0%) | 0 (0.0%) |
| 6 to 11 Years | 60 (15.0%) | 0 (0.0%) |
| 12 to 14 Years | 0 (0.0%) | 0 (0.0%) |
| 15 Years | 0 (0.0%) | 0 (0.0%) |
| 16 and 17 Years | 0 (0.0%) | 0 (0.0%) |
| 18 to 24 Years | 0 (0.0%) | 0 (0.0%) |
| 25 to 34 Years | 0 (0.0%) | 55 (11.9%) |
| 35 to 44 Years | 14 (1.8%) | 0 (0.0%) |
| 45 to 54 Years | 0 (0.0%) | 0 (0.0%) |
| 55 to 64 Years | 0 (0.0%) | 56 (7.3%) |
| 65 to 74 Years | 25 (8.9%) | 0 (0.0%) |
| 75 Years and over | 0 (0.0%) | 0 (0.0%) |
| Total | 254 (6.4%) | 111 (2.2%) |
Income Above Poverty by Sex and Age in Breinigsville
According to the poverty statistics in Breinigsville, males aged 5 years and females aged under 5 years are the age groups that are most secure financially, with 100.0% of males and 100.0% of females in these age groups living above the poverty line.
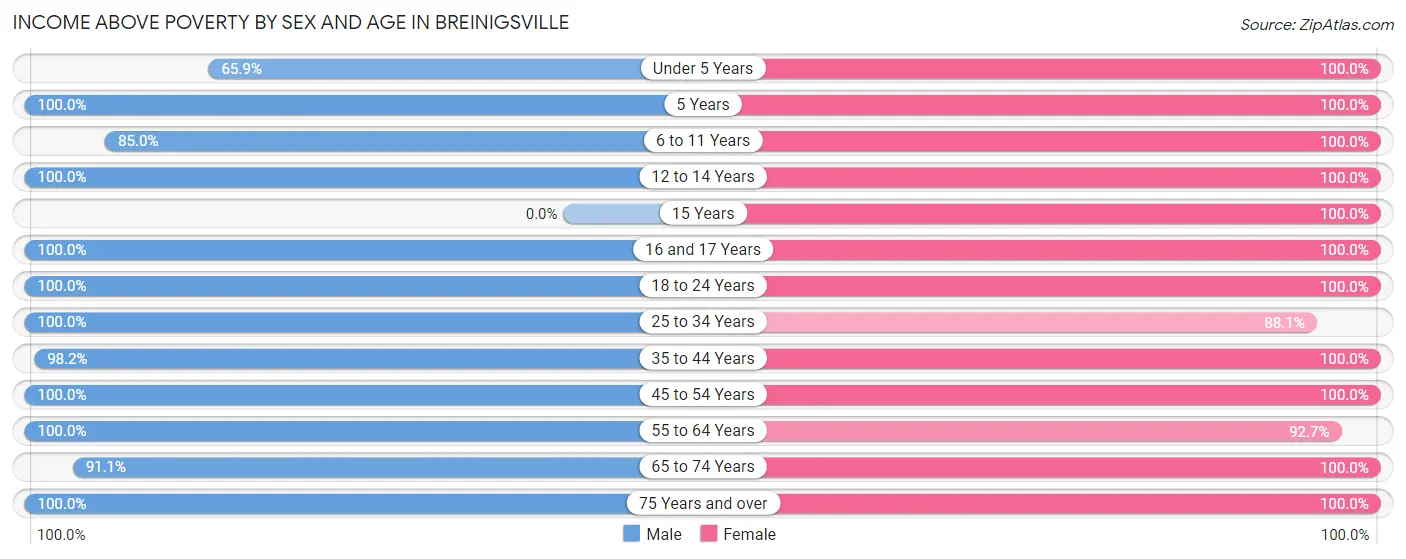
| Age Bracket | Male | Female |
| Under 5 Years | 299 (65.9%) | 77 (100.0%) |
| 5 Years | 47 (100.0%) | 12 (100.0%) |
| 6 to 11 Years | 341 (85.0%) | 768 (100.0%) |
| 12 to 14 Years | 209 (100.0%) | 282 (100.0%) |
| 15 Years | 0 (0.0%) | 389 (100.0%) |
| 16 and 17 Years | 39 (100.0%) | 177 (100.0%) |
| 18 to 24 Years | 86 (100.0%) | 178 (100.0%) |
| 25 to 34 Years | 481 (100.0%) | 407 (88.1%) |
| 35 to 44 Years | 770 (98.2%) | 860 (100.0%) |
| 45 to 54 Years | 331 (100.0%) | 368 (100.0%) |
| 55 to 64 Years | 868 (100.0%) | 711 (92.7%) |
| 65 to 74 Years | 255 (91.1%) | 353 (100.0%) |
| 75 Years and over | 20 (100.0%) | 342 (100.0%) |
| Total | 3,746 (93.6%) | 4,924 (97.8%) |
Income Below Poverty Among Married-Couple Families in Breinigsville
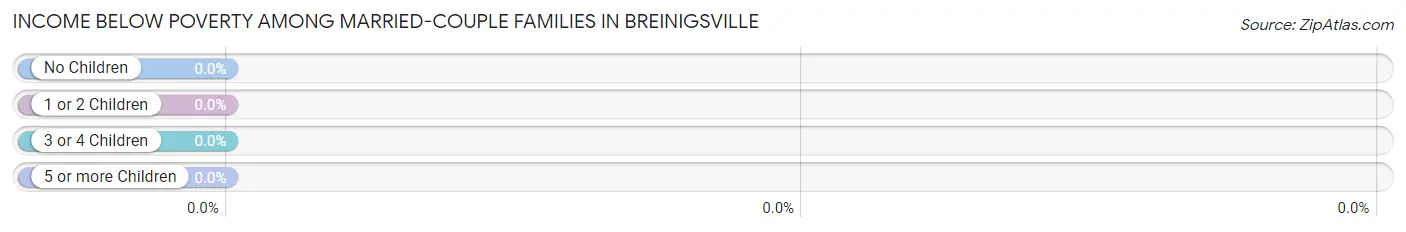
| Children | Above Poverty | Below Poverty |
| No Children | 833 (100.0%) | 0 (0.0%) |
| 1 or 2 Children | 727 (100.0%) | 0 (0.0%) |
| 3 or 4 Children | 348 (100.0%) | 0 (0.0%) |
| 5 or more Children | 12 (100.0%) | 0 (0.0%) |
| Total | 1,920 (100.0%) | 0 (0.0%) |
Income Below Poverty Among Single-Parent Households in Breinigsville
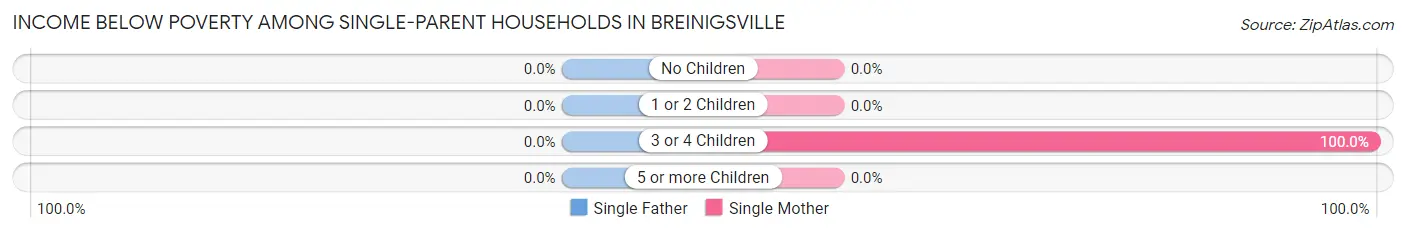
| Children | Single Father | Single Mother |
| No Children | 0 (0.0%) | 0 (0.0%) |
| 1 or 2 Children | 0 (0.0%) | 0 (0.0%) |
| 3 or 4 Children | 0 (0.0%) | 55 (100.0%) |
| 5 or more Children | 0 (0.0%) | 0 (0.0%) |
| Total | 0 (0.0%) | 55 (20.1%) |
Income Below Poverty Among Married-Couple vs Single-Parent Households in Breinigsville
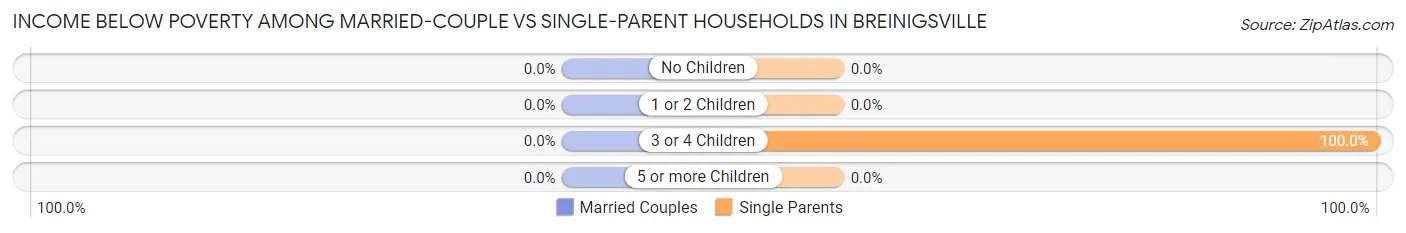
| Children | Married-Couple Families | Single-Parent Households |
| No Children | 0 (0.0%) | 0 (0.0%) |
| 1 or 2 Children | 0 (0.0%) | 0 (0.0%) |
| 3 or 4 Children | 0 (0.0%) | 55 (100.0%) |
| 5 or more Children | 0 (0.0%) | 0 (0.0%) |
| Total | 0 (0.0%) | 55 (10.5%) |
Race in Breinigsville
The most populous races in Breinigsville are White / Caucasian (5,233 | 57.9%), Hispanic or Latino (1,944 | 21.5%), and Asian (1,310 | 14.5%).
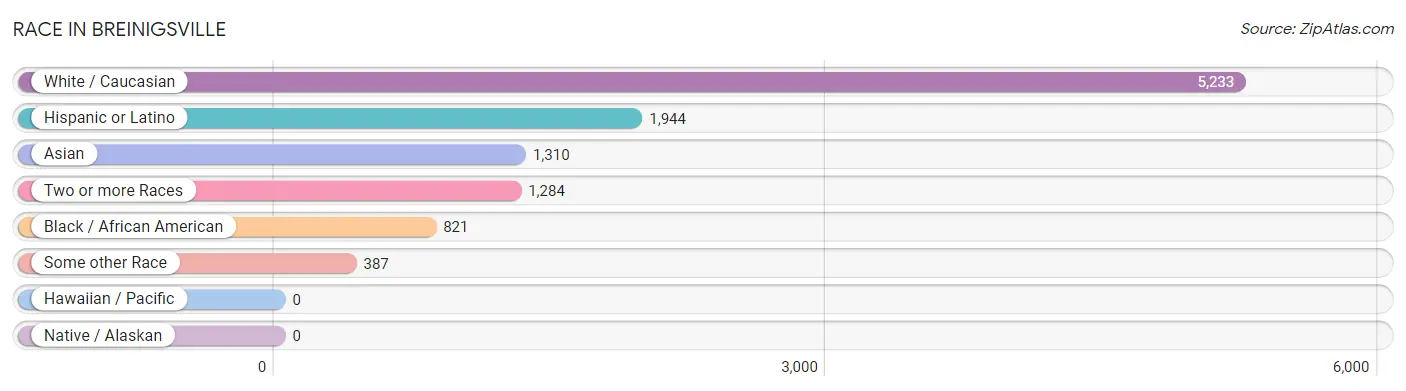
| Race | # Population | % Population |
| Asian | 1,310 | 14.5% |
| Black / African American | 821 | 9.1% |
| Hawaiian / Pacific | 0 | 0.0% |
| Hispanic or Latino | 1,944 | 21.5% |
| Native / Alaskan | 0 | 0.0% |
| White / Caucasian | 5,233 | 57.9% |
| Two or more Races | 1,284 | 14.2% |
| Some other Race | 387 | 4.3% |
| Total | 9,035 | 100.0% |
Ancestry in Breinigsville
The most populous ancestries reported in Breinigsville are German (1,996 | 22.1%), Irish (1,454 | 16.1%), Thai (1,131 | 12.5%), English (747 | 8.3%), and Italian (742 | 8.2%), together accounting for 67.2% of all Breinigsville residents.
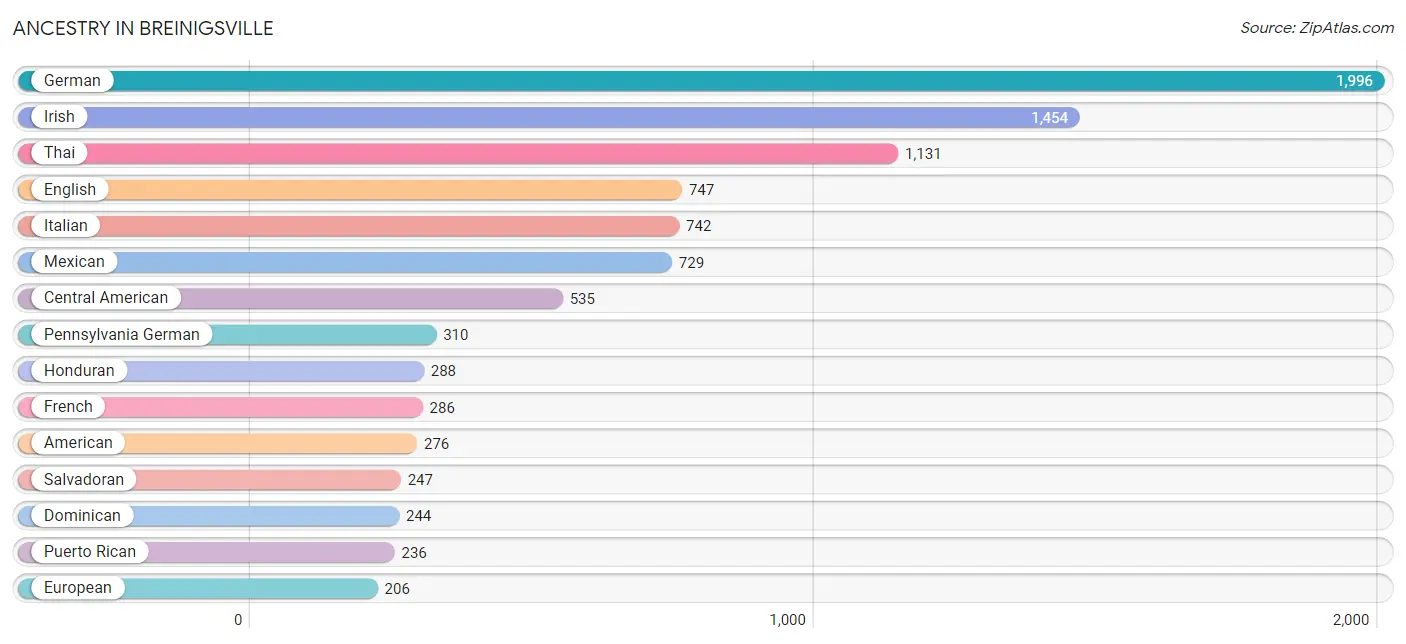
| Ancestry | # Population | % Population |
| American | 276 | 3.0% |
| Arab | 28 | 0.3% |
| Austrian | 175 | 1.9% |
| Canadian | 8 | 0.1% |
| Central American | 535 | 5.9% |
| Czechoslovakian | 8 | 0.1% |
| Dominican | 244 | 2.7% |
| Dutch | 198 | 2.2% |
| English | 747 | 8.3% |
| European | 206 | 2.3% |
| French | 286 | 3.2% |
| German | 1,996 | 22.1% |
| Haitian | 155 | 1.7% |
| Honduran | 288 | 3.2% |
| Indian (Asian) | 193 | 2.1% |
| Irish | 1,454 | 16.1% |
| Italian | 742 | 8.2% |
| Mexican | 729 | 8.1% |
| Norwegian | 48 | 0.5% |
| Pennsylvania German | 310 | 3.4% |
| Polish | 148 | 1.6% |
| Puerto Rican | 236 | 2.6% |
| Romanian | 24 | 0.3% |
| Salvadoran | 247 | 2.7% |
| Scandinavian | 25 | 0.3% |
| Scotch-Irish | 8 | 0.1% |
| Scottish | 20 | 0.2% |
| Spaniard | 42 | 0.5% |
| Spanish | 98 | 1.1% |
| Subsaharan African | 145 | 1.6% |
| Thai | 1,131 | 12.5% |
| Ukrainian | 18 | 0.2% |
| Welsh | 14 | 0.2% |
| Yugoslavian | 17 | 0.2% | View All 34 Rows |
Immigrants in Breinigsville
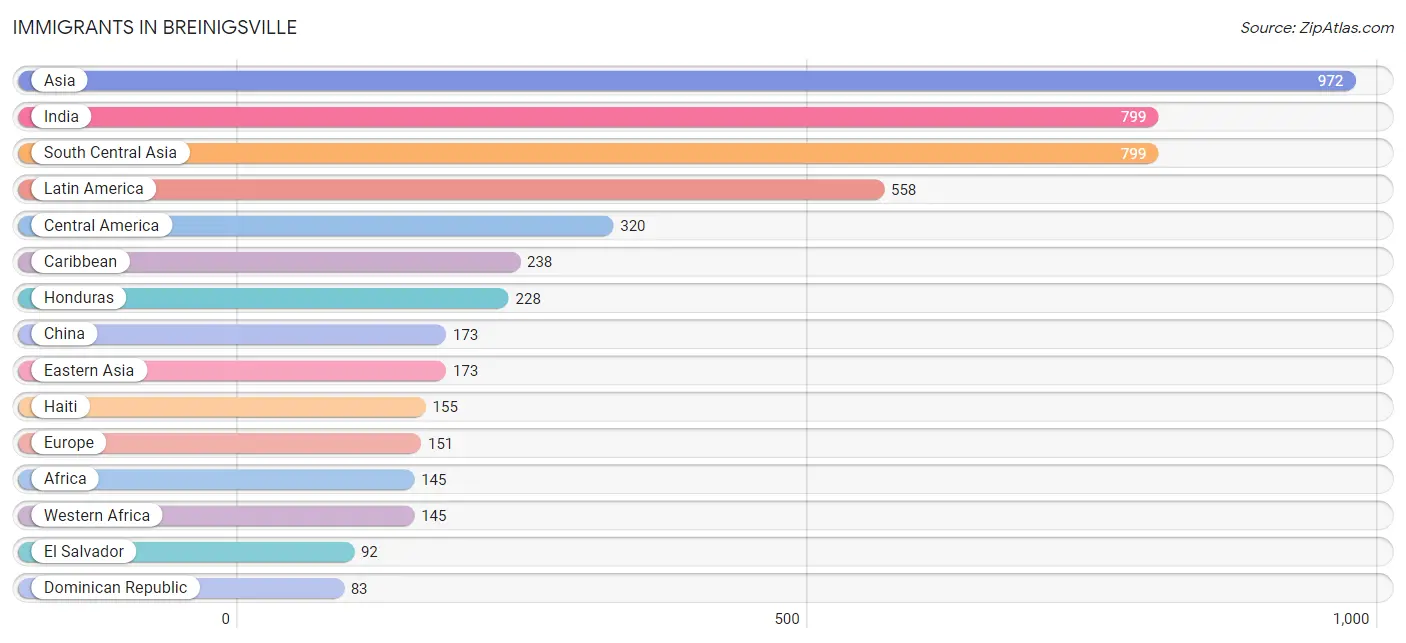
The most numerous immigrant groups reported in Breinigsville came from Asia (972 | 10.8%), India (799 | 8.8%), South Central Asia (799 | 8.8%), Latin America (558 | 6.2%), and Central America (320 | 3.5%), together accounting for 38.2% of all Breinigsville residents.
| Immigration Origin | # Population | % Population |
| Africa | 145 | 1.6% |
| Asia | 972 | 10.8% |
| Bosnia and Herzegovina | 54 | 0.6% |
| Canada | 8 | 0.1% |
| Caribbean | 238 | 2.6% |
| Central America | 320 | 3.5% |
| China | 173 | 1.9% |
| Dominican Republic | 83 | 0.9% |
| Eastern Asia | 173 | 1.9% |
| Eastern Europe | 78 | 0.9% |
| El Salvador | 92 | 1.0% |
| Europe | 151 | 1.7% |
| France | 73 | 0.8% |
| Haiti | 155 | 1.7% |
| Honduras | 228 | 2.5% |
| India | 799 | 8.8% |
| Latin America | 558 | 6.2% |
| Romania | 24 | 0.3% |
| South Central Asia | 799 | 8.8% |
| Taiwan | 51 | 0.6% |
| Western Africa | 145 | 1.6% |
| Western Europe | 73 | 0.8% | View All 22 Rows |
Sex and Age in Breinigsville
Sex and Age in Breinigsville
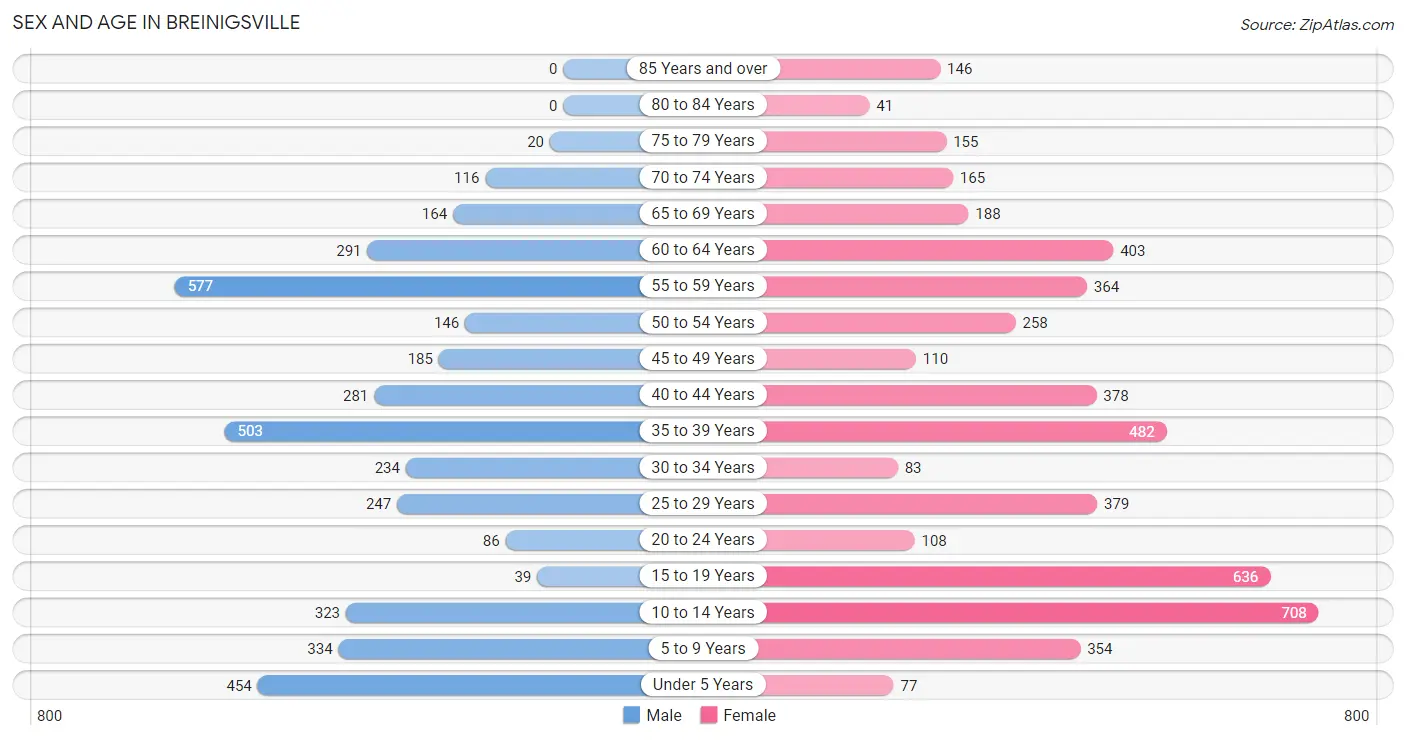
The most populous age groups in Breinigsville are 55 to 59 Years (577 | 14.4%) for men and 10 to 14 Years (708 | 14.1%) for women.
| Age Bracket | Male | Female |
| Under 5 Years | 454 (11.4%) | 77 (1.5%) |
| 5 to 9 Years | 334 (8.4%) | 354 (7.0%) |
| 10 to 14 Years | 323 (8.1%) | 708 (14.1%) |
| 15 to 19 Years | 39 (1.0%) | 636 (12.6%) |
| 20 to 24 Years | 86 (2.1%) | 108 (2.1%) |
| 25 to 29 Years | 247 (6.2%) | 379 (7.5%) |
| 30 to 34 Years | 234 (5.9%) | 83 (1.7%) |
| 35 to 39 Years | 503 (12.6%) | 482 (9.6%) |
| 40 to 44 Years | 281 (7.0%) | 378 (7.5%) |
| 45 to 49 Years | 185 (4.6%) | 110 (2.2%) |
| 50 to 54 Years | 146 (3.6%) | 258 (5.1%) |
| 55 to 59 Years | 577 (14.4%) | 364 (7.2%) |
| 60 to 64 Years | 291 (7.3%) | 403 (8.0%) |
| 65 to 69 Years | 164 (4.1%) | 188 (3.7%) |
| 70 to 74 Years | 116 (2.9%) | 165 (3.3%) |
| 75 to 79 Years | 20 (0.5%) | 155 (3.1%) |
| 80 to 84 Years | 0 (0.0%) | 41 (0.8%) |
| 85 Years and over | 0 (0.0%) | 146 (2.9%) |
| Total | 4,000 (100.0%) | 5,035 (100.0%) |
Families and Households in Breinigsville
Median Family Size in Breinigsville
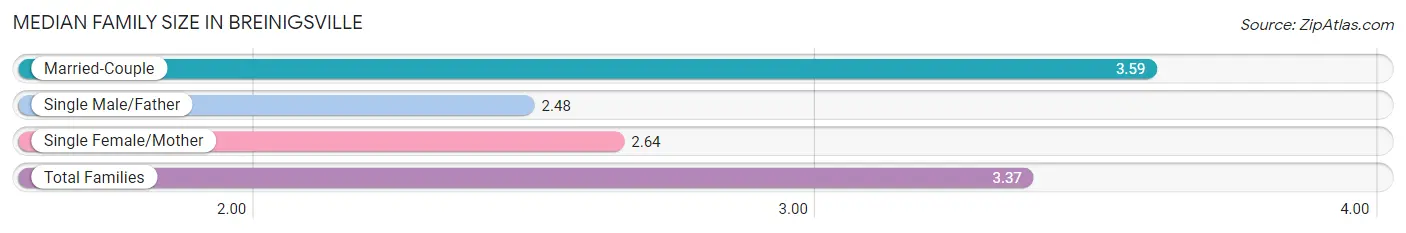
The median family size in Breinigsville is 3.37 persons per family, with married-couple families (1,920 | 78.6%) accounting for the largest median family size of 3.59 persons per family. On the other hand, single male/father families (249 | 10.2%) represent the smallest median family size with 2.48 persons per family.
| Family Type | # Families | Family Size |
| Married-Couple | 1,920 (78.6%) | 3.59 |
| Single Male/Father | 249 (10.2%) | 2.48 |
| Single Female/Mother | 274 (11.2%) | 2.64 |
| Total Families | 2,443 (100.0%) | 3.37 |
Median Household Size in Breinigsville
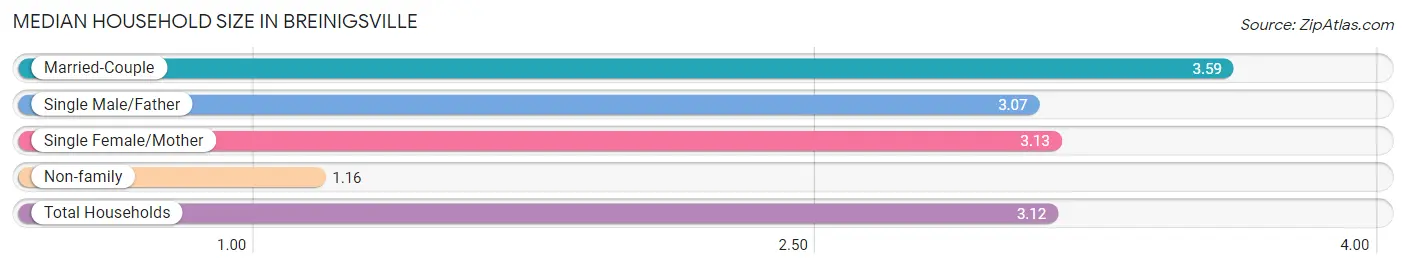
The median household size in Breinigsville is 3.12 persons per household, with married-couple households (1,920 | 66.2%) accounting for the largest median household size of 3.59 persons per household. non-family households (456 | 15.7%) represent the smallest median household size with 1.16 persons per household.
| Household Type | # Households | Household Size |
| Married-Couple | 1,920 (66.2%) | 3.59 |
| Single Male/Father | 249 (8.6%) | 3.07 |
| Single Female/Mother | 274 (9.5%) | 3.13 |
| Non-family | 456 (15.7%) | 1.16 |
| Total Households | 2,899 (100.0%) | 3.12 |
Household Size by Marriage Status in Breinigsville
Out of a total of 2,899 households in Breinigsville, 2,443 (84.3%) are family households, while 456 (15.7%) are nonfamily households. The most numerous type of family households are 2-person households, comprising 761, and the most common type of nonfamily households are 1-person households, comprising 386.
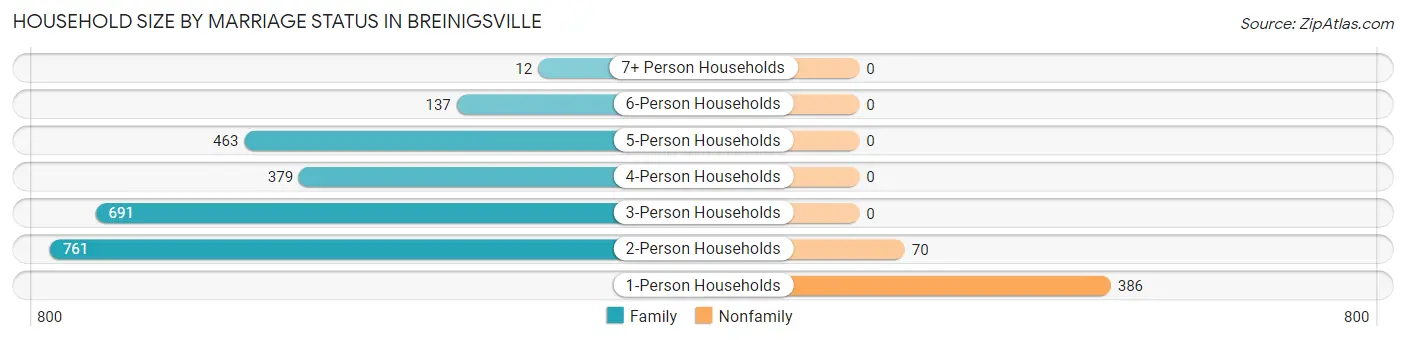
| Household Size | Family Households | Nonfamily Households |
| 1-Person Households | - | 386 (13.3%) |
| 2-Person Households | 761 (26.3%) | 70 (2.4%) |
| 3-Person Households | 691 (23.8%) | 0 (0.0%) |
| 4-Person Households | 379 (13.1%) | 0 (0.0%) |
| 5-Person Households | 463 (16.0%) | 0 (0.0%) |
| 6-Person Households | 137 (4.7%) | 0 (0.0%) |
| 7+ Person Households | 12 (0.4%) | 0 (0.0%) |
| Total | 2,443 (84.3%) | 456 (15.7%) |
Female Fertility in Breinigsville
Fertility by Age in Breinigsville
Average fertility rate in Breinigsville is 17.0 births per 1,000 women. Women in the age bracket of 20 to 34 years have the highest fertility rate with 53.0 births per 1,000 women. Women in the age bracket of 20 to 34 years acount for 78.9% of all women with births.
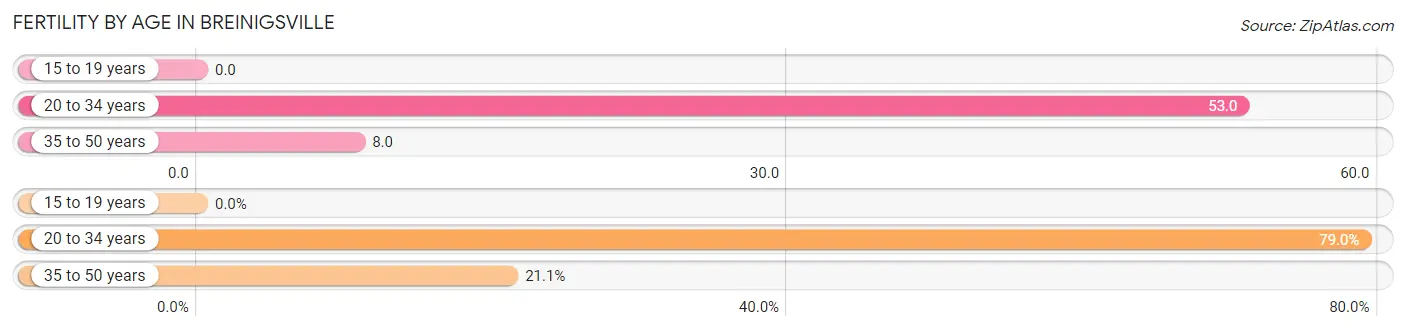
| Age Bracket | Women with Births | Births / 1,000 Women |
| 15 to 19 years | 0 (0.0%) | 0.0 |
| 20 to 34 years | 30 (78.9%) | 53.0 |
| 35 to 50 years | 8 (21.0%) | 8.0 |
| Total | 38 (100.0%) | 17.0 |
Fertility by Age by Marriage Status in Breinigsville
21.1% of women with births (38) in Breinigsville are married. The highest percentage of unmarried women with births falls into 20 to 34 years age bracket with 100.0% of them unmarried at the time of birth, while the lowest percentage of unmarried women with births belong to 35 to 50 years age bracket with 0.0% of them unmarried.
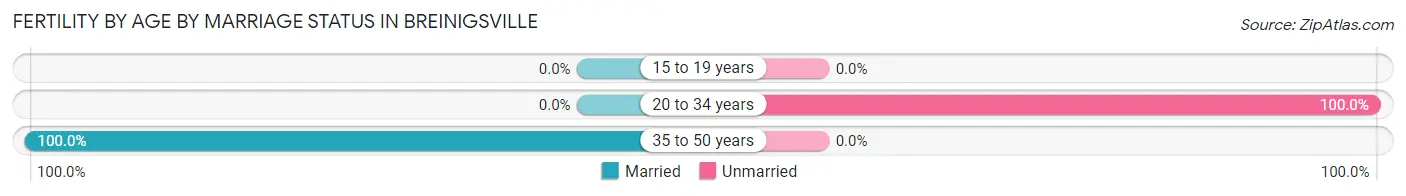
| Age Bracket | Married | Unmarried |
| 15 to 19 years | 0 (0.0%) | 0 (0.0%) |
| 20 to 34 years | 0 (0.0%) | 30 (100.0%) |
| 35 to 50 years | 8 (100.0%) | 0 (0.0%) |
| Total | 8 (21.0%) | 30 (78.9%) |
Fertility by Education in Breinigsville
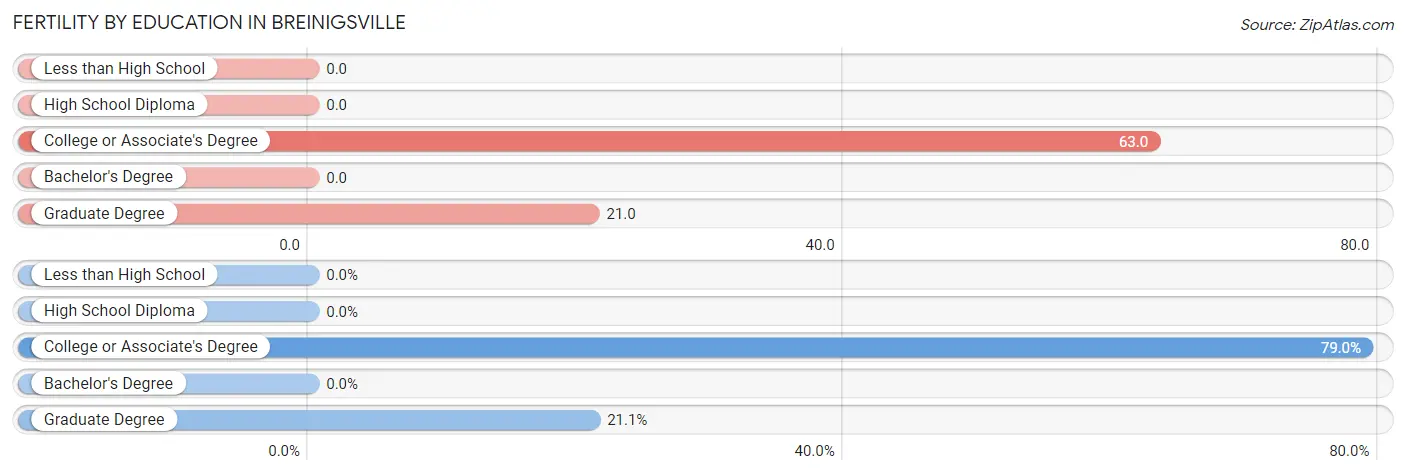
| Educational Attainment | Women with Births | Births / 1,000 Women |
| Less than High School | 0 (0.0%) | 0.0 |
| High School Diploma | 0 (0.0%) | 0.0 |
| College or Associate's Degree | 30 (78.9%) | 63.0 |
| Bachelor's Degree | 0 (0.0%) | 0.0 |
| Graduate Degree | 8 (21.0%) | 21.0 |
| Total | 38 (100.0%) | 17.0 |
Fertility by Education by Marriage Status in Breinigsville
78.9% of women with births in Breinigsville are unmarried. Women with the educational attainment of graduate degree are most likely to be married with 100.0% of them married at childbirth, while women with the educational attainment of college or associate's degree are least likely to be married with 100.0% of them unmarried at childbirth.
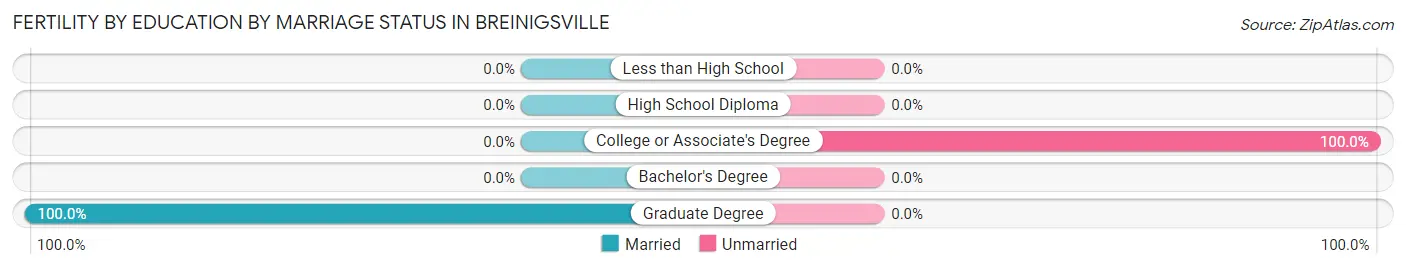
| Educational Attainment | Married | Unmarried |
| Less than High School | 0 (0.0%) | 0 (0.0%) |
| High School Diploma | 0 (0.0%) | 0 (0.0%) |
| College or Associate's Degree | 0 (0.0%) | 30 (100.0%) |
| Bachelor's Degree | 0 (0.0%) | 0 (0.0%) |
| Graduate Degree | 8 (100.0%) | 0 (0.0%) |
| Total | 8 (21.0%) | 30 (78.9%) |
Employment Characteristics in Breinigsville
Employment by Class of Employer in Breinigsville
Among the 3,937 employed individuals in Breinigsville, private company employees (2,887 | 73.3%), not-for-profit organizations (598 | 15.2%), and local government employees (197 | 5.0%) make up the most common classes of employment.
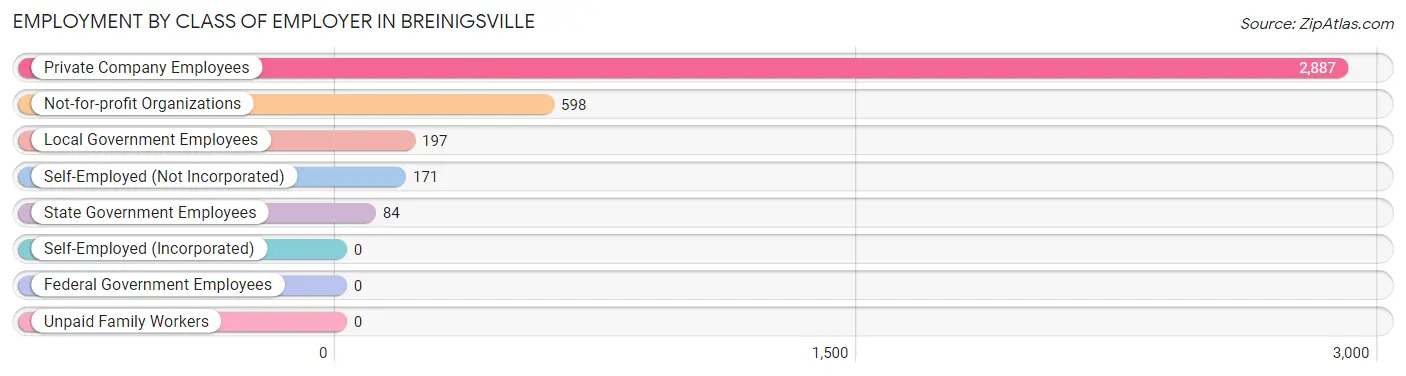
| Employer Class | # Employees | % Employees |
| Private Company Employees | 2,887 | 73.3% |
| Self-Employed (Incorporated) | 0 | 0.0% |
| Self-Employed (Not Incorporated) | 171 | 4.3% |
| Not-for-profit Organizations | 598 | 15.2% |
| Local Government Employees | 197 | 5.0% |
| State Government Employees | 84 | 2.1% |
| Federal Government Employees | 0 | 0.0% |
| Unpaid Family Workers | 0 | 0.0% |
| Total | 3,937 | 100.0% |
Employment Status by Age in Breinigsville
According to the labor force statistics for Breinigsville, out of the total population over 16 years of age (6,396), 67.8% or 4,336 individuals are in the labor force, with 4.8% or 208 of them unemployed. The age group with the highest labor force participation rate is 20 to 24 years, with 100.0% or 194 individuals in the labor force. Within the labor force, the 55 to 59 years age range has the highest percentage of unemployed individuals, with 15.0% or 105 of them being unemployed.
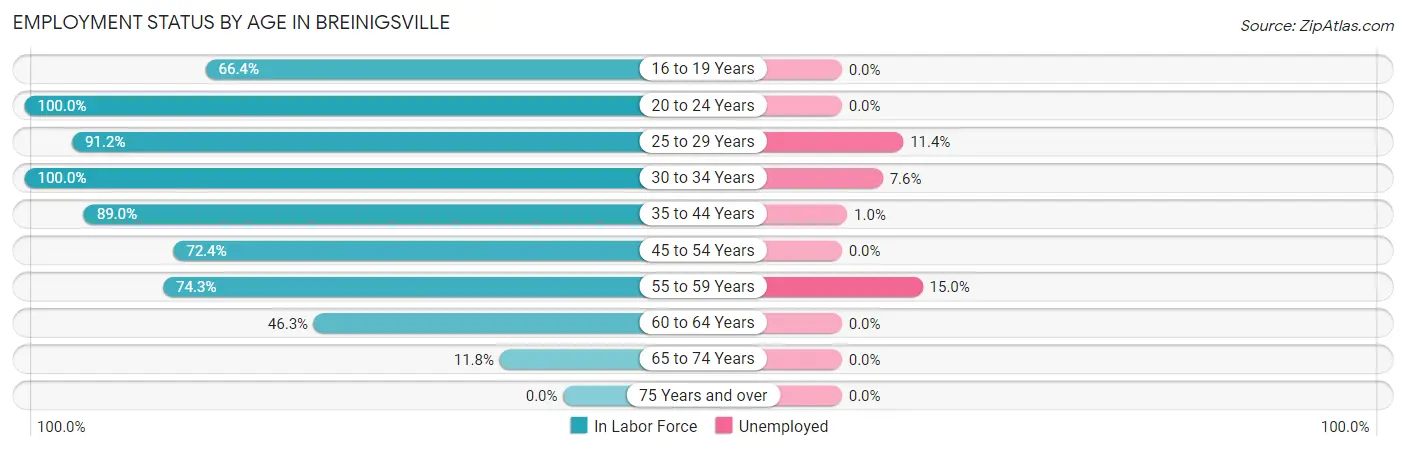
| Age Bracket | In Labor Force | Unemployed |
| 16 to 19 Years | 190 (66.4%) | 0 (0.0%) |
| 20 to 24 Years | 194 (100.0%) | 0 (0.0%) |
| 25 to 29 Years | 571 (91.2%) | 65 (11.4%) |
| 30 to 34 Years | 317 (100.0%) | 24 (7.6%) |
| 35 to 44 Years | 1,463 (89.0%) | 15 (1.0%) |
| 45 to 54 Years | 506 (72.4%) | 0 (0.0%) |
| 55 to 59 Years | 699 (74.3%) | 105 (15.0%) |
| 60 to 64 Years | 321 (46.3%) | 0 (0.0%) |
| 65 to 74 Years | 75 (11.8%) | 0 (0.0%) |
| 75 Years and over | 0 (0.0%) | 0 (0.0%) |
| Total | 4,336 (67.8%) | 208 (4.8%) |
Employment Status by Educational Attainment in Breinigsville
According to labor force statistics for Breinigsville, 78.8% of individuals (3,878) out of the total population between 25 and 64 years of age (4,921) are in the labor force, with 5.4% or 209 of them being unemployed. The group with the highest labor force participation rate are those with the educational attainment of bachelor's degree or higher, with 91.5% or 2,501 individuals in the labor force. Within the labor force, individuals with bachelor's degree or higher education have the highest percentage of unemployment, with 7.2% or 180 of them being unemployed.
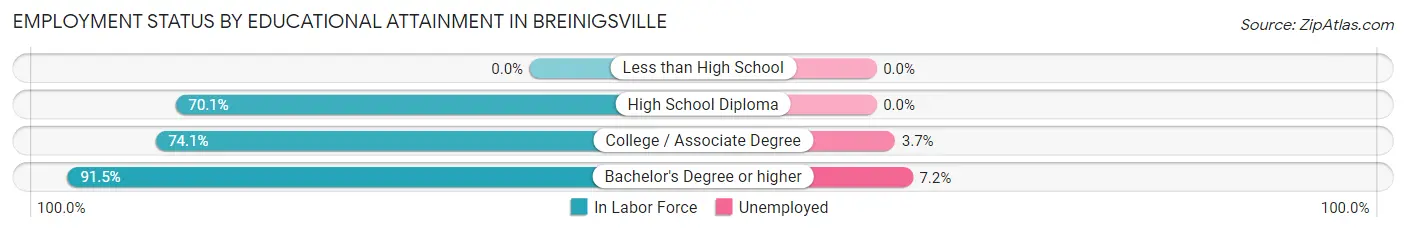
| Educational Attainment | In Labor Force | Unemployed |
| Less than High School | 0 (0.0%) | 0 (0.0%) |
| High School Diploma | 558 (70.1%) | 0 (0.0%) |
| College / Associate Degree | 820 (74.1%) | 41 (3.7%) |
| Bachelor's Degree or higher | 2,501 (91.5%) | 197 (7.2%) |
| Total | 3,878 (78.8%) | 266 (5.4%) |
Employment Occupations by Sex in Breinigsville
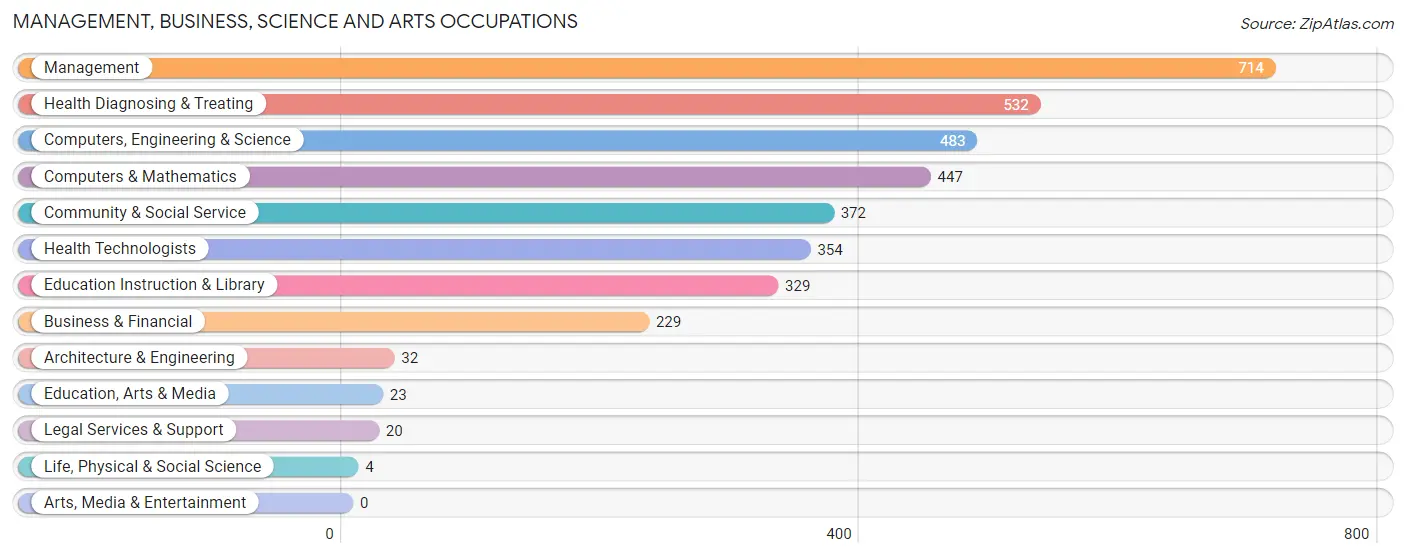
Management, Business, Science and Arts Occupations
The most common Management, Business, Science and Arts occupations in Breinigsville are Management (714 | 17.3%), Health Diagnosing & Treating (532 | 12.9%), Computers, Engineering & Science (483 | 11.7%), Computers & Mathematics (447 | 10.8%), and Community & Social Service (372 | 9.0%).
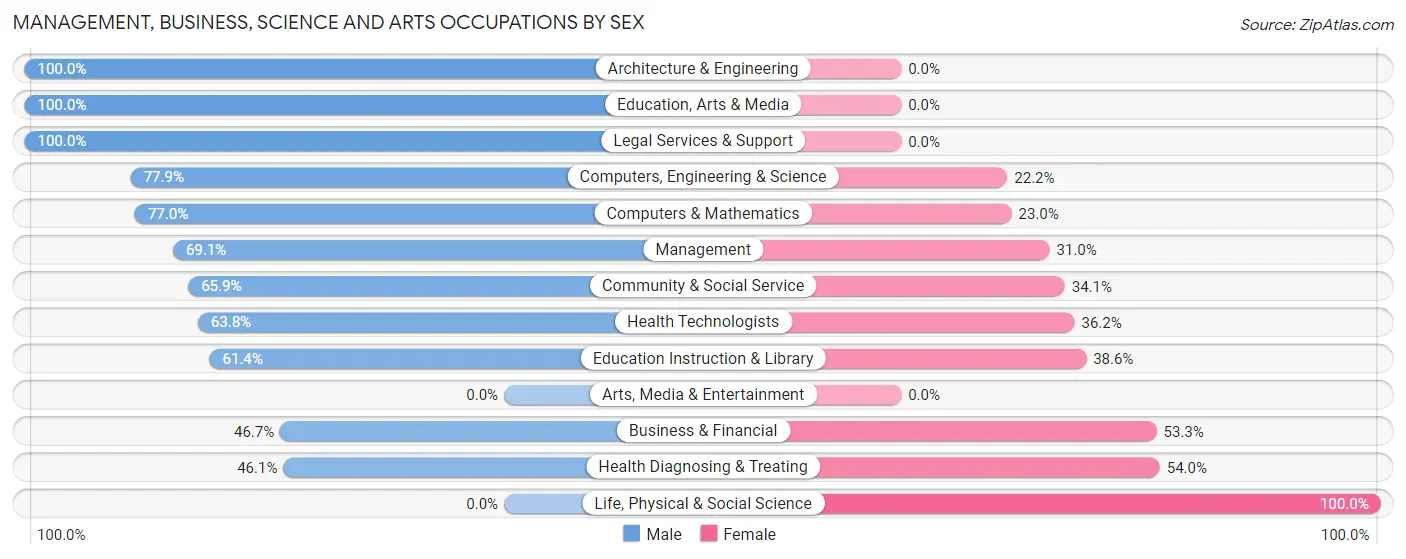
Management, Business, Science and Arts Occupations by Sex
Within the Management, Business, Science and Arts occupations in Breinigsville, the most male-oriented occupations are Architecture & Engineering (100.0%), Education, Arts & Media (100.0%), and Legal Services & Support (100.0%), while the most female-oriented occupations are Life, Physical & Social Science (100.0%), Health Diagnosing & Treating (53.9%), and Business & Financial (53.3%).
| Occupation | Male | Female |
| Management | 493 (69.1%) | 221 (30.9%) |
| Business & Financial | 107 (46.7%) | 122 (53.3%) |
| Computers, Engineering & Science | 376 (77.8%) | 107 (22.2%) |
| Computers & Mathematics | 344 (77.0%) | 103 (23.0%) |
| Architecture & Engineering | 32 (100.0%) | 0 (0.0%) |
| Life, Physical & Social Science | 0 (0.0%) | 4 (100.0%) |
| Community & Social Service | 245 (65.9%) | 127 (34.1%) |
| Education, Arts & Media | 23 (100.0%) | 0 (0.0%) |
| Legal Services & Support | 20 (100.0%) | 0 (0.0%) |
| Education Instruction & Library | 202 (61.4%) | 127 (38.6%) |
| Arts, Media & Entertainment | 0 (0.0%) | 0 (0.0%) |
| Health Diagnosing & Treating | 245 (46.1%) | 287 (53.9%) |
| Health Technologists | 226 (63.8%) | 128 (36.2%) |
| Total (Category) | 1,466 (62.9%) | 864 (37.1%) |
| Total (Overall) | 2,162 (52.4%) | 1,965 (47.6%) |
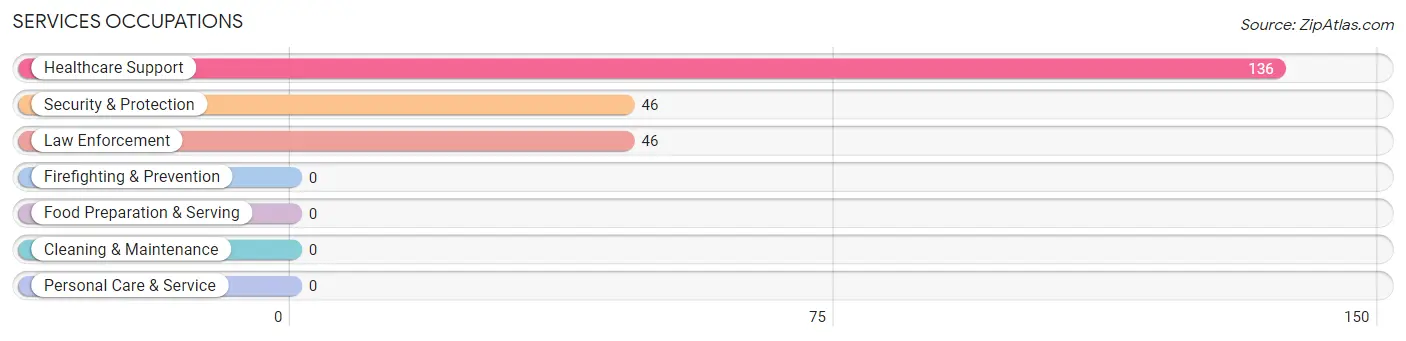
Services Occupations
The most common Services occupations in Breinigsville are Healthcare Support (136 | 3.3%), Security & Protection (46 | 1.1%), and Law Enforcement (46 | 1.1%).
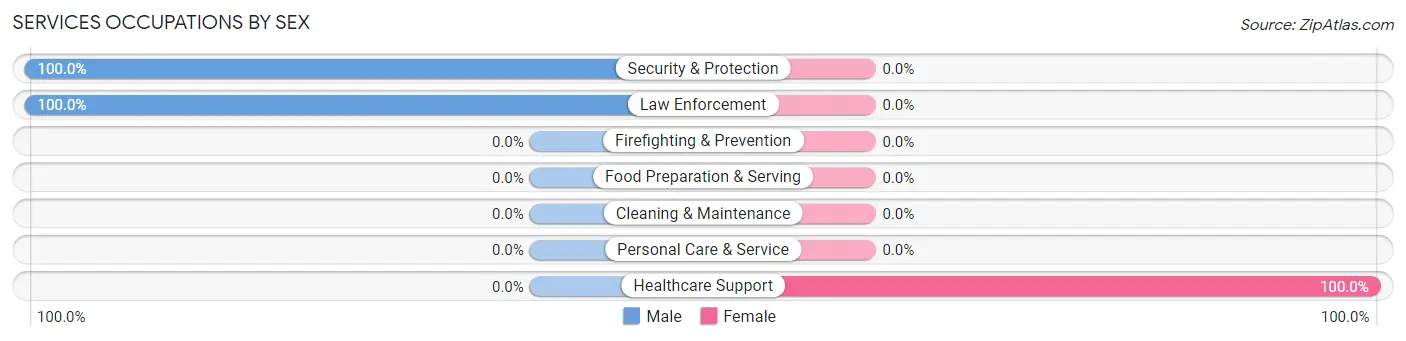
Services Occupations by Sex
| Occupation | Male | Female |
| Healthcare Support | 0 (0.0%) | 136 (100.0%) |
| Security & Protection | 46 (100.0%) | 0 (0.0%) |
| Firefighting & Prevention | 0 (0.0%) | 0 (0.0%) |
| Law Enforcement | 46 (100.0%) | 0 (0.0%) |
| Food Preparation & Serving | 0 (0.0%) | 0 (0.0%) |
| Cleaning & Maintenance | 0 (0.0%) | 0 (0.0%) |
| Personal Care & Service | 0 (0.0%) | 0 (0.0%) |
| Total (Category) | 46 (25.3%) | 136 (74.7%) |
| Total (Overall) | 2,162 (52.4%) | 1,965 (47.6%) |
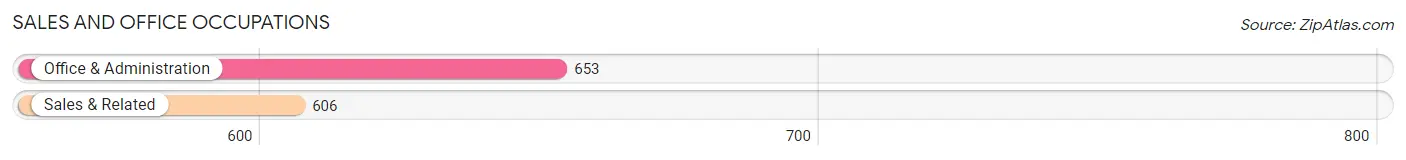
Sales and Office Occupations
The most common Sales and Office occupations in Breinigsville are Office & Administration (653 | 15.8%), and Sales & Related (606 | 14.7%).
Sales and Office Occupations by Sex
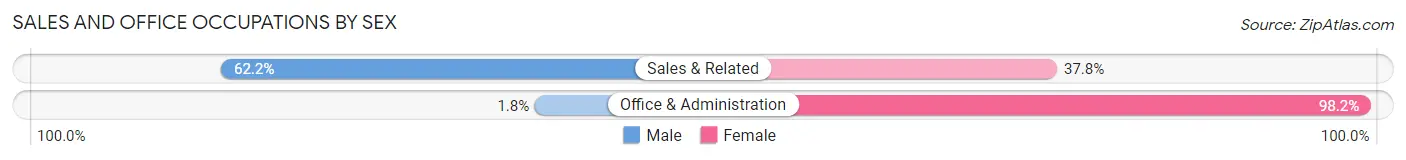
| Occupation | Male | Female |
| Sales & Related | 377 (62.2%) | 229 (37.8%) |
| Office & Administration | 12 (1.8%) | 641 (98.2%) |
| Total (Category) | 389 (30.9%) | 870 (69.1%) |
| Total (Overall) | 2,162 (52.4%) | 1,965 (47.6%) |
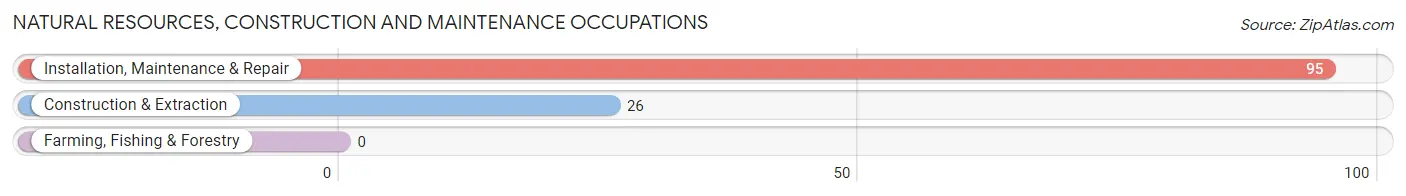
Natural Resources, Construction and Maintenance Occupations
The most common Natural Resources, Construction and Maintenance occupations in Breinigsville are Installation, Maintenance & Repair (95 | 2.3%), and Construction & Extraction (26 | 0.6%).
Natural Resources, Construction and Maintenance Occupations by Sex
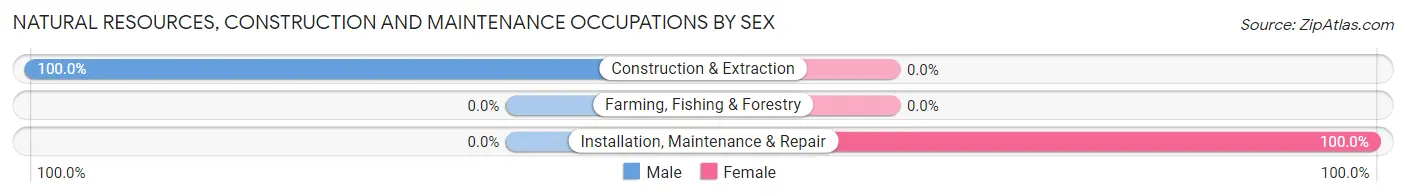
| Occupation | Male | Female |
| Farming, Fishing & Forestry | 0 (0.0%) | 0 (0.0%) |
| Construction & Extraction | 26 (100.0%) | 0 (0.0%) |
| Installation, Maintenance & Repair | 0 (0.0%) | 95 (100.0%) |
| Total (Category) | 26 (21.5%) | 95 (78.5%) |
| Total (Overall) | 2,162 (52.4%) | 1,965 (47.6%) |
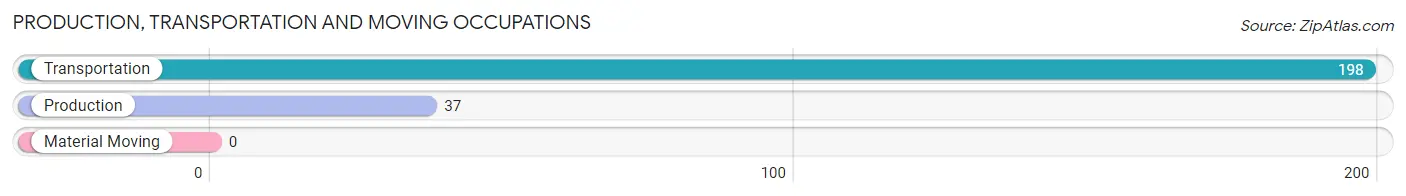
Production, Transportation and Moving Occupations
The most common Production, Transportation and Moving occupations in Breinigsville are Transportation (198 | 4.8%), and Production (37 | 0.9%).
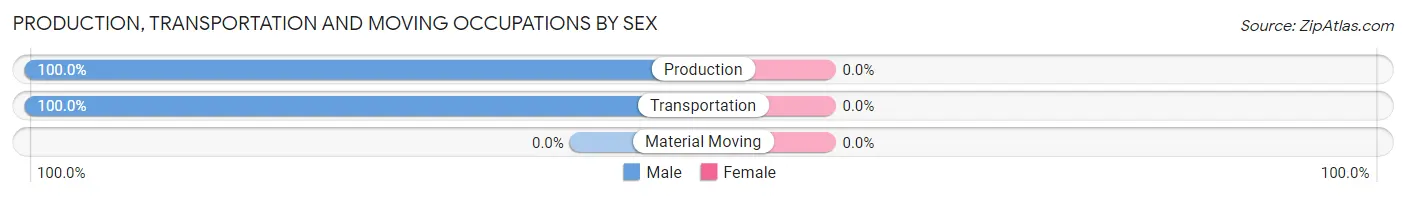
Production, Transportation and Moving Occupations by Sex
| Occupation | Male | Female |
| Production | 37 (100.0%) | 0 (0.0%) |
| Transportation | 198 (100.0%) | 0 (0.0%) |
| Material Moving | 0 (0.0%) | 0 (0.0%) |
| Total (Category) | 235 (100.0%) | 0 (0.0%) |
| Total (Overall) | 2,162 (52.4%) | 1,965 (47.6%) |
Employment Industries by Sex in Breinigsville
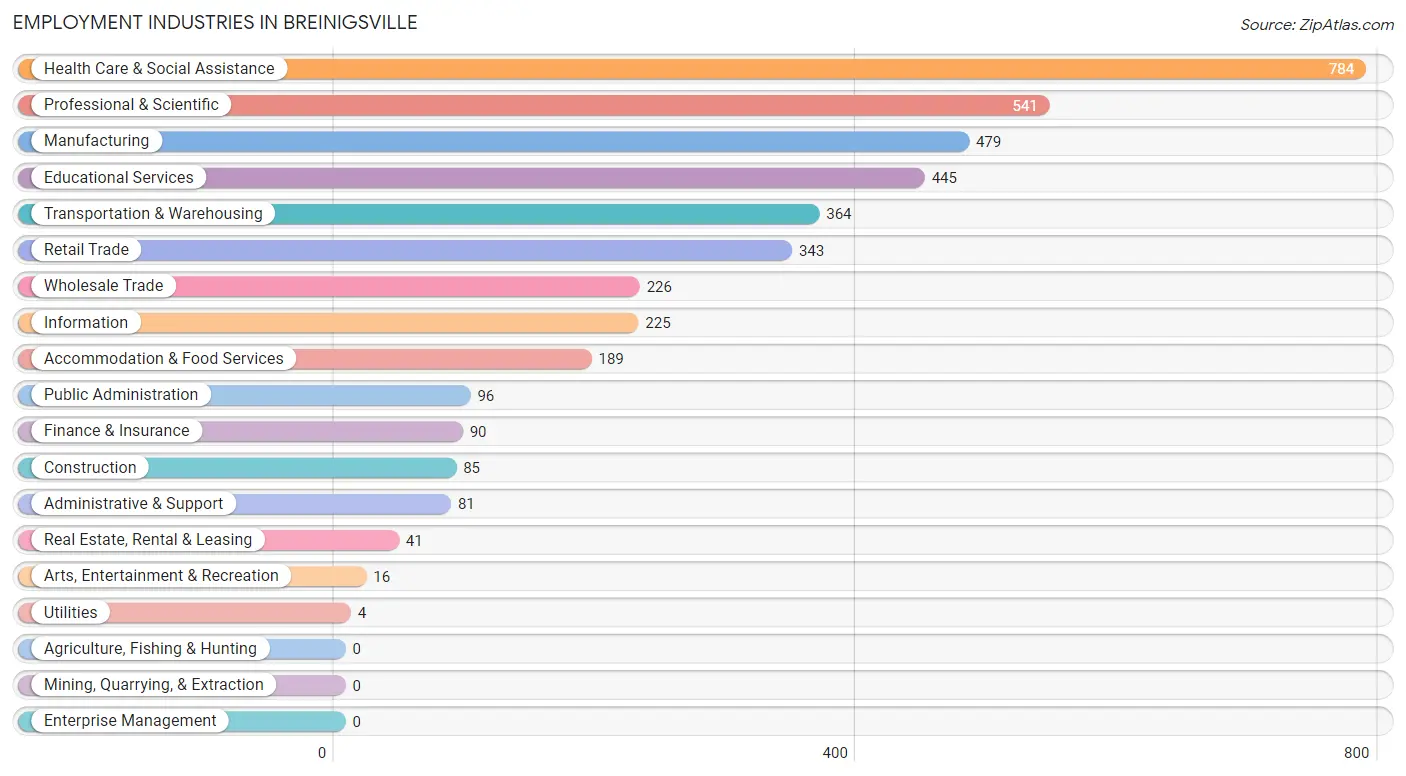
Employment Industries in Breinigsville
The major employment industries in Breinigsville include Health Care & Social Assistance (784 | 19.0%), Professional & Scientific (541 | 13.1%), Manufacturing (479 | 11.6%), Educational Services (445 | 10.8%), and Transportation & Warehousing (364 | 8.8%).
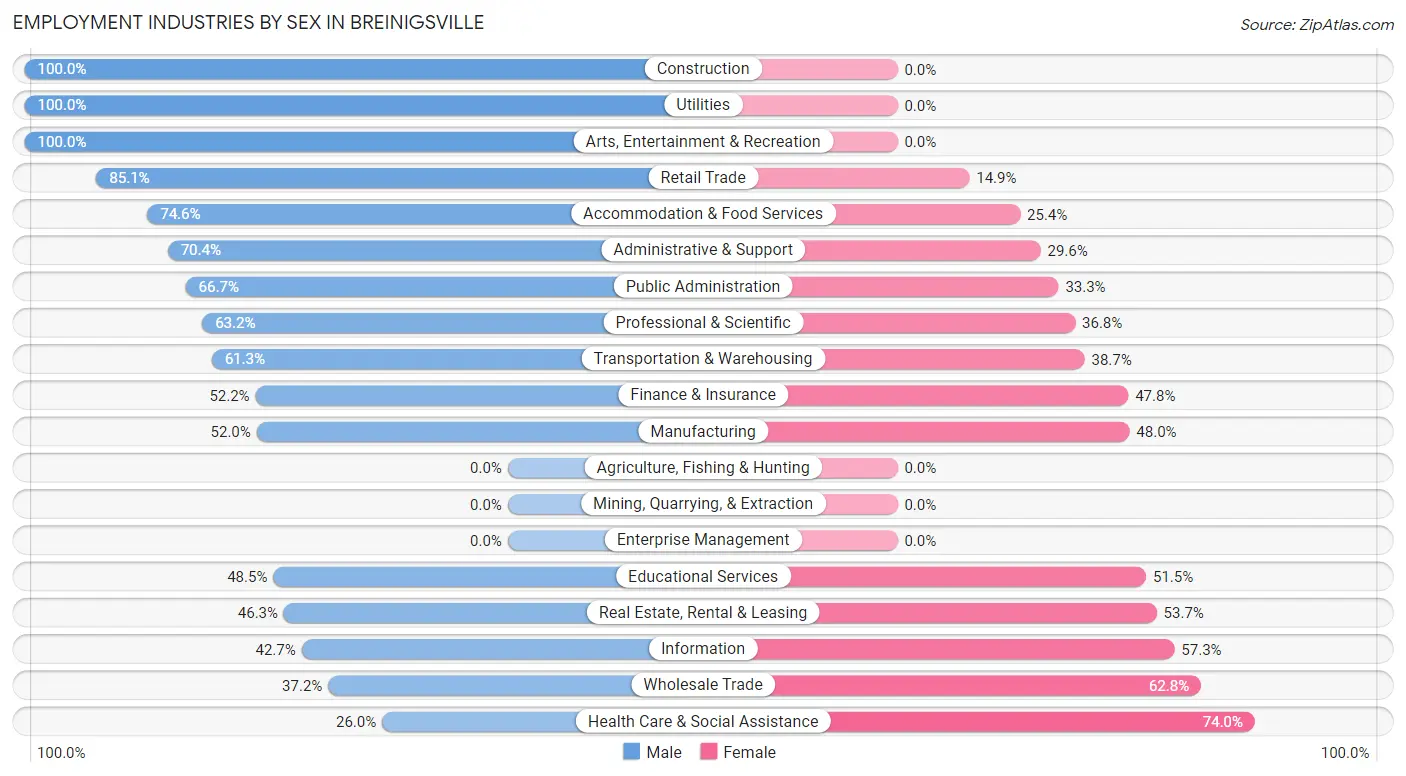
Employment Industries by Sex in Breinigsville
The Breinigsville industries that see more men than women are Construction (100.0%), Utilities (100.0%), and Arts, Entertainment & Recreation (100.0%), whereas the industries that tend to have a higher number of women are Health Care & Social Assistance (74.0%), Wholesale Trade (62.8%), and Information (57.3%).
| Industry | Male | Female |
| Agriculture, Fishing & Hunting | 0 (0.0%) | 0 (0.0%) |
| Mining, Quarrying, & Extraction | 0 (0.0%) | 0 (0.0%) |
| Construction | 85 (100.0%) | 0 (0.0%) |
| Manufacturing | 249 (52.0%) | 230 (48.0%) |
| Wholesale Trade | 84 (37.2%) | 142 (62.8%) |
| Retail Trade | 292 (85.1%) | 51 (14.9%) |
| Transportation & Warehousing | 223 (61.3%) | 141 (38.7%) |
| Utilities | 4 (100.0%) | 0 (0.0%) |
| Information | 96 (42.7%) | 129 (57.3%) |
| Finance & Insurance | 47 (52.2%) | 43 (47.8%) |
| Real Estate, Rental & Leasing | 19 (46.3%) | 22 (53.7%) |
| Professional & Scientific | 342 (63.2%) | 199 (36.8%) |
| Enterprise Management | 0 (0.0%) | 0 (0.0%) |
| Administrative & Support | 57 (70.4%) | 24 (29.6%) |
| Educational Services | 216 (48.5%) | 229 (51.5%) |
| Health Care & Social Assistance | 204 (26.0%) | 580 (74.0%) |
| Arts, Entertainment & Recreation | 16 (100.0%) | 0 (0.0%) |
| Accommodation & Food Services | 141 (74.6%) | 48 (25.4%) |
| Public Administration | 64 (66.7%) | 32 (33.3%) |
| Total | 2,162 (52.4%) | 1,965 (47.6%) |
Education in Breinigsville
School Enrollment in Breinigsville
The most common levels of schooling among the 2,714 students in Breinigsville are middle school (833 | 30.7%), high school (733 | 27.0%), and elementary school (687 | 25.3%).
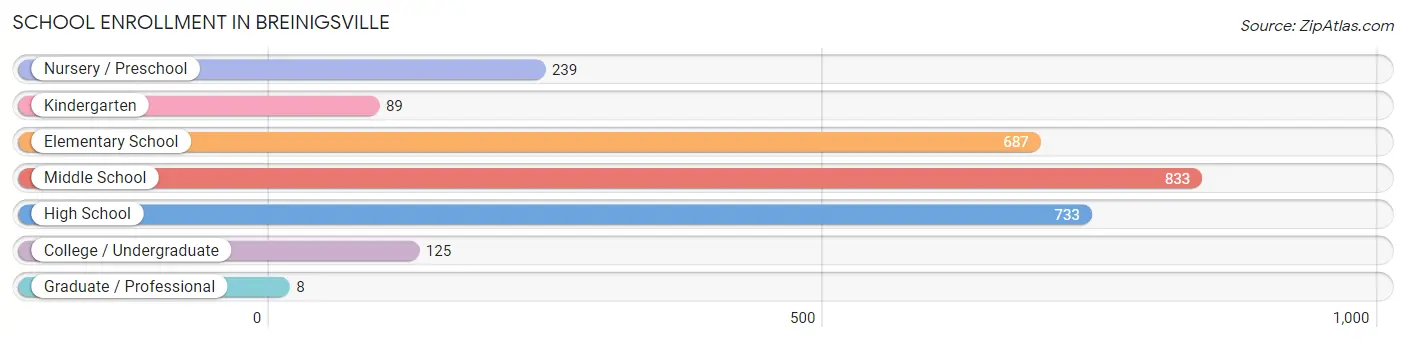
| School Level | # Students | % Students |
| Nursery / Preschool | 239 | 8.8% |
| Kindergarten | 89 | 3.3% |
| Elementary School | 687 | 25.3% |
| Middle School | 833 | 30.7% |
| High School | 733 | 27.0% |
| College / Undergraduate | 125 | 4.6% |
| Graduate / Professional | 8 | 0.3% |
| Total | 2,714 | 100.0% |
School Enrollment by Age by Funding Source in Breinigsville
Out of a total of 2,714 students who are enrolled in schools in Breinigsville, 326 (12.0%) attend a private institution, while the remaining 2,388 (88.0%) are enrolled in public schools. The age group of 3 to 4 year olds has the highest likelihood of being enrolled in private schools, with 75 (33.8% in the age bracket) enrolled. Conversely, the age group of 18 to 19 year olds has the lowest likelihood of being enrolled in a private school, with 70 (100.0% in the age bracket) attending a public institution.
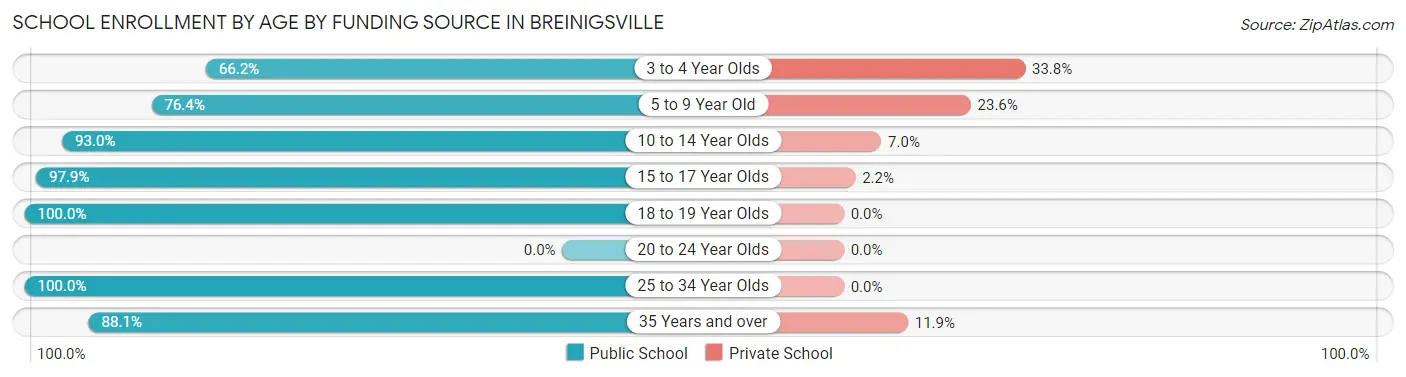
| Age Bracket | Public School | Private School |
| 3 to 4 Year Olds | 147 (66.2%) | 75 (33.8%) |
| 5 to 9 Year Old | 507 (76.4%) | 157 (23.6%) |
| 10 to 14 Year Olds | 959 (93.0%) | 72 (7.0%) |
| 15 to 17 Year Olds | 592 (97.9%) | 13 (2.1%) |
| 18 to 19 Year Olds | 70 (100.0%) | 0 (0.0%) |
| 20 to 24 Year Olds | 0 (0.0%) | 0 (0.0%) |
| 25 to 34 Year Olds | 55 (100.0%) | 0 (0.0%) |
| 35 Years and over | 59 (88.1%) | 8 (11.9%) |
| Total | 2,388 (88.0%) | 326 (12.0%) |
Educational Attainment by Field of Study in Breinigsville
Business (684 | 22.7%), engineering (623 | 20.7%), education (474 | 15.7%), science & technology (278 | 9.2%), and computers & mathematics (239 | 7.9%) are the most common fields of study among 3,016 individuals in Breinigsville who have obtained a bachelor's degree or higher.
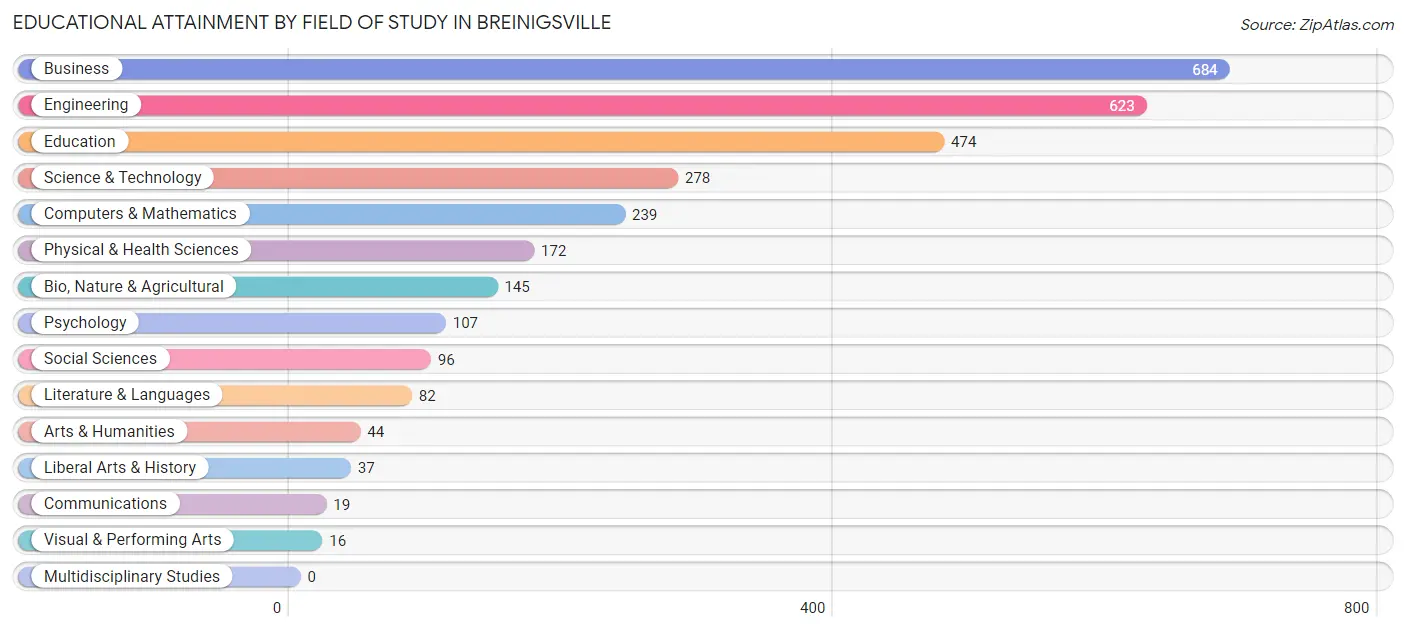
| Field of Study | # Graduates | % Graduates |
| Computers & Mathematics | 239 | 7.9% |
| Bio, Nature & Agricultural | 145 | 4.8% |
| Physical & Health Sciences | 172 | 5.7% |
| Psychology | 107 | 3.5% |
| Social Sciences | 96 | 3.2% |
| Engineering | 623 | 20.7% |
| Multidisciplinary Studies | 0 | 0.0% |
| Science & Technology | 278 | 9.2% |
| Business | 684 | 22.7% |
| Education | 474 | 15.7% |
| Literature & Languages | 82 | 2.7% |
| Liberal Arts & History | 37 | 1.2% |
| Visual & Performing Arts | 16 | 0.5% |
| Communications | 19 | 0.6% |
| Arts & Humanities | 44 | 1.5% |
| Total | 3,016 | 100.0% |
Transportation & Commute in Breinigsville
Vehicle Availability by Sex in Breinigsville
The most prevalent vehicle ownership categories in Breinigsville are males with 2 vehicles (1,228, accounting for 56.8%) and females with 2 vehicles (1,057, making up 69.2%).
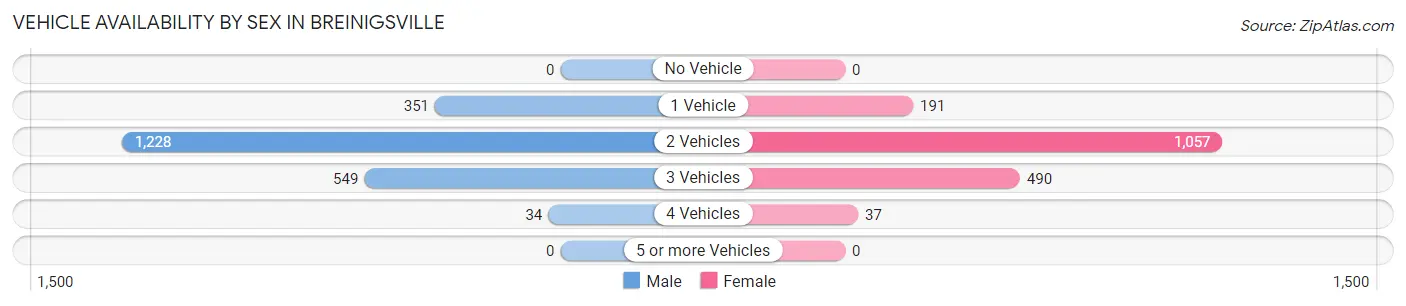
| Vehicles Available | Male | Female |
| No Vehicle | 0 (0.0%) | 0 (0.0%) |
| 1 Vehicle | 351 (16.2%) | 191 (10.8%) |
| 2 Vehicles | 1,228 (56.8%) | 1,057 (59.6%) |
| 3 Vehicles | 549 (25.4%) | 490 (27.6%) |
| 4 Vehicles | 34 (1.6%) | 37 (2.1%) |
| 5 or more Vehicles | 0 (0.0%) | 0 (0.0%) |
| Total | 2,162 (100.0%) | 1,775 (100.0%) |
Commute Time in Breinigsville
The most frequently occuring commute durations in Breinigsville are 20 to 24 minutes (791 commuters, 25.8%), 10 to 14 minutes (632 commuters, 20.6%), and 30 to 34 minutes (553 commuters, 18.0%).
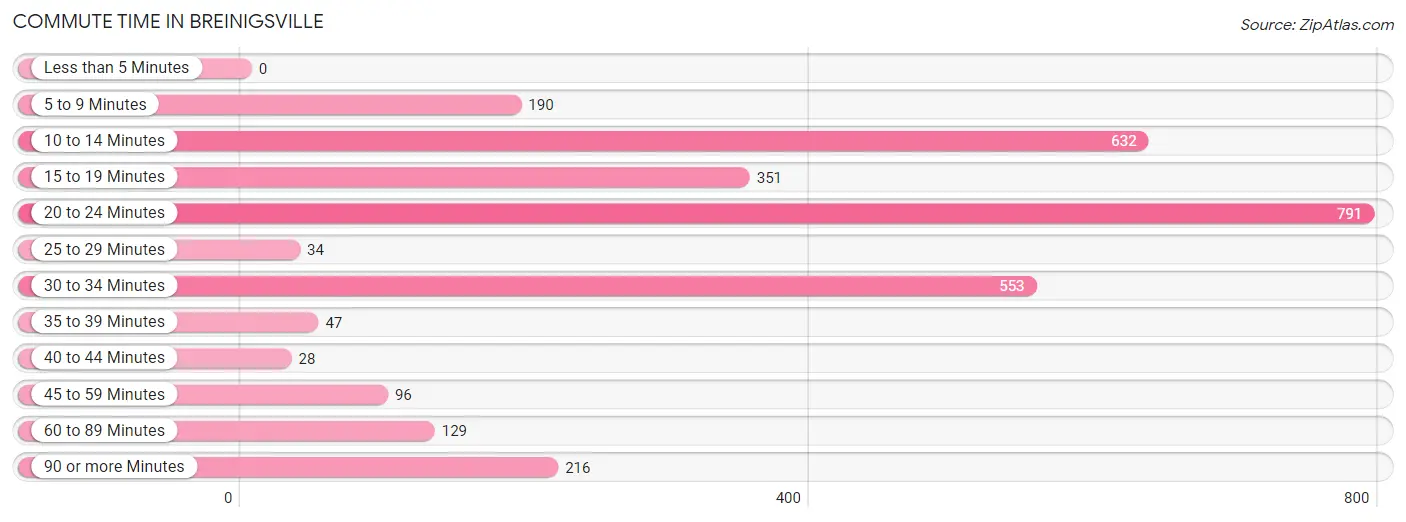
| Commute Time | # Commuters | % Commuters |
| Less than 5 Minutes | 0 | 0.0% |
| 5 to 9 Minutes | 190 | 6.2% |
| 10 to 14 Minutes | 632 | 20.6% |
| 15 to 19 Minutes | 351 | 11.4% |
| 20 to 24 Minutes | 791 | 25.8% |
| 25 to 29 Minutes | 34 | 1.1% |
| 30 to 34 Minutes | 553 | 18.0% |
| 35 to 39 Minutes | 47 | 1.5% |
| 40 to 44 Minutes | 28 | 0.9% |
| 45 to 59 Minutes | 96 | 3.1% |
| 60 to 89 Minutes | 129 | 4.2% |
| 90 or more Minutes | 216 | 7.0% |
Commute Time by Sex in Breinigsville
The most common commute times in Breinigsville are 20 to 24 minutes (502 commuters, 28.1%) for males and 30 to 34 minutes (373 commuters, 29.1%) for females.
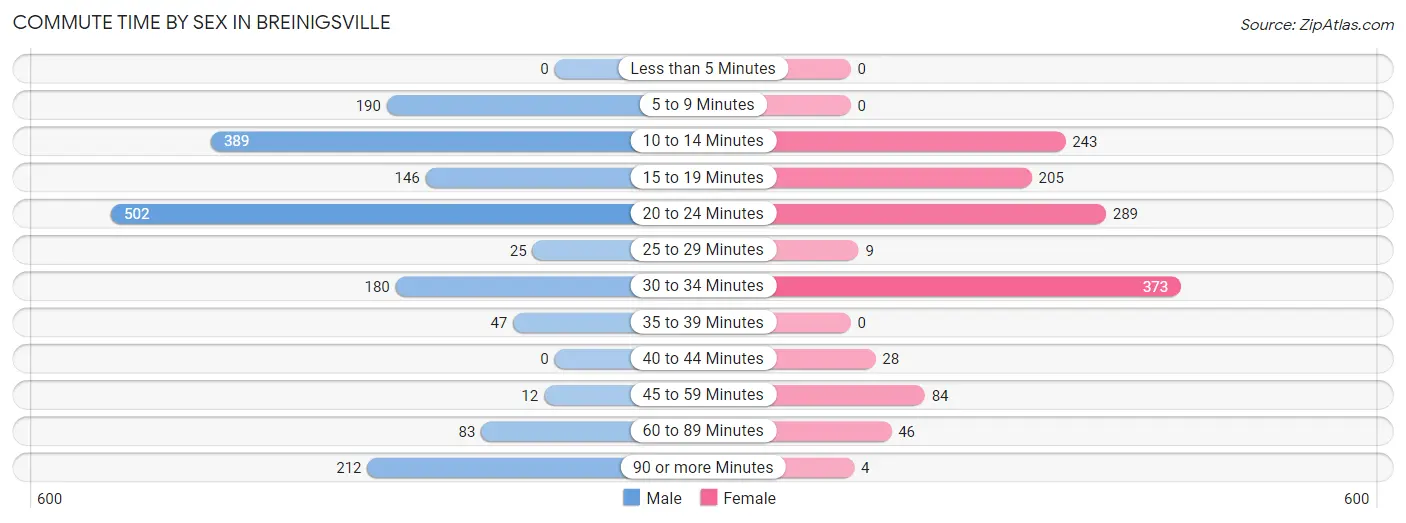
| Commute Time | Male | Female |
| Less than 5 Minutes | 0 (0.0%) | 0 (0.0%) |
| 5 to 9 Minutes | 190 (10.6%) | 0 (0.0%) |
| 10 to 14 Minutes | 389 (21.8%) | 243 (19.0%) |
| 15 to 19 Minutes | 146 (8.2%) | 205 (16.0%) |
| 20 to 24 Minutes | 502 (28.1%) | 289 (22.6%) |
| 25 to 29 Minutes | 25 (1.4%) | 9 (0.7%) |
| 30 to 34 Minutes | 180 (10.1%) | 373 (29.1%) |
| 35 to 39 Minutes | 47 (2.6%) | 0 (0.0%) |
| 40 to 44 Minutes | 0 (0.0%) | 28 (2.2%) |
| 45 to 59 Minutes | 12 (0.7%) | 84 (6.6%) |
| 60 to 89 Minutes | 83 (4.6%) | 46 (3.6%) |
| 90 or more Minutes | 212 (11.9%) | 4 (0.3%) |
Time of Departure to Work by Sex in Breinigsville
The most frequent times of departure to work in Breinigsville are 8:30 AM to 8:59 AM (319, 17.9%) for males and 7:00 AM to 7:29 AM (282, 22.0%) for females.
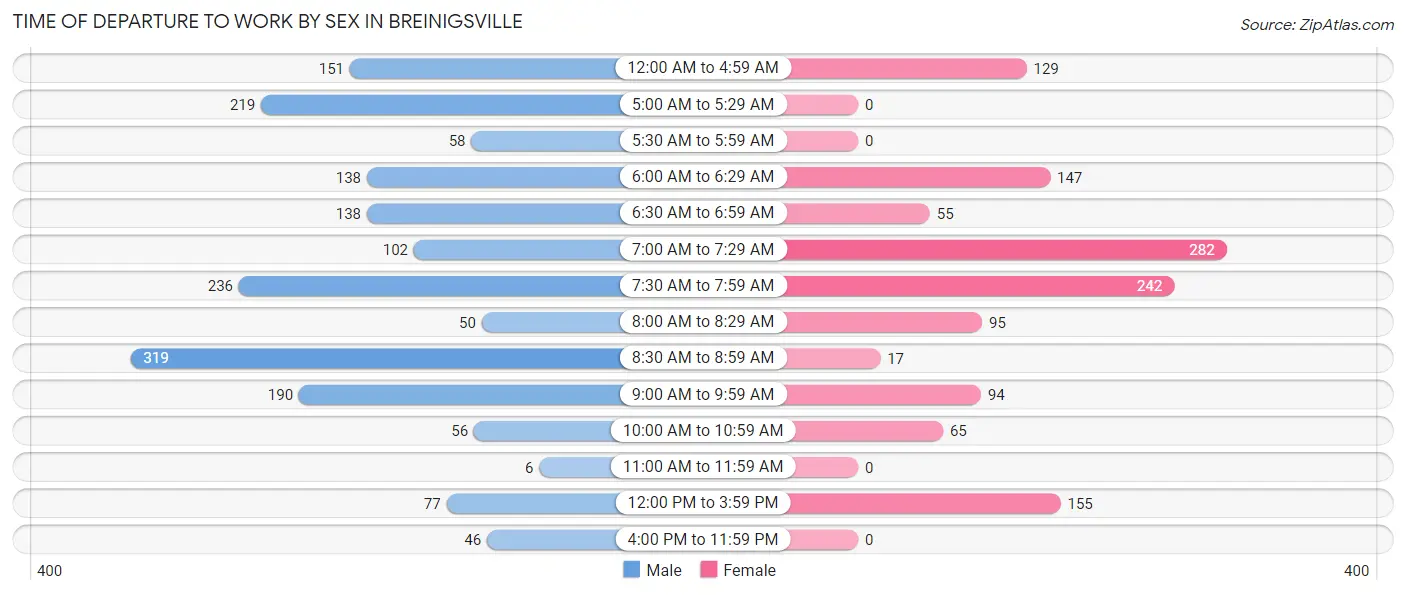
| Time of Departure | Male | Female |
| 12:00 AM to 4:59 AM | 151 (8.5%) | 129 (10.1%) |
| 5:00 AM to 5:29 AM | 219 (12.3%) | 0 (0.0%) |
| 5:30 AM to 5:59 AM | 58 (3.3%) | 0 (0.0%) |
| 6:00 AM to 6:29 AM | 138 (7.7%) | 147 (11.5%) |
| 6:30 AM to 6:59 AM | 138 (7.7%) | 55 (4.3%) |
| 7:00 AM to 7:29 AM | 102 (5.7%) | 282 (22.0%) |
| 7:30 AM to 7:59 AM | 236 (13.2%) | 242 (18.9%) |
| 8:00 AM to 8:29 AM | 50 (2.8%) | 95 (7.4%) |
| 8:30 AM to 8:59 AM | 319 (17.9%) | 17 (1.3%) |
| 9:00 AM to 9:59 AM | 190 (10.6%) | 94 (7.3%) |
| 10:00 AM to 10:59 AM | 56 (3.1%) | 65 (5.1%) |
| 11:00 AM to 11:59 AM | 6 (0.3%) | 0 (0.0%) |
| 12:00 PM to 3:59 PM | 77 (4.3%) | 155 (12.1%) |
| 4:00 PM to 11:59 PM | 46 (2.6%) | 0 (0.0%) |
| Total | 1,786 (100.0%) | 1,281 (100.0%) |
Housing Occupancy in Breinigsville
Occupancy by Ownership in Breinigsville
Of the total 2,899 dwellings in Breinigsville, owner-occupied units account for 2,543 (87.7%), while renter-occupied units make up 356 (12.3%).
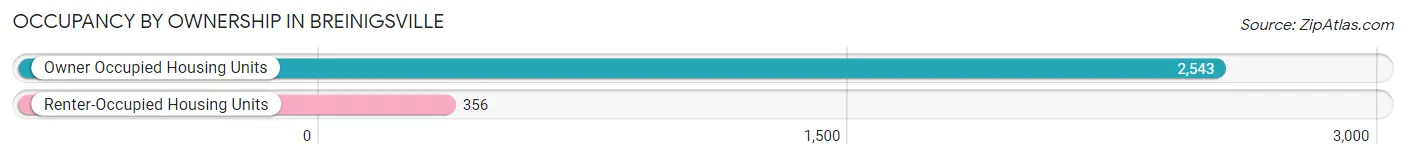
| Occupancy | # Housing Units | % Housing Units |
| Owner Occupied Housing Units | 2,543 | 87.7% |
| Renter-Occupied Housing Units | 356 | 12.3% |
| Total Occupied Housing Units | 2,899 | 100.0% |
Occupancy by Household Size in Breinigsville
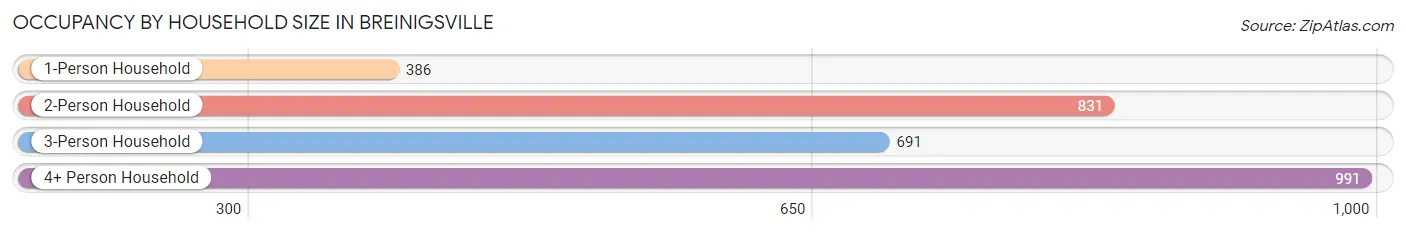
| Household Size | # Housing Units | % Housing Units |
| 1-Person Household | 386 | 13.3% |
| 2-Person Household | 831 | 28.7% |
| 3-Person Household | 691 | 23.8% |
| 4+ Person Household | 991 | 34.2% |
| Total Housing Units | 2,899 | 100.0% |
Occupancy by Ownership by Household Size in Breinigsville
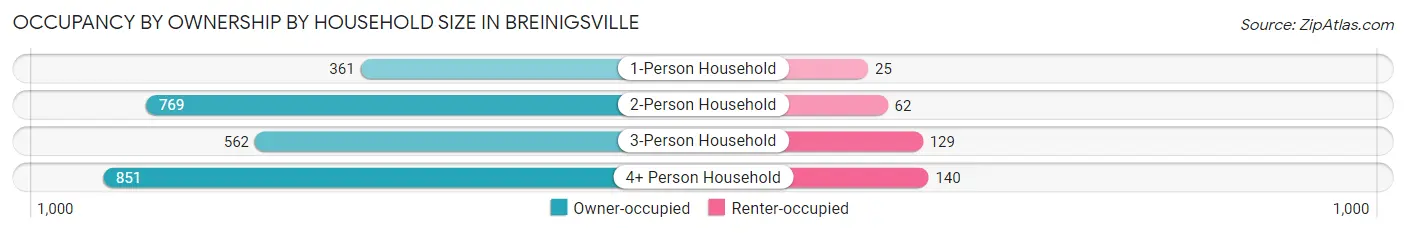
| Household Size | Owner-occupied | Renter-occupied |
| 1-Person Household | 361 (93.5%) | 25 (6.5%) |
| 2-Person Household | 769 (92.5%) | 62 (7.5%) |
| 3-Person Household | 562 (81.3%) | 129 (18.7%) |
| 4+ Person Household | 851 (85.9%) | 140 (14.1%) |
| Total Housing Units | 2,543 (87.7%) | 356 (12.3%) |
Occupancy by Educational Attainment in Breinigsville
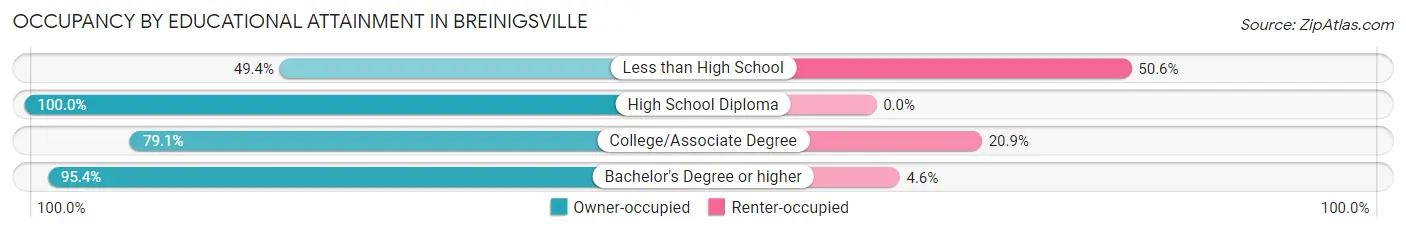
| Household Size | Owner-occupied | Renter-occupied |
| Less than High School | 126 (49.4%) | 129 (50.6%) |
| High School Diploma | 398 (100.0%) | 0 (0.0%) |
| College/Associate Degree | 597 (79.1%) | 158 (20.9%) |
| Bachelor's Degree or higher | 1,422 (95.4%) | 69 (4.6%) |
Occupancy by Age of Householder in Breinigsville
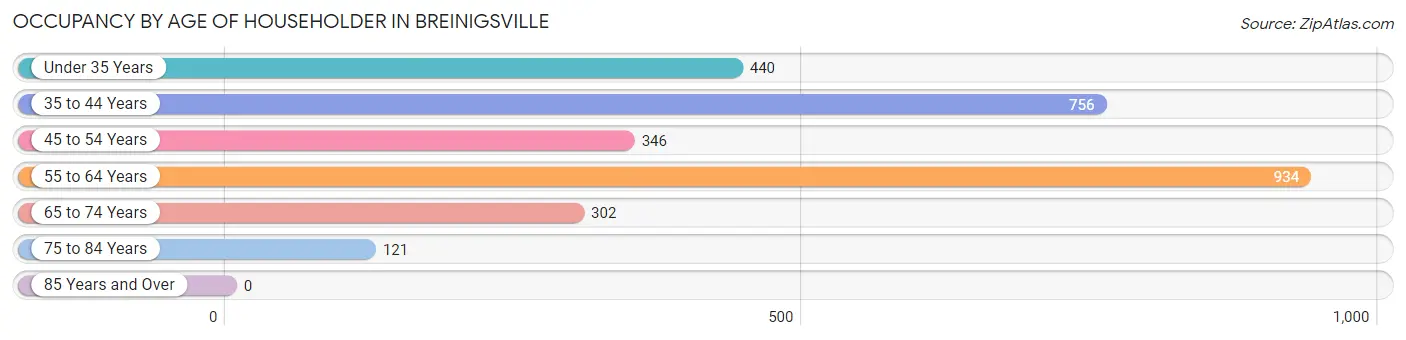
| Age Bracket | # Households | % Households |
| Under 35 Years | 440 | 15.2% |
| 35 to 44 Years | 756 | 26.1% |
| 45 to 54 Years | 346 | 11.9% |
| 55 to 64 Years | 934 | 32.2% |
| 65 to 74 Years | 302 | 10.4% |
| 75 to 84 Years | 121 | 4.2% |
| 85 Years and Over | 0 | 0.0% |
| Total | 2,899 | 100.0% |
Housing Finances in Breinigsville
Median Income by Occupancy in Breinigsville
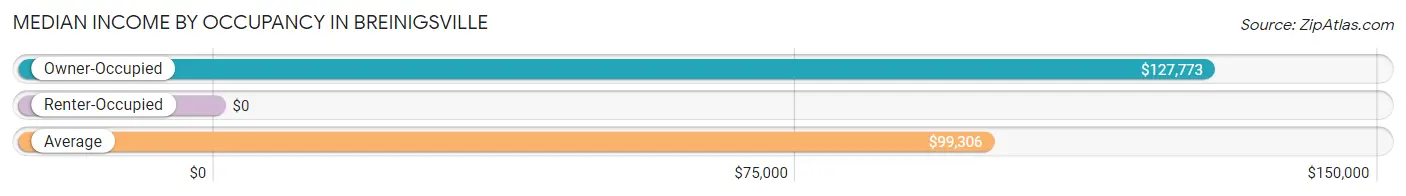
| Occupancy Type | # Households | Median Income |
| Owner-Occupied | 2,543 (87.7%) | $127,773 |
| Renter-Occupied | 356 (12.3%) | $0 |
| Average | 2,899 (100.0%) | $99,306 |
Occupancy by Householder Income Bracket in Breinigsville
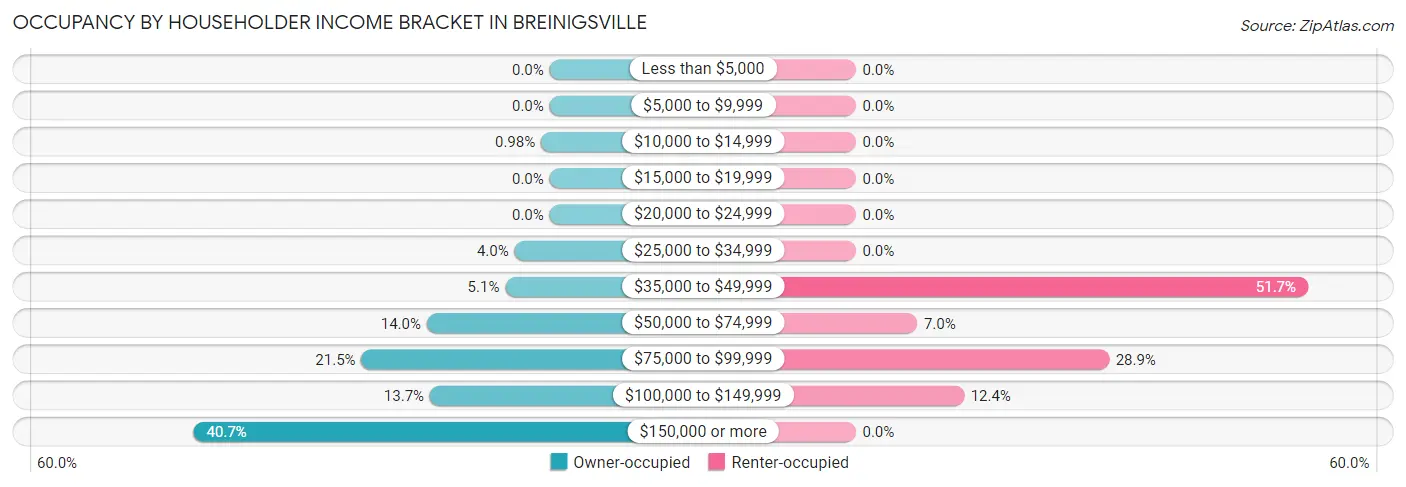
| Income Bracket | Owner-occupied | Renter-occupied |
| Less than $5,000 | 0 (0.0%) | 0 (0.0%) |
| $5,000 to $9,999 | 0 (0.0%) | 0 (0.0%) |
| $10,000 to $14,999 | 25 (1.0%) | 0 (0.0%) |
| $15,000 to $19,999 | 0 (0.0%) | 0 (0.0%) |
| $20,000 to $24,999 | 0 (0.0%) | 0 (0.0%) |
| $25,000 to $34,999 | 102 (4.0%) | 0 (0.0%) |
| $35,000 to $49,999 | 129 (5.1%) | 184 (51.7%) |
| $50,000 to $74,999 | 357 (14.0%) | 25 (7.0%) |
| $75,000 to $99,999 | 547 (21.5%) | 103 (28.9%) |
| $100,000 to $149,999 | 348 (13.7%) | 44 (12.4%) |
| $150,000 or more | 1,035 (40.7%) | 0 (0.0%) |
| Total | 2,543 (100.0%) | 356 (100.0%) |
Monthly Housing Cost Tiers in Breinigsville
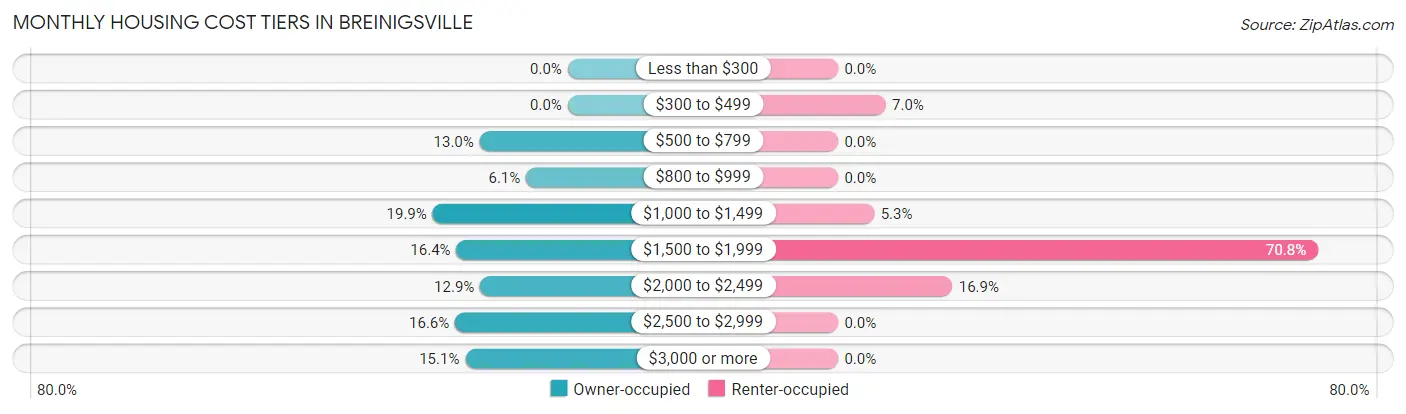
| Monthly Cost | Owner-occupied | Renter-occupied |
| Less than $300 | 0 (0.0%) | 0 (0.0%) |
| $300 to $499 | 0 (0.0%) | 25 (7.0%) |
| $500 to $799 | 330 (13.0%) | 0 (0.0%) |
| $800 to $999 | 156 (6.1%) | 0 (0.0%) |
| $1,000 to $1,499 | 506 (19.9%) | 19 (5.3%) |
| $1,500 to $1,999 | 417 (16.4%) | 252 (70.8%) |
| $2,000 to $2,499 | 328 (12.9%) | 60 (16.9%) |
| $2,500 to $2,999 | 422 (16.6%) | 0 (0.0%) |
| $3,000 or more | 384 (15.1%) | 0 (0.0%) |
| Total | 2,543 (100.0%) | 356 (100.0%) |
Physical Housing Characteristics in Breinigsville
Housing Structures in Breinigsville
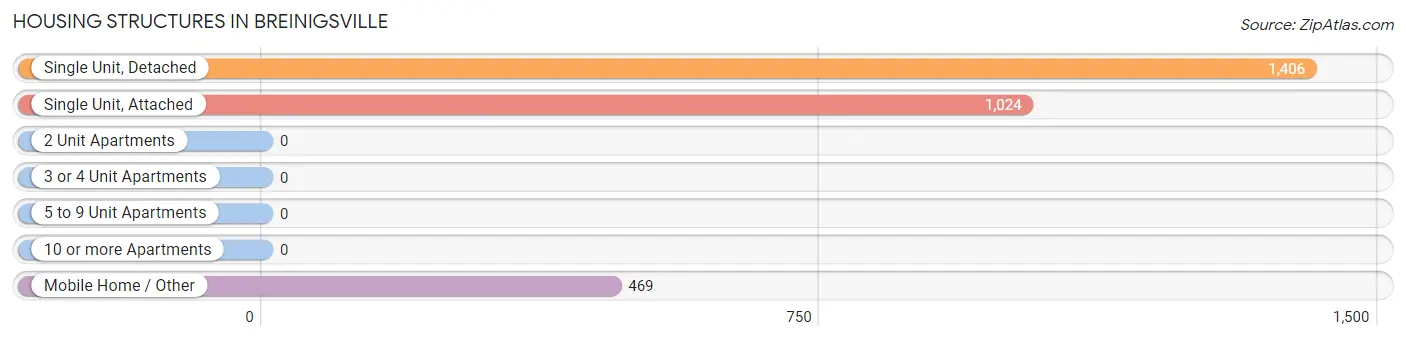
| Structure Type | # Housing Units | % Housing Units |
| Single Unit, Detached | 1,406 | 48.5% |
| Single Unit, Attached | 1,024 | 35.3% |
| 2 Unit Apartments | 0 | 0.0% |
| 3 or 4 Unit Apartments | 0 | 0.0% |
| 5 to 9 Unit Apartments | 0 | 0.0% |
| 10 or more Apartments | 0 | 0.0% |
| Mobile Home / Other | 469 | 16.2% |
| Total | 2,899 | 100.0% |
Housing Structures by Occupancy in Breinigsville
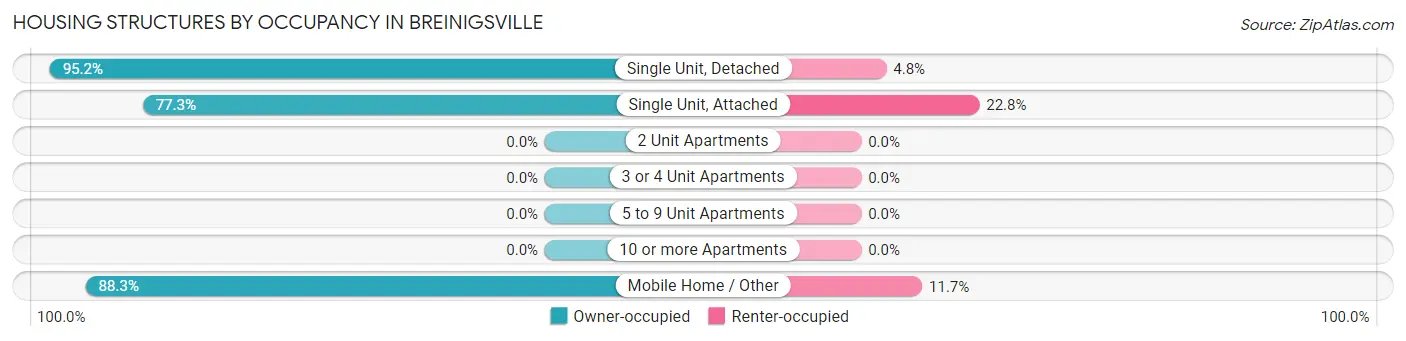
| Structure Type | Owner-occupied | Renter-occupied |
| Single Unit, Detached | 1,338 (95.2%) | 68 (4.8%) |
| Single Unit, Attached | 791 (77.2%) | 233 (22.8%) |
| 2 Unit Apartments | 0 (0.0%) | 0 (0.0%) |
| 3 or 4 Unit Apartments | 0 (0.0%) | 0 (0.0%) |
| 5 to 9 Unit Apartments | 0 (0.0%) | 0 (0.0%) |
| 10 or more Apartments | 0 (0.0%) | 0 (0.0%) |
| Mobile Home / Other | 414 (88.3%) | 55 (11.7%) |
| Total | 2,543 (87.7%) | 356 (12.3%) |
Housing Structures by Number of Rooms in Breinigsville
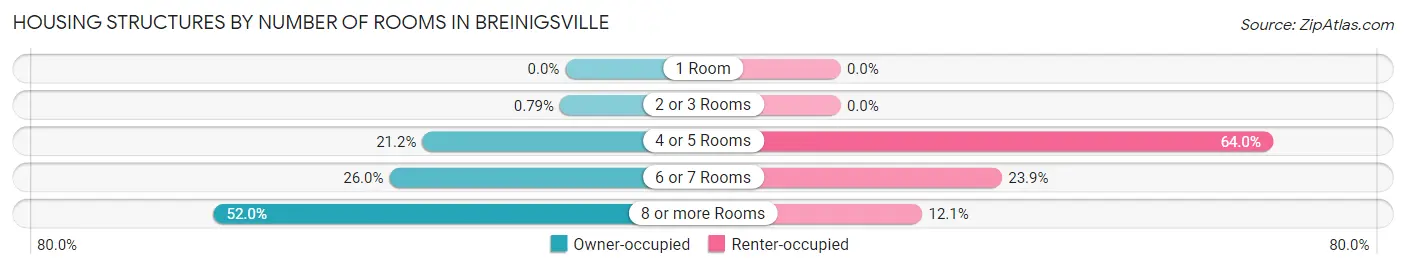
| Number of Rooms | Owner-occupied | Renter-occupied |
| 1 Room | 0 (0.0%) | 0 (0.0%) |
| 2 or 3 Rooms | 20 (0.8%) | 0 (0.0%) |
| 4 or 5 Rooms | 538 (21.2%) | 228 (64.0%) |
| 6 or 7 Rooms | 662 (26.0%) | 85 (23.9%) |
| 8 or more Rooms | 1,323 (52.0%) | 43 (12.1%) |
| Total | 2,543 (100.0%) | 356 (100.0%) |
Housing Structure by Heating Type in Breinigsville
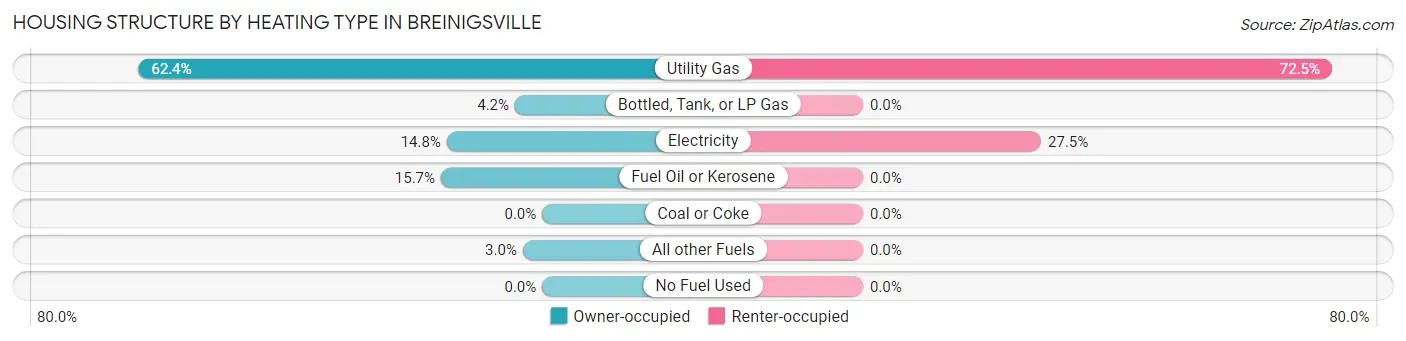
| Heating Type | Owner-occupied | Renter-occupied |
| Utility Gas | 1,587 (62.4%) | 258 (72.5%) |
| Bottled, Tank, or LP Gas | 107 (4.2%) | 0 (0.0%) |
| Electricity | 375 (14.7%) | 98 (27.5%) |
| Fuel Oil or Kerosene | 398 (15.7%) | 0 (0.0%) |
| Coal or Coke | 0 (0.0%) | 0 (0.0%) |
| All other Fuels | 76 (3.0%) | 0 (0.0%) |
| No Fuel Used | 0 (0.0%) | 0 (0.0%) |
| Total | 2,543 (100.0%) | 356 (100.0%) |
Household Vehicle Usage in Breinigsville
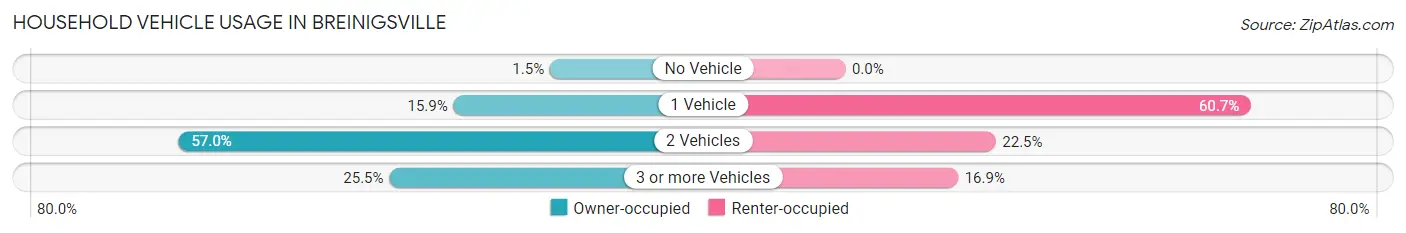
| Vehicles per Household | Owner-occupied | Renter-occupied |
| No Vehicle | 39 (1.5%) | 0 (0.0%) |
| 1 Vehicle | 405 (15.9%) | 216 (60.7%) |
| 2 Vehicles | 1,450 (57.0%) | 80 (22.5%) |
| 3 or more Vehicles | 649 (25.5%) | 60 (16.9%) |
| Total | 2,543 (100.0%) | 356 (100.0%) |
Real Estate & Mortgages in Breinigsville
Real Estate and Mortgage Overview in Breinigsville
| Characteristic | Without Mortgage | With Mortgage |
| Housing Units | 686 | 1,857 |
| Median Property Value | $314,700 | $383,300 |
| Median Household Income | $67,175 | $887 |
| Monthly Housing Costs | $812 | $364 |
| Real Estate Taxes | $4,220 | $0 |
Property Value by Mortgage Status in Breinigsville
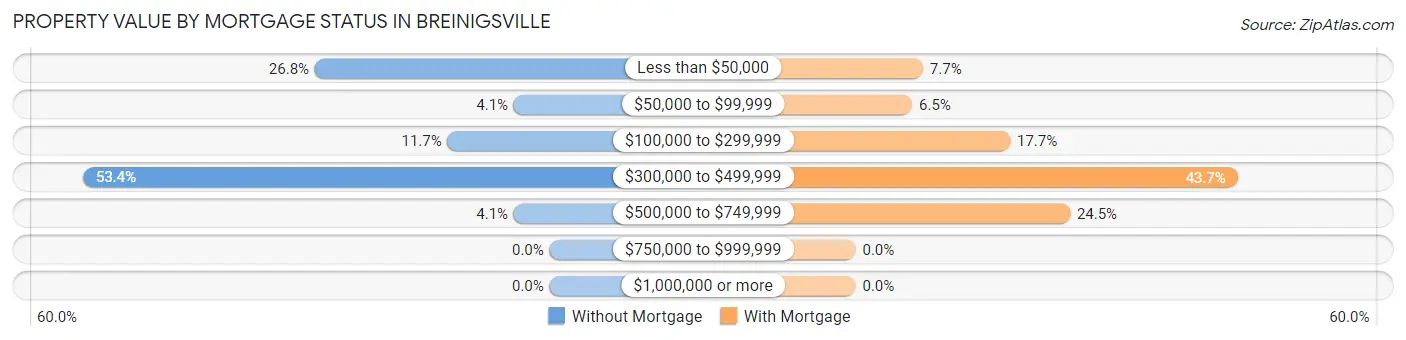
| Property Value | Without Mortgage | With Mortgage |
| Less than $50,000 | 184 (26.8%) | 143 (7.7%) |
| $50,000 to $99,999 | 28 (4.1%) | 120 (6.5%) |
| $100,000 to $299,999 | 80 (11.7%) | 328 (17.7%) |
| $300,000 to $499,999 | 366 (53.3%) | 811 (43.7%) |
| $500,000 to $749,999 | 28 (4.1%) | 455 (24.5%) |
| $750,000 to $999,999 | 0 (0.0%) | 0 (0.0%) |
| $1,000,000 or more | 0 (0.0%) | 0 (0.0%) |
| Total | 686 (100.0%) | 1,857 (100.0%) |
Household Income by Mortgage Status in Breinigsville
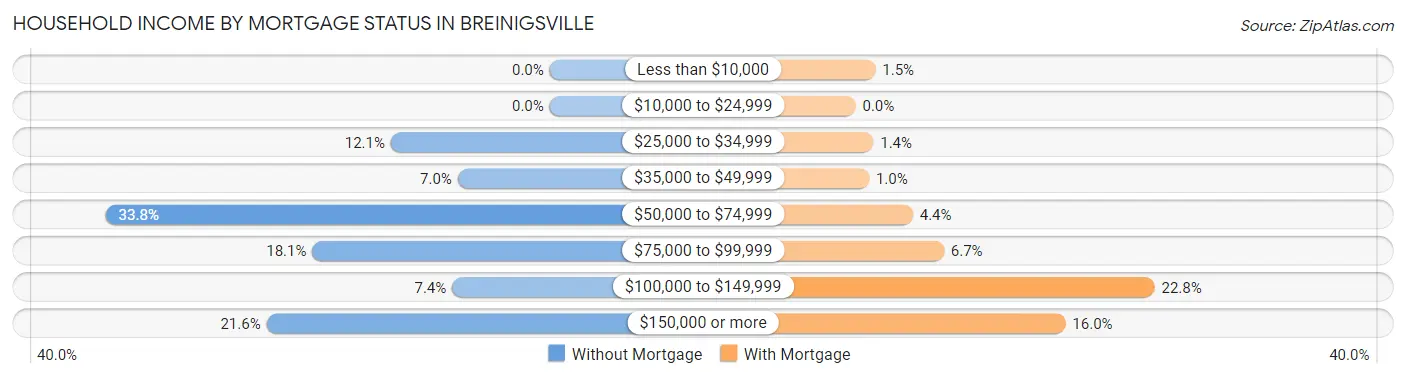
| Household Income | Without Mortgage | With Mortgage |
| Less than $10,000 | 0 (0.0%) | 28 (1.5%) |
| $10,000 to $24,999 | 0 (0.0%) | 0 (0.0%) |
| $25,000 to $34,999 | 83 (12.1%) | 25 (1.3%) |
| $35,000 to $49,999 | 48 (7.0%) | 19 (1.0%) |
| $50,000 to $74,999 | 232 (33.8%) | 81 (4.4%) |
| $75,000 to $99,999 | 124 (18.1%) | 125 (6.7%) |
| $100,000 to $149,999 | 51 (7.4%) | 423 (22.8%) |
| $150,000 or more | 148 (21.6%) | 297 (16.0%) |
| Total | 686 (100.0%) | 1,857 (100.0%) |
Property Value to Household Income Ratio in Breinigsville
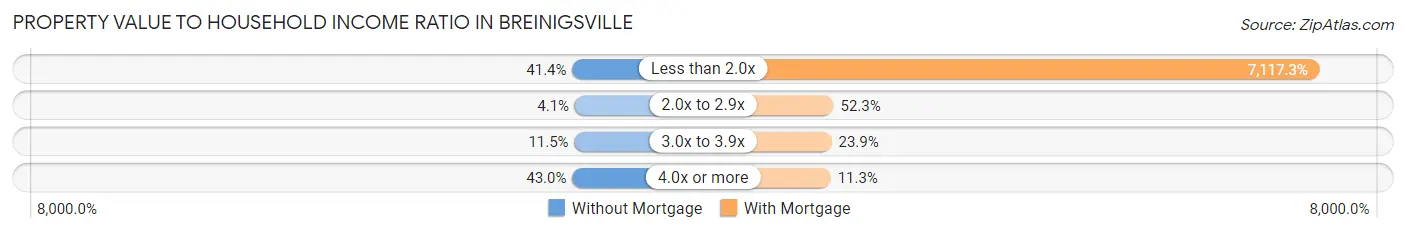
| Value-to-Income Ratio | Without Mortgage | With Mortgage |
| Less than 2.0x | 284 (41.4%) | 132,168 (7,117.3%) |
| 2.0x to 2.9x | 28 (4.1%) | 971 (52.3%) |
| 3.0x to 3.9x | 79 (11.5%) | 444 (23.9%) |
| 4.0x or more | 295 (43.0%) | 209 (11.3%) |
| Total | 686 (100.0%) | 1,857 (100.0%) |
Real Estate Taxes by Mortgage Status in Breinigsville
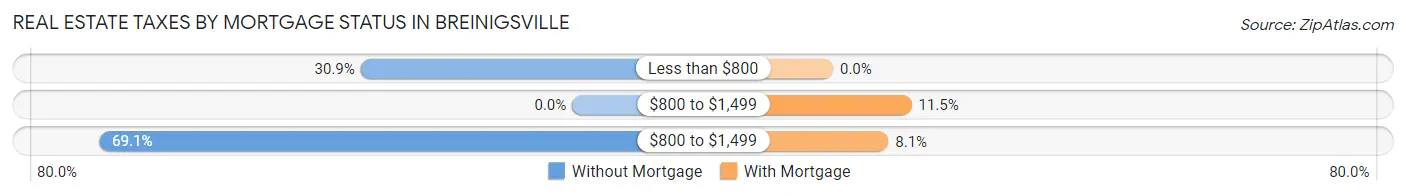
| Property Taxes | Without Mortgage | With Mortgage |
| Less than $800 | 212 (30.9%) | 0 (0.0%) |
| $800 to $1,499 | 0 (0.0%) | 213 (11.5%) |
| $800 to $1,499 | 474 (69.1%) | 150 (8.1%) |
| Total | 686 (100.0%) | 1,857 (100.0%) |
Health & Disability in Breinigsville
Health Insurance Coverage by Age in Breinigsville
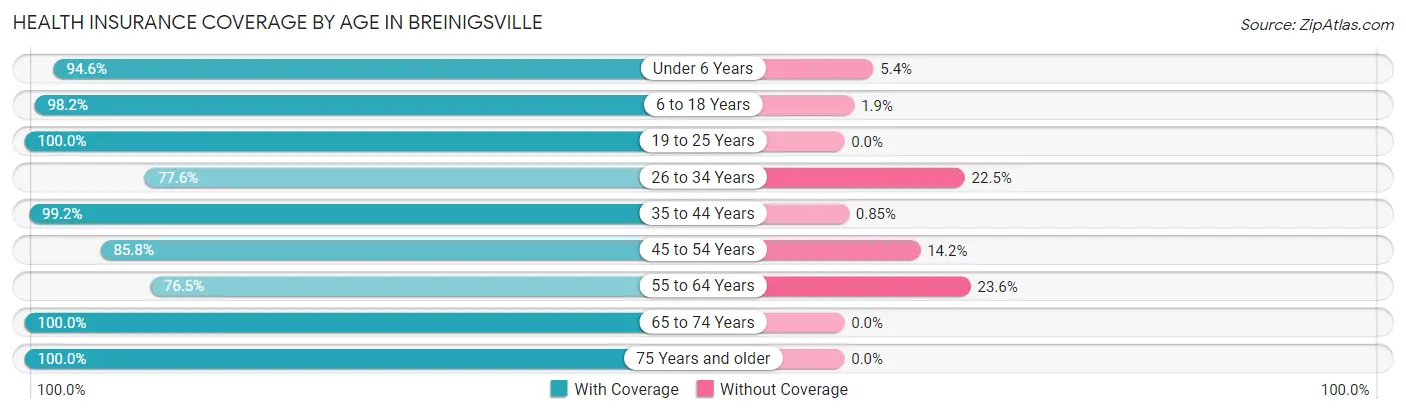
| Age Bracket | With Coverage | Without Coverage |
| Under 6 Years | 558 (94.6%) | 32 (5.4%) |
| 6 to 18 Years | 2,223 (98.2%) | 42 (1.8%) |
| 19 to 25 Years | 334 (100.0%) | 0 (0.0%) |
| 26 to 34 Years | 677 (77.5%) | 196 (22.5%) |
| 35 to 44 Years | 1,630 (99.2%) | 14 (0.9%) |
| 45 to 54 Years | 600 (85.8%) | 99 (14.2%) |
| 55 to 64 Years | 1,250 (76.4%) | 385 (23.5%) |
| 65 to 74 Years | 633 (100.0%) | 0 (0.0%) |
| 75 Years and older | 362 (100.0%) | 0 (0.0%) |
| Total | 8,267 (91.5%) | 768 (8.5%) |
Health Insurance Coverage by Citizenship Status in Breinigsville
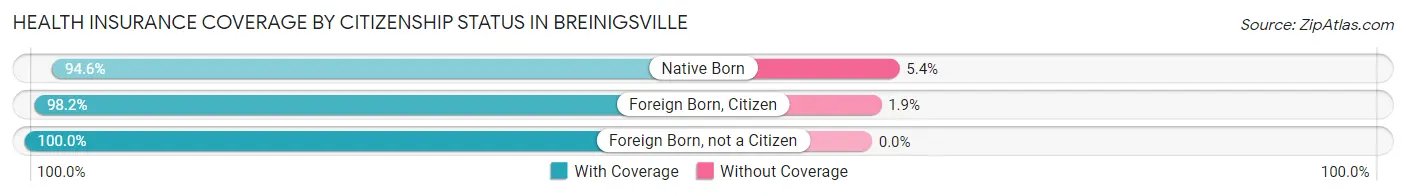
| Citizenship Status | With Coverage | Without Coverage |
| Native Born | 558 (94.6%) | 32 (5.4%) |
| Foreign Born, Citizen | 2,223 (98.2%) | 42 (1.8%) |
| Foreign Born, not a Citizen | 334 (100.0%) | 0 (0.0%) |
Health Insurance Coverage by Household Income in Breinigsville
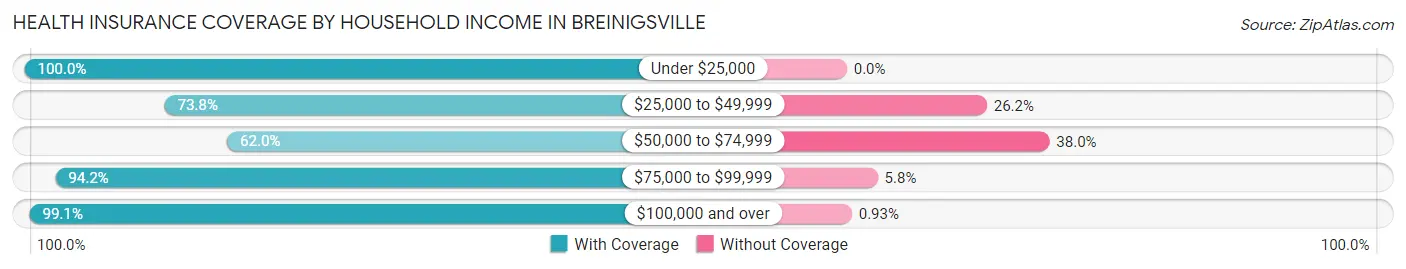
| Household Income | With Coverage | Without Coverage |
| Under $25,000 | 25 (100.0%) | 0 (0.0%) |
| $25,000 to $49,999 | 841 (73.8%) | 299 (26.2%) |
| $50,000 to $74,999 | 492 (62.0%) | 301 (38.0%) |
| $75,000 to $99,999 | 1,988 (94.2%) | 122 (5.8%) |
| $100,000 and over | 4,921 (99.1%) | 46 (0.9%) |
Public vs Private Health Insurance Coverage by Age in Breinigsville
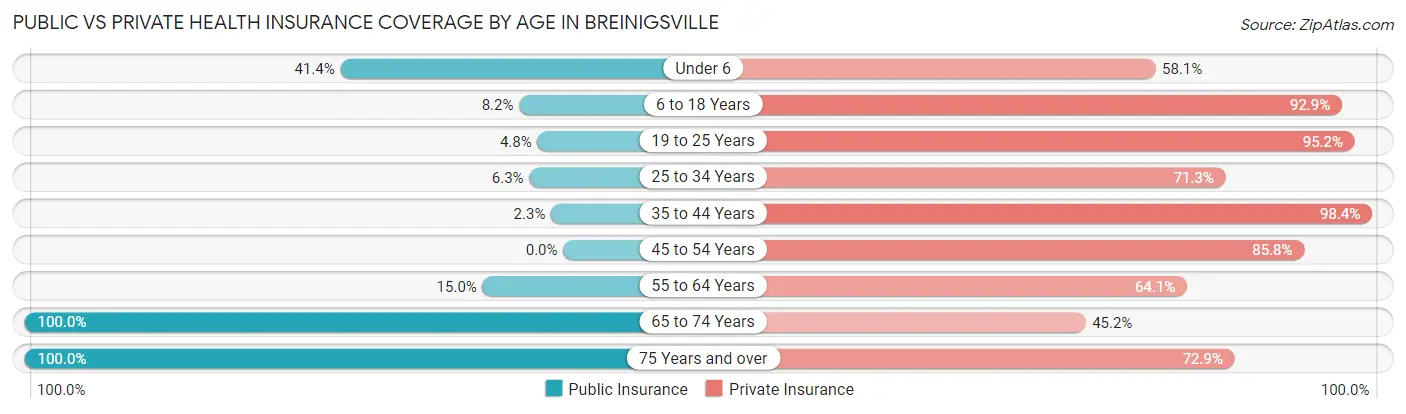
| Age Bracket | Public Insurance | Private Insurance |
| Under 6 | 244 (41.4%) | 343 (58.1%) |
| 6 to 18 Years | 185 (8.2%) | 2,103 (92.8%) |
| 19 to 25 Years | 16 (4.8%) | 318 (95.2%) |
| 25 to 34 Years | 55 (6.3%) | 622 (71.3%) |
| 35 to 44 Years | 37 (2.2%) | 1,618 (98.4%) |
| 45 to 54 Years | 0 (0.0%) | 600 (85.8%) |
| 55 to 64 Years | 245 (15.0%) | 1,048 (64.1%) |
| 65 to 74 Years | 633 (100.0%) | 286 (45.2%) |
| 75 Years and over | 362 (100.0%) | 264 (72.9%) |
| Total | 1,777 (19.7%) | 7,202 (79.7%) |
Disability Status by Sex by Age in Breinigsville
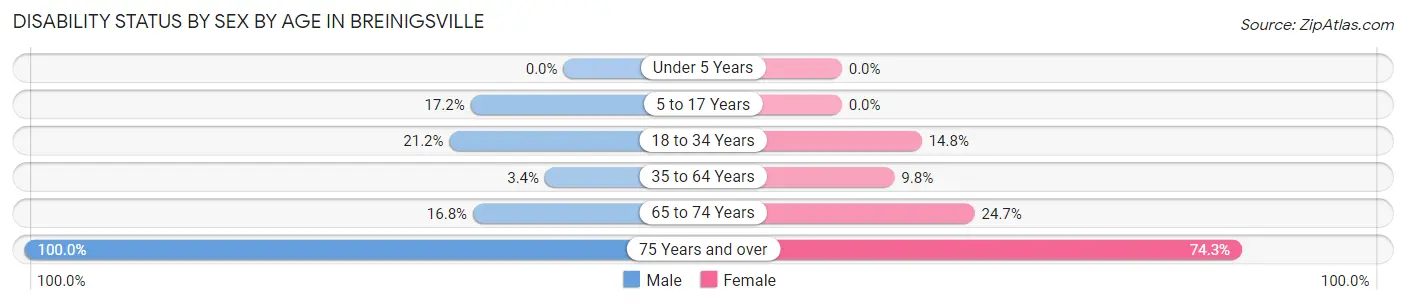
| Age Bracket | Male | Female |
| Under 5 Years | 0 (0.0%) | 0 (0.0%) |
| 5 to 17 Years | 120 (17.2%) | 0 (0.0%) |
| 18 to 34 Years | 120 (21.2%) | 95 (14.8%) |
| 35 to 64 Years | 68 (3.4%) | 195 (9.8%) |
| 65 to 74 Years | 47 (16.8%) | 87 (24.6%) |
| 75 Years and over | 20 (100.0%) | 254 (74.3%) |
Disability Class by Sex by Age in Breinigsville
Disability Class: Hearing Difficulty
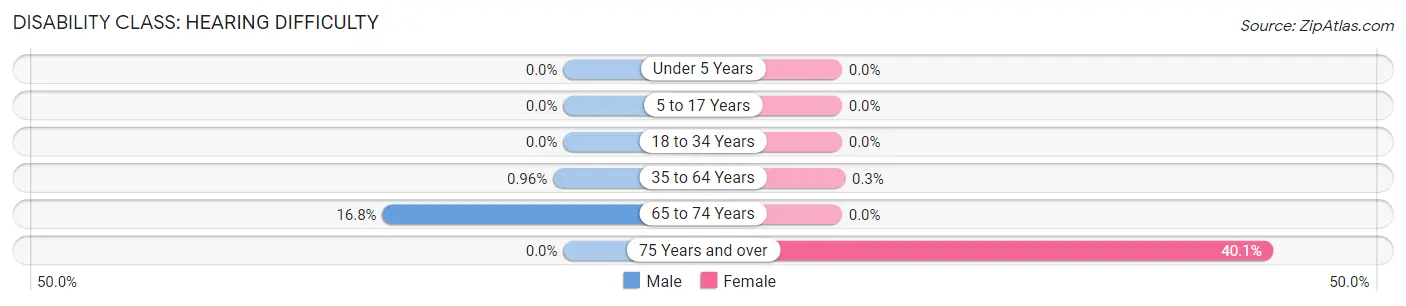
| Age Bracket | Male | Female |
| Under 5 Years | 0 (0.0%) | 0 (0.0%) |
| 5 to 17 Years | 0 (0.0%) | 0 (0.0%) |
| 18 to 34 Years | 0 (0.0%) | 0 (0.0%) |
| 35 to 64 Years | 19 (1.0%) | 6 (0.3%) |
| 65 to 74 Years | 47 (16.8%) | 0 (0.0%) |
| 75 Years and over | 0 (0.0%) | 137 (40.1%) |
Disability Class: Vision Difficulty
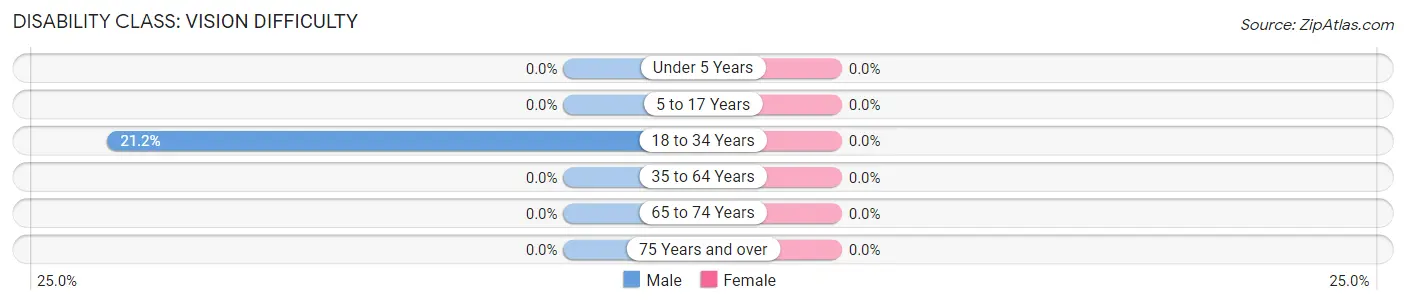
| Age Bracket | Male | Female |
| Under 5 Years | 0 (0.0%) | 0 (0.0%) |
| 5 to 17 Years | 0 (0.0%) | 0 (0.0%) |
| 18 to 34 Years | 120 (21.2%) | 0 (0.0%) |
| 35 to 64 Years | 0 (0.0%) | 0 (0.0%) |
| 65 to 74 Years | 0 (0.0%) | 0 (0.0%) |
| 75 Years and over | 0 (0.0%) | 0 (0.0%) |
Disability Class: Cognitive Difficulty
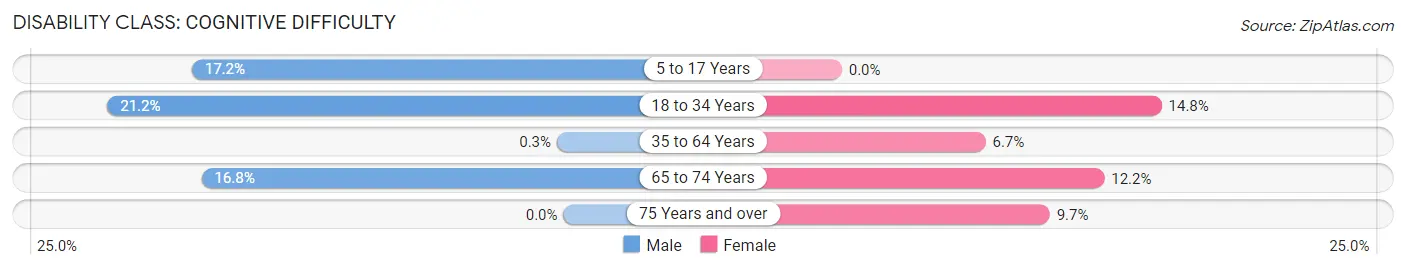
| Age Bracket | Male | Female |
| 5 to 17 Years | 120 (17.2%) | 0 (0.0%) |
| 18 to 34 Years | 120 (21.2%) | 95 (14.8%) |
| 35 to 64 Years | 6 (0.3%) | 133 (6.7%) |
| 65 to 74 Years | 47 (16.8%) | 43 (12.2%) |
| 75 Years and over | 0 (0.0%) | 33 (9.7%) |
Disability Class: Ambulatory Difficulty
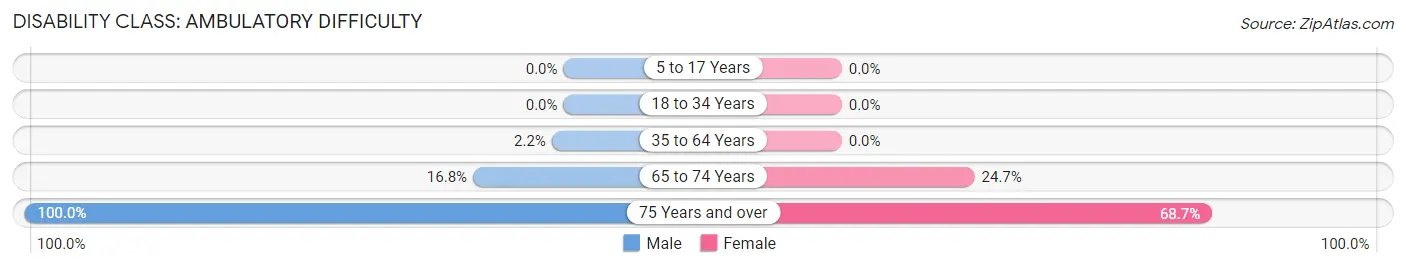
| Age Bracket | Male | Female |
| 5 to 17 Years | 0 (0.0%) | 0 (0.0%) |
| 18 to 34 Years | 0 (0.0%) | 0 (0.0%) |
| 35 to 64 Years | 43 (2.2%) | 0 (0.0%) |
| 65 to 74 Years | 47 (16.8%) | 87 (24.6%) |
| 75 Years and over | 20 (100.0%) | 235 (68.7%) |
Disability Class: Self-Care Difficulty
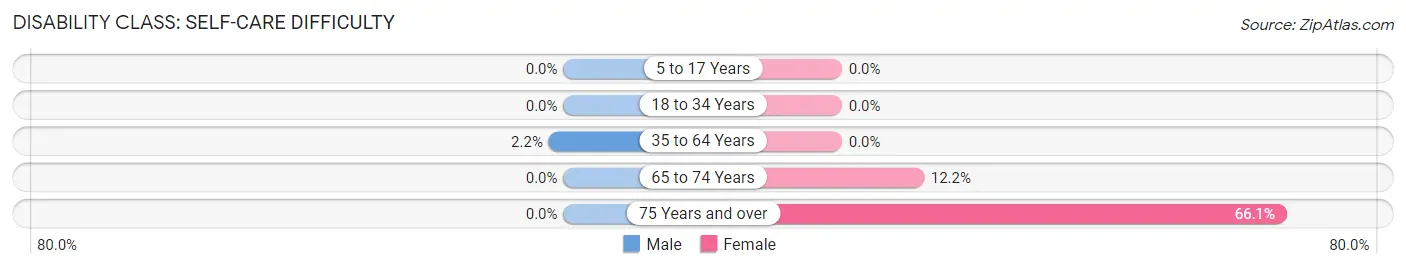
| Age Bracket | Male | Female |
| 5 to 17 Years | 0 (0.0%) | 0 (0.0%) |
| 18 to 34 Years | 0 (0.0%) | 0 (0.0%) |
| 35 to 64 Years | 43 (2.2%) | 0 (0.0%) |
| 65 to 74 Years | 0 (0.0%) | 43 (12.2%) |
| 75 Years and over | 0 (0.0%) | 226 (66.1%) |
Technology Access in Breinigsville
Computing Device Access in Breinigsville
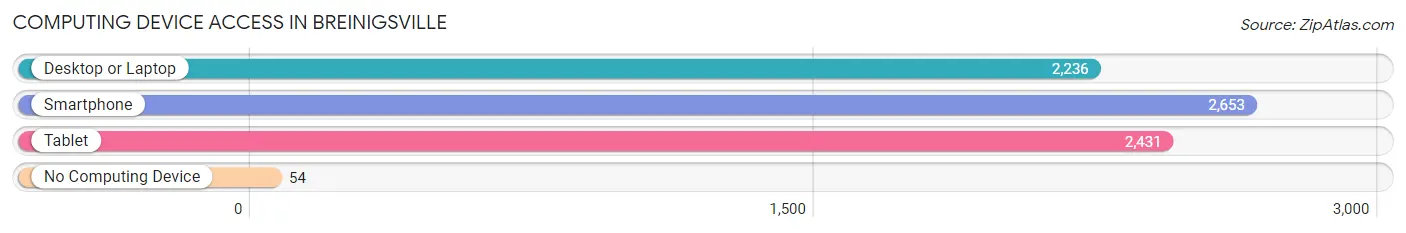
| Device Type | # Households | % Households |
| Desktop or Laptop | 2,236 | 77.1% |
| Smartphone | 2,653 | 91.5% |
| Tablet | 2,431 | 83.9% |
| No Computing Device | 54 | 1.9% |
| Total | 2,899 | 100.0% |
Internet Access in Breinigsville
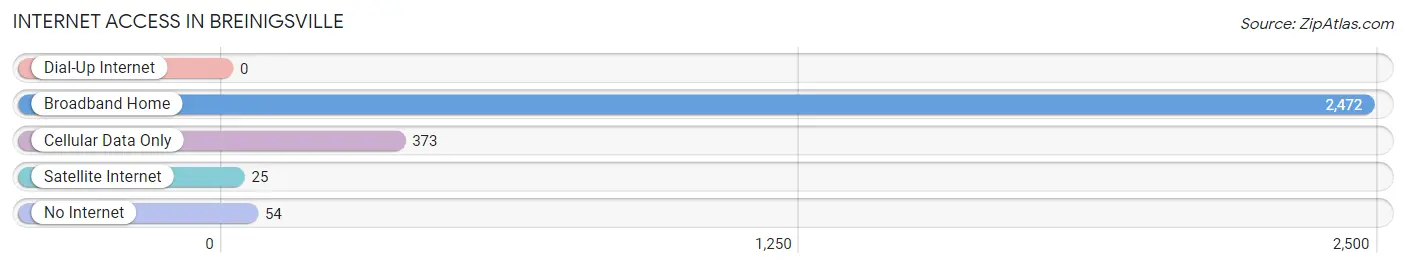
| Internet Type | # Households | % Households |
| Dial-Up Internet | 0 | 0.0% |
| Broadband Home | 2,472 | 85.3% |
| Cellular Data Only | 373 | 12.9% |
| Satellite Internet | 25 | 0.9% |
| No Internet | 54 | 1.9% |
| Total | 2,899 | 100.0% |
Breinigsville Summary
Breinigsville is a small borough located in Lehigh County, Pennsylvania. It is situated in the Lehigh Valley region of the state, approximately 10 miles northwest of Allentown. The borough was established in 1845 and is home to a population of approximately 3,000 people.
History
The area that is now Breinigsville was originally inhabited by the Lenape Native Americans. The first European settlers arrived in the area in the late 1700s and early 1800s. The area was originally known as “Brunnerville” and was part of North Whitehall Township. In 1845, the area was officially incorporated as the Borough of Breinigsville.
The name “Breinigsville” is derived from the Breinig family, who were among the first settlers in the area. The Breinig family owned a large tract of land in the area and operated a grist mill and a saw mill. The Breinig family also operated a general store and a post office.
Geography
Breinigsville is located in the Lehigh Valley region of Pennsylvania. It is situated in the foothills of the Appalachian Mountains and is approximately 10 miles northwest of Allentown. The borough is bordered by North Whitehall Township to the north, Upper Macungie Township to the east, Lower Macungie Township to the south, and South Whitehall Township to the west.
The borough covers an area of 1.2 square miles and is home to a population of approximately 3,000 people. The terrain of the area is mostly flat, with some rolling hills. The climate is humid continental, with hot summers and cold winters.
Economy
The economy of Breinigsville is largely based on agriculture and manufacturing. The borough is home to several farms, which produce a variety of crops, including corn, soybeans, wheat, and hay. The area is also home to several manufacturing companies, which produce a variety of products, including plastics, paper products, and metal products.
The borough is also home to several retail stores, restaurants, and other businesses. The largest employer in the area is the Lehigh Valley Health Network, which operates a hospital and several medical offices in the borough.
Demographics
As of the 2010 census, the population of Breinigsville was 3,068. The racial makeup of the borough was 94.3% White, 1.2% African American, 0.3% Native American, 1.2% Asian, 0.1% Pacific Islander, 1.2% from other races, and 1.9% from two or more races. Hispanic or Latino of any race were 3.3% of the population.
The median household income in Breinigsville was $60,938, and the median family income was $68,958. The per capita income was $25,945. About 4.3% of families and 5.3% of the population were below the poverty line, including 6.2% of those under age 18 and 4.2% of those age 65 or over.
Breinigsville is a small borough with a rich history and a diverse economy. The borough is home to a variety of businesses, farms, and manufacturing companies, and is a great place to live and work.
Common Questions
What is Per Capita Income in Breinigsville?
Per Capita income in Breinigsville is $56,530.
What is the Median Family Income in Breinigsville?
Median Family Income in Breinigsville is $130,020.
What is the Median Household income in Breinigsville?
Median Household Income in Breinigsville is $99,306.
What is Income or Wage Gap in Breinigsville?
Income or Wage Gap in Breinigsville is 43.5%.
Women in Breinigsville earn 56.5 cents for every dollar earned by a man.
What is Inequality or Gini Index in Breinigsville?
Inequality or Gini Index in Breinigsville is 0.48.
What is the Total Population of Breinigsville?
Total Population of Breinigsville is 9,035.
What is the Total Male Population of Breinigsville?
Total Male Population of Breinigsville is 4,000.
What is the Total Female Population of Breinigsville?
Total Female Population of Breinigsville is 5,035.
What is the Ratio of Males per 100 Females in Breinigsville?
There are 79.44 Males per 100 Females in Breinigsville.
What is the Ratio of Females per 100 Males in Breinigsville?
There are 125.88 Females per 100 Males in Breinigsville.
What is the Median Population Age in Breinigsville?
Median Population Age in Breinigsville is 38.4 Years.
What is the Average Family Size in Breinigsville
Average Family Size in Breinigsville is 3.4 People.
What is the Average Household Size in Breinigsville
Average Household Size in Breinigsville is 3.1 People.
How Large is the Labor Force in Breinigsville?
There are 4,336 People in the Labor Forcein in Breinigsville.
What is the Percentage of People in the Labor Force in Breinigsville?
67.8% of People are in the Labor Force in Breinigsville.
What is the Unemployment Rate in Breinigsville?
Unemployment Rate in Breinigsville is 4.8%.