Saw Creek, PA Map & Demographics
Saw Creek Map
Saw Creek Overview
$35,284
PER CAPITA INCOME
$73,558
AVG FAMILY INCOME
$67,331
AVG HOUSEHOLD INCOME
24.7%
WAGE / INCOME GAP [ % ]
75.3¢/ $1
WAGE / INCOME GAP [ $ ]
0.39
INEQUALITY / GINI INDEX
4,071
TOTAL POPULATION
2,101
MALE POPULATION
1,970
FEMALE POPULATION
106.65
MALES / 100 FEMALES
93.76
FEMALES / 100 MALES
46.2
MEDIAN AGE
3.1
AVG FAMILY SIZE
2.5
AVG HOUSEHOLD SIZE
2,206
LABOR FORCE [ PEOPLE ]
61.3%
PERCENT IN LABOR FORCE
12.4%
UNEMPLOYMENT RATE
Income in Saw Creek
Income Overview in Saw Creek
Per Capita Income in Saw Creek is $35,284, while median incomes of families and households are $73,558 and $67,331 respectively.
| Characteristic | Number | Measure |
| Per Capita Income | 4,071 | $35,284 |
| Median Family Income | 1,060 | $73,558 |
| Mean Family Income | 1,060 | $81,460 |
| Median Household Income | 1,603 | $67,331 |
| Mean Household Income | 1,603 | $77,849 |
| Income Deficit | 1,060 | $0 |
| Wage / Income Gap (%) | 4,071 | 24.69% |
| Wage / Income Gap ($) | 4,071 | 75.31¢ per $1 |
| Gini / Inequality Index | 4,071 | 0.39 |
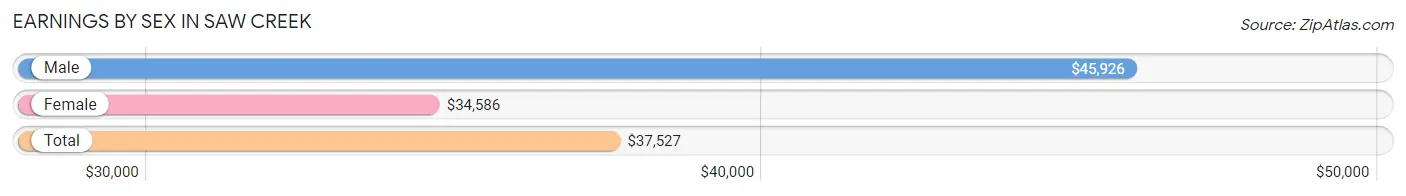
Earnings by Sex in Saw Creek
Average Earnings in Saw Creek are $37,527, $45,926 for men and $34,586 for women, a difference of 24.7%.
| Sex | Number | Average Earnings |
| Male | 1,112 (50.6%) | $45,926 |
| Female | 1,084 (49.4%) | $34,586 |
| Total | 2,196 (100.0%) | $37,527 |
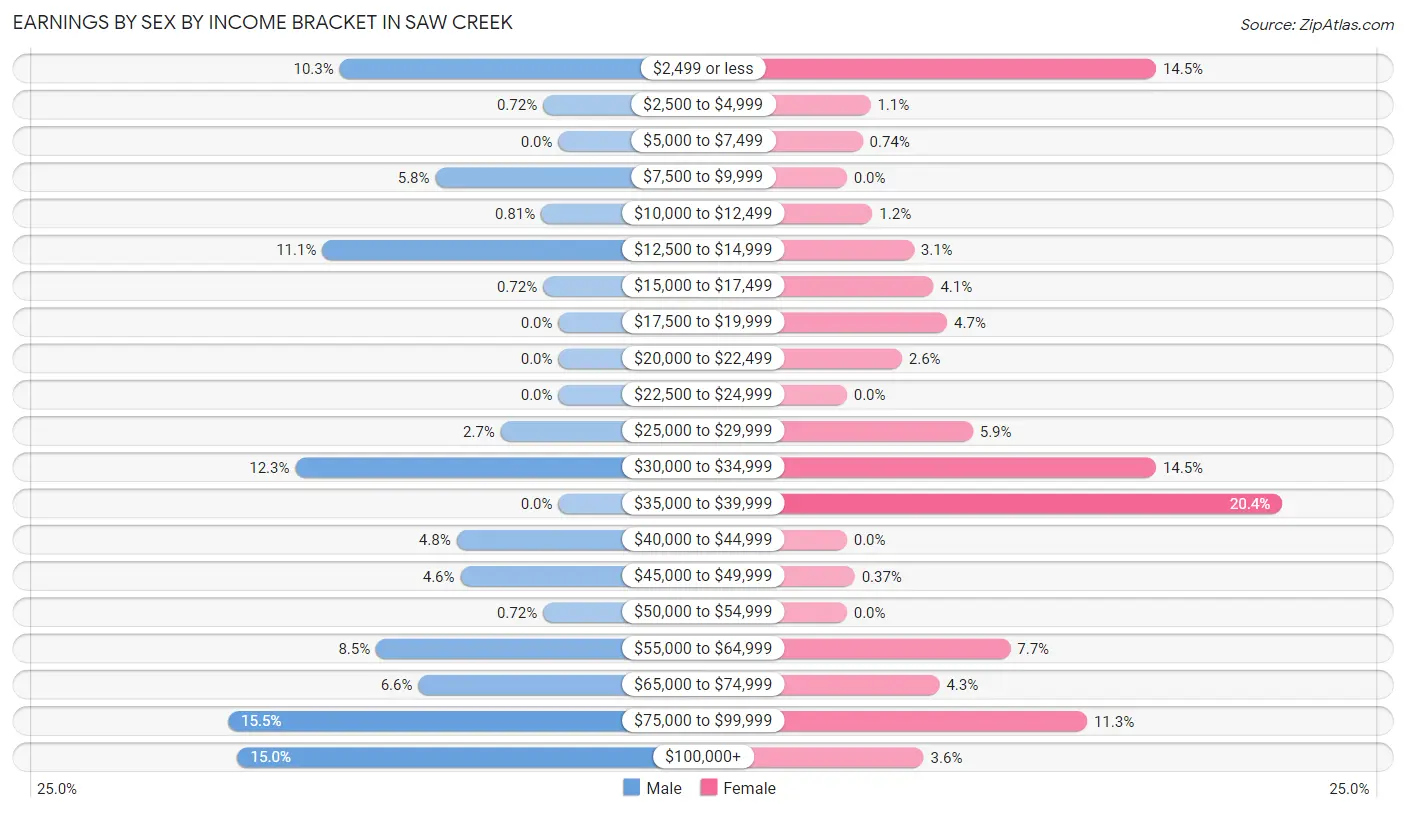
Earnings by Sex by Income Bracket in Saw Creek
The most common earnings brackets in Saw Creek are $75,000 to $99,999 for men (172 | 15.5%) and $35,000 to $39,999 for women (221 | 20.4%).
| Income | Male | Female |
| $2,499 or less | 114 (10.2%) | 157 (14.5%) |
| $2,500 to $4,999 | 8 (0.7%) | 12 (1.1%) |
| $5,000 to $7,499 | 0 (0.0%) | 8 (0.7%) |
| $7,500 to $9,999 | 64 (5.8%) | 0 (0.0%) |
| $10,000 to $12,499 | 9 (0.8%) | 13 (1.2%) |
| $12,500 to $14,999 | 123 (11.1%) | 34 (3.1%) |
| $15,000 to $17,499 | 8 (0.7%) | 44 (4.1%) |
| $17,500 to $19,999 | 0 (0.0%) | 51 (4.7%) |
| $20,000 to $22,499 | 0 (0.0%) | 28 (2.6%) |
| $22,500 to $24,999 | 0 (0.0%) | 0 (0.0%) |
| $25,000 to $29,999 | 30 (2.7%) | 64 (5.9%) |
| $30,000 to $34,999 | 137 (12.3%) | 157 (14.5%) |
| $35,000 to $39,999 | 0 (0.0%) | 221 (20.4%) |
| $40,000 to $44,999 | 53 (4.8%) | 0 (0.0%) |
| $45,000 to $49,999 | 51 (4.6%) | 4 (0.4%) |
| $50,000 to $54,999 | 8 (0.7%) | 0 (0.0%) |
| $55,000 to $64,999 | 95 (8.5%) | 83 (7.7%) |
| $65,000 to $74,999 | 73 (6.6%) | 47 (4.3%) |
| $75,000 to $99,999 | 172 (15.5%) | 122 (11.3%) |
| $100,000+ | 167 (15.0%) | 39 (3.6%) |
| Total | 1,112 (100.0%) | 1,084 (100.0%) |
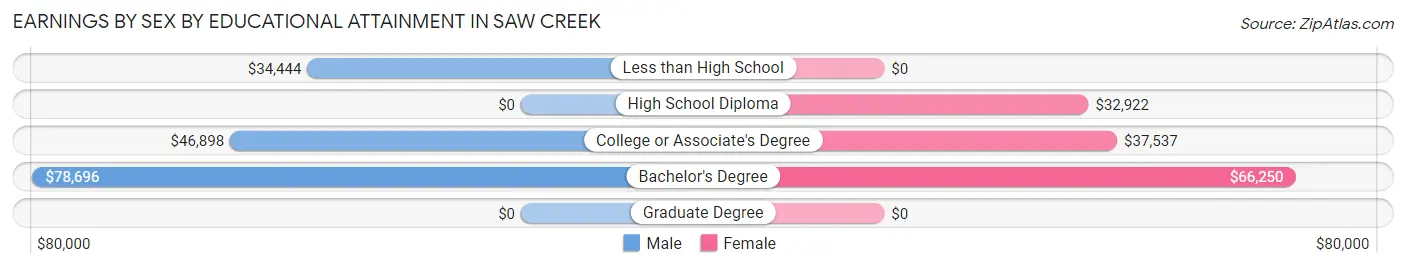
Earnings by Sex by Educational Attainment in Saw Creek
Average earnings in Saw Creek are $49,010 for men and $37,429 for women, a difference of 23.6%. Men with an educational attainment of bachelor's degree enjoy the highest average annual earnings of $78,696, while those with less than high school education earn the least with $34,444. Women with an educational attainment of bachelor's degree earn the most with the average annual earnings of $66,250, while those with high school diploma education have the smallest earnings of $32,922.
| Educational Attainment | Male Income | Female Income |
| Less than High School | $34,444 | $0 |
| High School Diploma | - | - |
| College or Associate's Degree | $46,898 | $37,537 |
| Bachelor's Degree | $78,696 | $66,250 |
| Graduate Degree | - | - |
| Total | $49,010 | $37,429 |
Family Income in Saw Creek
Family Income Brackets in Saw Creek
According to the Saw Creek family income data, there are 310 families falling into the $100,000 to $149,999 income range, which is the most common income bracket and makes up 29.2% of all families.
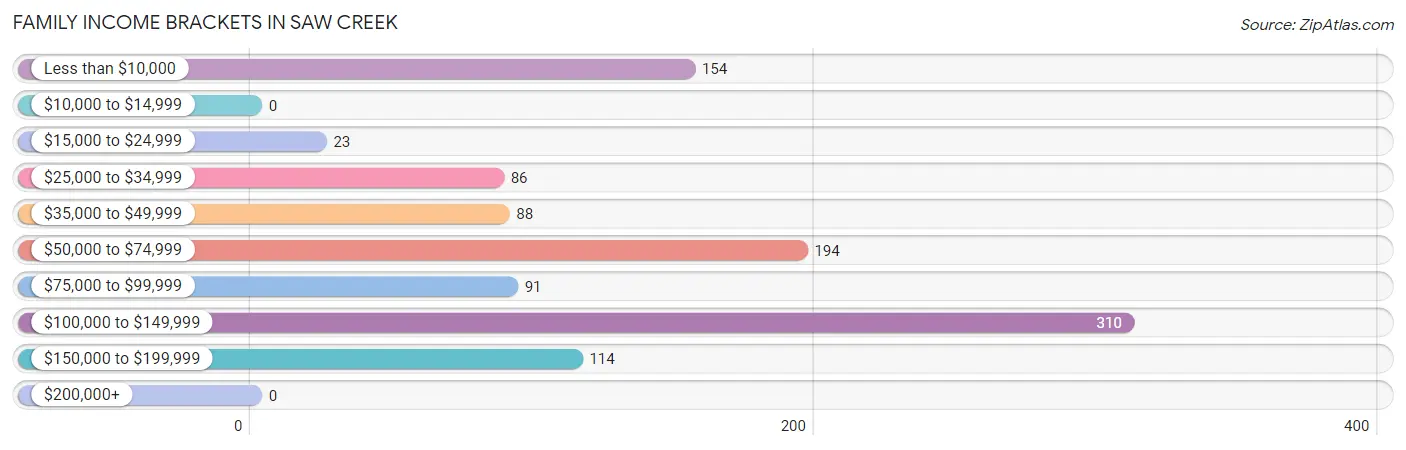
| Income Bracket | # Families | % Families |
| Less than $10,000 | 154 | 14.5% |
| $10,000 to $14,999 | 0 | 0.0% |
| $15,000 to $24,999 | 23 | 2.2% |
| $25,000 to $34,999 | 86 | 8.1% |
| $35,000 to $49,999 | 88 | 8.3% |
| $50,000 to $74,999 | 194 | 18.3% |
| $75,000 to $99,999 | 91 | 8.6% |
| $100,000 to $149,999 | 310 | 29.2% |
| $150,000 to $199,999 | 114 | 10.8% |
| $200,000+ | 0 | 0.0% |
Family Income by Famaliy Size in Saw Creek
4-person families (198 | 18.7%) account for the highest median family income in Saw Creek with $134,597 per family, while 4-person families (198 | 18.7%) have the highest median income of $33,649 per family member.
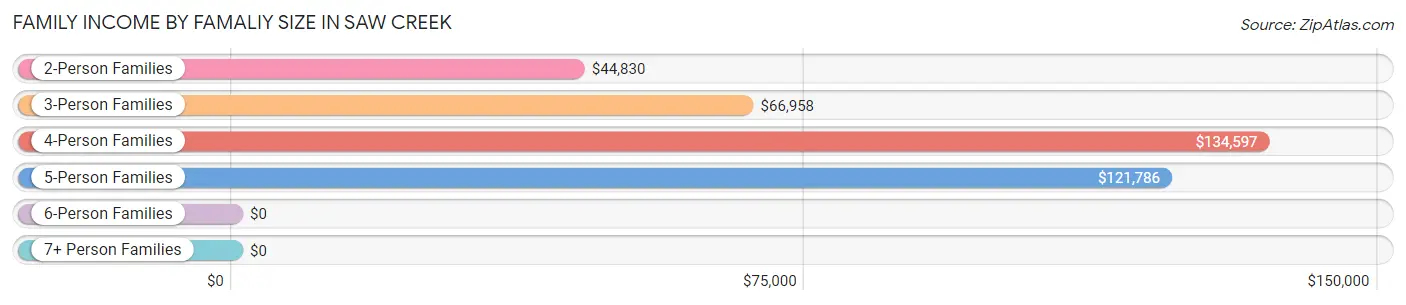
| Income Bracket | # Families | Median Income |
| 2-Person Families | 515 (48.6%) | $44,830 |
| 3-Person Families | 289 (27.3%) | $66,958 |
| 4-Person Families | 198 (18.7%) | $134,597 |
| 5-Person Families | 58 (5.5%) | $121,786 |
| 6-Person Families | 0 (0.0%) | $0 |
| 7+ Person Families | 0 (0.0%) | $0 |
| Total | 1,060 (100.0%) | $73,558 |
Family Income by Number of Earners in Saw Creek
The median family income in Saw Creek is $73,558, with families comprising 3+ earners (144) having the highest median family income of $122,407, while families with no earners (146) have the lowest median family income of $26,105, accounting for 13.6% and 13.8% of families, respectively.
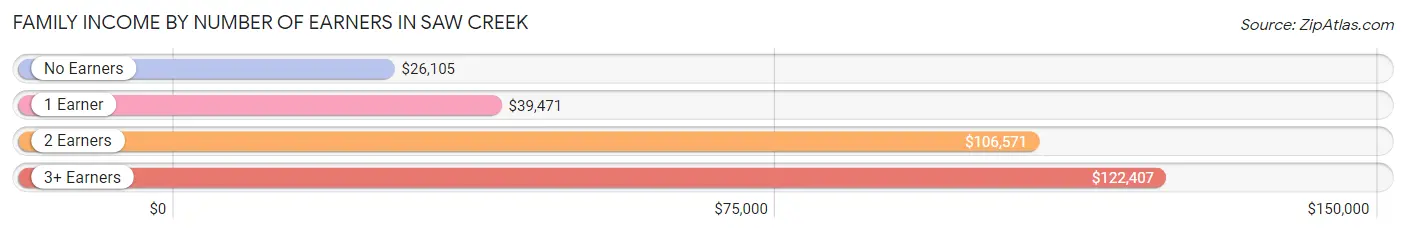
| Number of Earners | # Families | Median Income |
| No Earners | 146 (13.8%) | $26,105 |
| 1 Earner | 364 (34.3%) | $39,471 |
| 2 Earners | 406 (38.3%) | $106,571 |
| 3+ Earners | 144 (13.6%) | $122,407 |
| Total | 1,060 (100.0%) | $73,558 |
Household Income in Saw Creek
Household Income Brackets in Saw Creek
With 455 households falling in the category, the $100,000 to $149,999 income range is the most frequent in Saw Creek, accounting for 28.4% of all households. In contrast, only 13 households (0.8%) fall into the $200,000+ income bracket, making it the least populous group.
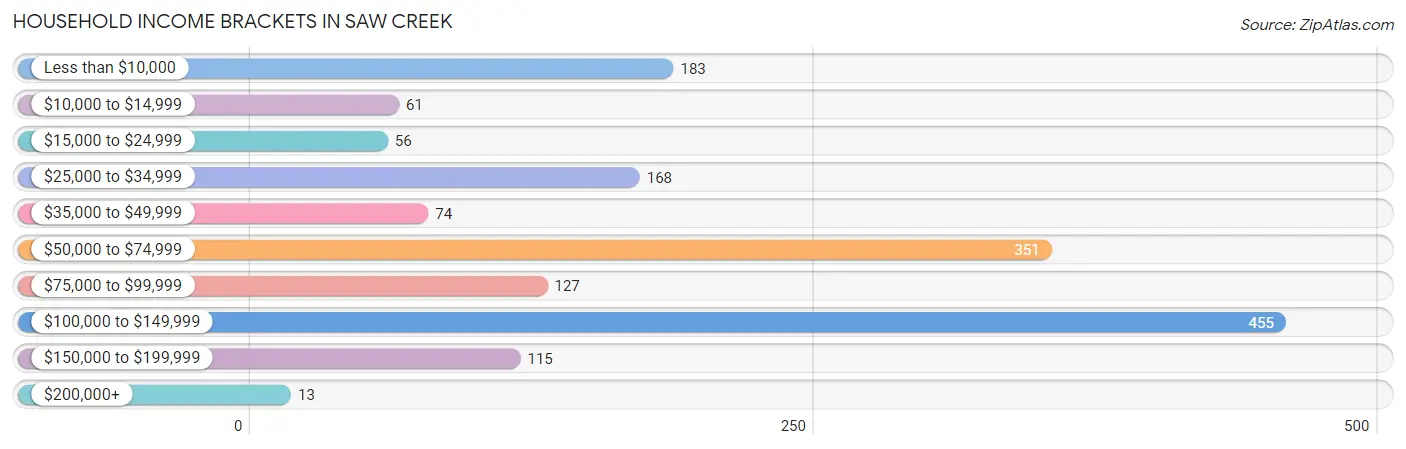
| Income Bracket | # Households | % Households |
| Less than $10,000 | 183 | 11.4% |
| $10,000 to $14,999 | 61 | 3.8% |
| $15,000 to $24,999 | 56 | 3.5% |
| $25,000 to $34,999 | 168 | 10.5% |
| $35,000 to $49,999 | 74 | 4.6% |
| $50,000 to $74,999 | 351 | 21.9% |
| $75,000 to $99,999 | 127 | 7.9% |
| $100,000 to $149,999 | 455 | 28.4% |
| $150,000 to $199,999 | 115 | 7.2% |
| $200,000+ | 13 | 0.8% |
Household Income by Householder Age in Saw Creek
The median household income in Saw Creek is $67,331, with the highest median household income of $82,083 found in the 45 to 64 years age bracket for the primary householder. A total of 929 households (58.0%) fall into this category.
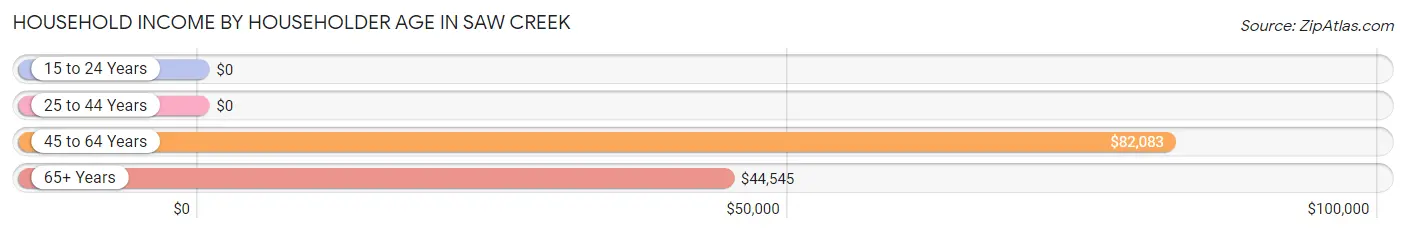
| Income Bracket | # Households | Median Income |
| 15 to 24 Years | 0 (0.0%) | $0 |
| 25 to 44 Years | 392 (24.4%) | $0 |
| 45 to 64 Years | 929 (58.0%) | $82,083 |
| 65+ Years | 282 (17.6%) | $44,545 |
| Total | 1,603 (100.0%) | $67,331 |
Poverty in Saw Creek
Income Below Poverty by Sex and Age in Saw Creek
With 12.9% poverty level for males and 15.5% for females among the residents of Saw Creek, 6 to 11 year old males and 18 to 24 year old females are the most vulnerable to poverty, with 28 males (53.8%) and 31 females (49.2%) in their respective age groups living below the poverty level.
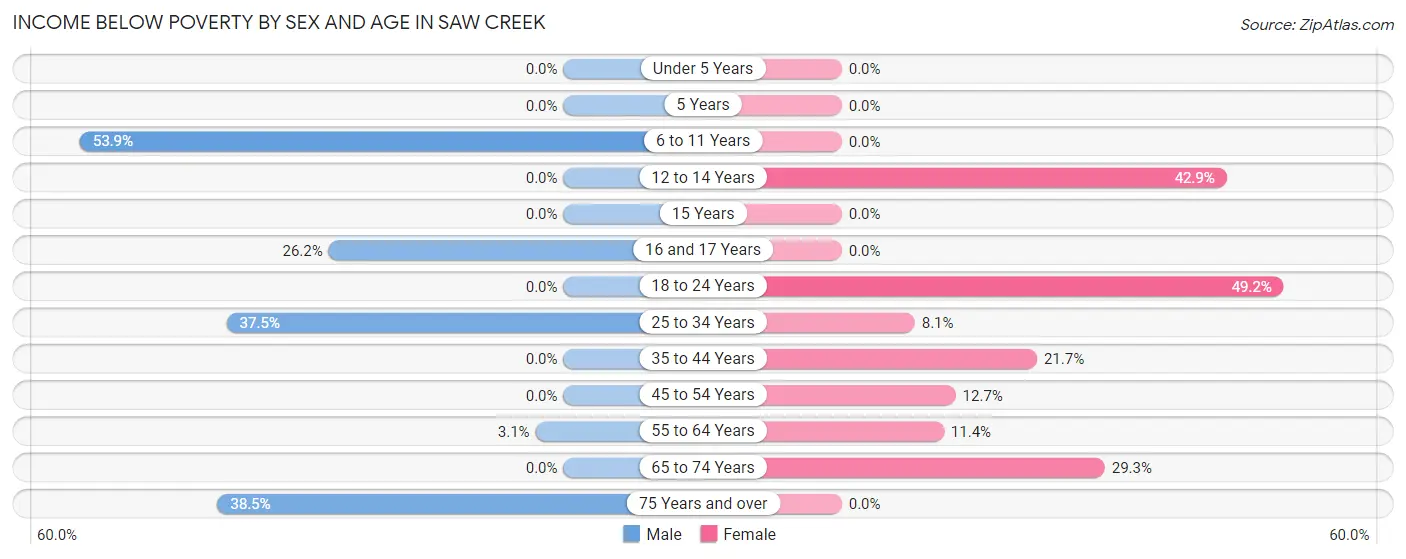
| Age Bracket | Male | Female |
| Under 5 Years | 0 (0.0%) | 0 (0.0%) |
| 5 Years | 0 (0.0%) | 0 (0.0%) |
| 6 to 11 Years | 28 (53.8%) | 0 (0.0%) |
| 12 to 14 Years | 0 (0.0%) | 42 (42.9%) |
| 15 Years | 0 (0.0%) | 0 (0.0%) |
| 16 and 17 Years | 68 (26.2%) | 0 (0.0%) |
| 18 to 24 Years | 0 (0.0%) | 31 (49.2%) |
| 25 to 34 Years | 111 (37.5%) | 27 (8.1%) |
| 35 to 44 Years | 0 (0.0%) | 65 (21.7%) |
| 45 to 54 Years | 0 (0.0%) | 43 (12.7%) |
| 55 to 64 Years | 22 (3.1%) | 39 (11.4%) |
| 65 to 74 Years | 0 (0.0%) | 58 (29.3%) |
| 75 Years and over | 42 (38.5%) | 0 (0.0%) |
| Total | 271 (12.9%) | 305 (15.5%) |
Income Above Poverty by Sex and Age in Saw Creek
According to the poverty statistics in Saw Creek, males aged under 5 years and females aged under 5 years are the age groups that are most secure financially, with 100.0% of males and 100.0% of females in these age groups living above the poverty line.
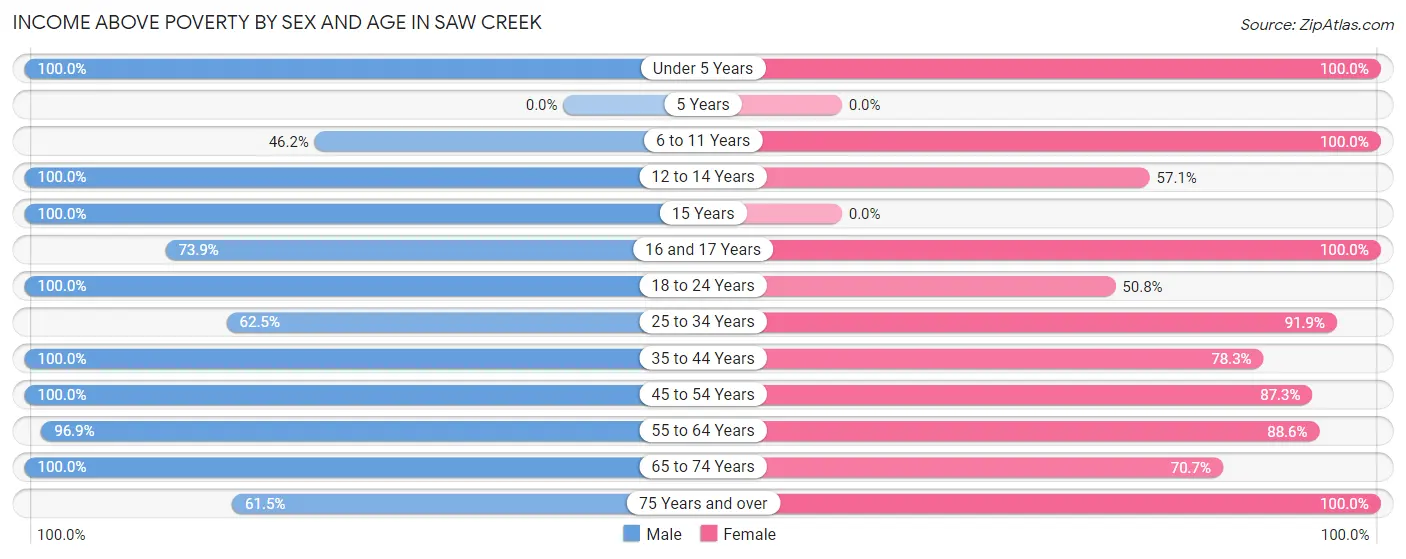
| Age Bracket | Male | Female |
| Under 5 Years | 68 (100.0%) | 79 (100.0%) |
| 5 Years | 0 (0.0%) | 0 (0.0%) |
| 6 to 11 Years | 24 (46.2%) | 50 (100.0%) |
| 12 to 14 Years | 48 (100.0%) | 56 (57.1%) |
| 15 Years | 78 (100.0%) | 0 (0.0%) |
| 16 and 17 Years | 192 (73.9%) | 110 (100.0%) |
| 18 to 24 Years | 33 (100.0%) | 32 (50.8%) |
| 25 to 34 Years | 185 (62.5%) | 305 (91.9%) |
| 35 to 44 Years | 130 (100.0%) | 234 (78.3%) |
| 45 to 54 Years | 186 (100.0%) | 296 (87.3%) |
| 55 to 64 Years | 686 (96.9%) | 304 (88.6%) |
| 65 to 74 Years | 133 (100.0%) | 140 (70.7%) |
| 75 Years and over | 67 (61.5%) | 59 (100.0%) |
| Total | 1,830 (87.1%) | 1,665 (84.5%) |
Income Below Poverty Among Married-Couple Families in Saw Creek
The poverty statistics for married-couple families in Saw Creek show that 4.0% or 31 of the total 776 families live below the poverty line. Families with no children have the highest poverty rate of 8.1%, comprising of 31 families. On the other hand, families with 1 or 2 children have the lowest poverty rate of 0.0%, which includes 0 families.
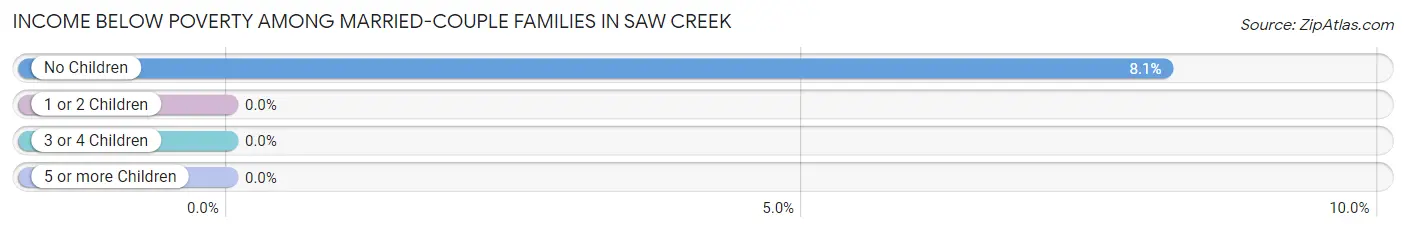
| Children | Above Poverty | Below Poverty |
| No Children | 350 (91.9%) | 31 (8.1%) |
| 1 or 2 Children | 361 (100.0%) | 0 (0.0%) |
| 3 or 4 Children | 34 (100.0%) | 0 (0.0%) |
| 5 or more Children | 0 (0.0%) | 0 (0.0%) |
| Total | 745 (96.0%) | 31 (4.0%) |
Income Below Poverty Among Single-Parent Households in Saw Creek
According to the poverty data in Saw Creek, 84.8% or 50 single-father households and 32.4% or 73 single-mother households are living below the poverty line. Among single-father households, those with 1 or 2 children have the highest poverty rate, with 50 households (100.0%) experiencing poverty. Likewise, among single-mother households, those with 1 or 2 children have the highest poverty rate, with 73 households (35.8%) falling below the poverty line.
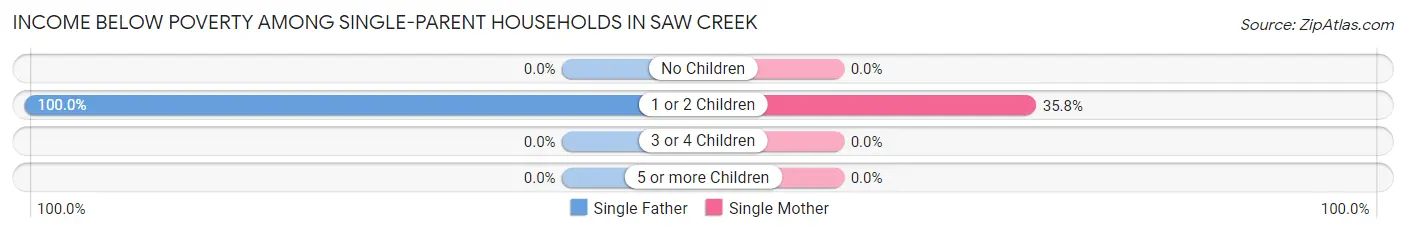
| Children | Single Father | Single Mother |
| No Children | 0 (0.0%) | 0 (0.0%) |
| 1 or 2 Children | 50 (100.0%) | 73 (35.8%) |
| 3 or 4 Children | 0 (0.0%) | 0 (0.0%) |
| 5 or more Children | 0 (0.0%) | 0 (0.0%) |
| Total | 50 (84.8%) | 73 (32.4%) |
Income Below Poverty Among Married-Couple vs Single-Parent Households in Saw Creek
The poverty data for Saw Creek shows that 31 of the married-couple family households (4.0%) and 123 of the single-parent households (43.3%) are living below the poverty level. Within the married-couple family households, those with no children have the highest poverty rate, with 31 households (8.1%) falling below the poverty line. Among the single-parent households, those with 1 or 2 children have the highest poverty rate, with 123 household (48.4%) living below poverty.
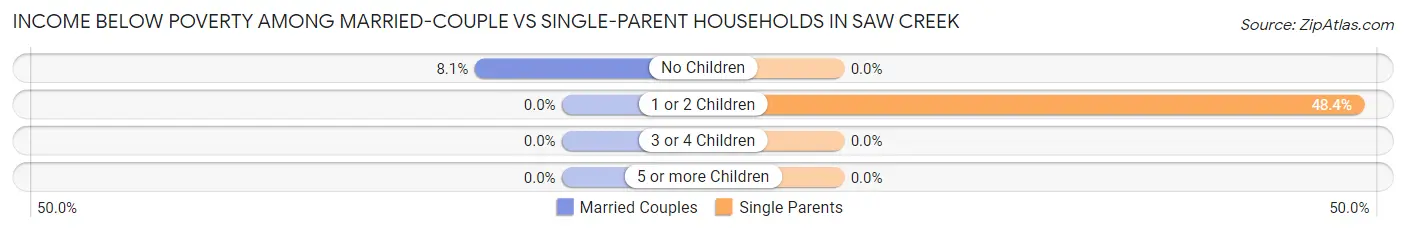
| Children | Married-Couple Families | Single-Parent Households |
| No Children | 31 (8.1%) | 0 (0.0%) |
| 1 or 2 Children | 0 (0.0%) | 123 (48.4%) |
| 3 or 4 Children | 0 (0.0%) | 0 (0.0%) |
| 5 or more Children | 0 (0.0%) | 0 (0.0%) |
| Total | 31 (4.0%) | 123 (43.3%) |
Race in Saw Creek
The most populous races in Saw Creek are White / Caucasian (2,202 | 54.1%), Hispanic or Latino (1,314 | 32.3%), and Black / African American (849 | 20.8%).
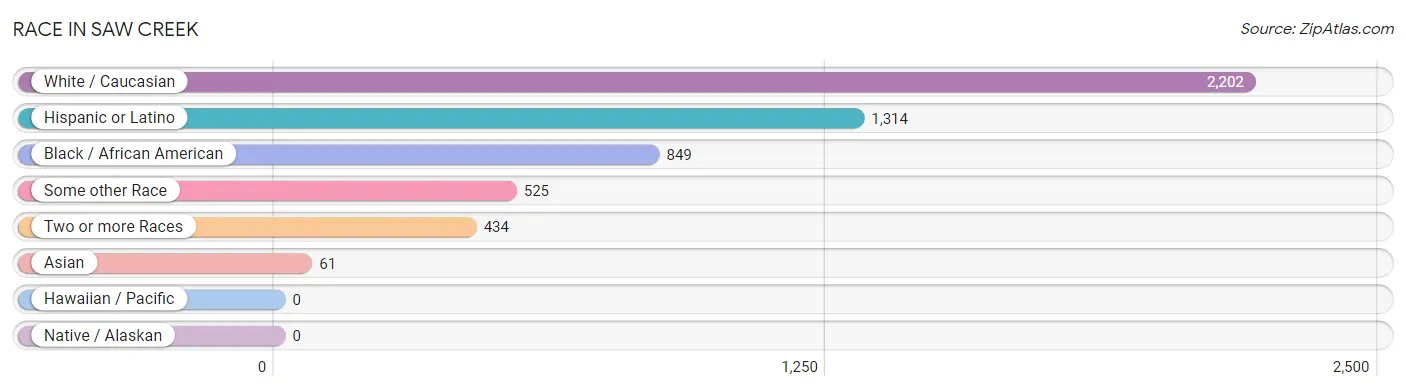
| Race | # Population | % Population |
| Asian | 61 | 1.5% |
| Black / African American | 849 | 20.8% |
| Hawaiian / Pacific | 0 | 0.0% |
| Hispanic or Latino | 1,314 | 32.3% |
| Native / Alaskan | 0 | 0.0% |
| White / Caucasian | 2,202 | 54.1% |
| Two or more Races | 434 | 10.7% |
| Some other Race | 525 | 12.9% |
| Total | 4,071 | 100.0% |
Ancestry in Saw Creek
The most populous ancestries reported in Saw Creek are Dominican (479 | 11.8%), Irish (409 | 10.1%), German (393 | 9.7%), Puerto Rican (383 | 9.4%), and Italian (317 | 7.8%), together accounting for 48.7% of all Saw Creek residents.
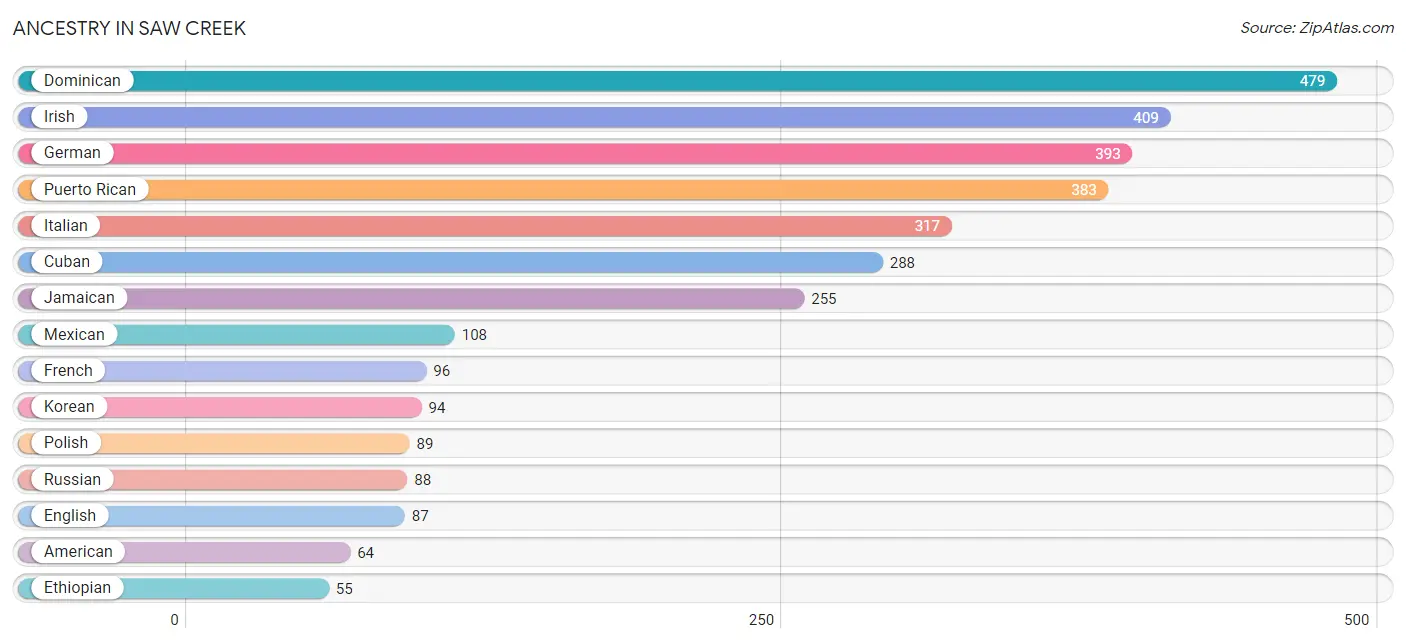
| Ancestry | # Population | % Population |
| American | 64 | 1.6% |
| Blackfeet | 17 | 0.4% |
| Brazilian | 12 | 0.3% |
| Central American | 39 | 1.0% |
| Cuban | 288 | 7.1% |
| Dominican | 479 | 11.8% |
| English | 87 | 2.1% |
| Ethiopian | 55 | 1.3% |
| French | 96 | 2.4% |
| German | 393 | 9.7% |
| Irish | 409 | 10.1% |
| Iroquois | 9 | 0.2% |
| Italian | 317 | 7.8% |
| Jamaican | 255 | 6.3% |
| Korean | 94 | 2.3% |
| Laotian | 52 | 1.3% |
| Lithuanian | 14 | 0.3% |
| Mexican | 108 | 2.6% |
| Peruvian | 17 | 0.4% |
| Polish | 89 | 2.2% |
| Portuguese | 15 | 0.4% |
| Puerto Rican | 383 | 9.4% |
| Russian | 88 | 2.2% |
| Salvadoran | 39 | 1.0% |
| South American | 17 | 0.4% |
| Subsaharan African | 55 | 1.3% |
| Swedish | 40 | 1.0% |
| Thai | 53 | 1.3% |
| Welsh | 22 | 0.5% | View All 29 Rows |
Immigrants in Saw Creek
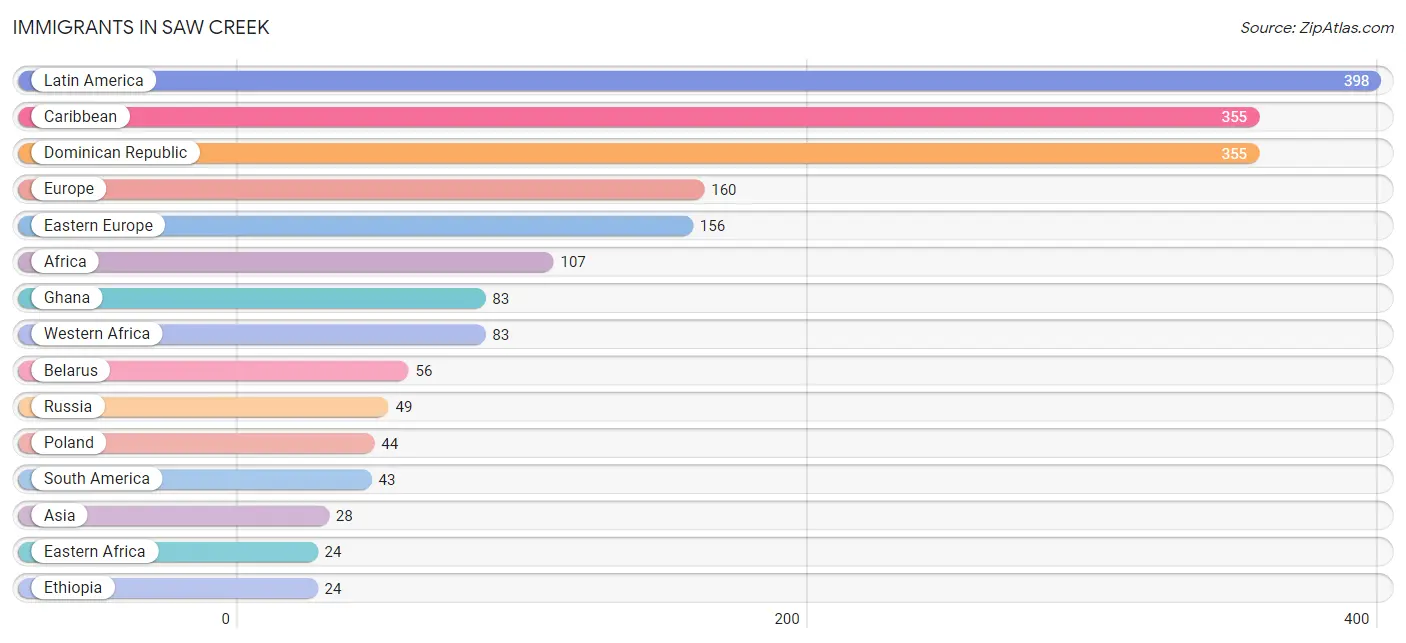
The most numerous immigrant groups reported in Saw Creek came from Latin America (398 | 9.8%), Caribbean (355 | 8.7%), Dominican Republic (355 | 8.7%), Europe (160 | 3.9%), and Eastern Europe (156 | 3.8%), together accounting for 35.0% of all Saw Creek residents.
| Immigration Origin | # Population | % Population |
| Africa | 107 | 2.6% |
| Asia | 28 | 0.7% |
| Belarus | 56 | 1.4% |
| Caribbean | 355 | 8.7% |
| China | 9 | 0.2% |
| Dominican Republic | 355 | 8.7% |
| Eastern Africa | 24 | 0.6% |
| Eastern Asia | 9 | 0.2% |
| Eastern Europe | 156 | 3.8% |
| Ethiopia | 24 | 0.6% |
| Europe | 160 | 3.9% |
| Ghana | 83 | 2.0% |
| Guyana | 19 | 0.5% |
| Latin America | 398 | 9.8% |
| Lithuania | 7 | 0.2% |
| Northern Europe | 4 | 0.1% |
| Peru | 10 | 0.3% |
| Philippines | 12 | 0.3% |
| Poland | 44 | 1.1% |
| Russia | 49 | 1.2% |
| South America | 43 | 1.1% |
| South Central Asia | 7 | 0.2% |
| South Eastern Asia | 12 | 0.3% |
| Western Africa | 83 | 2.0% | View All 24 Rows |
Sex and Age in Saw Creek
Sex and Age in Saw Creek
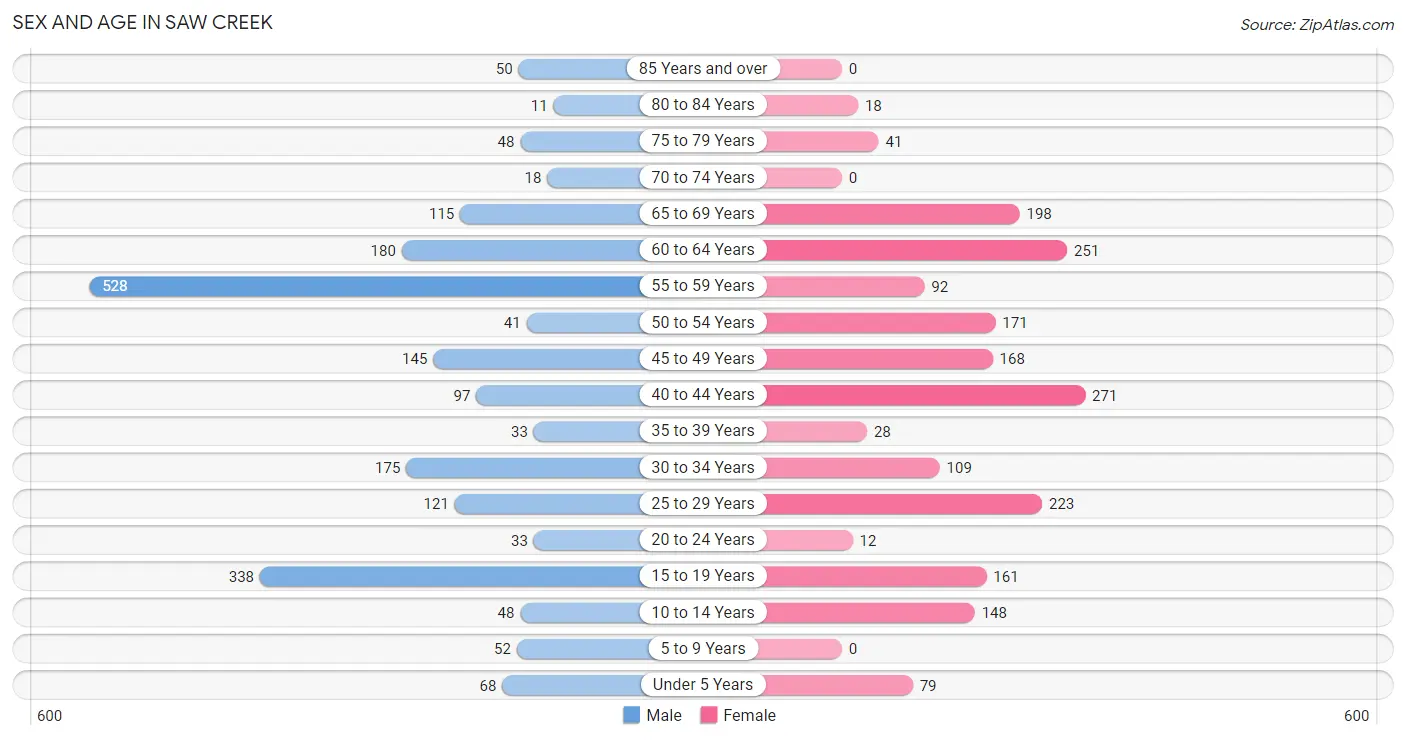
The most populous age groups in Saw Creek are 55 to 59 Years (528 | 25.1%) for men and 40 to 44 Years (271 | 13.8%) for women.
| Age Bracket | Male | Female |
| Under 5 Years | 68 (3.2%) | 79 (4.0%) |
| 5 to 9 Years | 52 (2.5%) | 0 (0.0%) |
| 10 to 14 Years | 48 (2.3%) | 148 (7.5%) |
| 15 to 19 Years | 338 (16.1%) | 161 (8.2%) |
| 20 to 24 Years | 33 (1.6%) | 12 (0.6%) |
| 25 to 29 Years | 121 (5.8%) | 223 (11.3%) |
| 30 to 34 Years | 175 (8.3%) | 109 (5.5%) |
| 35 to 39 Years | 33 (1.6%) | 28 (1.4%) |
| 40 to 44 Years | 97 (4.6%) | 271 (13.8%) |
| 45 to 49 Years | 145 (6.9%) | 168 (8.5%) |
| 50 to 54 Years | 41 (1.9%) | 171 (8.7%) |
| 55 to 59 Years | 528 (25.1%) | 92 (4.7%) |
| 60 to 64 Years | 180 (8.6%) | 251 (12.7%) |
| 65 to 69 Years | 115 (5.5%) | 198 (10.1%) |
| 70 to 74 Years | 18 (0.9%) | 0 (0.0%) |
| 75 to 79 Years | 48 (2.3%) | 41 (2.1%) |
| 80 to 84 Years | 11 (0.5%) | 18 (0.9%) |
| 85 Years and over | 50 (2.4%) | 0 (0.0%) |
| Total | 2,101 (100.0%) | 1,970 (100.0%) |
Families and Households in Saw Creek
Median Family Size in Saw Creek
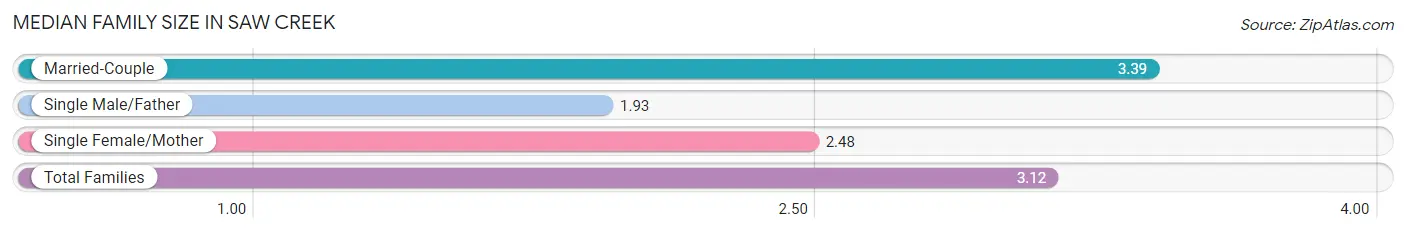
The median family size in Saw Creek is 3.12 persons per family, with married-couple families (776 | 73.2%) accounting for the largest median family size of 3.39 persons per family. On the other hand, single male/father families (59 | 5.6%) represent the smallest median family size with 1.93 persons per family.
| Family Type | # Families | Family Size |
| Married-Couple | 776 (73.2%) | 3.39 |
| Single Male/Father | 59 (5.6%) | 1.93 |
| Single Female/Mother | 225 (21.2%) | 2.48 |
| Total Families | 1,060 (100.0%) | 3.12 |
Median Household Size in Saw Creek
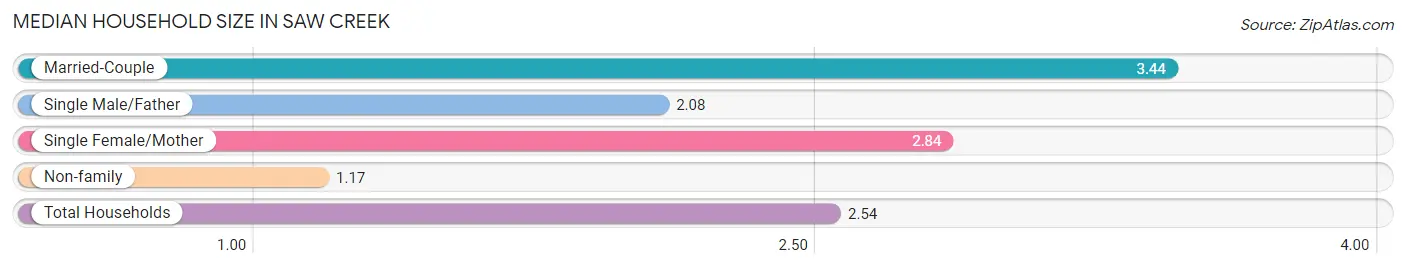
The median household size in Saw Creek is 2.54 persons per household, with married-couple households (776 | 48.4%) accounting for the largest median household size of 3.44 persons per household. non-family households (543 | 33.9%) represent the smallest median household size with 1.17 persons per household.
| Household Type | # Households | Household Size |
| Married-Couple | 776 (48.4%) | 3.44 |
| Single Male/Father | 59 (3.7%) | 2.08 |
| Single Female/Mother | 225 (14.0%) | 2.84 |
| Non-family | 543 (33.9%) | 1.17 |
| Total Households | 1,603 (100.0%) | 2.54 |
Household Size by Marriage Status in Saw Creek
Out of a total of 1,603 households in Saw Creek, 1,060 (66.1%) are family households, while 543 (33.9%) are nonfamily households. The most numerous type of family households are 2-person households, comprising 430, and the most common type of nonfamily households are 1-person households, comprising 454.
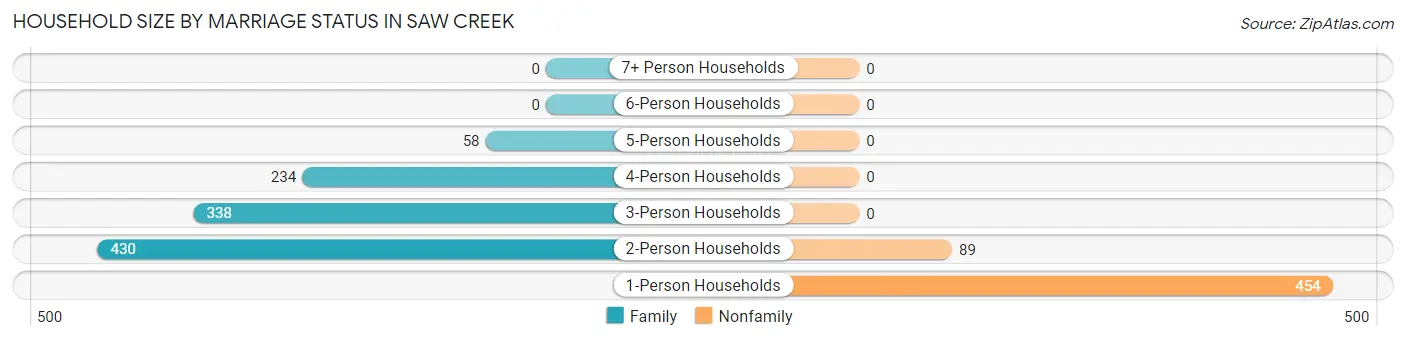
| Household Size | Family Households | Nonfamily Households |
| 1-Person Households | - | 454 (28.3%) |
| 2-Person Households | 430 (26.8%) | 89 (5.6%) |
| 3-Person Households | 338 (21.1%) | 0 (0.0%) |
| 4-Person Households | 234 (14.6%) | 0 (0.0%) |
| 5-Person Households | 58 (3.6%) | 0 (0.0%) |
| 6-Person Households | 0 (0.0%) | 0 (0.0%) |
| 7+ Person Households | 0 (0.0%) | 0 (0.0%) |
| Total | 1,060 (66.1%) | 543 (33.9%) |
Female Fertility in Saw Creek
Fertility by Age in Saw Creek
Average fertility rate in Saw Creek is 32.0 births per 1,000 women. Women in the age bracket of 20 to 34 years have the highest fertility rate with 90.0 births per 1,000 women. Women in the age bracket of 20 to 34 years acount for 100.0% of all women with births.
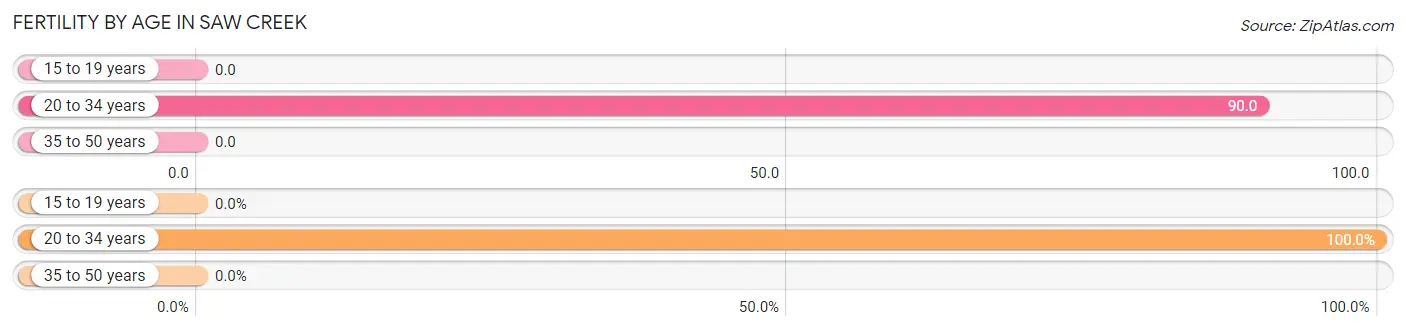
| Age Bracket | Women with Births | Births / 1,000 Women |
| 15 to 19 years | 0 (0.0%) | 0.0 |
| 20 to 34 years | 31 (100.0%) | 90.0 |
| 35 to 50 years | 0 (0.0%) | 0.0 |
| Total | 31 (100.0%) | 32.0 |
Fertility by Age by Marriage Status in Saw Creek
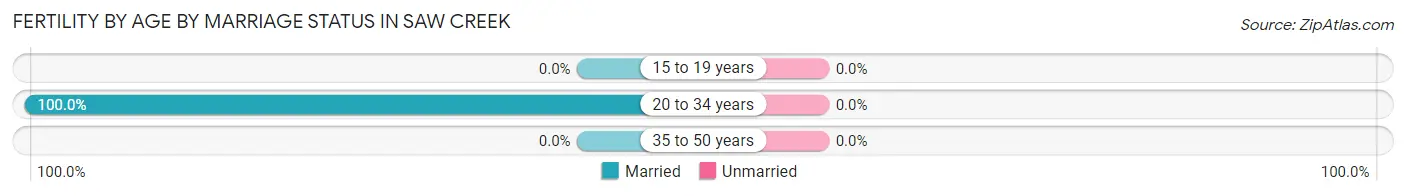
| Age Bracket | Married | Unmarried |
| 15 to 19 years | 0 (0.0%) | 0 (0.0%) |
| 20 to 34 years | 31 (100.0%) | 0 (0.0%) |
| 35 to 50 years | 0 (0.0%) | 0 (0.0%) |
| Total | 31 (100.0%) | 0 (0.0%) |
Fertility by Education in Saw Creek
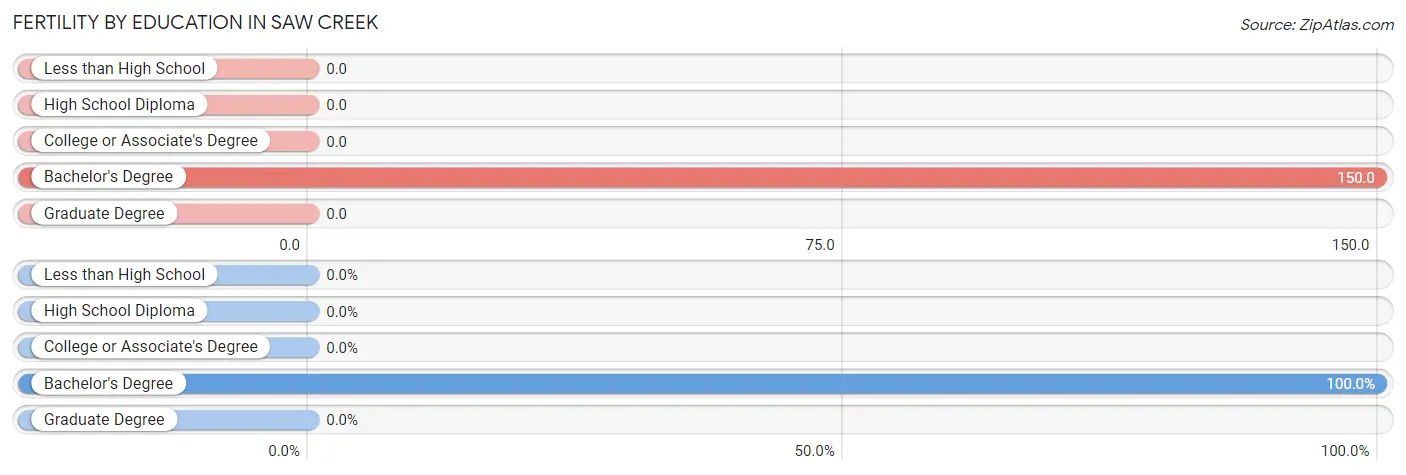
| Educational Attainment | Women with Births | Births / 1,000 Women |
| Less than High School | 0 (0.0%) | 0.0 |
| High School Diploma | 0 (0.0%) | 0.0 |
| College or Associate's Degree | 0 (0.0%) | 0.0 |
| Bachelor's Degree | 31 (100.0%) | 150.0 |
| Graduate Degree | 0 (0.0%) | 0.0 |
| Total | 31 (100.0%) | 32.0 |
Fertility by Education by Marriage Status in Saw Creek
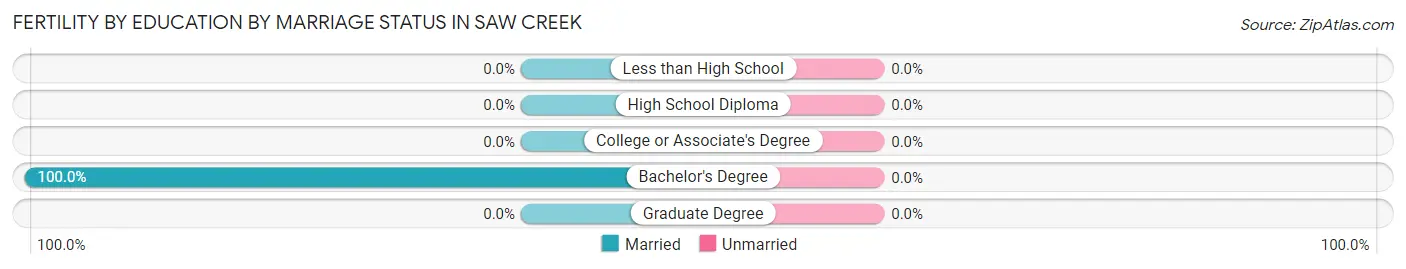
| Educational Attainment | Married | Unmarried |
| Less than High School | 0 (0.0%) | 0 (0.0%) |
| High School Diploma | 0 (0.0%) | 0 (0.0%) |
| College or Associate's Degree | 0 (0.0%) | 0 (0.0%) |
| Bachelor's Degree | 31 (100.0%) | 0 (0.0%) |
| Graduate Degree | 0 (0.0%) | 0 (0.0%) |
| Total | 31 (100.0%) | 0 (0.0%) |
Employment Characteristics in Saw Creek
Employment by Class of Employer in Saw Creek
Among the 1,908 employed individuals in Saw Creek, private company employees (1,266 | 66.3%), local government employees (202 | 10.6%), and not-for-profit organizations (168 | 8.8%) make up the most common classes of employment.
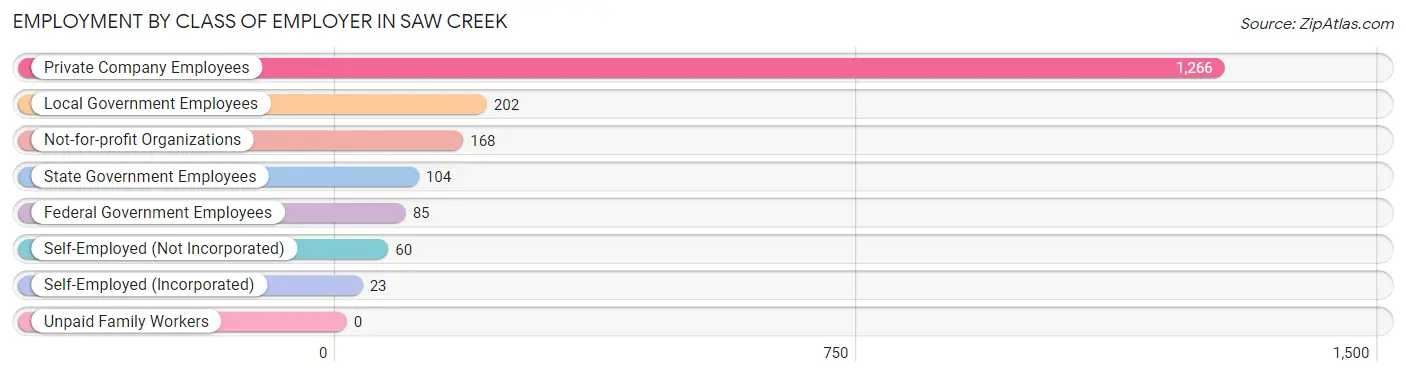
| Employer Class | # Employees | % Employees |
| Private Company Employees | 1,266 | 66.3% |
| Self-Employed (Incorporated) | 23 | 1.2% |
| Self-Employed (Not Incorporated) | 60 | 3.1% |
| Not-for-profit Organizations | 168 | 8.8% |
| Local Government Employees | 202 | 10.6% |
| State Government Employees | 104 | 5.4% |
| Federal Government Employees | 85 | 4.4% |
| Unpaid Family Workers | 0 | 0.0% |
| Total | 1,908 | 100.0% |
Employment Status by Age in Saw Creek
According to the labor force statistics for Saw Creek, out of the total population over 16 years of age (3,598), 61.3% or 2,206 individuals are in the labor force, with 12.4% or 274 of them unemployed. The age group with the highest labor force participation rate is 25 to 29 years, with 100.0% or 344 individuals in the labor force. Within the labor force, the 16 to 19 years age range has the highest percentage of unemployed individuals, with 86.6% or 129 of them being unemployed.
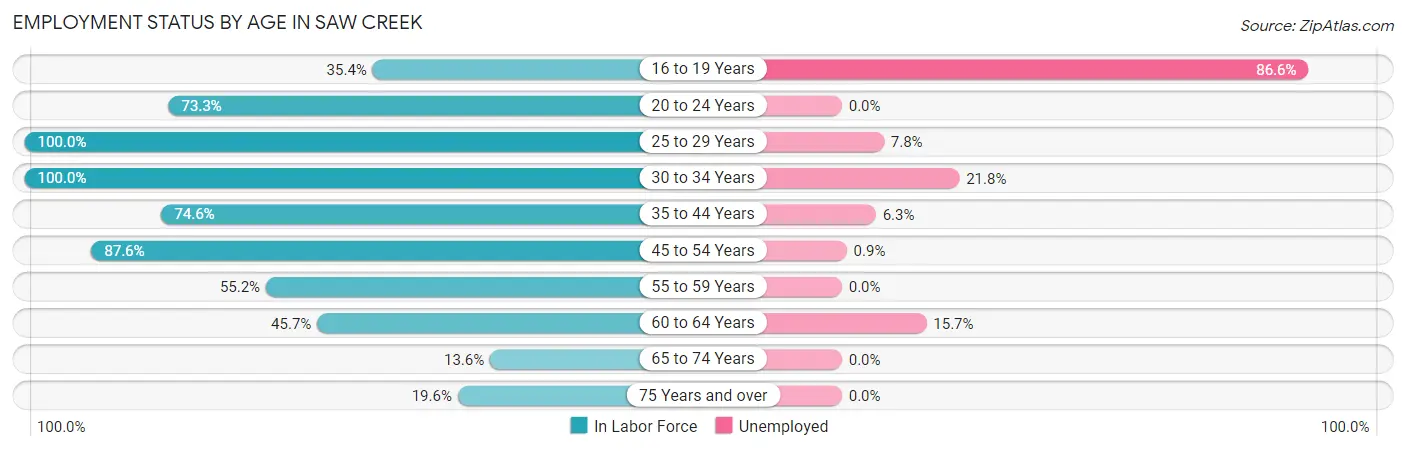
| Age Bracket | In Labor Force | Unemployed |
| 16 to 19 Years | 149 (35.4%) | 129 (86.6%) |
| 20 to 24 Years | 33 (73.3%) | 0 (0.0%) |
| 25 to 29 Years | 344 (100.0%) | 27 (7.8%) |
| 30 to 34 Years | 284 (100.0%) | 62 (21.8%) |
| 35 to 44 Years | 320 (74.6%) | 20 (6.3%) |
| 45 to 54 Years | 460 (87.6%) | 4 (0.9%) |
| 55 to 59 Years | 342 (55.2%) | 0 (0.0%) |
| 60 to 64 Years | 197 (45.7%) | 31 (15.7%) |
| 65 to 74 Years | 45 (13.6%) | 0 (0.0%) |
| 75 Years and over | 33 (19.6%) | 0 (0.0%) |
| Total | 2,206 (61.3%) | 274 (12.4%) |
Employment Status by Educational Attainment in Saw Creek
According to labor force statistics for Saw Creek, 73.9% of individuals (1,946) out of the total population between 25 and 64 years of age (2,633) are in the labor force, with 7.4% or 144 of them being unemployed. The group with the highest labor force participation rate are those with the educational attainment of bachelor's degree or higher, with 97.8% or 571 individuals in the labor force. Within the labor force, individuals with college / associate degree education have the highest percentage of unemployment, with 14.2% or 103 of them being unemployed.
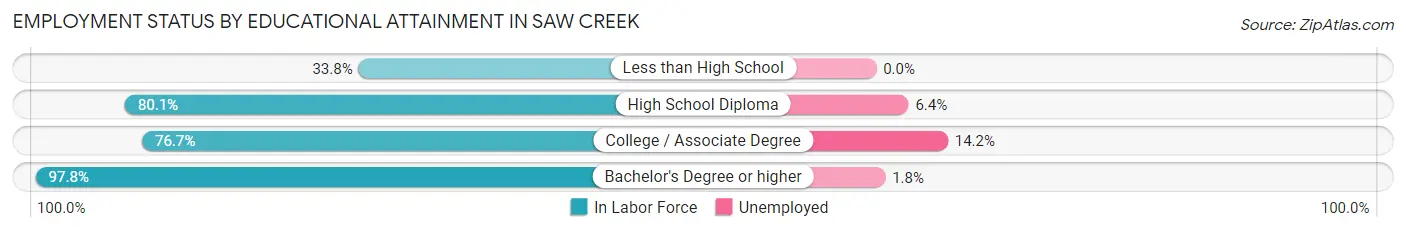
| Educational Attainment | In Labor Force | Unemployed |
| Less than High School | 170 (33.8%) | 0 (0.0%) |
| High School Diploma | 482 (80.1%) | 39 (6.4%) |
| College / Associate Degree | 724 (76.7%) | 134 (14.2%) |
| Bachelor's Degree or higher | 571 (97.8%) | 11 (1.8%) |
| Total | 1,946 (73.9%) | 195 (7.4%) |
Employment Occupations by Sex in Saw Creek
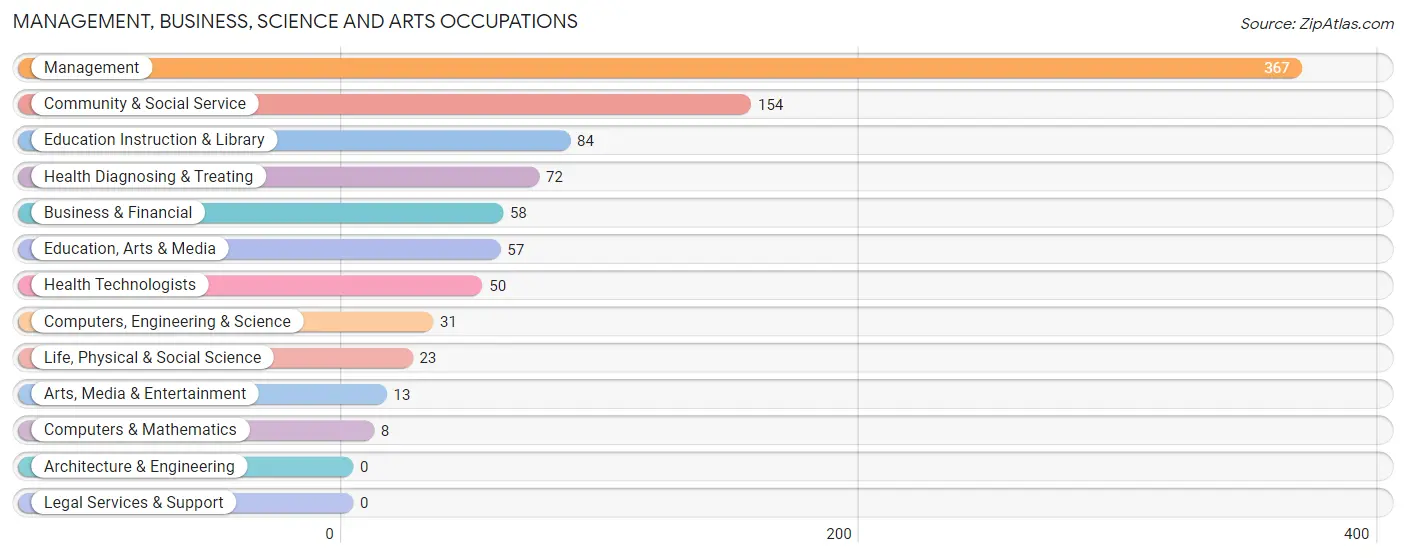
Management, Business, Science and Arts Occupations
The most common Management, Business, Science and Arts occupations in Saw Creek are Management (367 | 19.0%), Community & Social Service (154 | 8.0%), Education Instruction & Library (84 | 4.3%), Health Diagnosing & Treating (72 | 3.7%), and Business & Financial (58 | 3.0%).
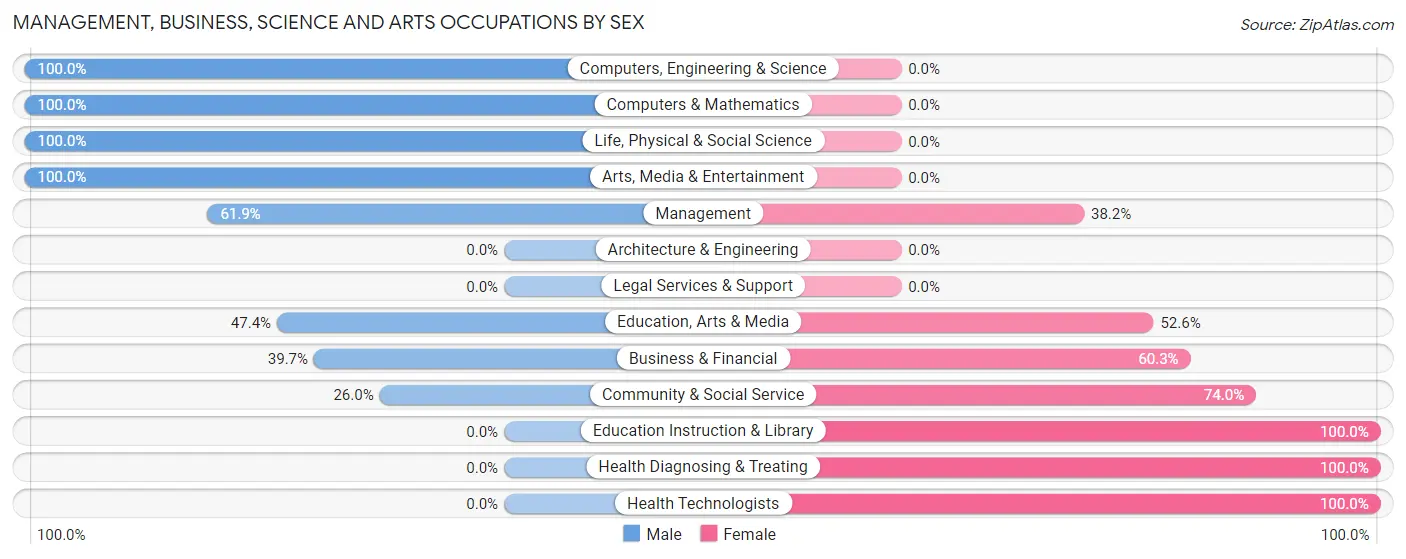
Management, Business, Science and Arts Occupations by Sex
Within the Management, Business, Science and Arts occupations in Saw Creek, the most male-oriented occupations are Computers, Engineering & Science (100.0%), Computers & Mathematics (100.0%), and Life, Physical & Social Science (100.0%), while the most female-oriented occupations are Education Instruction & Library (100.0%), Health Diagnosing & Treating (100.0%), and Health Technologists (100.0%).
| Occupation | Male | Female |
| Management | 227 (61.9%) | 140 (38.2%) |
| Business & Financial | 23 (39.7%) | 35 (60.3%) |
| Computers, Engineering & Science | 31 (100.0%) | 0 (0.0%) |
| Computers & Mathematics | 8 (100.0%) | 0 (0.0%) |
| Architecture & Engineering | 0 (0.0%) | 0 (0.0%) |
| Life, Physical & Social Science | 23 (100.0%) | 0 (0.0%) |
| Community & Social Service | 40 (26.0%) | 114 (74.0%) |
| Education, Arts & Media | 27 (47.4%) | 30 (52.6%) |
| Legal Services & Support | 0 (0.0%) | 0 (0.0%) |
| Education Instruction & Library | 0 (0.0%) | 84 (100.0%) |
| Arts, Media & Entertainment | 13 (100.0%) | 0 (0.0%) |
| Health Diagnosing & Treating | 0 (0.0%) | 72 (100.0%) |
| Health Technologists | 0 (0.0%) | 50 (100.0%) |
| Total (Category) | 321 (47.1%) | 361 (52.9%) |
| Total (Overall) | 1,032 (53.4%) | 902 (46.6%) |
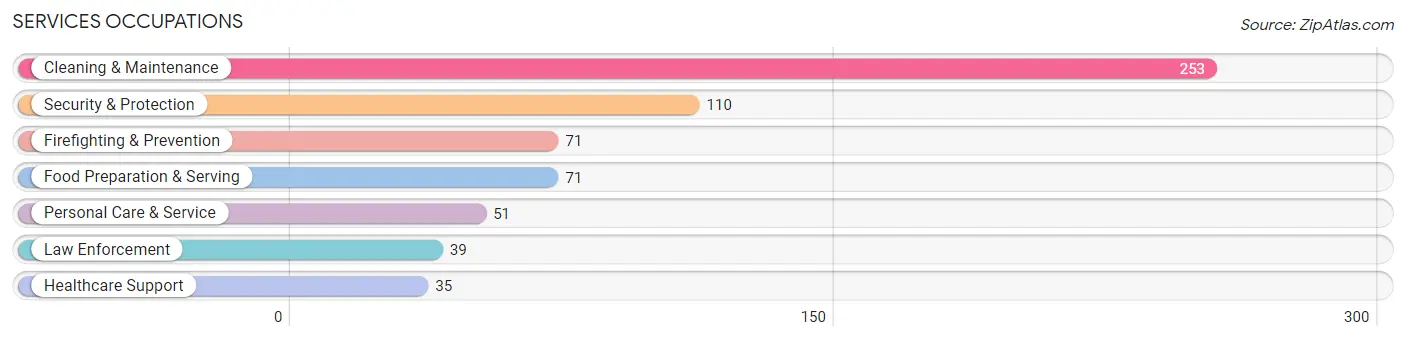
Services Occupations
The most common Services occupations in Saw Creek are Cleaning & Maintenance (253 | 13.1%), Security & Protection (110 | 5.7%), Firefighting & Prevention (71 | 3.7%), Food Preparation & Serving (71 | 3.7%), and Personal Care & Service (51 | 2.6%).
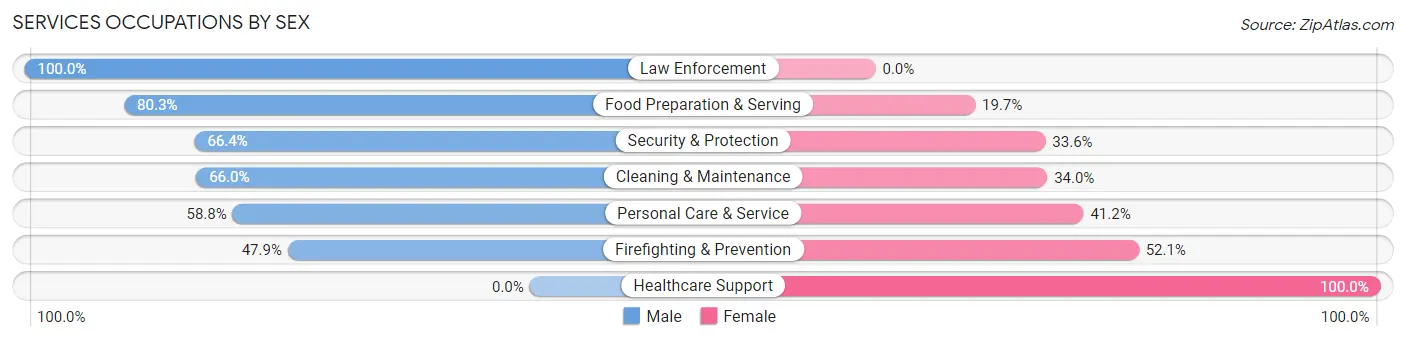
Services Occupations by Sex
Within the Services occupations in Saw Creek, the most male-oriented occupations are Law Enforcement (100.0%), Food Preparation & Serving (80.3%), and Security & Protection (66.4%), while the most female-oriented occupations are Healthcare Support (100.0%), Firefighting & Prevention (52.1%), and Personal Care & Service (41.2%).
| Occupation | Male | Female |
| Healthcare Support | 0 (0.0%) | 35 (100.0%) |
| Security & Protection | 73 (66.4%) | 37 (33.6%) |
| Firefighting & Prevention | 34 (47.9%) | 37 (52.1%) |
| Law Enforcement | 39 (100.0%) | 0 (0.0%) |
| Food Preparation & Serving | 57 (80.3%) | 14 (19.7%) |
| Cleaning & Maintenance | 167 (66.0%) | 86 (34.0%) |
| Personal Care & Service | 30 (58.8%) | 21 (41.2%) |
| Total (Category) | 327 (62.9%) | 193 (37.1%) |
| Total (Overall) | 1,032 (53.4%) | 902 (46.6%) |
Sales and Office Occupations
The most common Sales and Office occupations in Saw Creek are Office & Administration (243 | 12.6%), and Sales & Related (46 | 2.4%).
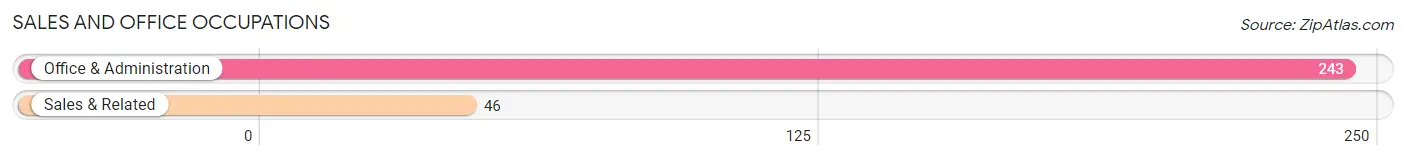
Sales and Office Occupations by Sex
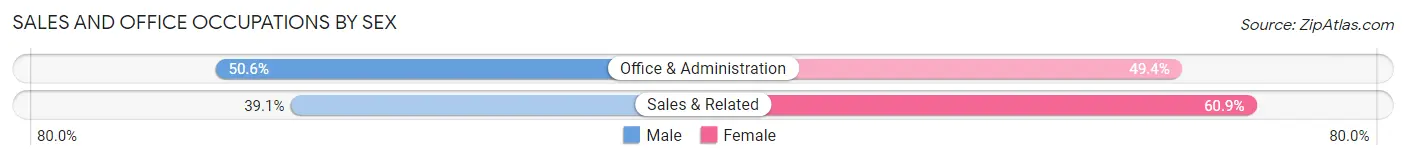
| Occupation | Male | Female |
| Sales & Related | 18 (39.1%) | 28 (60.9%) |
| Office & Administration | 123 (50.6%) | 120 (49.4%) |
| Total (Category) | 141 (48.8%) | 148 (51.2%) |
| Total (Overall) | 1,032 (53.4%) | 902 (46.6%) |
Natural Resources, Construction and Maintenance Occupations
The most common Natural Resources, Construction and Maintenance occupations in Saw Creek are Installation, Maintenance & Repair (59 | 3.0%), and Construction & Extraction (51 | 2.6%).
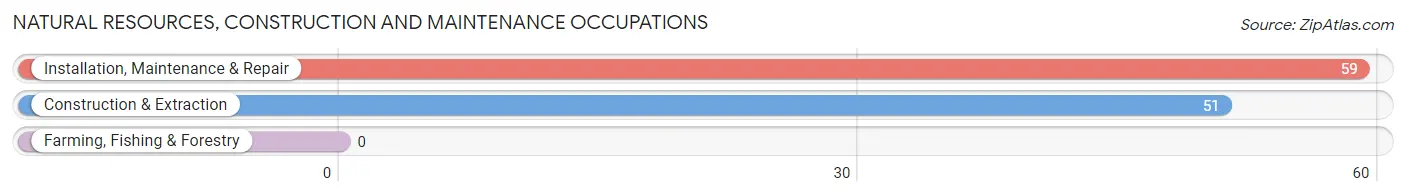
Natural Resources, Construction and Maintenance Occupations by Sex
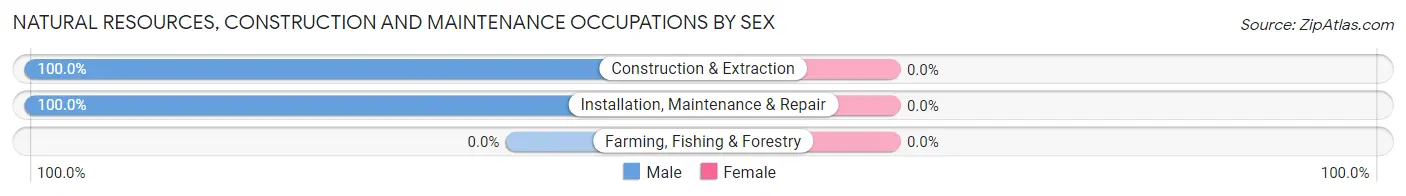
| Occupation | Male | Female |
| Farming, Fishing & Forestry | 0 (0.0%) | 0 (0.0%) |
| Construction & Extraction | 51 (100.0%) | 0 (0.0%) |
| Installation, Maintenance & Repair | 59 (100.0%) | 0 (0.0%) |
| Total (Category) | 110 (100.0%) | 0 (0.0%) |
| Total (Overall) | 1,032 (53.4%) | 902 (46.6%) |
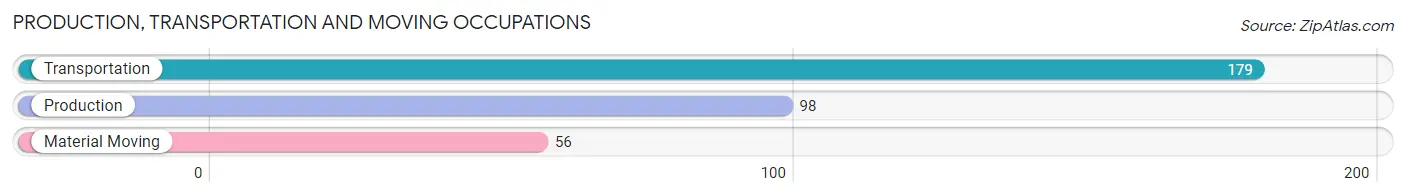
Production, Transportation and Moving Occupations
The most common Production, Transportation and Moving occupations in Saw Creek are Transportation (179 | 9.3%), Production (98 | 5.1%), and Material Moving (56 | 2.9%).
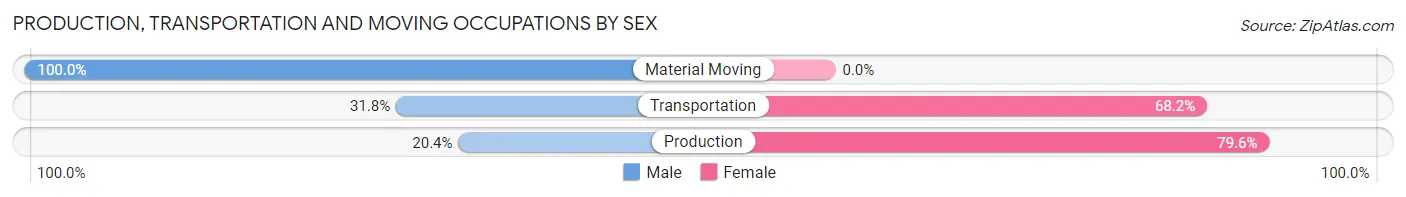
Production, Transportation and Moving Occupations by Sex
| Occupation | Male | Female |
| Production | 20 (20.4%) | 78 (79.6%) |
| Transportation | 57 (31.8%) | 122 (68.2%) |
| Material Moving | 56 (100.0%) | 0 (0.0%) |
| Total (Category) | 133 (39.9%) | 200 (60.1%) |
| Total (Overall) | 1,032 (53.4%) | 902 (46.6%) |
Employment Industries by Sex in Saw Creek
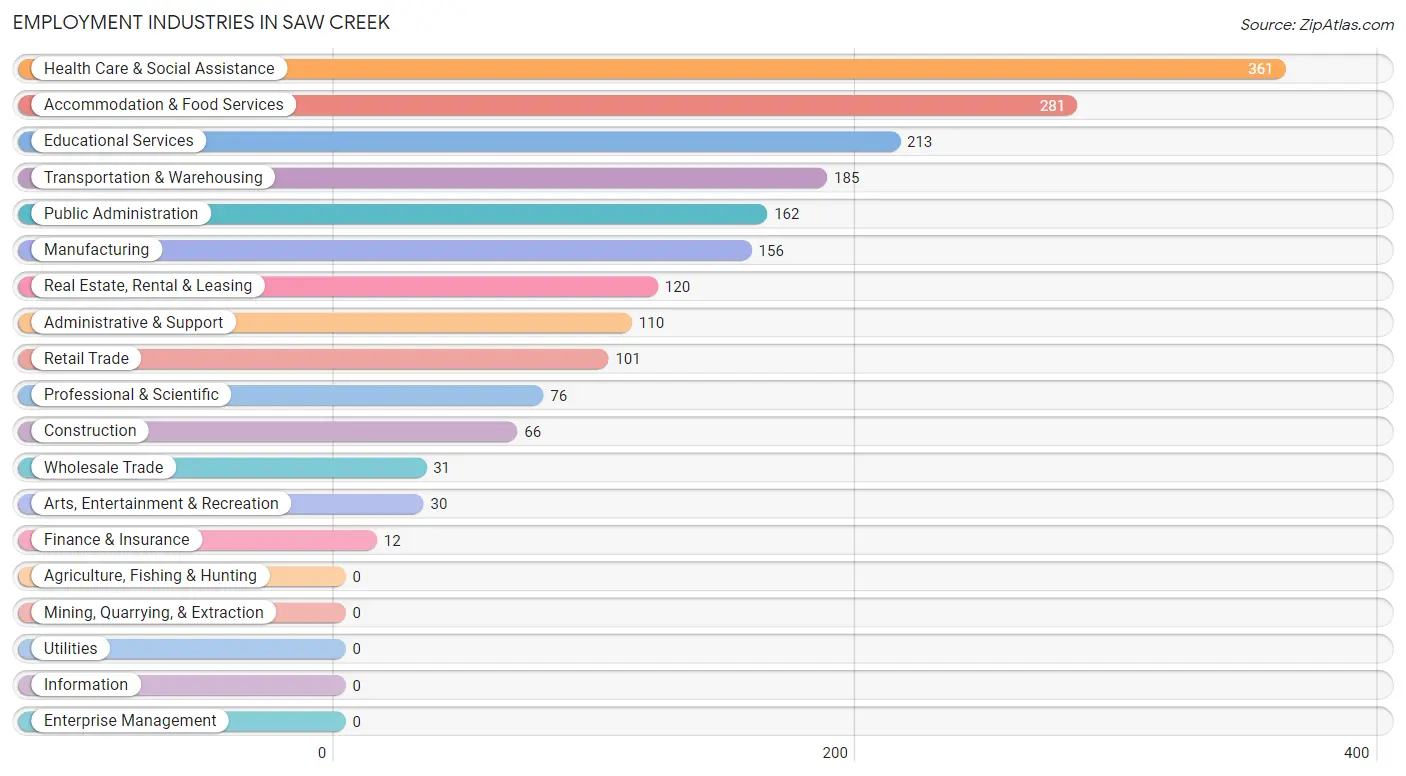
Employment Industries in Saw Creek
The major employment industries in Saw Creek include Health Care & Social Assistance (361 | 18.7%), Accommodation & Food Services (281 | 14.5%), Educational Services (213 | 11.0%), Transportation & Warehousing (185 | 9.6%), and Public Administration (162 | 8.4%).
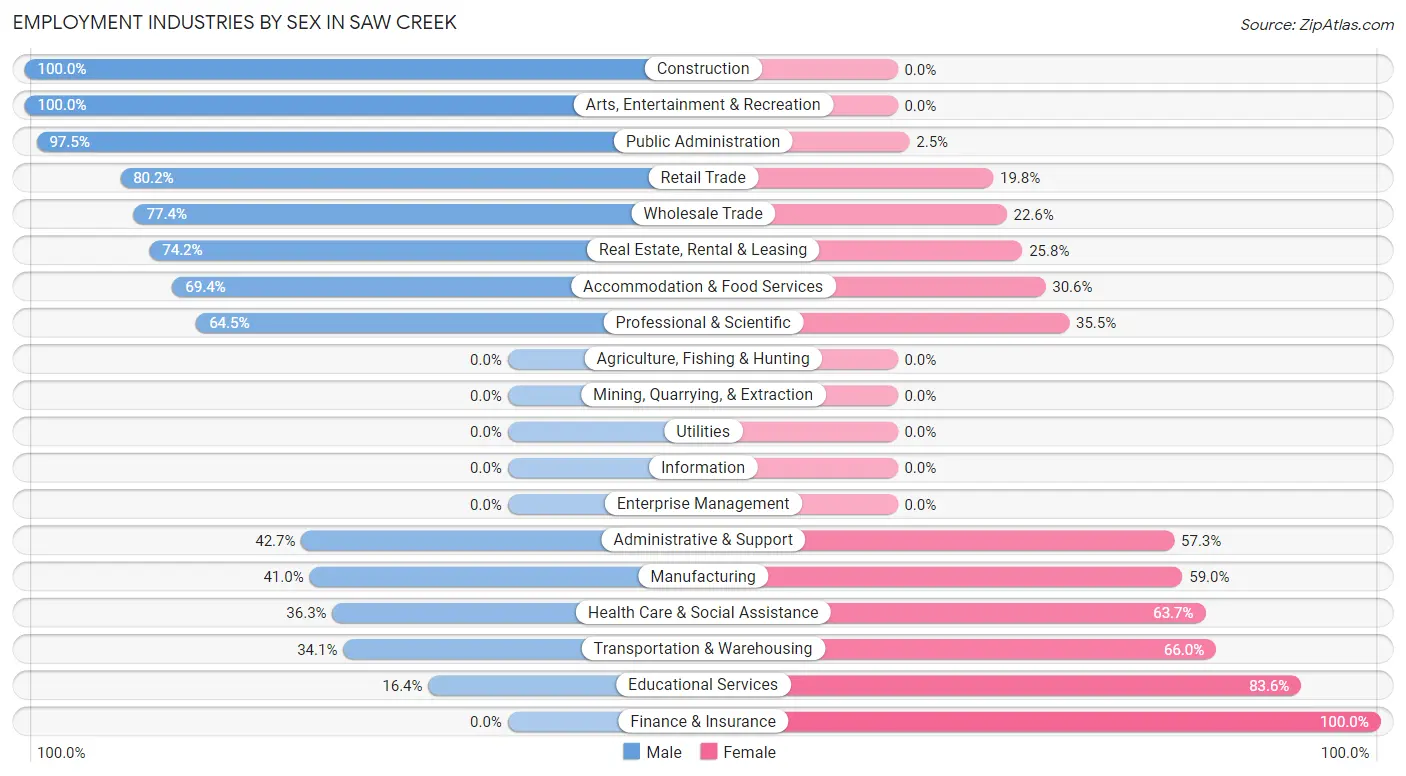
Employment Industries by Sex in Saw Creek
The Saw Creek industries that see more men than women are Construction (100.0%), Arts, Entertainment & Recreation (100.0%), and Public Administration (97.5%), whereas the industries that tend to have a higher number of women are Finance & Insurance (100.0%), Educational Services (83.6%), and Transportation & Warehousing (65.9%).
| Industry | Male | Female |
| Agriculture, Fishing & Hunting | 0 (0.0%) | 0 (0.0%) |
| Mining, Quarrying, & Extraction | 0 (0.0%) | 0 (0.0%) |
| Construction | 66 (100.0%) | 0 (0.0%) |
| Manufacturing | 64 (41.0%) | 92 (59.0%) |
| Wholesale Trade | 24 (77.4%) | 7 (22.6%) |
| Retail Trade | 81 (80.2%) | 20 (19.8%) |
| Transportation & Warehousing | 63 (34.1%) | 122 (65.9%) |
| Utilities | 0 (0.0%) | 0 (0.0%) |
| Information | 0 (0.0%) | 0 (0.0%) |
| Finance & Insurance | 0 (0.0%) | 12 (100.0%) |
| Real Estate, Rental & Leasing | 89 (74.2%) | 31 (25.8%) |
| Professional & Scientific | 49 (64.5%) | 27 (35.5%) |
| Enterprise Management | 0 (0.0%) | 0 (0.0%) |
| Administrative & Support | 47 (42.7%) | 63 (57.3%) |
| Educational Services | 35 (16.4%) | 178 (83.6%) |
| Health Care & Social Assistance | 131 (36.3%) | 230 (63.7%) |
| Arts, Entertainment & Recreation | 30 (100.0%) | 0 (0.0%) |
| Accommodation & Food Services | 195 (69.4%) | 86 (30.6%) |
| Public Administration | 158 (97.5%) | 4 (2.5%) |
| Total | 1,032 (53.4%) | 902 (46.6%) |
Education in Saw Creek
School Enrollment in Saw Creek
The most common levels of schooling among the 964 students in Saw Creek are high school (537 | 55.7%), college / undergraduate (167 | 17.3%), and middle school (134 | 13.9%).
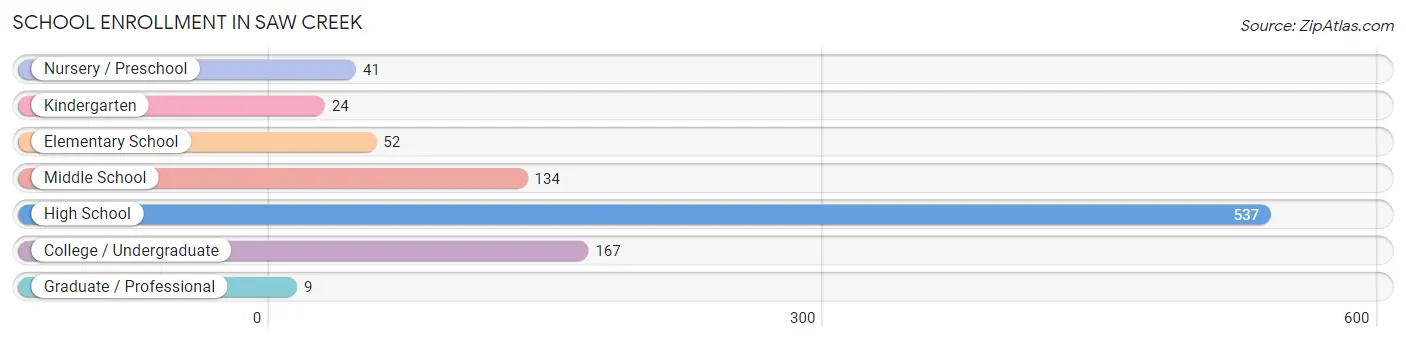
| School Level | # Students | % Students |
| Nursery / Preschool | 41 | 4.3% |
| Kindergarten | 24 | 2.5% |
| Elementary School | 52 | 5.4% |
| Middle School | 134 | 13.9% |
| High School | 537 | 55.7% |
| College / Undergraduate | 167 | 17.3% |
| Graduate / Professional | 9 | 0.9% |
| Total | 964 | 100.0% |
School Enrollment by Age by Funding Source in Saw Creek
Out of a total of 964 students who are enrolled in schools in Saw Creek, 83 (8.6%) attend a private institution, while the remaining 881 (91.4%) are enrolled in public schools. The age group of 35 years and over has the highest likelihood of being enrolled in private schools, with 9 (100.0% in the age bracket) enrolled. Conversely, the age group of 3 to 4 year olds has the lowest likelihood of being enrolled in a private school, with 41 (100.0% in the age bracket) attending a public institution.
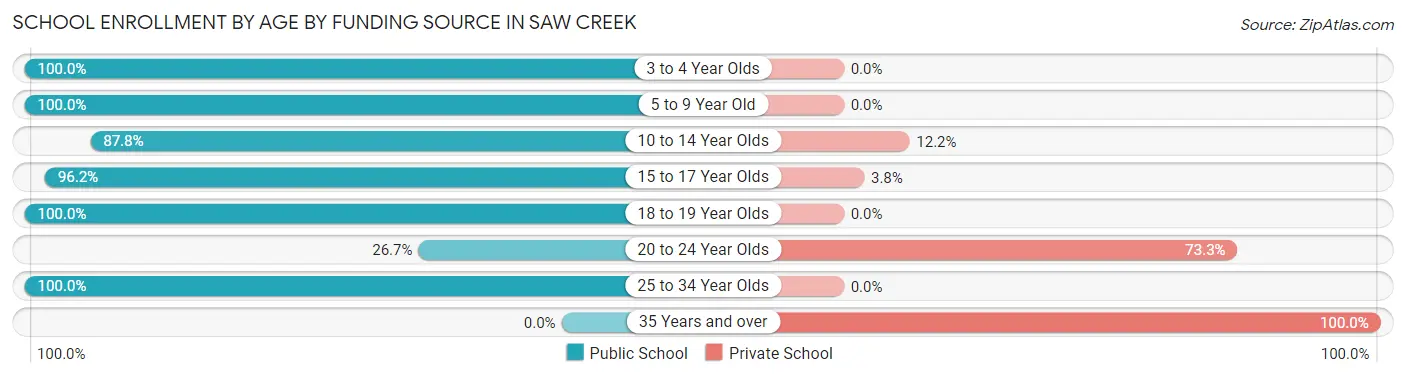
| Age Bracket | Public School | Private School |
| 3 to 4 Year Olds | 41 (100.0%) | 0 (0.0%) |
| 5 to 9 Year Old | 52 (100.0%) | 0 (0.0%) |
| 10 to 14 Year Olds | 172 (87.8%) | 24 (12.2%) |
| 15 to 17 Year Olds | 431 (96.2%) | 17 (3.8%) |
| 18 to 19 Year Olds | 51 (100.0%) | 0 (0.0%) |
| 20 to 24 Year Olds | 12 (26.7%) | 33 (73.3%) |
| 25 to 34 Year Olds | 122 (100.0%) | 0 (0.0%) |
| 35 Years and over | 0 (0.0%) | 9 (100.0%) |
| Total | 881 (91.4%) | 83 (8.6%) |
Educational Attainment by Field of Study in Saw Creek
Business (171 | 22.9%), literature & languages (137 | 18.4%), psychology (115 | 15.4%), science & technology (75 | 10.1%), and physical & health sciences (53 | 7.1%) are the most common fields of study among 746 individuals in Saw Creek who have obtained a bachelor's degree or higher.
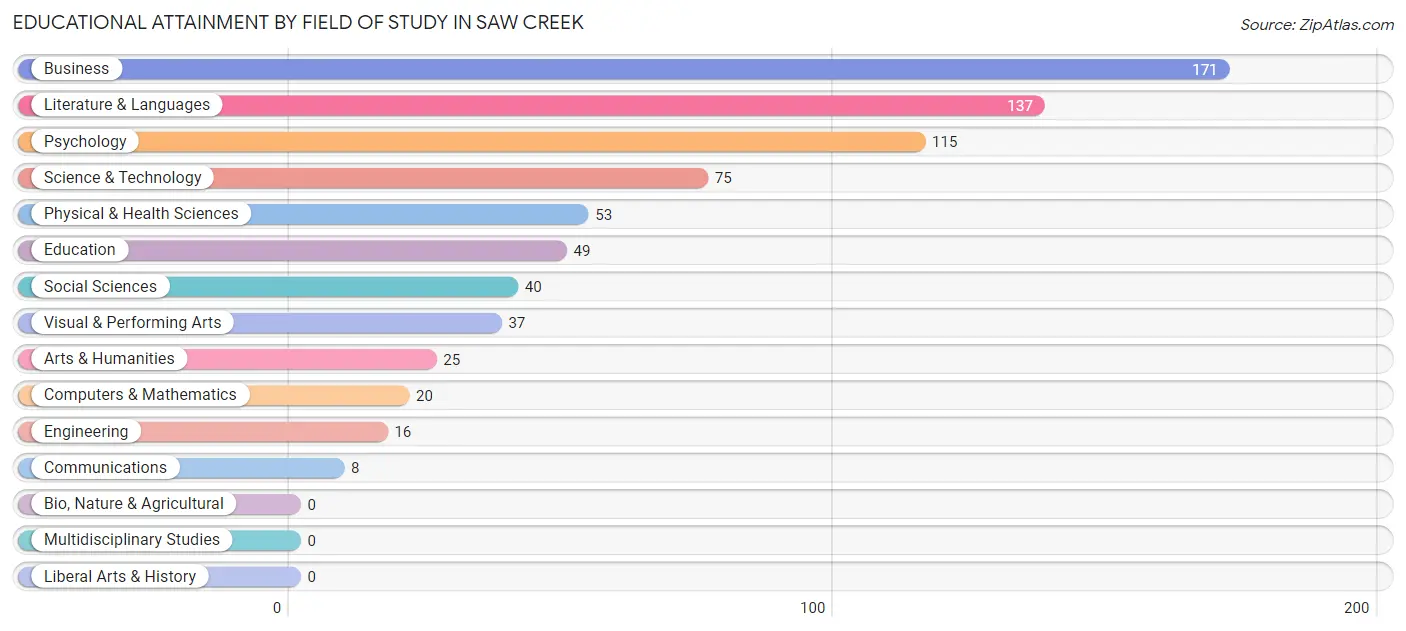
| Field of Study | # Graduates | % Graduates |
| Computers & Mathematics | 20 | 2.7% |
| Bio, Nature & Agricultural | 0 | 0.0% |
| Physical & Health Sciences | 53 | 7.1% |
| Psychology | 115 | 15.4% |
| Social Sciences | 40 | 5.4% |
| Engineering | 16 | 2.1% |
| Multidisciplinary Studies | 0 | 0.0% |
| Science & Technology | 75 | 10.1% |
| Business | 171 | 22.9% |
| Education | 49 | 6.6% |
| Literature & Languages | 137 | 18.4% |
| Liberal Arts & History | 0 | 0.0% |
| Visual & Performing Arts | 37 | 5.0% |
| Communications | 8 | 1.1% |
| Arts & Humanities | 25 | 3.4% |
| Total | 746 | 100.0% |
Transportation & Commute in Saw Creek
Vehicle Availability by Sex in Saw Creek
The most prevalent vehicle ownership categories in Saw Creek are males with 2 vehicles (443, accounting for 43.6%) and females with 2 vehicles (200, making up 49.6%).
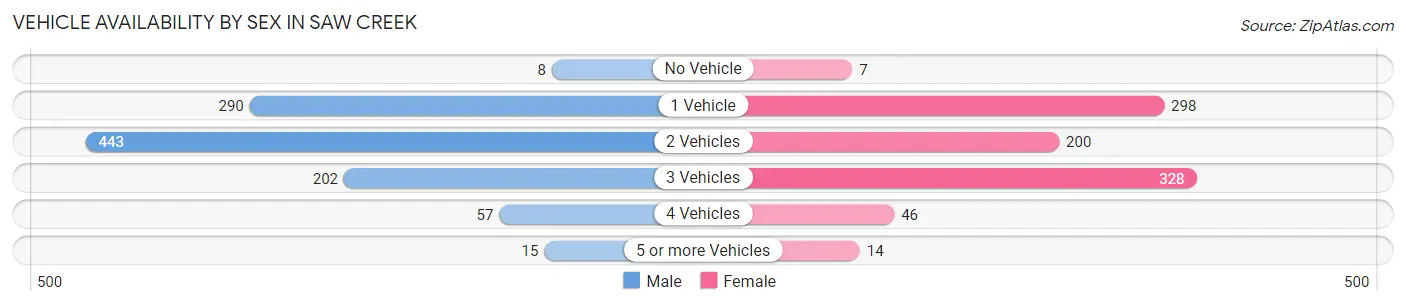
| Vehicles Available | Male | Female |
| No Vehicle | 8 (0.8%) | 7 (0.8%) |
| 1 Vehicle | 290 (28.6%) | 298 (33.4%) |
| 2 Vehicles | 443 (43.6%) | 200 (22.4%) |
| 3 Vehicles | 202 (19.9%) | 328 (36.7%) |
| 4 Vehicles | 57 (5.6%) | 46 (5.1%) |
| 5 or more Vehicles | 15 (1.5%) | 14 (1.6%) |
| Total | 1,015 (100.0%) | 893 (100.0%) |
Commute Time in Saw Creek
The most frequently occuring commute durations in Saw Creek are 90 or more minutes (453 commuters, 26.3%), 45 to 59 minutes (312 commuters, 18.1%), and 15 to 19 minutes (233 commuters, 13.6%).
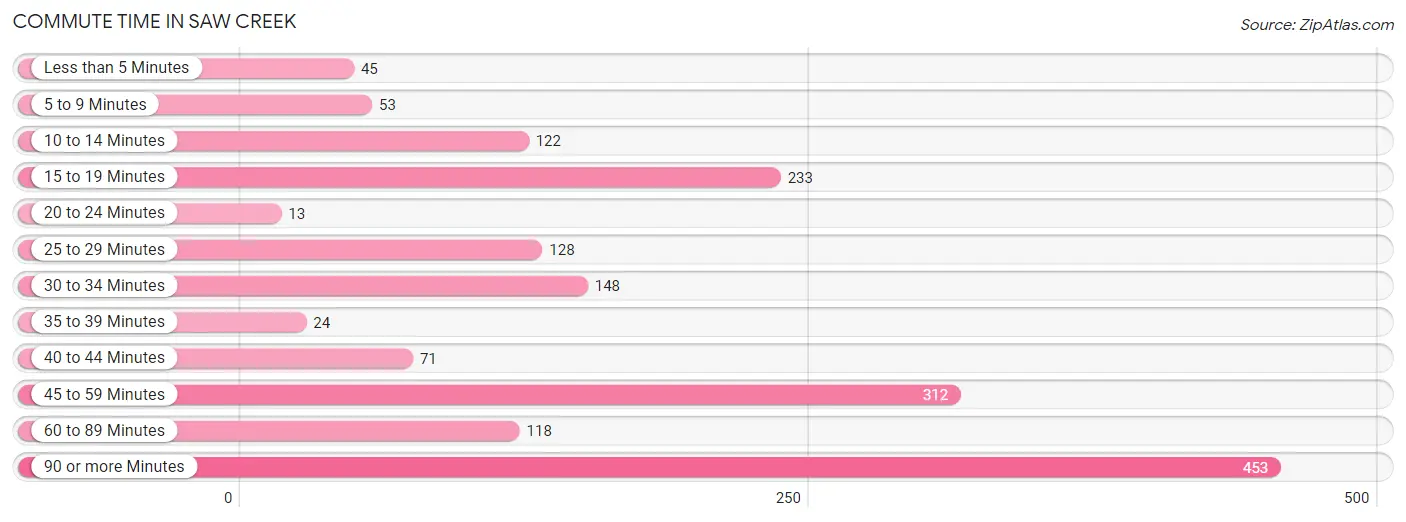
| Commute Time | # Commuters | % Commuters |
| Less than 5 Minutes | 45 | 2.6% |
| 5 to 9 Minutes | 53 | 3.1% |
| 10 to 14 Minutes | 122 | 7.1% |
| 15 to 19 Minutes | 233 | 13.6% |
| 20 to 24 Minutes | 13 | 0.8% |
| 25 to 29 Minutes | 128 | 7.4% |
| 30 to 34 Minutes | 148 | 8.6% |
| 35 to 39 Minutes | 24 | 1.4% |
| 40 to 44 Minutes | 71 | 4.1% |
| 45 to 59 Minutes | 312 | 18.1% |
| 60 to 89 Minutes | 118 | 6.9% |
| 90 or more Minutes | 453 | 26.3% |
Commute Time by Sex in Saw Creek
The most common commute times in Saw Creek are 90 or more minutes (340 commuters, 35.0%) for males and 45 to 59 minutes (161 commuters, 21.5%) for females.
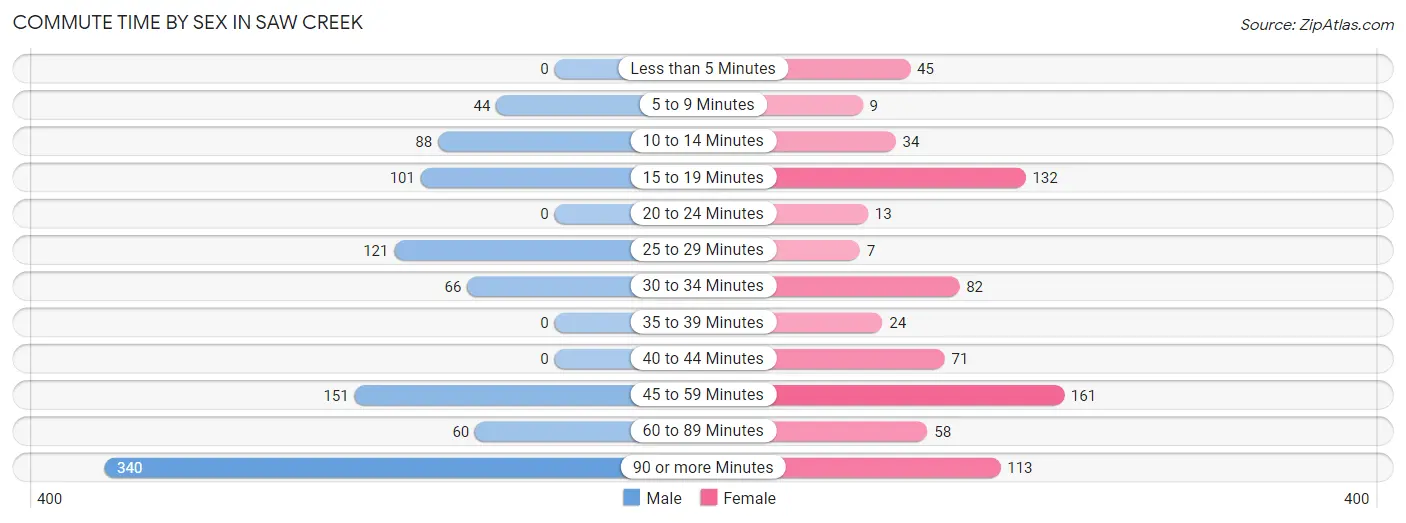
| Commute Time | Male | Female |
| Less than 5 Minutes | 0 (0.0%) | 45 (6.0%) |
| 5 to 9 Minutes | 44 (4.5%) | 9 (1.2%) |
| 10 to 14 Minutes | 88 (9.1%) | 34 (4.5%) |
| 15 to 19 Minutes | 101 (10.4%) | 132 (17.6%) |
| 20 to 24 Minutes | 0 (0.0%) | 13 (1.7%) |
| 25 to 29 Minutes | 121 (12.5%) | 7 (0.9%) |
| 30 to 34 Minutes | 66 (6.8%) | 82 (11.0%) |
| 35 to 39 Minutes | 0 (0.0%) | 24 (3.2%) |
| 40 to 44 Minutes | 0 (0.0%) | 71 (9.5%) |
| 45 to 59 Minutes | 151 (15.5%) | 161 (21.5%) |
| 60 to 89 Minutes | 60 (6.2%) | 58 (7.7%) |
| 90 or more Minutes | 340 (35.0%) | 113 (15.1%) |
Time of Departure to Work by Sex in Saw Creek
The most frequent times of departure to work in Saw Creek are 12:00 AM to 4:59 AM (224, 23.1%) for males and 7:30 AM to 7:59 AM (125, 16.7%) for females.
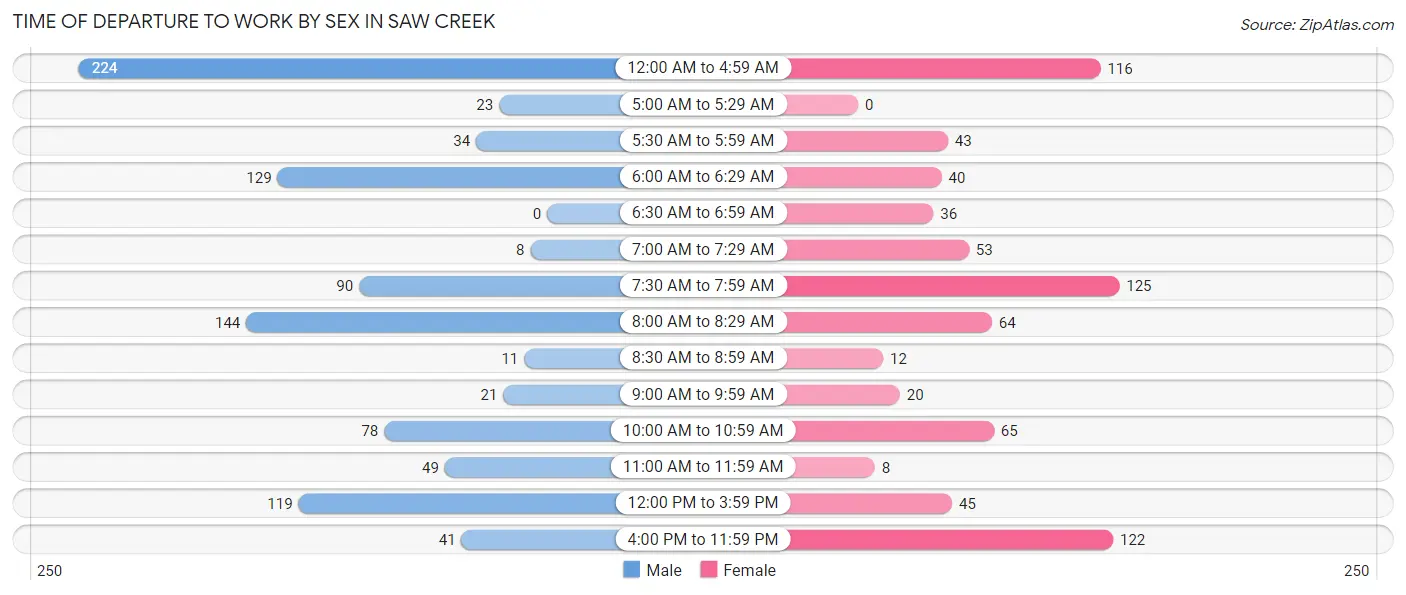
| Time of Departure | Male | Female |
| 12:00 AM to 4:59 AM | 224 (23.1%) | 116 (15.5%) |
| 5:00 AM to 5:29 AM | 23 (2.4%) | 0 (0.0%) |
| 5:30 AM to 5:59 AM | 34 (3.5%) | 43 (5.7%) |
| 6:00 AM to 6:29 AM | 129 (13.3%) | 40 (5.3%) |
| 6:30 AM to 6:59 AM | 0 (0.0%) | 36 (4.8%) |
| 7:00 AM to 7:29 AM | 8 (0.8%) | 53 (7.1%) |
| 7:30 AM to 7:59 AM | 90 (9.3%) | 125 (16.7%) |
| 8:00 AM to 8:29 AM | 144 (14.8%) | 64 (8.5%) |
| 8:30 AM to 8:59 AM | 11 (1.1%) | 12 (1.6%) |
| 9:00 AM to 9:59 AM | 21 (2.2%) | 20 (2.7%) |
| 10:00 AM to 10:59 AM | 78 (8.0%) | 65 (8.7%) |
| 11:00 AM to 11:59 AM | 49 (5.1%) | 8 (1.1%) |
| 12:00 PM to 3:59 PM | 119 (12.3%) | 45 (6.0%) |
| 4:00 PM to 11:59 PM | 41 (4.2%) | 122 (16.3%) |
| Total | 971 (100.0%) | 749 (100.0%) |
Housing Occupancy in Saw Creek
Occupancy by Ownership in Saw Creek
Of the total 1,603 dwellings in Saw Creek, owner-occupied units account for 1,267 (79.0%), while renter-occupied units make up 336 (21.0%).
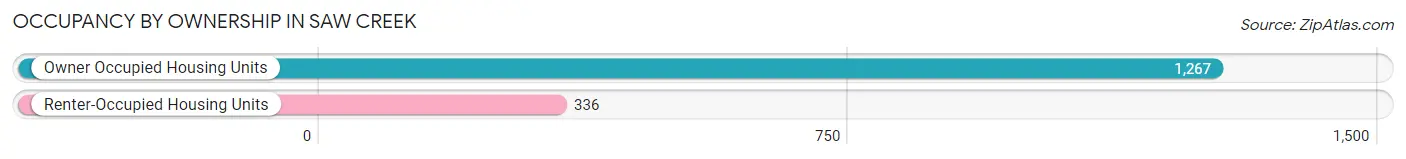
| Occupancy | # Housing Units | % Housing Units |
| Owner Occupied Housing Units | 1,267 | 79.0% |
| Renter-Occupied Housing Units | 336 | 21.0% |
| Total Occupied Housing Units | 1,603 | 100.0% |
Occupancy by Household Size in Saw Creek
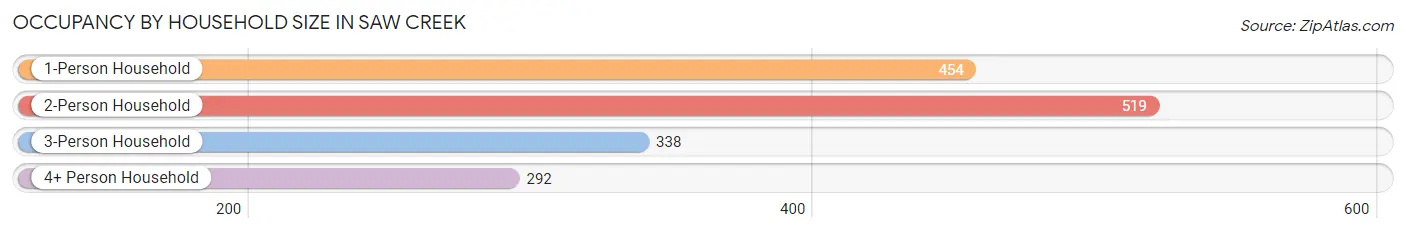
| Household Size | # Housing Units | % Housing Units |
| 1-Person Household | 454 | 28.3% |
| 2-Person Household | 519 | 32.4% |
| 3-Person Household | 338 | 21.1% |
| 4+ Person Household | 292 | 18.2% |
| Total Housing Units | 1,603 | 100.0% |
Occupancy by Ownership by Household Size in Saw Creek
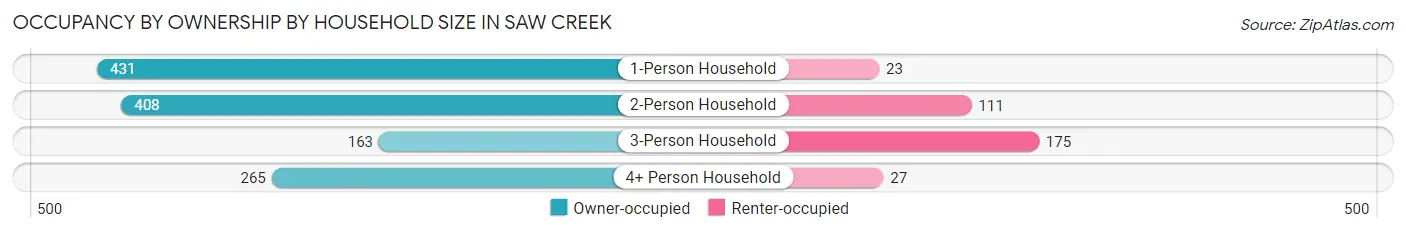
| Household Size | Owner-occupied | Renter-occupied |
| 1-Person Household | 431 (94.9%) | 23 (5.1%) |
| 2-Person Household | 408 (78.6%) | 111 (21.4%) |
| 3-Person Household | 163 (48.2%) | 175 (51.8%) |
| 4+ Person Household | 265 (90.7%) | 27 (9.2%) |
| Total Housing Units | 1,267 (79.0%) | 336 (21.0%) |
Occupancy by Educational Attainment in Saw Creek
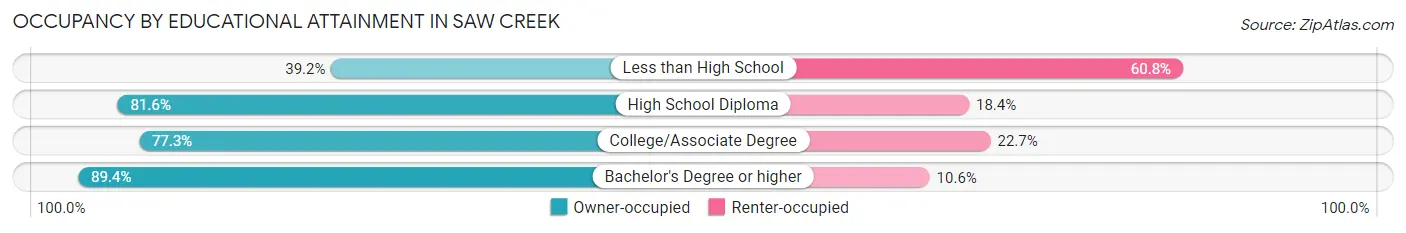
| Household Size | Owner-occupied | Renter-occupied |
| Less than High School | 58 (39.2%) | 90 (60.8%) |
| High School Diploma | 279 (81.6%) | 63 (18.4%) |
| College/Associate Degree | 416 (77.3%) | 122 (22.7%) |
| Bachelor's Degree or higher | 514 (89.4%) | 61 (10.6%) |
Occupancy by Age of Householder in Saw Creek
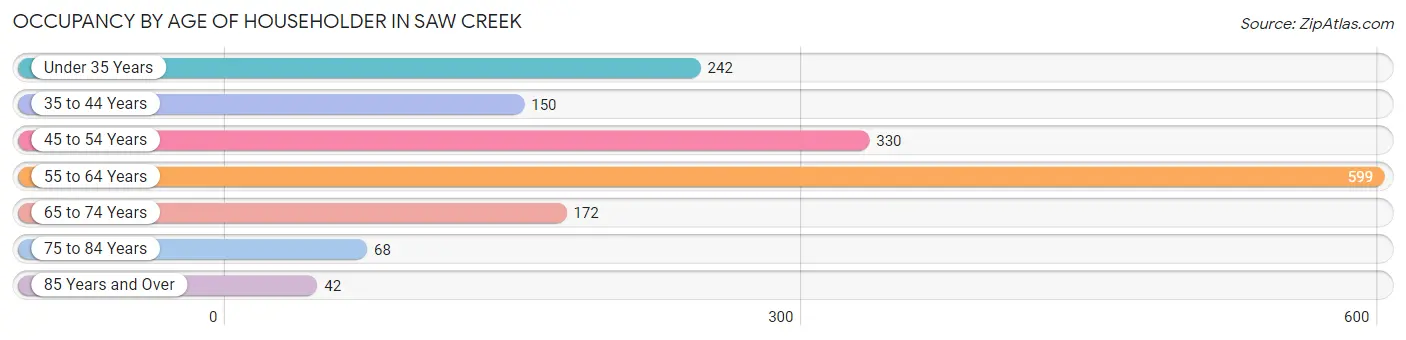
| Age Bracket | # Households | % Households |
| Under 35 Years | 242 | 15.1% |
| 35 to 44 Years | 150 | 9.4% |
| 45 to 54 Years | 330 | 20.6% |
| 55 to 64 Years | 599 | 37.4% |
| 65 to 74 Years | 172 | 10.7% |
| 75 to 84 Years | 68 | 4.2% |
| 85 Years and Over | 42 | 2.6% |
| Total | 1,603 | 100.0% |
Housing Finances in Saw Creek
Median Income by Occupancy in Saw Creek
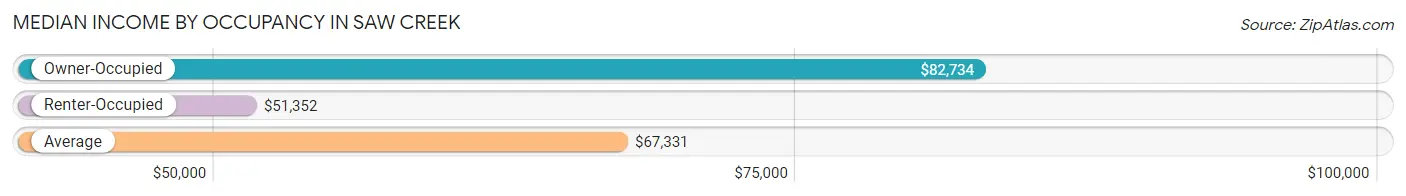
| Occupancy Type | # Households | Median Income |
| Owner-Occupied | 1,267 (79.0%) | $82,734 |
| Renter-Occupied | 336 (21.0%) | $51,352 |
| Average | 1,603 (100.0%) | $67,331 |
Occupancy by Householder Income Bracket in Saw Creek
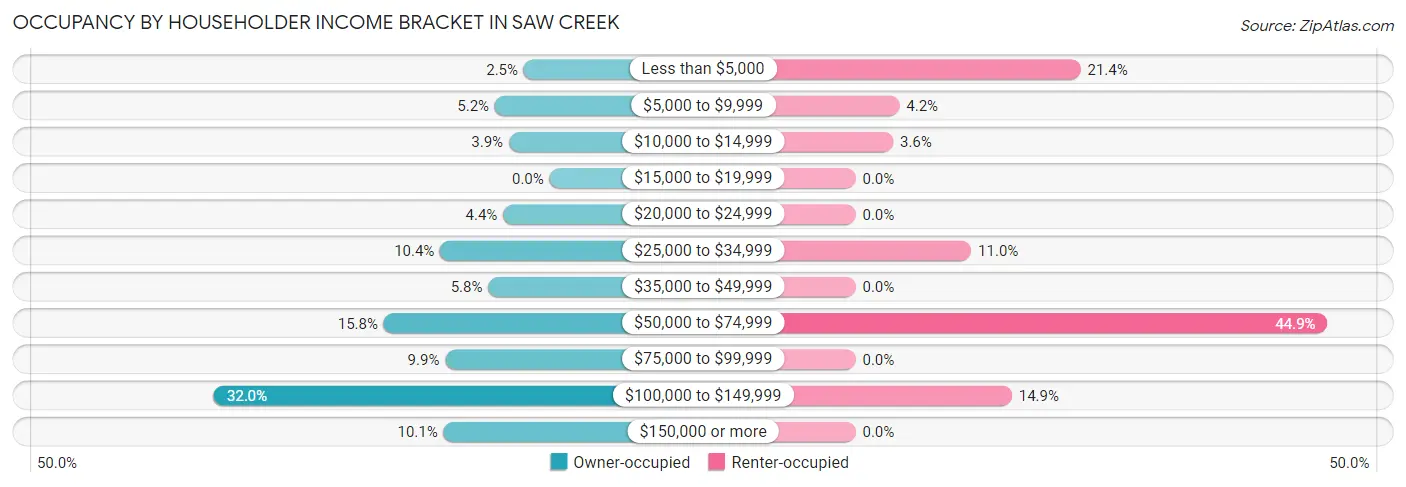
| Income Bracket | Owner-occupied | Renter-occupied |
| Less than $5,000 | 31 (2.5%) | 72 (21.4%) |
| $5,000 to $9,999 | 66 (5.2%) | 14 (4.2%) |
| $10,000 to $14,999 | 49 (3.9%) | 12 (3.6%) |
| $15,000 to $19,999 | 0 (0.0%) | 0 (0.0%) |
| $20,000 to $24,999 | 56 (4.4%) | 0 (0.0%) |
| $25,000 to $34,999 | 132 (10.4%) | 37 (11.0%) |
| $35,000 to $49,999 | 74 (5.8%) | 0 (0.0%) |
| $50,000 to $74,999 | 200 (15.8%) | 151 (44.9%) |
| $75,000 to $99,999 | 126 (9.9%) | 0 (0.0%) |
| $100,000 to $149,999 | 405 (32.0%) | 50 (14.9%) |
| $150,000 or more | 128 (10.1%) | 0 (0.0%) |
| Total | 1,267 (100.0%) | 336 (100.0%) |
Monthly Housing Cost Tiers in Saw Creek
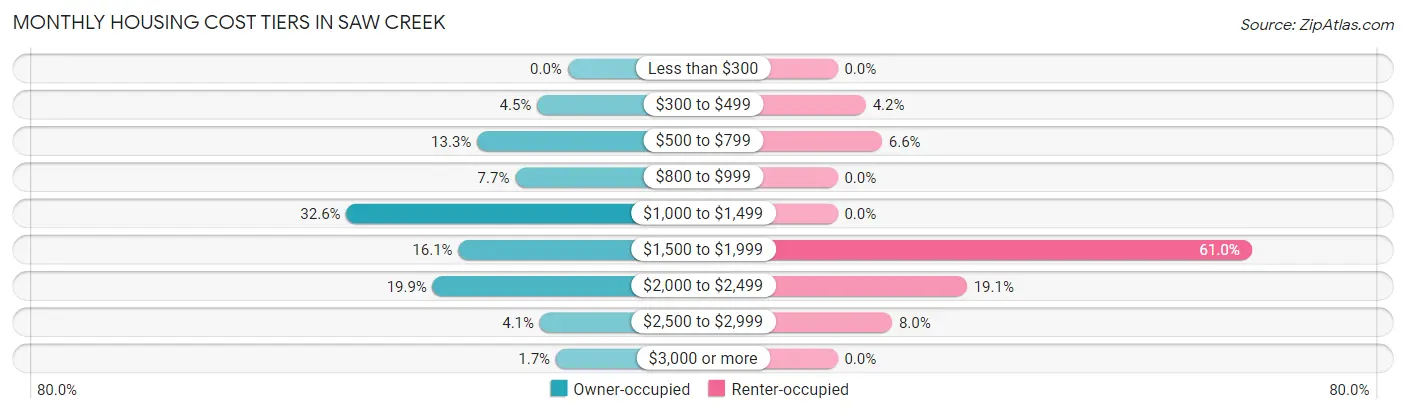
| Monthly Cost | Owner-occupied | Renter-occupied |
| Less than $300 | 0 (0.0%) | 0 (0.0%) |
| $300 to $499 | 57 (4.5%) | 14 (4.2%) |
| $500 to $799 | 169 (13.3%) | 22 (6.6%) |
| $800 to $999 | 98 (7.7%) | 0 (0.0%) |
| $1,000 to $1,499 | 413 (32.6%) | 0 (0.0%) |
| $1,500 to $1,999 | 204 (16.1%) | 205 (61.0%) |
| $2,000 to $2,499 | 252 (19.9%) | 64 (19.1%) |
| $2,500 to $2,999 | 52 (4.1%) | 27 (8.0%) |
| $3,000 or more | 22 (1.7%) | 0 (0.0%) |
| Total | 1,267 (100.0%) | 336 (100.0%) |
Physical Housing Characteristics in Saw Creek
Housing Structures in Saw Creek
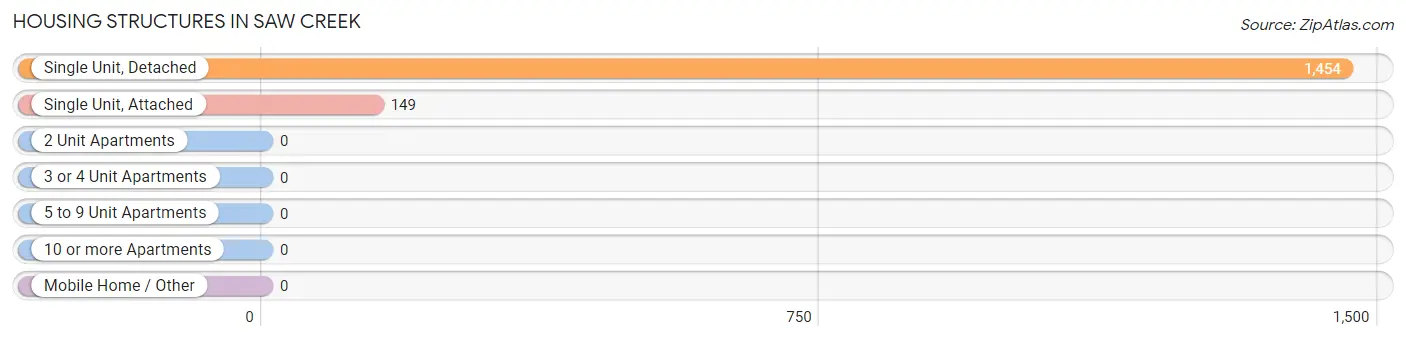
| Structure Type | # Housing Units | % Housing Units |
| Single Unit, Detached | 1,454 | 90.7% |
| Single Unit, Attached | 149 | 9.3% |
| 2 Unit Apartments | 0 | 0.0% |
| 3 or 4 Unit Apartments | 0 | 0.0% |
| 5 to 9 Unit Apartments | 0 | 0.0% |
| 10 or more Apartments | 0 | 0.0% |
| Mobile Home / Other | 0 | 0.0% |
| Total | 1,603 | 100.0% |
Housing Structures by Occupancy in Saw Creek
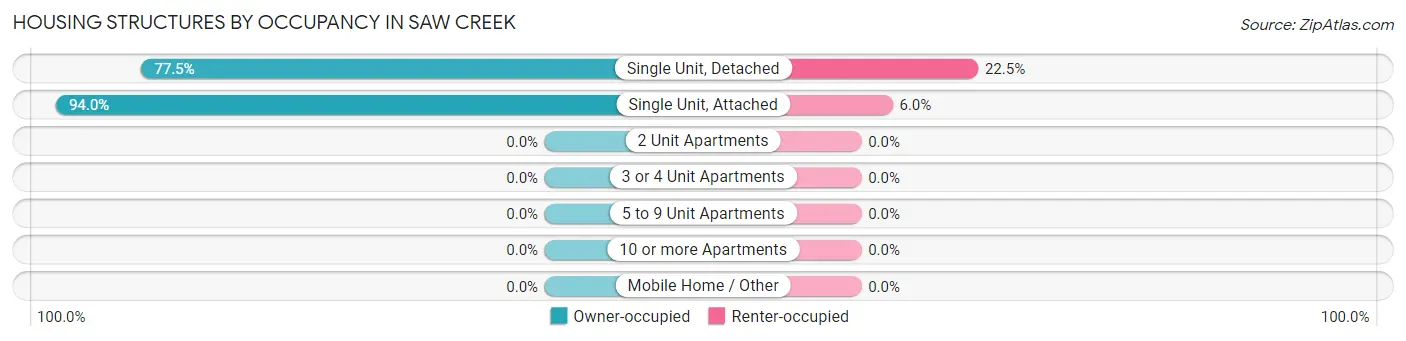
| Structure Type | Owner-occupied | Renter-occupied |
| Single Unit, Detached | 1,127 (77.5%) | 327 (22.5%) |
| Single Unit, Attached | 140 (94.0%) | 9 (6.0%) |
| 2 Unit Apartments | 0 (0.0%) | 0 (0.0%) |
| 3 or 4 Unit Apartments | 0 (0.0%) | 0 (0.0%) |
| 5 to 9 Unit Apartments | 0 (0.0%) | 0 (0.0%) |
| 10 or more Apartments | 0 (0.0%) | 0 (0.0%) |
| Mobile Home / Other | 0 (0.0%) | 0 (0.0%) |
| Total | 1,267 (79.0%) | 336 (21.0%) |
Housing Structures by Number of Rooms in Saw Creek
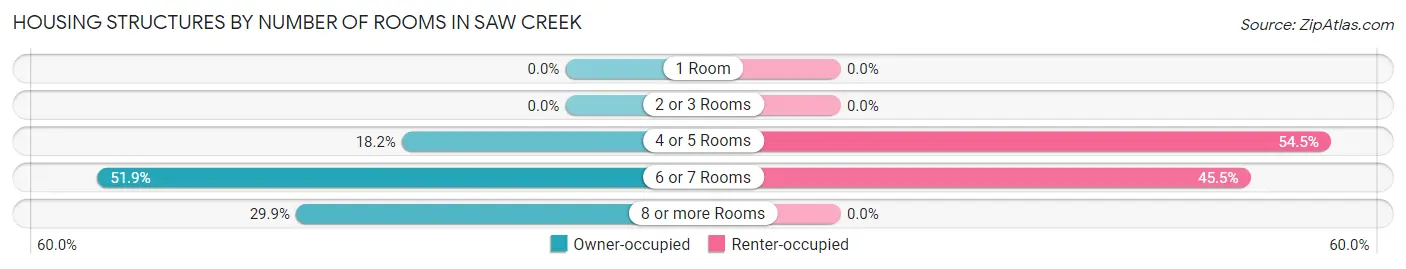
| Number of Rooms | Owner-occupied | Renter-occupied |
| 1 Room | 0 (0.0%) | 0 (0.0%) |
| 2 or 3 Rooms | 0 (0.0%) | 0 (0.0%) |
| 4 or 5 Rooms | 230 (18.1%) | 183 (54.5%) |
| 6 or 7 Rooms | 658 (51.9%) | 153 (45.5%) |
| 8 or more Rooms | 379 (29.9%) | 0 (0.0%) |
| Total | 1,267 (100.0%) | 336 (100.0%) |
Housing Structure by Heating Type in Saw Creek
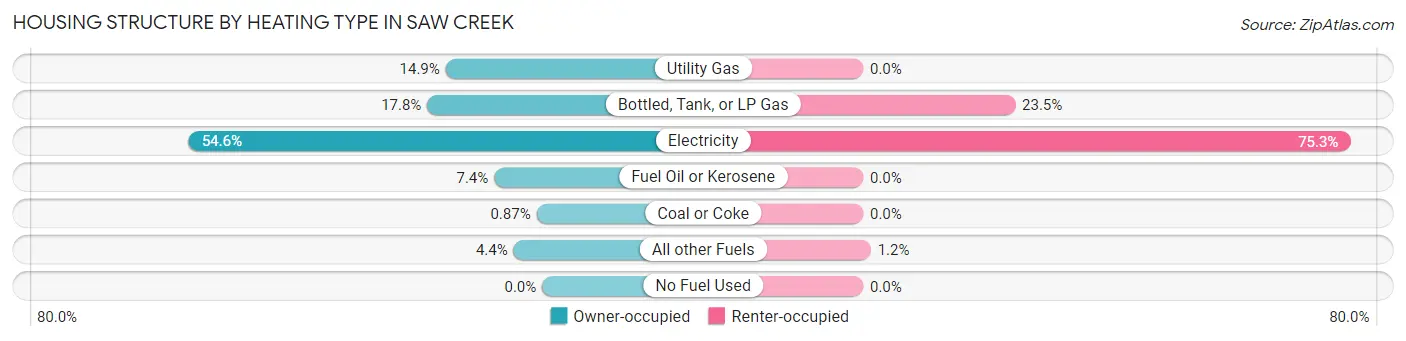
| Heating Type | Owner-occupied | Renter-occupied |
| Utility Gas | 189 (14.9%) | 0 (0.0%) |
| Bottled, Tank, or LP Gas | 225 (17.8%) | 79 (23.5%) |
| Electricity | 692 (54.6%) | 253 (75.3%) |
| Fuel Oil or Kerosene | 94 (7.4%) | 0 (0.0%) |
| Coal or Coke | 11 (0.9%) | 0 (0.0%) |
| All other Fuels | 56 (4.4%) | 4 (1.2%) |
| No Fuel Used | 0 (0.0%) | 0 (0.0%) |
| Total | 1,267 (100.0%) | 336 (100.0%) |
Household Vehicle Usage in Saw Creek
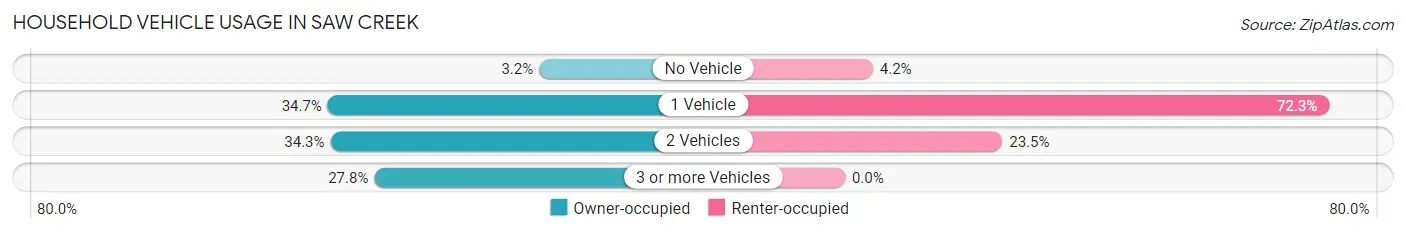
| Vehicles per Household | Owner-occupied | Renter-occupied |
| No Vehicle | 40 (3.2%) | 14 (4.2%) |
| 1 Vehicle | 440 (34.7%) | 243 (72.3%) |
| 2 Vehicles | 435 (34.3%) | 79 (23.5%) |
| 3 or more Vehicles | 352 (27.8%) | 0 (0.0%) |
| Total | 1,267 (100.0%) | 336 (100.0%) |
Real Estate & Mortgages in Saw Creek
Real Estate and Mortgage Overview in Saw Creek
| Characteristic | Without Mortgage | With Mortgage |
| Housing Units | 430 | 837 |
| Median Property Value | $197,100 | $196,100 |
| Median Household Income | $41,544 | $101 |
| Monthly Housing Costs | $797 | $22 |
| Real Estate Taxes | $4,469 | $0 |
Property Value by Mortgage Status in Saw Creek
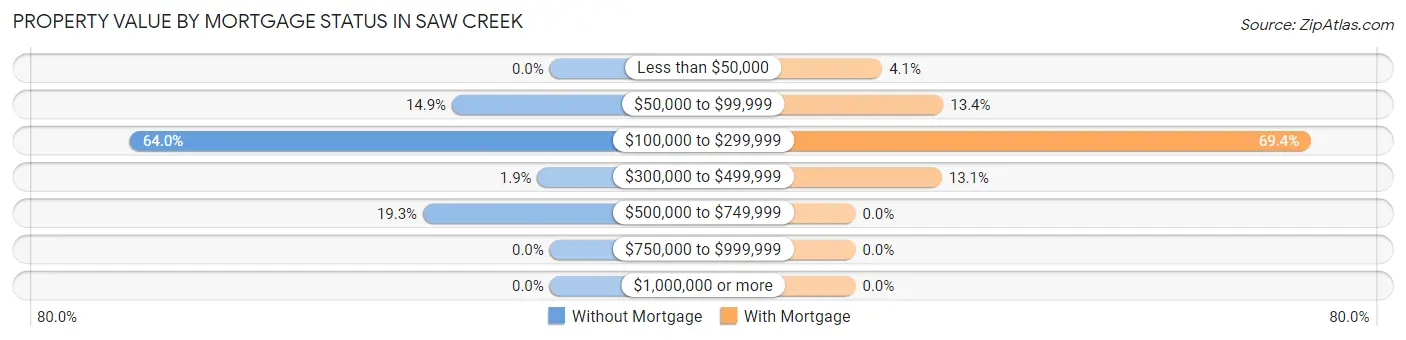
| Property Value | Without Mortgage | With Mortgage |
| Less than $50,000 | 0 (0.0%) | 34 (4.1%) |
| $50,000 to $99,999 | 64 (14.9%) | 112 (13.4%) |
| $100,000 to $299,999 | 275 (63.9%) | 581 (69.4%) |
| $300,000 to $499,999 | 8 (1.9%) | 110 (13.1%) |
| $500,000 to $749,999 | 83 (19.3%) | 0 (0.0%) |
| $750,000 to $999,999 | 0 (0.0%) | 0 (0.0%) |
| $1,000,000 or more | 0 (0.0%) | 0 (0.0%) |
| Total | 430 (100.0%) | 837 (100.0%) |
Household Income by Mortgage Status in Saw Creek
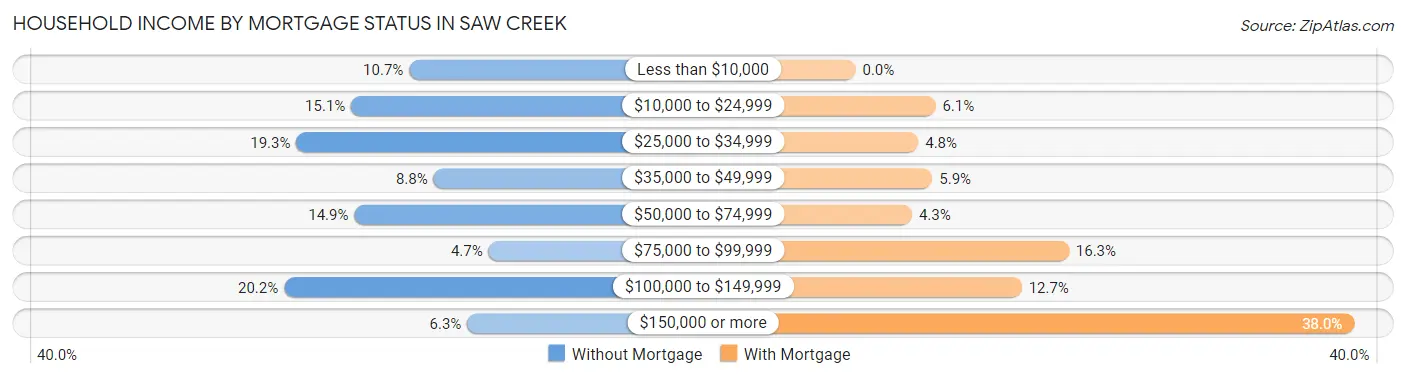
| Household Income | Without Mortgage | With Mortgage |
| Less than $10,000 | 46 (10.7%) | 0 (0.0%) |
| $10,000 to $24,999 | 65 (15.1%) | 51 (6.1%) |
| $25,000 to $34,999 | 83 (19.3%) | 40 (4.8%) |
| $35,000 to $49,999 | 38 (8.8%) | 49 (5.9%) |
| $50,000 to $74,999 | 64 (14.9%) | 36 (4.3%) |
| $75,000 to $99,999 | 20 (4.6%) | 136 (16.3%) |
| $100,000 to $149,999 | 87 (20.2%) | 106 (12.7%) |
| $150,000 or more | 27 (6.3%) | 318 (38.0%) |
| Total | 430 (100.0%) | 837 (100.0%) |
Property Value to Household Income Ratio in Saw Creek
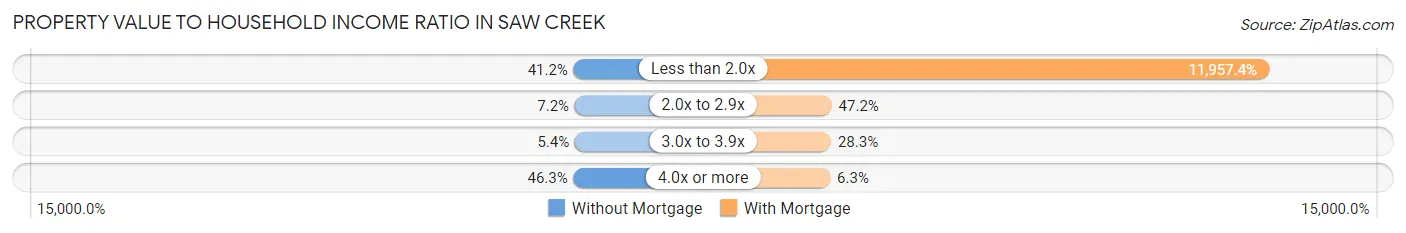
| Value-to-Income Ratio | Without Mortgage | With Mortgage |
| Less than 2.0x | 177 (41.2%) | 100,083 (11,957.3%) |
| 2.0x to 2.9x | 31 (7.2%) | 395 (47.2%) |
| 3.0x to 3.9x | 23 (5.3%) | 237 (28.3%) |
| 4.0x or more | 199 (46.3%) | 53 (6.3%) |
| Total | 430 (100.0%) | 837 (100.0%) |
Real Estate Taxes by Mortgage Status in Saw Creek
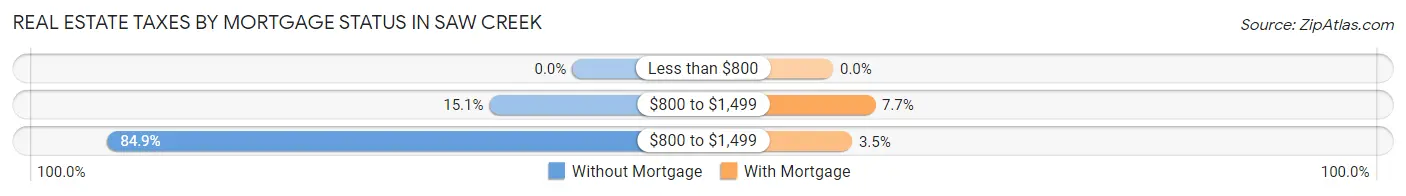
| Property Taxes | Without Mortgage | With Mortgage |
| Less than $800 | 0 (0.0%) | 0 (0.0%) |
| $800 to $1,499 | 65 (15.1%) | 64 (7.6%) |
| $800 to $1,499 | 365 (84.9%) | 29 (3.5%) |
| Total | 430 (100.0%) | 837 (100.0%) |
Health & Disability in Saw Creek
Health Insurance Coverage by Age in Saw Creek
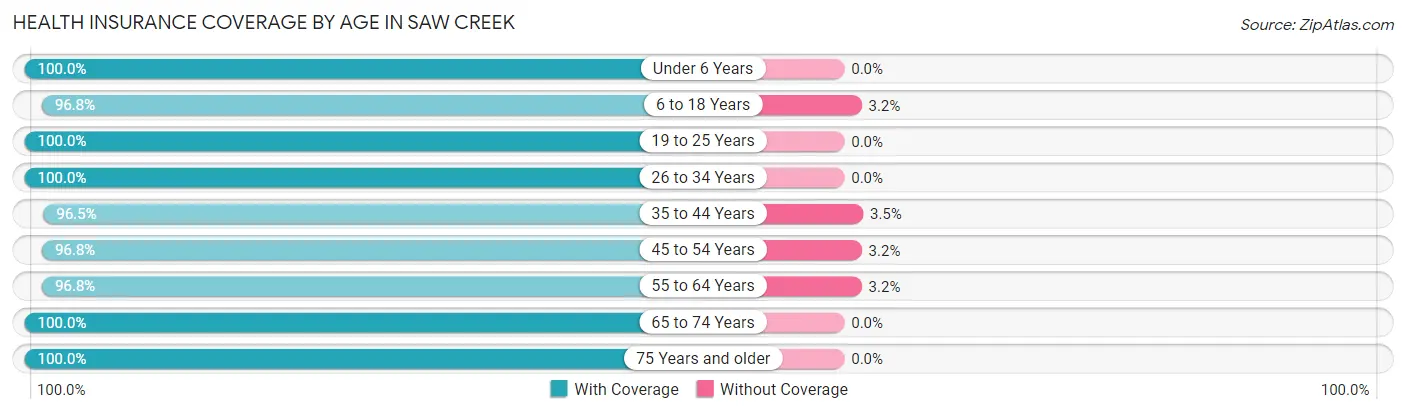
| Age Bracket | With Coverage | Without Coverage |
| Under 6 Years | 147 (100.0%) | 0 (0.0%) |
| 6 to 18 Years | 723 (96.8%) | 24 (3.2%) |
| 19 to 25 Years | 207 (100.0%) | 0 (0.0%) |
| 26 to 34 Years | 466 (100.0%) | 0 (0.0%) |
| 35 to 44 Years | 414 (96.5%) | 15 (3.5%) |
| 45 to 54 Years | 508 (96.8%) | 17 (3.2%) |
| 55 to 64 Years | 1,017 (96.8%) | 34 (3.2%) |
| 65 to 74 Years | 331 (100.0%) | 0 (0.0%) |
| 75 Years and older | 168 (100.0%) | 0 (0.0%) |
| Total | 3,981 (97.8%) | 90 (2.2%) |
Health Insurance Coverage by Citizenship Status in Saw Creek
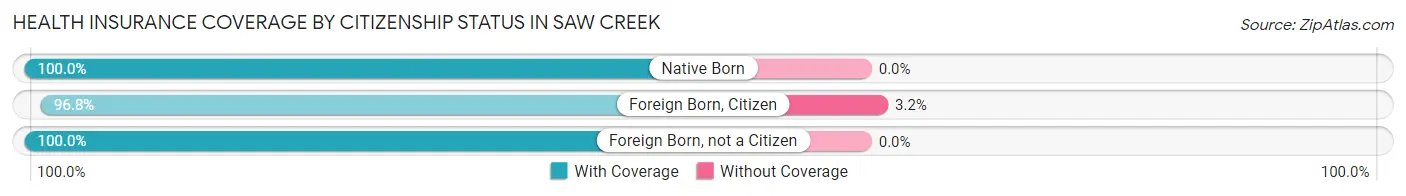
| Citizenship Status | With Coverage | Without Coverage |
| Native Born | 147 (100.0%) | 0 (0.0%) |
| Foreign Born, Citizen | 723 (96.8%) | 24 (3.2%) |
| Foreign Born, not a Citizen | 207 (100.0%) | 0 (0.0%) |
Health Insurance Coverage by Household Income in Saw Creek
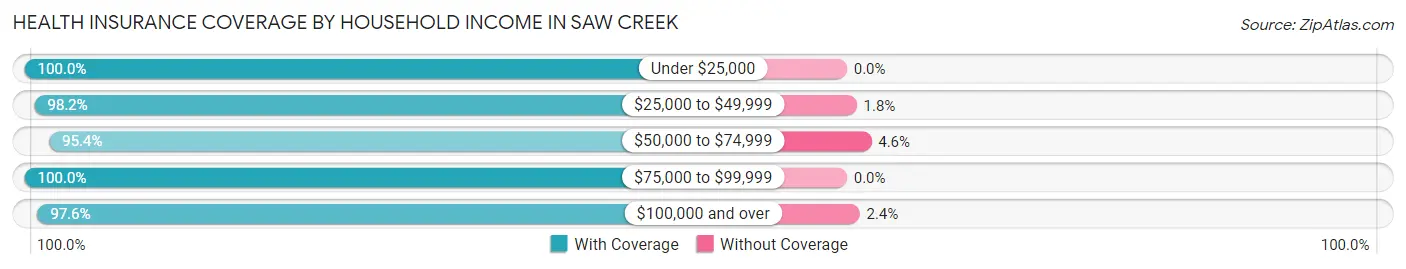
| Household Income | With Coverage | Without Coverage |
| Under $25,000 | 574 (100.0%) | 0 (0.0%) |
| $25,000 to $49,999 | 426 (98.2%) | 8 (1.8%) |
| $50,000 to $74,999 | 706 (95.4%) | 34 (4.6%) |
| $75,000 to $99,999 | 316 (100.0%) | 0 (0.0%) |
| $100,000 and over | 1,959 (97.6%) | 48 (2.4%) |
Public vs Private Health Insurance Coverage by Age in Saw Creek
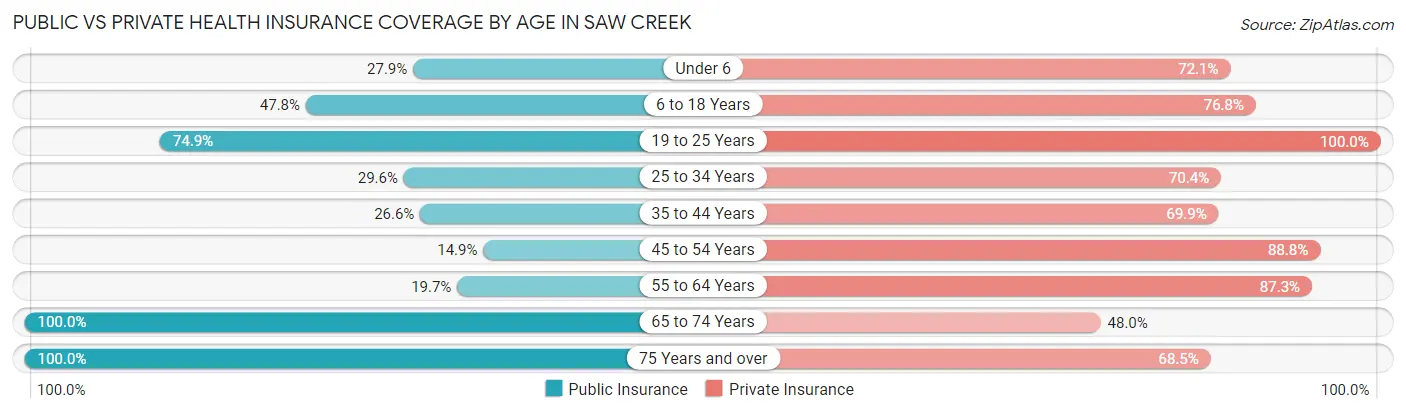
| Age Bracket | Public Insurance | Private Insurance |
| Under 6 | 41 (27.9%) | 106 (72.1%) |
| 6 to 18 Years | 357 (47.8%) | 574 (76.8%) |
| 19 to 25 Years | 155 (74.9%) | 207 (100.0%) |
| 25 to 34 Years | 138 (29.6%) | 328 (70.4%) |
| 35 to 44 Years | 114 (26.6%) | 300 (69.9%) |
| 45 to 54 Years | 78 (14.9%) | 466 (88.8%) |
| 55 to 64 Years | 207 (19.7%) | 917 (87.3%) |
| 65 to 74 Years | 331 (100.0%) | 159 (48.0%) |
| 75 Years and over | 168 (100.0%) | 115 (68.4%) |
| Total | 1,589 (39.0%) | 3,172 (77.9%) |
Disability Status by Sex by Age in Saw Creek
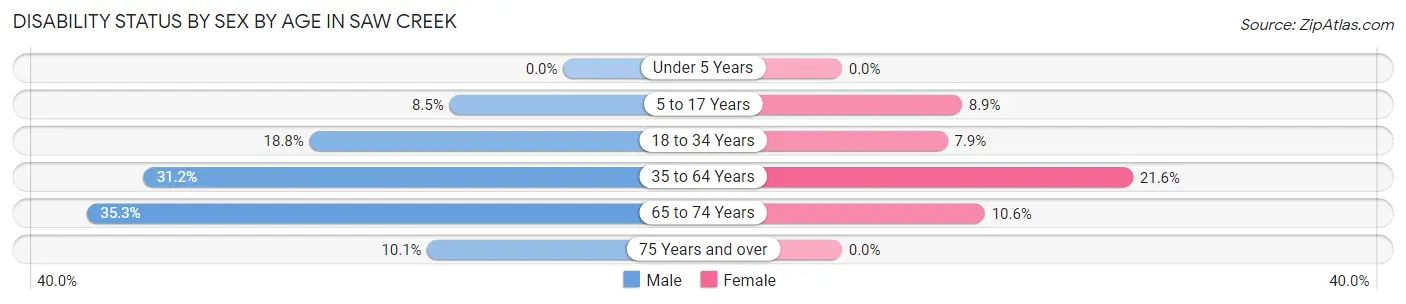
| Age Bracket | Male | Female |
| Under 5 Years | 0 (0.0%) | 0 (0.0%) |
| 5 to 17 Years | 37 (8.5%) | 23 (8.9%) |
| 18 to 34 Years | 62 (18.8%) | 31 (7.9%) |
| 35 to 64 Years | 319 (31.1%) | 212 (21.6%) |
| 65 to 74 Years | 47 (35.3%) | 21 (10.6%) |
| 75 Years and over | 11 (10.1%) | 0 (0.0%) |
Disability Class by Sex by Age in Saw Creek
Disability Class: Hearing Difficulty
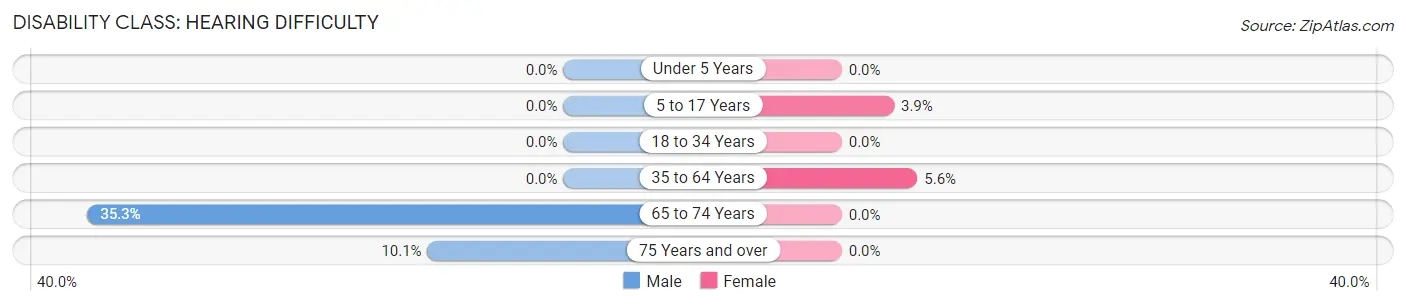
| Age Bracket | Male | Female |
| Under 5 Years | 0 (0.0%) | 0 (0.0%) |
| 5 to 17 Years | 0 (0.0%) | 10 (3.9%) |
| 18 to 34 Years | 0 (0.0%) | 0 (0.0%) |
| 35 to 64 Years | 0 (0.0%) | 55 (5.6%) |
| 65 to 74 Years | 47 (35.3%) | 0 (0.0%) |
| 75 Years and over | 11 (10.1%) | 0 (0.0%) |
Disability Class: Vision Difficulty
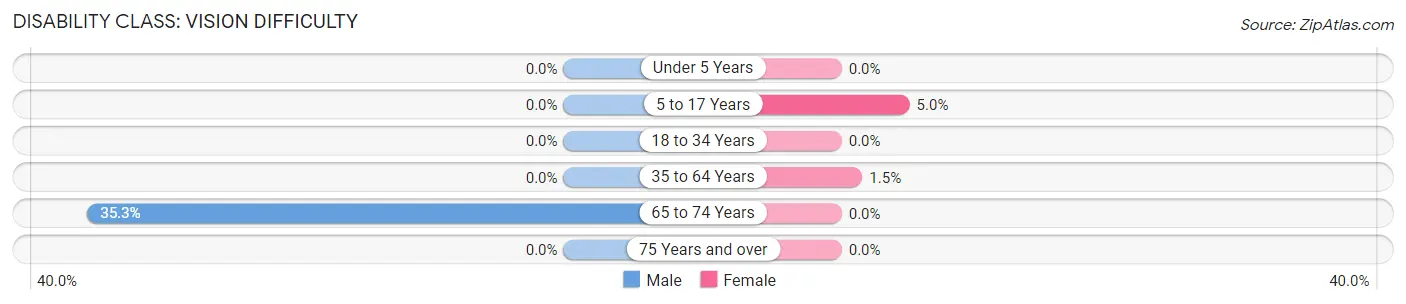
| Age Bracket | Male | Female |
| Under 5 Years | 0 (0.0%) | 0 (0.0%) |
| 5 to 17 Years | 0 (0.0%) | 13 (5.0%) |
| 18 to 34 Years | 0 (0.0%) | 0 (0.0%) |
| 35 to 64 Years | 0 (0.0%) | 15 (1.5%) |
| 65 to 74 Years | 47 (35.3%) | 0 (0.0%) |
| 75 Years and over | 0 (0.0%) | 0 (0.0%) |
Disability Class: Cognitive Difficulty
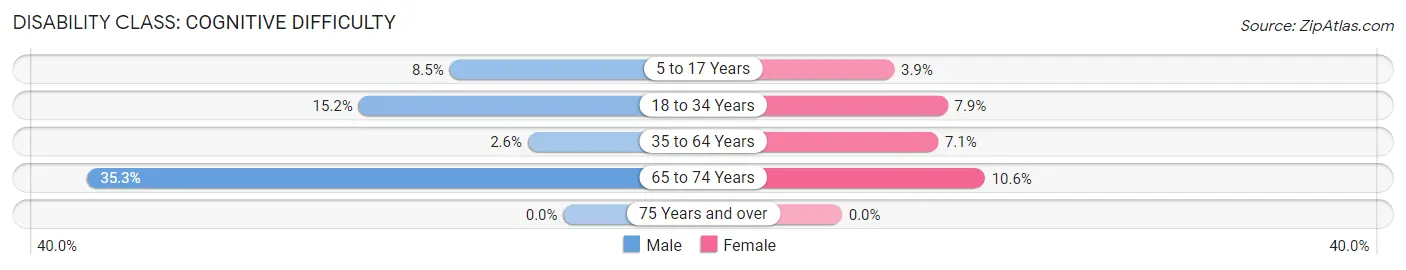
| Age Bracket | Male | Female |
| 5 to 17 Years | 37 (8.5%) | 10 (3.9%) |
| 18 to 34 Years | 50 (15.2%) | 31 (7.9%) |
| 35 to 64 Years | 27 (2.6%) | 70 (7.1%) |
| 65 to 74 Years | 47 (35.3%) | 21 (10.6%) |
| 75 Years and over | 0 (0.0%) | 0 (0.0%) |
Disability Class: Ambulatory Difficulty
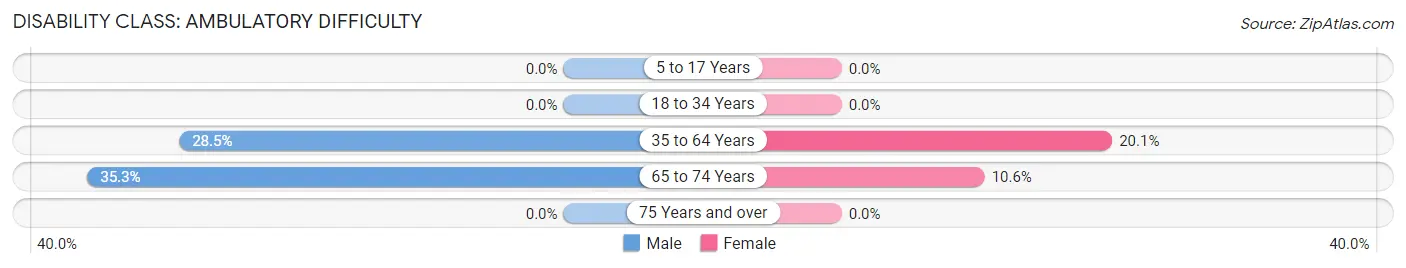
| Age Bracket | Male | Female |
| 5 to 17 Years | 0 (0.0%) | 0 (0.0%) |
| 18 to 34 Years | 0 (0.0%) | 0 (0.0%) |
| 35 to 64 Years | 292 (28.5%) | 197 (20.1%) |
| 65 to 74 Years | 47 (35.3%) | 21 (10.6%) |
| 75 Years and over | 0 (0.0%) | 0 (0.0%) |
Disability Class: Self-Care Difficulty
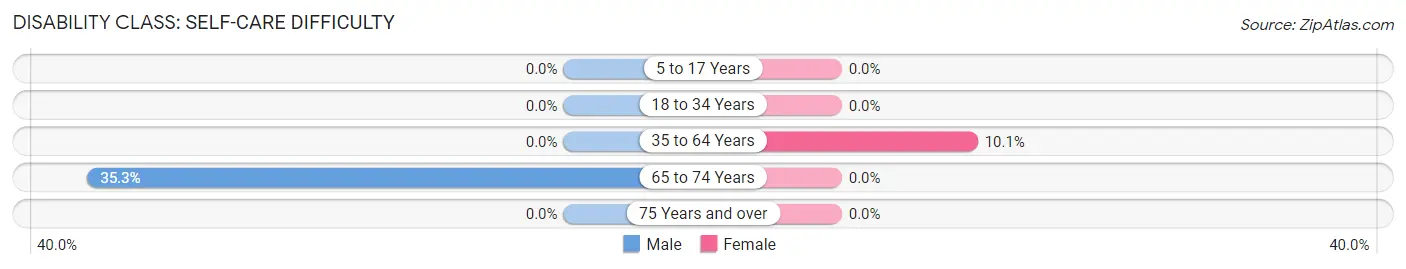
| Age Bracket | Male | Female |
| 5 to 17 Years | 0 (0.0%) | 0 (0.0%) |
| 18 to 34 Years | 0 (0.0%) | 0 (0.0%) |
| 35 to 64 Years | 0 (0.0%) | 99 (10.1%) |
| 65 to 74 Years | 47 (35.3%) | 0 (0.0%) |
| 75 Years and over | 0 (0.0%) | 0 (0.0%) |
Technology Access in Saw Creek
Computing Device Access in Saw Creek
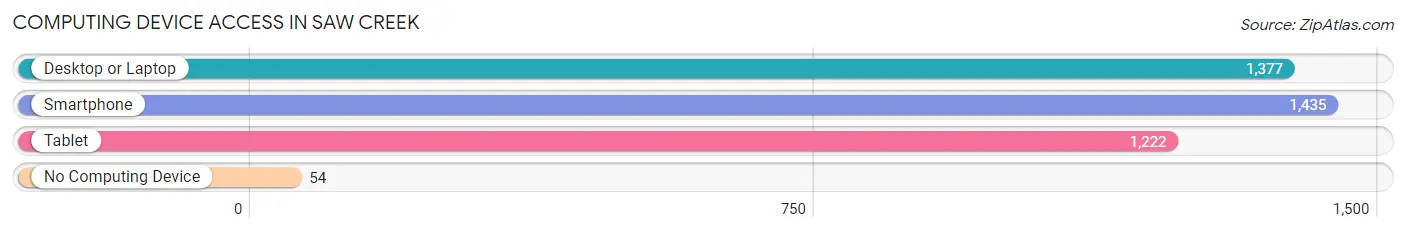
| Device Type | # Households | % Households |
| Desktop or Laptop | 1,377 | 85.9% |
| Smartphone | 1,435 | 89.5% |
| Tablet | 1,222 | 76.2% |
| No Computing Device | 54 | 3.4% |
| Total | 1,603 | 100.0% |
Internet Access in Saw Creek
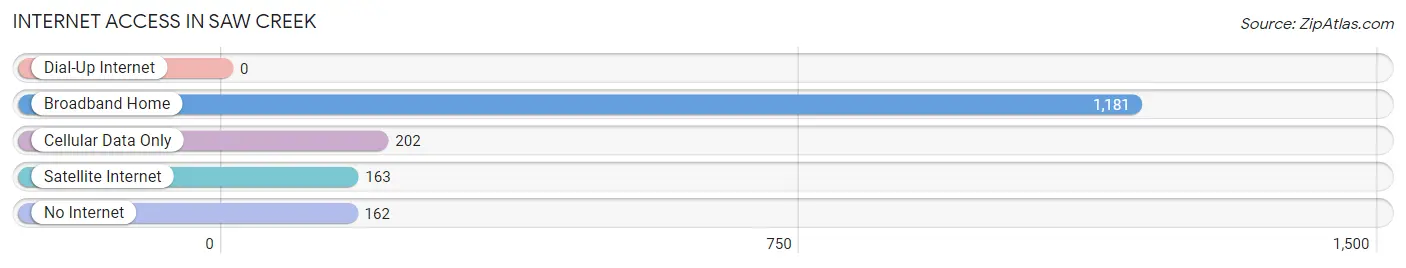
| Internet Type | # Households | % Households |
| Dial-Up Internet | 0 | 0.0% |
| Broadband Home | 1,181 | 73.7% |
| Cellular Data Only | 202 | 12.6% |
| Satellite Internet | 163 | 10.2% |
| No Internet | 162 | 10.1% |
| Total | 1,603 | 100.0% |
Saw Creek Summary
Saw Creek is a census-designated place (CDP) located in Lehman Township, Pike County, Pennsylvania. It is situated in the Pocono Mountains region of the state, and is home to a population of approximately 1,500 people. The CDP is located in the heart of the Poconos, and is surrounded by a number of popular tourist attractions, including the Delaware Water Gap National Recreation Area, Bushkill Falls, and the Pocono Raceway.
Geography
Saw Creek is located in the Pocono Mountains region of Pennsylvania, in the northeastern corner of the state. It is situated in Lehman Township, Pike County, and is bordered by the Delaware River to the east, and the towns of Bushkill and Dingmans Ferry to the south. The CDP has a total area of 4.2 square miles, all of which is land.
The terrain of Saw Creek is mostly hilly, with some flat areas. The highest point in the CDP is located at an elevation of 1,890 feet, while the lowest point is at an elevation of 1,400 feet. The climate in the area is classified as humid continental, with cold winters and warm summers.
Economy
The economy of Saw Creek is largely based on tourism. The area is home to a number of popular attractions, including the Delaware Water Gap National Recreation Area, Bushkill Falls, and the Pocono Raceway. These attractions draw visitors from all over the country, and provide a significant boost to the local economy.
In addition to tourism, Saw Creek is also home to a number of small businesses, including restaurants, retail stores, and other services. The CDP is also home to a number of manufacturing companies, which produce a variety of products, including furniture, clothing, and electronics.
Demographics
As of the 2010 census, the population of Saw Creek was 1,500. The racial makeup of the CDP was 94.7% White, 1.3% African American, 0.7% Native American, 0.7% Asian, 0.3% from other races, and 2.0% from two or more races. Hispanic or Latino of any race were 2.7% of the population.
The median household income in Saw Creek was $50,000, and the median family income was $54,000. The per capita income for the CDP was $22,000. About 8.7% of families and 11.3% of the population were below the poverty line, including 16.7% of those under age 18 and none of those age 65 or over.
History
Saw Creek was first settled in the late 1700s by a group of German immigrants. The area was originally known as “Saw Creek Settlement”, and was home to a number of small farms. In the early 1800s, the area began to grow, and a number of businesses were established, including a sawmill, a gristmill, and a tannery.
In the late 1800s, the area began to attract tourists, and a number of hotels and resorts were built in the area. The popularity of the area continued to grow, and in the early 1900s, the Delaware Water Gap National Recreation Area was established. This helped to further boost the local economy, and Saw Creek has remained a popular tourist destination ever since.
Common Questions
What is Per Capita Income in Saw Creek?
Per Capita income in Saw Creek is $35,284.
What is the Median Family Income in Saw Creek?
Median Family Income in Saw Creek is $73,558.
What is the Median Household income in Saw Creek?
Median Household Income in Saw Creek is $67,331.
What is Income or Wage Gap in Saw Creek?
Income or Wage Gap in Saw Creek is 24.7%.
Women in Saw Creek earn 75.3 cents for every dollar earned by a man.
What is Inequality or Gini Index in Saw Creek?
Inequality or Gini Index in Saw Creek is 0.39.
What is the Total Population of Saw Creek?
Total Population of Saw Creek is 4,071.
What is the Total Male Population of Saw Creek?
Total Male Population of Saw Creek is 2,101.
What is the Total Female Population of Saw Creek?
Total Female Population of Saw Creek is 1,970.
What is the Ratio of Males per 100 Females in Saw Creek?
There are 106.65 Males per 100 Females in Saw Creek.
What is the Ratio of Females per 100 Males in Saw Creek?
There are 93.76 Females per 100 Males in Saw Creek.
What is the Median Population Age in Saw Creek?
Median Population Age in Saw Creek is 46.2 Years.
What is the Average Family Size in Saw Creek
Average Family Size in Saw Creek is 3.1 People.
What is the Average Household Size in Saw Creek
Average Household Size in Saw Creek is 2.5 People.
How Large is the Labor Force in Saw Creek?
There are 2,206 People in the Labor Forcein in Saw Creek.
What is the Percentage of People in the Labor Force in Saw Creek?
61.3% of People are in the Labor Force in Saw Creek.
What is the Unemployment Rate in Saw Creek?
Unemployment Rate in Saw Creek is 12.4%.