West Grove borough, PA Map & Demographics
West Grove borough Overview
$32,787
PER CAPITA INCOME
$85,493
AVG FAMILY INCOME
$82,788
AVG HOUSEHOLD INCOME
10.9%
WAGE / INCOME GAP [ % ]
89.1¢/ $1
WAGE / INCOME GAP [ $ ]
0.36
INEQUALITY / GINI INDEX
2,784
TOTAL POPULATION
1,172
MALE POPULATION
1,612
FEMALE POPULATION
72.70
MALES / 100 FEMALES
137.54
FEMALES / 100 MALES
35.4
MEDIAN AGE
3.2
AVG FAMILY SIZE
2.9
AVG HOUSEHOLD SIZE
1,602
LABOR FORCE [ PEOPLE ]
75.0%
PERCENT IN LABOR FORCE
4.1%
UNEMPLOYMENT RATE
Income in West Grove borough
Income Overview in West Grove borough
Per Capita Income in West Grove borough is $32,787, while median incomes of families and households are $85,493 and $82,788 respectively.
| Characteristic | Number | Measure |
| Per Capita Income | 2,784 | $32,787 |
| Median Family Income | 757 | $85,493 |
| Mean Family Income | 757 | $98,141 |
| Median Household Income | 964 | $82,788 |
| Mean Household Income | 964 | $91,868 |
| Income Deficit | 757 | $0 |
| Wage / Income Gap (%) | 2,784 | 10.87% |
| Wage / Income Gap ($) | 2,784 | 89.13¢ per $1 |
| Gini / Inequality Index | 2,784 | 0.36 |
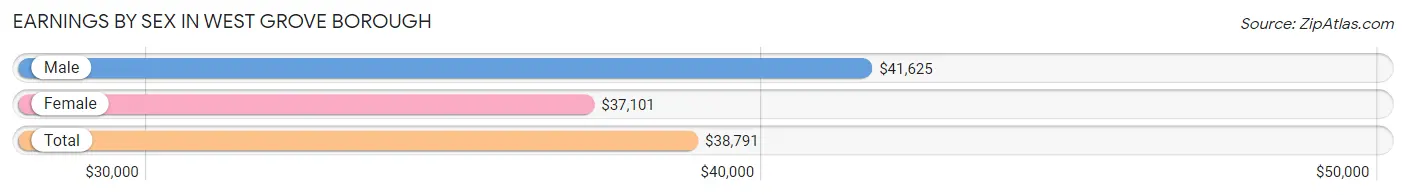
Earnings by Sex in West Grove borough
Average Earnings in West Grove borough are $38,791, $41,625 for men and $37,101 for women, a difference of 10.9%.
| Sex | Number | Average Earnings |
| Male | 696 (42.3%) | $41,625 |
| Female | 949 (57.7%) | $37,101 |
| Total | 1,645 (100.0%) | $38,791 |
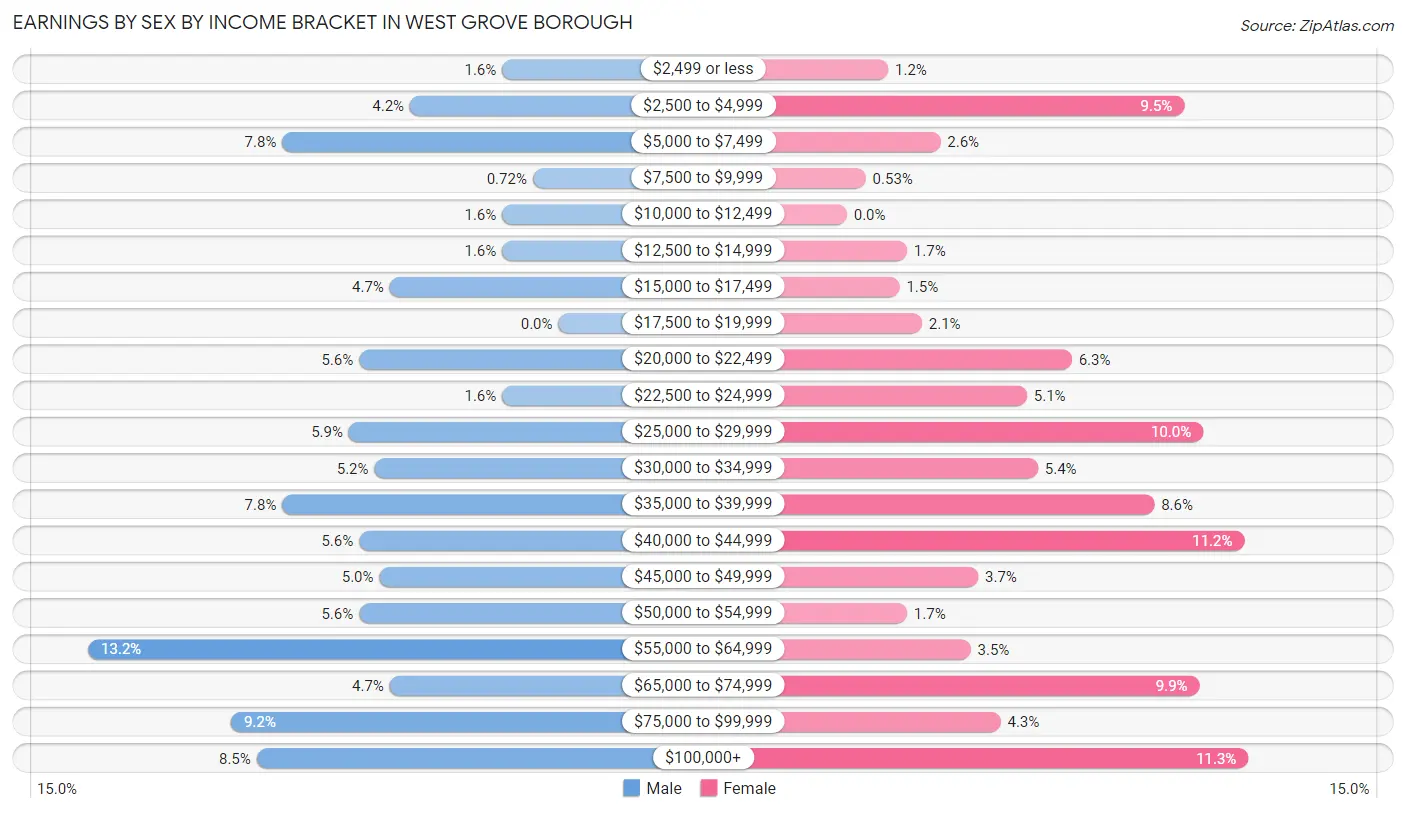
Earnings by Sex by Income Bracket in West Grove borough
The most common earnings brackets in West Grove borough are $55,000 to $64,999 for men (92 | 13.2%) and $100,000+ for women (107 | 11.3%).
| Income | Male | Female |
| $2,499 or less | 11 (1.6%) | 11 (1.2%) |
| $2,500 to $4,999 | 29 (4.2%) | 90 (9.5%) |
| $5,000 to $7,499 | 54 (7.8%) | 25 (2.6%) |
| $7,500 to $9,999 | 5 (0.7%) | 5 (0.5%) |
| $10,000 to $12,499 | 11 (1.6%) | 0 (0.0%) |
| $12,500 to $14,999 | 11 (1.6%) | 16 (1.7%) |
| $15,000 to $17,499 | 33 (4.7%) | 14 (1.5%) |
| $17,500 to $19,999 | 0 (0.0%) | 20 (2.1%) |
| $20,000 to $22,499 | 39 (5.6%) | 60 (6.3%) |
| $22,500 to $24,999 | 11 (1.6%) | 48 (5.1%) |
| $25,000 to $29,999 | 41 (5.9%) | 95 (10.0%) |
| $30,000 to $34,999 | 36 (5.2%) | 51 (5.4%) |
| $35,000 to $39,999 | 54 (7.8%) | 82 (8.6%) |
| $40,000 to $44,999 | 39 (5.6%) | 106 (11.2%) |
| $45,000 to $49,999 | 35 (5.0%) | 35 (3.7%) |
| $50,000 to $54,999 | 39 (5.6%) | 16 (1.7%) |
| $55,000 to $64,999 | 92 (13.2%) | 33 (3.5%) |
| $65,000 to $74,999 | 33 (4.7%) | 94 (9.9%) |
| $75,000 to $99,999 | 64 (9.2%) | 41 (4.3%) |
| $100,000+ | 59 (8.5%) | 107 (11.3%) |
| Total | 696 (100.0%) | 949 (100.0%) |
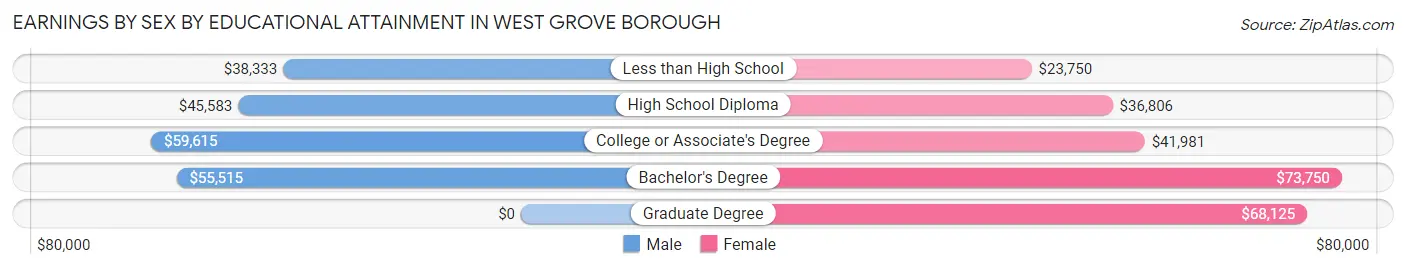
Earnings by Sex by Educational Attainment in West Grove borough
Average earnings in West Grove borough are $49,167 for men and $41,327 for women, a difference of 16.0%. Men with an educational attainment of college or associate's degree enjoy the highest average annual earnings of $59,615, while those with less than high school education earn the least with $38,333. Women with an educational attainment of bachelor's degree earn the most with the average annual earnings of $73,750, while those with less than high school education have the smallest earnings of $23,750.
| Educational Attainment | Male Income | Female Income |
| Less than High School | $38,333 | $23,750 |
| High School Diploma | $45,583 | $36,806 |
| College or Associate's Degree | $59,615 | $41,981 |
| Bachelor's Degree | $55,515 | $73,750 |
| Graduate Degree | - | - |
| Total | $49,167 | $41,327 |
Family Income in West Grove borough
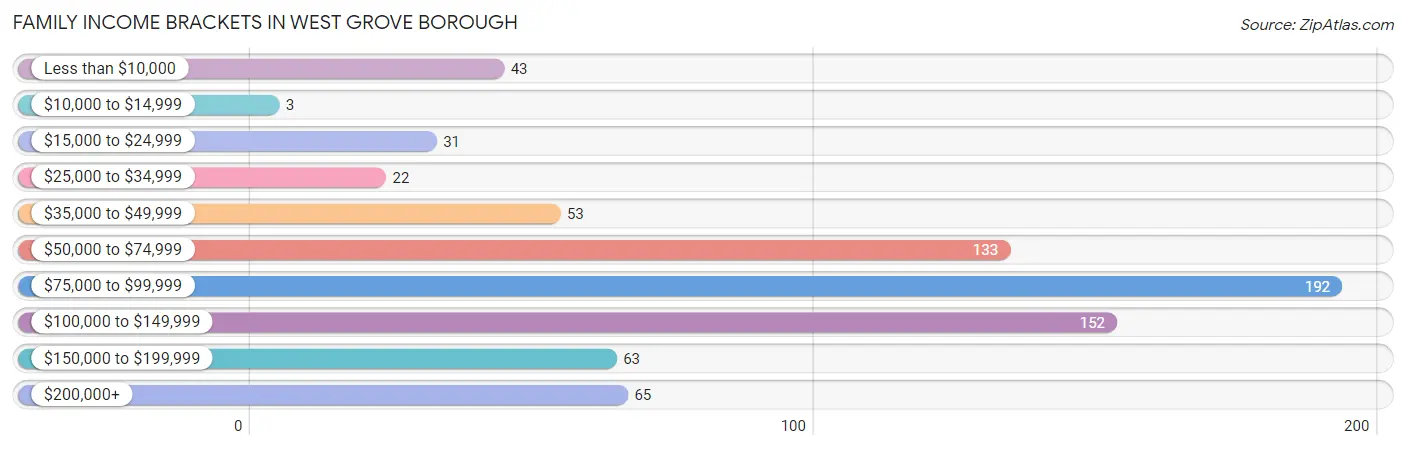
Family Income Brackets in West Grove borough
According to the West Grove borough family income data, there are 192 families falling into the $75,000 to $99,999 income range, which is the most common income bracket and makes up 25.4% of all families. Conversely, the $10,000 to $14,999 income bracket is the least frequent group with only 3 families (0.4%) belonging to this category.
| Income Bracket | # Families | % Families |
| Less than $10,000 | 43 | 5.7% |
| $10,000 to $14,999 | 3 | 0.4% |
| $15,000 to $24,999 | 31 | 4.1% |
| $25,000 to $34,999 | 22 | 2.9% |
| $35,000 to $49,999 | 53 | 7.0% |
| $50,000 to $74,999 | 133 | 17.6% |
| $75,000 to $99,999 | 192 | 25.4% |
| $100,000 to $149,999 | 152 | 20.1% |
| $150,000 to $199,999 | 63 | 8.3% |
| $200,000+ | 65 | 8.6% |
Family Income by Famaliy Size in West Grove borough
3-person families (220 | 29.1%) account for the highest median family income in West Grove borough with $99,773 per family, while 2-person families (334 | 44.1%) have the highest median income of $36,131 per family member.
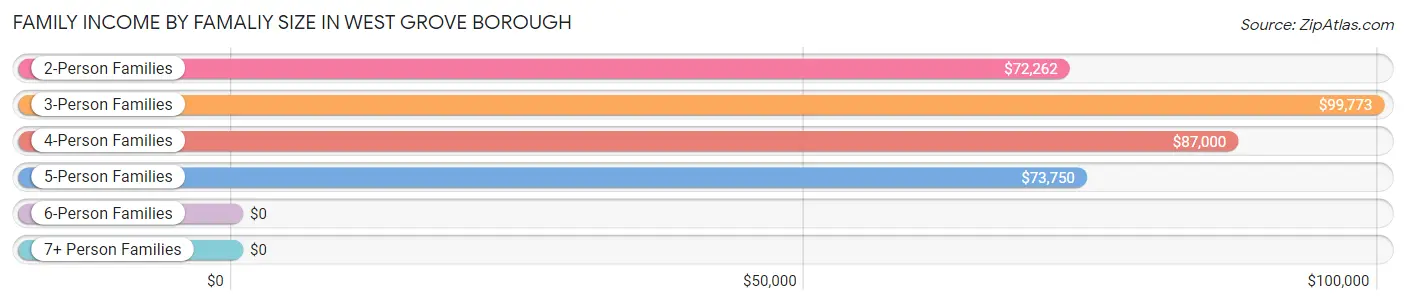
| Income Bracket | # Families | Median Income |
| 2-Person Families | 334 (44.1%) | $72,262 |
| 3-Person Families | 220 (29.1%) | $99,773 |
| 4-Person Families | 84 (11.1%) | $87,000 |
| 5-Person Families | 98 (13.0%) | $73,750 |
| 6-Person Families | 18 (2.4%) | $0 |
| 7+ Person Families | 3 (0.4%) | $0 |
| Total | 757 (100.0%) | $85,493 |
Family Income by Number of Earners in West Grove borough
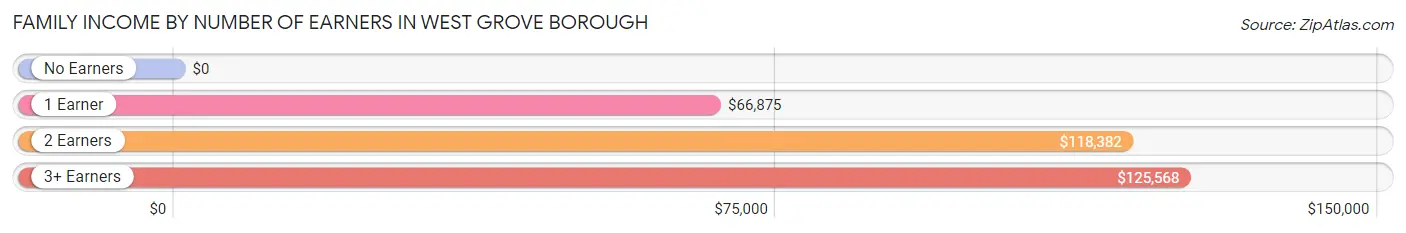
| Number of Earners | # Families | Median Income |
| No Earners | 55 (7.3%) | $0 |
| 1 Earner | 245 (32.4%) | $66,875 |
| 2 Earners | 360 (47.6%) | $118,382 |
| 3+ Earners | 97 (12.8%) | $125,568 |
| Total | 757 (100.0%) | $85,493 |
Household Income in West Grove borough
Household Income Brackets in West Grove borough
With 251 households falling in the category, the $75,000 to $99,999 income range is the most frequent in West Grove borough, accounting for 26.0% of all households. In contrast, only 9 households (0.9%) fall into the $10,000 to $14,999 income bracket, making it the least populous group.
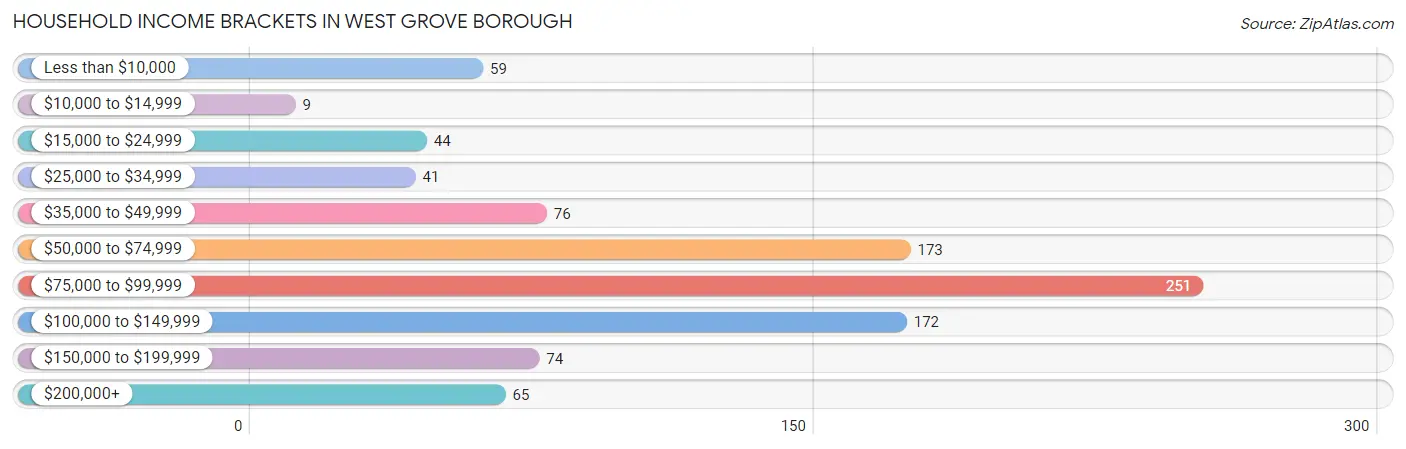
| Income Bracket | # Households | % Households |
| Less than $10,000 | 59 | 6.1% |
| $10,000 to $14,999 | 9 | 0.9% |
| $15,000 to $24,999 | 44 | 4.6% |
| $25,000 to $34,999 | 41 | 4.3% |
| $35,000 to $49,999 | 76 | 7.9% |
| $50,000 to $74,999 | 173 | 17.9% |
| $75,000 to $99,999 | 251 | 26.0% |
| $100,000 to $149,999 | 172 | 17.8% |
| $150,000 to $199,999 | 74 | 7.7% |
| $200,000+ | 65 | 6.7% |
Household Income by Householder Age in West Grove borough
The median household income in West Grove borough is $82,788, with the highest median household income of $92,593 found in the 45 to 64 years age bracket for the primary householder. A total of 382 households (39.6%) fall into this category. Meanwhile, the 15 to 24 years age bracket for the primary householder has the lowest median household income of $0, with 3 households (0.3%) in this group.
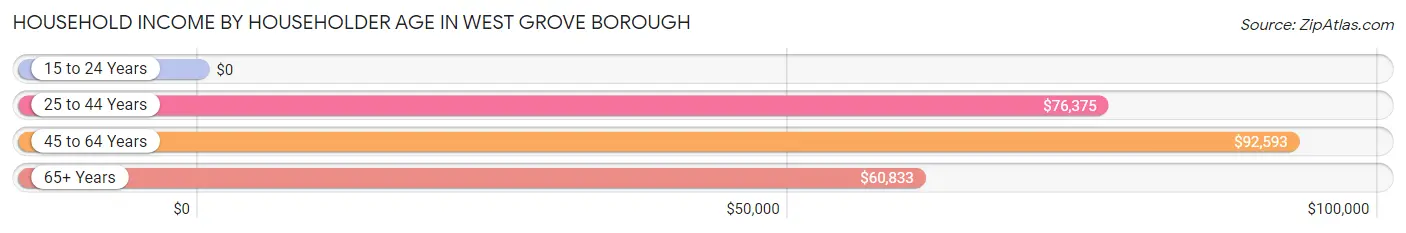
| Income Bracket | # Households | Median Income |
| 15 to 24 Years | 3 (0.3%) | $0 |
| 25 to 44 Years | 395 (41.0%) | $76,375 |
| 45 to 64 Years | 382 (39.6%) | $92,593 |
| 65+ Years | 184 (19.1%) | $60,833 |
| Total | 964 (100.0%) | $82,788 |
Poverty in West Grove borough
Income Below Poverty by Sex and Age in West Grove borough
With 5.3% poverty level for males and 11.9% for females among the residents of West Grove borough, 15 year old males and 15 year old females are the most vulnerable to poverty, with 9 males (100.0%) and 18 females (64.3%) in their respective age groups living below the poverty level.
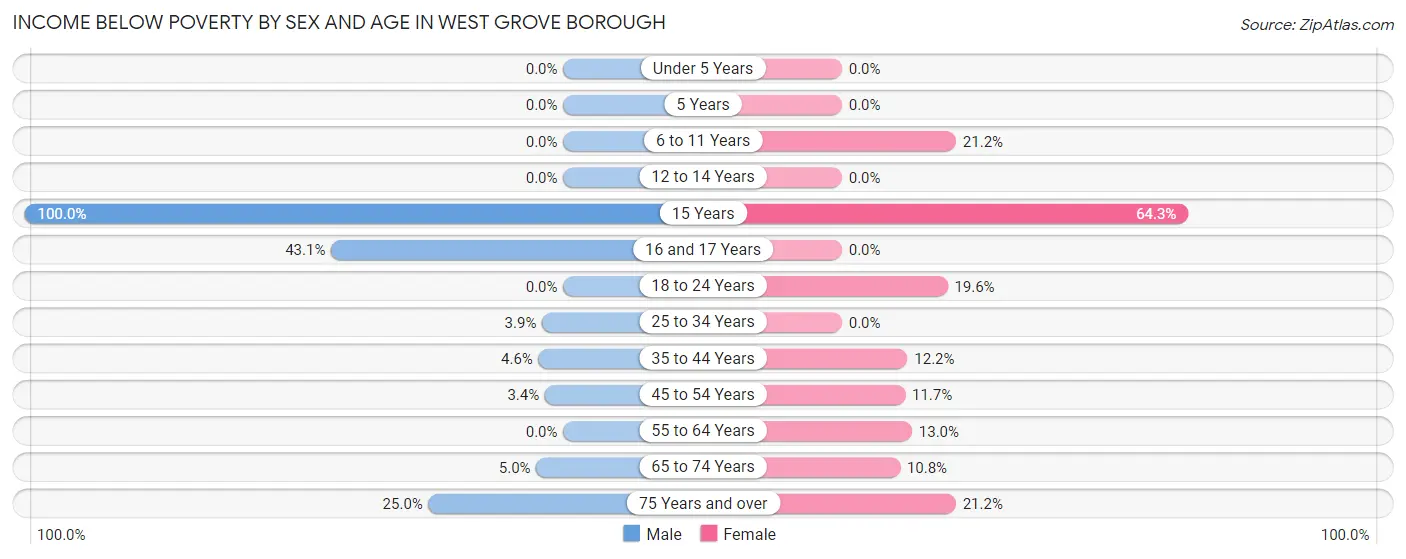
| Age Bracket | Male | Female |
| Under 5 Years | 0 (0.0%) | 0 (0.0%) |
| 5 Years | 0 (0.0%) | 0 (0.0%) |
| 6 to 11 Years | 0 (0.0%) | 36 (21.2%) |
| 12 to 14 Years | 0 (0.0%) | 0 (0.0%) |
| 15 Years | 9 (100.0%) | 18 (64.3%) |
| 16 and 17 Years | 28 (43.1%) | 0 (0.0%) |
| 18 to 24 Years | 0 (0.0%) | 30 (19.6%) |
| 25 to 34 Years | 6 (3.9%) | 0 (0.0%) |
| 35 to 44 Years | 7 (4.6%) | 32 (12.2%) |
| 45 to 54 Years | 5 (3.4%) | 31 (11.7%) |
| 55 to 64 Years | 0 (0.0%) | 19 (13.0%) |
| 65 to 74 Years | 4 (5.0%) | 15 (10.8%) |
| 75 Years and over | 3 (25.0%) | 11 (21.1%) |
| Total | 62 (5.3%) | 192 (11.9%) |
Income Above Poverty by Sex and Age in West Grove borough
According to the poverty statistics in West Grove borough, males aged under 5 years and females aged under 5 years are the age groups that are most secure financially, with 100.0% of males and 100.0% of females in these age groups living above the poverty line.
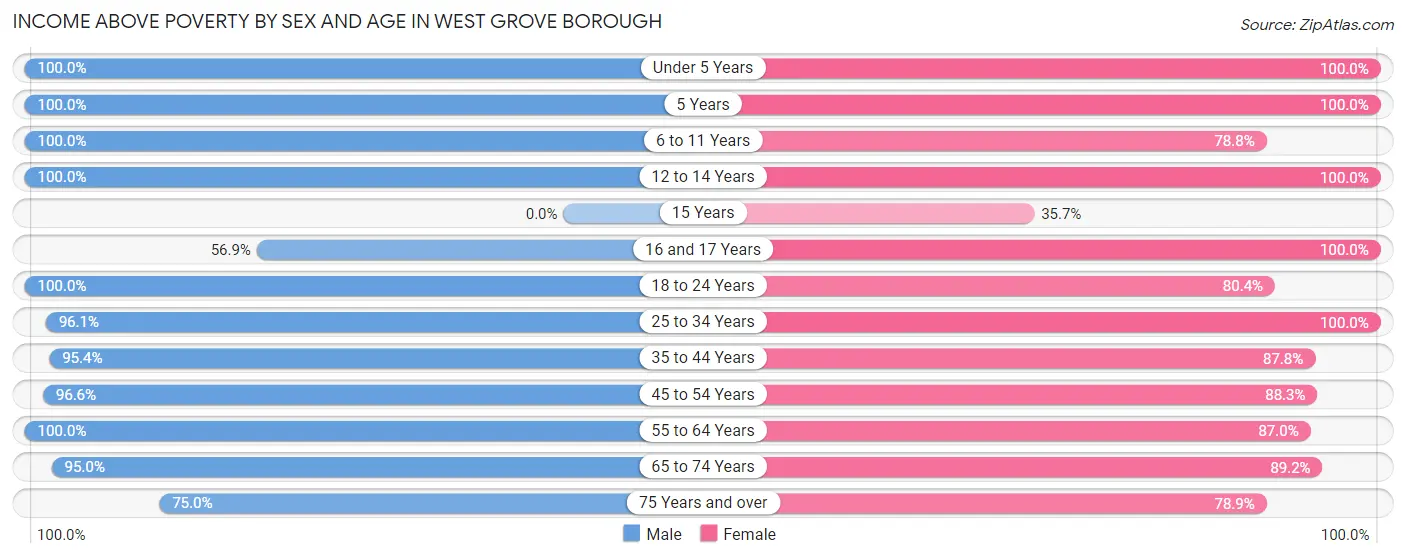
| Age Bracket | Male | Female |
| Under 5 Years | 102 (100.0%) | 97 (100.0%) |
| 5 Years | 14 (100.0%) | 5 (100.0%) |
| 6 to 11 Years | 113 (100.0%) | 134 (78.8%) |
| 12 to 14 Years | 57 (100.0%) | 53 (100.0%) |
| 15 Years | 0 (0.0%) | 10 (35.7%) |
| 16 and 17 Years | 37 (56.9%) | 42 (100.0%) |
| 18 to 24 Years | 120 (100.0%) | 123 (80.4%) |
| 25 to 34 Years | 147 (96.1%) | 200 (100.0%) |
| 35 to 44 Years | 146 (95.4%) | 231 (87.8%) |
| 45 to 54 Years | 142 (96.6%) | 233 (88.3%) |
| 55 to 64 Years | 147 (100.0%) | 127 (87.0%) |
| 65 to 74 Years | 76 (95.0%) | 124 (89.2%) |
| 75 Years and over | 9 (75.0%) | 41 (78.8%) |
| Total | 1,110 (94.7%) | 1,420 (88.1%) |
Income Below Poverty Among Married-Couple Families in West Grove borough
The poverty statistics for married-couple families in West Grove borough show that 0.7% or 3 of the total 425 families live below the poverty line. Families with no children have the highest poverty rate of 1.3%, comprising of 3 families. On the other hand, families with 1 or 2 children have the lowest poverty rate of 0.0%, which includes 0 families.
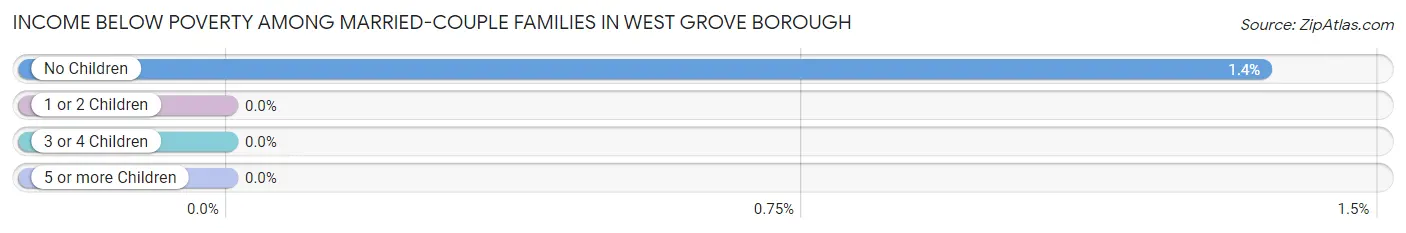
| Children | Above Poverty | Below Poverty |
| No Children | 220 (98.7%) | 3 (1.3%) |
| 1 or 2 Children | 154 (100.0%) | 0 (0.0%) |
| 3 or 4 Children | 48 (100.0%) | 0 (0.0%) |
| 5 or more Children | 0 (0.0%) | 0 (0.0%) |
| Total | 422 (99.3%) | 3 (0.7%) |
Income Below Poverty Among Single-Parent Households in West Grove borough
According to the poverty data in West Grove borough, 14.1% or 12 single-father households and 23.1% or 57 single-mother households are living below the poverty line. Among single-father households, those with 1 or 2 children have the highest poverty rate, with 12 households (25.0%) experiencing poverty. Likewise, among single-mother households, those with 3 or 4 children have the highest poverty rate, with 14 households (40.0%) falling below the poverty line.
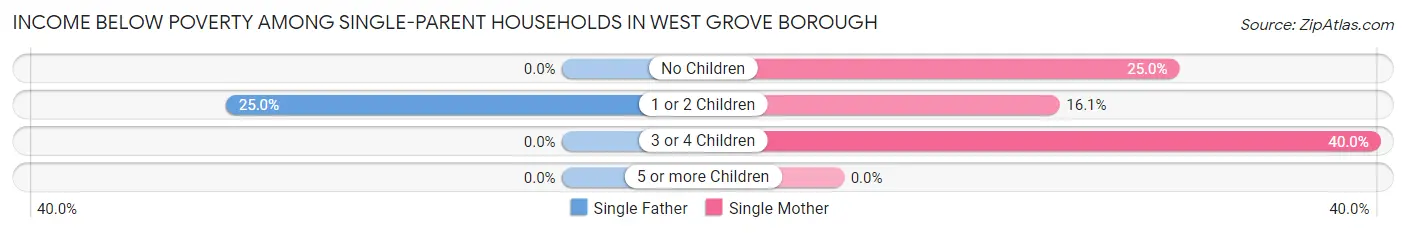
| Children | Single Father | Single Mother |
| No Children | 0 (0.0%) | 25 (25.0%) |
| 1 or 2 Children | 12 (25.0%) | 18 (16.1%) |
| 3 or 4 Children | 0 (0.0%) | 14 (40.0%) |
| 5 or more Children | 0 (0.0%) | 0 (0.0%) |
| Total | 12 (14.1%) | 57 (23.1%) |
Income Below Poverty Among Married-Couple vs Single-Parent Households in West Grove borough
The poverty data for West Grove borough shows that 3 of the married-couple family households (0.7%) and 69 of the single-parent households (20.8%) are living below the poverty level. Within the married-couple family households, those with no children have the highest poverty rate, with 3 households (1.3%) falling below the poverty line. Among the single-parent households, those with 3 or 4 children have the highest poverty rate, with 14 household (36.8%) living below poverty.
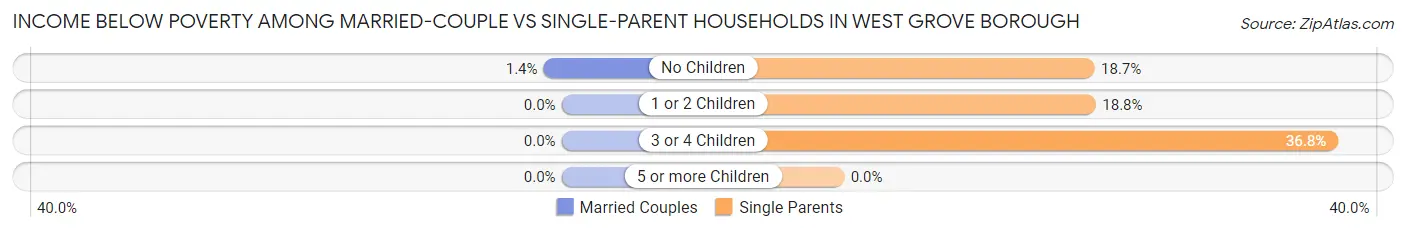
| Children | Married-Couple Families | Single-Parent Households |
| No Children | 3 (1.3%) | 25 (18.7%) |
| 1 or 2 Children | 0 (0.0%) | 30 (18.8%) |
| 3 or 4 Children | 0 (0.0%) | 14 (36.8%) |
| 5 or more Children | 0 (0.0%) | 0 (0.0%) |
| Total | 3 (0.7%) | 69 (20.8%) |
Race in West Grove borough
The most populous races in West Grove borough are White / Caucasian (1,868 | 67.1%), Hispanic or Latino (674 | 24.2%), and Two or more Races (437 | 15.7%).
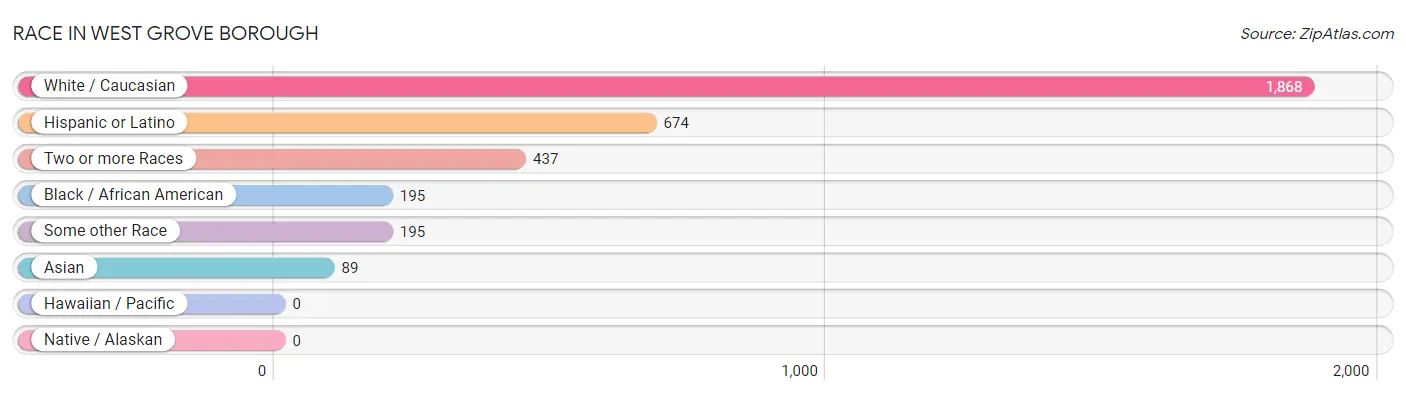
| Race | # Population | % Population |
| Asian | 89 | 3.2% |
| Black / African American | 195 | 7.0% |
| Hawaiian / Pacific | 0 | 0.0% |
| Hispanic or Latino | 674 | 24.2% |
| Native / Alaskan | 0 | 0.0% |
| White / Caucasian | 1,868 | 67.1% |
| Two or more Races | 437 | 15.7% |
| Some other Race | 195 | 7.0% |
| Total | 2,784 | 100.0% |
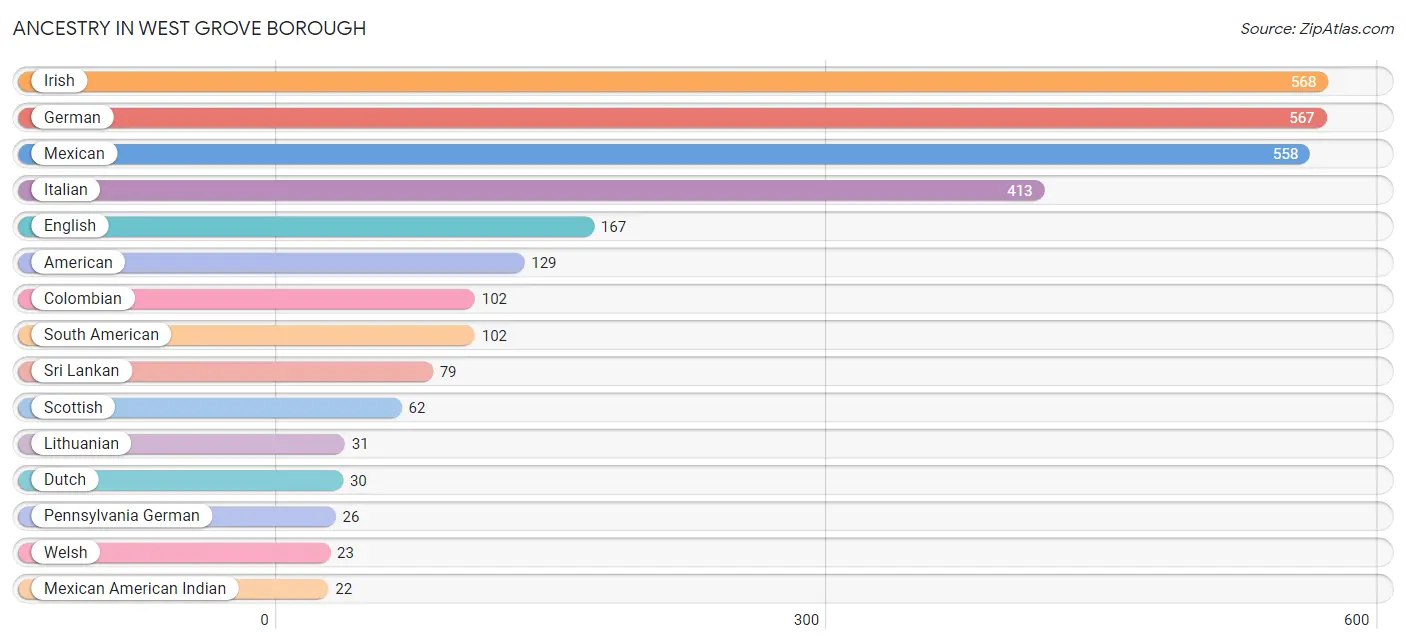
Ancestry in West Grove borough
The most populous ancestries reported in West Grove borough are Irish (568 | 20.4%), German (567 | 20.4%), Mexican (558 | 20.0%), Italian (413 | 14.8%), and English (167 | 6.0%), together accounting for 81.6% of all West Grove borough residents.
| Ancestry | # Population | % Population |
| African | 5 | 0.2% |
| Albanian | 6 | 0.2% |
| American | 129 | 4.6% |
| Arab | 9 | 0.3% |
| Bhutanese | 8 | 0.3% |
| Brazilian | 14 | 0.5% |
| British | 5 | 0.2% |
| Canadian | 4 | 0.1% |
| Cherokee | 8 | 0.3% |
| Colombian | 102 | 3.7% |
| Cypriot | 13 | 0.5% |
| Dutch | 30 | 1.1% |
| English | 167 | 6.0% |
| European | 6 | 0.2% |
| French | 18 | 0.6% |
| French Canadian | 6 | 0.2% |
| German | 567 | 20.4% |
| Hungarian | 15 | 0.5% |
| Indian (Asian) | 10 | 0.4% |
| Irish | 568 | 20.4% |
| Italian | 413 | 14.8% |
| Latvian | 5 | 0.2% |
| Lithuanian | 31 | 1.1% |
| Mexican | 558 | 20.0% |
| Mexican American Indian | 22 | 0.8% |
| Northern European | 16 | 0.6% |
| Norwegian | 14 | 0.5% |
| Pennsylvania German | 26 | 0.9% |
| Polish | 16 | 0.6% |
| Puerto Rican | 14 | 0.5% |
| Russian | 13 | 0.5% |
| Scotch-Irish | 13 | 0.5% |
| Scottish | 62 | 2.2% |
| South American | 102 | 3.7% |
| Sri Lankan | 79 | 2.8% |
| Subsaharan African | 5 | 0.2% |
| Swedish | 12 | 0.4% |
| Thai | 5 | 0.2% |
| Welsh | 23 | 0.8% | View All 39 Rows |
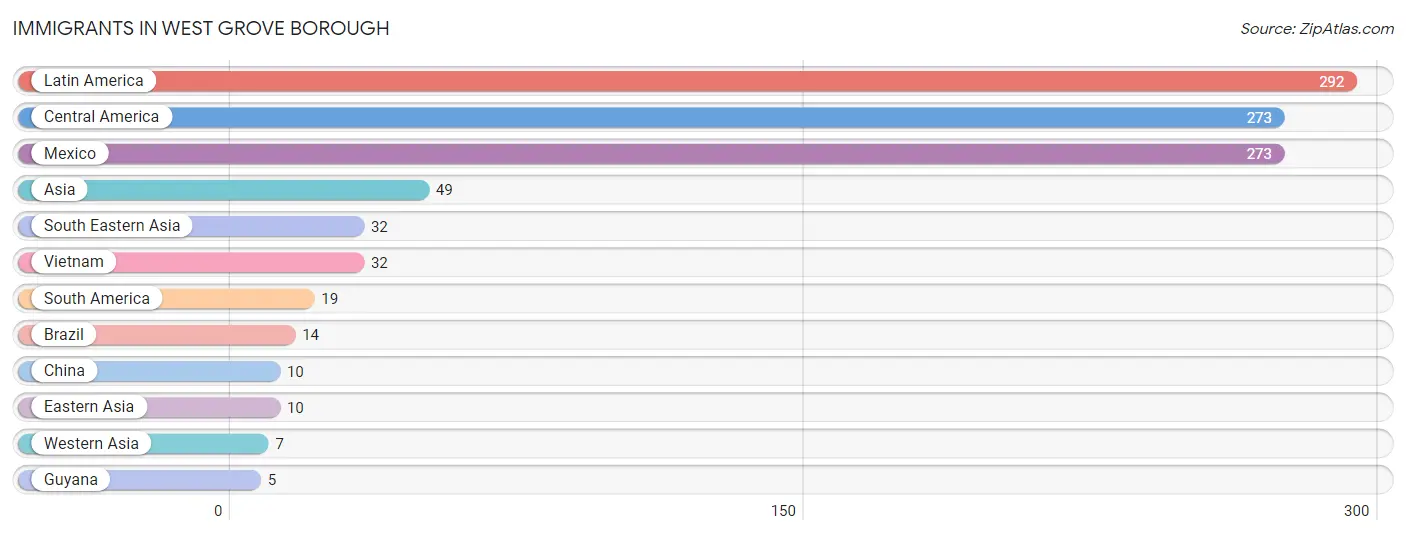
Immigrants in West Grove borough
The most numerous immigrant groups reported in West Grove borough came from Latin America (292 | 10.5%), Central America (273 | 9.8%), Mexico (273 | 9.8%), Asia (49 | 1.8%), and South Eastern Asia (32 | 1.1%), together accounting for 33.0% of all West Grove borough residents.
| Immigration Origin | # Population | % Population |
| Asia | 49 | 1.8% |
| Brazil | 14 | 0.5% |
| Central America | 273 | 9.8% |
| China | 10 | 0.4% |
| Eastern Asia | 10 | 0.4% |
| Guyana | 5 | 0.2% |
| Latin America | 292 | 10.5% |
| Mexico | 273 | 9.8% |
| South America | 19 | 0.7% |
| South Eastern Asia | 32 | 1.1% |
| Vietnam | 32 | 1.1% |
| Western Asia | 7 | 0.3% | View All 12 Rows |
Sex and Age in West Grove borough
Sex and Age in West Grove borough
The most populous age groups in West Grove borough are 20 to 24 Years (115 | 9.8%) for men and 50 to 54 Years (147 | 9.1%) for women.
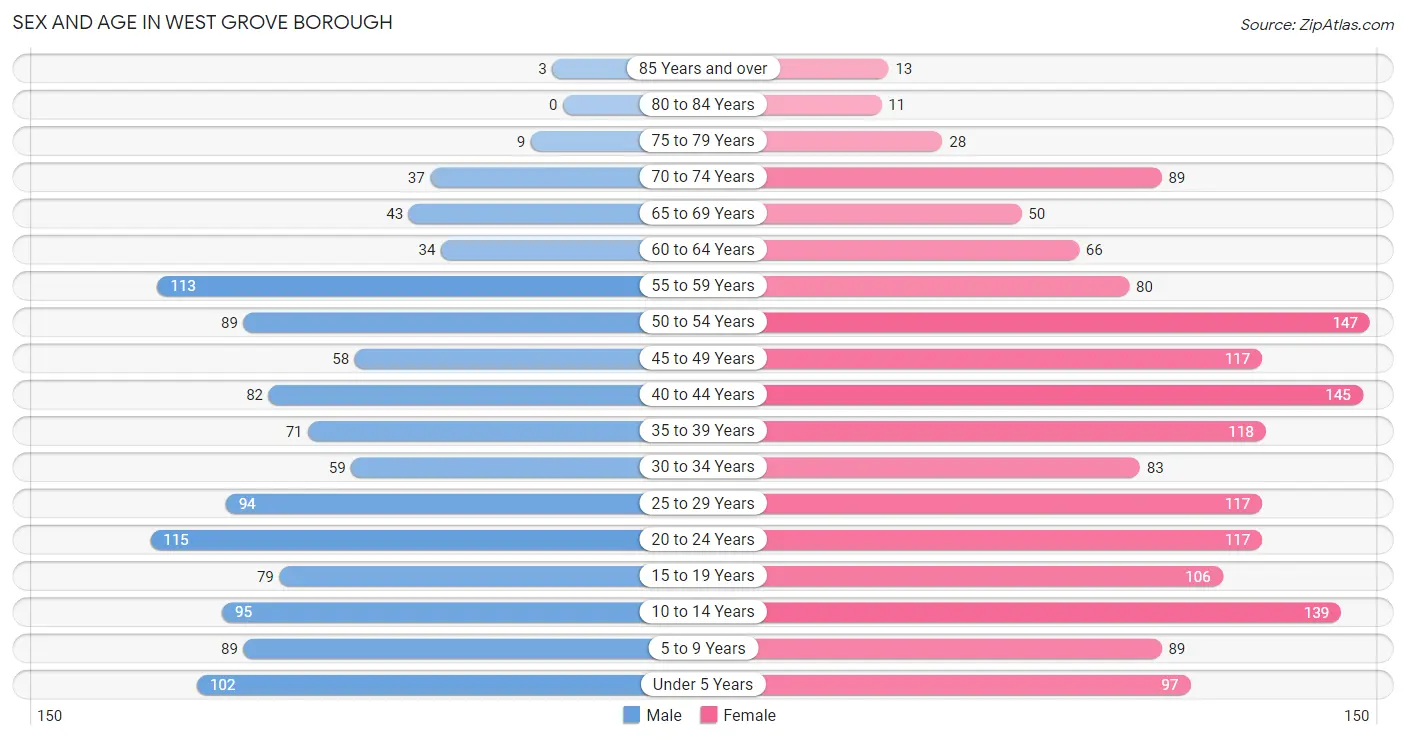
| Age Bracket | Male | Female |
| Under 5 Years | 102 (8.7%) | 97 (6.0%) |
| 5 to 9 Years | 89 (7.6%) | 89 (5.5%) |
| 10 to 14 Years | 95 (8.1%) | 139 (8.6%) |
| 15 to 19 Years | 79 (6.7%) | 106 (6.6%) |
| 20 to 24 Years | 115 (9.8%) | 117 (7.3%) |
| 25 to 29 Years | 94 (8.0%) | 117 (7.3%) |
| 30 to 34 Years | 59 (5.0%) | 83 (5.1%) |
| 35 to 39 Years | 71 (6.1%) | 118 (7.3%) |
| 40 to 44 Years | 82 (7.0%) | 145 (9.0%) |
| 45 to 49 Years | 58 (5.0%) | 117 (7.3%) |
| 50 to 54 Years | 89 (7.6%) | 147 (9.1%) |
| 55 to 59 Years | 113 (9.6%) | 80 (5.0%) |
| 60 to 64 Years | 34 (2.9%) | 66 (4.1%) |
| 65 to 69 Years | 43 (3.7%) | 50 (3.1%) |
| 70 to 74 Years | 37 (3.2%) | 89 (5.5%) |
| 75 to 79 Years | 9 (0.8%) | 28 (1.7%) |
| 80 to 84 Years | 0 (0.0%) | 11 (0.7%) |
| 85 Years and over | 3 (0.3%) | 13 (0.8%) |
| Total | 1,172 (100.0%) | 1,612 (100.0%) |
Families and Households in West Grove borough
Median Family Size in West Grove borough
The median family size in West Grove borough is 3.16 persons per family, with married-couple families (425 | 56.1%) accounting for the largest median family size of 3.25 persons per family. On the other hand, single male/father families (85 | 11.2%) represent the smallest median family size with 2.69 persons per family.
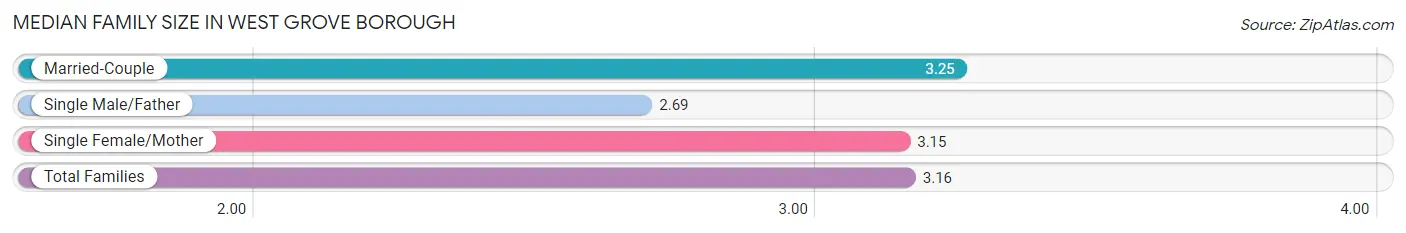
| Family Type | # Families | Family Size |
| Married-Couple | 425 (56.1%) | 3.25 |
| Single Male/Father | 85 (11.2%) | 2.69 |
| Single Female/Mother | 247 (32.6%) | 3.15 |
| Total Families | 757 (100.0%) | 3.16 |
Median Household Size in West Grove borough
The median household size in West Grove borough is 2.89 persons per household, with married-couple households (425 | 44.1%) accounting for the largest median household size of 3.28 persons per household. non-family households (207 | 21.5%) represent the smallest median household size with 1.63 persons per household.
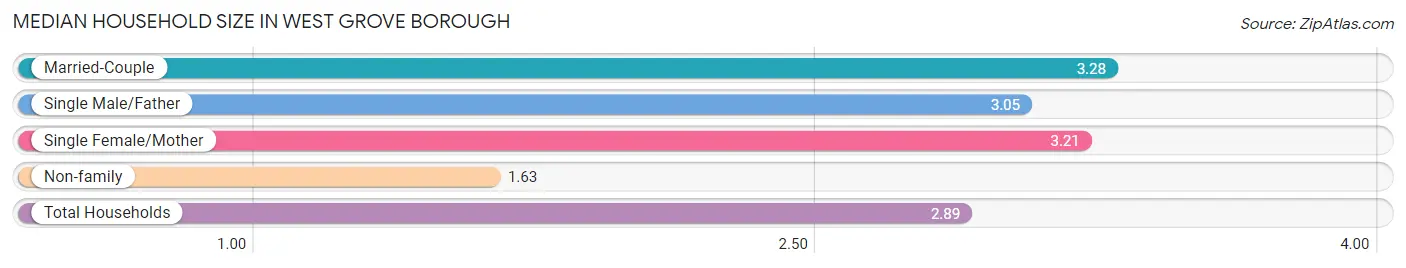
| Household Type | # Households | Household Size |
| Married-Couple | 425 (44.1%) | 3.28 |
| Single Male/Father | 85 (8.8%) | 3.05 |
| Single Female/Mother | 247 (25.6%) | 3.21 |
| Non-family | 207 (21.5%) | 1.63 |
| Total Households | 964 (100.0%) | 2.89 |
Household Size by Marriage Status in West Grove borough
Out of a total of 964 households in West Grove borough, 757 (78.5%) are family households, while 207 (21.5%) are nonfamily households. The most numerous type of family households are 2-person households, comprising 307, and the most common type of nonfamily households are 1-person households, comprising 148.
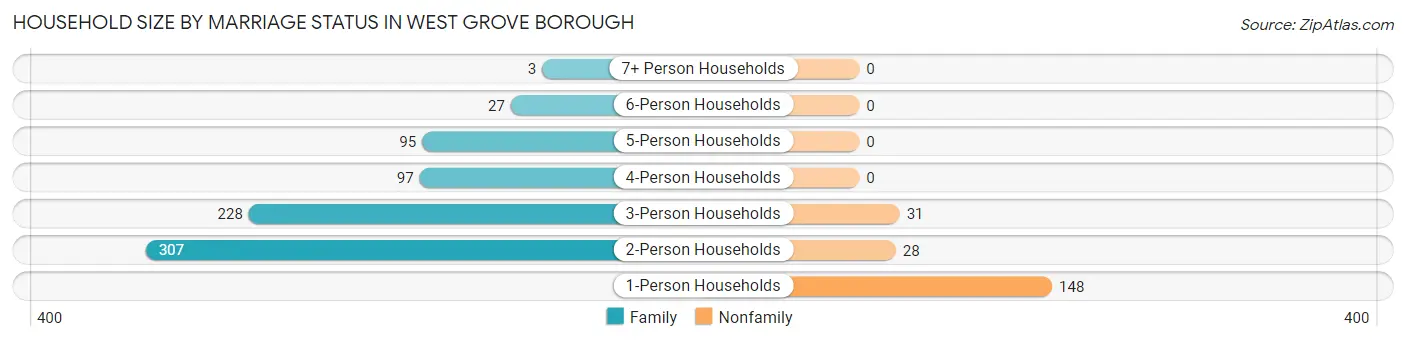
| Household Size | Family Households | Nonfamily Households |
| 1-Person Households | - | 148 (15.3%) |
| 2-Person Households | 307 (31.9%) | 28 (2.9%) |
| 3-Person Households | 228 (23.6%) | 31 (3.2%) |
| 4-Person Households | 97 (10.1%) | 0 (0.0%) |
| 5-Person Households | 95 (9.9%) | 0 (0.0%) |
| 6-Person Households | 27 (2.8%) | 0 (0.0%) |
| 7+ Person Households | 3 (0.3%) | 0 (0.0%) |
| Total | 757 (78.5%) | 207 (21.5%) |
Female Fertility in West Grove borough
Fertility by Age in West Grove borough
Average fertility rate in West Grove borough is 144.0 births per 1,000 women. Women in the age bracket of 20 to 34 years have the highest fertility rate with 350.0 births per 1,000 women. Women in the age bracket of 20 to 34 years acount for 93.3% of all women with births.
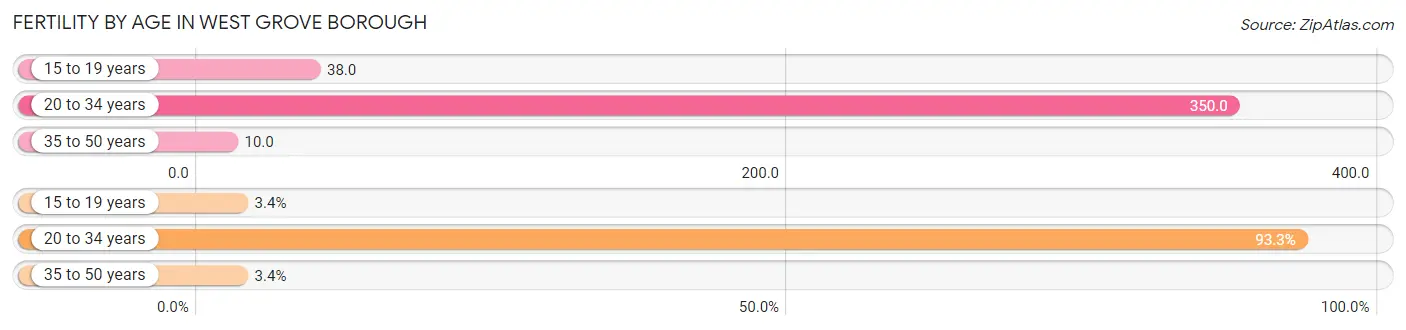
| Age Bracket | Women with Births | Births / 1,000 Women |
| 15 to 19 years | 4 (3.4%) | 38.0 |
| 20 to 34 years | 111 (93.3%) | 350.0 |
| 35 to 50 years | 4 (3.4%) | 10.0 |
| Total | 119 (100.0%) | 144.0 |
Fertility by Age by Marriage Status in West Grove borough
47.1% of women with births (119) in West Grove borough are married. The highest percentage of unmarried women with births falls into 15 to 19 years age bracket with 100.0% of them unmarried at the time of birth, while the lowest percentage of unmarried women with births belong to 35 to 50 years age bracket with 0.0% of them unmarried.
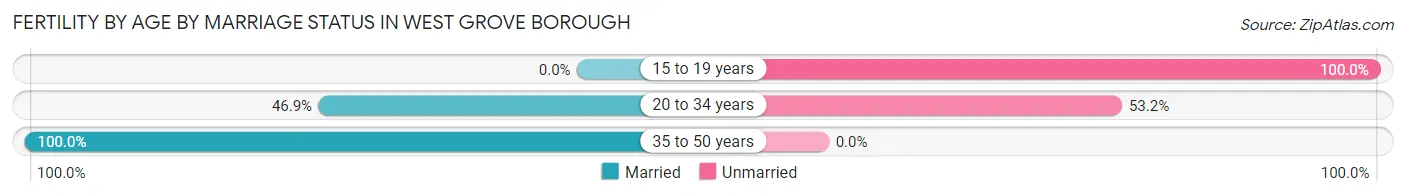
| Age Bracket | Married | Unmarried |
| 15 to 19 years | 0 (0.0%) | 4 (100.0%) |
| 20 to 34 years | 52 (46.9%) | 59 (53.1%) |
| 35 to 50 years | 4 (100.0%) | 0 (0.0%) |
| Total | 56 (47.1%) | 63 (52.9%) |
Fertility by Education in West Grove borough
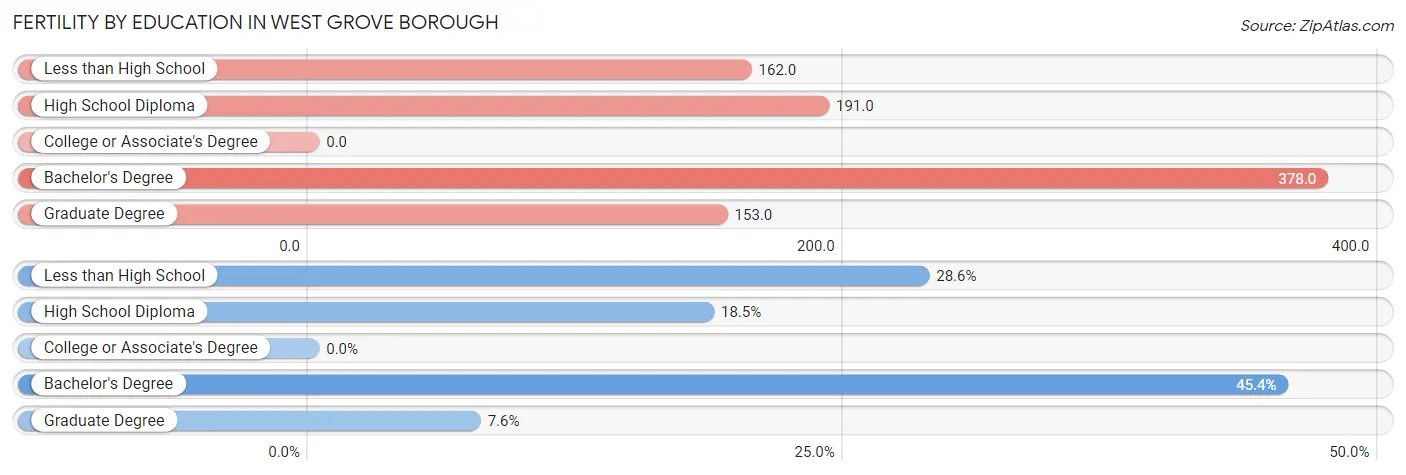
| Educational Attainment | Women with Births | Births / 1,000 Women |
| Less than High School | 34 (28.6%) | 162.0 |
| High School Diploma | 22 (18.5%) | 191.0 |
| College or Associate's Degree | 0 (0.0%) | 0.0 |
| Bachelor's Degree | 54 (45.4%) | 378.0 |
| Graduate Degree | 9 (7.6%) | 153.0 |
| Total | 119 (100.0%) | 144.0 |
Fertility by Education by Marriage Status in West Grove borough
52.9% of women with births in West Grove borough are unmarried. Women with the educational attainment of graduate degree are most likely to be married with 100.0% of them married at childbirth, while women with the educational attainment of high school diploma are least likely to be married with 77.3% of them unmarried at childbirth.
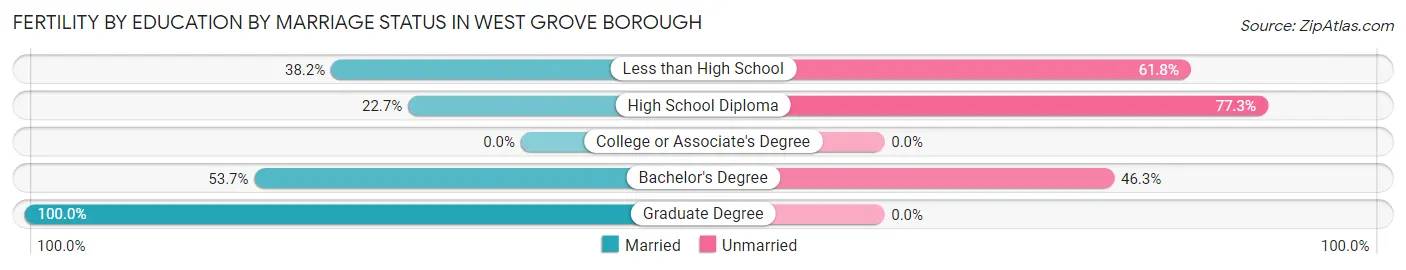
| Educational Attainment | Married | Unmarried |
| Less than High School | 13 (38.2%) | 21 (61.8%) |
| High School Diploma | 5 (22.7%) | 17 (77.3%) |
| College or Associate's Degree | 0 (0.0%) | 0 (0.0%) |
| Bachelor's Degree | 29 (53.7%) | 25 (46.3%) |
| Graduate Degree | 9 (100.0%) | 0 (0.0%) |
| Total | 56 (47.1%) | 63 (52.9%) |
Employment Characteristics in West Grove borough
Employment by Class of Employer in West Grove borough
Among the 1,526 employed individuals in West Grove borough, private company employees (976 | 64.0%), not-for-profit organizations (240 | 15.7%), and local government employees (130 | 8.5%) make up the most common classes of employment.
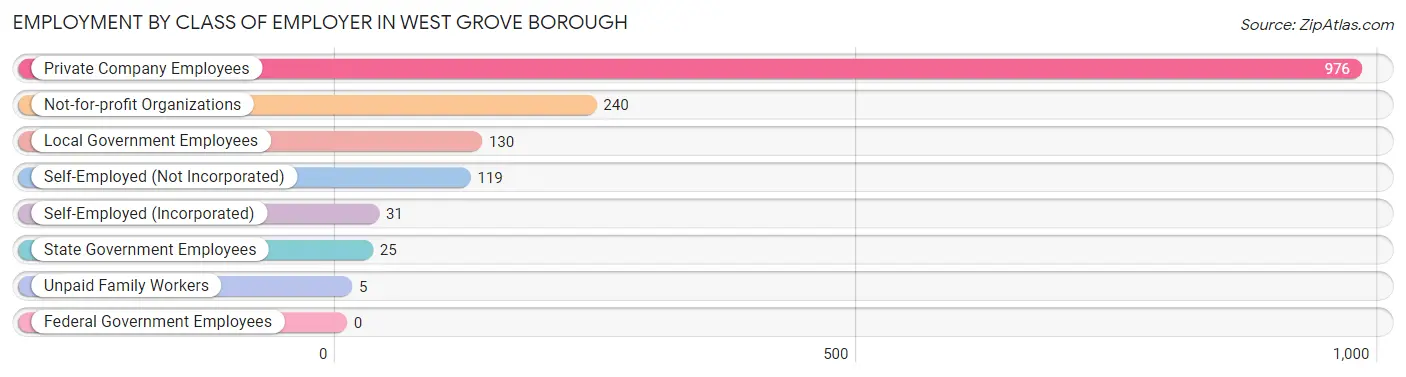
| Employer Class | # Employees | % Employees |
| Private Company Employees | 976 | 64.0% |
| Self-Employed (Incorporated) | 31 | 2.0% |
| Self-Employed (Not Incorporated) | 119 | 7.8% |
| Not-for-profit Organizations | 240 | 15.7% |
| Local Government Employees | 130 | 8.5% |
| State Government Employees | 25 | 1.6% |
| Federal Government Employees | 0 | 0.0% |
| Unpaid Family Workers | 5 | 0.3% |
| Total | 1,526 | 100.0% |
Employment Status by Age in West Grove borough
According to the labor force statistics for West Grove borough, out of the total population over 16 years of age (2,136), 75.0% or 1,602 individuals are in the labor force, with 4.1% or 66 of them unemployed. The age group with the highest labor force participation rate is 25 to 29 years, with 100.0% or 211 individuals in the labor force. Within the labor force, the 55 to 59 years age range has the highest percentage of unemployed individuals, with 11.6% or 18 of them being unemployed.
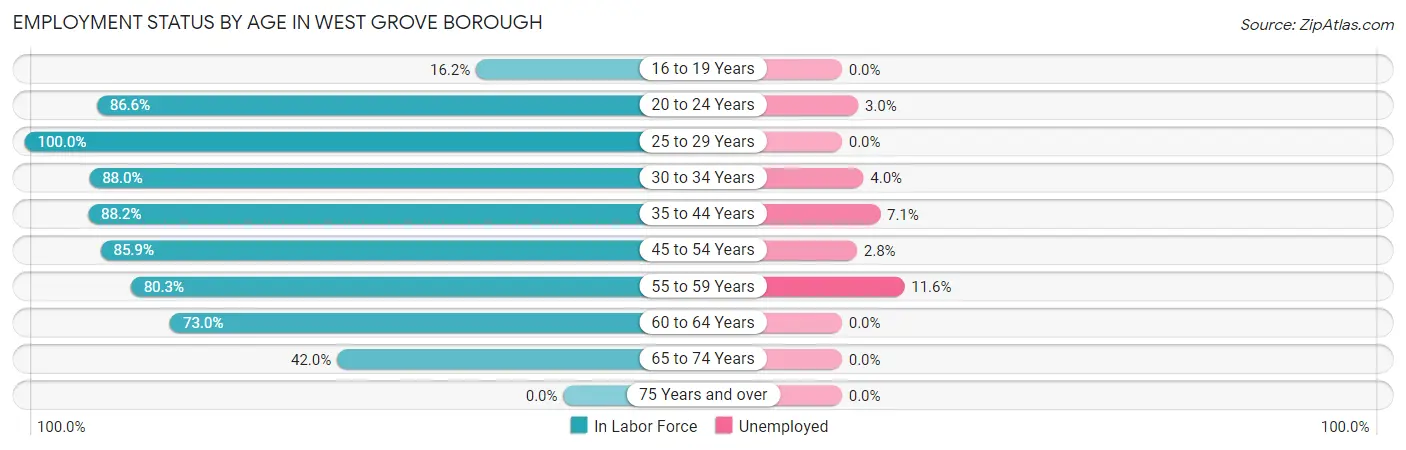
| Age Bracket | In Labor Force | Unemployed |
| 16 to 19 Years | 24 (16.2%) | 0 (0.0%) |
| 20 to 24 Years | 201 (86.6%) | 6 (3.0%) |
| 25 to 29 Years | 211 (100.0%) | 0 (0.0%) |
| 30 to 34 Years | 125 (88.0%) | 5 (4.0%) |
| 35 to 44 Years | 367 (88.2%) | 26 (7.1%) |
| 45 to 54 Years | 353 (85.9%) | 10 (2.8%) |
| 55 to 59 Years | 155 (80.3%) | 18 (11.6%) |
| 60 to 64 Years | 73 (73.0%) | 0 (0.0%) |
| 65 to 74 Years | 92 (42.0%) | 0 (0.0%) |
| 75 Years and over | 0 (0.0%) | 0 (0.0%) |
| Total | 1,602 (75.0%) | 66 (4.1%) |
Employment Status by Educational Attainment in West Grove borough
According to labor force statistics for West Grove borough, 87.2% of individuals (1,284) out of the total population between 25 and 64 years of age (1,473) are in the labor force, with 4.6% or 59 of them being unemployed. The group with the highest labor force participation rate are those with the educational attainment of bachelor's degree or higher, with 93.6% or 393 individuals in the labor force. Within the labor force, individuals with less than high school education have the highest percentage of unemployment, with 8.2% or 15 of them being unemployed.
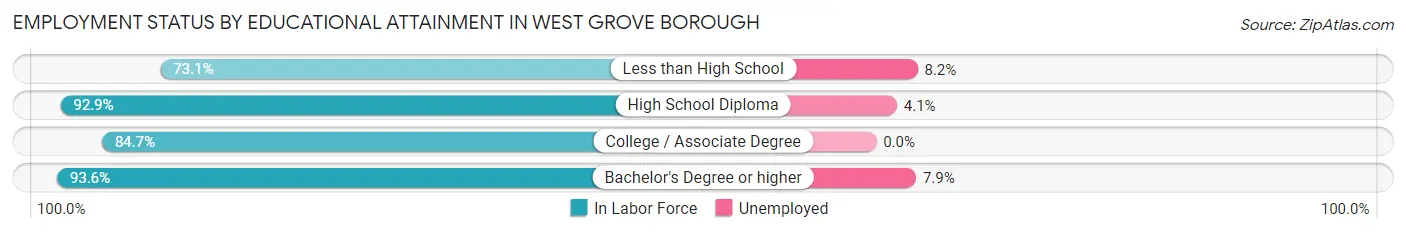
| Educational Attainment | In Labor Force | Unemployed |
| Less than High School | 182 (73.1%) | 20 (8.2%) |
| High School Diploma | 316 (92.9%) | 14 (4.1%) |
| College / Associate Degree | 393 (84.7%) | 0 (0.0%) |
| Bachelor's Degree or higher | 393 (93.6%) | 33 (7.9%) |
| Total | 1,284 (87.2%) | 68 (4.6%) |
Employment Occupations by Sex in West Grove borough
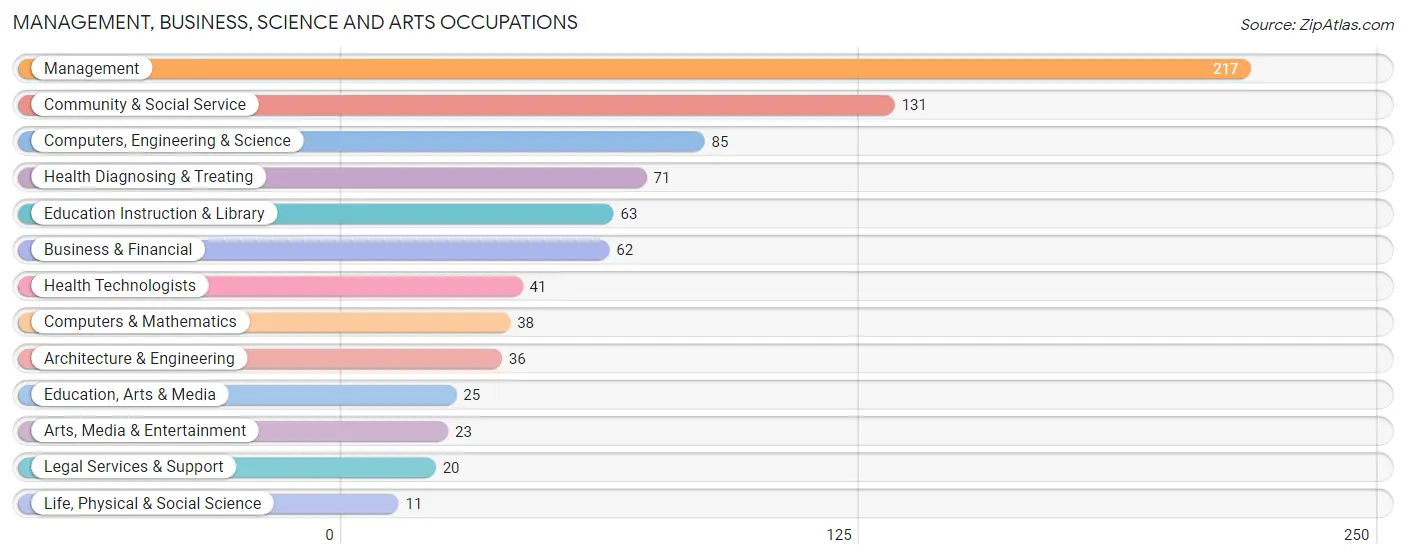
Management, Business, Science and Arts Occupations
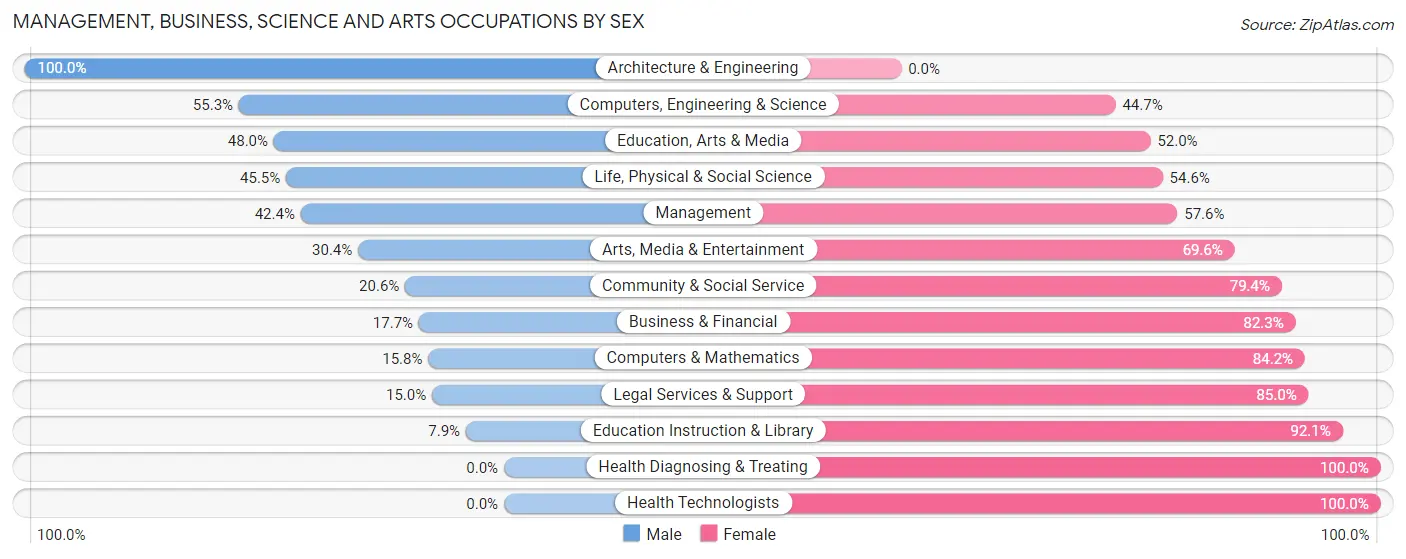
The most common Management, Business, Science and Arts occupations in West Grove borough are Management (217 | 14.1%), Community & Social Service (131 | 8.5%), Computers, Engineering & Science (85 | 5.5%), Health Diagnosing & Treating (71 | 4.6%), and Education Instruction & Library (63 | 4.1%).
Management, Business, Science and Arts Occupations by Sex
Within the Management, Business, Science and Arts occupations in West Grove borough, the most male-oriented occupations are Architecture & Engineering (100.0%), Computers, Engineering & Science (55.3%), and Education, Arts & Media (48.0%), while the most female-oriented occupations are Health Diagnosing & Treating (100.0%), Health Technologists (100.0%), and Education Instruction & Library (92.1%).
| Occupation | Male | Female |
| Management | 92 (42.4%) | 125 (57.6%) |
| Business & Financial | 11 (17.7%) | 51 (82.3%) |
| Computers, Engineering & Science | 47 (55.3%) | 38 (44.7%) |
| Computers & Mathematics | 6 (15.8%) | 32 (84.2%) |
| Architecture & Engineering | 36 (100.0%) | 0 (0.0%) |
| Life, Physical & Social Science | 5 (45.5%) | 6 (54.5%) |
| Community & Social Service | 27 (20.6%) | 104 (79.4%) |
| Education, Arts & Media | 12 (48.0%) | 13 (52.0%) |
| Legal Services & Support | 3 (15.0%) | 17 (85.0%) |
| Education Instruction & Library | 5 (7.9%) | 58 (92.1%) |
| Arts, Media & Entertainment | 7 (30.4%) | 16 (69.6%) |
| Health Diagnosing & Treating | 0 (0.0%) | 71 (100.0%) |
| Health Technologists | 0 (0.0%) | 41 (100.0%) |
| Total (Category) | 177 (31.3%) | 389 (68.7%) |
| Total (Overall) | 642 (41.8%) | 894 (58.2%) |
Services Occupations
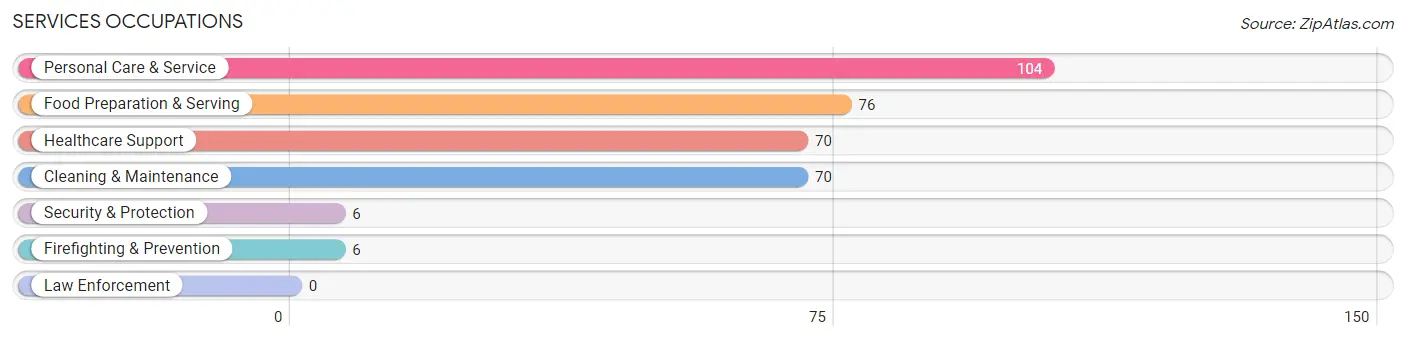
The most common Services occupations in West Grove borough are Personal Care & Service (104 | 6.8%), Food Preparation & Serving (76 | 5.0%), Healthcare Support (70 | 4.6%), Cleaning & Maintenance (70 | 4.6%), and Security & Protection (6 | 0.4%).
Services Occupations by Sex
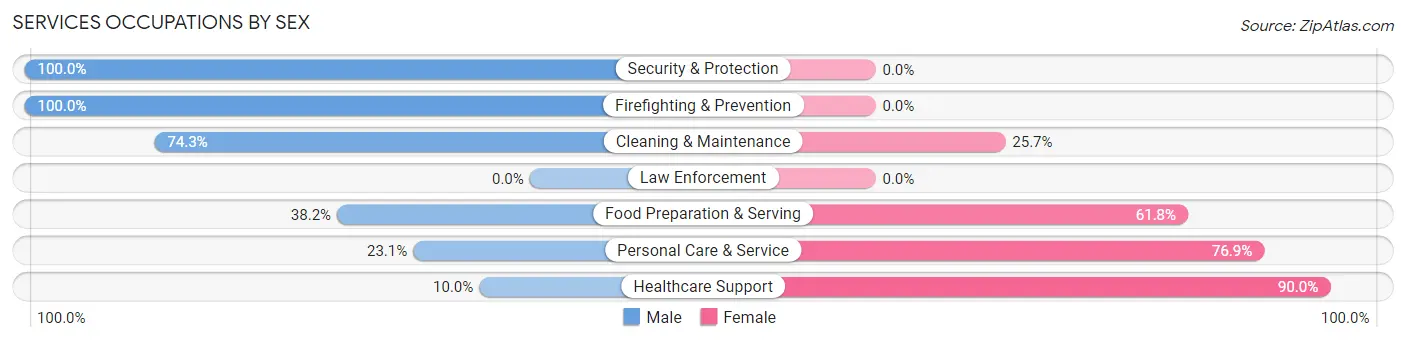
Within the Services occupations in West Grove borough, the most male-oriented occupations are Security & Protection (100.0%), Firefighting & Prevention (100.0%), and Cleaning & Maintenance (74.3%), while the most female-oriented occupations are Healthcare Support (90.0%), Personal Care & Service (76.9%), and Food Preparation & Serving (61.8%).
| Occupation | Male | Female |
| Healthcare Support | 7 (10.0%) | 63 (90.0%) |
| Security & Protection | 6 (100.0%) | 0 (0.0%) |
| Firefighting & Prevention | 6 (100.0%) | 0 (0.0%) |
| Law Enforcement | 0 (0.0%) | 0 (0.0%) |
| Food Preparation & Serving | 29 (38.2%) | 47 (61.8%) |
| Cleaning & Maintenance | 52 (74.3%) | 18 (25.7%) |
| Personal Care & Service | 24 (23.1%) | 80 (76.9%) |
| Total (Category) | 118 (36.2%) | 208 (63.8%) |
| Total (Overall) | 642 (41.8%) | 894 (58.2%) |
Sales and Office Occupations
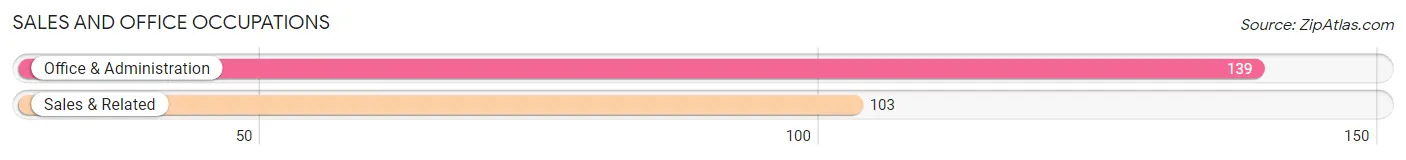
The most common Sales and Office occupations in West Grove borough are Office & Administration (139 | 9.0%), and Sales & Related (103 | 6.7%).
Sales and Office Occupations by Sex
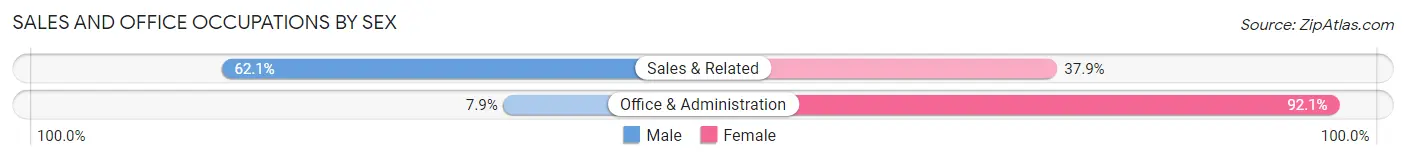
| Occupation | Male | Female |
| Sales & Related | 64 (62.1%) | 39 (37.9%) |
| Office & Administration | 11 (7.9%) | 128 (92.1%) |
| Total (Category) | 75 (31.0%) | 167 (69.0%) |
| Total (Overall) | 642 (41.8%) | 894 (58.2%) |
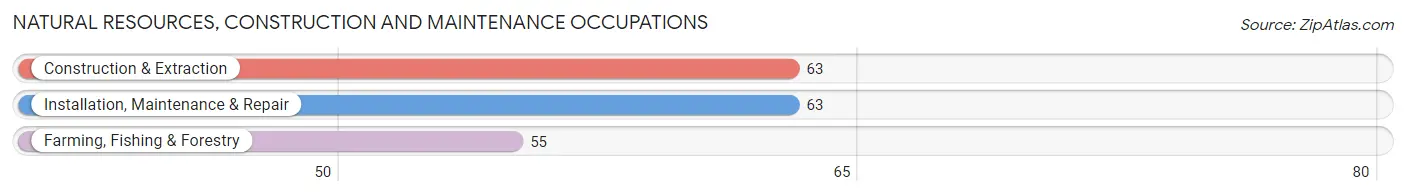
Natural Resources, Construction and Maintenance Occupations
The most common Natural Resources, Construction and Maintenance occupations in West Grove borough are Construction & Extraction (63 | 4.1%), Installation, Maintenance & Repair (63 | 4.1%), and Farming, Fishing & Forestry (55 | 3.6%).
Natural Resources, Construction and Maintenance Occupations by Sex
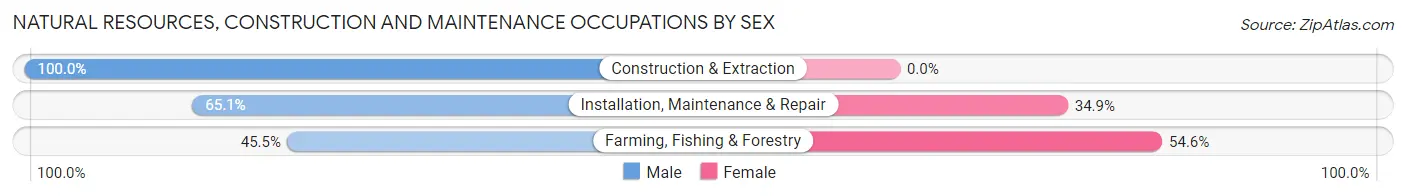
| Occupation | Male | Female |
| Farming, Fishing & Forestry | 25 (45.5%) | 30 (54.5%) |
| Construction & Extraction | 63 (100.0%) | 0 (0.0%) |
| Installation, Maintenance & Repair | 41 (65.1%) | 22 (34.9%) |
| Total (Category) | 129 (71.3%) | 52 (28.7%) |
| Total (Overall) | 642 (41.8%) | 894 (58.2%) |
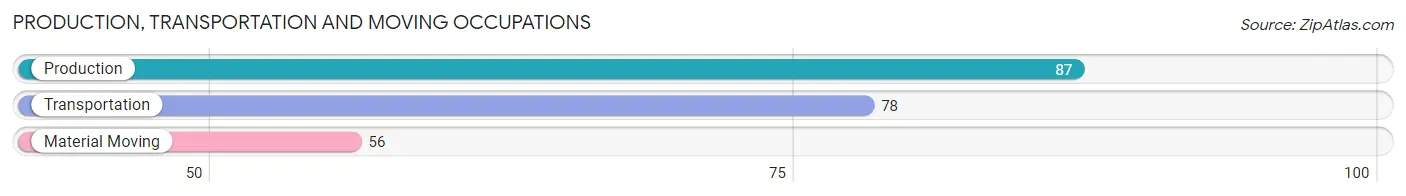
Production, Transportation and Moving Occupations
The most common Production, Transportation and Moving occupations in West Grove borough are Production (87 | 5.7%), Transportation (78 | 5.1%), and Material Moving (56 | 3.6%).
Production, Transportation and Moving Occupations by Sex
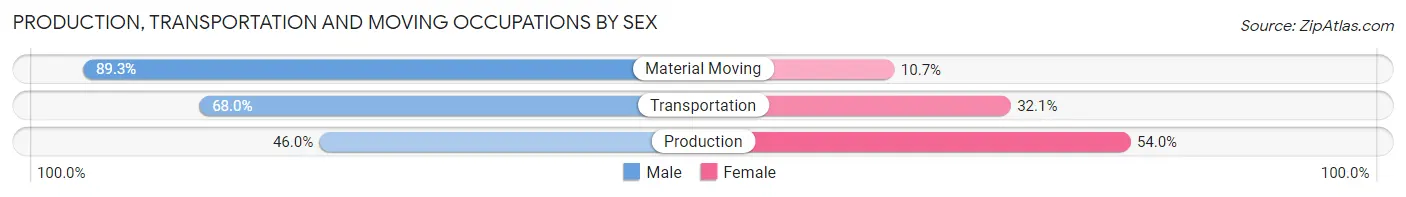
| Occupation | Male | Female |
| Production | 40 (46.0%) | 47 (54.0%) |
| Transportation | 53 (67.9%) | 25 (32.1%) |
| Material Moving | 50 (89.3%) | 6 (10.7%) |
| Total (Category) | 143 (64.7%) | 78 (35.3%) |
| Total (Overall) | 642 (41.8%) | 894 (58.2%) |
Employment Industries by Sex in West Grove borough
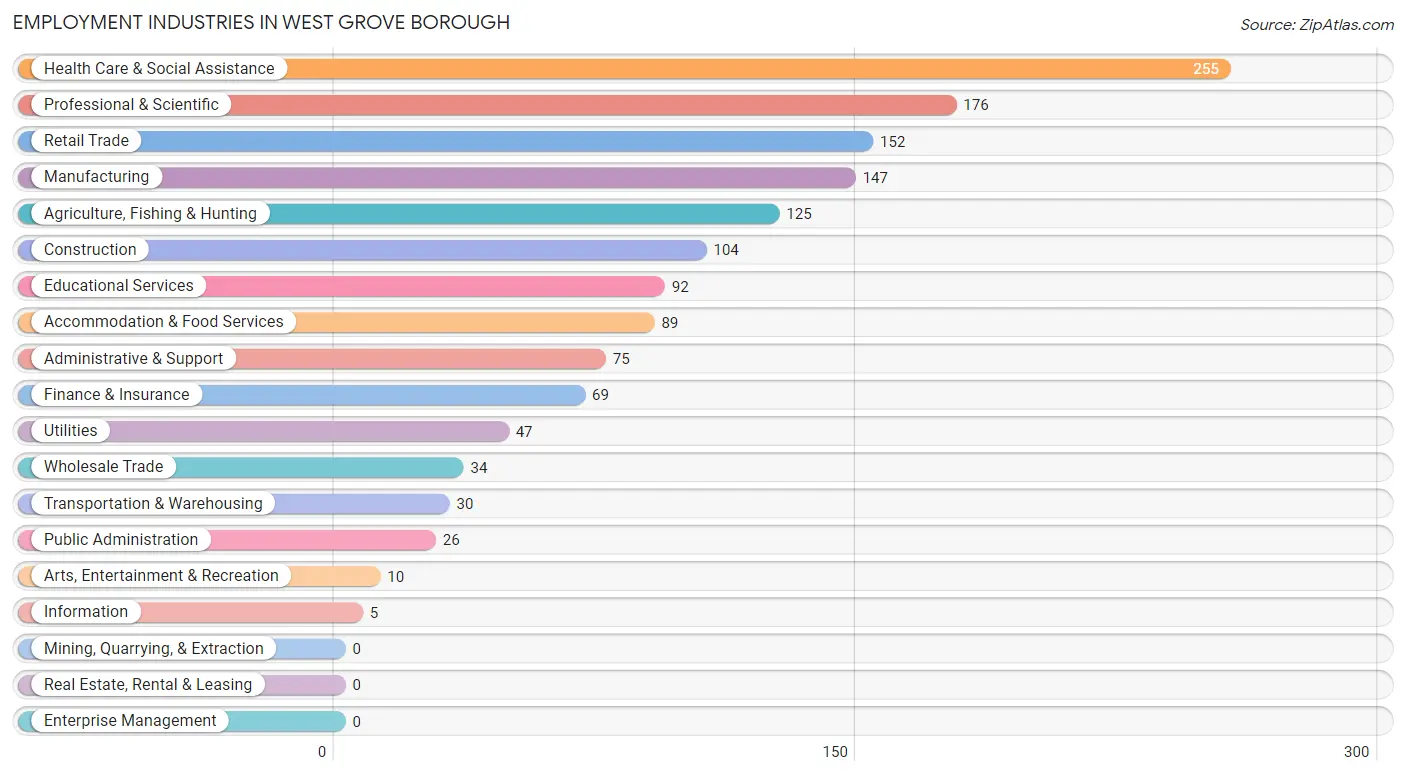
Employment Industries in West Grove borough
The major employment industries in West Grove borough include Health Care & Social Assistance (255 | 16.6%), Professional & Scientific (176 | 11.5%), Retail Trade (152 | 9.9%), Manufacturing (147 | 9.6%), and Agriculture, Fishing & Hunting (125 | 8.1%).
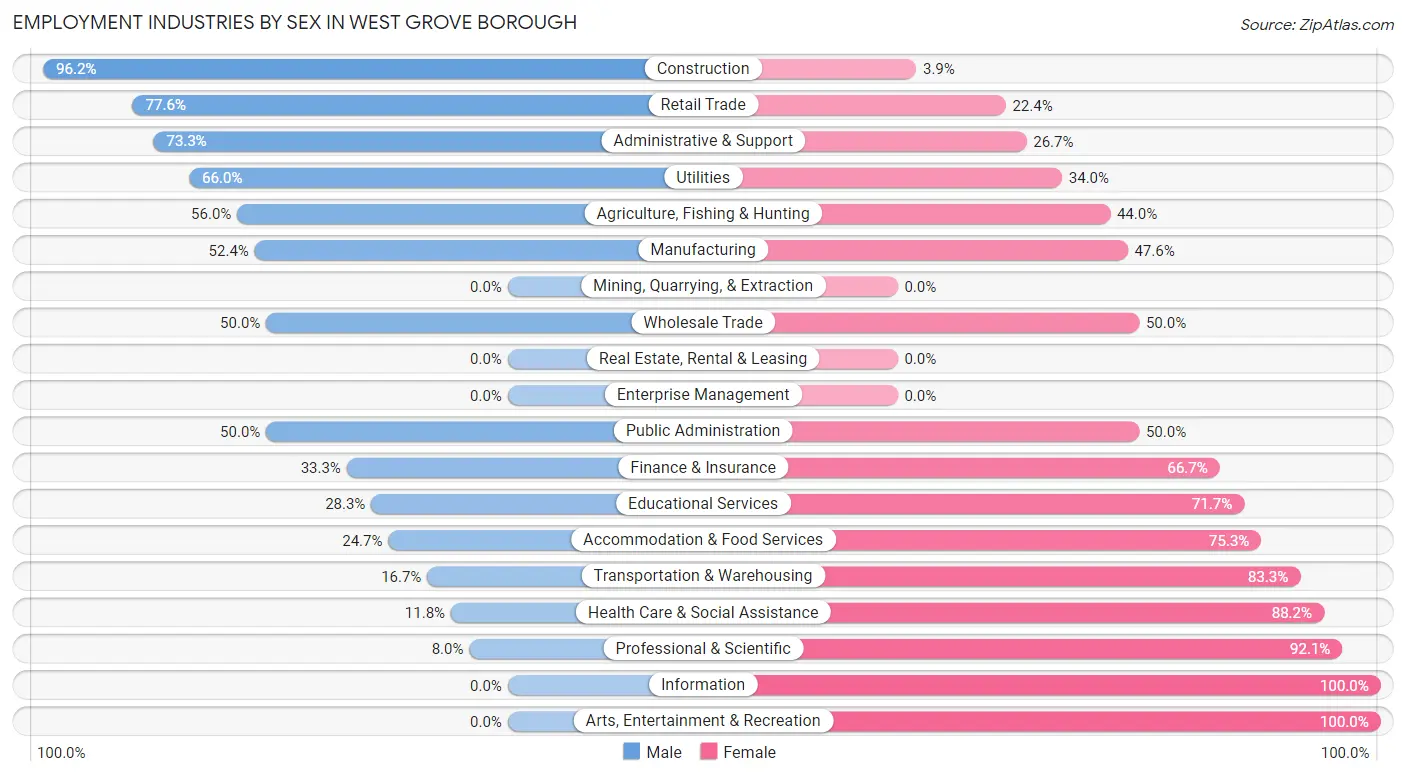
Employment Industries by Sex in West Grove borough
The West Grove borough industries that see more men than women are Construction (96.2%), Retail Trade (77.6%), and Administrative & Support (73.3%), whereas the industries that tend to have a higher number of women are Information (100.0%), Arts, Entertainment & Recreation (100.0%), and Professional & Scientific (92.0%).
| Industry | Male | Female |
| Agriculture, Fishing & Hunting | 70 (56.0%) | 55 (44.0%) |
| Mining, Quarrying, & Extraction | 0 (0.0%) | 0 (0.0%) |
| Construction | 100 (96.2%) | 4 (3.8%) |
| Manufacturing | 77 (52.4%) | 70 (47.6%) |
| Wholesale Trade | 17 (50.0%) | 17 (50.0%) |
| Retail Trade | 118 (77.6%) | 34 (22.4%) |
| Transportation & Warehousing | 5 (16.7%) | 25 (83.3%) |
| Utilities | 31 (66.0%) | 16 (34.0%) |
| Information | 0 (0.0%) | 5 (100.0%) |
| Finance & Insurance | 23 (33.3%) | 46 (66.7%) |
| Real Estate, Rental & Leasing | 0 (0.0%) | 0 (0.0%) |
| Professional & Scientific | 14 (8.0%) | 162 (92.0%) |
| Enterprise Management | 0 (0.0%) | 0 (0.0%) |
| Administrative & Support | 55 (73.3%) | 20 (26.7%) |
| Educational Services | 26 (28.3%) | 66 (71.7%) |
| Health Care & Social Assistance | 30 (11.8%) | 225 (88.2%) |
| Arts, Entertainment & Recreation | 0 (0.0%) | 10 (100.0%) |
| Accommodation & Food Services | 22 (24.7%) | 67 (75.3%) |
| Public Administration | 13 (50.0%) | 13 (50.0%) |
| Total | 642 (41.8%) | 894 (58.2%) |
Education in West Grove borough
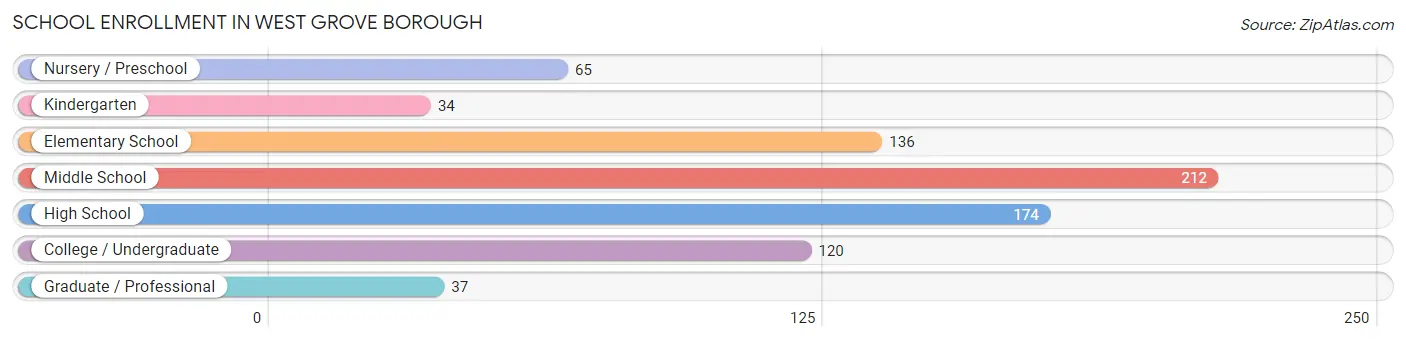
School Enrollment in West Grove borough
The most common levels of schooling among the 778 students in West Grove borough are middle school (212 | 27.3%), high school (174 | 22.4%), and elementary school (136 | 17.5%).
| School Level | # Students | % Students |
| Nursery / Preschool | 65 | 8.4% |
| Kindergarten | 34 | 4.4% |
| Elementary School | 136 | 17.5% |
| Middle School | 212 | 27.3% |
| High School | 174 | 22.4% |
| College / Undergraduate | 120 | 15.4% |
| Graduate / Professional | 37 | 4.8% |
| Total | 778 | 100.0% |
School Enrollment by Age by Funding Source in West Grove borough
Out of a total of 778 students who are enrolled in schools in West Grove borough, 84 (10.8%) attend a private institution, while the remaining 694 (89.2%) are enrolled in public schools. The age group of 3 to 4 year olds has the highest likelihood of being enrolled in private schools, with 23 (45.1% in the age bracket) enrolled. Conversely, the age group of 10 to 14 year olds has the lowest likelihood of being enrolled in a private school, with 222 (100.0% in the age bracket) attending a public institution.
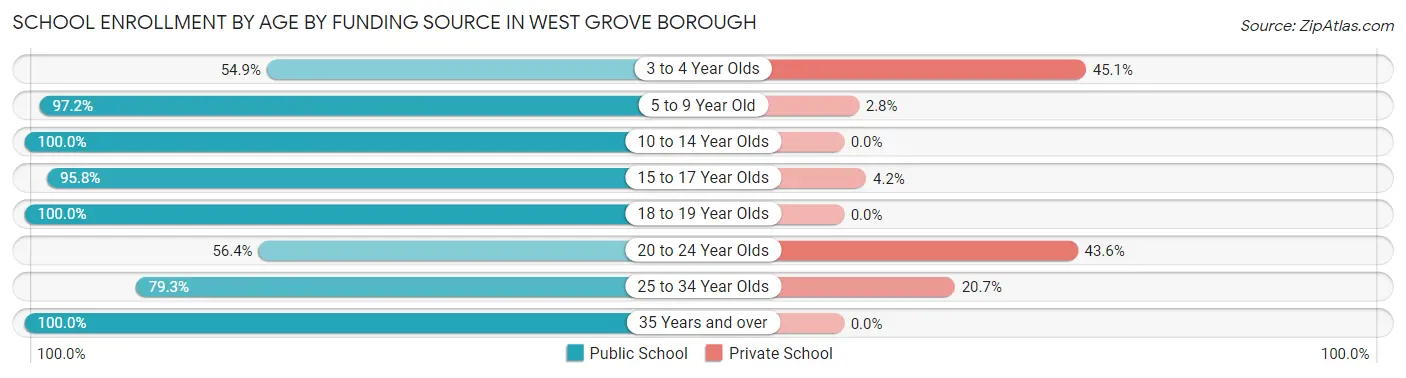
| Age Bracket | Public School | Private School |
| 3 to 4 Year Olds | 28 (54.9%) | 23 (45.1%) |
| 5 to 9 Year Old | 173 (97.2%) | 5 (2.8%) |
| 10 to 14 Year Olds | 222 (100.0%) | 0 (0.0%) |
| 15 to 17 Year Olds | 138 (95.8%) | 6 (4.2%) |
| 18 to 19 Year Olds | 41 (100.0%) | 0 (0.0%) |
| 20 to 24 Year Olds | 57 (56.4%) | 44 (43.6%) |
| 25 to 34 Year Olds | 23 (79.3%) | 6 (20.7%) |
| 35 Years and over | 12 (100.0%) | 0 (0.0%) |
| Total | 694 (89.2%) | 84 (10.8%) |
Educational Attainment by Field of Study in West Grove borough
Education (81 | 14.8%), business (66 | 12.0%), communications (59 | 10.8%), science & technology (58 | 10.6%), and arts & humanities (56 | 10.2%) are the most common fields of study among 548 individuals in West Grove borough who have obtained a bachelor's degree or higher.
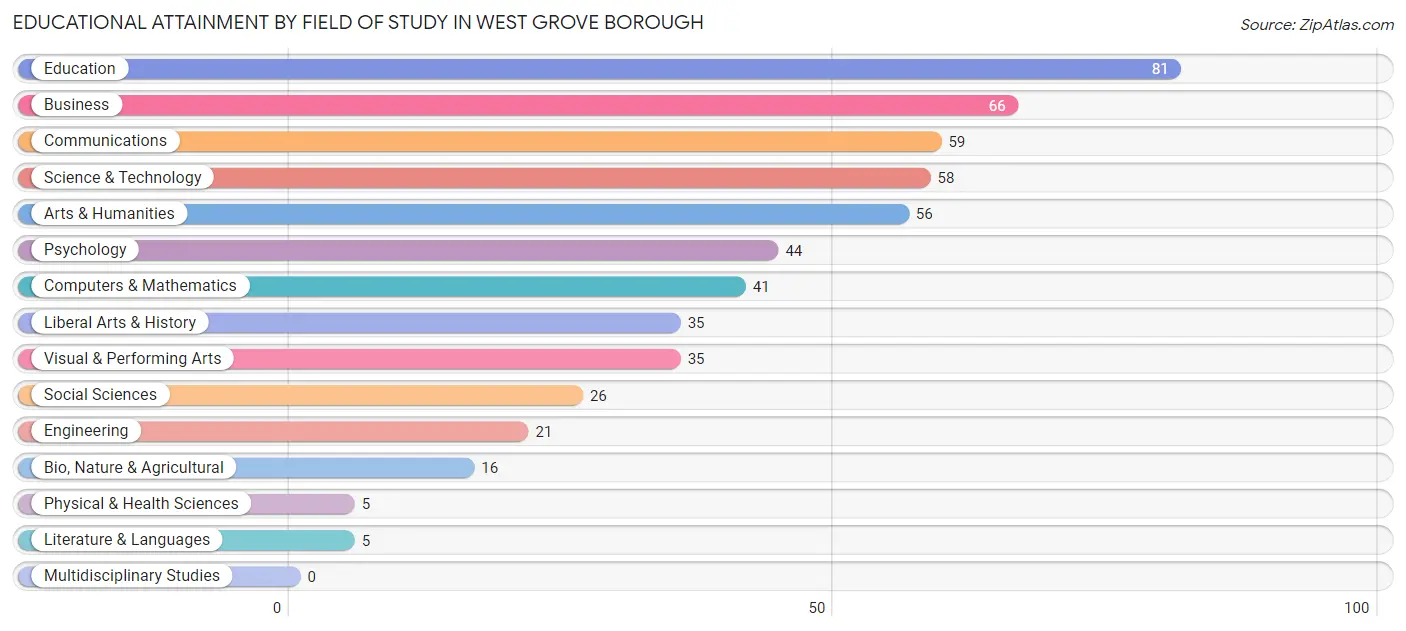
| Field of Study | # Graduates | % Graduates |
| Computers & Mathematics | 41 | 7.5% |
| Bio, Nature & Agricultural | 16 | 2.9% |
| Physical & Health Sciences | 5 | 0.9% |
| Psychology | 44 | 8.0% |
| Social Sciences | 26 | 4.7% |
| Engineering | 21 | 3.8% |
| Multidisciplinary Studies | 0 | 0.0% |
| Science & Technology | 58 | 10.6% |
| Business | 66 | 12.0% |
| Education | 81 | 14.8% |
| Literature & Languages | 5 | 0.9% |
| Liberal Arts & History | 35 | 6.4% |
| Visual & Performing Arts | 35 | 6.4% |
| Communications | 59 | 10.8% |
| Arts & Humanities | 56 | 10.2% |
| Total | 548 | 100.0% |
Transportation & Commute in West Grove borough
Vehicle Availability by Sex in West Grove borough
The most prevalent vehicle ownership categories in West Grove borough are males with 2 vehicles (273, accounting for 42.9%) and females with 2 vehicles (375, making up 30.7%).
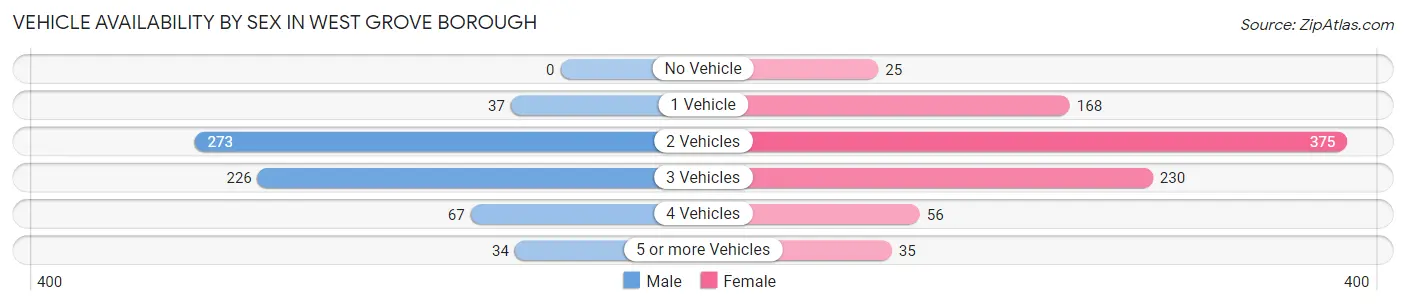
| Vehicles Available | Male | Female |
| No Vehicle | 0 (0.0%) | 25 (2.8%) |
| 1 Vehicle | 37 (5.8%) | 168 (18.9%) |
| 2 Vehicles | 273 (42.9%) | 375 (42.2%) |
| 3 Vehicles | 226 (35.5%) | 230 (25.9%) |
| 4 Vehicles | 67 (10.5%) | 56 (6.3%) |
| 5 or more Vehicles | 34 (5.3%) | 35 (3.9%) |
| Total | 637 (100.0%) | 889 (100.0%) |
Commute Time in West Grove borough
The most frequently occuring commute durations in West Grove borough are 10 to 14 minutes (258 commuters, 18.3%), 15 to 19 minutes (164 commuters, 11.6%), and 60 to 89 minutes (163 commuters, 11.6%).
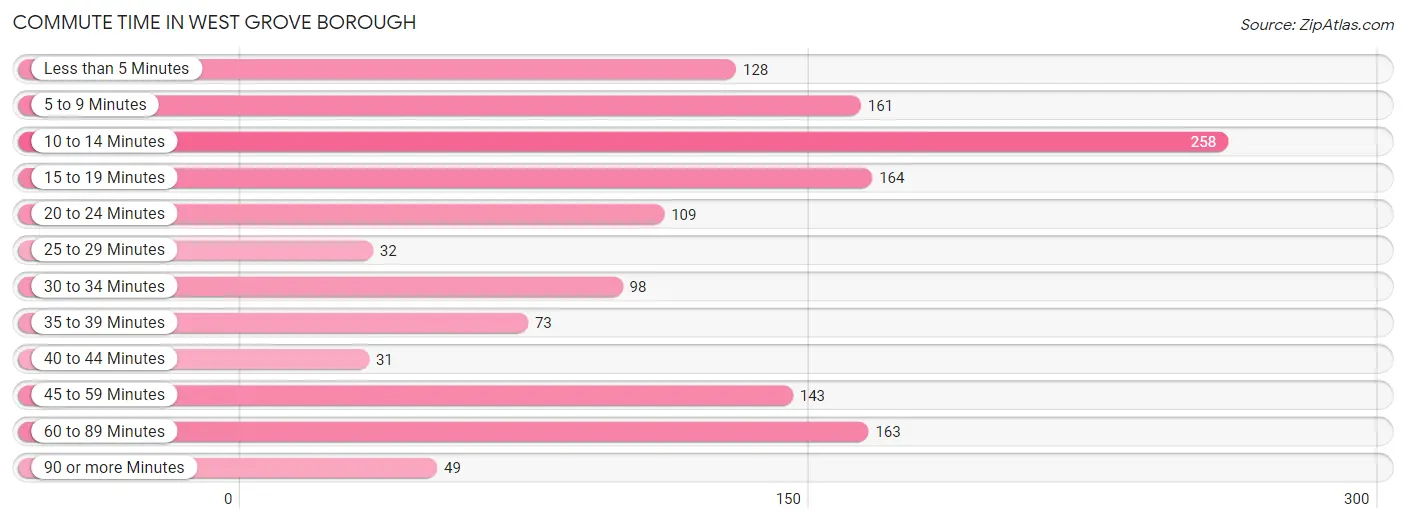
| Commute Time | # Commuters | % Commuters |
| Less than 5 Minutes | 128 | 9.1% |
| 5 to 9 Minutes | 161 | 11.4% |
| 10 to 14 Minutes | 258 | 18.3% |
| 15 to 19 Minutes | 164 | 11.6% |
| 20 to 24 Minutes | 109 | 7.7% |
| 25 to 29 Minutes | 32 | 2.3% |
| 30 to 34 Minutes | 98 | 7.0% |
| 35 to 39 Minutes | 73 | 5.2% |
| 40 to 44 Minutes | 31 | 2.2% |
| 45 to 59 Minutes | 143 | 10.2% |
| 60 to 89 Minutes | 163 | 11.6% |
| 90 or more Minutes | 49 | 3.5% |
Commute Time by Sex in West Grove borough
The most common commute times in West Grove borough are 10 to 14 minutes (106 commuters, 17.6%) for males and 10 to 14 minutes (152 commuters, 18.9%) for females.
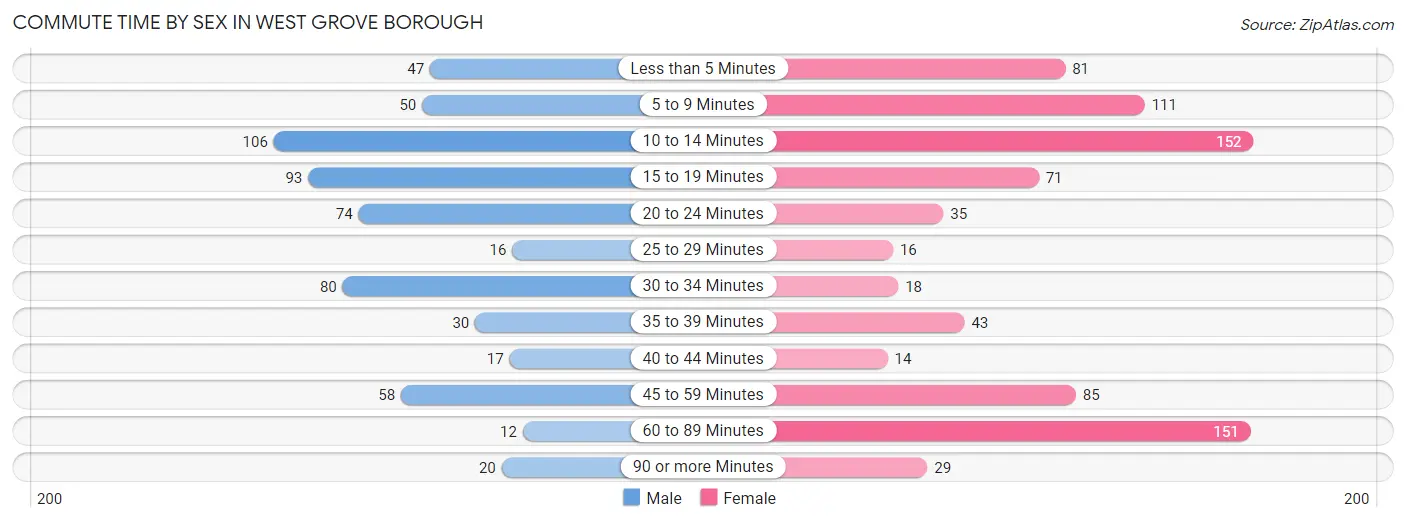
| Commute Time | Male | Female |
| Less than 5 Minutes | 47 (7.8%) | 81 (10.1%) |
| 5 to 9 Minutes | 50 (8.3%) | 111 (13.8%) |
| 10 to 14 Minutes | 106 (17.6%) | 152 (18.9%) |
| 15 to 19 Minutes | 93 (15.4%) | 71 (8.8%) |
| 20 to 24 Minutes | 74 (12.3%) | 35 (4.3%) |
| 25 to 29 Minutes | 16 (2.6%) | 16 (2.0%) |
| 30 to 34 Minutes | 80 (13.3%) | 18 (2.2%) |
| 35 to 39 Minutes | 30 (5.0%) | 43 (5.3%) |
| 40 to 44 Minutes | 17 (2.8%) | 14 (1.7%) |
| 45 to 59 Minutes | 58 (9.6%) | 85 (10.5%) |
| 60 to 89 Minutes | 12 (2.0%) | 151 (18.7%) |
| 90 or more Minutes | 20 (3.3%) | 29 (3.6%) |
Time of Departure to Work by Sex in West Grove borough
The most frequent times of departure to work in West Grove borough are 6:30 AM to 6:59 AM (92, 15.3%) for males and 7:00 AM to 7:29 AM (174, 21.6%) for females.
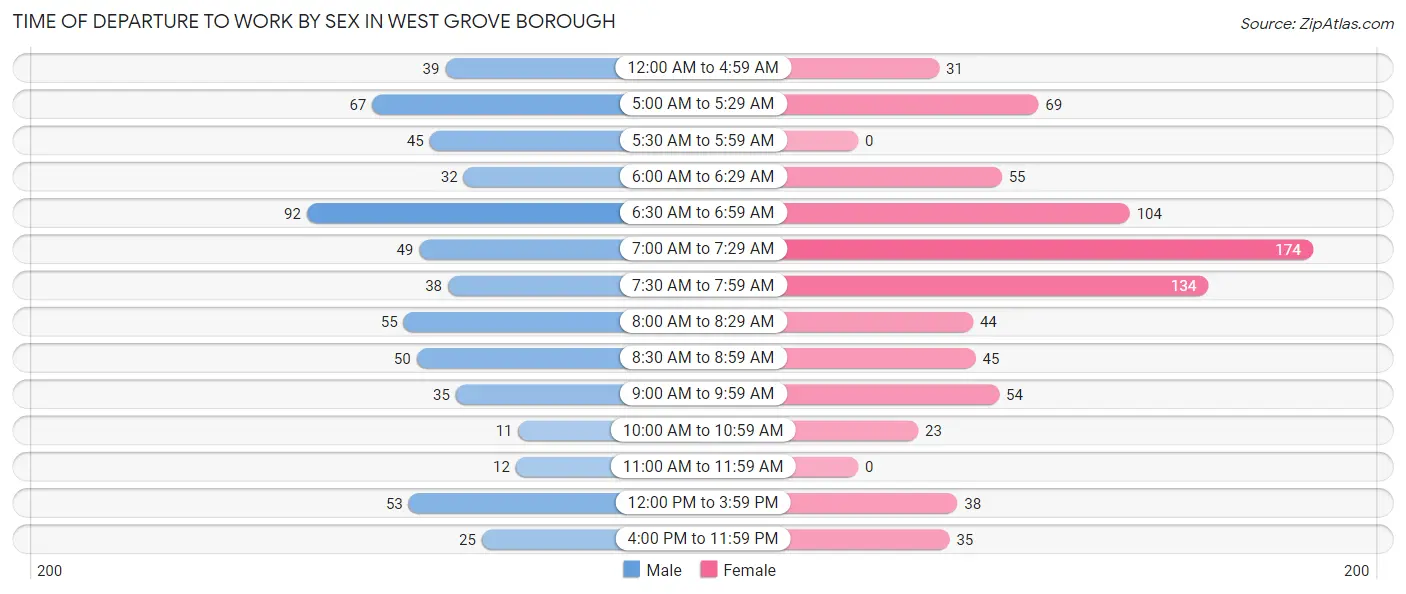
| Time of Departure | Male | Female |
| 12:00 AM to 4:59 AM | 39 (6.5%) | 31 (3.8%) |
| 5:00 AM to 5:29 AM | 67 (11.1%) | 69 (8.6%) |
| 5:30 AM to 5:59 AM | 45 (7.5%) | 0 (0.0%) |
| 6:00 AM to 6:29 AM | 32 (5.3%) | 55 (6.8%) |
| 6:30 AM to 6:59 AM | 92 (15.3%) | 104 (12.9%) |
| 7:00 AM to 7:29 AM | 49 (8.1%) | 174 (21.6%) |
| 7:30 AM to 7:59 AM | 38 (6.3%) | 134 (16.6%) |
| 8:00 AM to 8:29 AM | 55 (9.1%) | 44 (5.5%) |
| 8:30 AM to 8:59 AM | 50 (8.3%) | 45 (5.6%) |
| 9:00 AM to 9:59 AM | 35 (5.8%) | 54 (6.7%) |
| 10:00 AM to 10:59 AM | 11 (1.8%) | 23 (2.9%) |
| 11:00 AM to 11:59 AM | 12 (2.0%) | 0 (0.0%) |
| 12:00 PM to 3:59 PM | 53 (8.8%) | 38 (4.7%) |
| 4:00 PM to 11:59 PM | 25 (4.2%) | 35 (4.3%) |
| Total | 603 (100.0%) | 806 (100.0%) |
Housing Occupancy in West Grove borough
Occupancy by Ownership in West Grove borough
Of the total 964 dwellings in West Grove borough, owner-occupied units account for 722 (74.9%), while renter-occupied units make up 242 (25.1%).
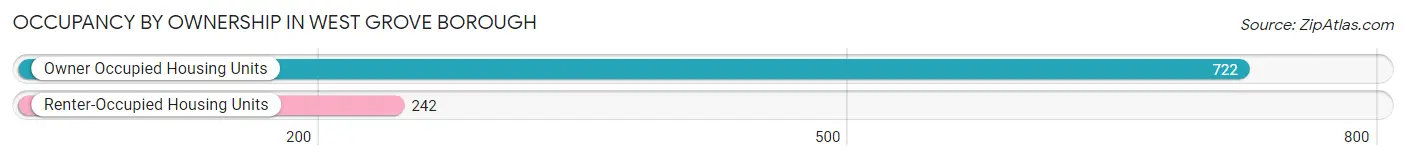
| Occupancy | # Housing Units | % Housing Units |
| Owner Occupied Housing Units | 722 | 74.9% |
| Renter-Occupied Housing Units | 242 | 25.1% |
| Total Occupied Housing Units | 964 | 100.0% |
Occupancy by Household Size in West Grove borough
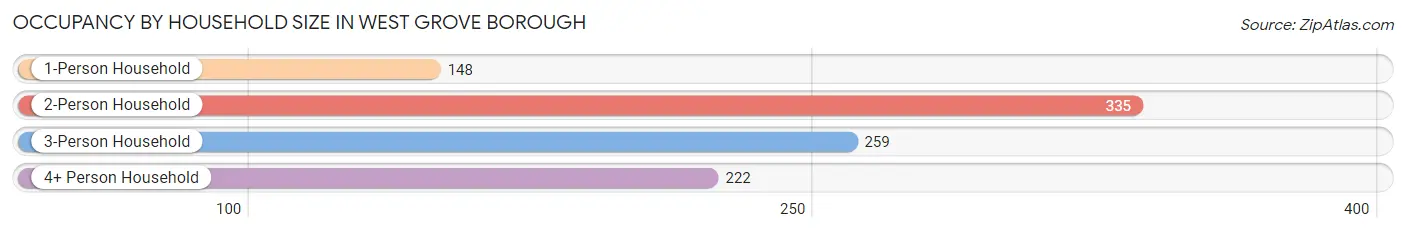
| Household Size | # Housing Units | % Housing Units |
| 1-Person Household | 148 | 15.3% |
| 2-Person Household | 335 | 34.7% |
| 3-Person Household | 259 | 26.9% |
| 4+ Person Household | 222 | 23.0% |
| Total Housing Units | 964 | 100.0% |
Occupancy by Ownership by Household Size in West Grove borough
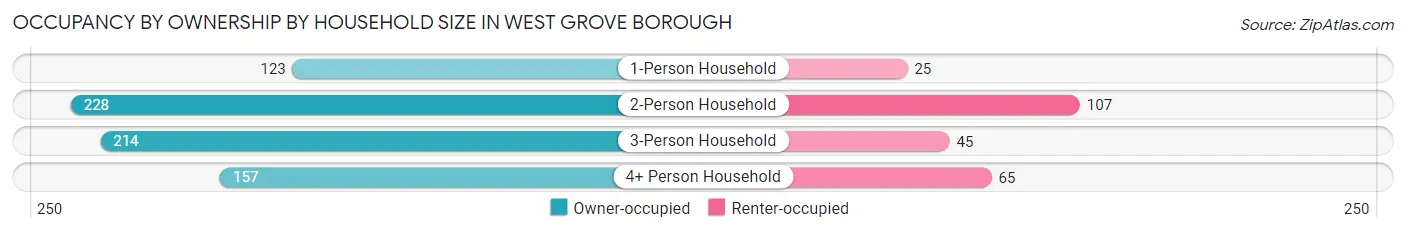
| Household Size | Owner-occupied | Renter-occupied |
| 1-Person Household | 123 (83.1%) | 25 (16.9%) |
| 2-Person Household | 228 (68.1%) | 107 (31.9%) |
| 3-Person Household | 214 (82.6%) | 45 (17.4%) |
| 4+ Person Household | 157 (70.7%) | 65 (29.3%) |
| Total Housing Units | 722 (74.9%) | 242 (25.1%) |
Occupancy by Educational Attainment in West Grove borough
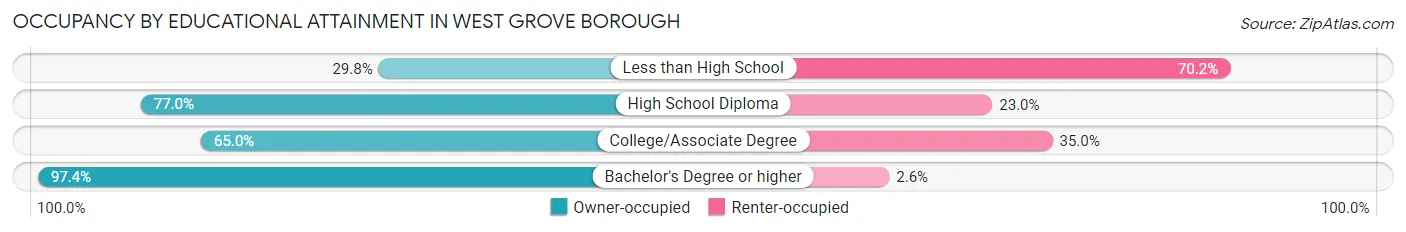
| Household Size | Owner-occupied | Renter-occupied |
| Less than High School | 37 (29.8%) | 87 (70.2%) |
| High School Diploma | 177 (77.0%) | 53 (23.0%) |
| College/Associate Degree | 173 (65.0%) | 93 (35.0%) |
| Bachelor's Degree or higher | 335 (97.4%) | 9 (2.6%) |
Occupancy by Age of Householder in West Grove borough
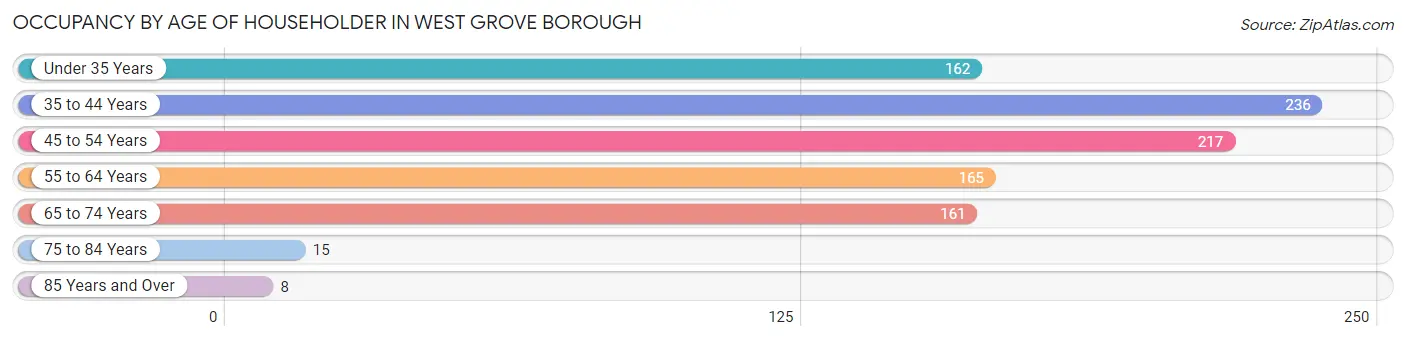
| Age Bracket | # Households | % Households |
| Under 35 Years | 162 | 16.8% |
| 35 to 44 Years | 236 | 24.5% |
| 45 to 54 Years | 217 | 22.5% |
| 55 to 64 Years | 165 | 17.1% |
| 65 to 74 Years | 161 | 16.7% |
| 75 to 84 Years | 15 | 1.6% |
| 85 Years and Over | 8 | 0.8% |
| Total | 964 | 100.0% |
Housing Finances in West Grove borough
Median Income by Occupancy in West Grove borough
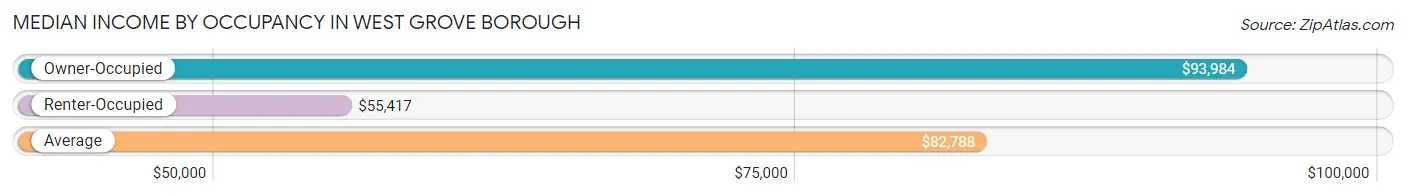
| Occupancy Type | # Households | Median Income |
| Owner-Occupied | 722 (74.9%) | $93,984 |
| Renter-Occupied | 242 (25.1%) | $55,417 |
| Average | 964 (100.0%) | $82,788 |
Occupancy by Householder Income Bracket in West Grove borough
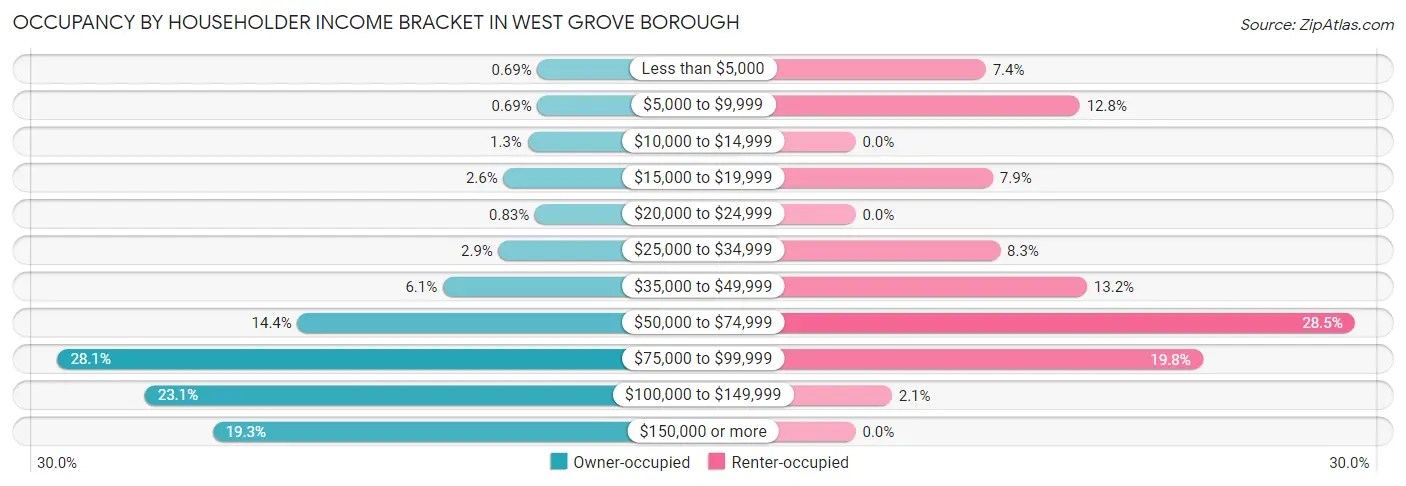
| Income Bracket | Owner-occupied | Renter-occupied |
| Less than $5,000 | 5 (0.7%) | 18 (7.4%) |
| $5,000 to $9,999 | 5 (0.7%) | 31 (12.8%) |
| $10,000 to $14,999 | 9 (1.3%) | 0 (0.0%) |
| $15,000 to $19,999 | 19 (2.6%) | 19 (7.9%) |
| $20,000 to $24,999 | 6 (0.8%) | 0 (0.0%) |
| $25,000 to $34,999 | 21 (2.9%) | 20 (8.3%) |
| $35,000 to $49,999 | 44 (6.1%) | 32 (13.2%) |
| $50,000 to $74,999 | 104 (14.4%) | 69 (28.5%) |
| $75,000 to $99,999 | 203 (28.1%) | 48 (19.8%) |
| $100,000 to $149,999 | 167 (23.1%) | 5 (2.1%) |
| $150,000 or more | 139 (19.3%) | 0 (0.0%) |
| Total | 722 (100.0%) | 242 (100.0%) |
Monthly Housing Cost Tiers in West Grove borough
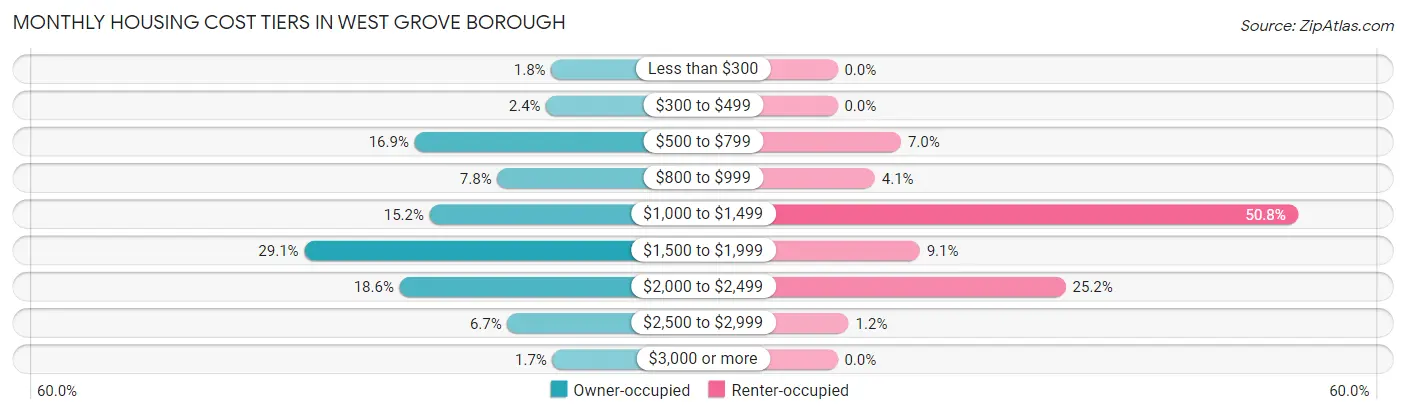
| Monthly Cost | Owner-occupied | Renter-occupied |
| Less than $300 | 13 (1.8%) | 0 (0.0%) |
| $300 to $499 | 17 (2.4%) | 0 (0.0%) |
| $500 to $799 | 122 (16.9%) | 17 (7.0%) |
| $800 to $999 | 56 (7.8%) | 10 (4.1%) |
| $1,000 to $1,499 | 110 (15.2%) | 123 (50.8%) |
| $1,500 to $1,999 | 210 (29.1%) | 22 (9.1%) |
| $2,000 to $2,499 | 134 (18.6%) | 61 (25.2%) |
| $2,500 to $2,999 | 48 (6.7%) | 3 (1.2%) |
| $3,000 or more | 12 (1.7%) | 0 (0.0%) |
| Total | 722 (100.0%) | 242 (100.0%) |
Physical Housing Characteristics in West Grove borough
Housing Structures in West Grove borough
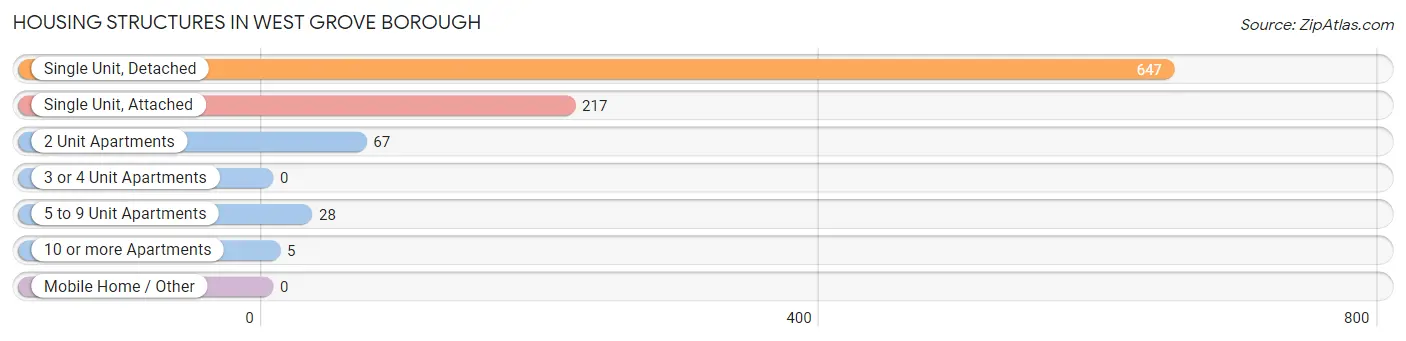
| Structure Type | # Housing Units | % Housing Units |
| Single Unit, Detached | 647 | 67.1% |
| Single Unit, Attached | 217 | 22.5% |
| 2 Unit Apartments | 67 | 7.0% |
| 3 or 4 Unit Apartments | 0 | 0.0% |
| 5 to 9 Unit Apartments | 28 | 2.9% |
| 10 or more Apartments | 5 | 0.5% |
| Mobile Home / Other | 0 | 0.0% |
| Total | 964 | 100.0% |
Housing Structures by Occupancy in West Grove borough
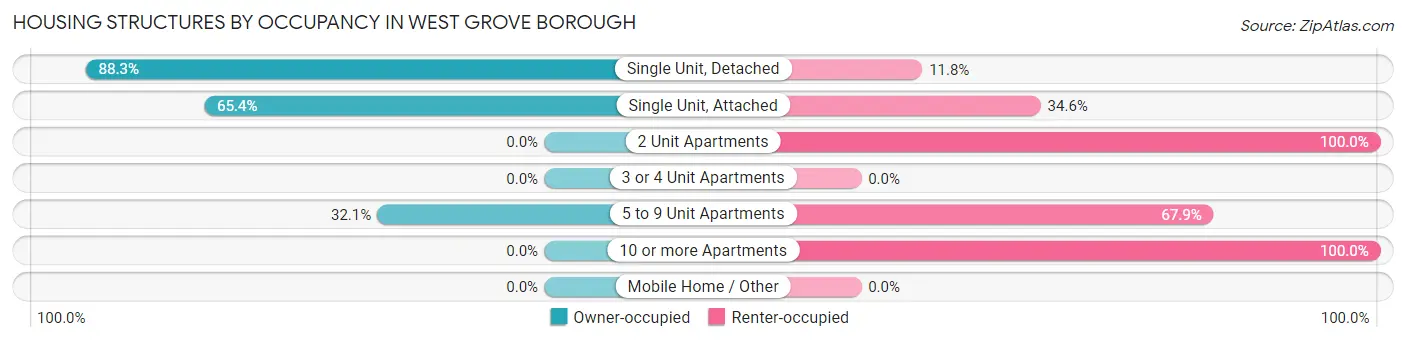
| Structure Type | Owner-occupied | Renter-occupied |
| Single Unit, Detached | 571 (88.2%) | 76 (11.7%) |
| Single Unit, Attached | 142 (65.4%) | 75 (34.6%) |
| 2 Unit Apartments | 0 (0.0%) | 67 (100.0%) |
| 3 or 4 Unit Apartments | 0 (0.0%) | 0 (0.0%) |
| 5 to 9 Unit Apartments | 9 (32.1%) | 19 (67.9%) |
| 10 or more Apartments | 0 (0.0%) | 5 (100.0%) |
| Mobile Home / Other | 0 (0.0%) | 0 (0.0%) |
| Total | 722 (74.9%) | 242 (25.1%) |
Housing Structures by Number of Rooms in West Grove borough
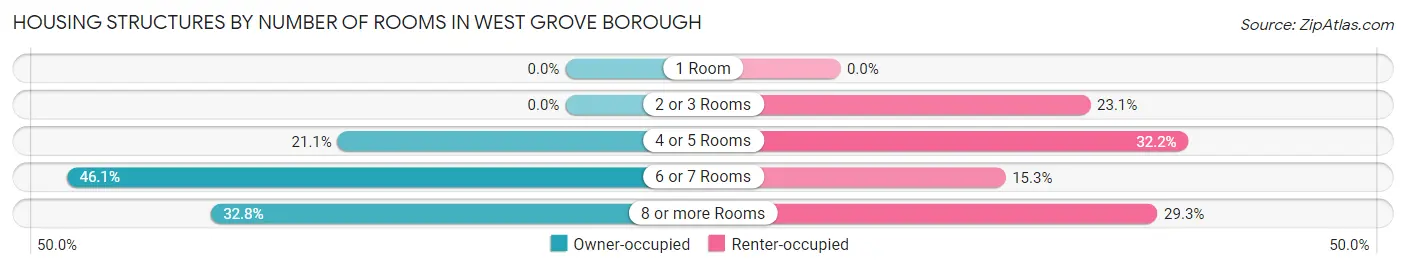
| Number of Rooms | Owner-occupied | Renter-occupied |
| 1 Room | 0 (0.0%) | 0 (0.0%) |
| 2 or 3 Rooms | 0 (0.0%) | 56 (23.1%) |
| 4 or 5 Rooms | 152 (21.0%) | 78 (32.2%) |
| 6 or 7 Rooms | 333 (46.1%) | 37 (15.3%) |
| 8 or more Rooms | 237 (32.8%) | 71 (29.3%) |
| Total | 722 (100.0%) | 242 (100.0%) |
Housing Structure by Heating Type in West Grove borough
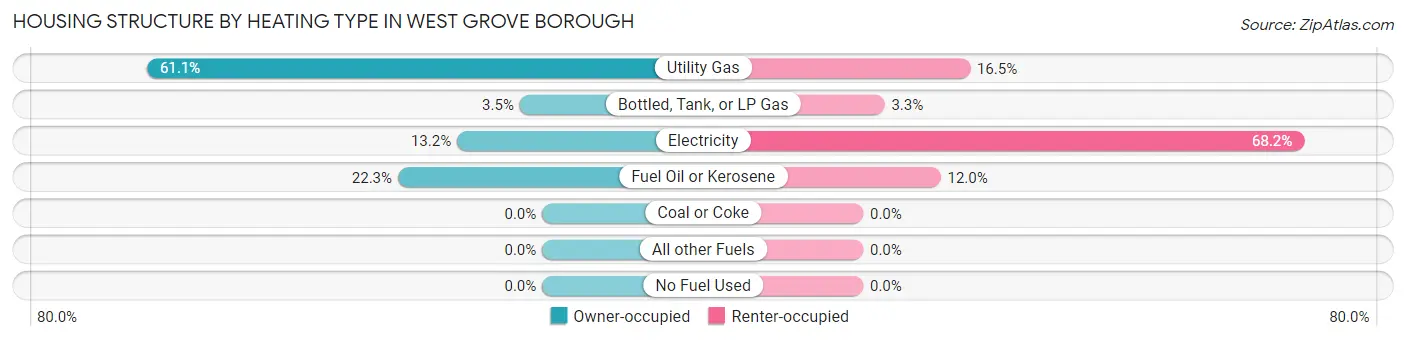
| Heating Type | Owner-occupied | Renter-occupied |
| Utility Gas | 441 (61.1%) | 40 (16.5%) |
| Bottled, Tank, or LP Gas | 25 (3.5%) | 8 (3.3%) |
| Electricity | 95 (13.2%) | 165 (68.2%) |
| Fuel Oil or Kerosene | 161 (22.3%) | 29 (12.0%) |
| Coal or Coke | 0 (0.0%) | 0 (0.0%) |
| All other Fuels | 0 (0.0%) | 0 (0.0%) |
| No Fuel Used | 0 (0.0%) | 0 (0.0%) |
| Total | 722 (100.0%) | 242 (100.0%) |
Household Vehicle Usage in West Grove borough
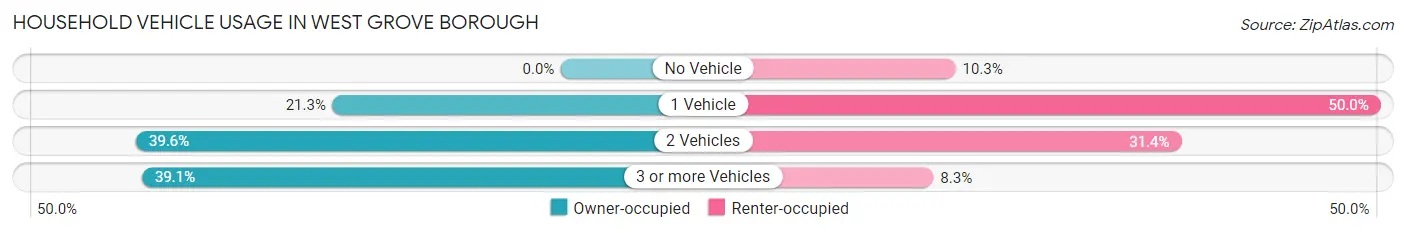
| Vehicles per Household | Owner-occupied | Renter-occupied |
| No Vehicle | 0 (0.0%) | 25 (10.3%) |
| 1 Vehicle | 154 (21.3%) | 121 (50.0%) |
| 2 Vehicles | 286 (39.6%) | 76 (31.4%) |
| 3 or more Vehicles | 282 (39.1%) | 20 (8.3%) |
| Total | 722 (100.0%) | 242 (100.0%) |
Real Estate & Mortgages in West Grove borough
Real Estate and Mortgage Overview in West Grove borough
| Characteristic | Without Mortgage | With Mortgage |
| Housing Units | 228 | 494 |
| Median Property Value | $264,700 | $277,500 |
| Median Household Income | $86,042 | $134 |
| Monthly Housing Costs | $693 | $12 |
| Real Estate Taxes | $4,575 | $20 |
Property Value by Mortgage Status in West Grove borough
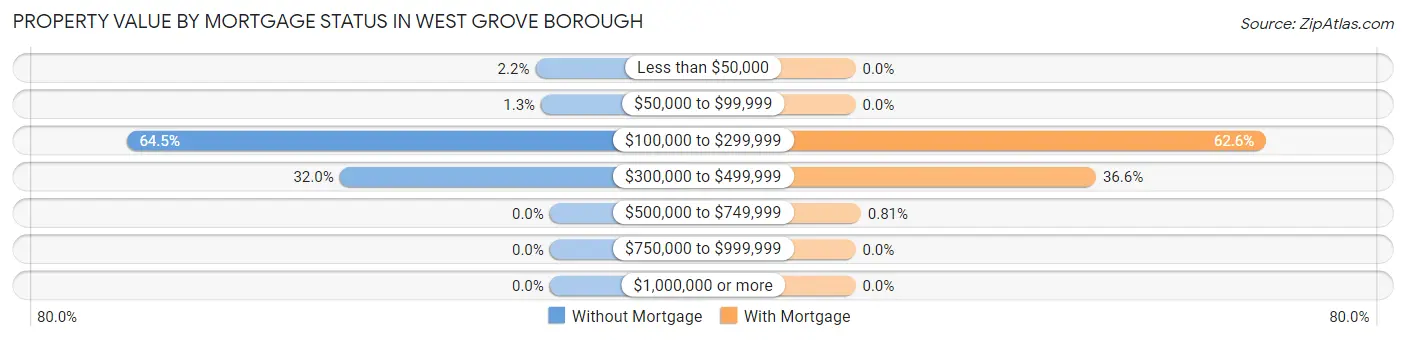
| Property Value | Without Mortgage | With Mortgage |
| Less than $50,000 | 5 (2.2%) | 0 (0.0%) |
| $50,000 to $99,999 | 3 (1.3%) | 0 (0.0%) |
| $100,000 to $299,999 | 147 (64.5%) | 309 (62.5%) |
| $300,000 to $499,999 | 73 (32.0%) | 181 (36.6%) |
| $500,000 to $749,999 | 0 (0.0%) | 4 (0.8%) |
| $750,000 to $999,999 | 0 (0.0%) | 0 (0.0%) |
| $1,000,000 or more | 0 (0.0%) | 0 (0.0%) |
| Total | 228 (100.0%) | 494 (100.0%) |
Household Income by Mortgage Status in West Grove borough
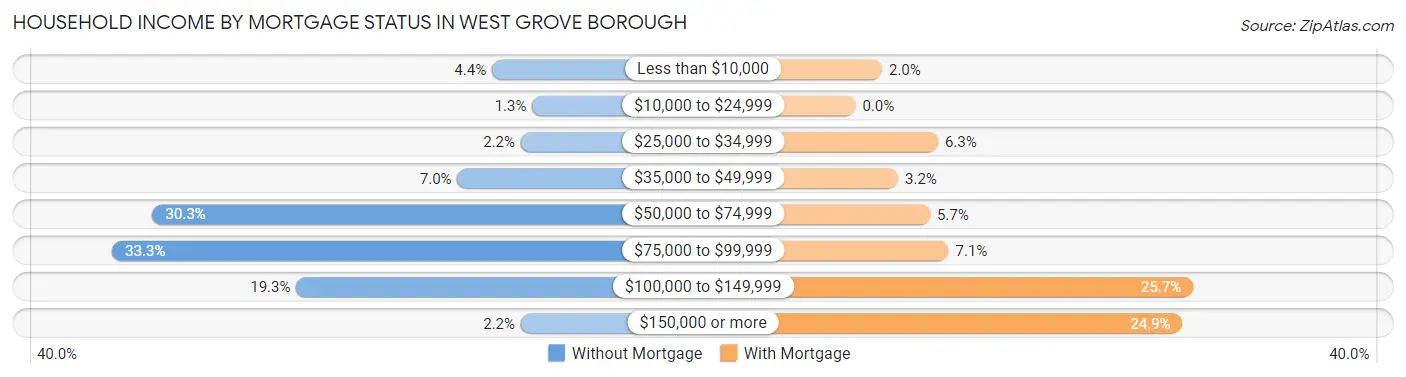
| Household Income | Without Mortgage | With Mortgage |
| Less than $10,000 | 10 (4.4%) | 10 (2.0%) |
| $10,000 to $24,999 | 3 (1.3%) | 0 (0.0%) |
| $25,000 to $34,999 | 5 (2.2%) | 31 (6.3%) |
| $35,000 to $49,999 | 16 (7.0%) | 16 (3.2%) |
| $50,000 to $74,999 | 69 (30.3%) | 28 (5.7%) |
| $75,000 to $99,999 | 76 (33.3%) | 35 (7.1%) |
| $100,000 to $149,999 | 44 (19.3%) | 127 (25.7%) |
| $150,000 or more | 5 (2.2%) | 123 (24.9%) |
| Total | 228 (100.0%) | 494 (100.0%) |
Property Value to Household Income Ratio in West Grove borough
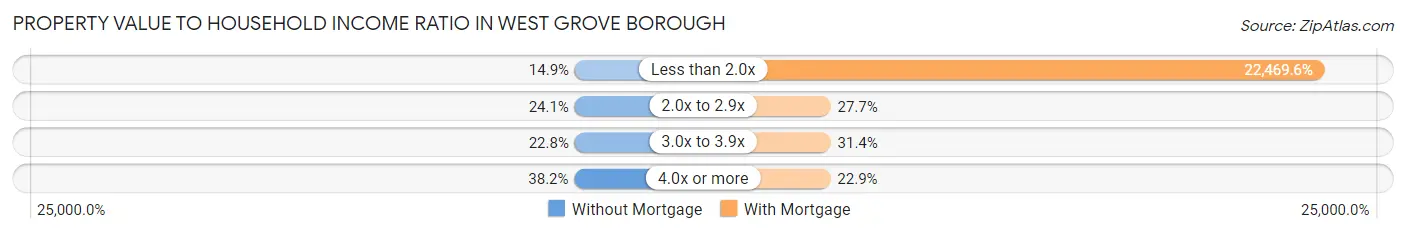
| Value-to-Income Ratio | Without Mortgage | With Mortgage |
| Less than 2.0x | 34 (14.9%) | 111,000 (22,469.6%) |
| 2.0x to 2.9x | 55 (24.1%) | 137 (27.7%) |
| 3.0x to 3.9x | 52 (22.8%) | 155 (31.4%) |
| 4.0x or more | 87 (38.2%) | 113 (22.9%) |
| Total | 228 (100.0%) | 494 (100.0%) |
Real Estate Taxes by Mortgage Status in West Grove borough
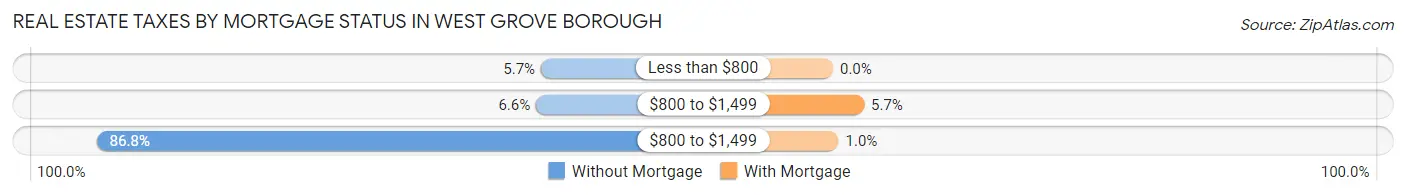
| Property Taxes | Without Mortgage | With Mortgage |
| Less than $800 | 13 (5.7%) | 0 (0.0%) |
| $800 to $1,499 | 15 (6.6%) | 28 (5.7%) |
| $800 to $1,499 | 198 (86.8%) | 5 (1.0%) |
| Total | 228 (100.0%) | 494 (100.0%) |
Health & Disability in West Grove borough
Health Insurance Coverage by Age in West Grove borough
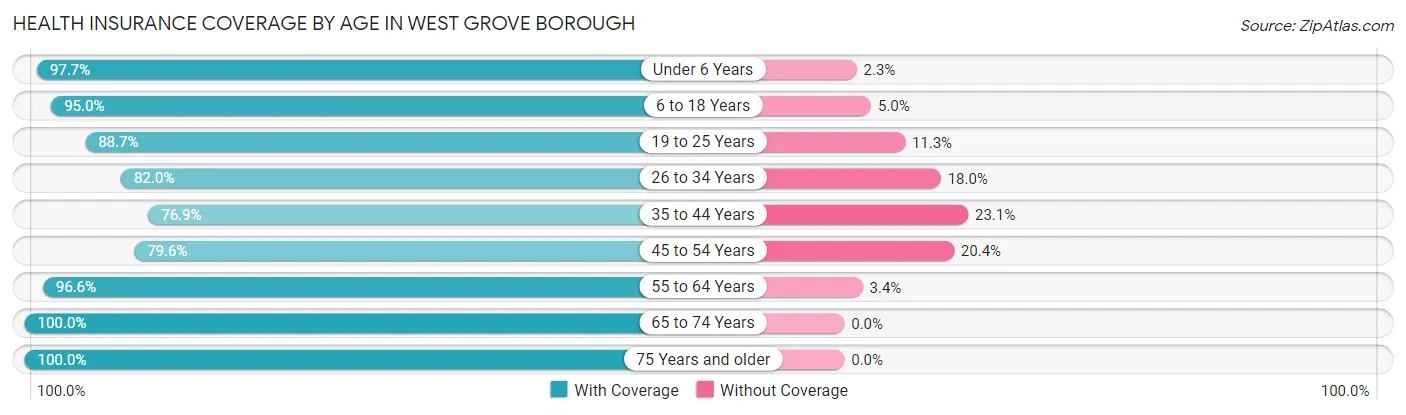
| Age Bracket | With Coverage | Without Coverage |
| Under 6 Years | 213 (97.7%) | 5 (2.3%) |
| 6 to 18 Years | 535 (95.0%) | 28 (5.0%) |
| 19 to 25 Years | 251 (88.7%) | 32 (11.3%) |
| 26 to 34 Years | 260 (82.0%) | 57 (18.0%) |
| 35 to 44 Years | 320 (76.9%) | 96 (23.1%) |
| 45 to 54 Years | 327 (79.6%) | 84 (20.4%) |
| 55 to 64 Years | 283 (96.6%) | 10 (3.4%) |
| 65 to 74 Years | 219 (100.0%) | 0 (0.0%) |
| 75 Years and older | 64 (100.0%) | 0 (0.0%) |
| Total | 2,472 (88.8%) | 312 (11.2%) |
Health Insurance Coverage by Citizenship Status in West Grove borough
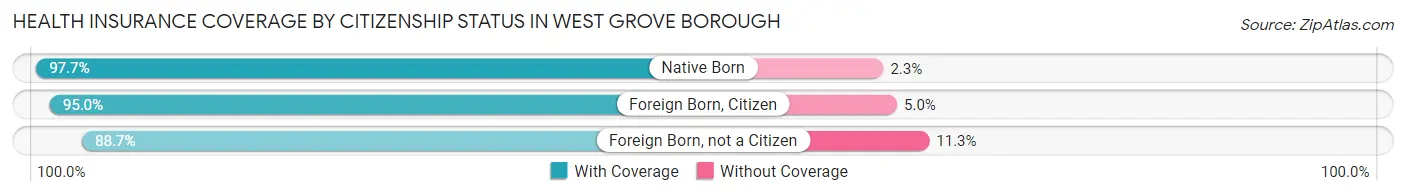
| Citizenship Status | With Coverage | Without Coverage |
| Native Born | 213 (97.7%) | 5 (2.3%) |
| Foreign Born, Citizen | 535 (95.0%) | 28 (5.0%) |
| Foreign Born, not a Citizen | 251 (88.7%) | 32 (11.3%) |
Health Insurance Coverage by Household Income in West Grove borough
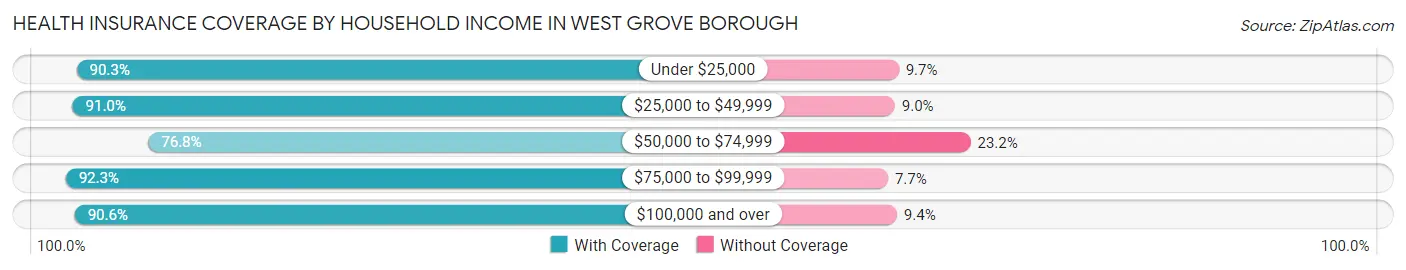
| Household Income | With Coverage | Without Coverage |
| Under $25,000 | 232 (90.3%) | 25 (9.7%) |
| $25,000 to $49,999 | 283 (91.0%) | 28 (9.0%) |
| $50,000 to $74,999 | 361 (76.8%) | 109 (23.2%) |
| $75,000 to $99,999 | 766 (92.3%) | 64 (7.7%) |
| $100,000 and over | 830 (90.6%) | 86 (9.4%) |
Public vs Private Health Insurance Coverage by Age in West Grove borough
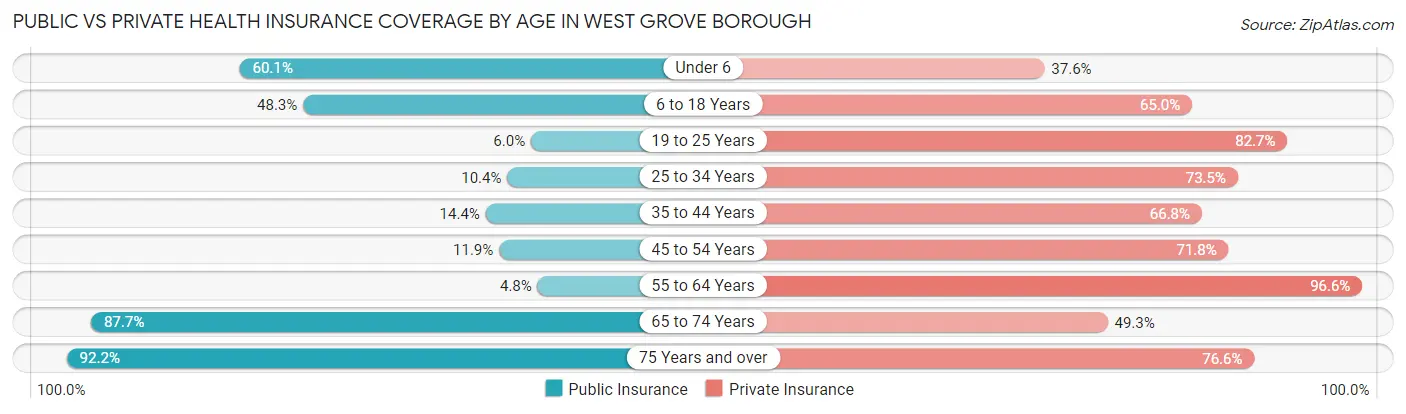
| Age Bracket | Public Insurance | Private Insurance |
| Under 6 | 131 (60.1%) | 82 (37.6%) |
| 6 to 18 Years | 272 (48.3%) | 366 (65.0%) |
| 19 to 25 Years | 17 (6.0%) | 234 (82.7%) |
| 25 to 34 Years | 33 (10.4%) | 233 (73.5%) |
| 35 to 44 Years | 60 (14.4%) | 278 (66.8%) |
| 45 to 54 Years | 49 (11.9%) | 295 (71.8%) |
| 55 to 64 Years | 14 (4.8%) | 283 (96.6%) |
| 65 to 74 Years | 192 (87.7%) | 108 (49.3%) |
| 75 Years and over | 59 (92.2%) | 49 (76.6%) |
| Total | 827 (29.7%) | 1,928 (69.3%) |
Disability Status by Sex by Age in West Grove borough
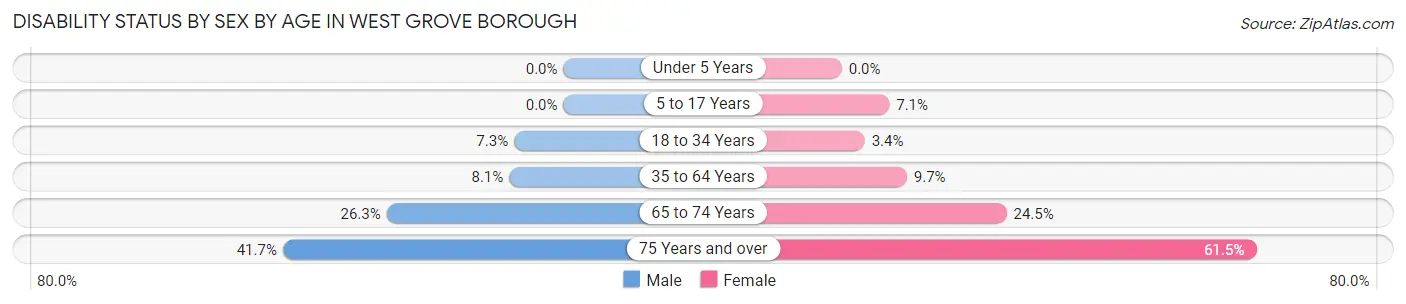
| Age Bracket | Male | Female |
| Under 5 Years | 0 (0.0%) | 0 (0.0%) |
| 5 to 17 Years | 0 (0.0%) | 21 (7.0%) |
| 18 to 34 Years | 20 (7.3%) | 12 (3.4%) |
| 35 to 64 Years | 36 (8.1%) | 65 (9.7%) |
| 65 to 74 Years | 21 (26.3%) | 34 (24.5%) |
| 75 Years and over | 5 (41.7%) | 32 (61.5%) |
Disability Class by Sex by Age in West Grove borough
Disability Class: Hearing Difficulty
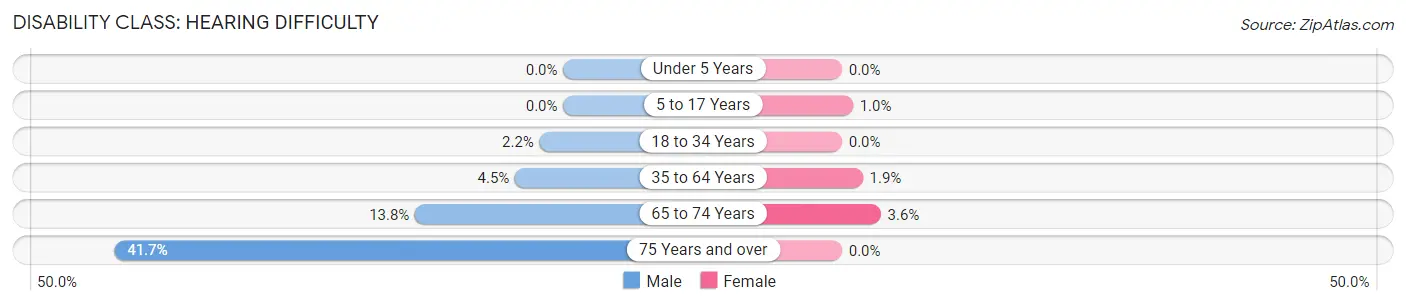
| Age Bracket | Male | Female |
| Under 5 Years | 0 (0.0%) | 0 (0.0%) |
| 5 to 17 Years | 0 (0.0%) | 3 (1.0%) |
| 18 to 34 Years | 6 (2.2%) | 0 (0.0%) |
| 35 to 64 Years | 20 (4.5%) | 13 (1.9%) |
| 65 to 74 Years | 11 (13.8%) | 5 (3.6%) |
| 75 Years and over | 5 (41.7%) | 0 (0.0%) |
Disability Class: Vision Difficulty
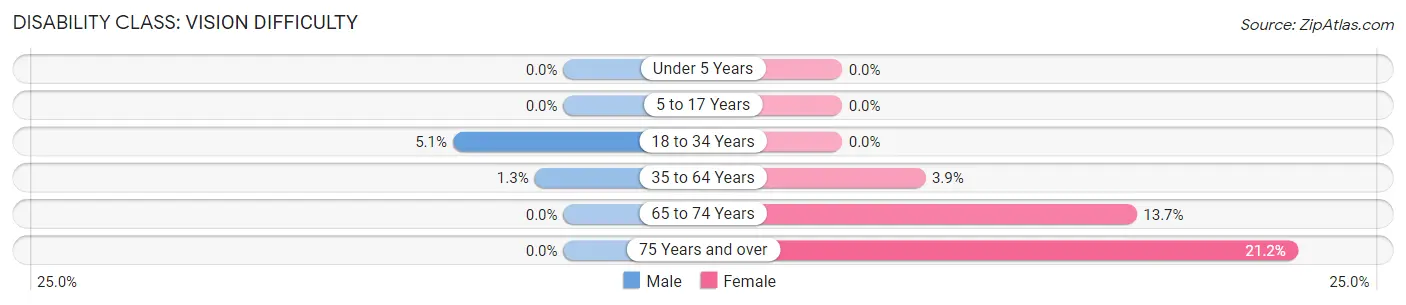
| Age Bracket | Male | Female |
| Under 5 Years | 0 (0.0%) | 0 (0.0%) |
| 5 to 17 Years | 0 (0.0%) | 0 (0.0%) |
| 18 to 34 Years | 14 (5.1%) | 0 (0.0%) |
| 35 to 64 Years | 6 (1.3%) | 26 (3.9%) |
| 65 to 74 Years | 0 (0.0%) | 19 (13.7%) |
| 75 Years and over | 0 (0.0%) | 11 (21.1%) |
Disability Class: Cognitive Difficulty
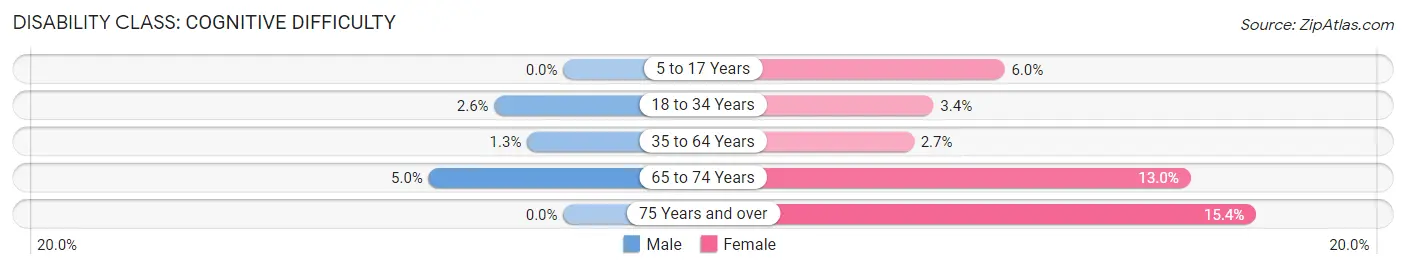
| Age Bracket | Male | Female |
| 5 to 17 Years | 0 (0.0%) | 18 (6.0%) |
| 18 to 34 Years | 7 (2.6%) | 12 (3.4%) |
| 35 to 64 Years | 6 (1.3%) | 18 (2.7%) |
| 65 to 74 Years | 4 (5.0%) | 18 (13.0%) |
| 75 Years and over | 0 (0.0%) | 8 (15.4%) |
Disability Class: Ambulatory Difficulty
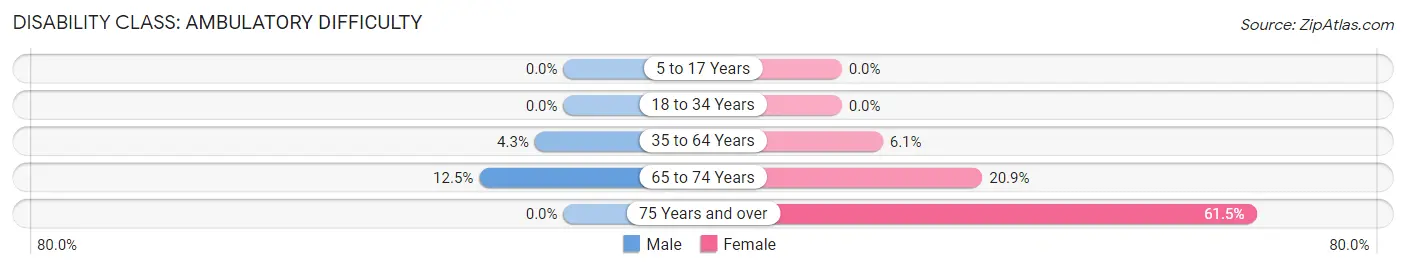
| Age Bracket | Male | Female |
| 5 to 17 Years | 0 (0.0%) | 0 (0.0%) |
| 18 to 34 Years | 0 (0.0%) | 0 (0.0%) |
| 35 to 64 Years | 19 (4.3%) | 41 (6.1%) |
| 65 to 74 Years | 10 (12.5%) | 29 (20.9%) |
| 75 Years and over | 0 (0.0%) | 32 (61.5%) |
Disability Class: Self-Care Difficulty
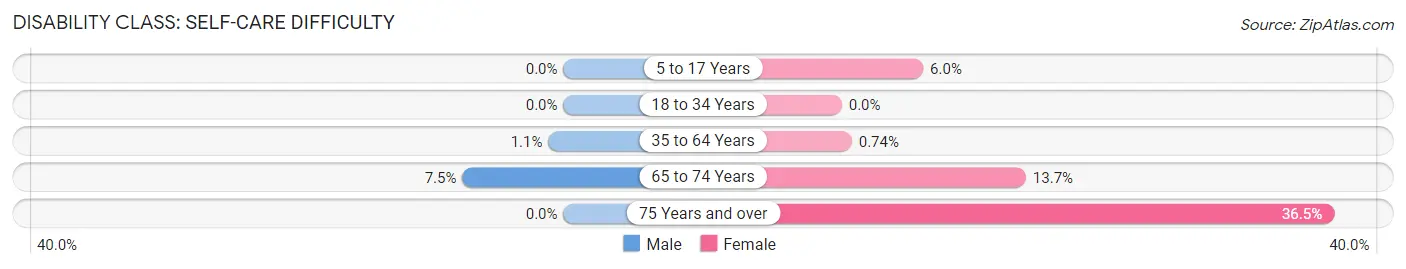
| Age Bracket | Male | Female |
| 5 to 17 Years | 0 (0.0%) | 18 (6.0%) |
| 18 to 34 Years | 0 (0.0%) | 0 (0.0%) |
| 35 to 64 Years | 5 (1.1%) | 5 (0.7%) |
| 65 to 74 Years | 6 (7.5%) | 19 (13.7%) |
| 75 Years and over | 0 (0.0%) | 19 (36.5%) |
Technology Access in West Grove borough
Computing Device Access in West Grove borough
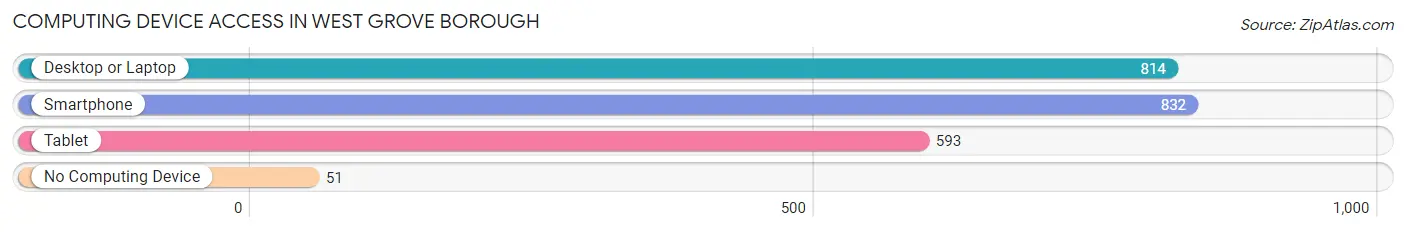
| Device Type | # Households | % Households |
| Desktop or Laptop | 814 | 84.4% |
| Smartphone | 832 | 86.3% |
| Tablet | 593 | 61.5% |
| No Computing Device | 51 | 5.3% |
| Total | 964 | 100.0% |
Internet Access in West Grove borough
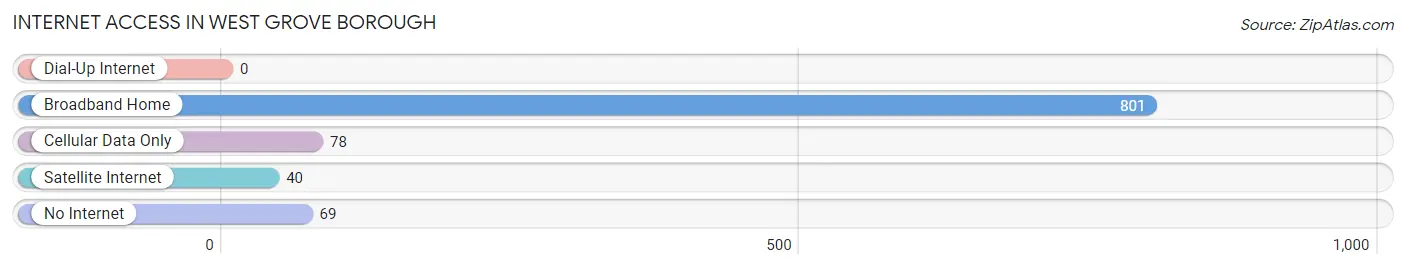
| Internet Type | # Households | % Households |
| Dial-Up Internet | 0 | 0.0% |
| Broadband Home | 801 | 83.1% |
| Cellular Data Only | 78 | 8.1% |
| Satellite Internet | 40 | 4.2% |
| No Internet | 69 | 7.2% |
| Total | 964 | 100.0% |
West Grove borough Summary
History
West Grove Borough is a small borough located in Chester County, Pennsylvania. It was incorporated in 1891 and is located in the southern part of the county. The borough is situated in the heart of the Brandywine Valley and is surrounded by rolling hills and farmland. The area was originally inhabited by the Lenni Lenape Native Americans and was later settled by Quakers in the late 1600s. The area was known as “West Grove” due to its location west of the original settlement of Kennett Square.
The borough was officially incorporated in 1891 and was home to a variety of businesses, including a grist mill, a saw mill, a blacksmith shop, a general store, and a post office. The population of West Grove Borough was 1,845 in the 2000 census.
Geography
West Grove Borough is located in the southern part of Chester County, Pennsylvania. It is situated in the heart of the Brandywine Valley and is surrounded by rolling hills and farmland. The borough is bordered by London Grove Township to the north, New Garden Township to the east, Penn Township to the south, and Kennett Square Borough to the west. The borough covers an area of 1.2 square miles and has a population of 1,845 as of the 2000 census.
The borough is located in the humid subtropical climate zone and experiences hot, humid summers and cold, wet winters. The average temperature in the summer is around 75 degrees Fahrenheit and the average temperature in the winter is around 35 degrees Fahrenheit. The average annual precipitation is around 40 inches.
Economy
West Grove Borough is a small, rural community with a population of 1,845 as of the 2000 census. The borough is home to a variety of businesses, including a grist mill, a saw mill, a blacksmith shop, a general store, and a post office. The borough is also home to a variety of small businesses, including restaurants, retail stores, and professional services.
The borough is home to a variety of agricultural businesses, including dairy farms, vegetable farms, and fruit farms. The borough is also home to a variety of manufacturing businesses, including furniture makers, metal fabricators, and machine shops.
Demographics
As of the 2000 census, the population of West Grove Borough was 1,845. The racial makeup of the borough was 97.3% White, 0.9% African American, 0.2% Native American, 0.4% Asian, 0.1% Pacific Islander, 0.2% from other races, and 0.9% from two or more races. Hispanic or Latino of any race were 1.2% of the population.
The median income for a household in the borough was $50,938, and the median income for a family was $60,000. The per capita income for the borough was $22,845. About 4.2% of families and 5.3% of the population were below the poverty line, including 6.2% of those under age 18 and 4.2% of those age 65 or over.
Common Questions
What is Per Capita Income in West Grove borough?
Per Capita income in West Grove borough is $32,787.
What is the Median Family Income in West Grove borough?
Median Family Income in West Grove borough is $85,493.
What is the Median Household income in West Grove borough?
Median Household Income in West Grove borough is $82,788.
What is Income or Wage Gap in West Grove borough?
Income or Wage Gap in West Grove borough is 10.9%.
Women in West Grove borough earn 89.1 cents for every dollar earned by a man.
What is Inequality or Gini Index in West Grove borough?
Inequality or Gini Index in West Grove borough is 0.36.
What is the Total Population of West Grove borough?
Total Population of West Grove borough is 2,784.
What is the Total Male Population of West Grove borough?
Total Male Population of West Grove borough is 1,172.
What is the Total Female Population of West Grove borough?
Total Female Population of West Grove borough is 1,612.
What is the Ratio of Males per 100 Females in West Grove borough?
There are 72.70 Males per 100 Females in West Grove borough.
What is the Ratio of Females per 100 Males in West Grove borough?
There are 137.54 Females per 100 Males in West Grove borough.
What is the Median Population Age in West Grove borough?
Median Population Age in West Grove borough is 35.4 Years.
What is the Average Family Size in West Grove borough
Average Family Size in West Grove borough is 3.2 People.
What is the Average Household Size in West Grove borough
Average Household Size in West Grove borough is 2.9 People.
How Large is the Labor Force in West Grove borough?
There are 1,602 People in the Labor Forcein in West Grove borough.
What is the Percentage of People in the Labor Force in West Grove borough?
75.0% of People are in the Labor Force in West Grove borough.
What is the Unemployment Rate in West Grove borough?
Unemployment Rate in West Grove borough is 4.1%.