Chambersburg borough, PA Map & Demographics
Chambersburg borough Overview
$32,662
PER CAPITA INCOME
$59,447
AVG FAMILY INCOME
$53,493
AVG HOUSEHOLD INCOME
23.1%
WAGE / INCOME GAP [ % ]
76.9¢/ $1
WAGE / INCOME GAP [ $ ]
0.43
INEQUALITY / GINI INDEX
21,917
TOTAL POPULATION
10,548
MALE POPULATION
11,369
FEMALE POPULATION
92.78
MALES / 100 FEMALES
107.78
FEMALES / 100 MALES
39.5
MEDIAN AGE
2.9
AVG FAMILY SIZE
2.2
AVG HOUSEHOLD SIZE
11,038
LABOR FORCE [ PEOPLE ]
61.4%
PERCENT IN LABOR FORCE
4.8%
UNEMPLOYMENT RATE
Income in Chambersburg borough
Income Overview in Chambersburg borough
Per Capita Income in Chambersburg borough is $32,662, while median incomes of families and households are $59,447 and $53,493 respectively.
| Characteristic | Number | Measure |
| Per Capita Income | 21,917 | $32,662 |
| Median Family Income | 5,197 | $59,447 |
| Mean Family Income | 5,197 | $85,350 |
| Median Household Income | 9,815 | $53,493 |
| Mean Household Income | 9,815 | $70,699 |
| Income Deficit | 5,197 | $0 |
| Wage / Income Gap (%) | 21,917 | 23.07% |
| Wage / Income Gap ($) | 21,917 | 76.93¢ per $1 |
| Gini / Inequality Index | 21,917 | 0.43 |
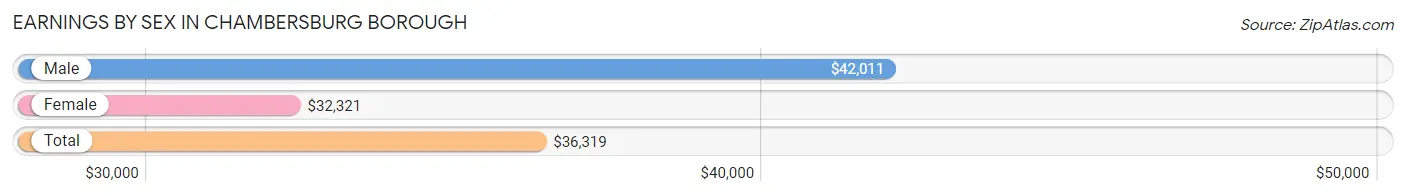
Earnings by Sex in Chambersburg borough
Average Earnings in Chambersburg borough are $36,319, $42,011 for men and $32,321 for women, a difference of 23.1%.
| Sex | Number | Average Earnings |
| Male | 5,957 (50.9%) | $42,011 |
| Female | 5,747 (49.1%) | $32,321 |
| Total | 11,704 (100.0%) | $36,319 |
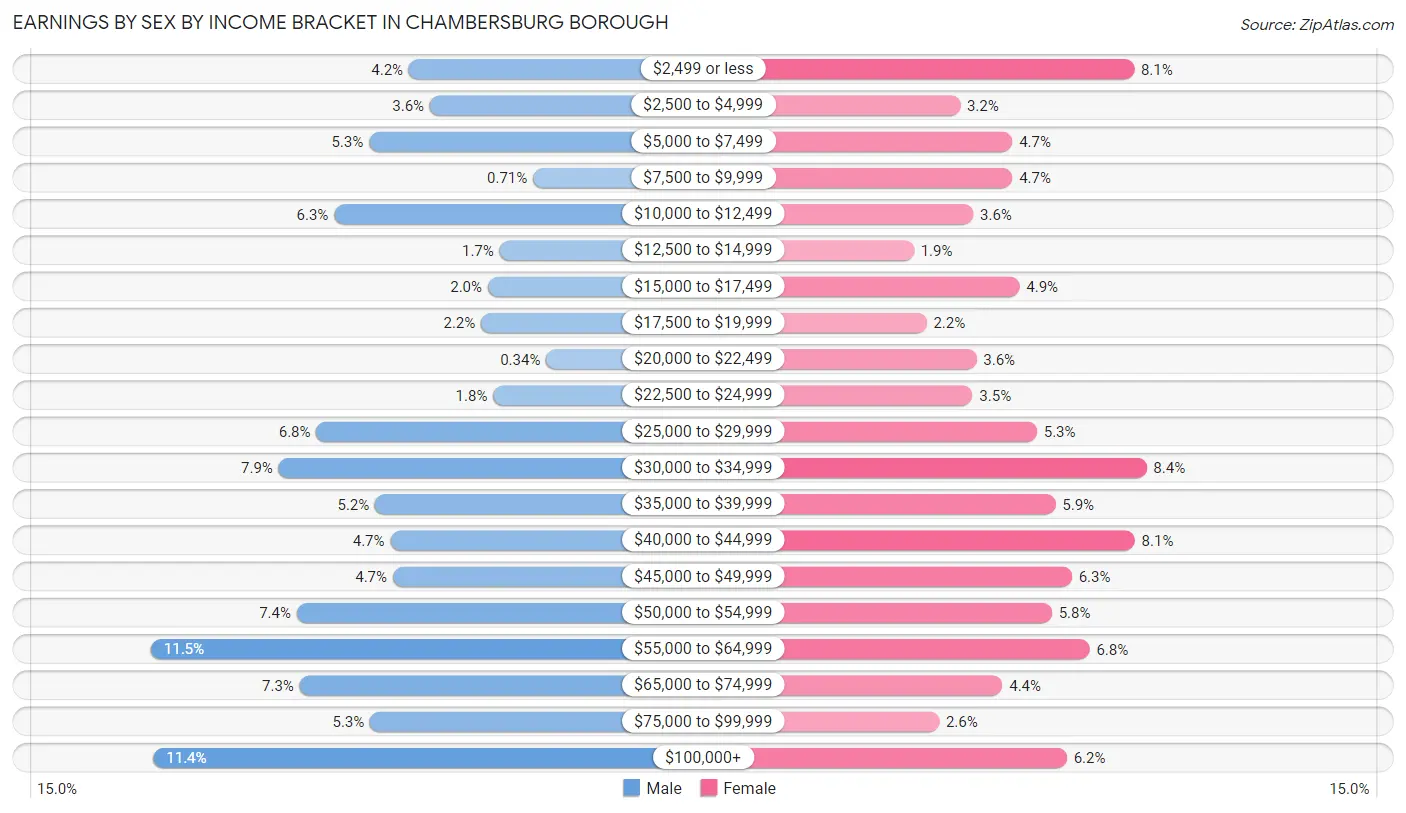
Earnings by Sex by Income Bracket in Chambersburg borough
The most common earnings brackets in Chambersburg borough are $55,000 to $64,999 for men (682 | 11.5%) and $30,000 to $34,999 for women (484 | 8.4%).
| Income | Male | Female |
| $2,499 or less | 250 (4.2%) | 464 (8.1%) |
| $2,500 to $4,999 | 215 (3.6%) | 183 (3.2%) |
| $5,000 to $7,499 | 317 (5.3%) | 267 (4.6%) |
| $7,500 to $9,999 | 42 (0.7%) | 267 (4.6%) |
| $10,000 to $12,499 | 375 (6.3%) | 204 (3.5%) |
| $12,500 to $14,999 | 98 (1.7%) | 108 (1.9%) |
| $15,000 to $17,499 | 118 (2.0%) | 279 (4.9%) |
| $17,500 to $19,999 | 129 (2.2%) | 129 (2.2%) |
| $20,000 to $22,499 | 20 (0.3%) | 209 (3.6%) |
| $22,500 to $24,999 | 109 (1.8%) | 203 (3.5%) |
| $25,000 to $29,999 | 405 (6.8%) | 307 (5.3%) |
| $30,000 to $34,999 | 468 (7.9%) | 484 (8.4%) |
| $35,000 to $39,999 | 307 (5.1%) | 337 (5.9%) |
| $40,000 to $44,999 | 281 (4.7%) | 465 (8.1%) |
| $45,000 to $49,999 | 277 (4.6%) | 363 (6.3%) |
| $50,000 to $54,999 | 438 (7.3%) | 331 (5.8%) |
| $55,000 to $64,999 | 682 (11.5%) | 392 (6.8%) |
| $65,000 to $74,999 | 433 (7.3%) | 251 (4.4%) |
| $75,000 to $99,999 | 315 (5.3%) | 149 (2.6%) |
| $100,000+ | 678 (11.4%) | 355 (6.2%) |
| Total | 5,957 (100.0%) | 5,747 (100.0%) |
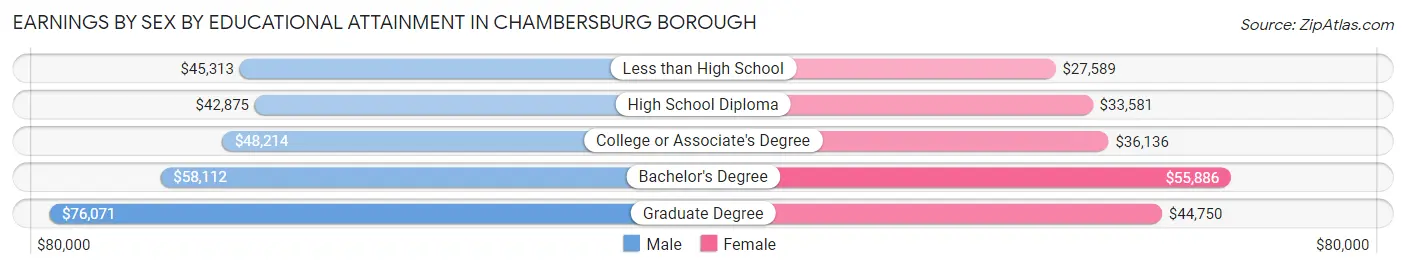
Earnings by Sex by Educational Attainment in Chambersburg borough
Average earnings in Chambersburg borough are $46,812 for men and $37,422 for women, a difference of 20.1%. Men with an educational attainment of graduate degree enjoy the highest average annual earnings of $76,071, while those with high school diploma education earn the least with $42,875. Women with an educational attainment of bachelor's degree earn the most with the average annual earnings of $55,886, while those with less than high school education have the smallest earnings of $27,589.
| Educational Attainment | Male Income | Female Income |
| Less than High School | $45,313 | $27,589 |
| High School Diploma | $42,875 | $33,581 |
| College or Associate's Degree | $48,214 | $36,136 |
| Bachelor's Degree | $58,112 | $55,886 |
| Graduate Degree | $76,071 | $44,750 |
| Total | $46,812 | $37,422 |
Family Income in Chambersburg borough
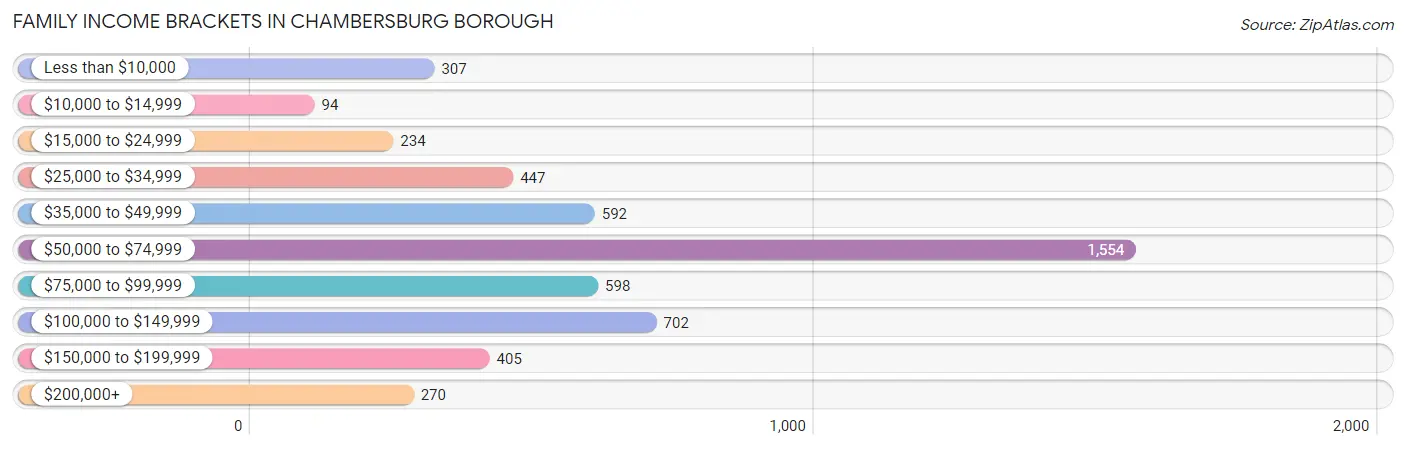
Family Income Brackets in Chambersburg borough
According to the Chambersburg borough family income data, there are 1,554 families falling into the $50,000 to $74,999 income range, which is the most common income bracket and makes up 29.9% of all families. Conversely, the $10,000 to $14,999 income bracket is the least frequent group with only 94 families (1.8%) belonging to this category.
| Income Bracket | # Families | % Families |
| Less than $10,000 | 307 | 5.9% |
| $10,000 to $14,999 | 94 | 1.8% |
| $15,000 to $24,999 | 234 | 4.5% |
| $25,000 to $34,999 | 447 | 8.6% |
| $35,000 to $49,999 | 592 | 11.4% |
| $50,000 to $74,999 | 1,554 | 29.9% |
| $75,000 to $99,999 | 598 | 11.5% |
| $100,000 to $149,999 | 702 | 13.5% |
| $150,000 to $199,999 | 405 | 7.8% |
| $200,000+ | 270 | 5.2% |
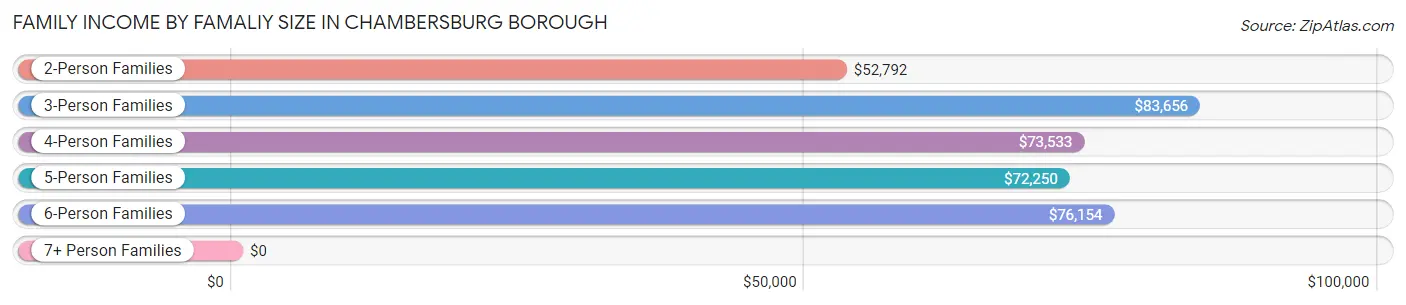
Family Income by Famaliy Size in Chambersburg borough
3-person families (1,027 | 19.8%) account for the highest median family income in Chambersburg borough with $83,656 per family, while 3-person families (1,027 | 19.8%) have the highest median income of $27,885 per family member.
| Income Bracket | # Families | Median Income |
| 2-Person Families | 2,816 (54.2%) | $52,792 |
| 3-Person Families | 1,027 (19.8%) | $83,656 |
| 4-Person Families | 681 (13.1%) | $73,533 |
| 5-Person Families | 374 (7.2%) | $72,250 |
| 6-Person Families | 218 (4.2%) | $76,154 |
| 7+ Person Families | 81 (1.6%) | $0 |
| Total | 5,197 (100.0%) | $59,447 |
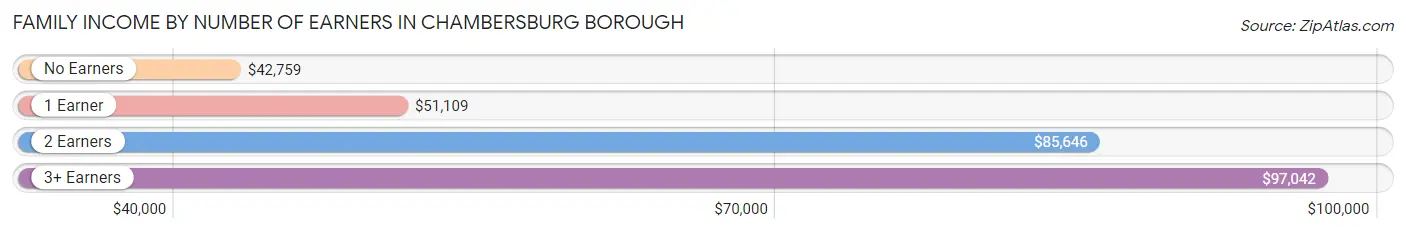
Family Income by Number of Earners in Chambersburg borough
The median family income in Chambersburg borough is $59,447, with families comprising 3+ earners (691) having the highest median family income of $97,042, while families with no earners (1,052) have the lowest median family income of $42,759, accounting for 13.3% and 20.2% of families, respectively.
| Number of Earners | # Families | Median Income |
| No Earners | 1,052 (20.2%) | $42,759 |
| 1 Earner | 1,695 (32.6%) | $51,109 |
| 2 Earners | 1,759 (33.9%) | $85,646 |
| 3+ Earners | 691 (13.3%) | $97,042 |
| Total | 5,197 (100.0%) | $59,447 |
Household Income in Chambersburg borough
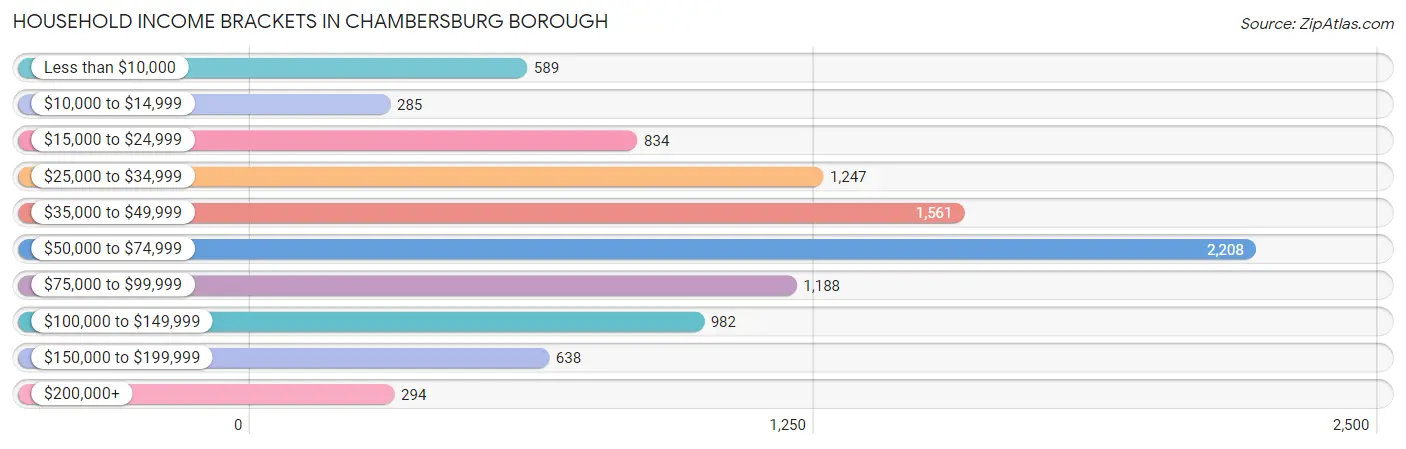
Household Income Brackets in Chambersburg borough
With 2,208 households falling in the category, the $50,000 to $74,999 income range is the most frequent in Chambersburg borough, accounting for 22.5% of all households. In contrast, only 285 households (2.9%) fall into the $10,000 to $14,999 income bracket, making it the least populous group.
| Income Bracket | # Households | % Households |
| Less than $10,000 | 589 | 6.0% |
| $10,000 to $14,999 | 285 | 2.9% |
| $15,000 to $24,999 | 834 | 8.5% |
| $25,000 to $34,999 | 1,247 | 12.7% |
| $35,000 to $49,999 | 1,561 | 15.9% |
| $50,000 to $74,999 | 2,208 | 22.5% |
| $75,000 to $99,999 | 1,188 | 12.1% |
| $100,000 to $149,999 | 982 | 10.0% |
| $150,000 to $199,999 | 638 | 6.5% |
| $200,000+ | 294 | 3.0% |
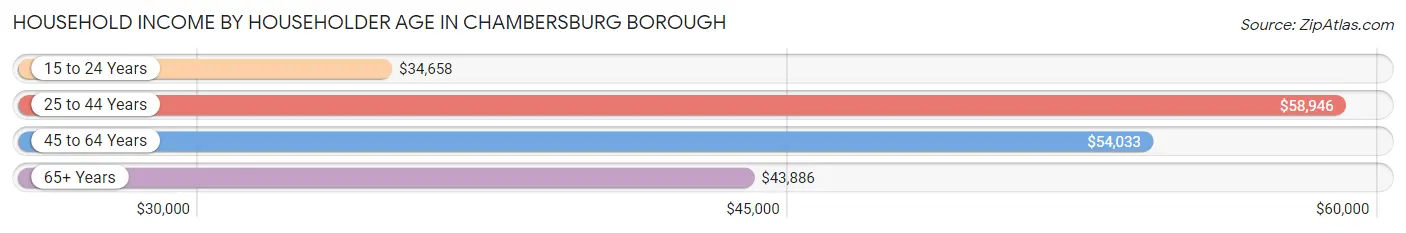
Household Income by Householder Age in Chambersburg borough
The median household income in Chambersburg borough is $53,493, with the highest median household income of $58,946 found in the 25 to 44 years age bracket for the primary householder. A total of 3,447 households (35.1%) fall into this category. Meanwhile, the 15 to 24 years age bracket for the primary householder has the lowest median household income of $34,658, with 313 households (3.2%) in this group.
| Income Bracket | # Households | Median Income |
| 15 to 24 Years | 313 (3.2%) | $34,658 |
| 25 to 44 Years | 3,447 (35.1%) | $58,946 |
| 45 to 64 Years | 3,279 (33.4%) | $54,033 |
| 65+ Years | 2,776 (28.3%) | $43,886 |
| Total | 9,815 (100.0%) | $53,493 |
Poverty in Chambersburg borough
Income Below Poverty by Sex and Age in Chambersburg borough
With 12.7% poverty level for males and 14.8% for females among the residents of Chambersburg borough, 12 to 14 year old males and 18 to 24 year old females are the most vulnerable to poverty, with 97 males (29.4%) and 208 females (25.2%) in their respective age groups living below the poverty level.
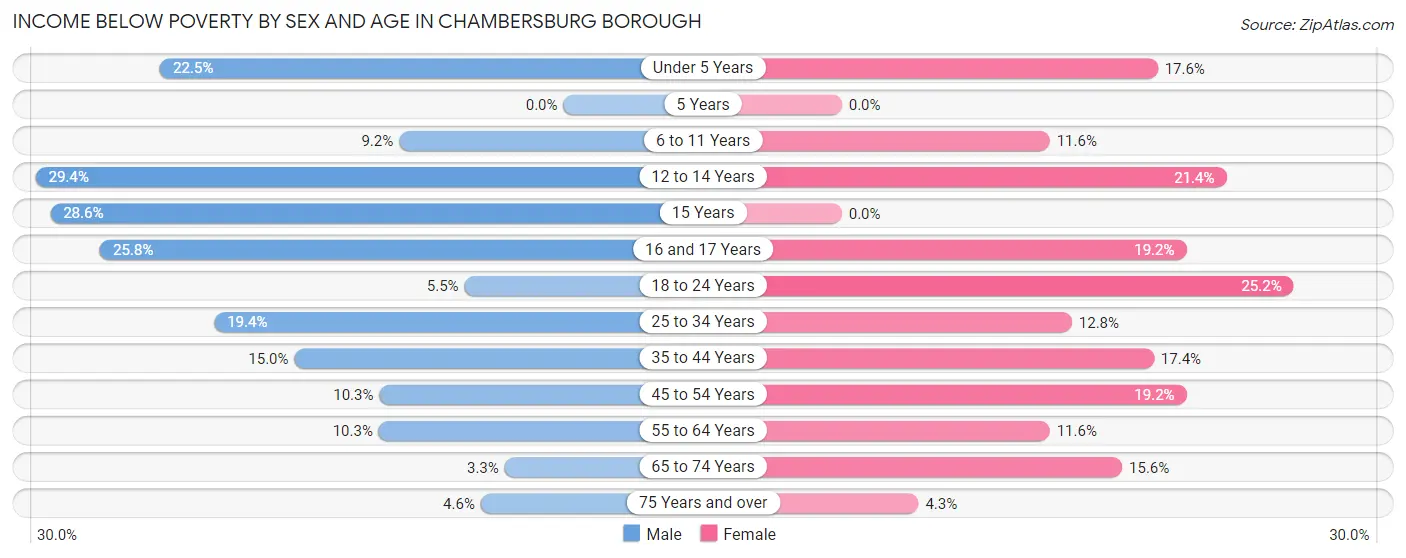
| Age Bracket | Male | Female |
| Under 5 Years | 128 (22.5%) | 73 (17.6%) |
| 5 Years | 0 (0.0%) | 0 (0.0%) |
| 6 to 11 Years | 78 (9.1%) | 96 (11.6%) |
| 12 to 14 Years | 97 (29.4%) | 88 (21.4%) |
| 15 Years | 36 (28.6%) | 0 (0.0%) |
| 16 and 17 Years | 73 (25.8%) | 28 (19.2%) |
| 18 to 24 Years | 52 (5.5%) | 208 (25.2%) |
| 25 to 34 Years | 328 (19.4%) | 199 (12.8%) |
| 35 to 44 Years | 196 (15.0%) | 245 (17.4%) |
| 45 to 54 Years | 130 (10.2%) | 305 (19.2%) |
| 55 to 64 Years | 131 (10.3%) | 132 (11.6%) |
| 65 to 74 Years | 31 (3.3%) | 170 (15.6%) |
| 75 Years and over | 28 (4.6%) | 54 (4.3%) |
| Total | 1,308 (12.7%) | 1,598 (14.8%) |
Income Above Poverty by Sex and Age in Chambersburg borough
According to the poverty statistics in Chambersburg borough, males aged 5 years and females aged 5 years are the age groups that are most secure financially, with 100.0% of males and 100.0% of females in these age groups living above the poverty line.
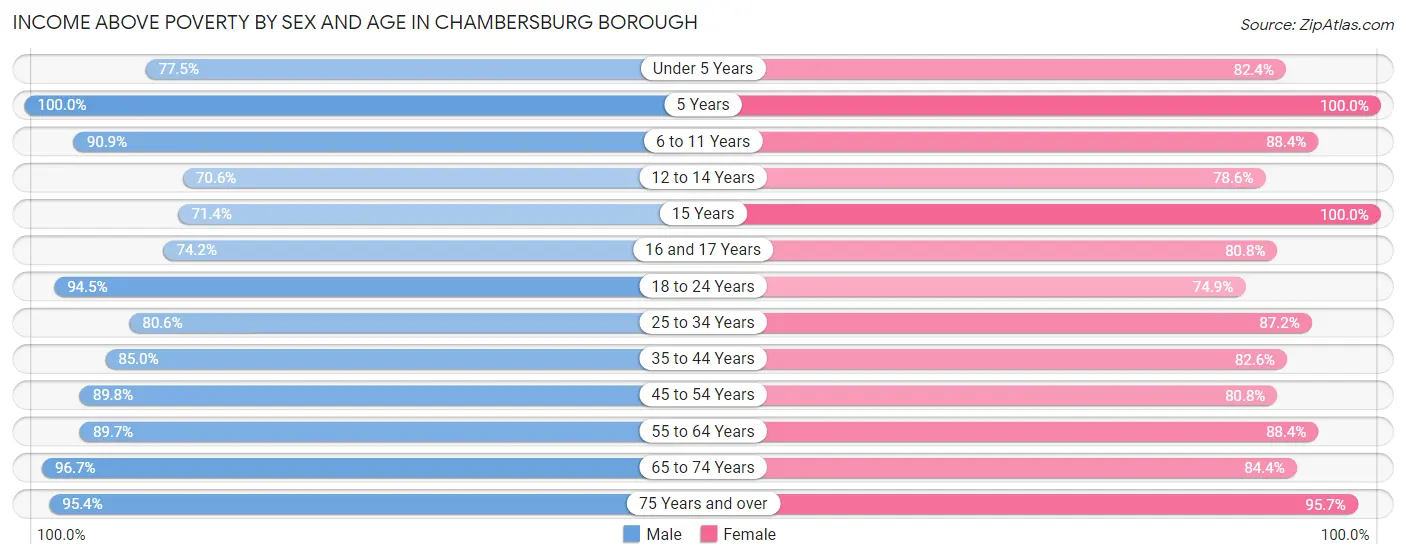
| Age Bracket | Male | Female |
| Under 5 Years | 442 (77.5%) | 342 (82.4%) |
| 5 Years | 134 (100.0%) | 68 (100.0%) |
| 6 to 11 Years | 774 (90.8%) | 733 (88.4%) |
| 12 to 14 Years | 233 (70.6%) | 323 (78.6%) |
| 15 Years | 90 (71.4%) | 70 (100.0%) |
| 16 and 17 Years | 210 (74.2%) | 118 (80.8%) |
| 18 to 24 Years | 891 (94.5%) | 619 (74.9%) |
| 25 to 34 Years | 1,359 (80.6%) | 1,354 (87.2%) |
| 35 to 44 Years | 1,112 (85.0%) | 1,165 (82.6%) |
| 45 to 54 Years | 1,138 (89.7%) | 1,284 (80.8%) |
| 55 to 64 Years | 1,143 (89.7%) | 1,008 (88.4%) |
| 65 to 74 Years | 918 (96.7%) | 919 (84.4%) |
| 75 Years and over | 581 (95.4%) | 1,210 (95.7%) |
| Total | 9,025 (87.3%) | 9,213 (85.2%) |
Income Below Poverty Among Married-Couple Families in Chambersburg borough
The poverty statistics for married-couple families in Chambersburg borough show that 7.0% or 223 of the total 3,162 families live below the poverty line. Families with 3 or 4 children have the highest poverty rate of 15.5%, comprising of 67 families. On the other hand, families with no children have the lowest poverty rate of 5.7%, which includes 94 families.
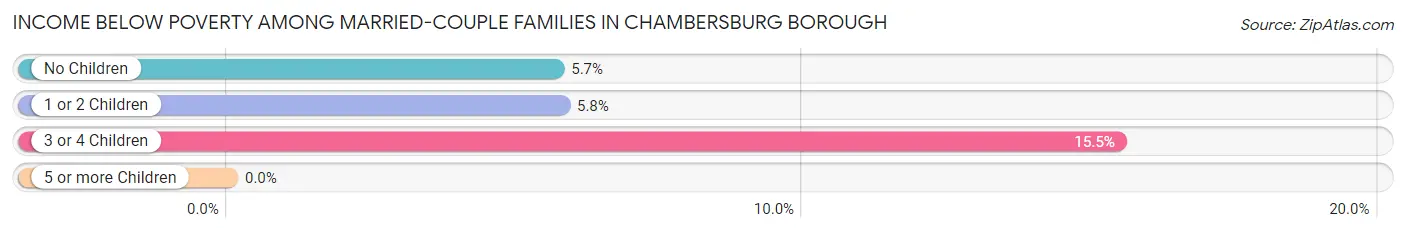
| Children | Above Poverty | Below Poverty |
| No Children | 1,562 (94.3%) | 94 (5.7%) |
| 1 or 2 Children | 1,011 (94.2%) | 62 (5.8%) |
| 3 or 4 Children | 366 (84.5%) | 67 (15.5%) |
| 5 or more Children | 0 (0.0%) | 0 (0.0%) |
| Total | 2,939 (92.9%) | 223 (7.0%) |
Income Below Poverty Among Single-Parent Households in Chambersburg borough
According to the poverty data in Chambersburg borough, 20.8% or 133 single-father households and 17.5% or 244 single-mother households are living below the poverty line. Among single-father households, those with 1 or 2 children have the highest poverty rate, with 133 households (30.9%) experiencing poverty. Likewise, among single-mother households, those with 3 or 4 children have the highest poverty rate, with 28 households (33.3%) falling below the poverty line.
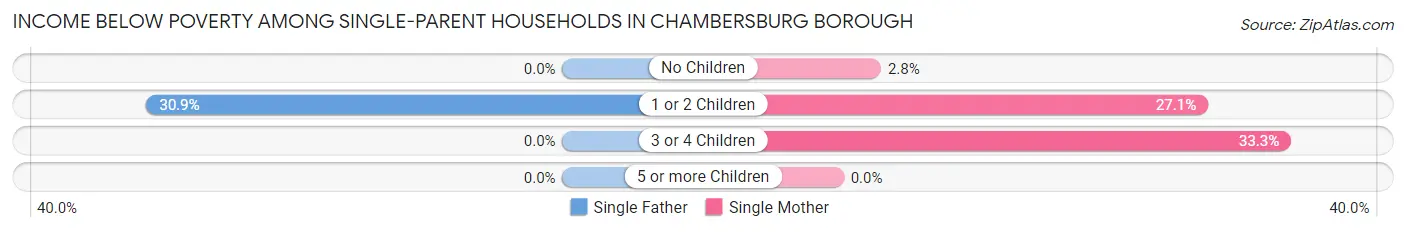
| Children | Single Father | Single Mother |
| No Children | 0 (0.0%) | 16 (2.8%) |
| 1 or 2 Children | 133 (30.9%) | 200 (27.1%) |
| 3 or 4 Children | 0 (0.0%) | 28 (33.3%) |
| 5 or more Children | 0 (0.0%) | 0 (0.0%) |
| Total | 133 (20.8%) | 244 (17.5%) |
Income Below Poverty Among Married-Couple vs Single-Parent Households in Chambersburg borough
The poverty data for Chambersburg borough shows that 223 of the married-couple family households (7.0%) and 377 of the single-parent households (18.5%) are living below the poverty level. Within the married-couple family households, those with 3 or 4 children have the highest poverty rate, with 67 households (15.5%) falling below the poverty line. Among the single-parent households, those with 3 or 4 children have the highest poverty rate, with 28 household (33.3%) living below poverty.
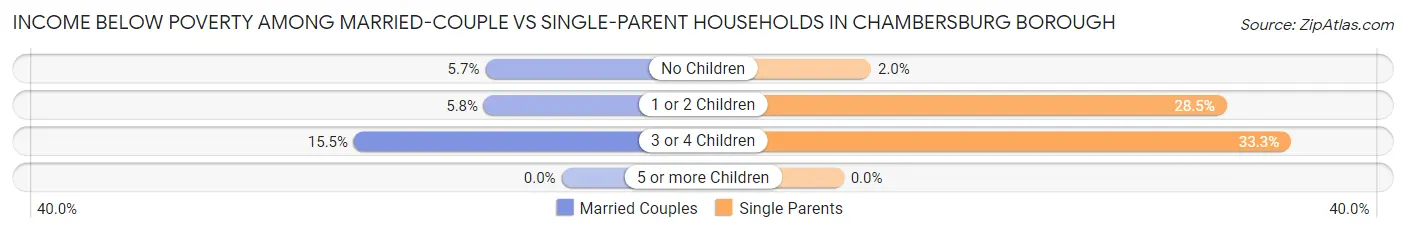
| Children | Married-Couple Families | Single-Parent Households |
| No Children | 94 (5.7%) | 16 (2.0%) |
| 1 or 2 Children | 62 (5.8%) | 333 (28.5%) |
| 3 or 4 Children | 67 (15.5%) | 28 (33.3%) |
| 5 or more Children | 0 (0.0%) | 0 (0.0%) |
| Total | 223 (7.0%) | 377 (18.5%) |
Race in Chambersburg borough
The most populous races in Chambersburg borough are White / Caucasian (16,273 | 74.3%), Hispanic or Latino (4,306 | 19.7%), and Black / African American (2,090 | 9.5%).
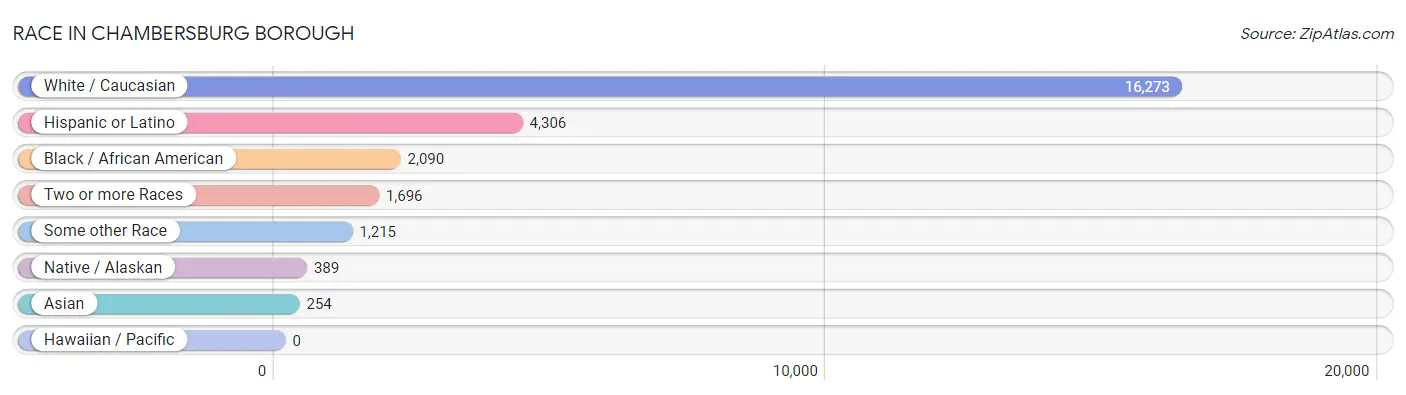
| Race | # Population | % Population |
| Asian | 254 | 1.2% |
| Black / African American | 2,090 | 9.5% |
| Hawaiian / Pacific | 0 | 0.0% |
| Hispanic or Latino | 4,306 | 19.7% |
| Native / Alaskan | 389 | 1.8% |
| White / Caucasian | 16,273 | 74.3% |
| Two or more Races | 1,696 | 7.7% |
| Some other Race | 1,215 | 5.5% |
| Total | 21,917 | 100.0% |
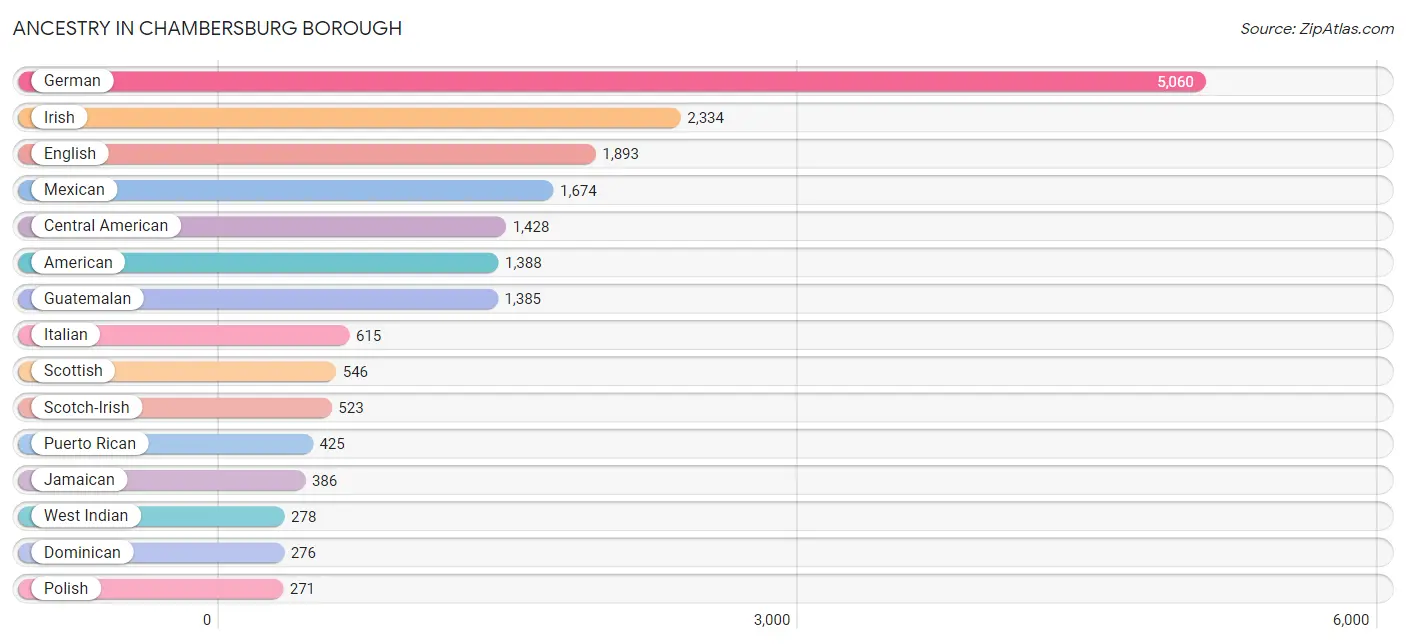
Ancestry in Chambersburg borough
The most populous ancestries reported in Chambersburg borough are German (5,060 | 23.1%), Irish (2,334 | 10.6%), English (1,893 | 8.6%), Mexican (1,674 | 7.6%), and Central American (1,428 | 6.5%), together accounting for 56.5% of all Chambersburg borough residents.
| Ancestry | # Population | % Population |
| African | 122 | 0.6% |
| American | 1,388 | 6.3% |
| Arab | 46 | 0.2% |
| Armenian | 90 | 0.4% |
| Austrian | 131 | 0.6% |
| Belizean | 80 | 0.4% |
| Bhutanese | 15 | 0.1% |
| Blackfeet | 34 | 0.2% |
| Brazilian | 8 | 0.0% |
| British | 31 | 0.1% |
| Bulgarian | 13 | 0.1% |
| Burmese | 75 | 0.3% |
| Central American | 1,428 | 6.5% |
| Central American Indian | 29 | 0.1% |
| Cherokee | 101 | 0.5% |
| Chilean | 24 | 0.1% |
| Choctaw | 14 | 0.1% |
| Costa Rican | 43 | 0.2% |
| Croatian | 122 | 0.6% |
| Cuban | 3 | 0.0% |
| Czechoslovakian | 9 | 0.0% |
| Delaware | 13 | 0.1% |
| Dominican | 276 | 1.3% |
| Dutch | 236 | 1.1% |
| Eastern European | 22 | 0.1% |
| Ecuadorian | 36 | 0.2% |
| English | 1,893 | 8.6% |
| European | 139 | 0.6% |
| Finnish | 15 | 0.1% |
| French | 226 | 1.0% |
| French Canadian | 9 | 0.0% |
| German | 5,060 | 23.1% |
| Greek | 54 | 0.3% |
| Guatemalan | 1,385 | 6.3% |
| Haitian | 103 | 0.5% |
| Hungarian | 160 | 0.7% |
| Indian (Asian) | 108 | 0.5% |
| Iranian | 28 | 0.1% |
| Irish | 2,334 | 10.6% |
| Italian | 615 | 2.8% |
| Jamaican | 386 | 1.8% |
| Korean | 10 | 0.1% |
| Lebanese | 31 | 0.1% |
| Lithuanian | 13 | 0.1% |
| Mexican | 1,674 | 7.6% |
| Mexican American Indian | 186 | 0.9% |
| Moroccan | 15 | 0.1% |
| Nigerian | 13 | 0.1% |
| Northern European | 42 | 0.2% |
| Norwegian | 101 | 0.5% |
| Pakistani | 15 | 0.1% |
| Pennsylvania German | 46 | 0.2% |
| Peruvian | 190 | 0.9% |
| Polish | 271 | 1.2% |
| Puerto Rican | 425 | 1.9% |
| Romanian | 4 | 0.0% |
| Russian | 195 | 0.9% |
| Scandinavian | 58 | 0.3% |
| Scotch-Irish | 523 | 2.4% |
| Scottish | 546 | 2.5% |
| Shoshone | 9 | 0.0% |
| Sioux | 6 | 0.0% |
| Slovak | 66 | 0.3% |
| Slovene | 17 | 0.1% |
| South American | 250 | 1.1% |
| Spanish | 133 | 0.6% |
| Sri Lankan | 83 | 0.4% |
| Subsaharan African | 135 | 0.6% |
| Swedish | 102 | 0.5% |
| Swiss | 194 | 0.9% |
| Thai | 106 | 0.5% |
| Trinidadian and Tobagonian | 18 | 0.1% |
| Ukrainian | 20 | 0.1% |
| Welsh | 270 | 1.2% |
| West Indian | 278 | 1.3% | View All 75 Rows |
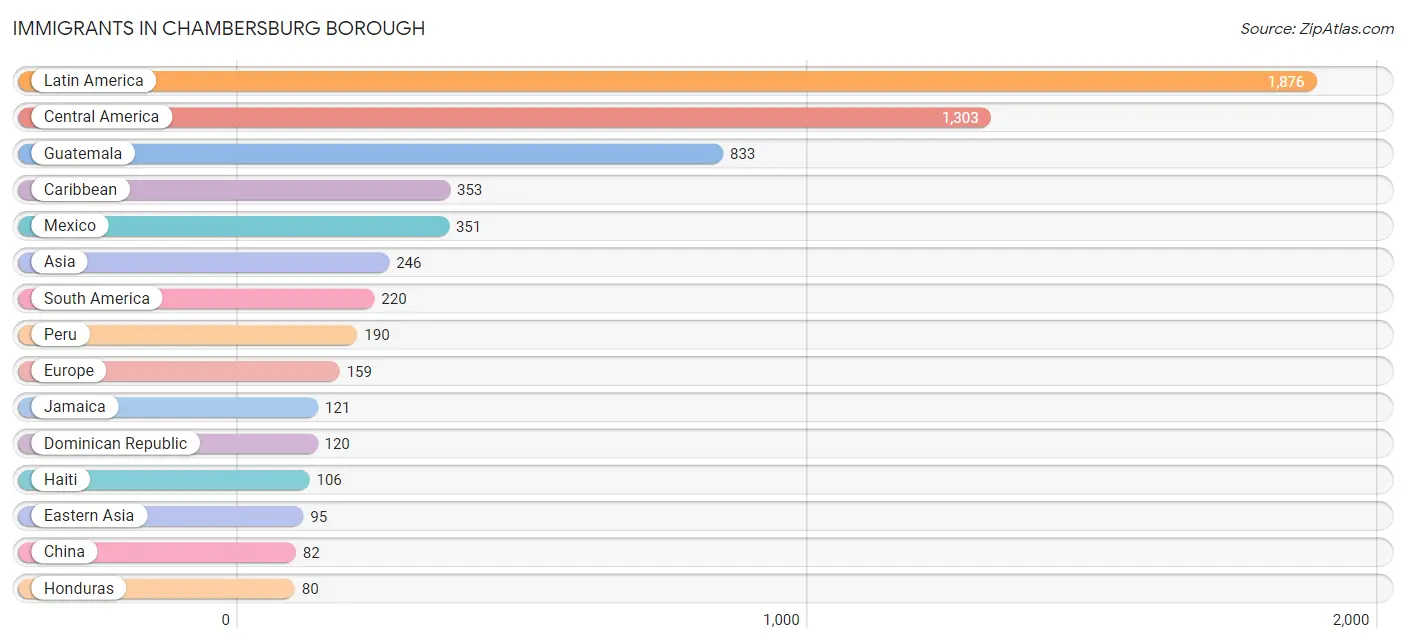
Immigrants in Chambersburg borough
The most numerous immigrant groups reported in Chambersburg borough came from Latin America (1,876 | 8.6%), Central America (1,303 | 5.9%), Guatemala (833 | 3.8%), Caribbean (353 | 1.6%), and Mexico (351 | 1.6%), together accounting for 21.5% of all Chambersburg borough residents.
| Immigration Origin | # Population | % Population |
| Africa | 22 | 0.1% |
| Armenia | 39 | 0.2% |
| Asia | 246 | 1.1% |
| Belize | 29 | 0.1% |
| Bosnia and Herzegovina | 38 | 0.2% |
| Brazil | 15 | 0.1% |
| Canada | 41 | 0.2% |
| Caribbean | 353 | 1.6% |
| Central America | 1,303 | 5.9% |
| China | 82 | 0.4% |
| Costa Rica | 10 | 0.1% |
| Croatia | 5 | 0.0% |
| Dominican Republic | 120 | 0.5% |
| Eastern Asia | 95 | 0.4% |
| Eastern Europe | 43 | 0.2% |
| Ecuador | 15 | 0.1% |
| England | 14 | 0.1% |
| Europe | 159 | 0.7% |
| Germany | 24 | 0.1% |
| Greece | 13 | 0.1% |
| Guatemala | 833 | 3.8% |
| Haiti | 106 | 0.5% |
| Honduras | 80 | 0.4% |
| India | 46 | 0.2% |
| Italy | 9 | 0.0% |
| Jamaica | 121 | 0.5% |
| Japan | 13 | 0.1% |
| Latin America | 1,876 | 8.6% |
| Lebanon | 16 | 0.1% |
| Mexico | 351 | 1.6% |
| Morocco | 15 | 0.1% |
| Netherlands | 56 | 0.3% |
| Northern Africa | 15 | 0.1% |
| Northern Europe | 14 | 0.1% |
| Pakistan | 25 | 0.1% |
| Peru | 190 | 0.9% |
| Philippines | 10 | 0.1% |
| South America | 220 | 1.0% |
| South Central Asia | 71 | 0.3% |
| South Eastern Asia | 25 | 0.1% |
| Southern Europe | 22 | 0.1% |
| Trinidad and Tobago | 6 | 0.0% |
| Vietnam | 15 | 0.1% |
| Western Asia | 55 | 0.3% |
| Western Europe | 80 | 0.4% | View All 45 Rows |
Sex and Age in Chambersburg borough
Sex and Age in Chambersburg borough
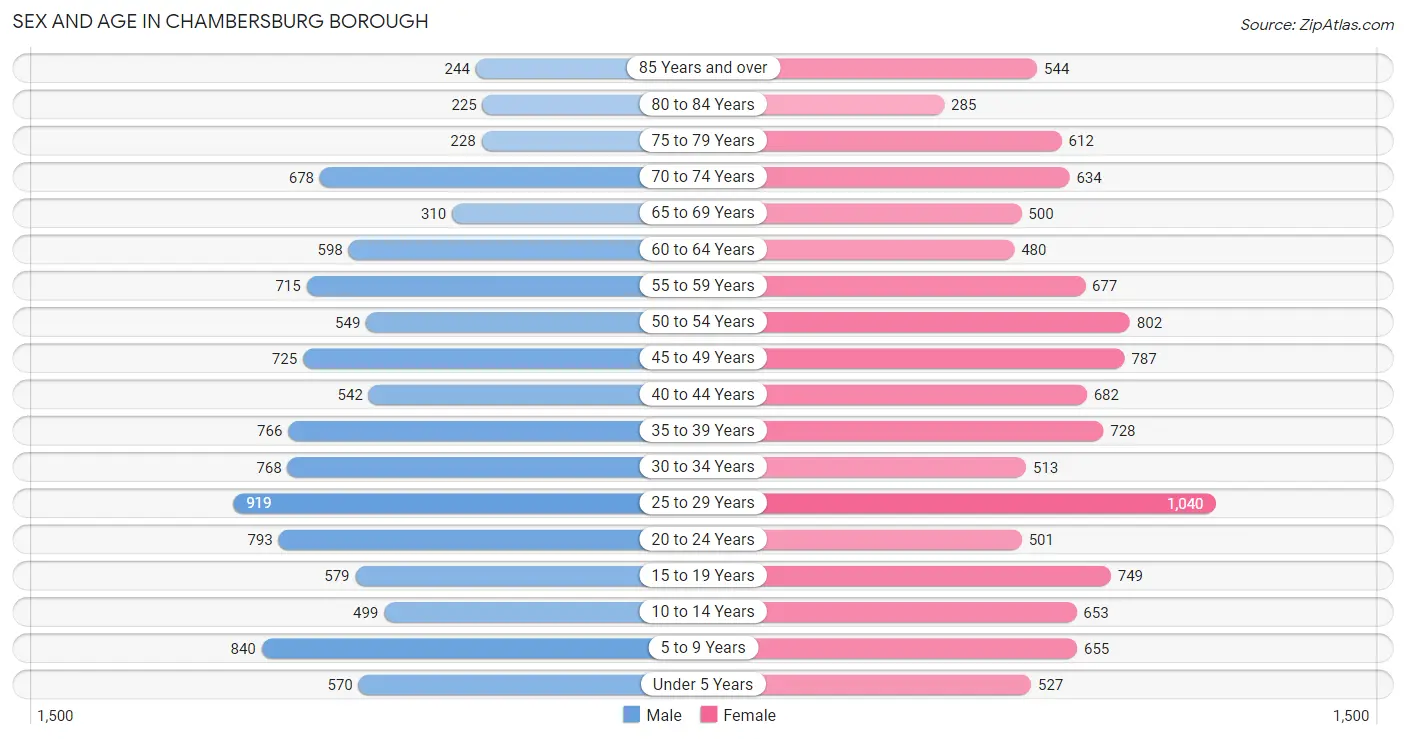
The most populous age groups in Chambersburg borough are 25 to 29 Years (919 | 8.7%) for men and 25 to 29 Years (1,040 | 9.1%) for women.
| Age Bracket | Male | Female |
| Under 5 Years | 570 (5.4%) | 527 (4.6%) |
| 5 to 9 Years | 840 (8.0%) | 655 (5.8%) |
| 10 to 14 Years | 499 (4.7%) | 653 (5.7%) |
| 15 to 19 Years | 579 (5.5%) | 749 (6.6%) |
| 20 to 24 Years | 793 (7.5%) | 501 (4.4%) |
| 25 to 29 Years | 919 (8.7%) | 1,040 (9.1%) |
| 30 to 34 Years | 768 (7.3%) | 513 (4.5%) |
| 35 to 39 Years | 766 (7.3%) | 728 (6.4%) |
| 40 to 44 Years | 542 (5.1%) | 682 (6.0%) |
| 45 to 49 Years | 725 (6.9%) | 787 (6.9%) |
| 50 to 54 Years | 549 (5.2%) | 802 (7.0%) |
| 55 to 59 Years | 715 (6.8%) | 677 (5.9%) |
| 60 to 64 Years | 598 (5.7%) | 480 (4.2%) |
| 65 to 69 Years | 310 (2.9%) | 500 (4.4%) |
| 70 to 74 Years | 678 (6.4%) | 634 (5.6%) |
| 75 to 79 Years | 228 (2.2%) | 612 (5.4%) |
| 80 to 84 Years | 225 (2.1%) | 285 (2.5%) |
| 85 Years and over | 244 (2.3%) | 544 (4.8%) |
| Total | 10,548 (100.0%) | 11,369 (100.0%) |
Families and Households in Chambersburg borough
Median Family Size in Chambersburg borough
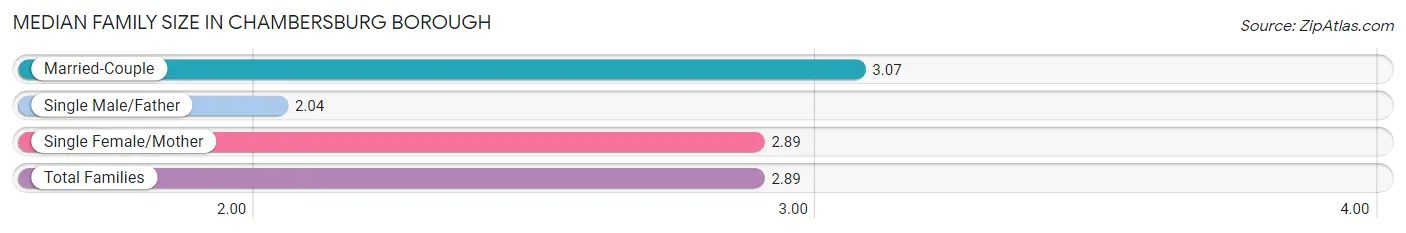
The median family size in Chambersburg borough is 2.89 persons per family, with married-couple families (3,162 | 60.8%) accounting for the largest median family size of 3.07 persons per family. On the other hand, single male/father families (638 | 12.3%) represent the smallest median family size with 2.04 persons per family.
| Family Type | # Families | Family Size |
| Married-Couple | 3,162 (60.8%) | 3.07 |
| Single Male/Father | 638 (12.3%) | 2.04 |
| Single Female/Mother | 1,397 (26.9%) | 2.89 |
| Total Families | 5,197 (100.0%) | 2.89 |
Median Household Size in Chambersburg borough
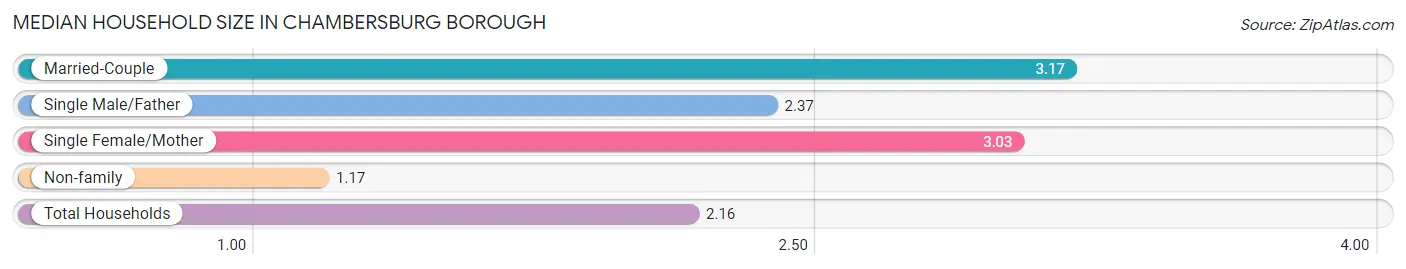
The median household size in Chambersburg borough is 2.16 persons per household, with married-couple households (3,162 | 32.2%) accounting for the largest median household size of 3.17 persons per household. non-family households (4,618 | 47.0%) represent the smallest median household size with 1.17 persons per household.
| Household Type | # Households | Household Size |
| Married-Couple | 3,162 (32.2%) | 3.17 |
| Single Male/Father | 638 (6.5%) | 2.37 |
| Single Female/Mother | 1,397 (14.2%) | 3.03 |
| Non-family | 4,618 (47.0%) | 1.17 |
| Total Households | 9,815 (100.0%) | 2.16 |
Household Size by Marriage Status in Chambersburg borough
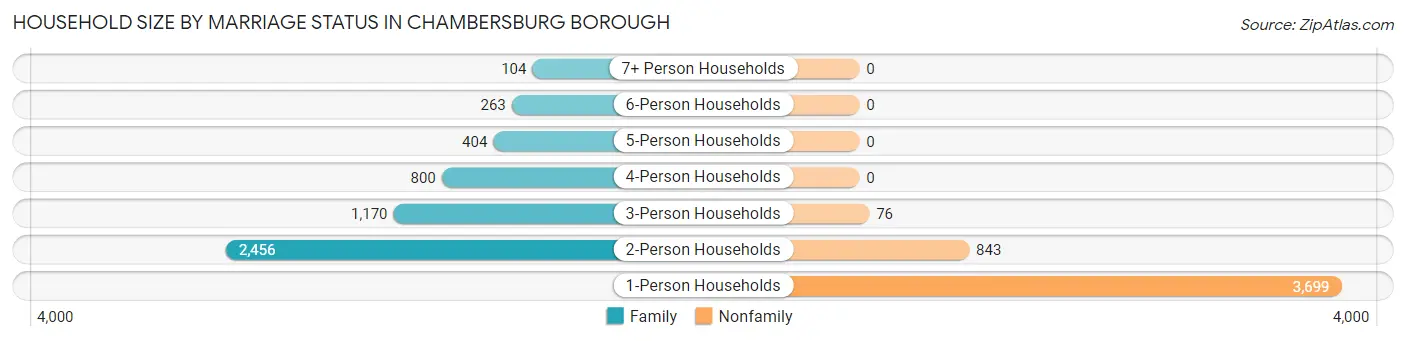
Out of a total of 9,815 households in Chambersburg borough, 5,197 (52.9%) are family households, while 4,618 (47.0%) are nonfamily households. The most numerous type of family households are 2-person households, comprising 2,456, and the most common type of nonfamily households are 1-person households, comprising 3,699.
| Household Size | Family Households | Nonfamily Households |
| 1-Person Households | - | 3,699 (37.7%) |
| 2-Person Households | 2,456 (25.0%) | 843 (8.6%) |
| 3-Person Households | 1,170 (11.9%) | 76 (0.8%) |
| 4-Person Households | 800 (8.2%) | 0 (0.0%) |
| 5-Person Households | 404 (4.1%) | 0 (0.0%) |
| 6-Person Households | 263 (2.7%) | 0 (0.0%) |
| 7+ Person Households | 104 (1.1%) | 0 (0.0%) |
| Total | 5,197 (52.9%) | 4,618 (47.0%) |
Female Fertility in Chambersburg borough
Fertility by Age in Chambersburg borough
Average fertility rate in Chambersburg borough is 37.0 births per 1,000 women. Women in the age bracket of 35 to 50 years have the highest fertility rate with 45.0 births per 1,000 women. Women in the age bracket of 35 to 50 years acount for 55.4% of all women with births.
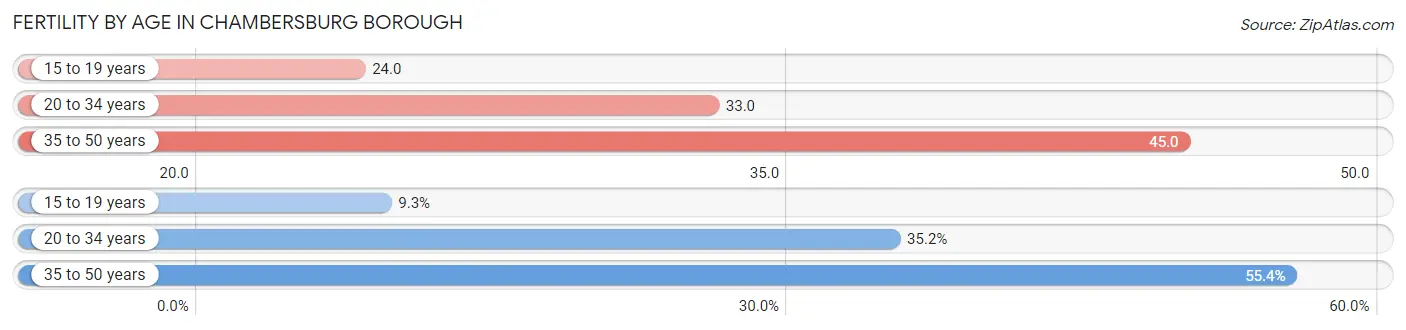
| Age Bracket | Women with Births | Births / 1,000 Women |
| 15 to 19 years | 18 (9.3%) | 24.0 |
| 20 to 34 years | 68 (35.2%) | 33.0 |
| 35 to 50 years | 107 (55.4%) | 45.0 |
| Total | 193 (100.0%) | 37.0 |
Fertility by Age by Marriage Status in Chambersburg borough
65.8% of women with births (193) in Chambersburg borough are married. The highest percentage of unmarried women with births falls into 15 to 19 years age bracket with 100.0% of them unmarried at the time of birth, while the lowest percentage of unmarried women with births belong to 35 to 50 years age bracket with 14.0% of them unmarried.
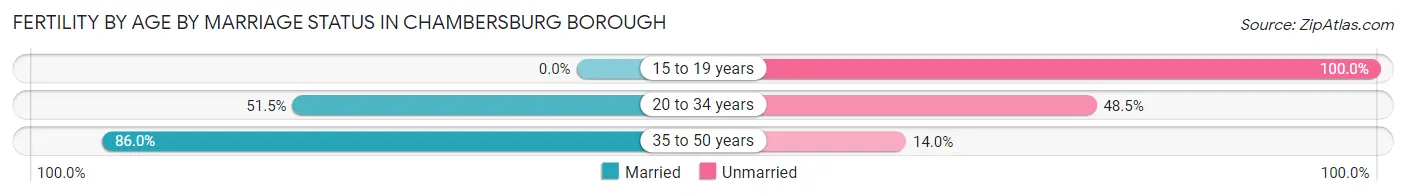
| Age Bracket | Married | Unmarried |
| 15 to 19 years | 0 (0.0%) | 18 (100.0%) |
| 20 to 34 years | 35 (51.5%) | 33 (48.5%) |
| 35 to 50 years | 92 (86.0%) | 15 (14.0%) |
| Total | 127 (65.8%) | 66 (34.2%) |
Fertility by Education in Chambersburg borough
Average fertility rate in Chambersburg borough is 37.0 births per 1,000 women. Women with the education attainment of less than high school have the highest fertility rate of 70.0 births per 1,000 women, while women with the education attainment of graduate degree have the lowest fertility at 19.0 births per 1,000 women. Women with the education attainment of high school diploma represent 37.8% of all women with births.
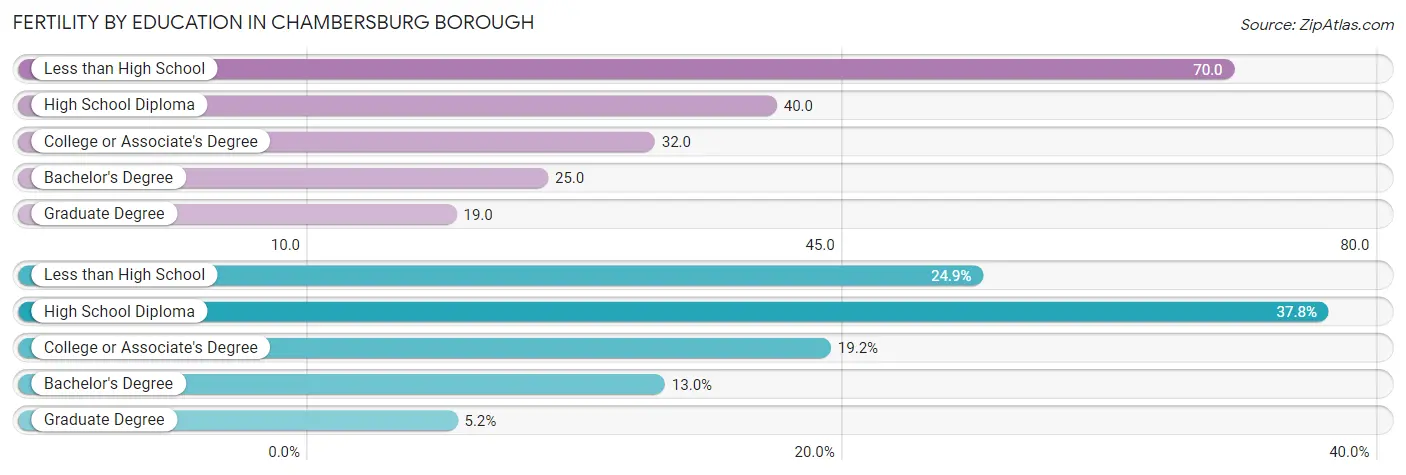
| Educational Attainment | Women with Births | Births / 1,000 Women |
| Less than High School | 48 (24.9%) | 70.0 |
| High School Diploma | 73 (37.8%) | 40.0 |
| College or Associate's Degree | 37 (19.2%) | 32.0 |
| Bachelor's Degree | 25 (13.0%) | 25.0 |
| Graduate Degree | 10 (5.2%) | 19.0 |
| Total | 193 (100.0%) | 37.0 |
Fertility by Education by Marriage Status in Chambersburg borough
34.2% of women with births in Chambersburg borough are unmarried. Women with the educational attainment of bachelor's degree are most likely to be married with 100.0% of them married at childbirth, while women with the educational attainment of less than high school are least likely to be married with 68.8% of them unmarried at childbirth.
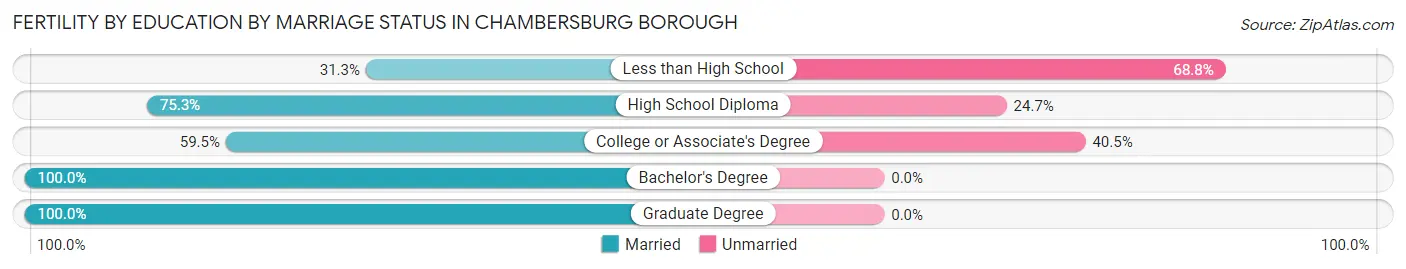
| Educational Attainment | Married | Unmarried |
| Less than High School | 15 (31.2%) | 33 (68.8%) |
| High School Diploma | 55 (75.3%) | 18 (24.7%) |
| College or Associate's Degree | 22 (59.5%) | 15 (40.5%) |
| Bachelor's Degree | 25 (100.0%) | 0 (0.0%) |
| Graduate Degree | 10 (100.0%) | 0 (0.0%) |
| Total | 127 (65.8%) | 66 (34.2%) |
Employment Characteristics in Chambersburg borough
Employment by Class of Employer in Chambersburg borough
Among the 10,337 employed individuals in Chambersburg borough, private company employees (7,419 | 71.8%), not-for-profit organizations (908 | 8.8%), and local government employees (873 | 8.5%) make up the most common classes of employment.
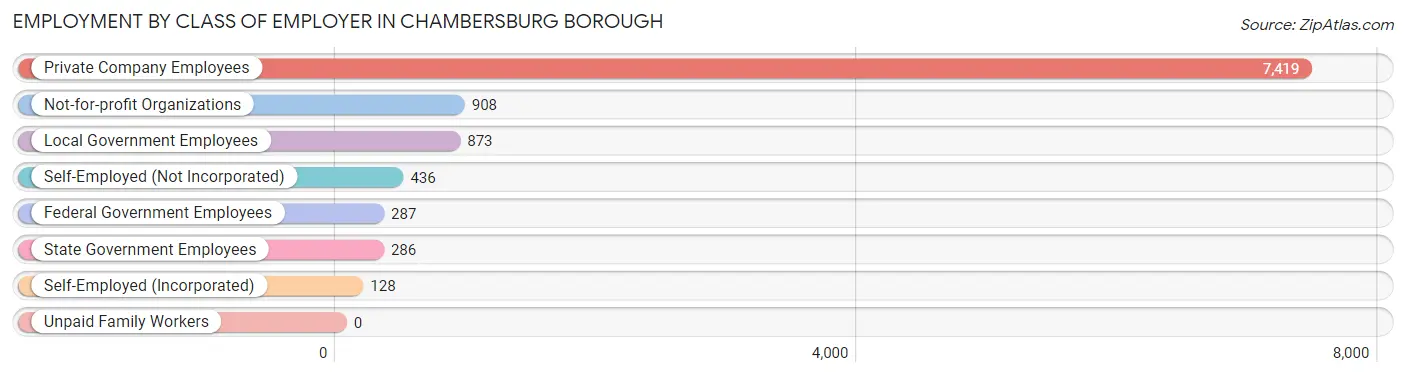
| Employer Class | # Employees | % Employees |
| Private Company Employees | 7,419 | 71.8% |
| Self-Employed (Incorporated) | 128 | 1.2% |
| Self-Employed (Not Incorporated) | 436 | 4.2% |
| Not-for-profit Organizations | 908 | 8.8% |
| Local Government Employees | 873 | 8.5% |
| State Government Employees | 286 | 2.8% |
| Federal Government Employees | 287 | 2.8% |
| Unpaid Family Workers | 0 | 0.0% |
| Total | 10,337 | 100.0% |
Employment Status by Age in Chambersburg borough
According to the labor force statistics for Chambersburg borough, out of the total population over 16 years of age (17,977), 61.4% or 11,038 individuals are in the labor force, with 4.8% or 530 of them unemployed. The age group with the highest labor force participation rate is 25 to 29 years, with 93.6% or 1,834 individuals in the labor force. Within the labor force, the 30 to 34 years age range has the highest percentage of unemployed individuals, with 10.0% or 94 of them being unemployed.
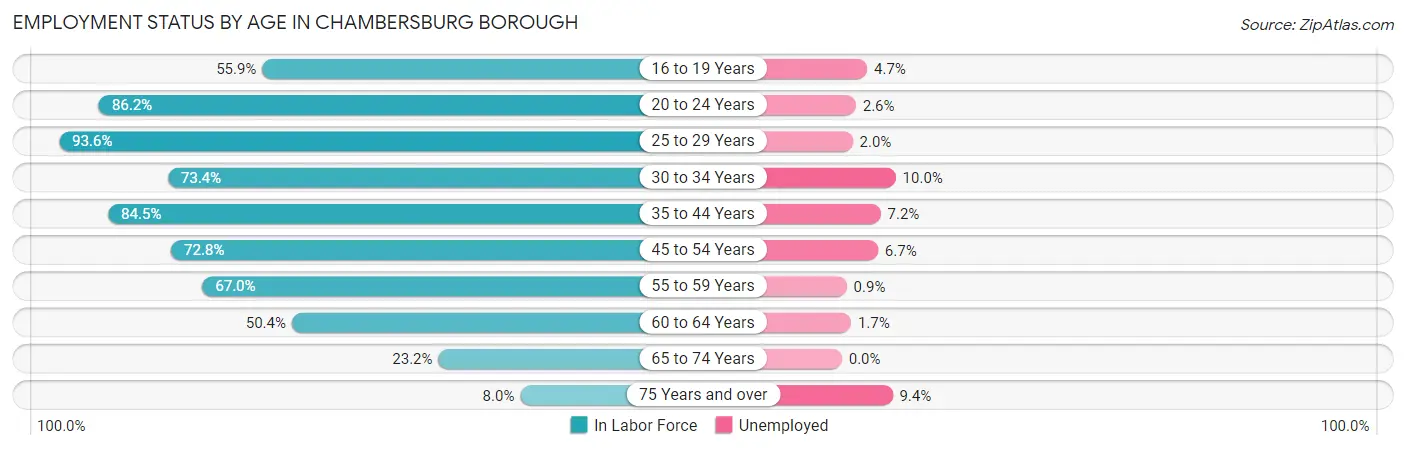
| Age Bracket | In Labor Force | Unemployed |
| 16 to 19 Years | 633 (55.9%) | 30 (4.7%) |
| 20 to 24 Years | 1,115 (86.2%) | 29 (2.6%) |
| 25 to 29 Years | 1,834 (93.6%) | 37 (2.0%) |
| 30 to 34 Years | 940 (73.4%) | 94 (10.0%) |
| 35 to 44 Years | 2,297 (84.5%) | 165 (7.2%) |
| 45 to 54 Years | 2,084 (72.8%) | 140 (6.7%) |
| 55 to 59 Years | 933 (67.0%) | 8 (0.9%) |
| 60 to 64 Years | 543 (50.4%) | 9 (1.7%) |
| 65 to 74 Years | 492 (23.2%) | 0 (0.0%) |
| 75 Years and over | 171 (8.0%) | 16 (9.4%) |
| Total | 11,038 (61.4%) | 530 (4.8%) |
Employment Status by Educational Attainment in Chambersburg borough
According to labor force statistics for Chambersburg borough, 76.4% of individuals (8,626) out of the total population between 25 and 64 years of age (11,291) are in the labor force, with 5.2% or 449 of them being unemployed. The group with the highest labor force participation rate are those with the educational attainment of bachelor's degree or higher, with 88.5% or 2,620 individuals in the labor force. Within the labor force, individuals with high school diploma education have the highest percentage of unemployment, with 8.8% or 325 of them being unemployed.
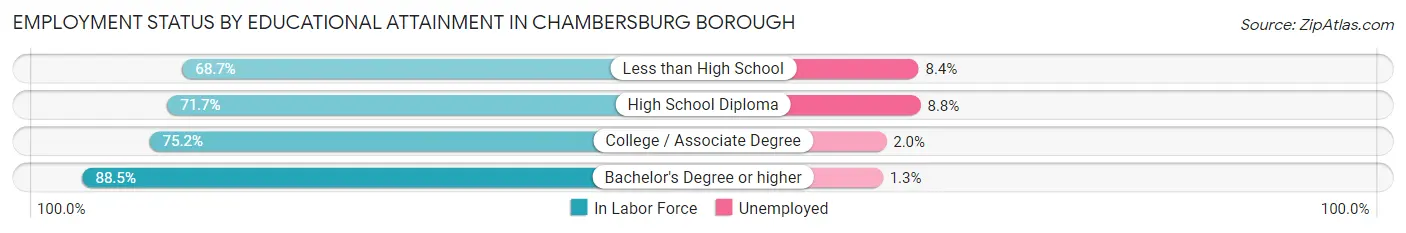
| Educational Attainment | In Labor Force | Unemployed |
| Less than High School | 785 (68.7%) | 96 (8.4%) |
| High School Diploma | 3,691 (71.7%) | 453 (8.8%) |
| College / Associate Degree | 1,535 (75.2%) | 41 (2.0%) |
| Bachelor's Degree or higher | 2,620 (88.5%) | 38 (1.3%) |
| Total | 8,626 (76.4%) | 587 (5.2%) |
Employment Occupations by Sex in Chambersburg borough
Management, Business, Science and Arts Occupations
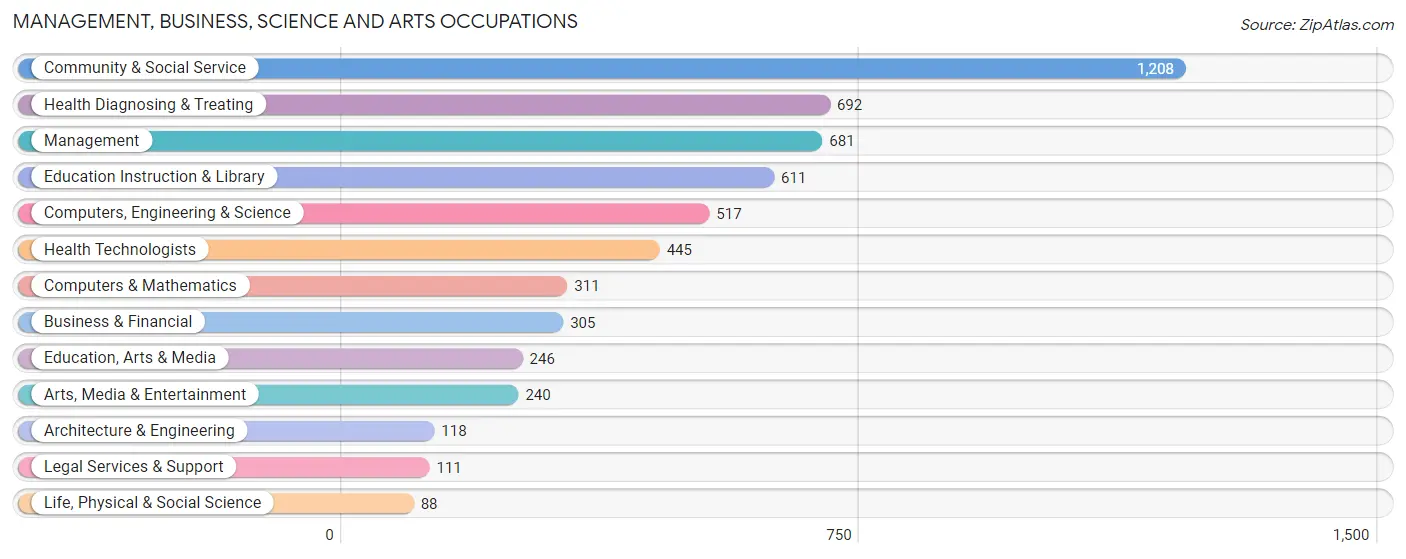
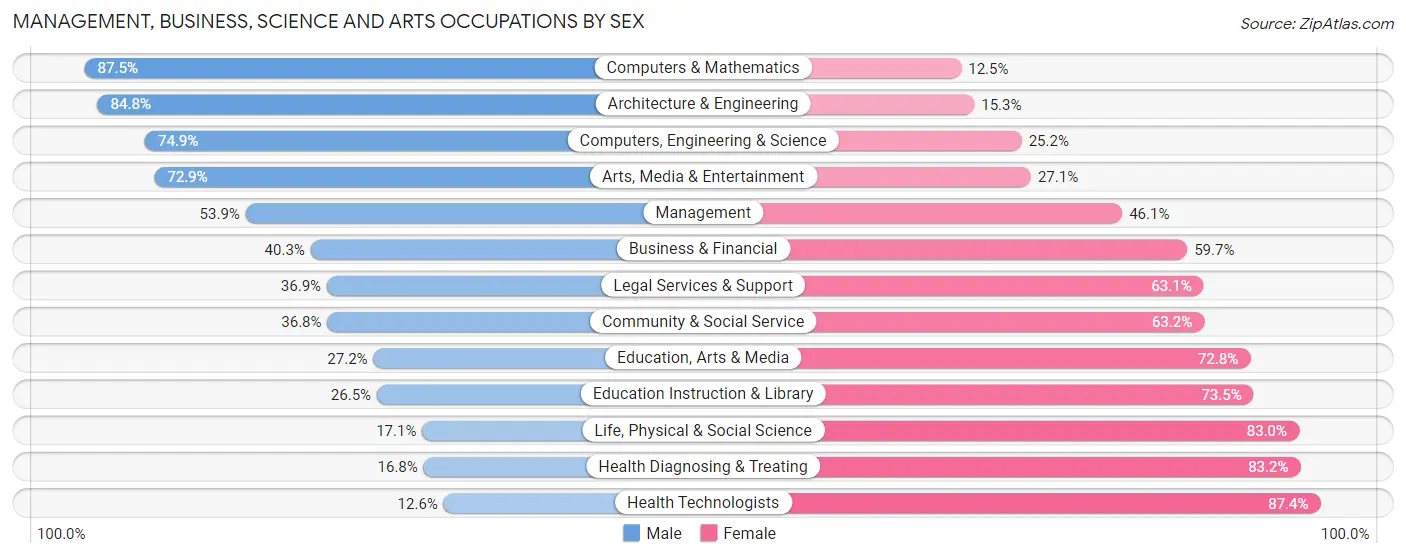
The most common Management, Business, Science and Arts occupations in Chambersburg borough are Community & Social Service (1,208 | 11.5%), Health Diagnosing & Treating (692 | 6.6%), Management (681 | 6.5%), Education Instruction & Library (611 | 5.8%), and Computers, Engineering & Science (517 | 4.9%).
Management, Business, Science and Arts Occupations by Sex
Within the Management, Business, Science and Arts occupations in Chambersburg borough, the most male-oriented occupations are Computers & Mathematics (87.5%), Architecture & Engineering (84.8%), and Computers, Engineering & Science (74.9%), while the most female-oriented occupations are Health Technologists (87.4%), Health Diagnosing & Treating (83.2%), and Life, Physical & Social Science (83.0%).
| Occupation | Male | Female |
| Management | 367 (53.9%) | 314 (46.1%) |
| Business & Financial | 123 (40.3%) | 182 (59.7%) |
| Computers, Engineering & Science | 387 (74.9%) | 130 (25.2%) |
| Computers & Mathematics | 272 (87.5%) | 39 (12.5%) |
| Architecture & Engineering | 100 (84.8%) | 18 (15.2%) |
| Life, Physical & Social Science | 15 (17.1%) | 73 (83.0%) |
| Community & Social Service | 445 (36.8%) | 763 (63.2%) |
| Education, Arts & Media | 67 (27.2%) | 179 (72.8%) |
| Legal Services & Support | 41 (36.9%) | 70 (63.1%) |
| Education Instruction & Library | 162 (26.5%) | 449 (73.5%) |
| Arts, Media & Entertainment | 175 (72.9%) | 65 (27.1%) |
| Health Diagnosing & Treating | 116 (16.8%) | 576 (83.2%) |
| Health Technologists | 56 (12.6%) | 389 (87.4%) |
| Total (Category) | 1,438 (42.3%) | 1,965 (57.7%) |
| Total (Overall) | 5,307 (50.5%) | 5,206 (49.5%) |
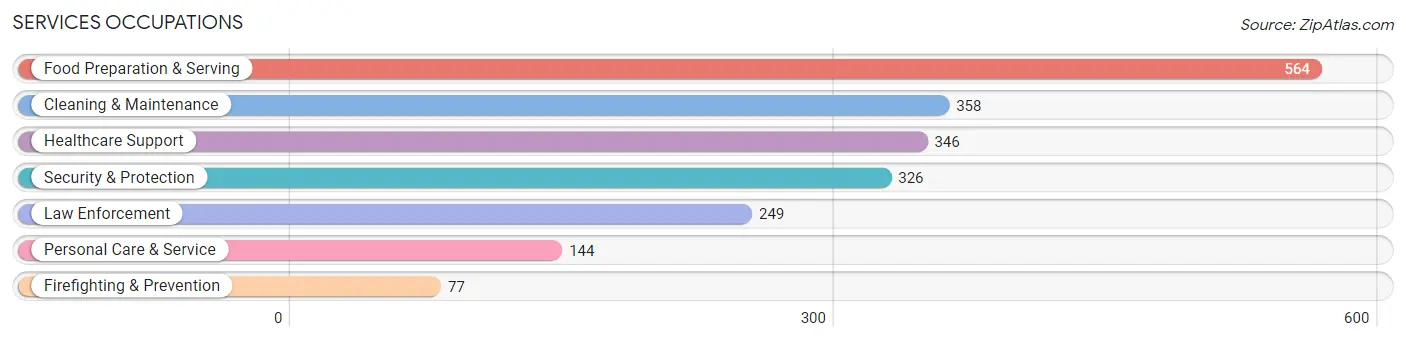
Services Occupations
The most common Services occupations in Chambersburg borough are Food Preparation & Serving (564 | 5.4%), Cleaning & Maintenance (358 | 3.4%), Healthcare Support (346 | 3.3%), Security & Protection (326 | 3.1%), and Law Enforcement (249 | 2.4%).
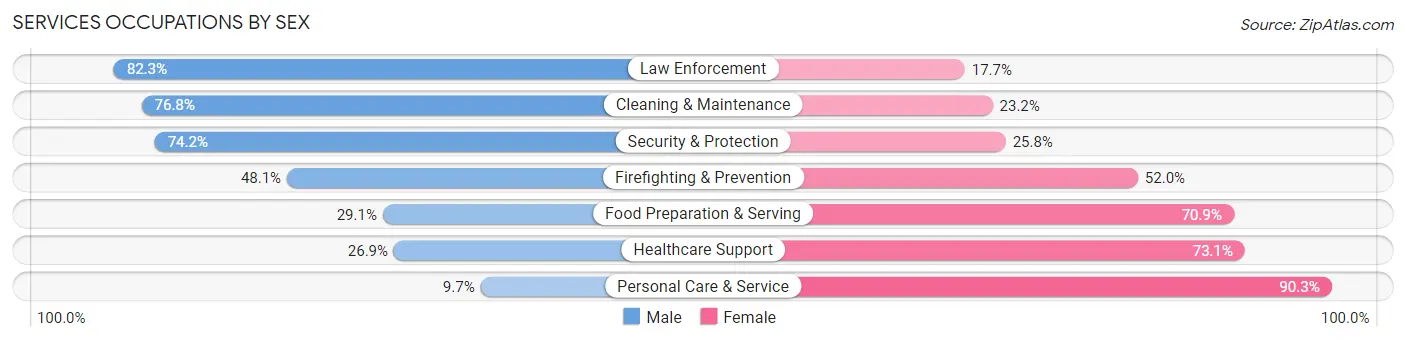
Services Occupations by Sex
Within the Services occupations in Chambersburg borough, the most male-oriented occupations are Law Enforcement (82.3%), Cleaning & Maintenance (76.8%), and Security & Protection (74.2%), while the most female-oriented occupations are Personal Care & Service (90.3%), Healthcare Support (73.1%), and Food Preparation & Serving (70.9%).
| Occupation | Male | Female |
| Healthcare Support | 93 (26.9%) | 253 (73.1%) |
| Security & Protection | 242 (74.2%) | 84 (25.8%) |
| Firefighting & Prevention | 37 (48.0%) | 40 (51.9%) |
| Law Enforcement | 205 (82.3%) | 44 (17.7%) |
| Food Preparation & Serving | 164 (29.1%) | 400 (70.9%) |
| Cleaning & Maintenance | 275 (76.8%) | 83 (23.2%) |
| Personal Care & Service | 14 (9.7%) | 130 (90.3%) |
| Total (Category) | 788 (45.3%) | 950 (54.7%) |
| Total (Overall) | 5,307 (50.5%) | 5,206 (49.5%) |
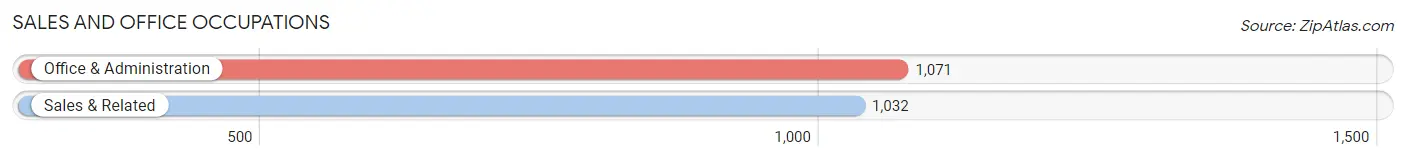
Sales and Office Occupations
The most common Sales and Office occupations in Chambersburg borough are Office & Administration (1,071 | 10.2%), and Sales & Related (1,032 | 9.8%).
Sales and Office Occupations by Sex
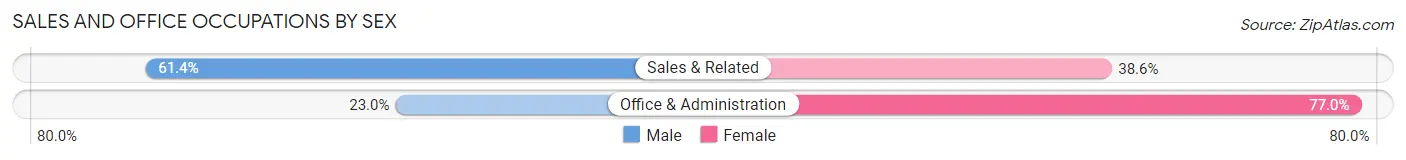
| Occupation | Male | Female |
| Sales & Related | 634 (61.4%) | 398 (38.6%) |
| Office & Administration | 246 (23.0%) | 825 (77.0%) |
| Total (Category) | 880 (41.8%) | 1,223 (58.2%) |
| Total (Overall) | 5,307 (50.5%) | 5,206 (49.5%) |
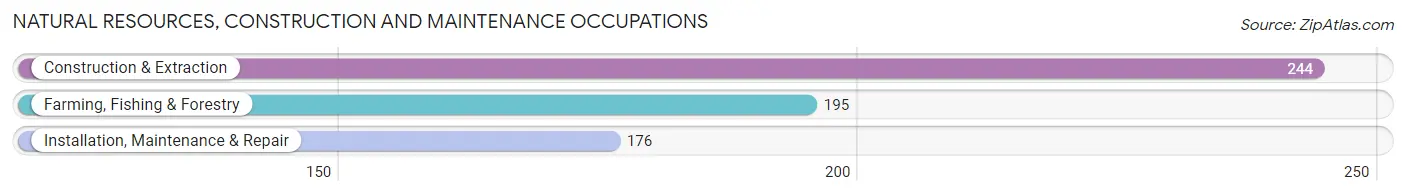
Natural Resources, Construction and Maintenance Occupations
The most common Natural Resources, Construction and Maintenance occupations in Chambersburg borough are Construction & Extraction (244 | 2.3%), Farming, Fishing & Forestry (195 | 1.8%), and Installation, Maintenance & Repair (176 | 1.7%).
Natural Resources, Construction and Maintenance Occupations by Sex
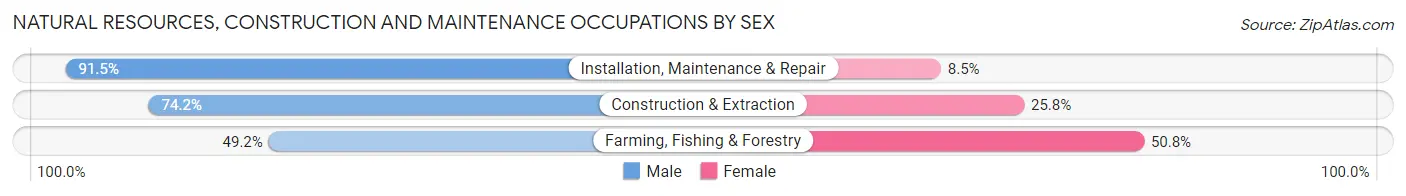
| Occupation | Male | Female |
| Farming, Fishing & Forestry | 96 (49.2%) | 99 (50.8%) |
| Construction & Extraction | 181 (74.2%) | 63 (25.8%) |
| Installation, Maintenance & Repair | 161 (91.5%) | 15 (8.5%) |
| Total (Category) | 438 (71.2%) | 177 (28.8%) |
| Total (Overall) | 5,307 (50.5%) | 5,206 (49.5%) |
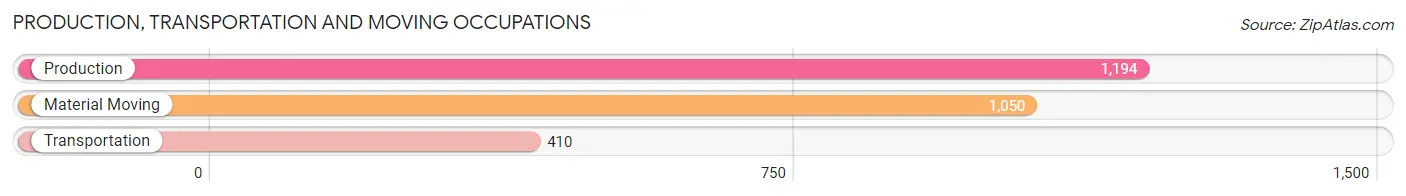
Production, Transportation and Moving Occupations
The most common Production, Transportation and Moving occupations in Chambersburg borough are Production (1,194 | 11.4%), Material Moving (1,050 | 10.0%), and Transportation (410 | 3.9%).
Production, Transportation and Moving Occupations by Sex
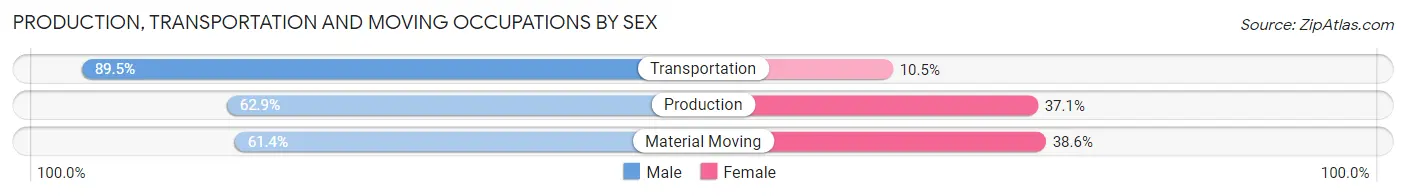
| Occupation | Male | Female |
| Production | 751 (62.9%) | 443 (37.1%) |
| Transportation | 367 (89.5%) | 43 (10.5%) |
| Material Moving | 645 (61.4%) | 405 (38.6%) |
| Total (Category) | 1,763 (66.4%) | 891 (33.6%) |
| Total (Overall) | 5,307 (50.5%) | 5,206 (49.5%) |
Employment Industries by Sex in Chambersburg borough
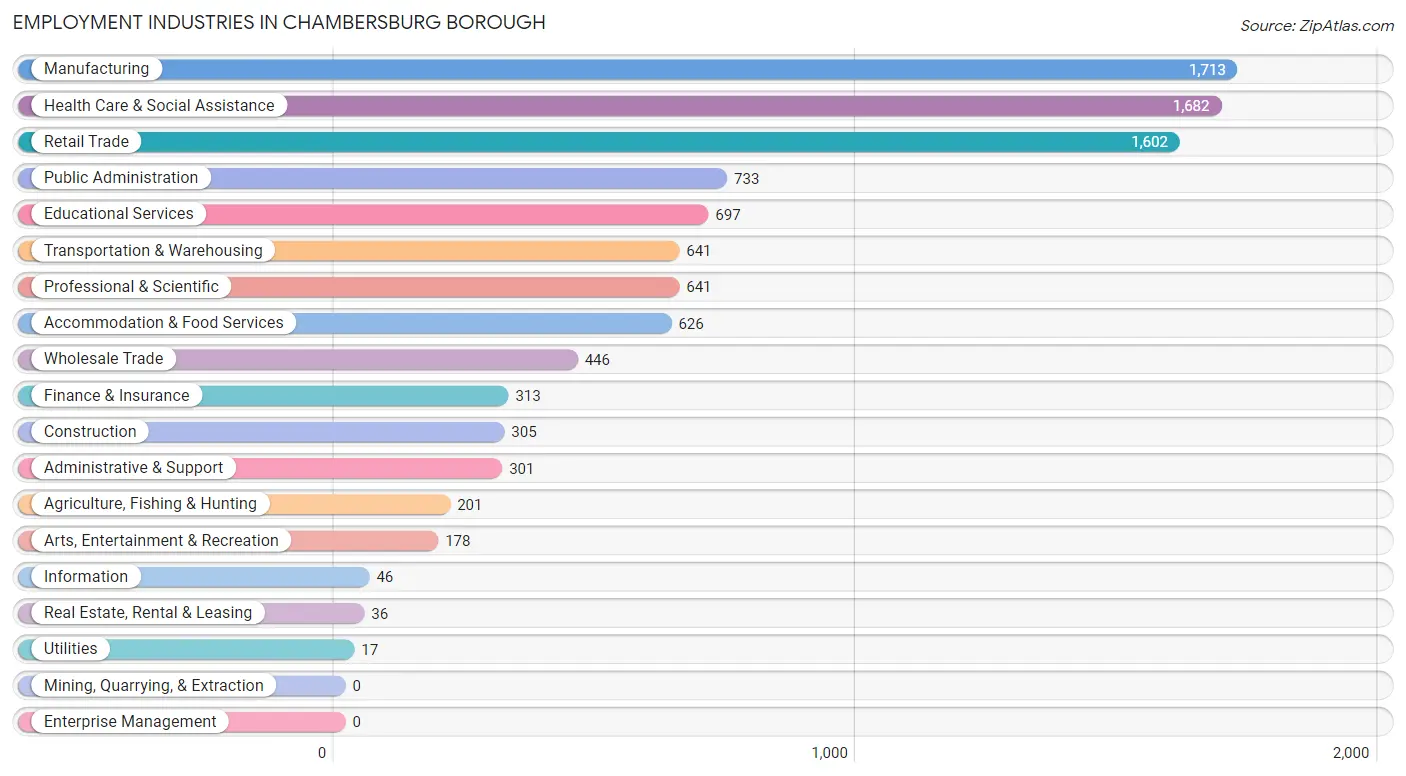
Employment Industries in Chambersburg borough
The major employment industries in Chambersburg borough include Manufacturing (1,713 | 16.3%), Health Care & Social Assistance (1,682 | 16.0%), Retail Trade (1,602 | 15.2%), Public Administration (733 | 7.0%), and Educational Services (697 | 6.6%).
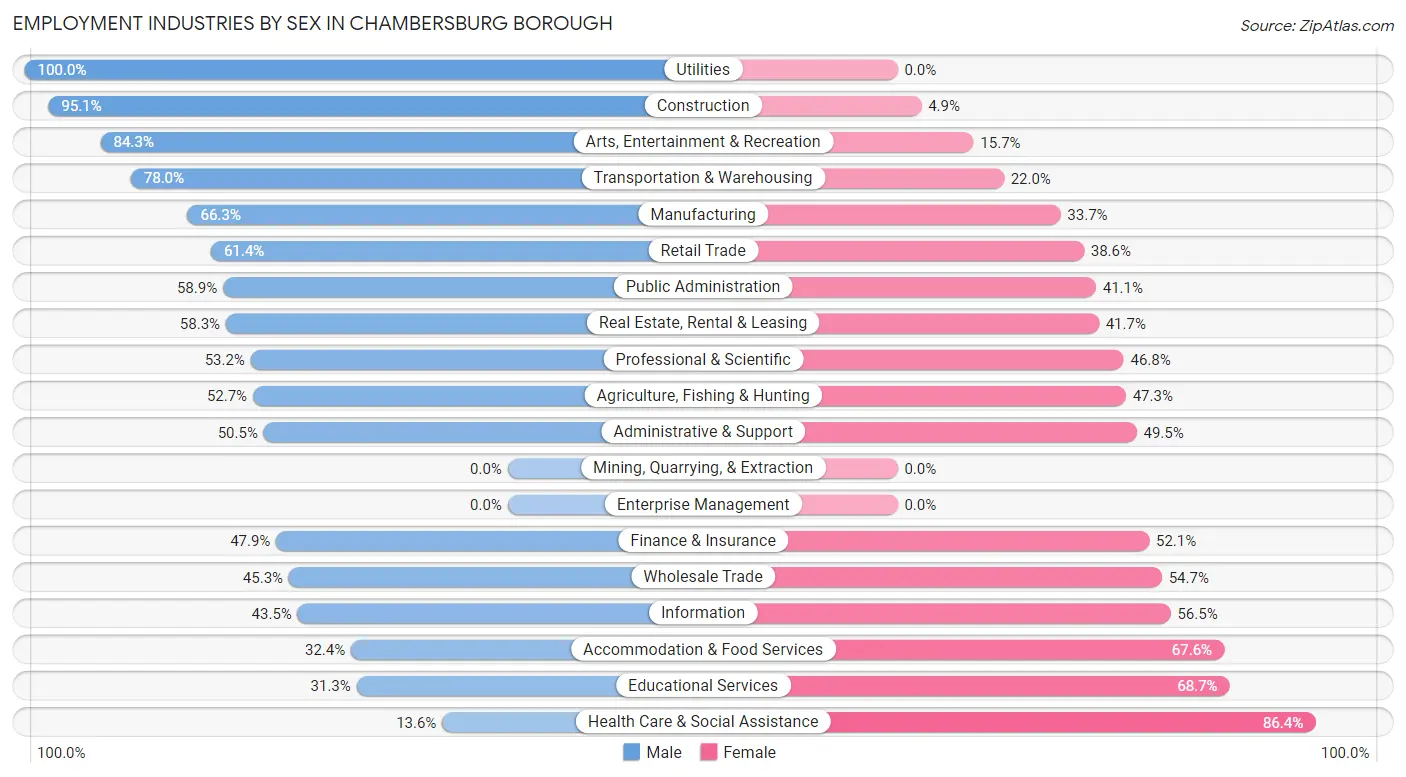
Employment Industries by Sex in Chambersburg borough
The Chambersburg borough industries that see more men than women are Utilities (100.0%), Construction (95.1%), and Arts, Entertainment & Recreation (84.3%), whereas the industries that tend to have a higher number of women are Health Care & Social Assistance (86.4%), Educational Services (68.7%), and Accommodation & Food Services (67.6%).
| Industry | Male | Female |
| Agriculture, Fishing & Hunting | 106 (52.7%) | 95 (47.3%) |
| Mining, Quarrying, & Extraction | 0 (0.0%) | 0 (0.0%) |
| Construction | 290 (95.1%) | 15 (4.9%) |
| Manufacturing | 1,135 (66.3%) | 578 (33.7%) |
| Wholesale Trade | 202 (45.3%) | 244 (54.7%) |
| Retail Trade | 984 (61.4%) | 618 (38.6%) |
| Transportation & Warehousing | 500 (78.0%) | 141 (22.0%) |
| Utilities | 17 (100.0%) | 0 (0.0%) |
| Information | 20 (43.5%) | 26 (56.5%) |
| Finance & Insurance | 150 (47.9%) | 163 (52.1%) |
| Real Estate, Rental & Leasing | 21 (58.3%) | 15 (41.7%) |
| Professional & Scientific | 341 (53.2%) | 300 (46.8%) |
| Enterprise Management | 0 (0.0%) | 0 (0.0%) |
| Administrative & Support | 152 (50.5%) | 149 (49.5%) |
| Educational Services | 218 (31.3%) | 479 (68.7%) |
| Health Care & Social Assistance | 228 (13.6%) | 1,454 (86.4%) |
| Arts, Entertainment & Recreation | 150 (84.3%) | 28 (15.7%) |
| Accommodation & Food Services | 203 (32.4%) | 423 (67.6%) |
| Public Administration | 432 (58.9%) | 301 (41.1%) |
| Total | 5,307 (50.5%) | 5,206 (49.5%) |
Education in Chambersburg borough
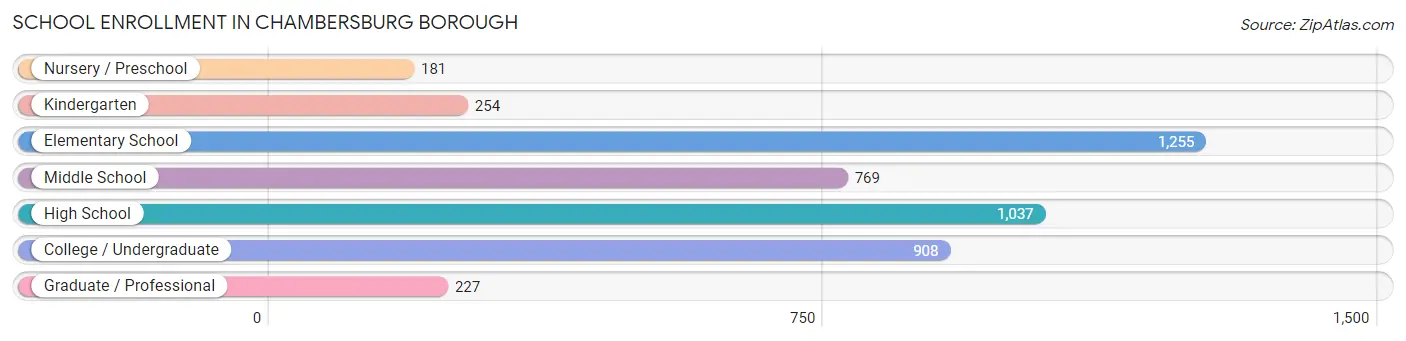
School Enrollment in Chambersburg borough
The most common levels of schooling among the 4,631 students in Chambersburg borough are elementary school (1,255 | 27.1%), high school (1,037 | 22.4%), and college / undergraduate (908 | 19.6%).
| School Level | # Students | % Students |
| Nursery / Preschool | 181 | 3.9% |
| Kindergarten | 254 | 5.5% |
| Elementary School | 1,255 | 27.1% |
| Middle School | 769 | 16.6% |
| High School | 1,037 | 22.4% |
| College / Undergraduate | 908 | 19.6% |
| Graduate / Professional | 227 | 4.9% |
| Total | 4,631 | 100.0% |
School Enrollment by Age by Funding Source in Chambersburg borough
Out of a total of 4,631 students who are enrolled in schools in Chambersburg borough, 769 (16.6%) attend a private institution, while the remaining 3,862 (83.4%) are enrolled in public schools. The age group of 3 to 4 year olds has the highest likelihood of being enrolled in private schools, with 45 (31.9% in the age bracket) enrolled. Conversely, the age group of 35 years and over has the lowest likelihood of being enrolled in a private school, with 264 (92.3% in the age bracket) attending a public institution.
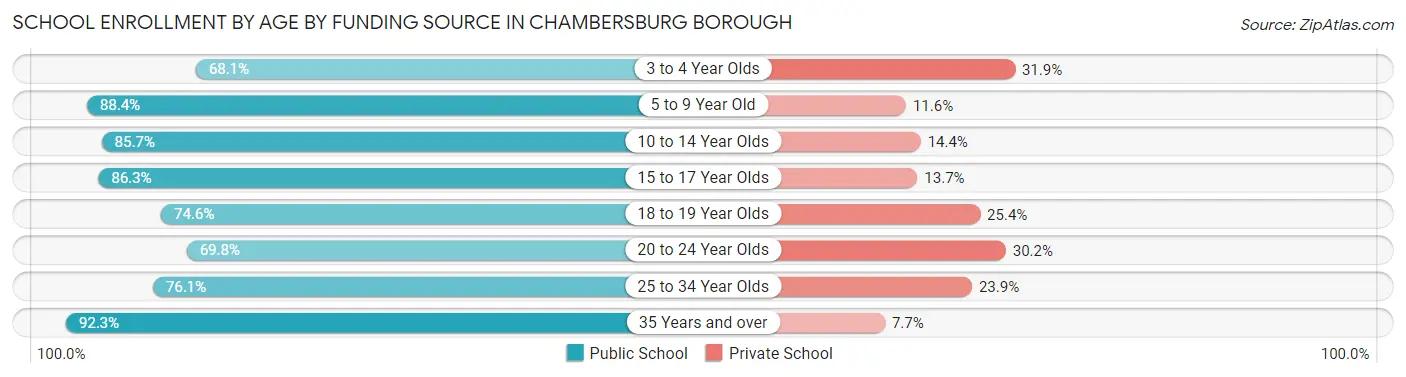
| Age Bracket | Public School | Private School |
| 3 to 4 Year Olds | 96 (68.1%) | 45 (31.9%) |
| 5 to 9 Year Old | 1,241 (88.4%) | 163 (11.6%) |
| 10 to 14 Year Olds | 931 (85.7%) | 156 (14.3%) |
| 15 to 17 Year Olds | 490 (86.3%) | 78 (13.7%) |
| 18 to 19 Year Olds | 355 (74.6%) | 121 (25.4%) |
| 20 to 24 Year Olds | 245 (69.8%) | 106 (30.2%) |
| 25 to 34 Year Olds | 242 (76.1%) | 76 (23.9%) |
| 35 Years and over | 264 (92.3%) | 22 (7.7%) |
| Total | 3,862 (83.4%) | 769 (16.6%) |
Educational Attainment by Field of Study in Chambersburg borough
Education (899 | 20.3%), business (765 | 17.2%), science & technology (456 | 10.3%), engineering (327 | 7.4%), and social sciences (291 | 6.6%) are the most common fields of study among 4,436 individuals in Chambersburg borough who have obtained a bachelor's degree or higher.
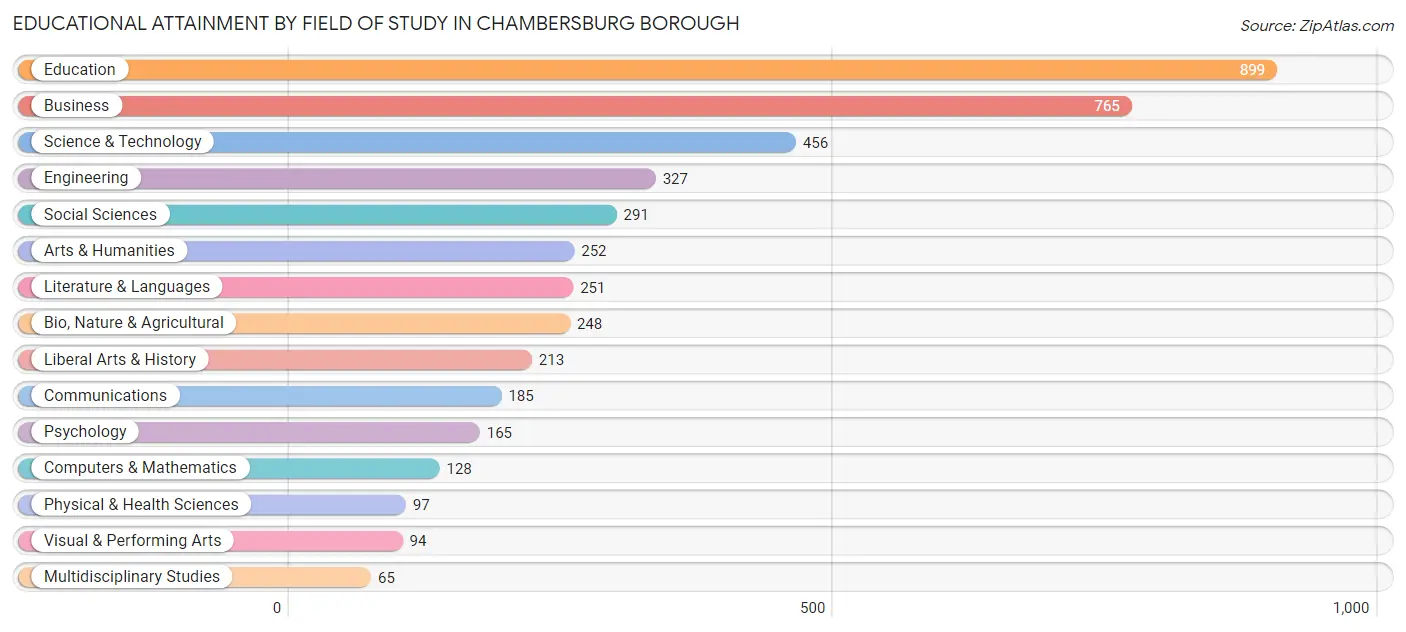
| Field of Study | # Graduates | % Graduates |
| Computers & Mathematics | 128 | 2.9% |
| Bio, Nature & Agricultural | 248 | 5.6% |
| Physical & Health Sciences | 97 | 2.2% |
| Psychology | 165 | 3.7% |
| Social Sciences | 291 | 6.6% |
| Engineering | 327 | 7.4% |
| Multidisciplinary Studies | 65 | 1.5% |
| Science & Technology | 456 | 10.3% |
| Business | 765 | 17.2% |
| Education | 899 | 20.3% |
| Literature & Languages | 251 | 5.7% |
| Liberal Arts & History | 213 | 4.8% |
| Visual & Performing Arts | 94 | 2.1% |
| Communications | 185 | 4.2% |
| Arts & Humanities | 252 | 5.7% |
| Total | 4,436 | 100.0% |
Transportation & Commute in Chambersburg borough
Vehicle Availability by Sex in Chambersburg borough
The most prevalent vehicle ownership categories in Chambersburg borough are males with 2 vehicles (2,148, accounting for 41.2%) and females with 2 vehicles (2,130, making up 42.5%).
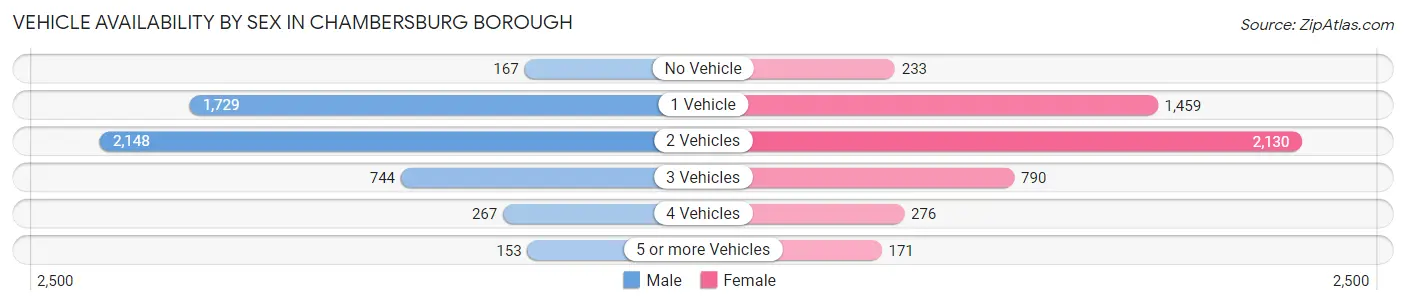
| Vehicles Available | Male | Female |
| No Vehicle | 167 (3.2%) | 233 (4.6%) |
| 1 Vehicle | 1,729 (33.2%) | 1,459 (28.8%) |
| 2 Vehicles | 2,148 (41.2%) | 2,130 (42.1%) |
| 3 Vehicles | 744 (14.3%) | 790 (15.6%) |
| 4 Vehicles | 267 (5.1%) | 276 (5.5%) |
| 5 or more Vehicles | 153 (2.9%) | 171 (3.4%) |
| Total | 5,208 (100.0%) | 5,059 (100.0%) |
Commute Time in Chambersburg borough
The most frequently occuring commute durations in Chambersburg borough are 10 to 14 minutes (2,148 commuters, 22.4%), 5 to 9 minutes (1,846 commuters, 19.2%), and 15 to 19 minutes (1,417 commuters, 14.7%).
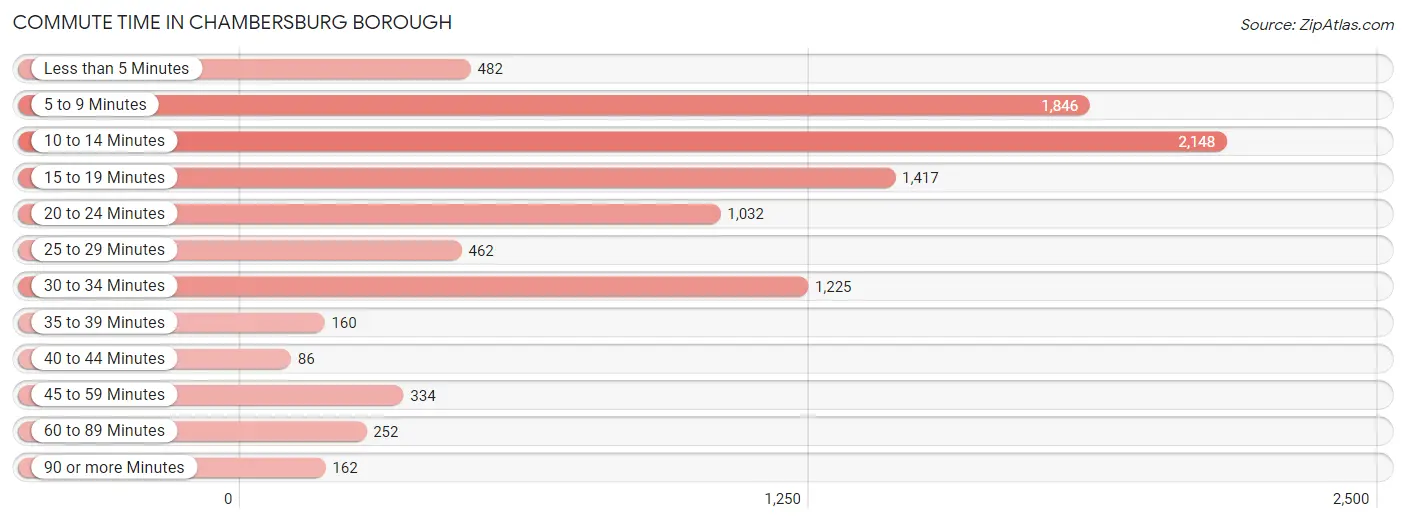
| Commute Time | # Commuters | % Commuters |
| Less than 5 Minutes | 482 | 5.0% |
| 5 to 9 Minutes | 1,846 | 19.2% |
| 10 to 14 Minutes | 2,148 | 22.4% |
| 15 to 19 Minutes | 1,417 | 14.7% |
| 20 to 24 Minutes | 1,032 | 10.7% |
| 25 to 29 Minutes | 462 | 4.8% |
| 30 to 34 Minutes | 1,225 | 12.8% |
| 35 to 39 Minutes | 160 | 1.7% |
| 40 to 44 Minutes | 86 | 0.9% |
| 45 to 59 Minutes | 334 | 3.5% |
| 60 to 89 Minutes | 252 | 2.6% |
| 90 or more Minutes | 162 | 1.7% |
Commute Time by Sex in Chambersburg borough
The most common commute times in Chambersburg borough are 10 to 14 minutes (1,268 commuters, 25.2%) for males and 5 to 9 minutes (1,012 commuters, 22.1%) for females.
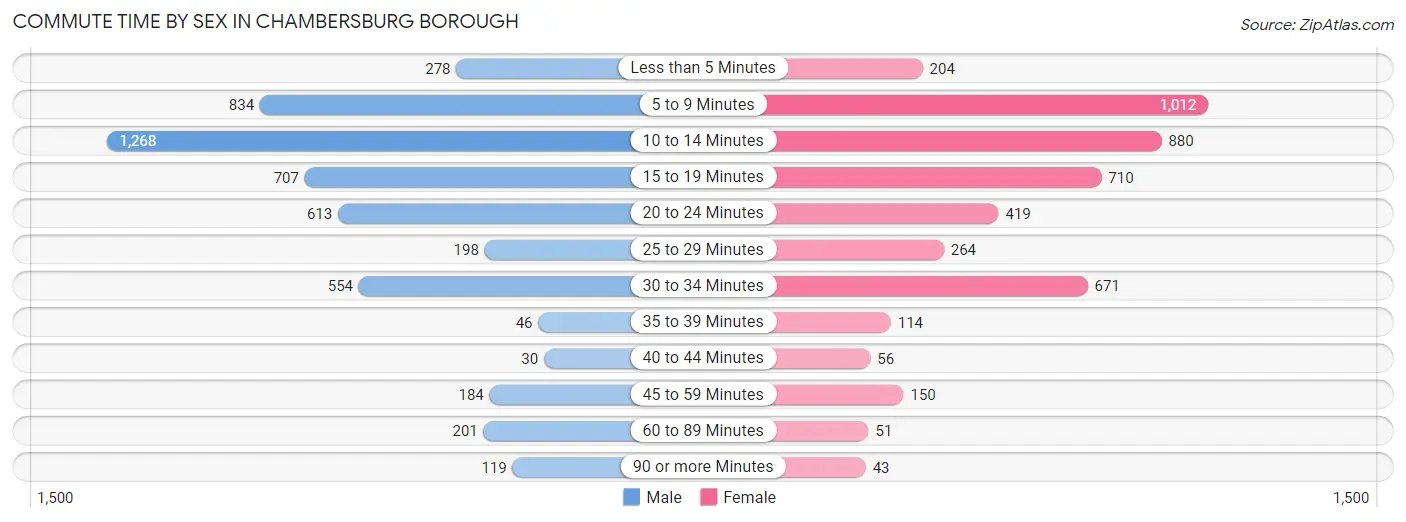
| Commute Time | Male | Female |
| Less than 5 Minutes | 278 (5.5%) | 204 (4.5%) |
| 5 to 9 Minutes | 834 (16.6%) | 1,012 (22.1%) |
| 10 to 14 Minutes | 1,268 (25.2%) | 880 (19.2%) |
| 15 to 19 Minutes | 707 (14.1%) | 710 (15.5%) |
| 20 to 24 Minutes | 613 (12.2%) | 419 (9.2%) |
| 25 to 29 Minutes | 198 (3.9%) | 264 (5.8%) |
| 30 to 34 Minutes | 554 (11.0%) | 671 (14.7%) |
| 35 to 39 Minutes | 46 (0.9%) | 114 (2.5%) |
| 40 to 44 Minutes | 30 (0.6%) | 56 (1.2%) |
| 45 to 59 Minutes | 184 (3.7%) | 150 (3.3%) |
| 60 to 89 Minutes | 201 (4.0%) | 51 (1.1%) |
| 90 or more Minutes | 119 (2.4%) | 43 (0.9%) |
Time of Departure to Work by Sex in Chambersburg borough
The most frequent times of departure to work in Chambersburg borough are 4:00 PM to 11:59 PM (786, 15.6%) for males and 7:00 AM to 7:29 AM (755, 16.5%) for females.
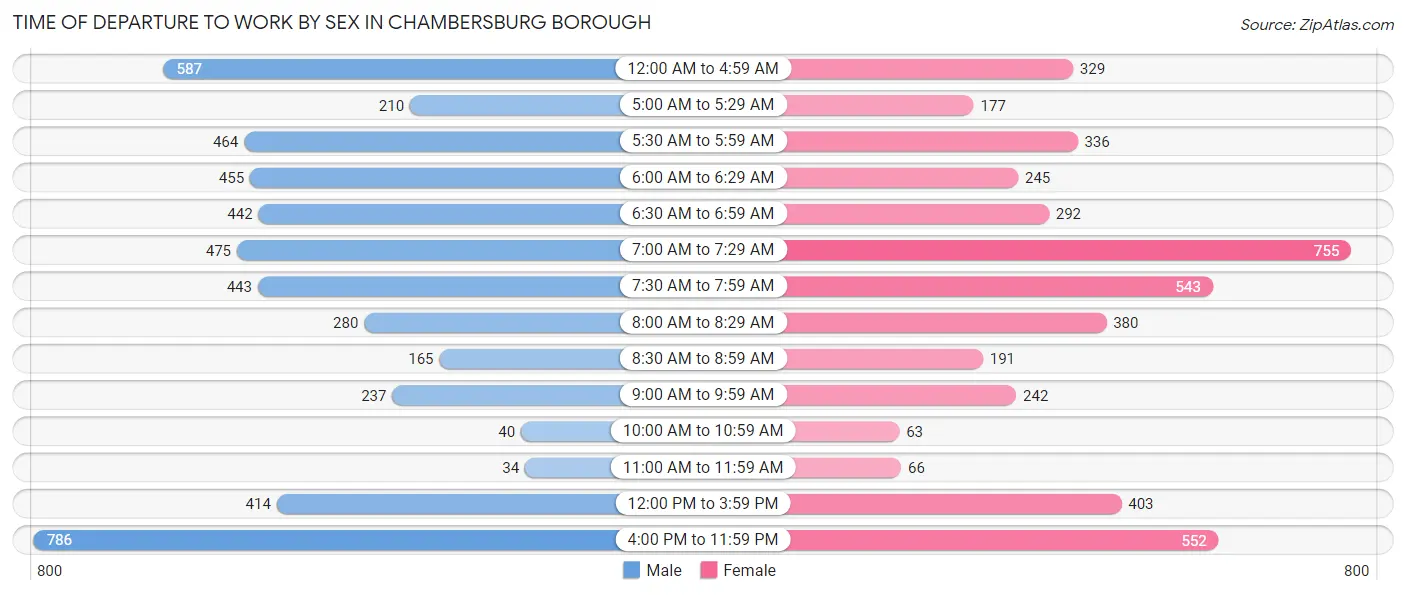
| Time of Departure | Male | Female |
| 12:00 AM to 4:59 AM | 587 (11.7%) | 329 (7.2%) |
| 5:00 AM to 5:29 AM | 210 (4.2%) | 177 (3.9%) |
| 5:30 AM to 5:59 AM | 464 (9.2%) | 336 (7.3%) |
| 6:00 AM to 6:29 AM | 455 (9.0%) | 245 (5.4%) |
| 6:30 AM to 6:59 AM | 442 (8.8%) | 292 (6.4%) |
| 7:00 AM to 7:29 AM | 475 (9.4%) | 755 (16.5%) |
| 7:30 AM to 7:59 AM | 443 (8.8%) | 543 (11.9%) |
| 8:00 AM to 8:29 AM | 280 (5.6%) | 380 (8.3%) |
| 8:30 AM to 8:59 AM | 165 (3.3%) | 191 (4.2%) |
| 9:00 AM to 9:59 AM | 237 (4.7%) | 242 (5.3%) |
| 10:00 AM to 10:59 AM | 40 (0.8%) | 63 (1.4%) |
| 11:00 AM to 11:59 AM | 34 (0.7%) | 66 (1.4%) |
| 12:00 PM to 3:59 PM | 414 (8.2%) | 403 (8.8%) |
| 4:00 PM to 11:59 PM | 786 (15.6%) | 552 (12.1%) |
| Total | 5,032 (100.0%) | 4,574 (100.0%) |
Housing Occupancy in Chambersburg borough
Occupancy by Ownership in Chambersburg borough
Of the total 9,815 dwellings in Chambersburg borough, owner-occupied units account for 4,146 (42.2%), while renter-occupied units make up 5,669 (57.8%).
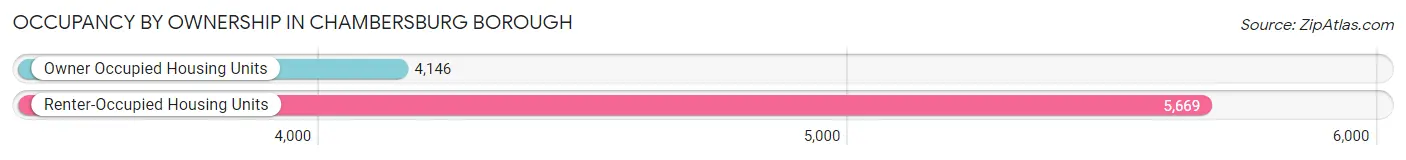
| Occupancy | # Housing Units | % Housing Units |
| Owner Occupied Housing Units | 4,146 | 42.2% |
| Renter-Occupied Housing Units | 5,669 | 57.8% |
| Total Occupied Housing Units | 9,815 | 100.0% |
Occupancy by Household Size in Chambersburg borough
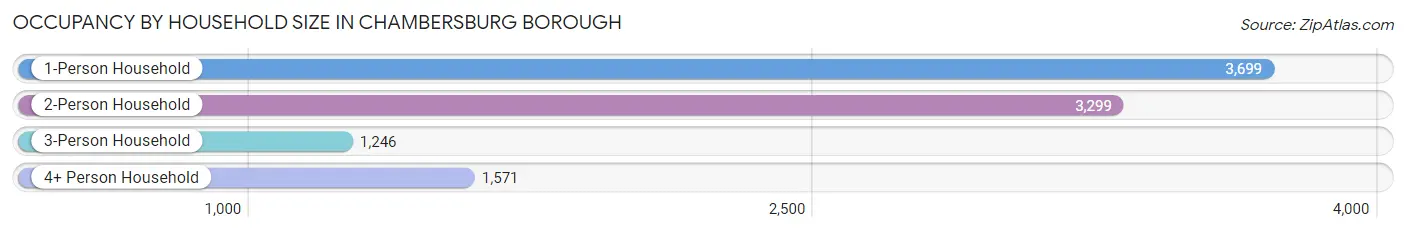
| Household Size | # Housing Units | % Housing Units |
| 1-Person Household | 3,699 | 37.7% |
| 2-Person Household | 3,299 | 33.6% |
| 3-Person Household | 1,246 | 12.7% |
| 4+ Person Household | 1,571 | 16.0% |
| Total Housing Units | 9,815 | 100.0% |
Occupancy by Ownership by Household Size in Chambersburg borough
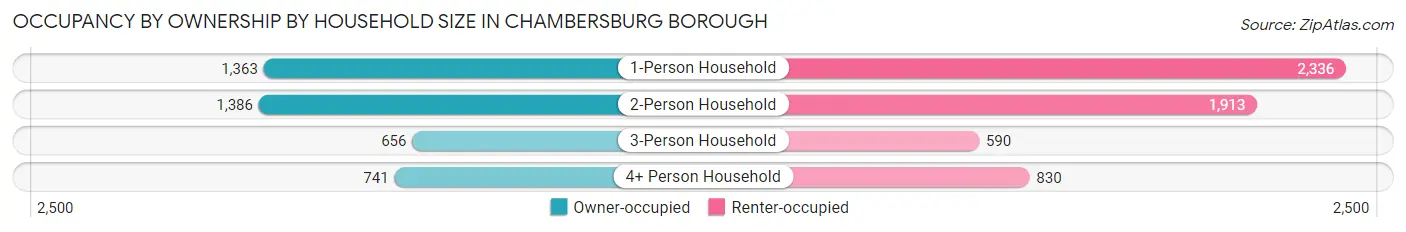
| Household Size | Owner-occupied | Renter-occupied |
| 1-Person Household | 1,363 (36.8%) | 2,336 (63.1%) |
| 2-Person Household | 1,386 (42.0%) | 1,913 (58.0%) |
| 3-Person Household | 656 (52.6%) | 590 (47.3%) |
| 4+ Person Household | 741 (47.2%) | 830 (52.8%) |
| Total Housing Units | 4,146 (42.2%) | 5,669 (57.8%) |
Occupancy by Educational Attainment in Chambersburg borough
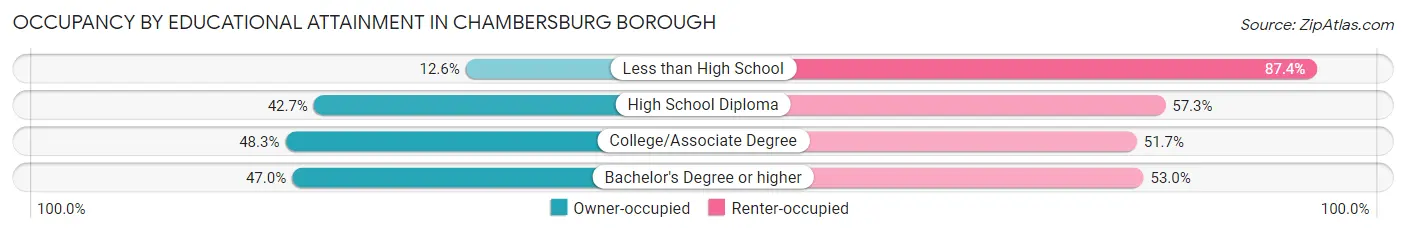
| Household Size | Owner-occupied | Renter-occupied |
| Less than High School | 116 (12.6%) | 806 (87.4%) |
| High School Diploma | 1,762 (42.7%) | 2,366 (57.3%) |
| College/Associate Degree | 1,050 (48.3%) | 1,123 (51.7%) |
| Bachelor's Degree or higher | 1,218 (47.0%) | 1,374 (53.0%) |
Occupancy by Age of Householder in Chambersburg borough
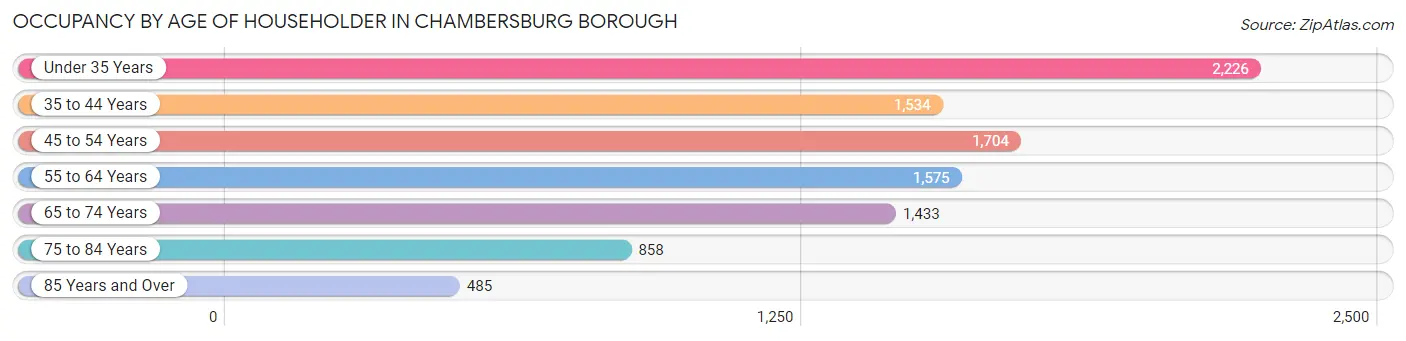
| Age Bracket | # Households | % Households |
| Under 35 Years | 2,226 | 22.7% |
| 35 to 44 Years | 1,534 | 15.6% |
| 45 to 54 Years | 1,704 | 17.4% |
| 55 to 64 Years | 1,575 | 16.1% |
| 65 to 74 Years | 1,433 | 14.6% |
| 75 to 84 Years | 858 | 8.7% |
| 85 Years and Over | 485 | 4.9% |
| Total | 9,815 | 100.0% |
Housing Finances in Chambersburg borough
Median Income by Occupancy in Chambersburg borough
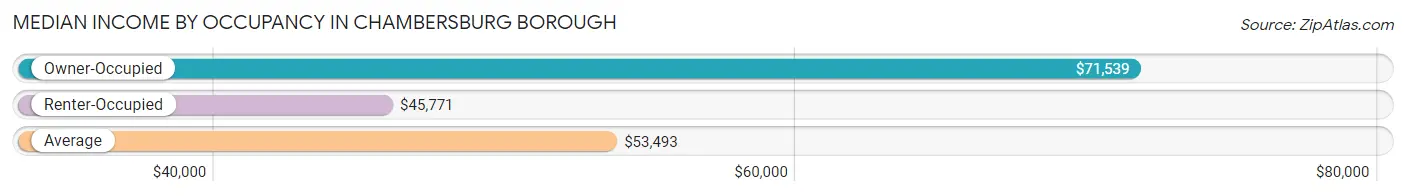
| Occupancy Type | # Households | Median Income |
| Owner-Occupied | 4,146 (42.2%) | $71,539 |
| Renter-Occupied | 5,669 (57.8%) | $45,771 |
| Average | 9,815 (100.0%) | $53,493 |
Occupancy by Householder Income Bracket in Chambersburg borough
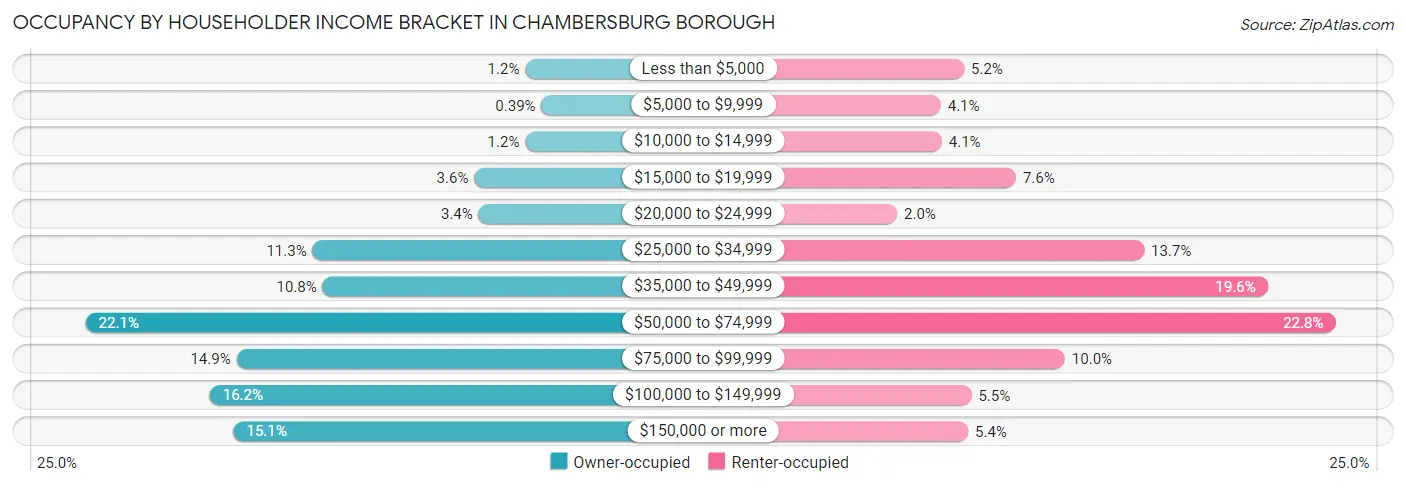
| Income Bracket | Owner-occupied | Renter-occupied |
| Less than $5,000 | 48 (1.2%) | 293 (5.2%) |
| $5,000 to $9,999 | 16 (0.4%) | 230 (4.1%) |
| $10,000 to $14,999 | 48 (1.2%) | 233 (4.1%) |
| $15,000 to $19,999 | 149 (3.6%) | 433 (7.6%) |
| $20,000 to $24,999 | 140 (3.4%) | 112 (2.0%) |
| $25,000 to $34,999 | 468 (11.3%) | 779 (13.7%) |
| $35,000 to $49,999 | 448 (10.8%) | 1,112 (19.6%) |
| $50,000 to $74,999 | 916 (22.1%) | 1,295 (22.8%) |
| $75,000 to $99,999 | 618 (14.9%) | 565 (10.0%) |
| $100,000 to $149,999 | 671 (16.2%) | 313 (5.5%) |
| $150,000 or more | 624 (15.0%) | 304 (5.4%) |
| Total | 4,146 (100.0%) | 5,669 (100.0%) |
Monthly Housing Cost Tiers in Chambersburg borough
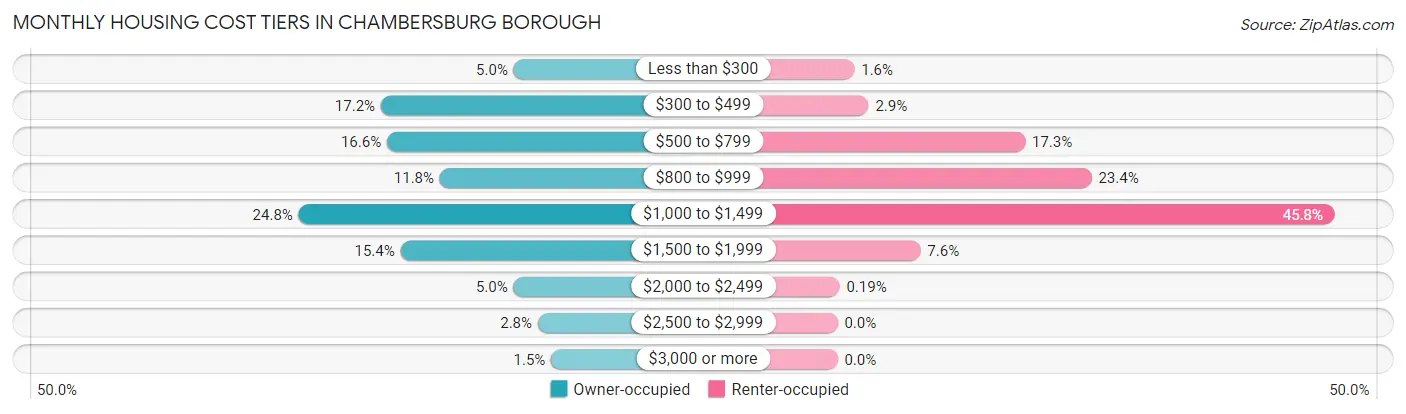
| Monthly Cost | Owner-occupied | Renter-occupied |
| Less than $300 | 206 (5.0%) | 88 (1.5%) |
| $300 to $499 | 713 (17.2%) | 162 (2.9%) |
| $500 to $799 | 690 (16.6%) | 979 (17.3%) |
| $800 to $999 | 488 (11.8%) | 1,326 (23.4%) |
| $1,000 to $1,499 | 1,027 (24.8%) | 2,596 (45.8%) |
| $1,500 to $1,999 | 638 (15.4%) | 433 (7.6%) |
| $2,000 to $2,499 | 207 (5.0%) | 11 (0.2%) |
| $2,500 to $2,999 | 114 (2.8%) | 0 (0.0%) |
| $3,000 or more | 63 (1.5%) | 0 (0.0%) |
| Total | 4,146 (100.0%) | 5,669 (100.0%) |
Physical Housing Characteristics in Chambersburg borough
Housing Structures in Chambersburg borough
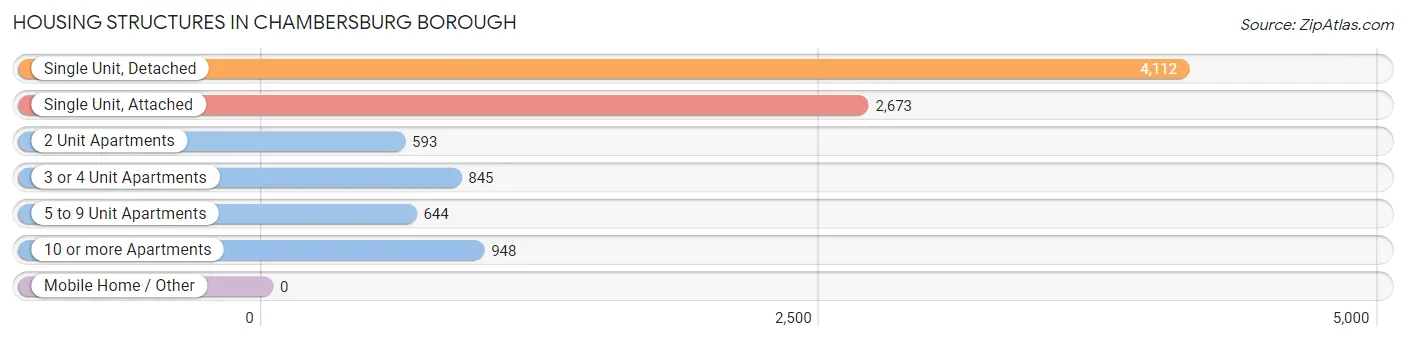
| Structure Type | # Housing Units | % Housing Units |
| Single Unit, Detached | 4,112 | 41.9% |
| Single Unit, Attached | 2,673 | 27.2% |
| 2 Unit Apartments | 593 | 6.0% |
| 3 or 4 Unit Apartments | 845 | 8.6% |
| 5 to 9 Unit Apartments | 644 | 6.6% |
| 10 or more Apartments | 948 | 9.7% |
| Mobile Home / Other | 0 | 0.0% |
| Total | 9,815 | 100.0% |
Housing Structures by Occupancy in Chambersburg borough
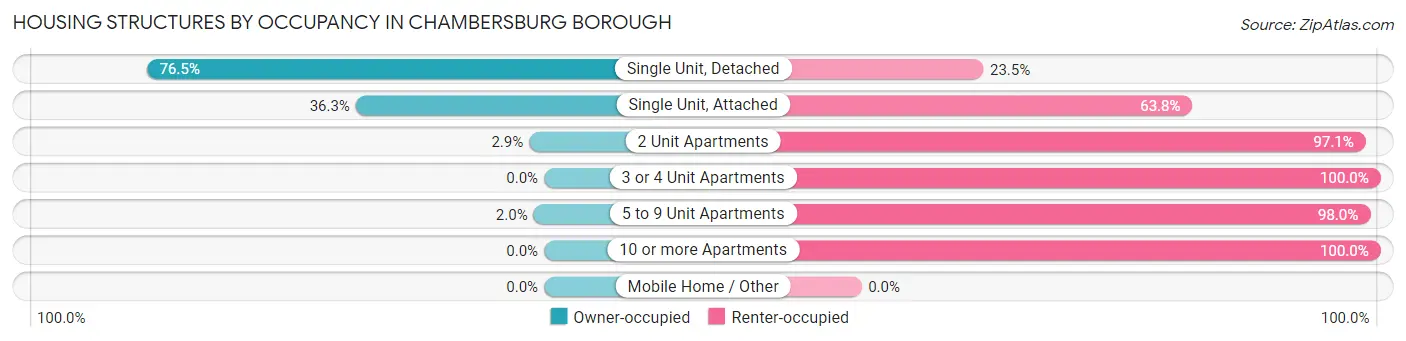
| Structure Type | Owner-occupied | Renter-occupied |
| Single Unit, Detached | 3,147 (76.5%) | 965 (23.5%) |
| Single Unit, Attached | 969 (36.2%) | 1,704 (63.7%) |
| 2 Unit Apartments | 17 (2.9%) | 576 (97.1%) |
| 3 or 4 Unit Apartments | 0 (0.0%) | 845 (100.0%) |
| 5 to 9 Unit Apartments | 13 (2.0%) | 631 (98.0%) |
| 10 or more Apartments | 0 (0.0%) | 948 (100.0%) |
| Mobile Home / Other | 0 (0.0%) | 0 (0.0%) |
| Total | 4,146 (42.2%) | 5,669 (57.8%) |
Housing Structures by Number of Rooms in Chambersburg borough
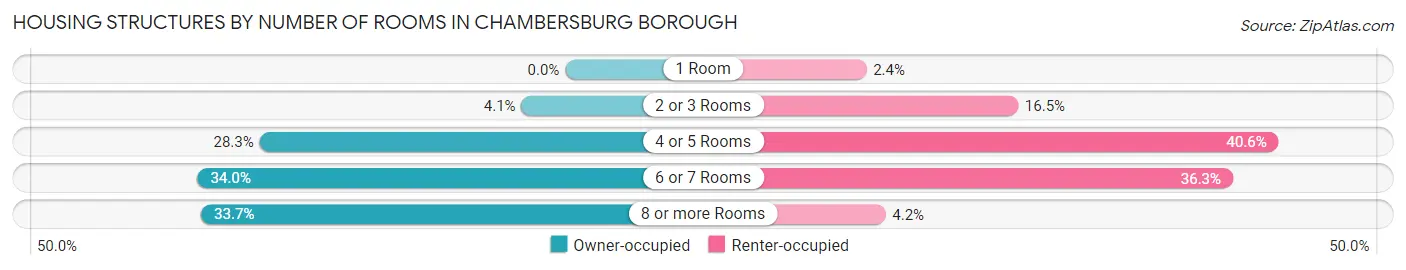
| Number of Rooms | Owner-occupied | Renter-occupied |
| 1 Room | 0 (0.0%) | 138 (2.4%) |
| 2 or 3 Rooms | 168 (4.1%) | 933 (16.5%) |
| 4 or 5 Rooms | 1,172 (28.3%) | 2,300 (40.6%) |
| 6 or 7 Rooms | 1,410 (34.0%) | 2,060 (36.3%) |
| 8 or more Rooms | 1,396 (33.7%) | 238 (4.2%) |
| Total | 4,146 (100.0%) | 5,669 (100.0%) |
Housing Structure by Heating Type in Chambersburg borough
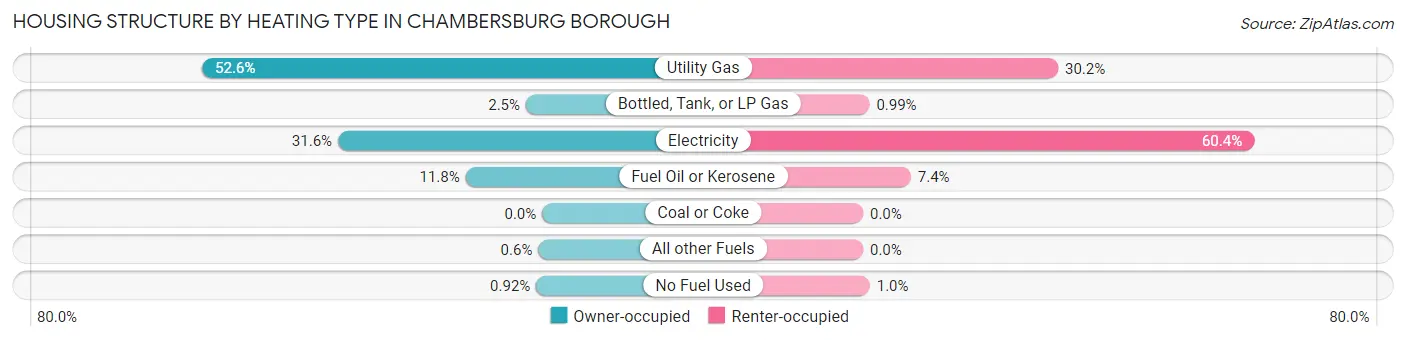
| Heating Type | Owner-occupied | Renter-occupied |
| Utility Gas | 2,179 (52.6%) | 1,709 (30.1%) |
| Bottled, Tank, or LP Gas | 104 (2.5%) | 56 (1.0%) |
| Electricity | 1,309 (31.6%) | 3,426 (60.4%) |
| Fuel Oil or Kerosene | 491 (11.8%) | 419 (7.4%) |
| Coal or Coke | 0 (0.0%) | 0 (0.0%) |
| All other Fuels | 25 (0.6%) | 0 (0.0%) |
| No Fuel Used | 38 (0.9%) | 59 (1.0%) |
| Total | 4,146 (100.0%) | 5,669 (100.0%) |
Household Vehicle Usage in Chambersburg borough
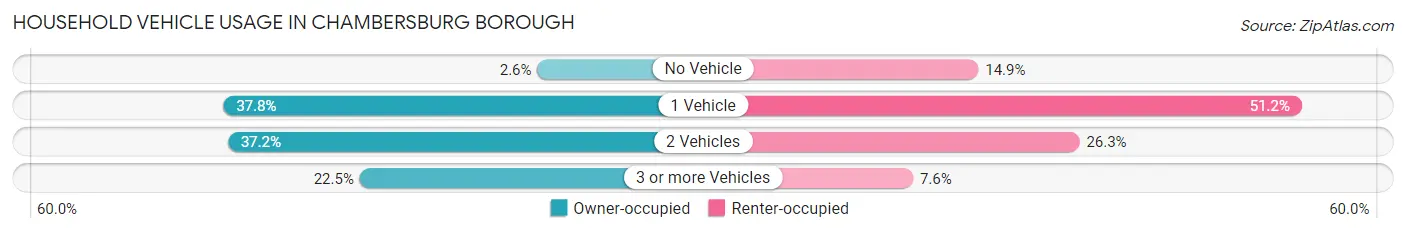
| Vehicles per Household | Owner-occupied | Renter-occupied |
| No Vehicle | 106 (2.6%) | 847 (14.9%) |
| 1 Vehicle | 1,565 (37.8%) | 2,901 (51.2%) |
| 2 Vehicles | 1,544 (37.2%) | 1,489 (26.3%) |
| 3 or more Vehicles | 931 (22.5%) | 432 (7.6%) |
| Total | 4,146 (100.0%) | 5,669 (100.0%) |
Real Estate & Mortgages in Chambersburg borough
Real Estate and Mortgage Overview in Chambersburg borough
| Characteristic | Without Mortgage | With Mortgage |
| Housing Units | 1,530 | 2,616 |
| Median Property Value | $191,200 | $180,500 |
| Median Household Income | $51,250 | $438 |
| Monthly Housing Costs | $466 | $63 |
| Real Estate Taxes | $2,587 | $38 |
Property Value by Mortgage Status in Chambersburg borough
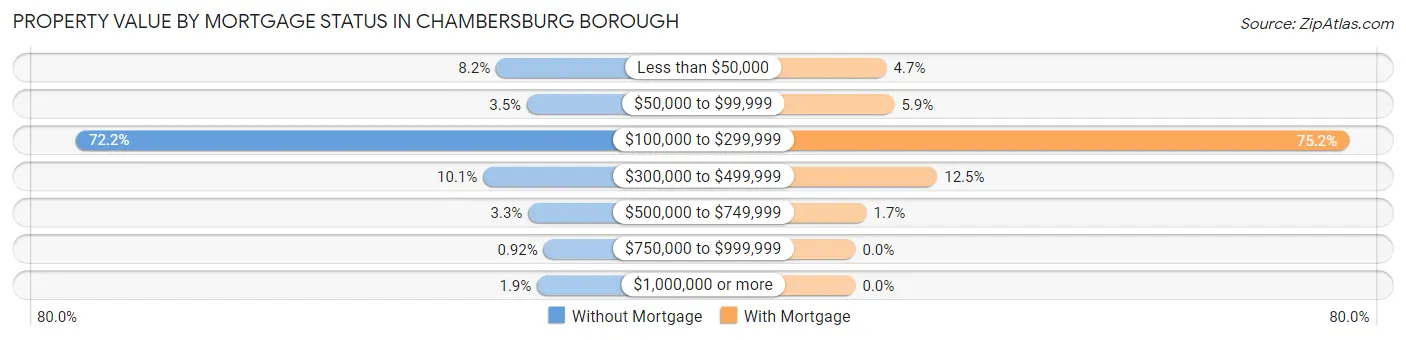
| Property Value | Without Mortgage | With Mortgage |
| Less than $50,000 | 125 (8.2%) | 124 (4.7%) |
| $50,000 to $99,999 | 53 (3.5%) | 155 (5.9%) |
| $100,000 to $299,999 | 1,104 (72.2%) | 1,967 (75.2%) |
| $300,000 to $499,999 | 155 (10.1%) | 326 (12.5%) |
| $500,000 to $749,999 | 50 (3.3%) | 44 (1.7%) |
| $750,000 to $999,999 | 14 (0.9%) | 0 (0.0%) |
| $1,000,000 or more | 29 (1.9%) | 0 (0.0%) |
| Total | 1,530 (100.0%) | 2,616 (100.0%) |
Household Income by Mortgage Status in Chambersburg borough
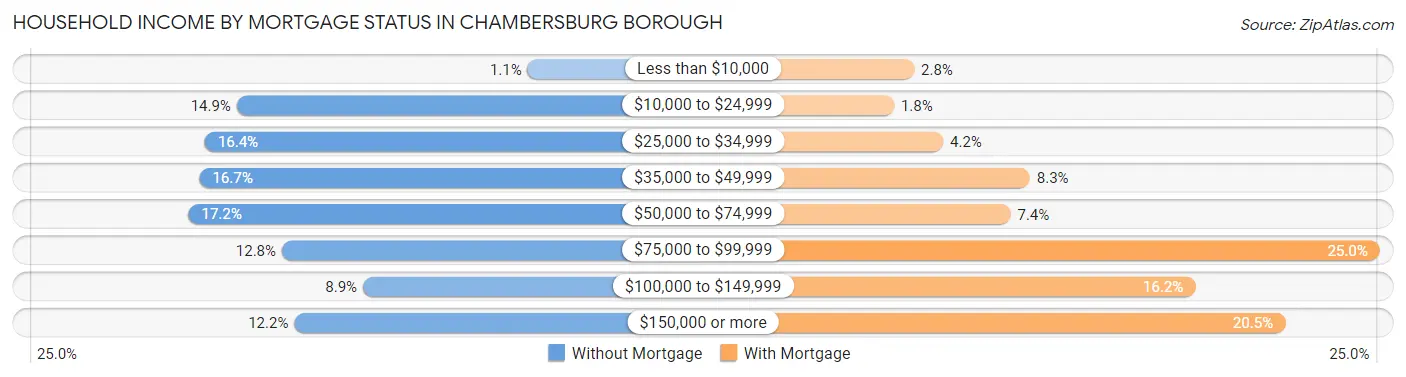
| Household Income | Without Mortgage | With Mortgage |
| Less than $10,000 | 16 (1.1%) | 73 (2.8%) |
| $10,000 to $24,999 | 228 (14.9%) | 48 (1.8%) |
| $25,000 to $34,999 | 251 (16.4%) | 109 (4.2%) |
| $35,000 to $49,999 | 255 (16.7%) | 217 (8.3%) |
| $50,000 to $74,999 | 263 (17.2%) | 193 (7.4%) |
| $75,000 to $99,999 | 195 (12.8%) | 653 (25.0%) |
| $100,000 to $149,999 | 136 (8.9%) | 423 (16.2%) |
| $150,000 or more | 186 (12.2%) | 535 (20.4%) |
| Total | 1,530 (100.0%) | 2,616 (100.0%) |
Property Value to Household Income Ratio in Chambersburg borough
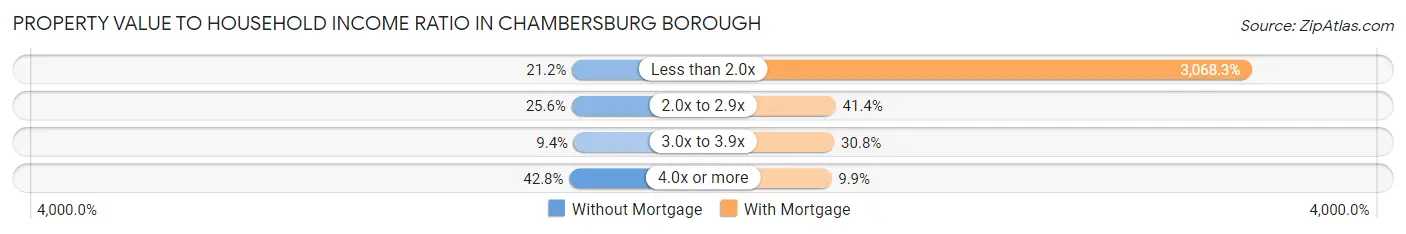
| Value-to-Income Ratio | Without Mortgage | With Mortgage |
| Less than 2.0x | 325 (21.2%) | 80,266 (3,068.3%) |
| 2.0x to 2.9x | 391 (25.6%) | 1,082 (41.4%) |
| 3.0x to 3.9x | 144 (9.4%) | 806 (30.8%) |
| 4.0x or more | 654 (42.7%) | 258 (9.9%) |
| Total | 1,530 (100.0%) | 2,616 (100.0%) |
Real Estate Taxes by Mortgage Status in Chambersburg borough
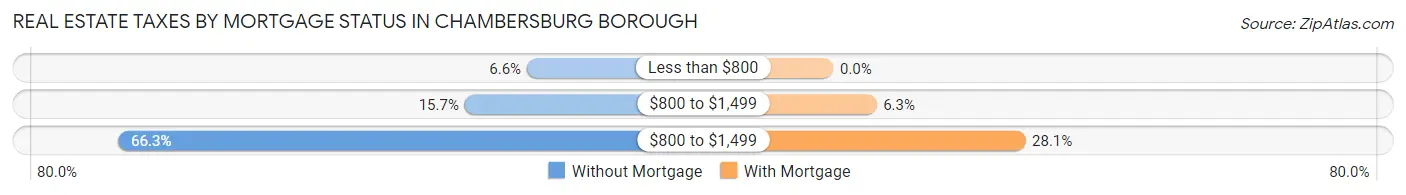
| Property Taxes | Without Mortgage | With Mortgage |
| Less than $800 | 101 (6.6%) | 0 (0.0%) |
| $800 to $1,499 | 240 (15.7%) | 165 (6.3%) |
| $800 to $1,499 | 1,015 (66.3%) | 734 (28.1%) |
| Total | 1,530 (100.0%) | 2,616 (100.0%) |
Health & Disability in Chambersburg borough
Health Insurance Coverage by Age in Chambersburg borough
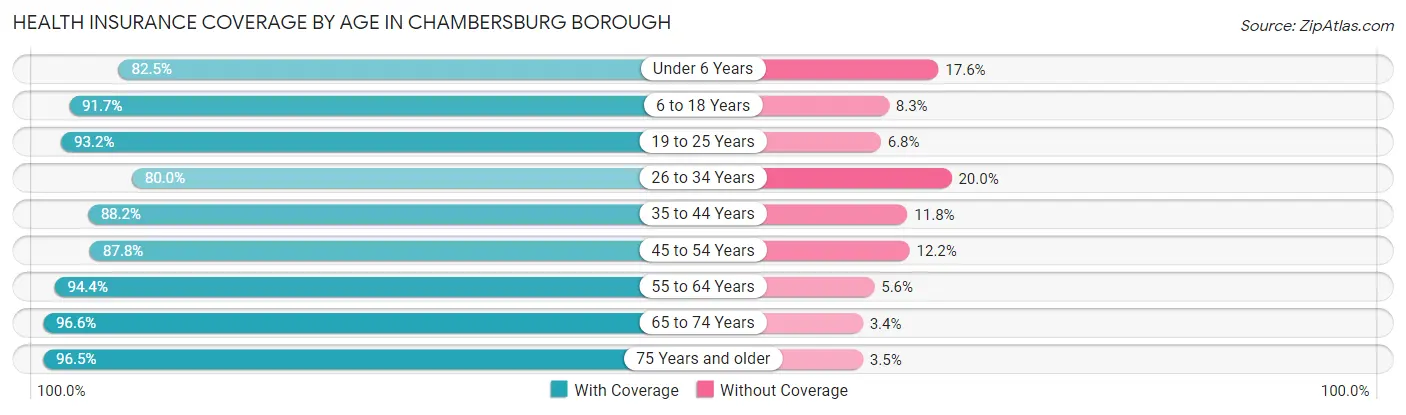
| Age Bracket | With Coverage | Without Coverage |
| Under 6 Years | 1,071 (82.5%) | 228 (17.5%) |
| 6 to 18 Years | 3,222 (91.7%) | 292 (8.3%) |
| 19 to 25 Years | 1,738 (93.2%) | 127 (6.8%) |
| 26 to 34 Years | 2,334 (80.0%) | 583 (20.0%) |
| 35 to 44 Years | 2,398 (88.2%) | 320 (11.8%) |
| 45 to 54 Years | 2,509 (87.8%) | 348 (12.2%) |
| 55 to 64 Years | 2,279 (94.4%) | 135 (5.6%) |
| 65 to 74 Years | 1,968 (96.6%) | 70 (3.4%) |
| 75 Years and older | 1,808 (96.5%) | 65 (3.5%) |
| Total | 19,327 (89.9%) | 2,168 (10.1%) |
Health Insurance Coverage by Citizenship Status in Chambersburg borough
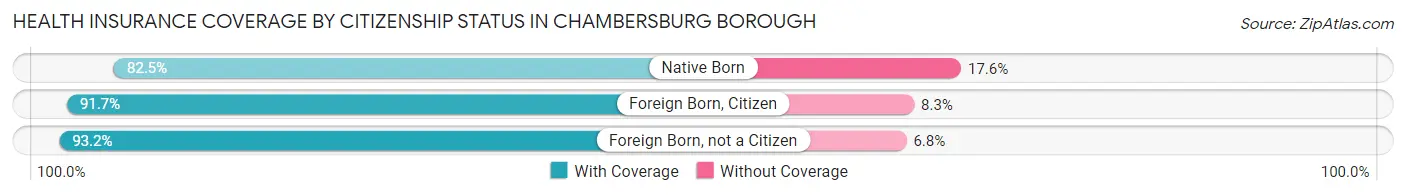
| Citizenship Status | With Coverage | Without Coverage |
| Native Born | 1,071 (82.5%) | 228 (17.5%) |
| Foreign Born, Citizen | 3,222 (91.7%) | 292 (8.3%) |
| Foreign Born, not a Citizen | 1,738 (93.2%) | 127 (6.8%) |
Health Insurance Coverage by Household Income in Chambersburg borough
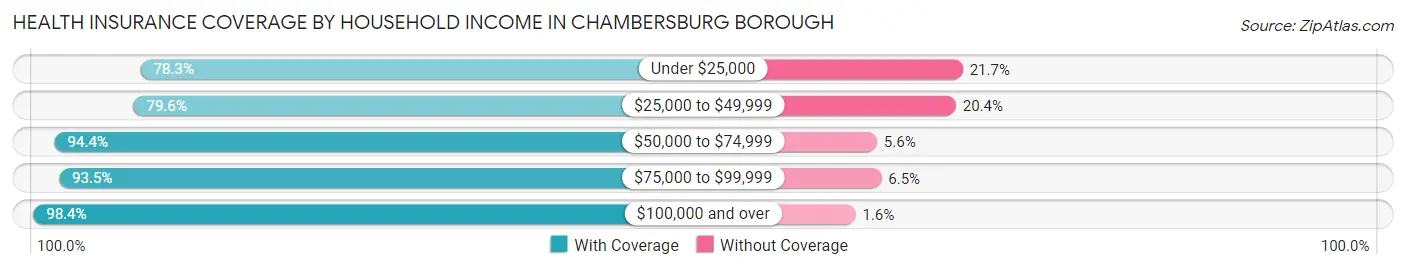
| Household Income | With Coverage | Without Coverage |
| Under $25,000 | 2,058 (78.3%) | 571 (21.7%) |
| $25,000 to $49,999 | 3,995 (79.6%) | 1,025 (20.4%) |
| $50,000 to $74,999 | 4,771 (94.4%) | 285 (5.6%) |
| $75,000 to $99,999 | 2,857 (93.5%) | 198 (6.5%) |
| $100,000 and over | 5,348 (98.4%) | 89 (1.6%) |
Public vs Private Health Insurance Coverage by Age in Chambersburg borough
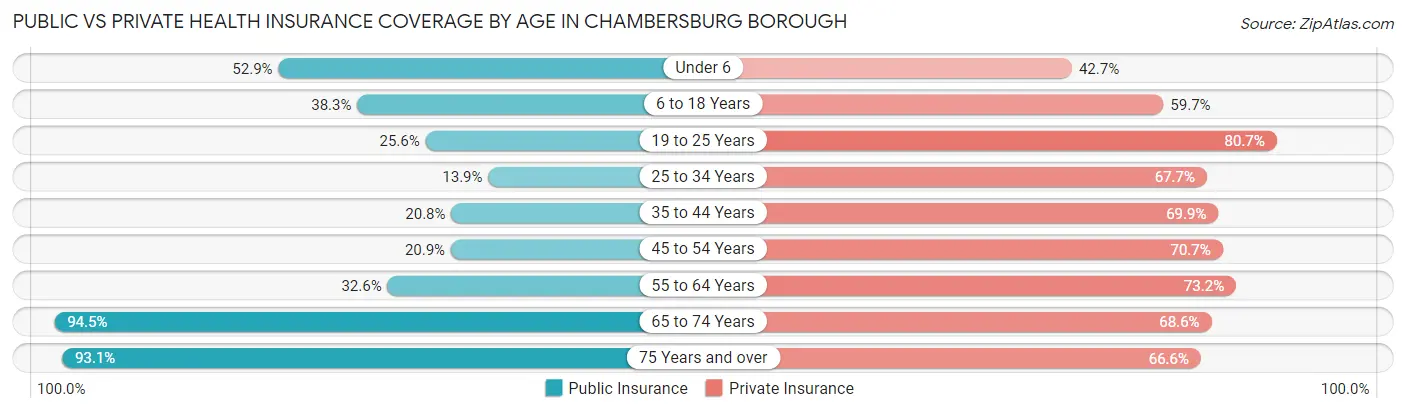
| Age Bracket | Public Insurance | Private Insurance |
| Under 6 | 687 (52.9%) | 555 (42.7%) |
| 6 to 18 Years | 1,344 (38.3%) | 2,098 (59.7%) |
| 19 to 25 Years | 477 (25.6%) | 1,505 (80.7%) |
| 25 to 34 Years | 406 (13.9%) | 1,976 (67.7%) |
| 35 to 44 Years | 565 (20.8%) | 1,899 (69.9%) |
| 45 to 54 Years | 596 (20.9%) | 2,019 (70.7%) |
| 55 to 64 Years | 788 (32.6%) | 1,766 (73.2%) |
| 65 to 74 Years | 1,926 (94.5%) | 1,398 (68.6%) |
| 75 Years and over | 1,743 (93.1%) | 1,248 (66.6%) |
| Total | 8,532 (39.7%) | 14,464 (67.3%) |
Disability Status by Sex by Age in Chambersburg borough
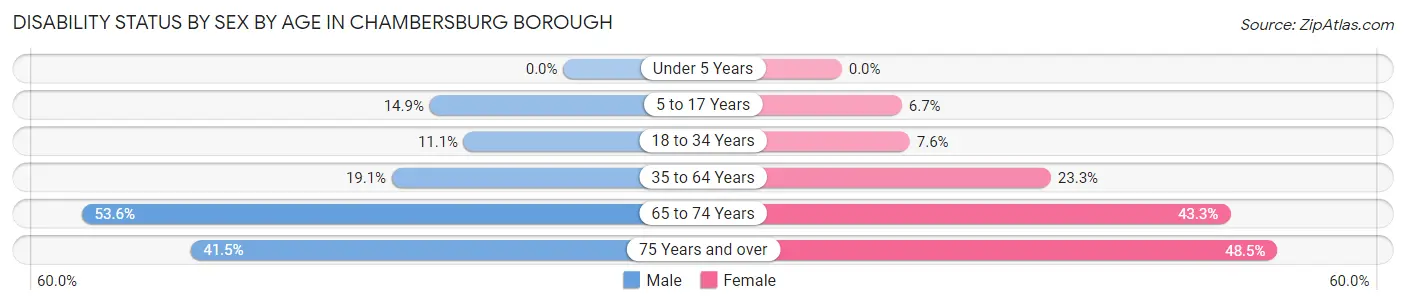
| Age Bracket | Male | Female |
| Under 5 Years | 0 (0.0%) | 0 (0.0%) |
| 5 to 17 Years | 259 (14.9%) | 102 (6.7%) |
| 18 to 34 Years | 293 (11.1%) | 196 (7.6%) |
| 35 to 64 Years | 735 (19.1%) | 964 (23.3%) |
| 65 to 74 Years | 509 (53.6%) | 471 (43.2%) |
| 75 Years and over | 253 (41.5%) | 613 (48.5%) |
Disability Class by Sex by Age in Chambersburg borough
Disability Class: Hearing Difficulty
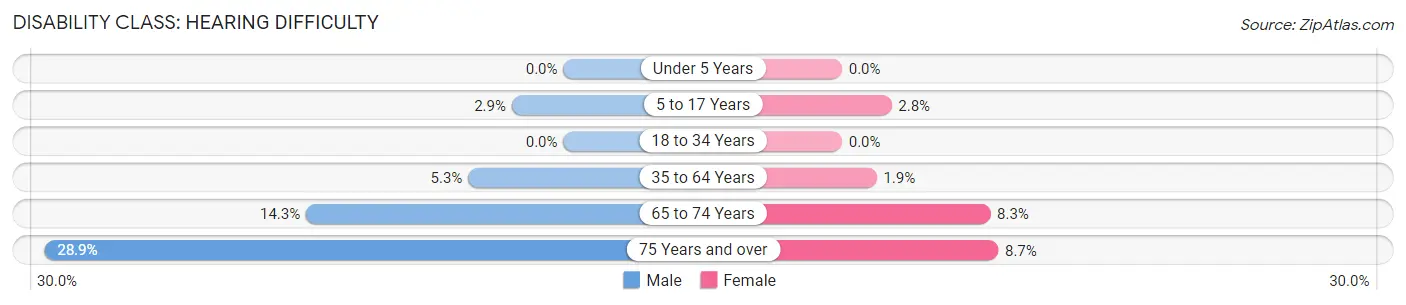
| Age Bracket | Male | Female |
| Under 5 Years | 0 (0.0%) | 0 (0.0%) |
| 5 to 17 Years | 50 (2.9%) | 42 (2.8%) |
| 18 to 34 Years | 0 (0.0%) | 0 (0.0%) |
| 35 to 64 Years | 204 (5.3%) | 80 (1.9%) |
| 65 to 74 Years | 136 (14.3%) | 90 (8.3%) |
| 75 Years and over | 176 (28.9%) | 110 (8.7%) |
Disability Class: Vision Difficulty
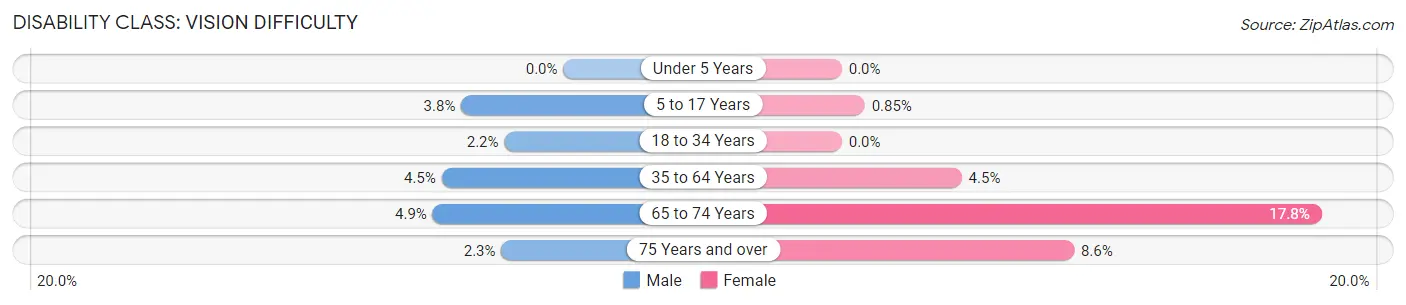
| Age Bracket | Male | Female |
| Under 5 Years | 0 (0.0%) | 0 (0.0%) |
| 5 to 17 Years | 66 (3.8%) | 13 (0.9%) |
| 18 to 34 Years | 58 (2.2%) | 0 (0.0%) |
| 35 to 64 Years | 174 (4.5%) | 184 (4.4%) |
| 65 to 74 Years | 46 (4.9%) | 194 (17.8%) |
| 75 Years and over | 14 (2.3%) | 109 (8.6%) |
Disability Class: Cognitive Difficulty
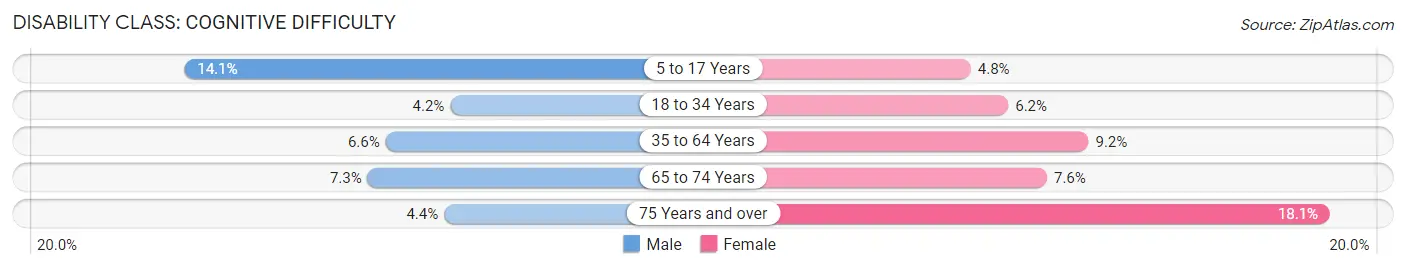
| Age Bracket | Male | Female |
| 5 to 17 Years | 245 (14.1%) | 73 (4.8%) |
| 18 to 34 Years | 111 (4.2%) | 160 (6.2%) |
| 35 to 64 Years | 254 (6.6%) | 379 (9.2%) |
| 65 to 74 Years | 69 (7.3%) | 83 (7.6%) |
| 75 Years and over | 27 (4.4%) | 229 (18.1%) |
Disability Class: Ambulatory Difficulty
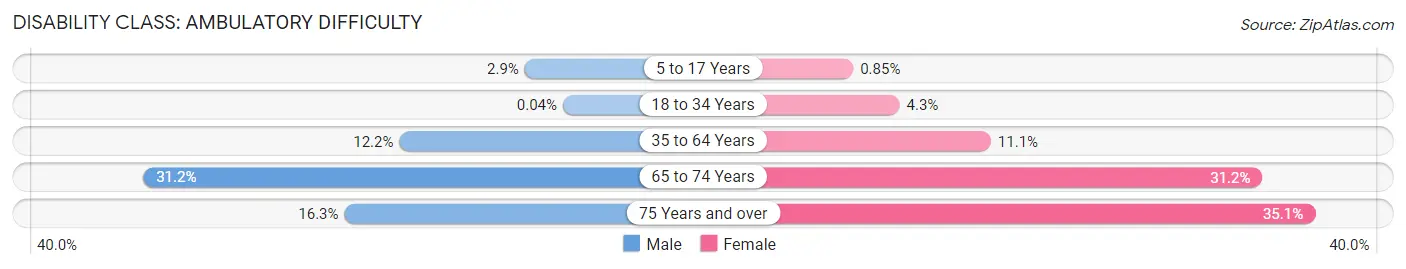
| Age Bracket | Male | Female |
| 5 to 17 Years | 50 (2.9%) | 13 (0.9%) |
| 18 to 34 Years | 1 (0.0%) | 111 (4.3%) |
| 35 to 64 Years | 469 (12.2%) | 458 (11.1%) |
| 65 to 74 Years | 296 (31.2%) | 340 (31.2%) |
| 75 Years and over | 99 (16.3%) | 444 (35.1%) |
Disability Class: Self-Care Difficulty
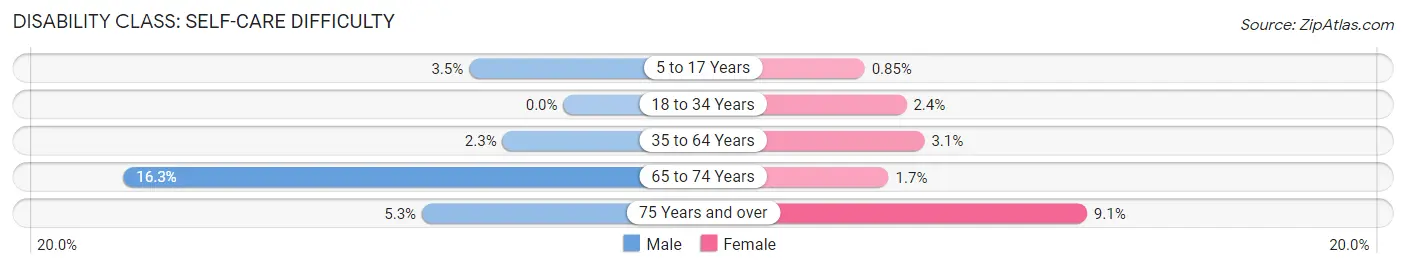
| Age Bracket | Male | Female |
| 5 to 17 Years | 61 (3.5%) | 13 (0.9%) |
| 18 to 34 Years | 0 (0.0%) | 62 (2.4%) |
| 35 to 64 Years | 87 (2.3%) | 127 (3.1%) |
| 65 to 74 Years | 155 (16.3%) | 19 (1.7%) |
| 75 Years and over | 32 (5.2%) | 115 (9.1%) |
Technology Access in Chambersburg borough
Computing Device Access in Chambersburg borough
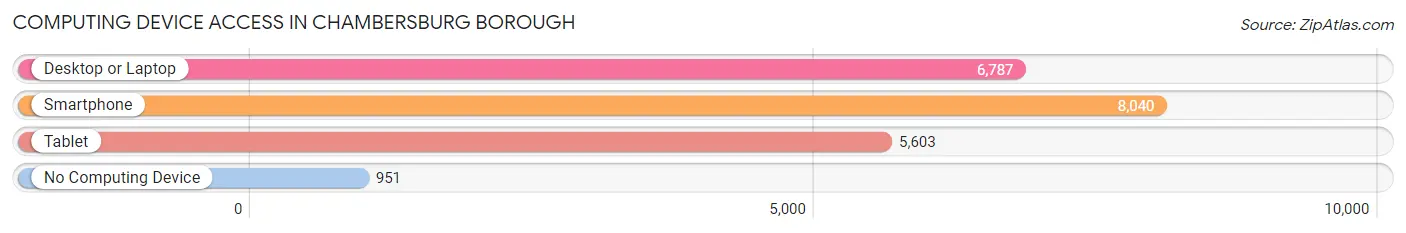
| Device Type | # Households | % Households |
| Desktop or Laptop | 6,787 | 69.2% |
| Smartphone | 8,040 | 81.9% |
| Tablet | 5,603 | 57.1% |
| No Computing Device | 951 | 9.7% |
| Total | 9,815 | 100.0% |
Internet Access in Chambersburg borough
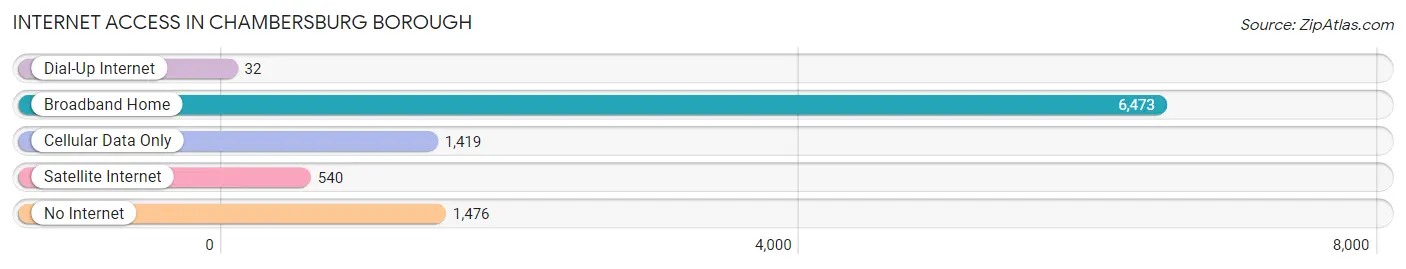
| Internet Type | # Households | % Households |
| Dial-Up Internet | 32 | 0.3% |
| Broadband Home | 6,473 | 65.9% |
| Cellular Data Only | 1,419 | 14.5% |
| Satellite Internet | 540 | 5.5% |
| No Internet | 1,476 | 15.0% |
| Total | 9,815 | 100.0% |
Chambersburg borough Summary
Chambersburg Borough is a borough located in Franklin County, Pennsylvania, United States. The population was 20,268 at the 2010 census. It is the county seat of Franklin County. Chambersburg is in the Cumberland Valley, which is part of the Great Appalachian Valley, and 13 miles (21 km) north of Maryland and the Mason-Dixon line and 52 miles (84 km) southwest of Harrisburg, the state capital.
History
Chambersburg was founded in 1764 by Benjamin Chambers, a Scots-Irish immigrant. It was named after Chambers, who had a large family and several children. The town was laid out in a square, surrounded by a stockade for protection from Native American and British raids.
Chambersburg quickly grew and prospered, and in 1790, it was made the county seat of Franklin County. During the American Civil War, Chambersburg was a major supply center for the Confederate Army. It was also the site of the Battle of Chambersburg in July 1863. After the war, Chambersburg was rebuilt and continued to grow and prosper.
Geography
Chambersburg is located at 39°55'N 77°40'W (39.914, -77.667). According to the United States Census Bureau, the borough has a total area of 4.2 square miles (10.8 km2), all of it land.
Economy
Chambersburg is a major economic center for the region. The borough is home to several large employers, including Letterkenny Army Depot, Summit Health, and Wilson College. The Chambersburg area is also home to several smaller businesses, including manufacturing, retail, and service industries.
Demographics
As of the census of 2010, there were 20,268 people, 8,541 households, and 4,945 families residing in the borough. The population density was 4,817.3 people per square mile (1,859.2/km2). There were 9,072 housing units at an average density of 2,176.2 per square mile (841.2/km2). The racial makeup of the borough was 87.2% White, 7.2% African American, 0.3% Native American, 1.7% Asian, 0.1% Pacific Islander, 1.3% from other races, and 2.4% from two or more races. Hispanic or Latino of any race were 4.2% of the population.
There were 8,541 households, out of which 25.2% had children under the age of 18 living with them, 40.2% were married couples living together, 13.3% had a female householder with no husband present, and 42.2% were non-families. 35.2% of all households were made up of individuals, and 14.3% had someone living alone who was 65 years of age or older. The average household size was 2.25 and the average family size was 2.93.
In the borough, the population was spread out, with 21.2% under the age of 18, 10.2% from 18 to 24, 27.2% from 25 to 44, 22.7% from 45 to 64, and 18.7% who were 65 years of age or older. The median age was 38 years. For every 100 females, there were 87.2 males. For every 100 females age 18 and over, there were 83.3 males.
The median income for a household in the borough was $35,945, and the median income for a family was $45,919. Males had a median income of $32,917 versus $25,945 for females. The per capita income for the borough was $19,945. About 8.7% of families and 11.2% of the population were below the poverty line, including 15.2% of those under age 18 and 8.2% of those age 65 or over.
Common Questions
What is Per Capita Income in Chambersburg borough?
Per Capita income in Chambersburg borough is $32,662.
What is the Median Family Income in Chambersburg borough?
Median Family Income in Chambersburg borough is $59,447.
What is the Median Household income in Chambersburg borough?
Median Household Income in Chambersburg borough is $53,493.
What is Income or Wage Gap in Chambersburg borough?
Income or Wage Gap in Chambersburg borough is 23.1%.
Women in Chambersburg borough earn 76.9 cents for every dollar earned by a man.
What is Inequality or Gini Index in Chambersburg borough?
Inequality or Gini Index in Chambersburg borough is 0.43.
What is the Total Population of Chambersburg borough?
Total Population of Chambersburg borough is 21,917.
What is the Total Male Population of Chambersburg borough?
Total Male Population of Chambersburg borough is 10,548.
What is the Total Female Population of Chambersburg borough?
Total Female Population of Chambersburg borough is 11,369.
What is the Ratio of Males per 100 Females in Chambersburg borough?
There are 92.78 Males per 100 Females in Chambersburg borough.
What is the Ratio of Females per 100 Males in Chambersburg borough?
There are 107.78 Females per 100 Males in Chambersburg borough.
What is the Median Population Age in Chambersburg borough?
Median Population Age in Chambersburg borough is 39.5 Years.
What is the Average Family Size in Chambersburg borough
Average Family Size in Chambersburg borough is 2.9 People.
What is the Average Household Size in Chambersburg borough
Average Household Size in Chambersburg borough is 2.2 People.
How Large is the Labor Force in Chambersburg borough?
There are 11,038 People in the Labor Forcein in Chambersburg borough.
What is the Percentage of People in the Labor Force in Chambersburg borough?
61.4% of People are in the Labor Force in Chambersburg borough.
What is the Unemployment Rate in Chambersburg borough?
Unemployment Rate in Chambersburg borough is 4.8%.