Macungie borough, PA Map & Demographics
Macungie borough Overview
$35,905
PER CAPITA INCOME
$80,240
AVG FAMILY INCOME
$60,313
AVG HOUSEHOLD INCOME
41.8%
WAGE / INCOME GAP [ % ]
58.2¢/ $1
WAGE / INCOME GAP [ $ ]
0.40
INEQUALITY / GINI INDEX
3,249
TOTAL POPULATION
1,712
MALE POPULATION
1,537
FEMALE POPULATION
111.39
MALES / 100 FEMALES
89.78
FEMALES / 100 MALES
39.9
MEDIAN AGE
3.0
AVG FAMILY SIZE
2.2
AVG HOUSEHOLD SIZE
1,913
LABOR FORCE [ PEOPLE ]
69.0%
PERCENT IN LABOR FORCE
2.1%
UNEMPLOYMENT RATE
Income in Macungie borough
Income Overview in Macungie borough
Per Capita Income in Macungie borough is $35,905, while median incomes of families and households are $80,240 and $60,313 respectively.
| Characteristic | Number | Measure |
| Per Capita Income | 3,249 | $35,905 |
| Median Family Income | 801 | $80,240 |
| Mean Family Income | 801 | $95,535 |
| Median Household Income | 1,448 | $60,313 |
| Mean Household Income | 1,448 | $81,099 |
| Income Deficit | 801 | $0 |
| Wage / Income Gap (%) | 3,249 | 41.81% |
| Wage / Income Gap ($) | 3,249 | 58.19¢ per $1 |
| Gini / Inequality Index | 3,249 | 0.40 |
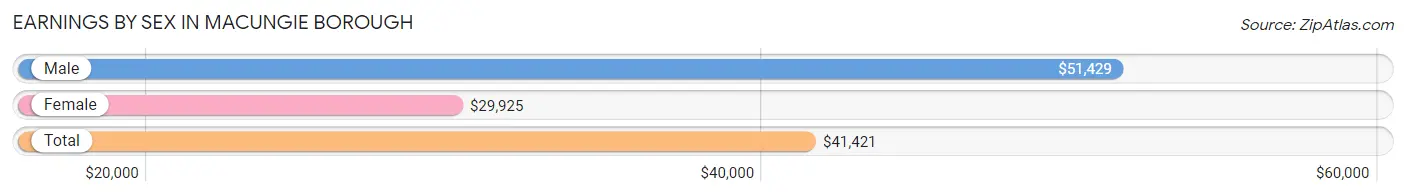
Earnings by Sex in Macungie borough
Average Earnings in Macungie borough are $41,421, $51,429 for men and $29,925 for women, a difference of 41.8%.
| Sex | Number | Average Earnings |
| Male | 988 (51.1%) | $51,429 |
| Female | 945 (48.9%) | $29,925 |
| Total | 1,933 (100.0%) | $41,421 |
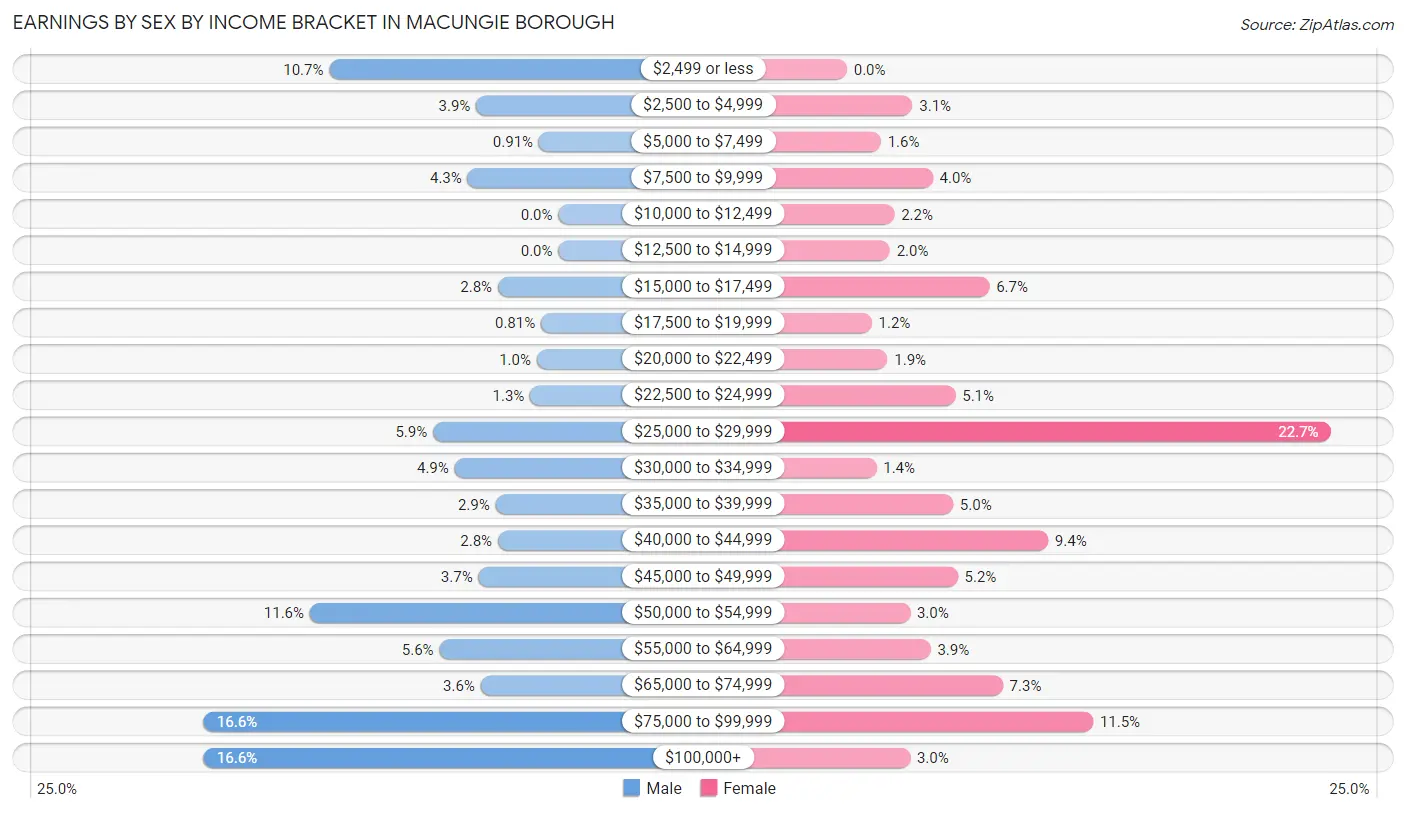
Earnings by Sex by Income Bracket in Macungie borough
The most common earnings brackets in Macungie borough are $75,000 to $99,999 for men (164 | 16.6%) and $25,000 to $29,999 for women (214 | 22.7%).
| Income | Male | Female |
| $2,499 or less | 106 (10.7%) | 0 (0.0%) |
| $2,500 to $4,999 | 38 (3.8%) | 29 (3.1%) |
| $5,000 to $7,499 | 9 (0.9%) | 15 (1.6%) |
| $7,500 to $9,999 | 42 (4.3%) | 38 (4.0%) |
| $10,000 to $12,499 | 0 (0.0%) | 21 (2.2%) |
| $12,500 to $14,999 | 0 (0.0%) | 19 (2.0%) |
| $15,000 to $17,499 | 28 (2.8%) | 63 (6.7%) |
| $17,500 to $19,999 | 8 (0.8%) | 11 (1.2%) |
| $20,000 to $22,499 | 10 (1.0%) | 18 (1.9%) |
| $22,500 to $24,999 | 13 (1.3%) | 48 (5.1%) |
| $25,000 to $29,999 | 58 (5.9%) | 214 (22.7%) |
| $30,000 to $34,999 | 48 (4.9%) | 13 (1.4%) |
| $35,000 to $39,999 | 29 (2.9%) | 47 (5.0%) |
| $40,000 to $44,999 | 28 (2.8%) | 89 (9.4%) |
| $45,000 to $49,999 | 37 (3.7%) | 49 (5.2%) |
| $50,000 to $54,999 | 115 (11.6%) | 28 (3.0%) |
| $55,000 to $64,999 | 55 (5.6%) | 37 (3.9%) |
| $65,000 to $74,999 | 36 (3.6%) | 69 (7.3%) |
| $75,000 to $99,999 | 164 (16.6%) | 109 (11.5%) |
| $100,000+ | 164 (16.6%) | 28 (3.0%) |
| Total | 988 (100.0%) | 945 (100.0%) |
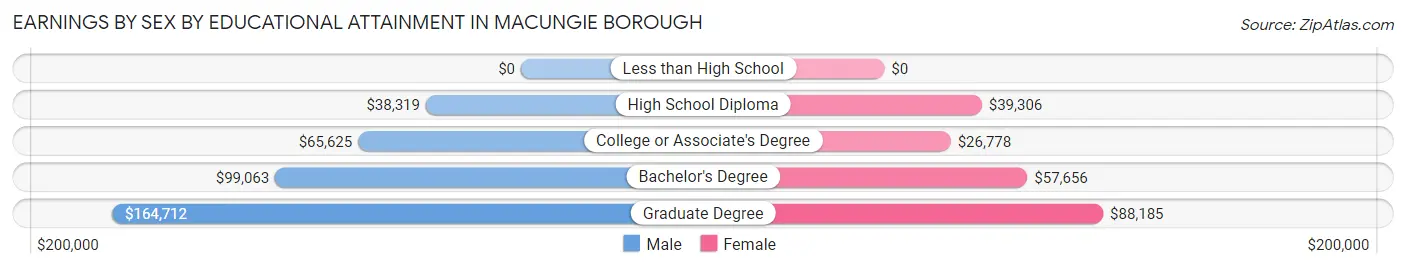
Earnings by Sex by Educational Attainment in Macungie borough
Average earnings in Macungie borough are $58,074 for men and $40,764 for women, a difference of 29.8%. Men with an educational attainment of graduate degree enjoy the highest average annual earnings of $164,712, while those with high school diploma education earn the least with $38,319. Women with an educational attainment of graduate degree earn the most with the average annual earnings of $88,185, while those with college or associate's degree education have the smallest earnings of $26,778.
| Educational Attainment | Male Income | Female Income |
| Less than High School | - | - |
| High School Diploma | $38,319 | $39,306 |
| College or Associate's Degree | $65,625 | $26,778 |
| Bachelor's Degree | $99,063 | $57,656 |
| Graduate Degree | $164,712 | $88,185 |
| Total | $58,074 | $40,764 |
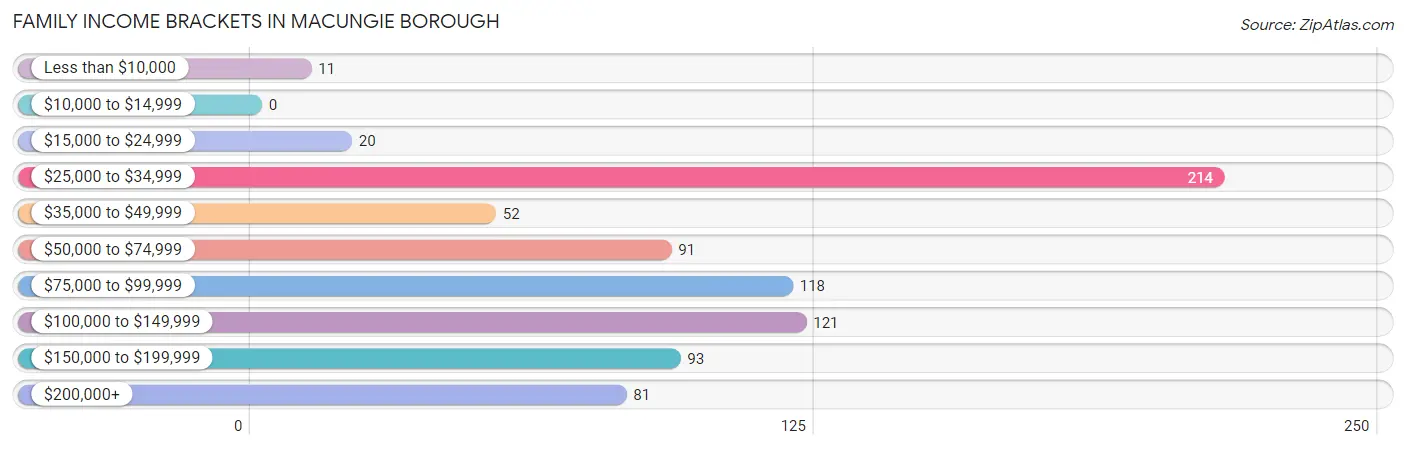
Family Income in Macungie borough
Family Income Brackets in Macungie borough
According to the Macungie borough family income data, there are 214 families falling into the $25,000 to $34,999 income range, which is the most common income bracket and makes up 26.7% of all families.
| Income Bracket | # Families | % Families |
| Less than $10,000 | 11 | 1.4% |
| $10,000 to $14,999 | 0 | 0.0% |
| $15,000 to $24,999 | 20 | 2.5% |
| $25,000 to $34,999 | 214 | 26.7% |
| $35,000 to $49,999 | 52 | 6.5% |
| $50,000 to $74,999 | 91 | 11.4% |
| $75,000 to $99,999 | 118 | 14.7% |
| $100,000 to $149,999 | 121 | 15.1% |
| $150,000 to $199,999 | 93 | 11.6% |
| $200,000+ | 81 | 10.1% |
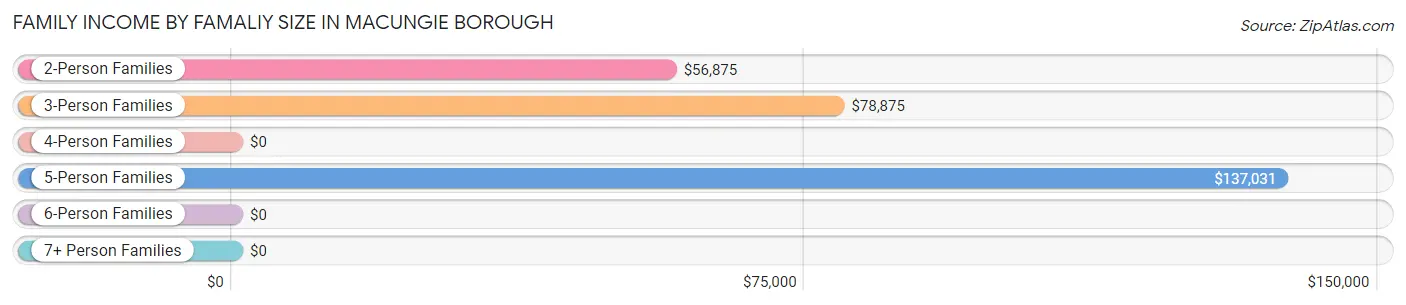
Family Income by Famaliy Size in Macungie borough
5-person families (49 | 6.1%) account for the highest median family income in Macungie borough with $137,031 per family, while 2-person families (250 | 31.2%) have the highest median income of $28,438 per family member.
| Income Bracket | # Families | Median Income |
| 2-Person Families | 250 (31.2%) | $56,875 |
| 3-Person Families | 129 (16.1%) | $78,875 |
| 4-Person Families | 354 (44.2%) | $0 |
| 5-Person Families | 49 (6.1%) | $137,031 |
| 6-Person Families | 0 (0.0%) | $0 |
| 7+ Person Families | 19 (2.4%) | $0 |
| Total | 801 (100.0%) | $80,240 |
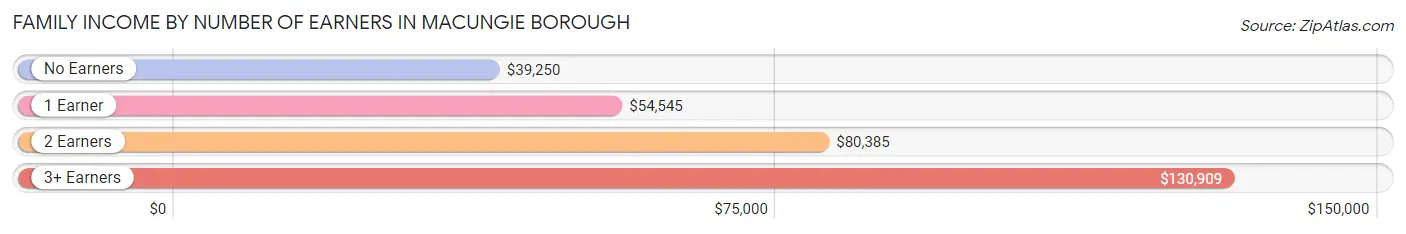
Family Income by Number of Earners in Macungie borough
The median family income in Macungie borough is $80,240, with families comprising 3+ earners (92) having the highest median family income of $130,909, while families with no earners (101) have the lowest median family income of $39,250, accounting for 11.5% and 12.6% of families, respectively.
| Number of Earners | # Families | Median Income |
| No Earners | 101 (12.6%) | $39,250 |
| 1 Earner | 150 (18.7%) | $54,545 |
| 2 Earners | 458 (57.2%) | $80,385 |
| 3+ Earners | 92 (11.5%) | $130,909 |
| Total | 801 (100.0%) | $80,240 |
Household Income in Macungie borough
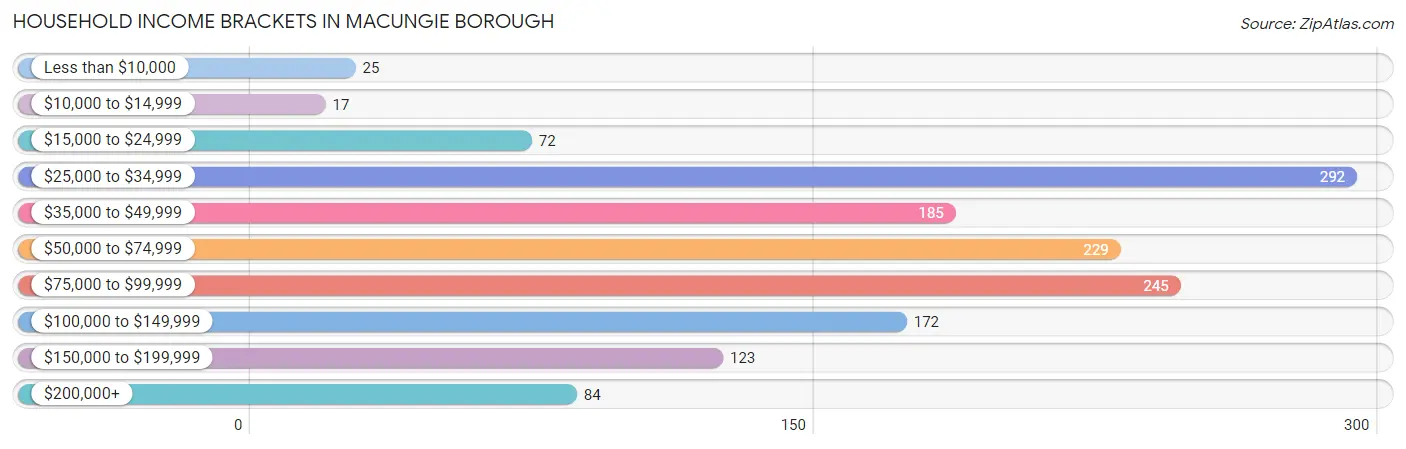
Household Income Brackets in Macungie borough
With 292 households falling in the category, the $25,000 to $34,999 income range is the most frequent in Macungie borough, accounting for 20.2% of all households. In contrast, only 17 households (1.2%) fall into the $10,000 to $14,999 income bracket, making it the least populous group.
| Income Bracket | # Households | % Households |
| Less than $10,000 | 25 | 1.7% |
| $10,000 to $14,999 | 17 | 1.2% |
| $15,000 to $24,999 | 72 | 5.0% |
| $25,000 to $34,999 | 292 | 20.2% |
| $35,000 to $49,999 | 185 | 12.8% |
| $50,000 to $74,999 | 229 | 15.8% |
| $75,000 to $99,999 | 245 | 16.9% |
| $100,000 to $149,999 | 172 | 11.9% |
| $150,000 to $199,999 | 123 | 8.5% |
| $200,000+ | 84 | 5.8% |
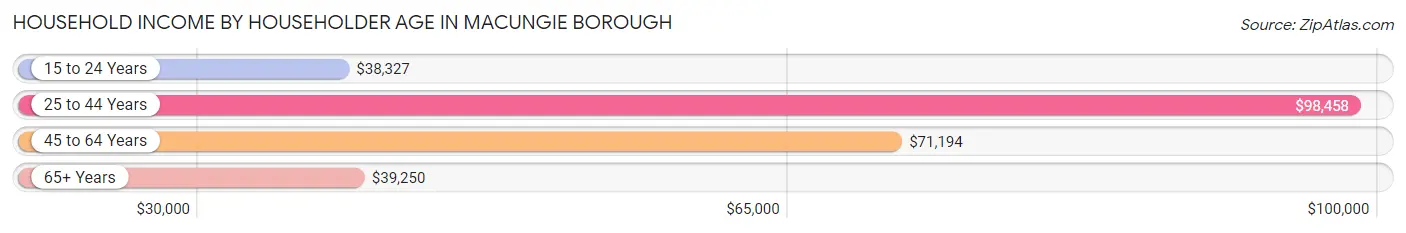
Household Income by Householder Age in Macungie borough
The median household income in Macungie borough is $60,313, with the highest median household income of $98,458 found in the 25 to 44 years age bracket for the primary householder. A total of 365 households (25.2%) fall into this category. Meanwhile, the 15 to 24 years age bracket for the primary householder has the lowest median household income of $38,327, with 135 households (9.3%) in this group.
| Income Bracket | # Households | Median Income |
| 15 to 24 Years | 135 (9.3%) | $38,327 |
| 25 to 44 Years | 365 (25.2%) | $98,458 |
| 45 to 64 Years | 683 (47.2%) | $71,194 |
| 65+ Years | 265 (18.3%) | $39,250 |
| Total | 1,448 (100.0%) | $60,313 |
Poverty in Macungie borough
Income Below Poverty by Sex and Age in Macungie borough
With 24.9% poverty level for males and 12.2% for females among the residents of Macungie borough, 16 and 17 year old males and 75 year old and over females are the most vulnerable to poverty, with 87 males (74.4%) and 32 females (36.0%) in their respective age groups living below the poverty level.
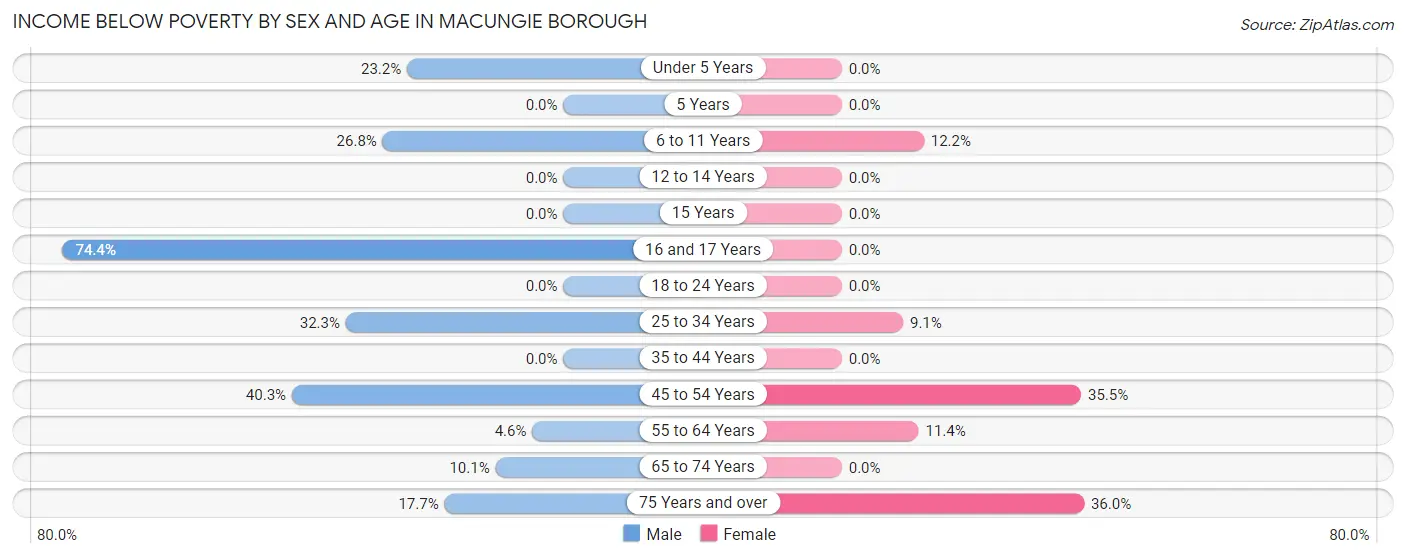
| Age Bracket | Male | Female |
| Under 5 Years | 13 (23.2%) | 0 (0.0%) |
| 5 Years | 0 (0.0%) | 0 (0.0%) |
| 6 to 11 Years | 22 (26.8%) | 14 (12.2%) |
| 12 to 14 Years | 0 (0.0%) | 0 (0.0%) |
| 15 Years | 0 (0.0%) | 0 (0.0%) |
| 16 and 17 Years | 87 (74.4%) | 0 (0.0%) |
| 18 to 24 Years | 0 (0.0%) | 0 (0.0%) |
| 25 to 34 Years | 95 (32.3%) | 22 (9.1%) |
| 35 to 44 Years | 0 (0.0%) | 0 (0.0%) |
| 45 to 54 Years | 181 (40.3%) | 97 (35.5%) |
| 55 to 64 Years | 7 (4.6%) | 22 (11.4%) |
| 65 to 74 Years | 12 (10.1%) | 0 (0.0%) |
| 75 Years and over | 9 (17.6%) | 32 (36.0%) |
| Total | 426 (24.9%) | 187 (12.2%) |
Income Above Poverty by Sex and Age in Macungie borough
According to the poverty statistics in Macungie borough, males aged 5 years and females aged under 5 years are the age groups that are most secure financially, with 100.0% of males and 100.0% of females in these age groups living above the poverty line.
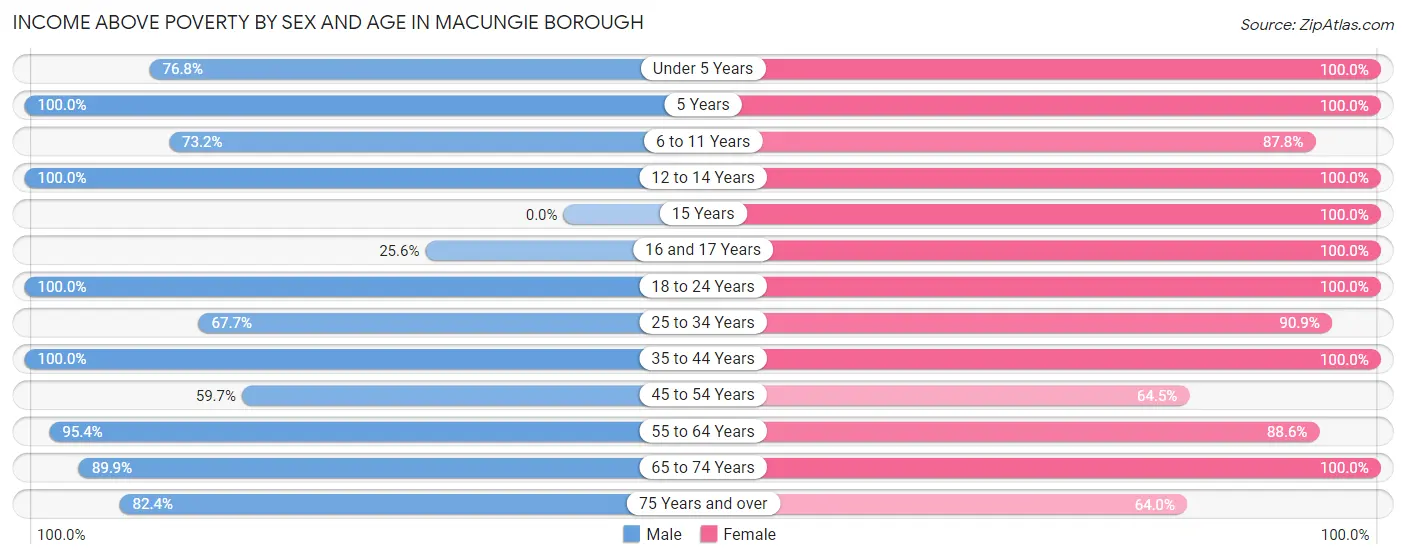
| Age Bracket | Male | Female |
| Under 5 Years | 43 (76.8%) | 34 (100.0%) |
| 5 Years | 38 (100.0%) | 43 (100.0%) |
| 6 to 11 Years | 60 (73.2%) | 101 (87.8%) |
| 12 to 14 Years | 84 (100.0%) | 11 (100.0%) |
| 15 Years | 0 (0.0%) | 13 (100.0%) |
| 16 and 17 Years | 30 (25.6%) | 25 (100.0%) |
| 18 to 24 Years | 156 (100.0%) | 175 (100.0%) |
| 25 to 34 Years | 199 (67.7%) | 220 (90.9%) |
| 35 to 44 Years | 114 (100.0%) | 163 (100.0%) |
| 45 to 54 Years | 268 (59.7%) | 176 (64.5%) |
| 55 to 64 Years | 145 (95.4%) | 171 (88.6%) |
| 65 to 74 Years | 107 (89.9%) | 161 (100.0%) |
| 75 Years and over | 42 (82.4%) | 57 (64.0%) |
| Total | 1,286 (75.1%) | 1,350 (87.8%) |
Income Below Poverty Among Married-Couple Families in Macungie borough
The poverty statistics for married-couple families in Macungie borough show that 28.1% or 190 of the total 676 families live below the poverty line. Families with 1 or 2 children have the highest poverty rate of 44.2%, comprising of 181 families. On the other hand, families with 3 or 4 children have the lowest poverty rate of 0.0%, which includes 0 families.
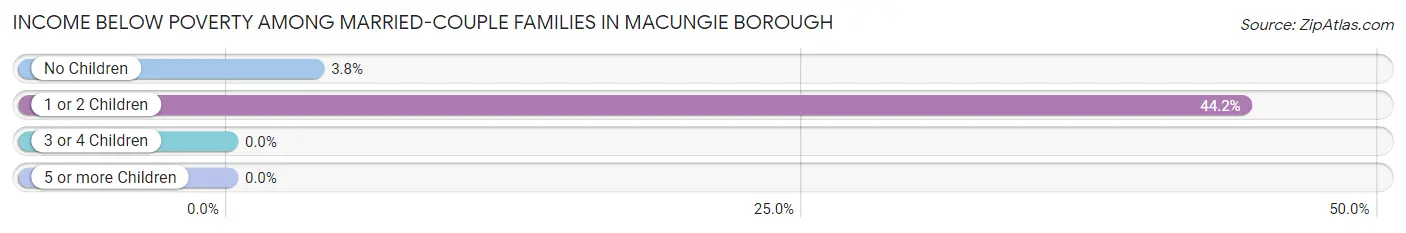
| Children | Above Poverty | Below Poverty |
| No Children | 231 (96.3%) | 9 (3.7%) |
| 1 or 2 Children | 229 (55.8%) | 181 (44.2%) |
| 3 or 4 Children | 26 (100.0%) | 0 (0.0%) |
| 5 or more Children | 0 (0.0%) | 0 (0.0%) |
| Total | 486 (71.9%) | 190 (28.1%) |
Income Below Poverty Among Single-Parent Households in Macungie borough
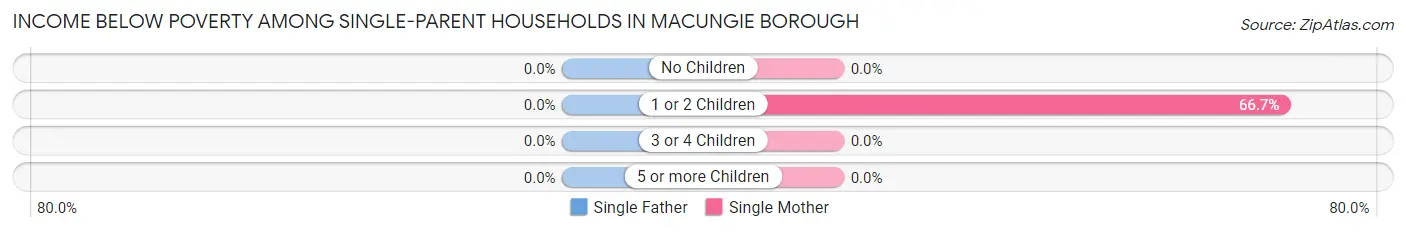
| Children | Single Father | Single Mother |
| No Children | 0 (0.0%) | 0 (0.0%) |
| 1 or 2 Children | 0 (0.0%) | 22 (66.7%) |
| 3 or 4 Children | 0 (0.0%) | 0 (0.0%) |
| 5 or more Children | 0 (0.0%) | 0 (0.0%) |
| Total | 0 (0.0%) | 22 (18.8%) |
Income Below Poverty Among Married-Couple vs Single-Parent Households in Macungie borough
The poverty data for Macungie borough shows that 190 of the married-couple family households (28.1%) and 22 of the single-parent households (17.6%) are living below the poverty level. Within the married-couple family households, those with 1 or 2 children have the highest poverty rate, with 181 households (44.2%) falling below the poverty line. Among the single-parent households, those with 1 or 2 children have the highest poverty rate, with 22 household (53.7%) living below poverty.
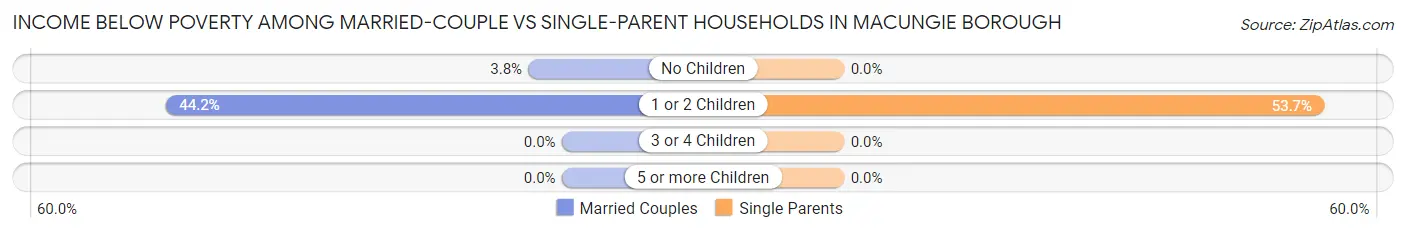
| Children | Married-Couple Families | Single-Parent Households |
| No Children | 9 (3.7%) | 0 (0.0%) |
| 1 or 2 Children | 181 (44.2%) | 22 (53.7%) |
| 3 or 4 Children | 0 (0.0%) | 0 (0.0%) |
| 5 or more Children | 0 (0.0%) | 0 (0.0%) |
| Total | 190 (28.1%) | 22 (17.6%) |
Race in Macungie borough
The most populous races in Macungie borough are White / Caucasian (2,333 | 71.8%), Hispanic or Latino (761 | 23.4%), and Two or more Races (537 | 16.5%).
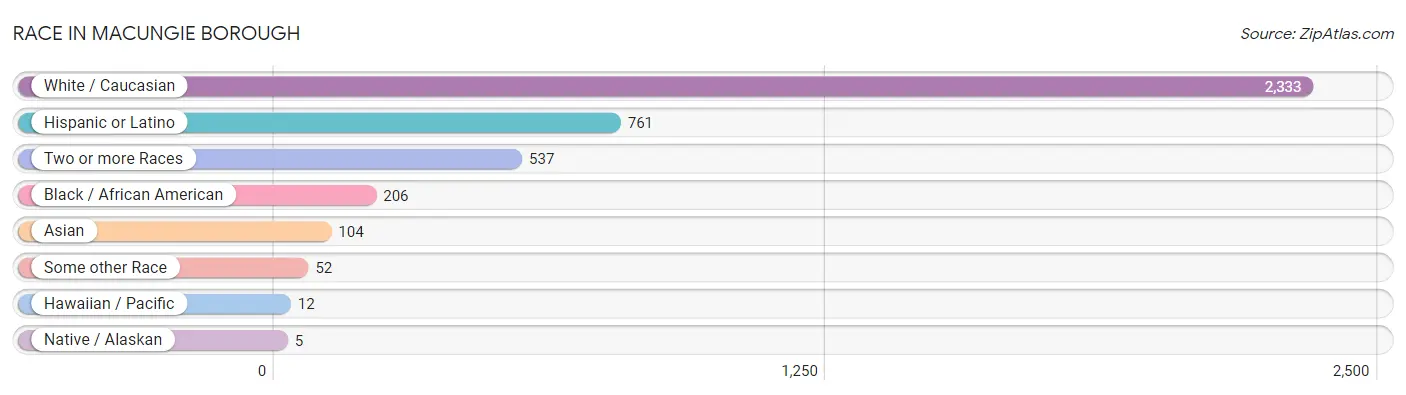
| Race | # Population | % Population |
| Asian | 104 | 3.2% |
| Black / African American | 206 | 6.3% |
| Hawaiian / Pacific | 12 | 0.4% |
| Hispanic or Latino | 761 | 23.4% |
| Native / Alaskan | 5 | 0.2% |
| White / Caucasian | 2,333 | 71.8% |
| Two or more Races | 537 | 16.5% |
| Some other Race | 52 | 1.6% |
| Total | 3,249 | 100.0% |
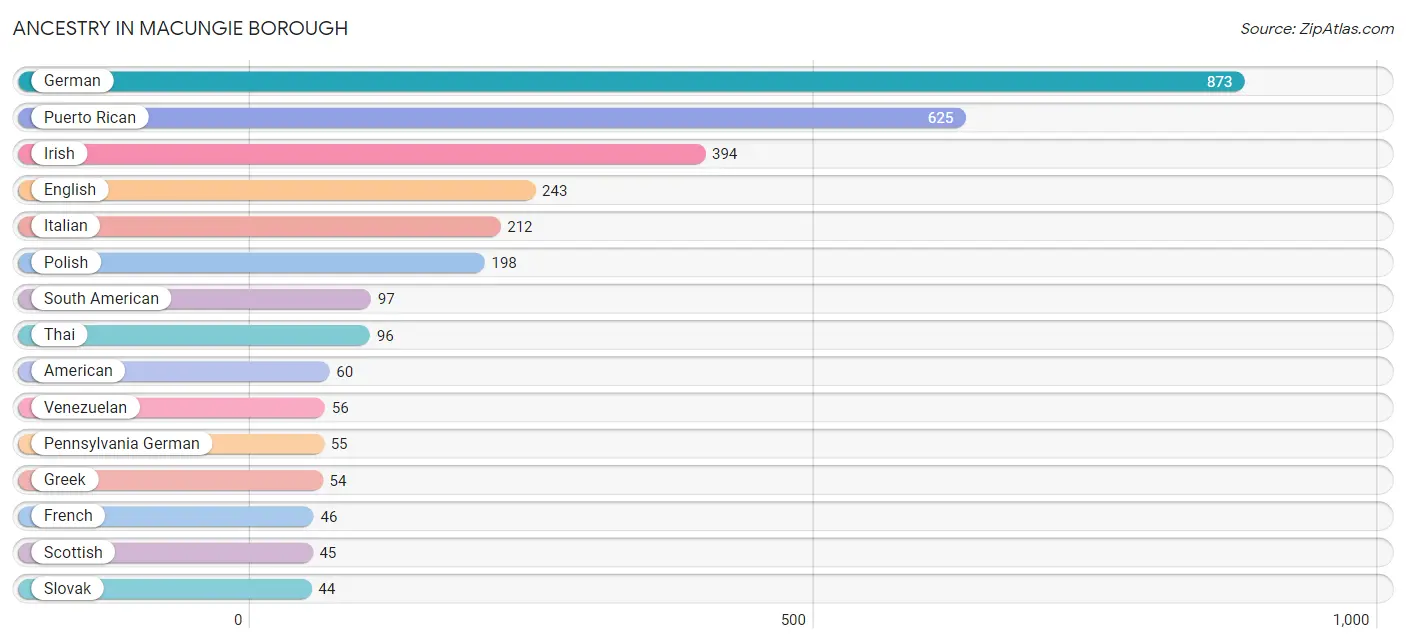
Ancestry in Macungie borough
The most populous ancestries reported in Macungie borough are German (873 | 26.9%), Puerto Rican (625 | 19.2%), Irish (394 | 12.1%), English (243 | 7.5%), and Italian (212 | 6.5%), together accounting for 72.2% of all Macungie borough residents.
| Ancestry | # Population | % Population |
| American | 60 | 1.8% |
| Arab | 32 | 1.0% |
| Argentinean | 18 | 0.5% |
| Austrian | 15 | 0.5% |
| Bhutanese | 8 | 0.3% |
| Blackfeet | 14 | 0.4% |
| British | 9 | 0.3% |
| Burmese | 6 | 0.2% |
| Cherokee | 38 | 1.2% |
| Cuban | 13 | 0.4% |
| Danish | 16 | 0.5% |
| Dominican | 21 | 0.6% |
| Dutch | 19 | 0.6% |
| Eastern European | 21 | 0.6% |
| Ecuadorian | 11 | 0.3% |
| English | 243 | 7.5% |
| European | 6 | 0.2% |
| French | 46 | 1.4% |
| German | 873 | 26.9% |
| Greek | 54 | 1.7% |
| Guamanian / Chamorro | 12 | 0.4% |
| Hungarian | 29 | 0.9% |
| Irish | 394 | 12.1% |
| Italian | 212 | 6.5% |
| Jamaican | 9 | 0.3% |
| Lithuanian | 8 | 0.3% |
| Mexican | 5 | 0.2% |
| Norwegian | 7 | 0.2% |
| Pennsylvania German | 55 | 1.7% |
| Polish | 198 | 6.1% |
| Puerto Rican | 625 | 19.2% |
| Scotch-Irish | 20 | 0.6% |
| Scottish | 45 | 1.4% |
| Sioux | 12 | 0.4% |
| Slovak | 44 | 1.3% |
| South American | 97 | 3.0% |
| Swiss | 5 | 0.2% |
| Syrian | 21 | 0.6% |
| Thai | 96 | 2.9% |
| Ukrainian | 39 | 1.2% |
| Uruguayan | 12 | 0.4% |
| Venezuelan | 56 | 1.7% |
| Welsh | 10 | 0.3% | View All 43 Rows |
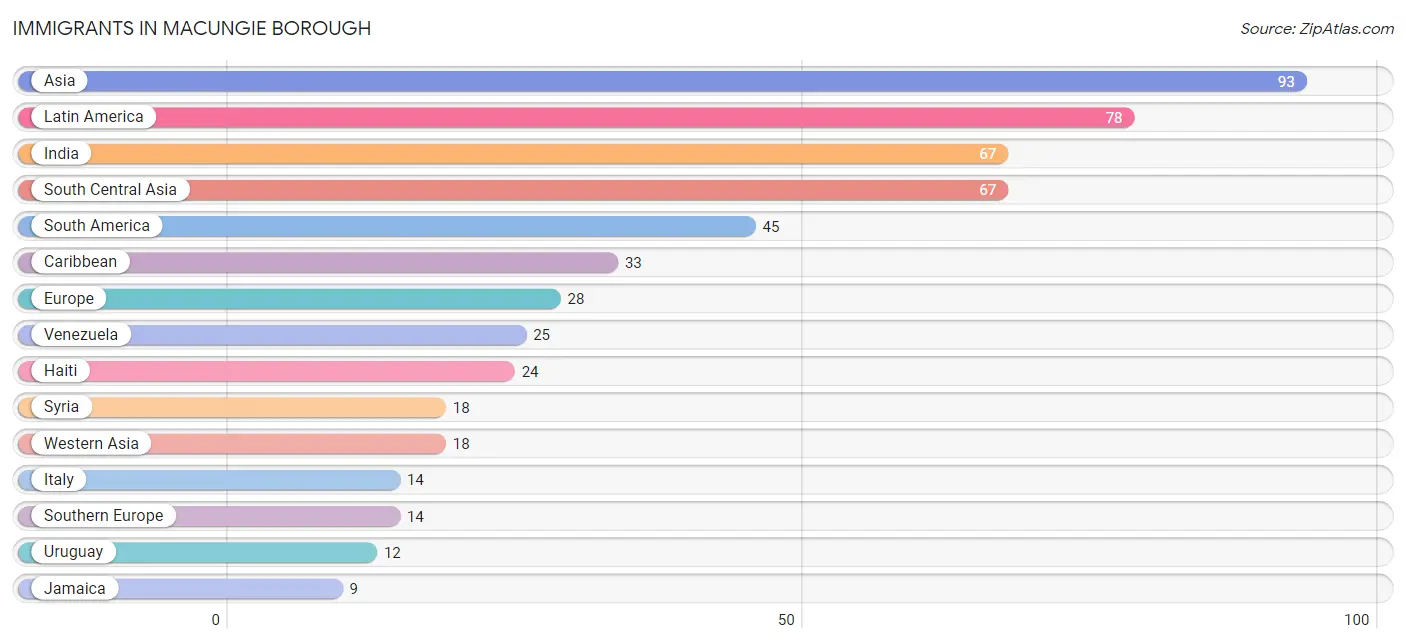
Immigrants in Macungie borough
The most numerous immigrant groups reported in Macungie borough came from Asia (93 | 2.9%), Latin America (78 | 2.4%), India (67 | 2.1%), South Central Asia (67 | 2.1%), and South America (45 | 1.4%), together accounting for 10.8% of all Macungie borough residents.
| Immigration Origin | # Population | % Population |
| Argentina | 8 | 0.3% |
| Asia | 93 | 2.9% |
| Caribbean | 33 | 1.0% |
| Eastern Asia | 8 | 0.3% |
| Eastern Europe | 8 | 0.3% |
| Europe | 28 | 0.9% |
| France | 6 | 0.2% |
| Haiti | 24 | 0.7% |
| India | 67 | 2.1% |
| Italy | 14 | 0.4% |
| Jamaica | 9 | 0.3% |
| Japan | 8 | 0.3% |
| Latin America | 78 | 2.4% |
| Poland | 8 | 0.3% |
| South America | 45 | 1.4% |
| South Central Asia | 67 | 2.1% |
| Southern Europe | 14 | 0.4% |
| Syria | 18 | 0.5% |
| Uruguay | 12 | 0.4% |
| Venezuela | 25 | 0.8% |
| Western Asia | 18 | 0.5% |
| Western Europe | 6 | 0.2% | View All 22 Rows |
Sex and Age in Macungie borough
Sex and Age in Macungie borough
The most populous age groups in Macungie borough are 50 to 54 Years (318 | 18.6%) for men and 20 to 24 Years (162 | 10.5%) for women.
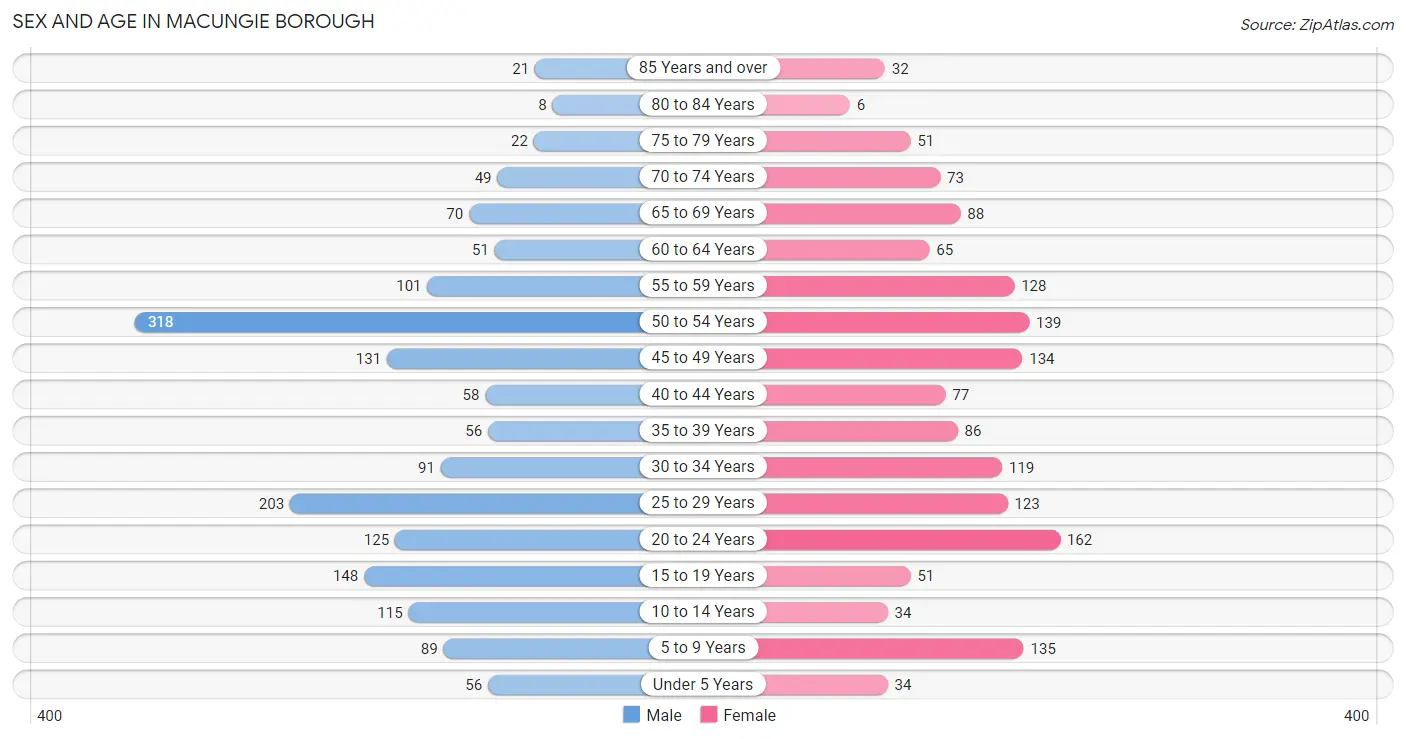
| Age Bracket | Male | Female |
| Under 5 Years | 56 (3.3%) | 34 (2.2%) |
| 5 to 9 Years | 89 (5.2%) | 135 (8.8%) |
| 10 to 14 Years | 115 (6.7%) | 34 (2.2%) |
| 15 to 19 Years | 148 (8.6%) | 51 (3.3%) |
| 20 to 24 Years | 125 (7.3%) | 162 (10.5%) |
| 25 to 29 Years | 203 (11.9%) | 123 (8.0%) |
| 30 to 34 Years | 91 (5.3%) | 119 (7.7%) |
| 35 to 39 Years | 56 (3.3%) | 86 (5.6%) |
| 40 to 44 Years | 58 (3.4%) | 77 (5.0%) |
| 45 to 49 Years | 131 (7.6%) | 134 (8.7%) |
| 50 to 54 Years | 318 (18.6%) | 139 (9.0%) |
| 55 to 59 Years | 101 (5.9%) | 128 (8.3%) |
| 60 to 64 Years | 51 (3.0%) | 65 (4.2%) |
| 65 to 69 Years | 70 (4.1%) | 88 (5.7%) |
| 70 to 74 Years | 49 (2.9%) | 73 (4.8%) |
| 75 to 79 Years | 22 (1.3%) | 51 (3.3%) |
| 80 to 84 Years | 8 (0.5%) | 6 (0.4%) |
| 85 Years and over | 21 (1.2%) | 32 (2.1%) |
| Total | 1,712 (100.0%) | 1,537 (100.0%) |
Families and Households in Macungie borough
Median Family Size in Macungie borough
The median family size in Macungie borough is 3.03 persons per family, with single male/father families (8 | 1.0%) accounting for the largest median family size of 4.13 persons per family. On the other hand, single female/mother families (117 | 14.6%) represent the smallest median family size with 2.69 persons per family.
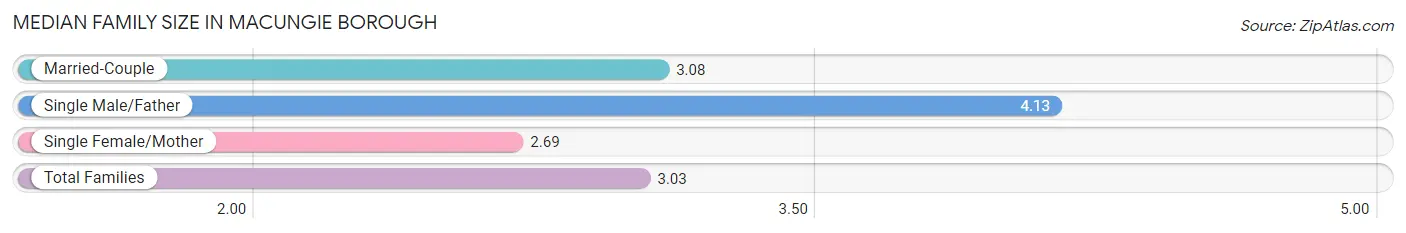
| Family Type | # Families | Family Size |
| Married-Couple | 676 (84.4%) | 3.08 |
| Single Male/Father | 8 (1.0%) | 4.13 |
| Single Female/Mother | 117 (14.6%) | 2.69 |
| Total Families | 801 (100.0%) | 3.03 |
Median Household Size in Macungie borough
The median household size in Macungie borough is 2.24 persons per household, with single male/father households (8 | 0.5%) accounting for the largest median household size of 4.13 persons per household. non-family households (647 | 44.7%) represent the smallest median household size with 1.18 persons per household.
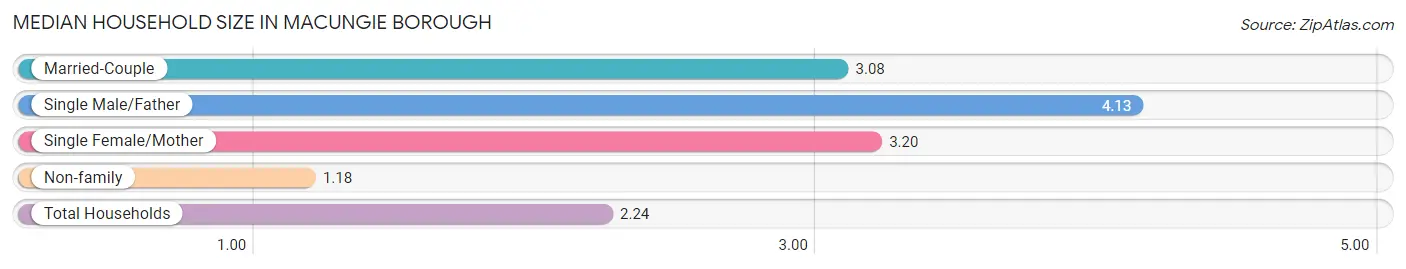
| Household Type | # Households | Household Size |
| Married-Couple | 676 (46.7%) | 3.08 |
| Single Male/Father | 8 (0.5%) | 4.13 |
| Single Female/Mother | 117 (8.1%) | 3.20 |
| Non-family | 647 (44.7%) | 1.18 |
| Total Households | 1,448 (100.0%) | 2.24 |
Household Size by Marriage Status in Macungie borough
Out of a total of 1,448 households in Macungie borough, 801 (55.3%) are family households, while 647 (44.7%) are nonfamily households. The most numerous type of family households are 4-person households, comprising 365, and the most common type of nonfamily households are 1-person households, comprising 536.
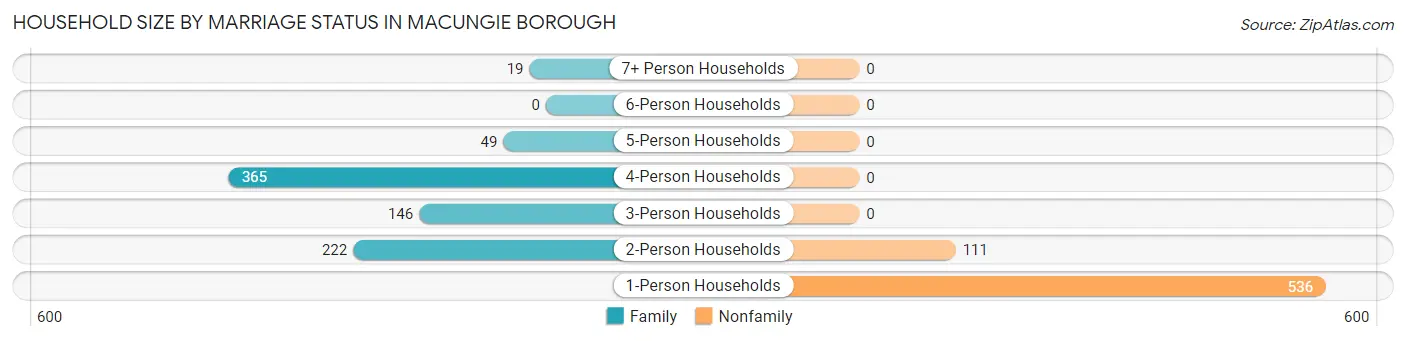
| Household Size | Family Households | Nonfamily Households |
| 1-Person Households | - | 536 (37.0%) |
| 2-Person Households | 222 (15.3%) | 111 (7.7%) |
| 3-Person Households | 146 (10.1%) | 0 (0.0%) |
| 4-Person Households | 365 (25.2%) | 0 (0.0%) |
| 5-Person Households | 49 (3.4%) | 0 (0.0%) |
| 6-Person Households | 0 (0.0%) | 0 (0.0%) |
| 7+ Person Households | 19 (1.3%) | 0 (0.0%) |
| Total | 801 (55.3%) | 647 (44.7%) |
Female Fertility in Macungie borough
Fertility by Age in Macungie borough
Average fertility rate in Macungie borough is 25.0 births per 1,000 women. Women in the age bracket of 20 to 34 years have the highest fertility rate with 47.0 births per 1,000 women. Women in the age bracket of 20 to 34 years acount for 100.0% of all women with births.
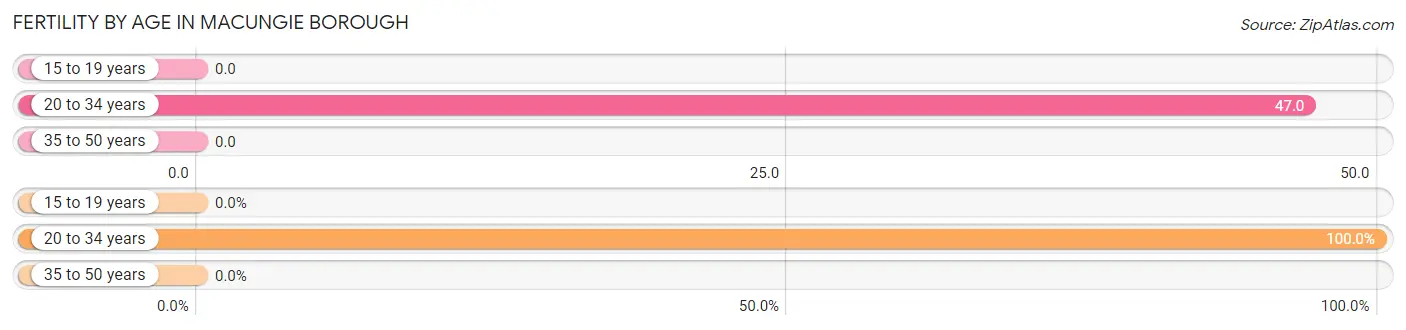
| Age Bracket | Women with Births | Births / 1,000 Women |
| 15 to 19 years | 0 (0.0%) | 0.0 |
| 20 to 34 years | 19 (100.0%) | 47.0 |
| 35 to 50 years | 0 (0.0%) | 0.0 |
| Total | 19 (100.0%) | 25.0 |
Fertility by Age by Marriage Status in Macungie borough
42.1% of women with births (19) in Macungie borough are married. The highest percentage of unmarried women with births falls into 20 to 34 years age bracket with 57.9% of them unmarried at the time of birth, while the lowest percentage of unmarried women with births belong to 20 to 34 years age bracket with 57.9% of them unmarried.
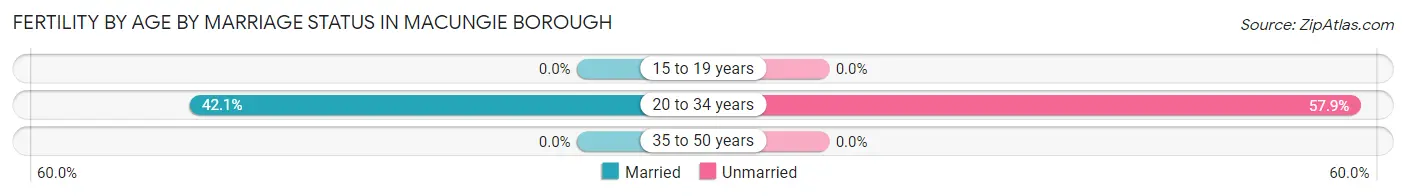
| Age Bracket | Married | Unmarried |
| 15 to 19 years | 0 (0.0%) | 0 (0.0%) |
| 20 to 34 years | 8 (42.1%) | 11 (57.9%) |
| 35 to 50 years | 0 (0.0%) | 0 (0.0%) |
| Total | 8 (42.1%) | 11 (57.9%) |
Fertility by Education in Macungie borough
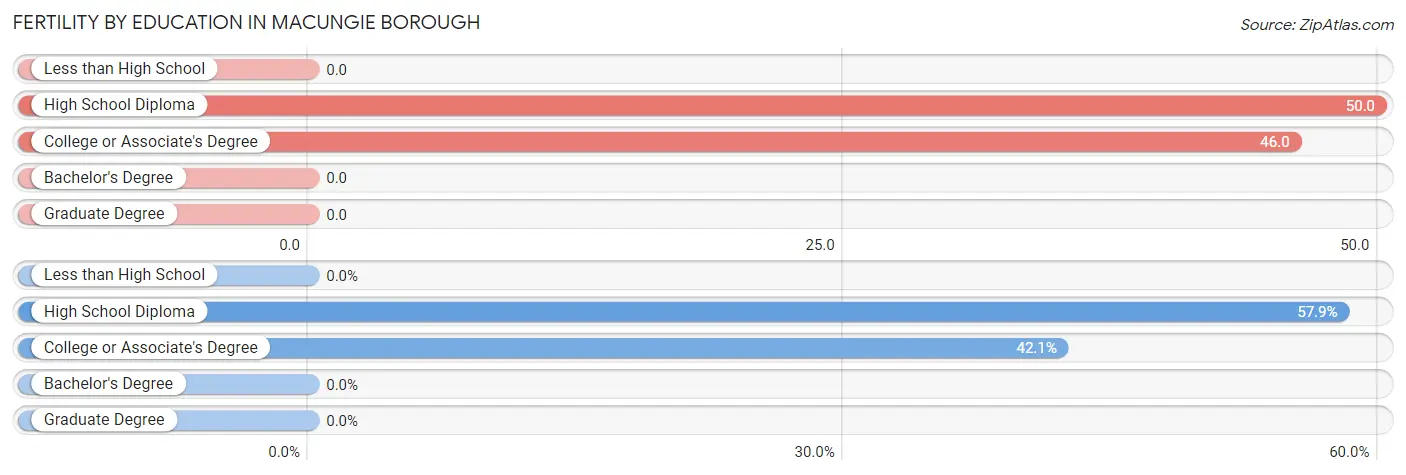
| Educational Attainment | Women with Births | Births / 1,000 Women |
| Less than High School | 0 (0.0%) | 0.0 |
| High School Diploma | 11 (57.9%) | 50.0 |
| College or Associate's Degree | 8 (42.1%) | 46.0 |
| Bachelor's Degree | 0 (0.0%) | 0.0 |
| Graduate Degree | 0 (0.0%) | 0.0 |
| Total | 19 (100.0%) | 25.0 |
Fertility by Education by Marriage Status in Macungie borough
57.9% of women with births in Macungie borough are unmarried. Women with the educational attainment of college or associate's degree are most likely to be married with 100.0% of them married at childbirth, while women with the educational attainment of high school diploma are least likely to be married with 100.0% of them unmarried at childbirth.
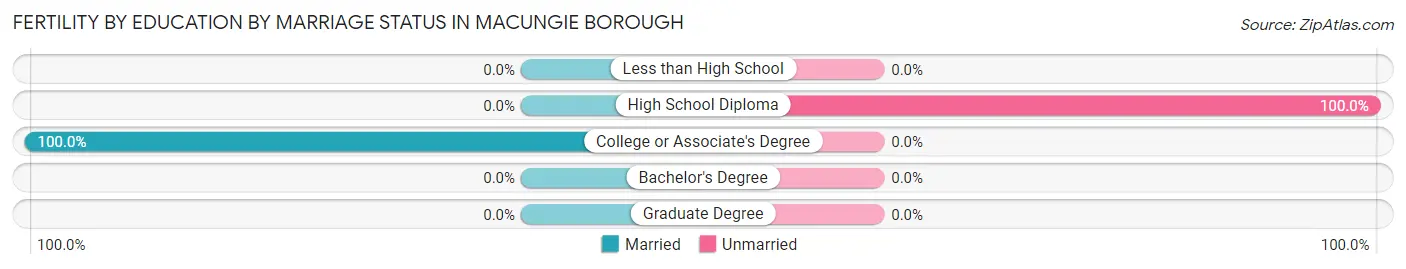
| Educational Attainment | Married | Unmarried |
| Less than High School | 0 (0.0%) | 0 (0.0%) |
| High School Diploma | 0 (0.0%) | 11 (100.0%) |
| College or Associate's Degree | 8 (100.0%) | 0 (0.0%) |
| Bachelor's Degree | 0 (0.0%) | 0 (0.0%) |
| Graduate Degree | 0 (0.0%) | 0 (0.0%) |
| Total | 8 (42.1%) | 11 (57.9%) |
Employment Characteristics in Macungie borough
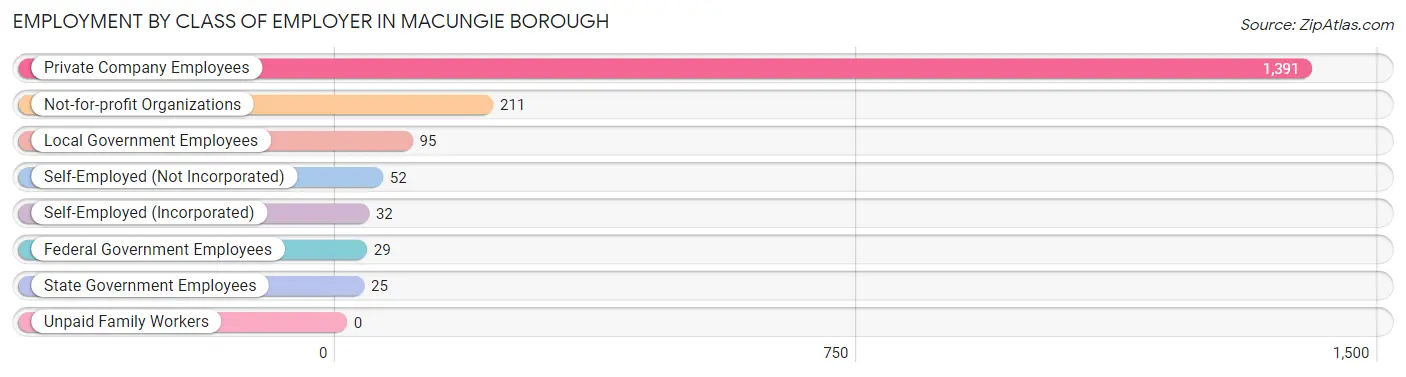
Employment by Class of Employer in Macungie borough
Among the 1,835 employed individuals in Macungie borough, private company employees (1,391 | 75.8%), not-for-profit organizations (211 | 11.5%), and local government employees (95 | 5.2%) make up the most common classes of employment.
| Employer Class | # Employees | % Employees |
| Private Company Employees | 1,391 | 75.8% |
| Self-Employed (Incorporated) | 32 | 1.7% |
| Self-Employed (Not Incorporated) | 52 | 2.8% |
| Not-for-profit Organizations | 211 | 11.5% |
| Local Government Employees | 95 | 5.2% |
| State Government Employees | 25 | 1.4% |
| Federal Government Employees | 29 | 1.6% |
| Unpaid Family Workers | 0 | 0.0% |
| Total | 1,835 | 100.0% |
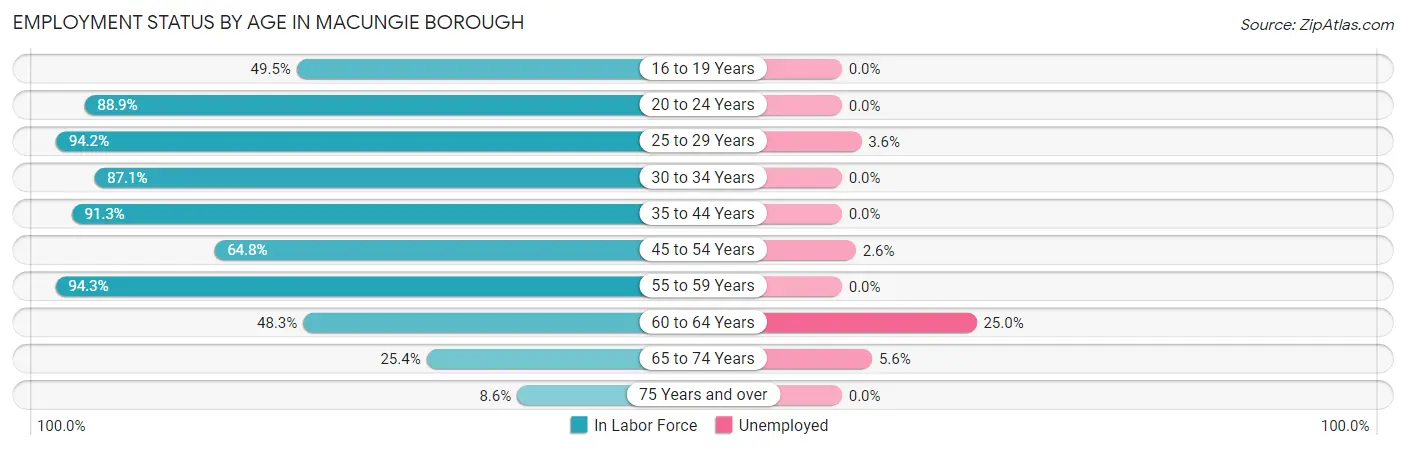
Employment Status by Age in Macungie borough
According to the labor force statistics for Macungie borough, out of the total population over 16 years of age (2,773), 69.0% or 1,913 individuals are in the labor force, with 2.1% or 40 of them unemployed. The age group with the highest labor force participation rate is 55 to 59 years, with 94.3% or 216 individuals in the labor force. Within the labor force, the 60 to 64 years age range has the highest percentage of unemployed individuals, with 25.0% or 14 of them being unemployed.
| Age Bracket | In Labor Force | Unemployed |
| 16 to 19 Years | 92 (49.5%) | 0 (0.0%) |
| 20 to 24 Years | 255 (88.9%) | 0 (0.0%) |
| 25 to 29 Years | 307 (94.2%) | 11 (3.6%) |
| 30 to 34 Years | 183 (87.1%) | 0 (0.0%) |
| 35 to 44 Years | 253 (91.3%) | 0 (0.0%) |
| 45 to 54 Years | 468 (64.8%) | 12 (2.6%) |
| 55 to 59 Years | 216 (94.3%) | 0 (0.0%) |
| 60 to 64 Years | 56 (48.3%) | 14 (25.0%) |
| 65 to 74 Years | 71 (25.4%) | 4 (5.6%) |
| 75 Years and over | 12 (8.6%) | 0 (0.0%) |
| Total | 1,913 (69.0%) | 40 (2.1%) |
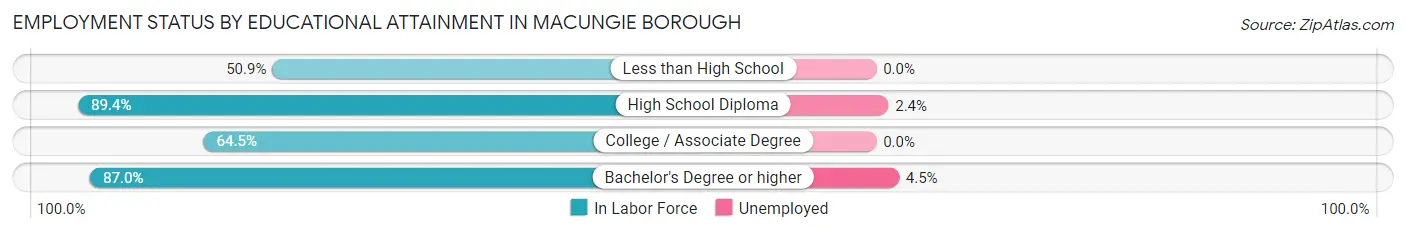
Employment Status by Educational Attainment in Macungie borough
According to labor force statistics for Macungie borough, 78.9% of individuals (1,483) out of the total population between 25 and 64 years of age (1,880) are in the labor force, with 2.5% or 37 of them being unemployed. The group with the highest labor force participation rate are those with the educational attainment of high school diploma, with 89.4% or 462 individuals in the labor force. Within the labor force, individuals with bachelor's degree or higher education have the highest percentage of unemployment, with 4.5% or 26 of them being unemployed.
| Educational Attainment | In Labor Force | Unemployed |
| Less than High School | 29 (50.9%) | 0 (0.0%) |
| High School Diploma | 462 (89.4%) | 12 (2.4%) |
| College / Associate Degree | 415 (64.5%) | 0 (0.0%) |
| Bachelor's Degree or higher | 577 (87.0%) | 30 (4.5%) |
| Total | 1,483 (78.9%) | 47 (2.5%) |
Employment Occupations by Sex in Macungie borough
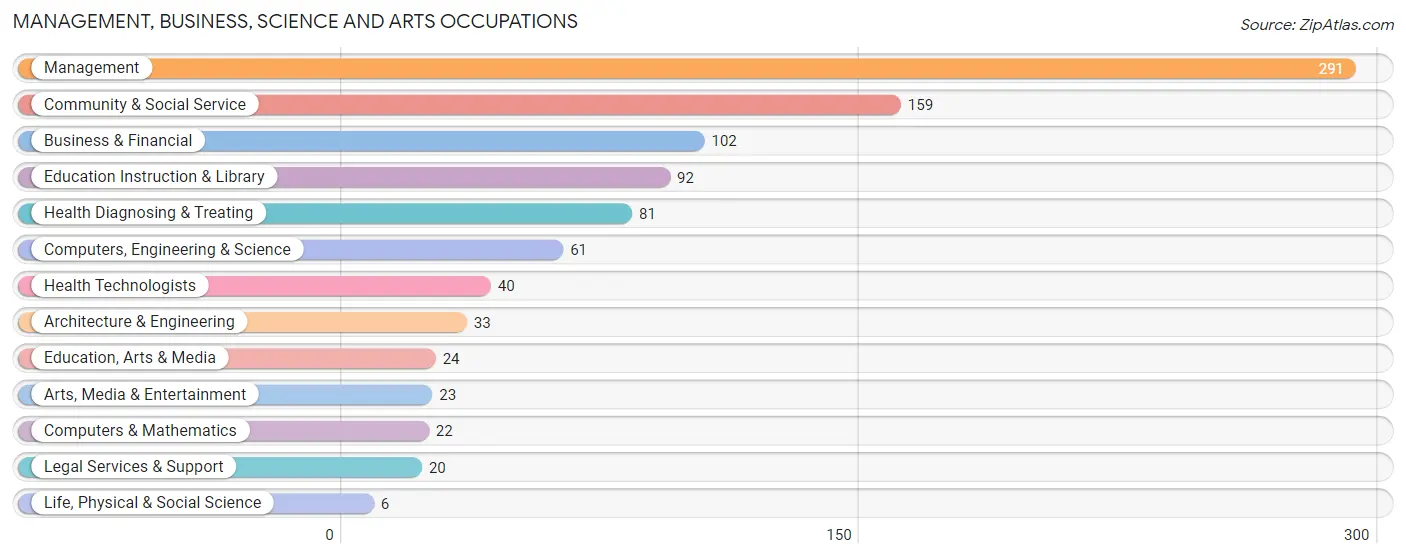
Management, Business, Science and Arts Occupations
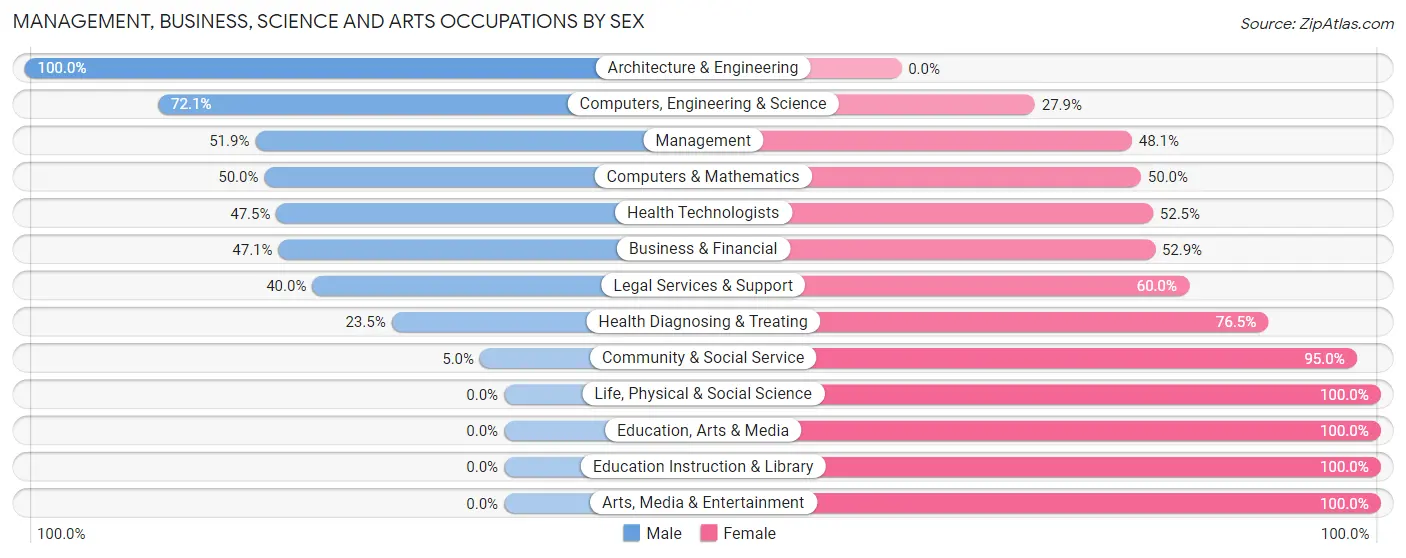
The most common Management, Business, Science and Arts occupations in Macungie borough are Management (291 | 15.5%), Community & Social Service (159 | 8.5%), Business & Financial (102 | 5.4%), Education Instruction & Library (92 | 4.9%), and Health Diagnosing & Treating (81 | 4.3%).
Management, Business, Science and Arts Occupations by Sex
Within the Management, Business, Science and Arts occupations in Macungie borough, the most male-oriented occupations are Architecture & Engineering (100.0%), Computers, Engineering & Science (72.1%), and Management (51.9%), while the most female-oriented occupations are Life, Physical & Social Science (100.0%), Education, Arts & Media (100.0%), and Education Instruction & Library (100.0%).
| Occupation | Male | Female |
| Management | 151 (51.9%) | 140 (48.1%) |
| Business & Financial | 48 (47.1%) | 54 (52.9%) |
| Computers, Engineering & Science | 44 (72.1%) | 17 (27.9%) |
| Computers & Mathematics | 11 (50.0%) | 11 (50.0%) |
| Architecture & Engineering | 33 (100.0%) | 0 (0.0%) |
| Life, Physical & Social Science | 0 (0.0%) | 6 (100.0%) |
| Community & Social Service | 8 (5.0%) | 151 (95.0%) |
| Education, Arts & Media | 0 (0.0%) | 24 (100.0%) |
| Legal Services & Support | 8 (40.0%) | 12 (60.0%) |
| Education Instruction & Library | 0 (0.0%) | 92 (100.0%) |
| Arts, Media & Entertainment | 0 (0.0%) | 23 (100.0%) |
| Health Diagnosing & Treating | 19 (23.5%) | 62 (76.5%) |
| Health Technologists | 19 (47.5%) | 21 (52.5%) |
| Total (Category) | 270 (38.9%) | 424 (61.1%) |
| Total (Overall) | 934 (49.9%) | 938 (50.1%) |
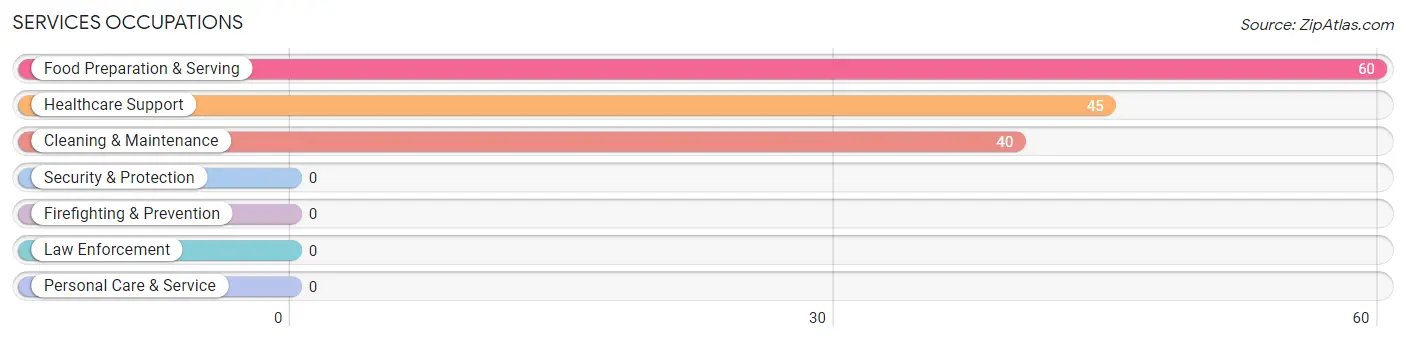
Services Occupations
The most common Services occupations in Macungie borough are Food Preparation & Serving (60 | 3.2%), Healthcare Support (45 | 2.4%), and Cleaning & Maintenance (40 | 2.1%).
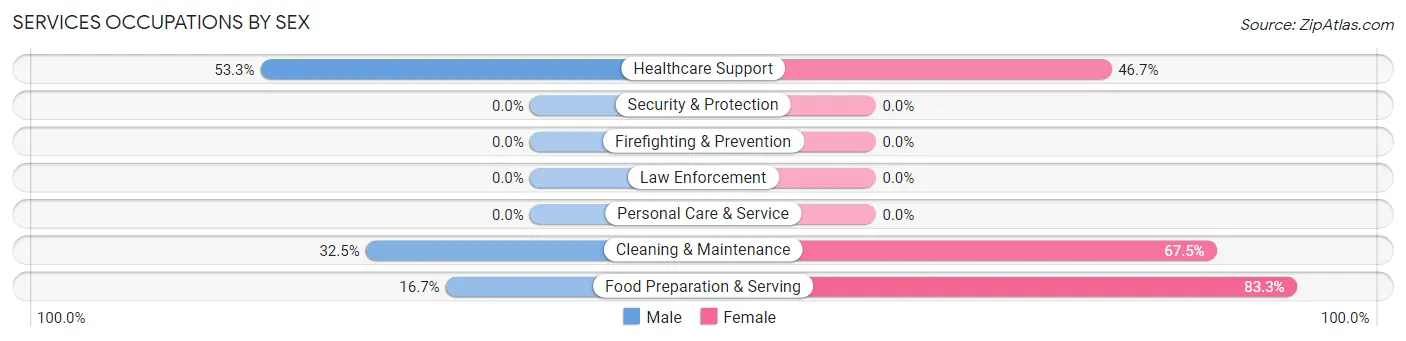
Services Occupations by Sex
Within the Services occupations in Macungie borough, the most male-oriented occupations are Healthcare Support (53.3%), Cleaning & Maintenance (32.5%), and Food Preparation & Serving (16.7%), while the most female-oriented occupations are Food Preparation & Serving (83.3%), Cleaning & Maintenance (67.5%), and Healthcare Support (46.7%).
| Occupation | Male | Female |
| Healthcare Support | 24 (53.3%) | 21 (46.7%) |
| Security & Protection | 0 (0.0%) | 0 (0.0%) |
| Firefighting & Prevention | 0 (0.0%) | 0 (0.0%) |
| Law Enforcement | 0 (0.0%) | 0 (0.0%) |
| Food Preparation & Serving | 10 (16.7%) | 50 (83.3%) |
| Cleaning & Maintenance | 13 (32.5%) | 27 (67.5%) |
| Personal Care & Service | 0 (0.0%) | 0 (0.0%) |
| Total (Category) | 47 (32.4%) | 98 (67.6%) |
| Total (Overall) | 934 (49.9%) | 938 (50.1%) |
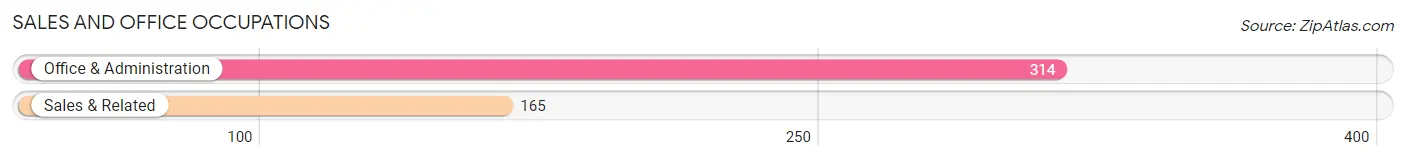
Sales and Office Occupations
The most common Sales and Office occupations in Macungie borough are Office & Administration (314 | 16.8%), and Sales & Related (165 | 8.8%).
Sales and Office Occupations by Sex
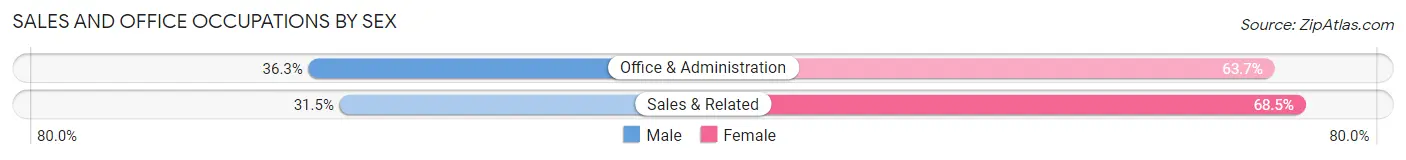
| Occupation | Male | Female |
| Sales & Related | 52 (31.5%) | 113 (68.5%) |
| Office & Administration | 114 (36.3%) | 200 (63.7%) |
| Total (Category) | 166 (34.7%) | 313 (65.3%) |
| Total (Overall) | 934 (49.9%) | 938 (50.1%) |
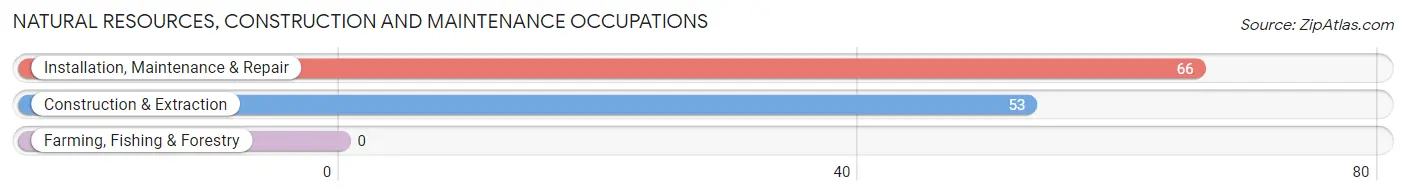
Natural Resources, Construction and Maintenance Occupations
The most common Natural Resources, Construction and Maintenance occupations in Macungie borough are Installation, Maintenance & Repair (66 | 3.5%), and Construction & Extraction (53 | 2.8%).
Natural Resources, Construction and Maintenance Occupations by Sex
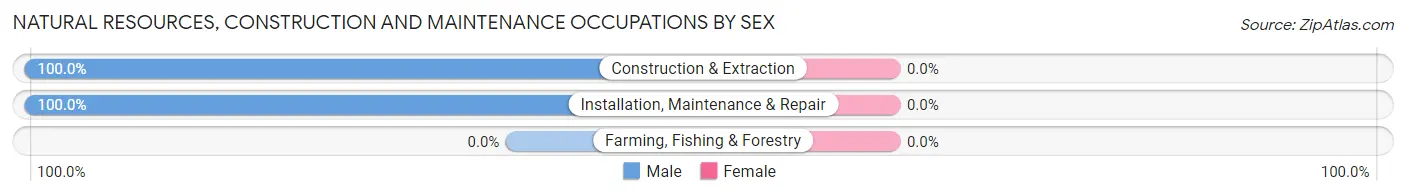
| Occupation | Male | Female |
| Farming, Fishing & Forestry | 0 (0.0%) | 0 (0.0%) |
| Construction & Extraction | 53 (100.0%) | 0 (0.0%) |
| Installation, Maintenance & Repair | 66 (100.0%) | 0 (0.0%) |
| Total (Category) | 119 (100.0%) | 0 (0.0%) |
| Total (Overall) | 934 (49.9%) | 938 (50.1%) |
Production, Transportation and Moving Occupations
The most common Production, Transportation and Moving occupations in Macungie borough are Transportation (264 | 14.1%), Production (105 | 5.6%), and Material Moving (66 | 3.5%).
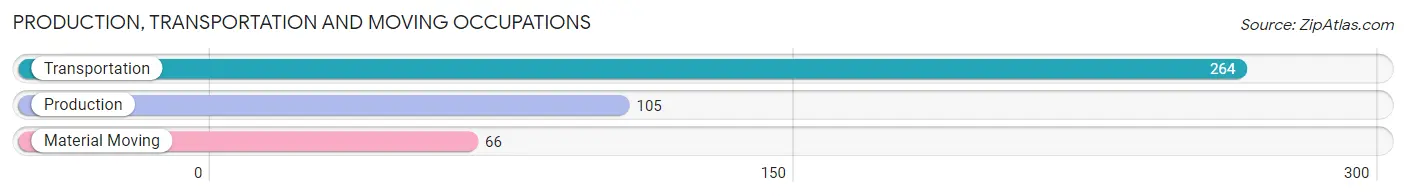
Production, Transportation and Moving Occupations by Sex
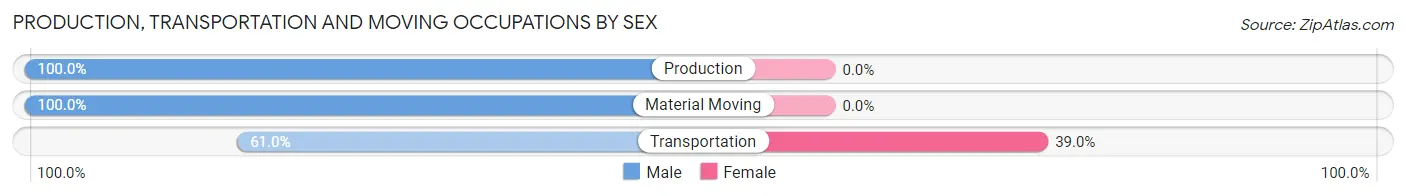
| Occupation | Male | Female |
| Production | 105 (100.0%) | 0 (0.0%) |
| Transportation | 161 (61.0%) | 103 (39.0%) |
| Material Moving | 66 (100.0%) | 0 (0.0%) |
| Total (Category) | 332 (76.3%) | 103 (23.7%) |
| Total (Overall) | 934 (49.9%) | 938 (50.1%) |
Employment Industries by Sex in Macungie borough
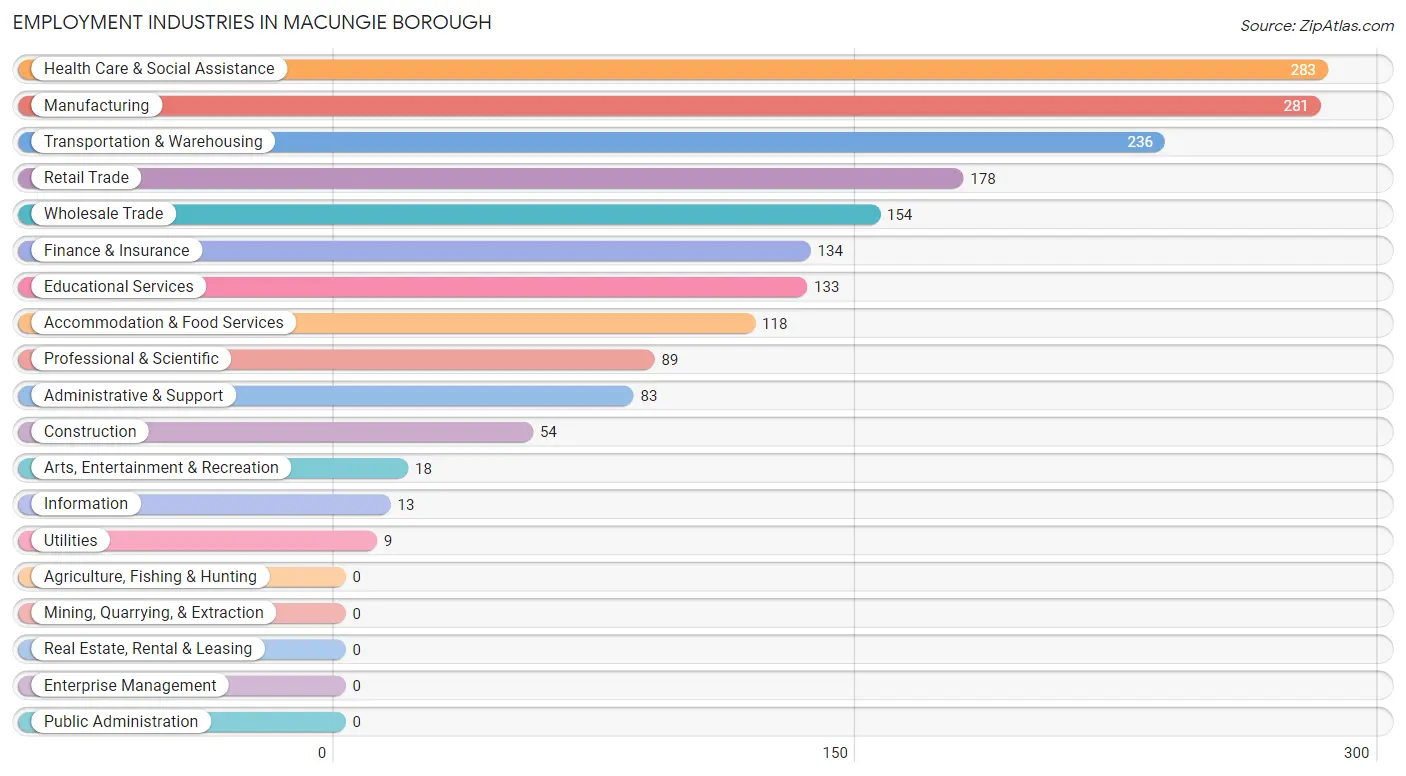
Employment Industries in Macungie borough
The major employment industries in Macungie borough include Health Care & Social Assistance (283 | 15.1%), Manufacturing (281 | 15.0%), Transportation & Warehousing (236 | 12.6%), Retail Trade (178 | 9.5%), and Wholesale Trade (154 | 8.2%).
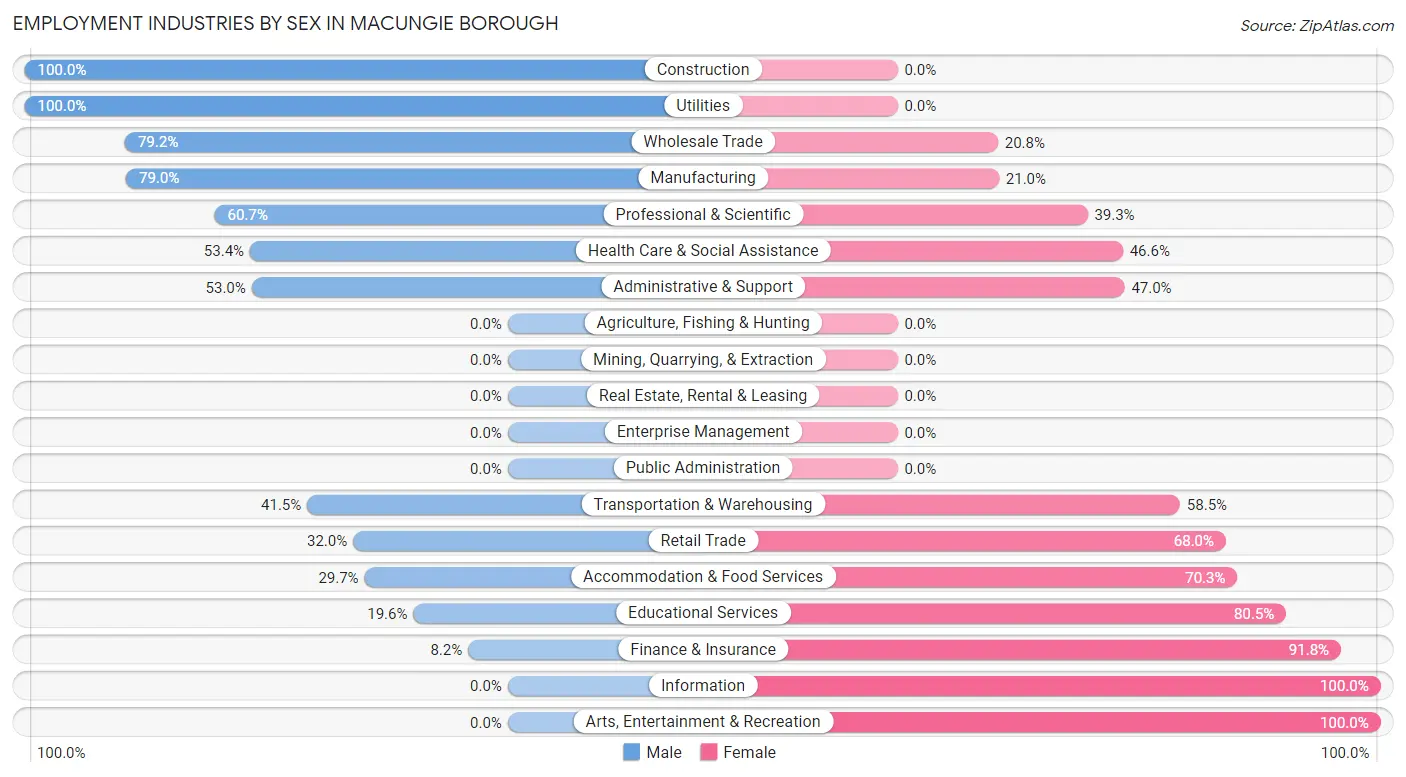
Employment Industries by Sex in Macungie borough
The Macungie borough industries that see more men than women are Construction (100.0%), Utilities (100.0%), and Wholesale Trade (79.2%), whereas the industries that tend to have a higher number of women are Information (100.0%), Arts, Entertainment & Recreation (100.0%), and Finance & Insurance (91.8%).
| Industry | Male | Female |
| Agriculture, Fishing & Hunting | 0 (0.0%) | 0 (0.0%) |
| Mining, Quarrying, & Extraction | 0 (0.0%) | 0 (0.0%) |
| Construction | 54 (100.0%) | 0 (0.0%) |
| Manufacturing | 222 (79.0%) | 59 (21.0%) |
| Wholesale Trade | 122 (79.2%) | 32 (20.8%) |
| Retail Trade | 57 (32.0%) | 121 (68.0%) |
| Transportation & Warehousing | 98 (41.5%) | 138 (58.5%) |
| Utilities | 9 (100.0%) | 0 (0.0%) |
| Information | 0 (0.0%) | 13 (100.0%) |
| Finance & Insurance | 11 (8.2%) | 123 (91.8%) |
| Real Estate, Rental & Leasing | 0 (0.0%) | 0 (0.0%) |
| Professional & Scientific | 54 (60.7%) | 35 (39.3%) |
| Enterprise Management | 0 (0.0%) | 0 (0.0%) |
| Administrative & Support | 44 (53.0%) | 39 (47.0%) |
| Educational Services | 26 (19.6%) | 107 (80.4%) |
| Health Care & Social Assistance | 151 (53.4%) | 132 (46.6%) |
| Arts, Entertainment & Recreation | 0 (0.0%) | 18 (100.0%) |
| Accommodation & Food Services | 35 (29.7%) | 83 (70.3%) |
| Public Administration | 0 (0.0%) | 0 (0.0%) |
| Total | 934 (49.9%) | 938 (50.1%) |
Education in Macungie borough
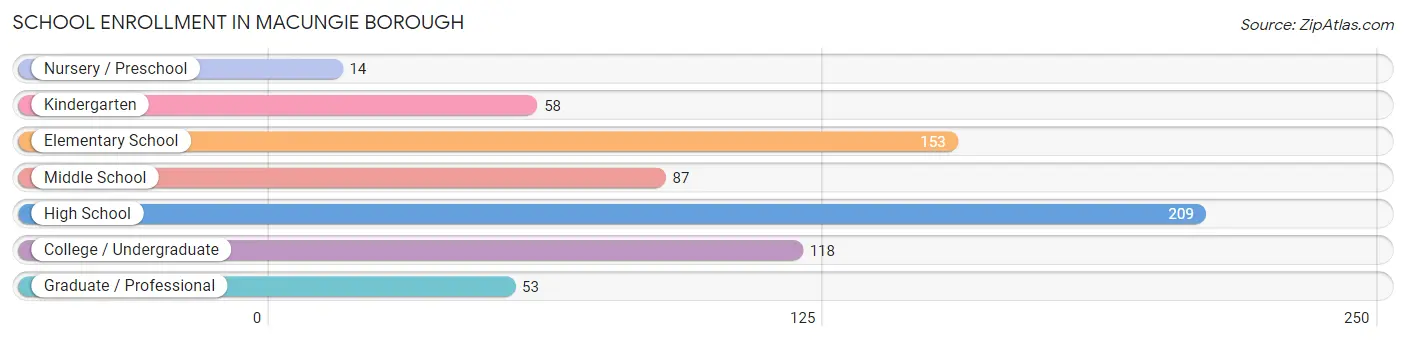
School Enrollment in Macungie borough
The most common levels of schooling among the 692 students in Macungie borough are high school (209 | 30.2%), elementary school (153 | 22.1%), and college / undergraduate (118 | 17.1%).
| School Level | # Students | % Students |
| Nursery / Preschool | 14 | 2.0% |
| Kindergarten | 58 | 8.4% |
| Elementary School | 153 | 22.1% |
| Middle School | 87 | 12.6% |
| High School | 209 | 30.2% |
| College / Undergraduate | 118 | 17.1% |
| Graduate / Professional | 53 | 7.7% |
| Total | 692 | 100.0% |
School Enrollment by Age by Funding Source in Macungie borough
Out of a total of 692 students who are enrolled in schools in Macungie borough, 95 (13.7%) attend a private institution, while the remaining 597 (86.3%) are enrolled in public schools. The age group of 35 years and over has the highest likelihood of being enrolled in private schools, with 13 (48.1% in the age bracket) enrolled. Conversely, the age group of 3 to 4 year olds has the lowest likelihood of being enrolled in a private school, with 14 (100.0% in the age bracket) attending a public institution.
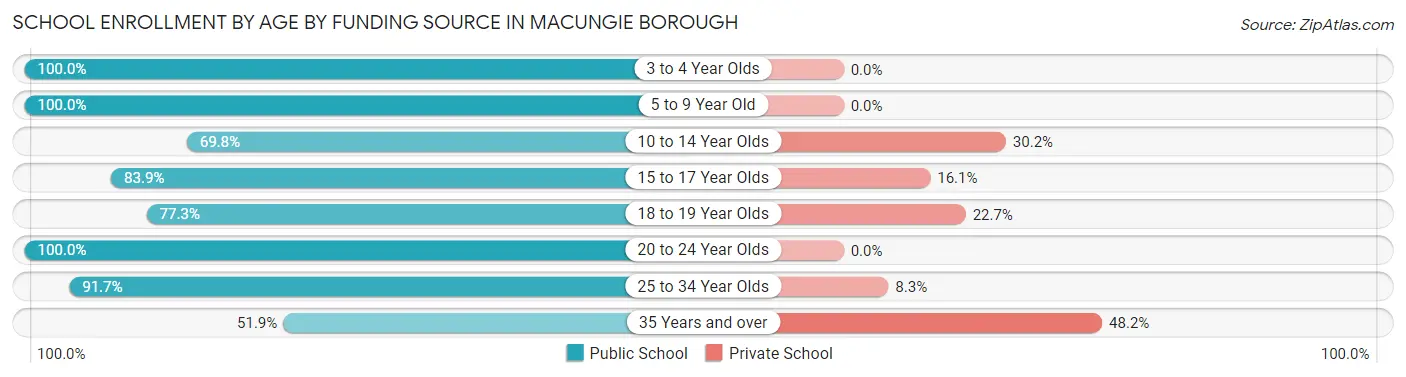
| Age Bracket | Public School | Private School |
| 3 to 4 Year Olds | 14 (100.0%) | 0 (0.0%) |
| 5 to 9 Year Old | 201 (100.0%) | 0 (0.0%) |
| 10 to 14 Year Olds | 97 (69.8%) | 42 (30.2%) |
| 15 to 17 Year Olds | 130 (83.9%) | 25 (16.1%) |
| 18 to 19 Year Olds | 34 (77.3%) | 10 (22.7%) |
| 20 to 24 Year Olds | 52 (100.0%) | 0 (0.0%) |
| 25 to 34 Year Olds | 55 (91.7%) | 5 (8.3%) |
| 35 Years and over | 14 (51.8%) | 13 (48.1%) |
| Total | 597 (86.3%) | 95 (13.7%) |
Educational Attainment by Field of Study in Macungie borough
Business (238 | 30.9%), education (121 | 15.7%), science & technology (97 | 12.6%), psychology (57 | 7.4%), and bio, nature & agricultural (51 | 6.6%) are the most common fields of study among 771 individuals in Macungie borough who have obtained a bachelor's degree or higher.
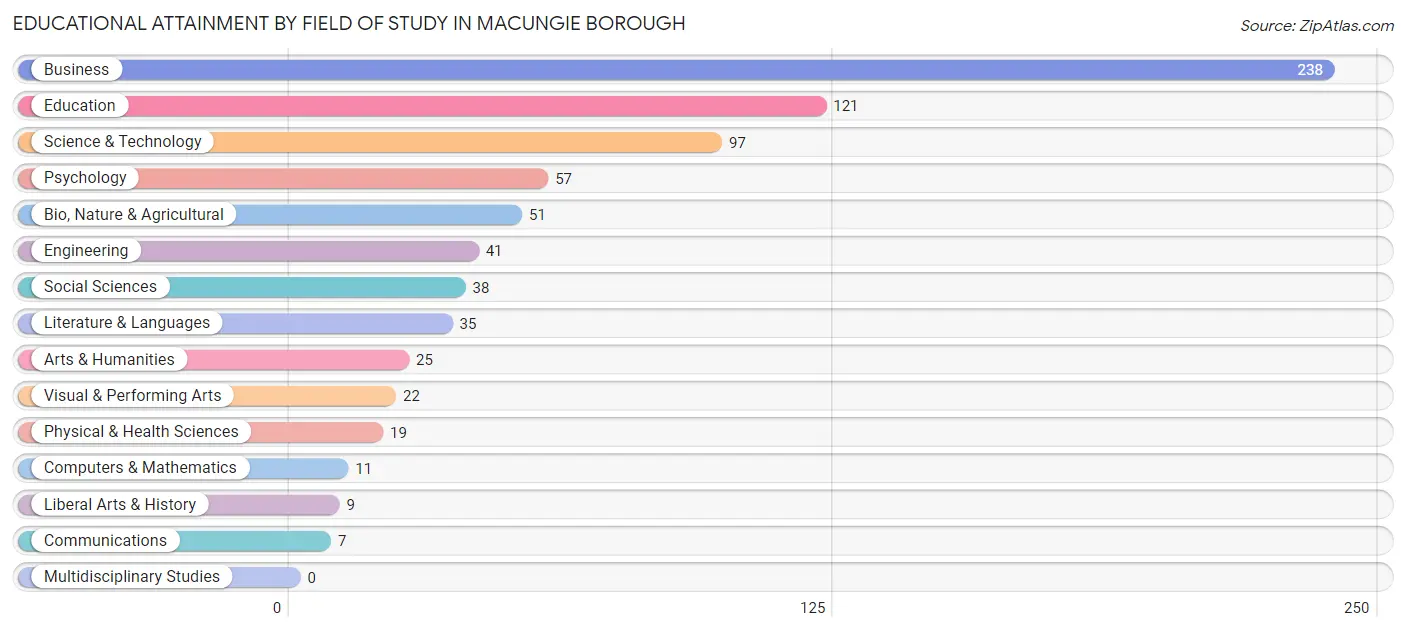
| Field of Study | # Graduates | % Graduates |
| Computers & Mathematics | 11 | 1.4% |
| Bio, Nature & Agricultural | 51 | 6.6% |
| Physical & Health Sciences | 19 | 2.5% |
| Psychology | 57 | 7.4% |
| Social Sciences | 38 | 4.9% |
| Engineering | 41 | 5.3% |
| Multidisciplinary Studies | 0 | 0.0% |
| Science & Technology | 97 | 12.6% |
| Business | 238 | 30.9% |
| Education | 121 | 15.7% |
| Literature & Languages | 35 | 4.5% |
| Liberal Arts & History | 9 | 1.2% |
| Visual & Performing Arts | 22 | 2.9% |
| Communications | 7 | 0.9% |
| Arts & Humanities | 25 | 3.2% |
| Total | 771 | 100.0% |
Transportation & Commute in Macungie borough
Vehicle Availability by Sex in Macungie borough
The most prevalent vehicle ownership categories in Macungie borough are males with 2 vehicles (376, accounting for 41.5%) and females with 2 vehicles (305, making up 40.5%).
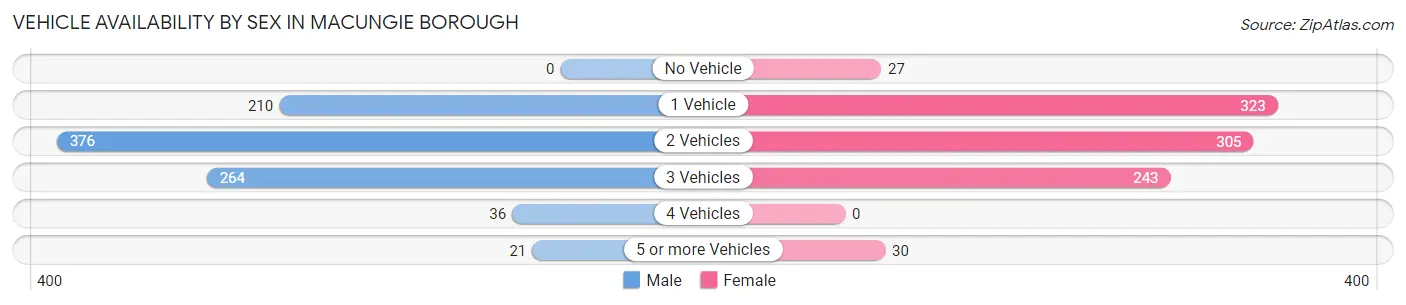
| Vehicles Available | Male | Female |
| No Vehicle | 0 (0.0%) | 27 (2.9%) |
| 1 Vehicle | 210 (23.2%) | 323 (34.8%) |
| 2 Vehicles | 376 (41.5%) | 305 (32.9%) |
| 3 Vehicles | 264 (29.1%) | 243 (26.2%) |
| 4 Vehicles | 36 (4.0%) | 0 (0.0%) |
| 5 or more Vehicles | 21 (2.3%) | 30 (3.2%) |
| Total | 907 (100.0%) | 928 (100.0%) |
Commute Time in Macungie borough
The most frequently occuring commute durations in Macungie borough are 20 to 24 minutes (350 commuters, 19.9%), 10 to 14 minutes (327 commuters, 18.6%), and 15 to 19 minutes (263 commuters, 14.9%).
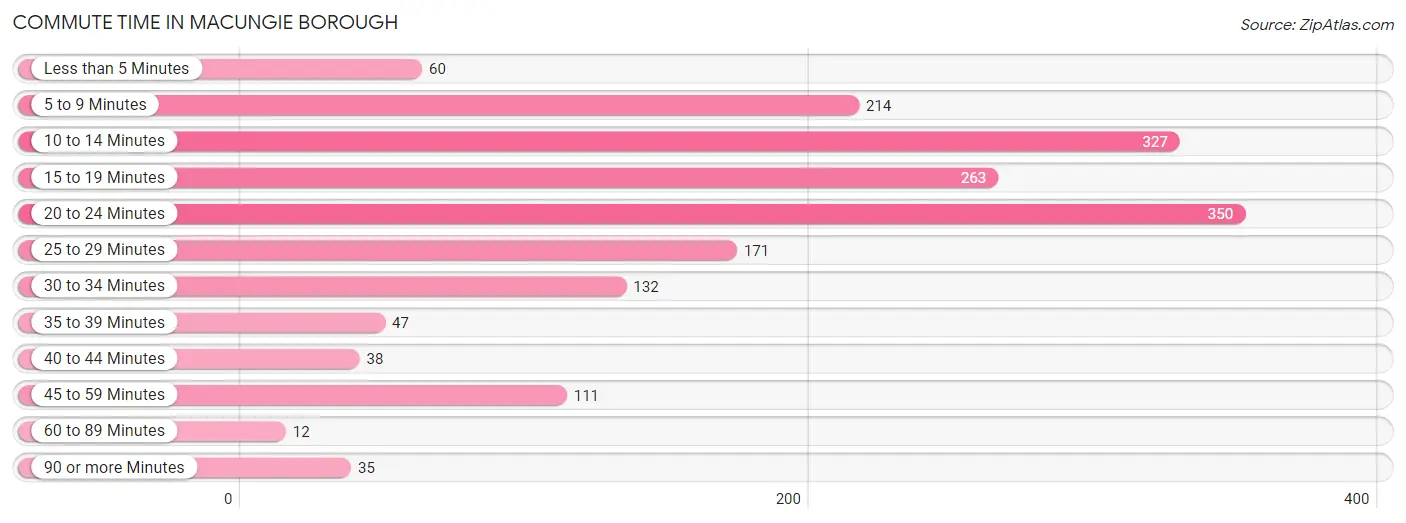
| Commute Time | # Commuters | % Commuters |
| Less than 5 Minutes | 60 | 3.4% |
| 5 to 9 Minutes | 214 | 12.2% |
| 10 to 14 Minutes | 327 | 18.6% |
| 15 to 19 Minutes | 263 | 14.9% |
| 20 to 24 Minutes | 350 | 19.9% |
| 25 to 29 Minutes | 171 | 9.7% |
| 30 to 34 Minutes | 132 | 7.5% |
| 35 to 39 Minutes | 47 | 2.7% |
| 40 to 44 Minutes | 38 | 2.2% |
| 45 to 59 Minutes | 111 | 6.3% |
| 60 to 89 Minutes | 12 | 0.7% |
| 90 or more Minutes | 35 | 2.0% |
Commute Time by Sex in Macungie borough
The most common commute times in Macungie borough are 10 to 14 minutes (177 commuters, 19.9%) for males and 20 to 24 minutes (258 commuters, 29.7%) for females.
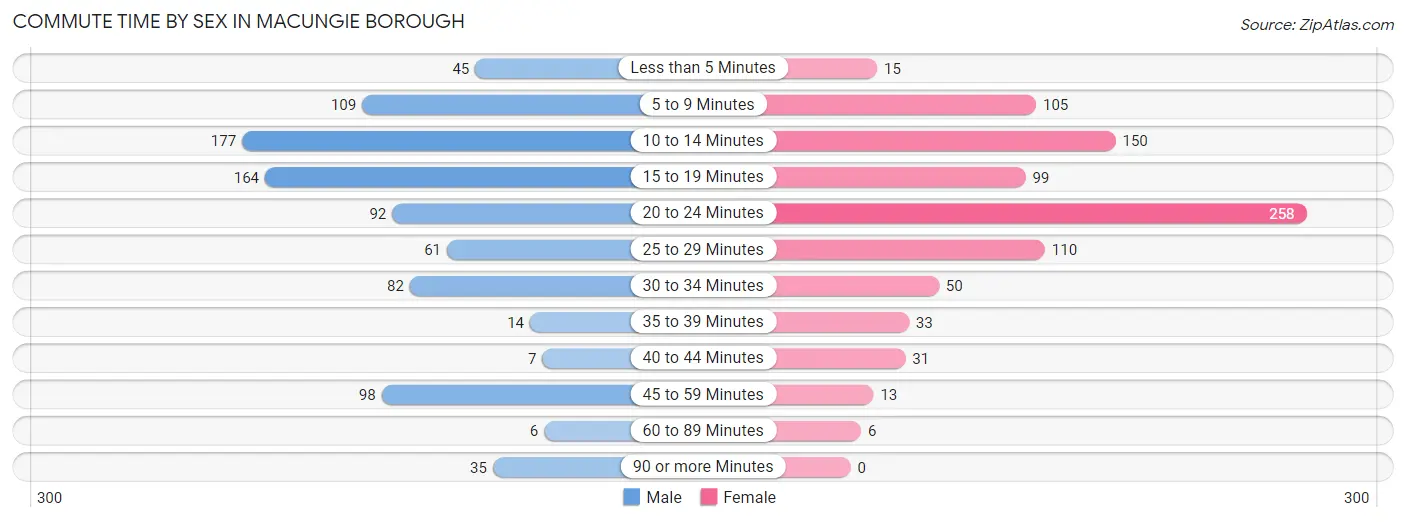
| Commute Time | Male | Female |
| Less than 5 Minutes | 45 (5.1%) | 15 (1.7%) |
| 5 to 9 Minutes | 109 (12.2%) | 105 (12.1%) |
| 10 to 14 Minutes | 177 (19.9%) | 150 (17.2%) |
| 15 to 19 Minutes | 164 (18.4%) | 99 (11.4%) |
| 20 to 24 Minutes | 92 (10.3%) | 258 (29.7%) |
| 25 to 29 Minutes | 61 (6.9%) | 110 (12.6%) |
| 30 to 34 Minutes | 82 (9.2%) | 50 (5.8%) |
| 35 to 39 Minutes | 14 (1.6%) | 33 (3.8%) |
| 40 to 44 Minutes | 7 (0.8%) | 31 (3.6%) |
| 45 to 59 Minutes | 98 (11.0%) | 13 (1.5%) |
| 60 to 89 Minutes | 6 (0.7%) | 6 (0.7%) |
| 90 or more Minutes | 35 (3.9%) | 0 (0.0%) |
Time of Departure to Work by Sex in Macungie borough
The most frequent times of departure to work in Macungie borough are 7:30 AM to 7:59 AM (192, 21.6%) for males and 7:30 AM to 7:59 AM (240, 27.6%) for females.
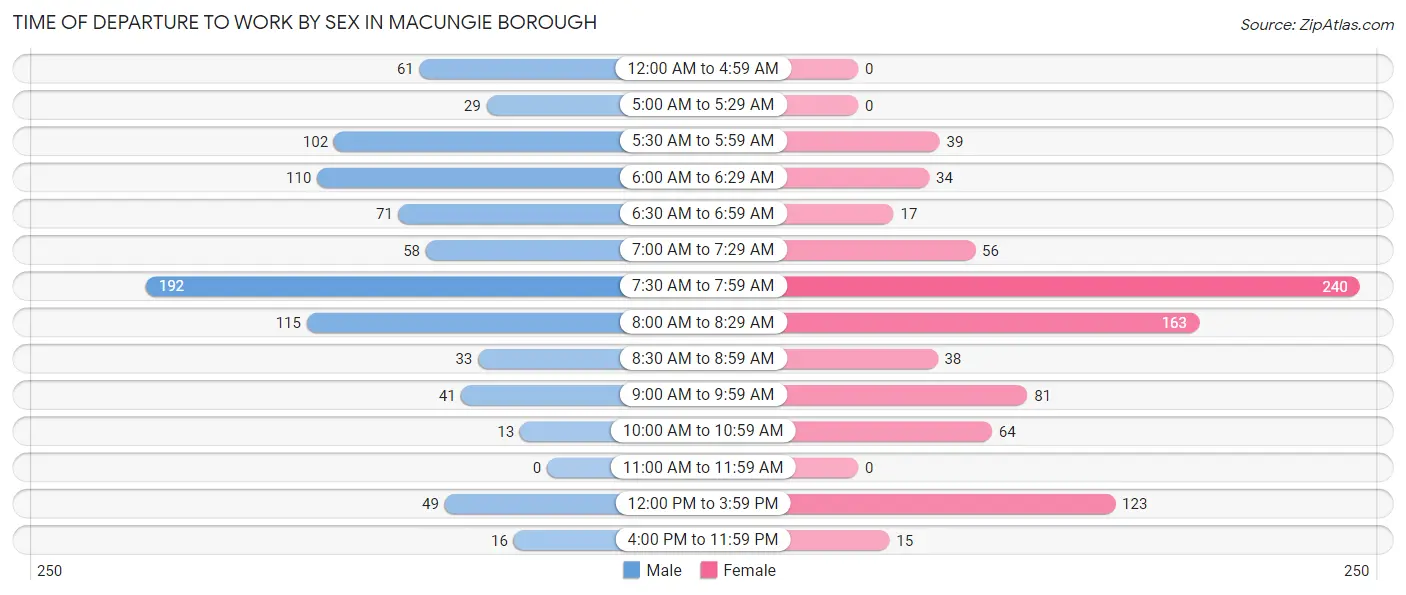
| Time of Departure | Male | Female |
| 12:00 AM to 4:59 AM | 61 (6.9%) | 0 (0.0%) |
| 5:00 AM to 5:29 AM | 29 (3.3%) | 0 (0.0%) |
| 5:30 AM to 5:59 AM | 102 (11.5%) | 39 (4.5%) |
| 6:00 AM to 6:29 AM | 110 (12.4%) | 34 (3.9%) |
| 6:30 AM to 6:59 AM | 71 (8.0%) | 17 (1.9%) |
| 7:00 AM to 7:29 AM | 58 (6.5%) | 56 (6.4%) |
| 7:30 AM to 7:59 AM | 192 (21.6%) | 240 (27.6%) |
| 8:00 AM to 8:29 AM | 115 (12.9%) | 163 (18.7%) |
| 8:30 AM to 8:59 AM | 33 (3.7%) | 38 (4.4%) |
| 9:00 AM to 9:59 AM | 41 (4.6%) | 81 (9.3%) |
| 10:00 AM to 10:59 AM | 13 (1.5%) | 64 (7.4%) |
| 11:00 AM to 11:59 AM | 0 (0.0%) | 0 (0.0%) |
| 12:00 PM to 3:59 PM | 49 (5.5%) | 123 (14.1%) |
| 4:00 PM to 11:59 PM | 16 (1.8%) | 15 (1.7%) |
| Total | 890 (100.0%) | 870 (100.0%) |
Housing Occupancy in Macungie borough
Occupancy by Ownership in Macungie borough
Of the total 1,448 dwellings in Macungie borough, owner-occupied units account for 635 (43.9%), while renter-occupied units make up 813 (56.1%).
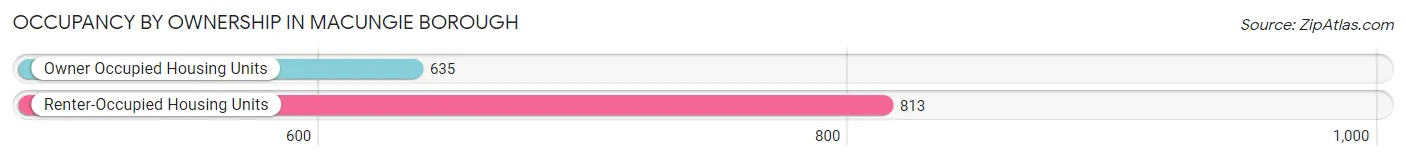
| Occupancy | # Housing Units | % Housing Units |
| Owner Occupied Housing Units | 635 | 43.9% |
| Renter-Occupied Housing Units | 813 | 56.1% |
| Total Occupied Housing Units | 1,448 | 100.0% |
Occupancy by Household Size in Macungie borough
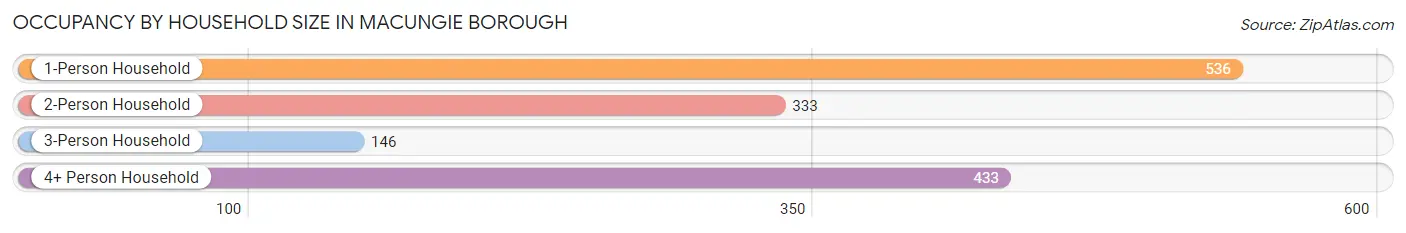
| Household Size | # Housing Units | % Housing Units |
| 1-Person Household | 536 | 37.0% |
| 2-Person Household | 333 | 23.0% |
| 3-Person Household | 146 | 10.1% |
| 4+ Person Household | 433 | 29.9% |
| Total Housing Units | 1,448 | 100.0% |
Occupancy by Ownership by Household Size in Macungie borough
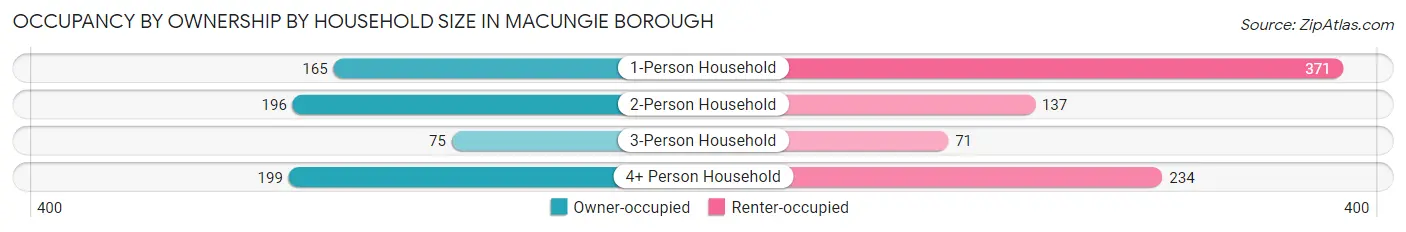
| Household Size | Owner-occupied | Renter-occupied |
| 1-Person Household | 165 (30.8%) | 371 (69.2%) |
| 2-Person Household | 196 (58.9%) | 137 (41.1%) |
| 3-Person Household | 75 (51.4%) | 71 (48.6%) |
| 4+ Person Household | 199 (46.0%) | 234 (54.0%) |
| Total Housing Units | 635 (43.9%) | 813 (56.1%) |
Occupancy by Educational Attainment in Macungie borough
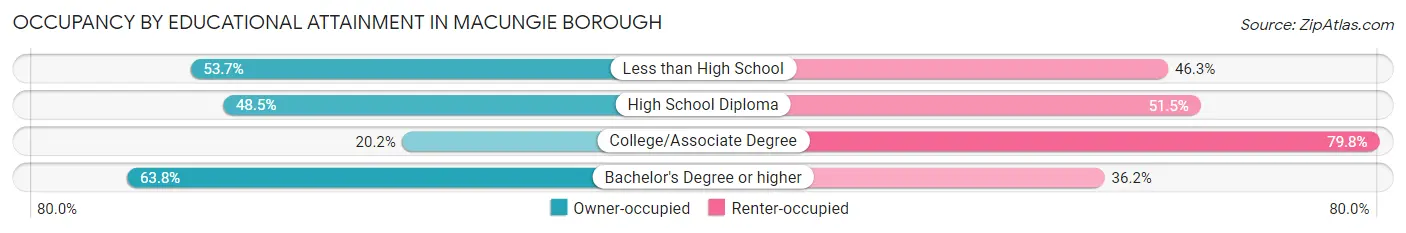
| Household Size | Owner-occupied | Renter-occupied |
| Less than High School | 29 (53.7%) | 25 (46.3%) |
| High School Diploma | 214 (48.5%) | 227 (51.5%) |
| College/Associate Degree | 100 (20.2%) | 395 (79.8%) |
| Bachelor's Degree or higher | 292 (63.8%) | 166 (36.2%) |
Occupancy by Age of Householder in Macungie borough
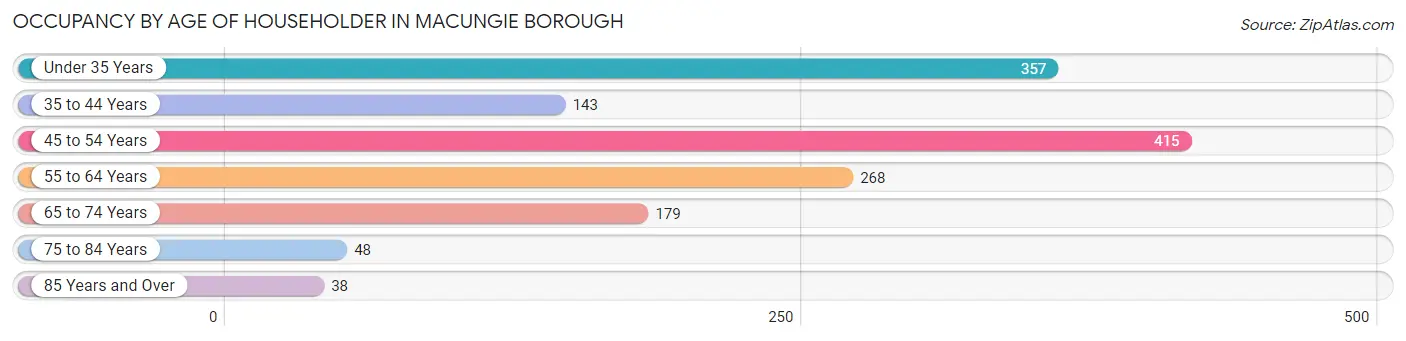
| Age Bracket | # Households | % Households |
| Under 35 Years | 357 | 24.6% |
| 35 to 44 Years | 143 | 9.9% |
| 45 to 54 Years | 415 | 28.7% |
| 55 to 64 Years | 268 | 18.5% |
| 65 to 74 Years | 179 | 12.4% |
| 75 to 84 Years | 48 | 3.3% |
| 85 Years and Over | 38 | 2.6% |
| Total | 1,448 | 100.0% |
Housing Finances in Macungie borough
Median Income by Occupancy in Macungie borough
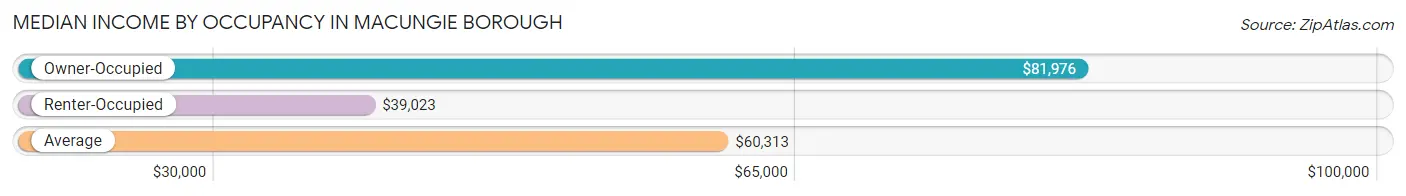
| Occupancy Type | # Households | Median Income |
| Owner-Occupied | 635 (43.9%) | $81,976 |
| Renter-Occupied | 813 (56.1%) | $39,023 |
| Average | 1,448 (100.0%) | $60,313 |
Occupancy by Householder Income Bracket in Macungie borough
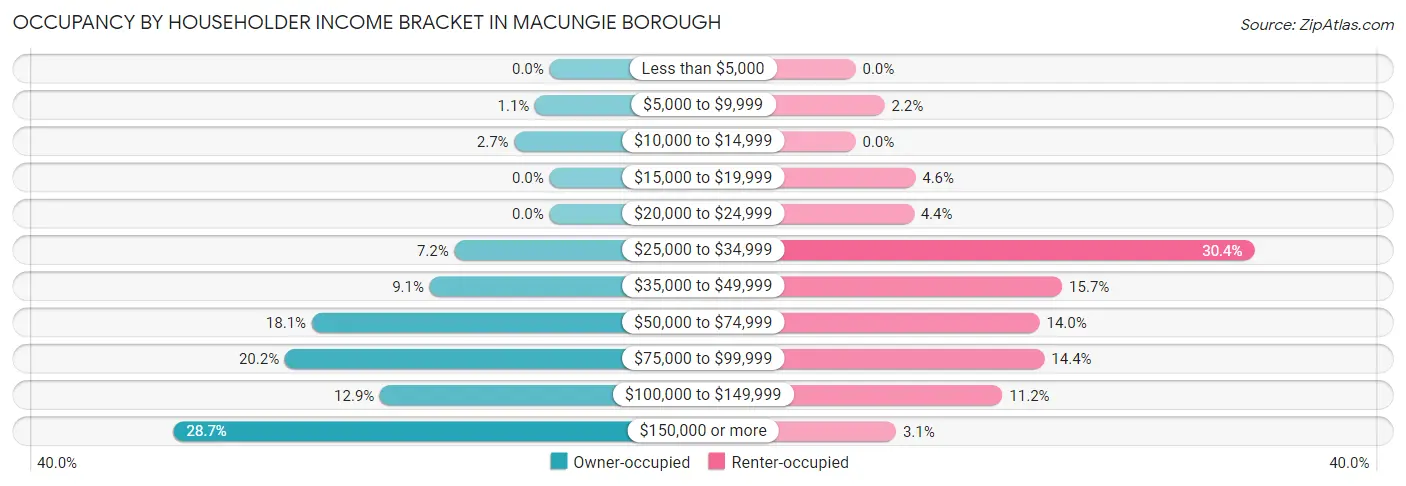
| Income Bracket | Owner-occupied | Renter-occupied |
| Less than $5,000 | 0 (0.0%) | 0 (0.0%) |
| $5,000 to $9,999 | 7 (1.1%) | 18 (2.2%) |
| $10,000 to $14,999 | 17 (2.7%) | 0 (0.0%) |
| $15,000 to $19,999 | 0 (0.0%) | 37 (4.5%) |
| $20,000 to $24,999 | 0 (0.0%) | 36 (4.4%) |
| $25,000 to $34,999 | 46 (7.2%) | 247 (30.4%) |
| $35,000 to $49,999 | 58 (9.1%) | 128 (15.7%) |
| $50,000 to $74,999 | 115 (18.1%) | 114 (14.0%) |
| $75,000 to $99,999 | 128 (20.2%) | 117 (14.4%) |
| $100,000 to $149,999 | 82 (12.9%) | 91 (11.2%) |
| $150,000 or more | 182 (28.7%) | 25 (3.1%) |
| Total | 635 (100.0%) | 813 (100.0%) |
Monthly Housing Cost Tiers in Macungie borough
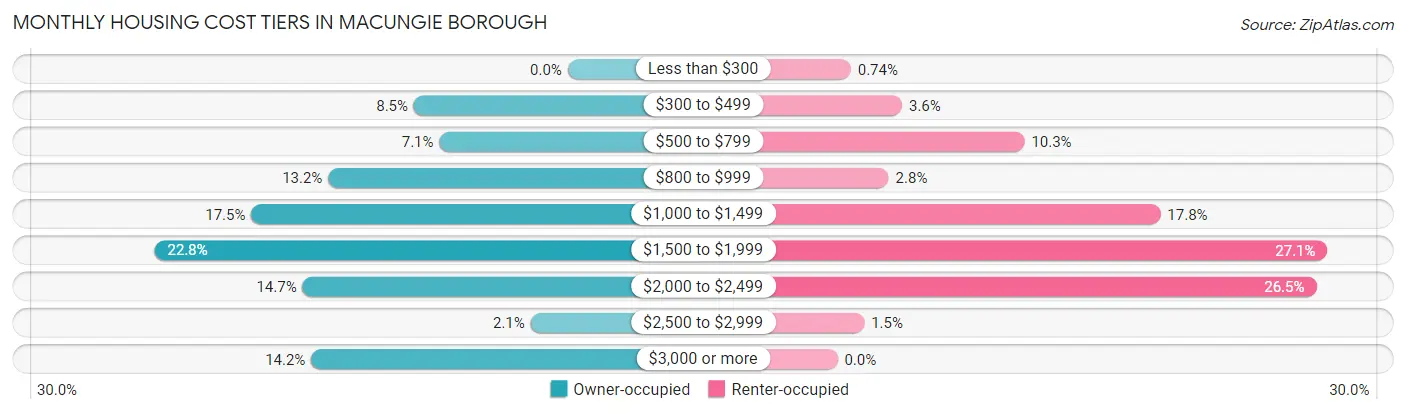
| Monthly Cost | Owner-occupied | Renter-occupied |
| Less than $300 | 0 (0.0%) | 6 (0.7%) |
| $300 to $499 | 54 (8.5%) | 29 (3.6%) |
| $500 to $799 | 45 (7.1%) | 84 (10.3%) |
| $800 to $999 | 84 (13.2%) | 23 (2.8%) |
| $1,000 to $1,499 | 111 (17.5%) | 145 (17.8%) |
| $1,500 to $1,999 | 145 (22.8%) | 220 (27.1%) |
| $2,000 to $2,499 | 93 (14.6%) | 215 (26.5%) |
| $2,500 to $2,999 | 13 (2.1%) | 12 (1.5%) |
| $3,000 or more | 90 (14.2%) | 0 (0.0%) |
| Total | 635 (100.0%) | 813 (100.0%) |
Physical Housing Characteristics in Macungie borough
Housing Structures in Macungie borough
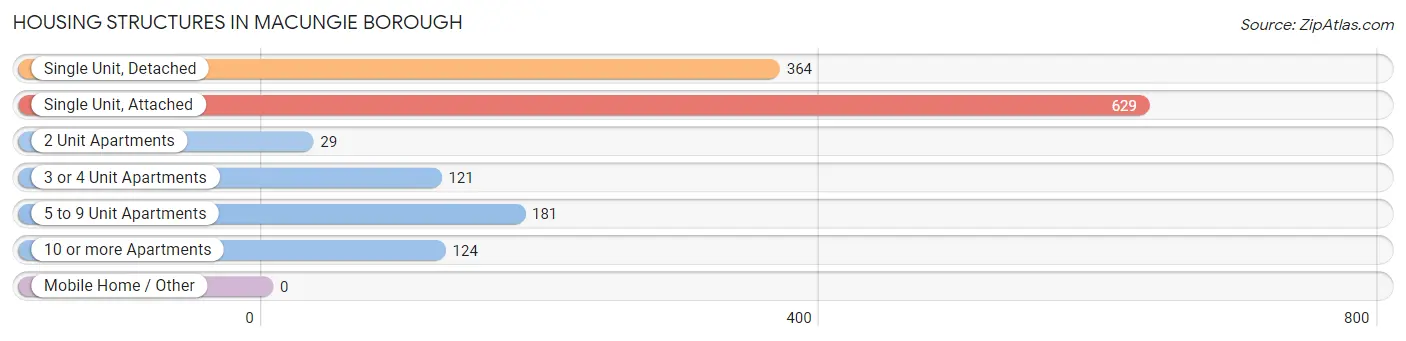
| Structure Type | # Housing Units | % Housing Units |
| Single Unit, Detached | 364 | 25.1% |
| Single Unit, Attached | 629 | 43.4% |
| 2 Unit Apartments | 29 | 2.0% |
| 3 or 4 Unit Apartments | 121 | 8.4% |
| 5 to 9 Unit Apartments | 181 | 12.5% |
| 10 or more Apartments | 124 | 8.6% |
| Mobile Home / Other | 0 | 0.0% |
| Total | 1,448 | 100.0% |
Housing Structures by Occupancy in Macungie borough
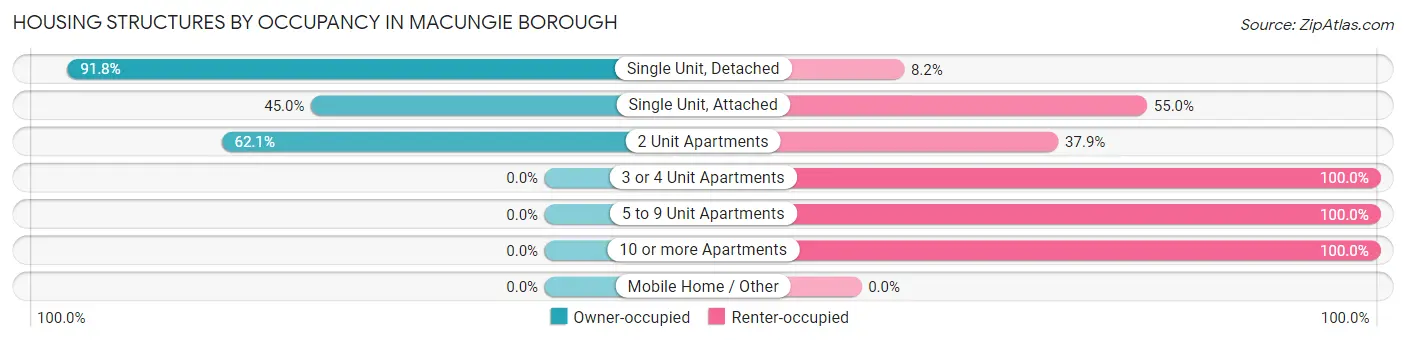
| Structure Type | Owner-occupied | Renter-occupied |
| Single Unit, Detached | 334 (91.8%) | 30 (8.2%) |
| Single Unit, Attached | 283 (45.0%) | 346 (55.0%) |
| 2 Unit Apartments | 18 (62.1%) | 11 (37.9%) |
| 3 or 4 Unit Apartments | 0 (0.0%) | 121 (100.0%) |
| 5 to 9 Unit Apartments | 0 (0.0%) | 181 (100.0%) |
| 10 or more Apartments | 0 (0.0%) | 124 (100.0%) |
| Mobile Home / Other | 0 (0.0%) | 0 (0.0%) |
| Total | 635 (43.9%) | 813 (56.1%) |
Housing Structures by Number of Rooms in Macungie borough
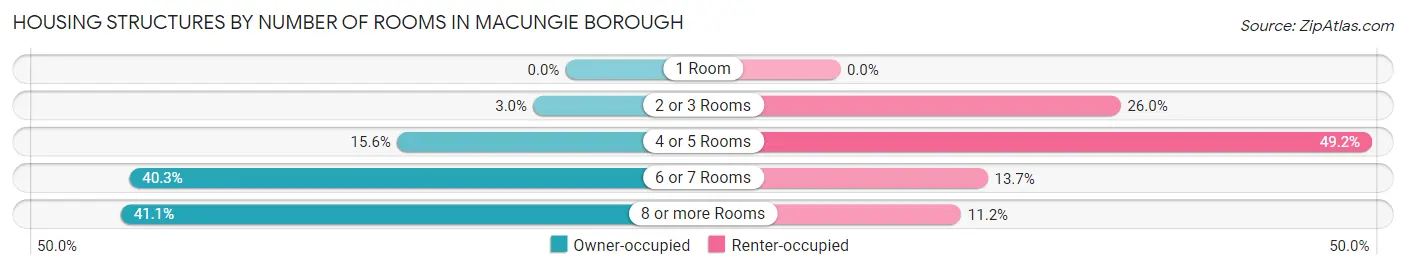
| Number of Rooms | Owner-occupied | Renter-occupied |
| 1 Room | 0 (0.0%) | 0 (0.0%) |
| 2 or 3 Rooms | 19 (3.0%) | 211 (26.0%) |
| 4 or 5 Rooms | 99 (15.6%) | 400 (49.2%) |
| 6 or 7 Rooms | 256 (40.3%) | 111 (13.7%) |
| 8 or more Rooms | 261 (41.1%) | 91 (11.2%) |
| Total | 635 (100.0%) | 813 (100.0%) |
Housing Structure by Heating Type in Macungie borough
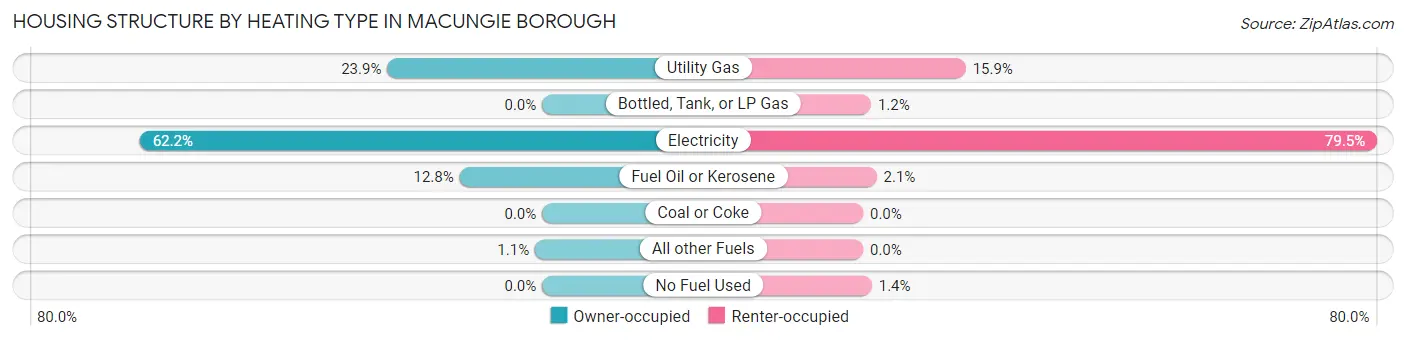
| Heating Type | Owner-occupied | Renter-occupied |
| Utility Gas | 152 (23.9%) | 129 (15.9%) |
| Bottled, Tank, or LP Gas | 0 (0.0%) | 10 (1.2%) |
| Electricity | 395 (62.2%) | 646 (79.5%) |
| Fuel Oil or Kerosene | 81 (12.8%) | 17 (2.1%) |
| Coal or Coke | 0 (0.0%) | 0 (0.0%) |
| All other Fuels | 7 (1.1%) | 0 (0.0%) |
| No Fuel Used | 0 (0.0%) | 11 (1.3%) |
| Total | 635 (100.0%) | 813 (100.0%) |
Household Vehicle Usage in Macungie borough
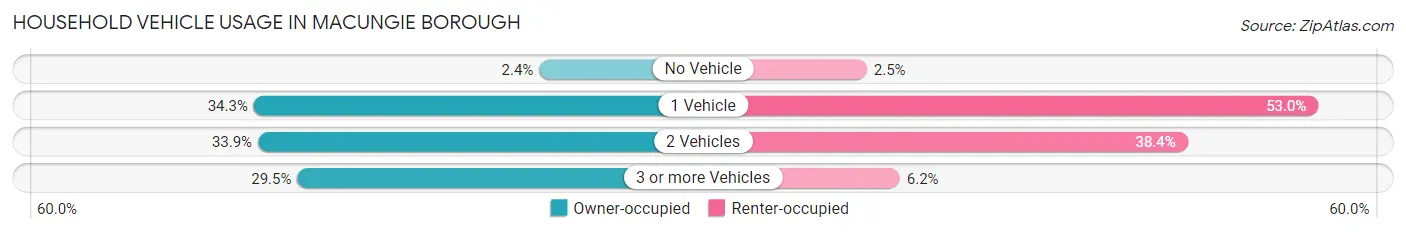
| Vehicles per Household | Owner-occupied | Renter-occupied |
| No Vehicle | 15 (2.4%) | 20 (2.5%) |
| 1 Vehicle | 218 (34.3%) | 431 (53.0%) |
| 2 Vehicles | 215 (33.9%) | 312 (38.4%) |
| 3 or more Vehicles | 187 (29.4%) | 50 (6.1%) |
| Total | 635 (100.0%) | 813 (100.0%) |
Real Estate & Mortgages in Macungie borough
Real Estate and Mortgage Overview in Macungie borough
| Characteristic | Without Mortgage | With Mortgage |
| Housing Units | 165 | 470 |
| Median Property Value | $210,200 | $247,500 |
| Median Household Income | $56,458 | $164 |
| Monthly Housing Costs | $786 | $90 |
| Real Estate Taxes | $3,794 | $0 |
Property Value by Mortgage Status in Macungie borough
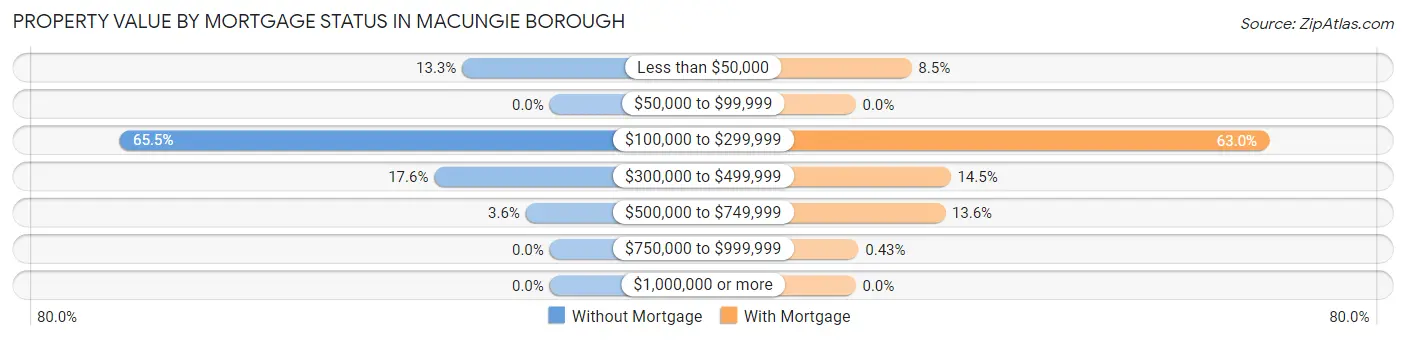
| Property Value | Without Mortgage | With Mortgage |
| Less than $50,000 | 22 (13.3%) | 40 (8.5%) |
| $50,000 to $99,999 | 0 (0.0%) | 0 (0.0%) |
| $100,000 to $299,999 | 108 (65.4%) | 296 (63.0%) |
| $300,000 to $499,999 | 29 (17.6%) | 68 (14.5%) |
| $500,000 to $749,999 | 6 (3.6%) | 64 (13.6%) |
| $750,000 to $999,999 | 0 (0.0%) | 2 (0.4%) |
| $1,000,000 or more | 0 (0.0%) | 0 (0.0%) |
| Total | 165 (100.0%) | 470 (100.0%) |
Household Income by Mortgage Status in Macungie borough
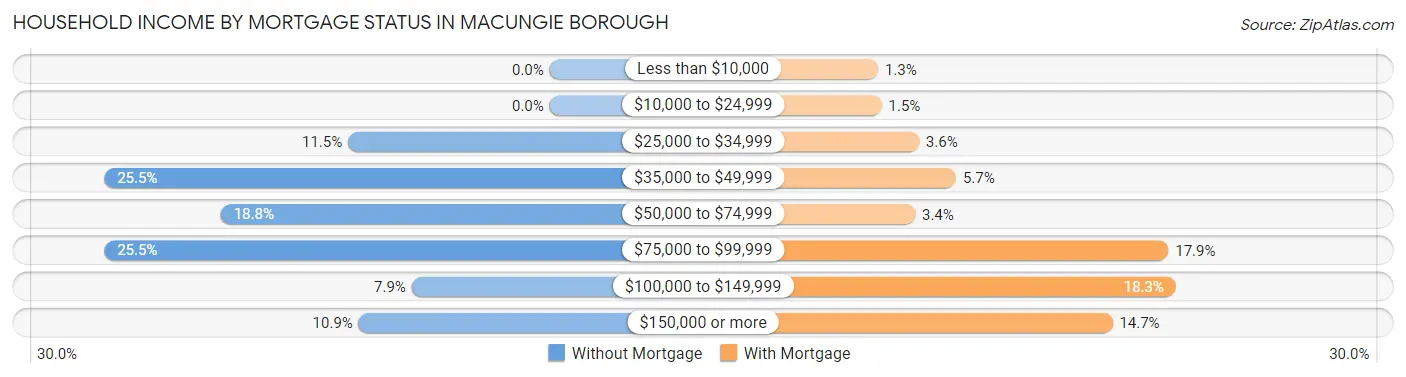
| Household Income | Without Mortgage | With Mortgage |
| Less than $10,000 | 0 (0.0%) | 6 (1.3%) |
| $10,000 to $24,999 | 0 (0.0%) | 7 (1.5%) |
| $25,000 to $34,999 | 19 (11.5%) | 17 (3.6%) |
| $35,000 to $49,999 | 42 (25.5%) | 27 (5.7%) |
| $50,000 to $74,999 | 31 (18.8%) | 16 (3.4%) |
| $75,000 to $99,999 | 42 (25.5%) | 84 (17.9%) |
| $100,000 to $149,999 | 13 (7.9%) | 86 (18.3%) |
| $150,000 or more | 18 (10.9%) | 69 (14.7%) |
| Total | 165 (100.0%) | 470 (100.0%) |
Property Value to Household Income Ratio in Macungie borough
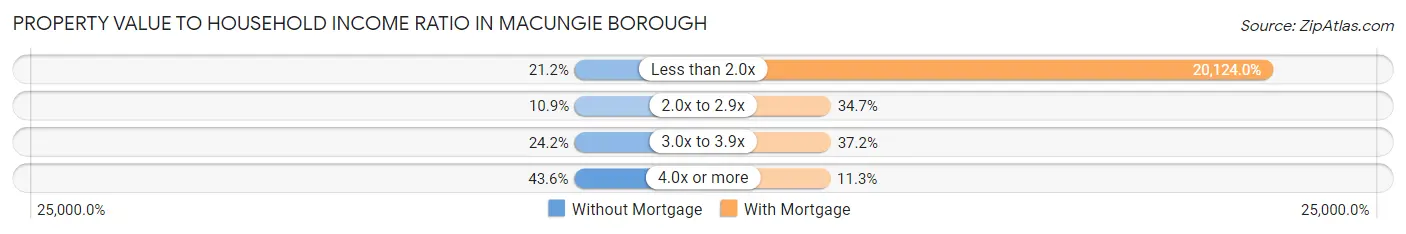
| Value-to-Income Ratio | Without Mortgage | With Mortgage |
| Less than 2.0x | 35 (21.2%) | 94,583 (20,124.0%) |
| 2.0x to 2.9x | 18 (10.9%) | 163 (34.7%) |
| 3.0x to 3.9x | 40 (24.2%) | 175 (37.2%) |
| 4.0x or more | 72 (43.6%) | 53 (11.3%) |
| Total | 165 (100.0%) | 470 (100.0%) |
Real Estate Taxes by Mortgage Status in Macungie borough
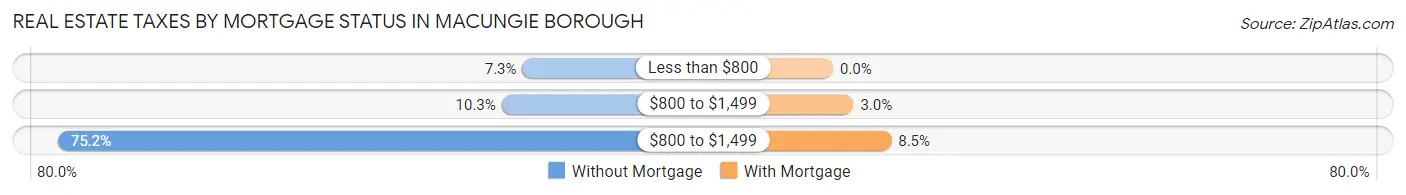
| Property Taxes | Without Mortgage | With Mortgage |
| Less than $800 | 12 (7.3%) | 0 (0.0%) |
| $800 to $1,499 | 17 (10.3%) | 14 (3.0%) |
| $800 to $1,499 | 124 (75.1%) | 40 (8.5%) |
| Total | 165 (100.0%) | 470 (100.0%) |
Health & Disability in Macungie borough
Health Insurance Coverage by Age in Macungie borough
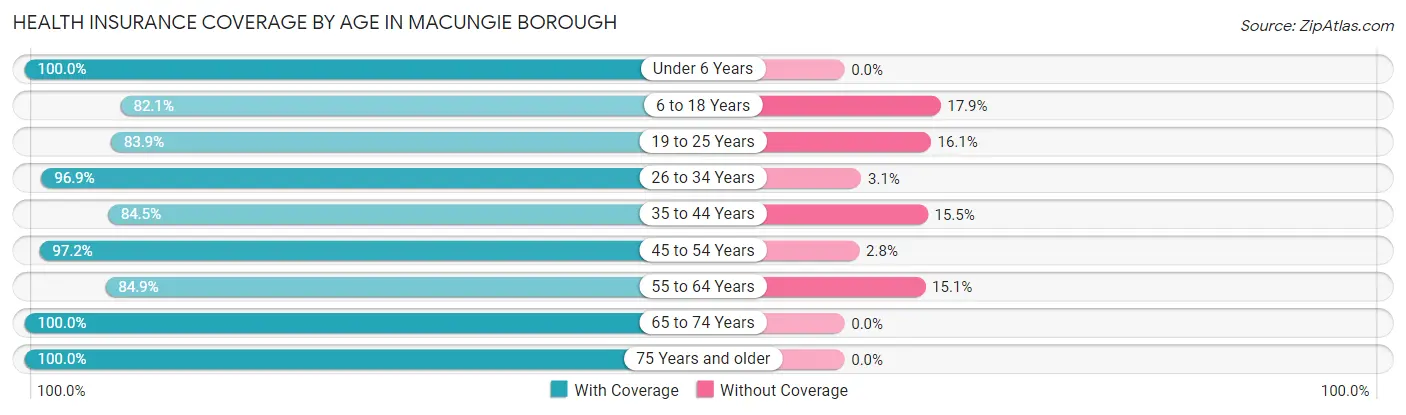
| Age Bracket | With Coverage | Without Coverage |
| Under 6 Years | 171 (100.0%) | 0 (0.0%) |
| 6 to 18 Years | 399 (82.1%) | 87 (17.9%) |
| 19 to 25 Years | 266 (83.9%) | 51 (16.1%) |
| 26 to 34 Years | 495 (96.9%) | 16 (3.1%) |
| 35 to 44 Years | 234 (84.5%) | 43 (15.5%) |
| 45 to 54 Years | 702 (97.2%) | 20 (2.8%) |
| 55 to 64 Years | 293 (84.9%) | 52 (15.1%) |
| 65 to 74 Years | 280 (100.0%) | 0 (0.0%) |
| 75 Years and older | 140 (100.0%) | 0 (0.0%) |
| Total | 2,980 (91.7%) | 269 (8.3%) |
Health Insurance Coverage by Citizenship Status in Macungie borough
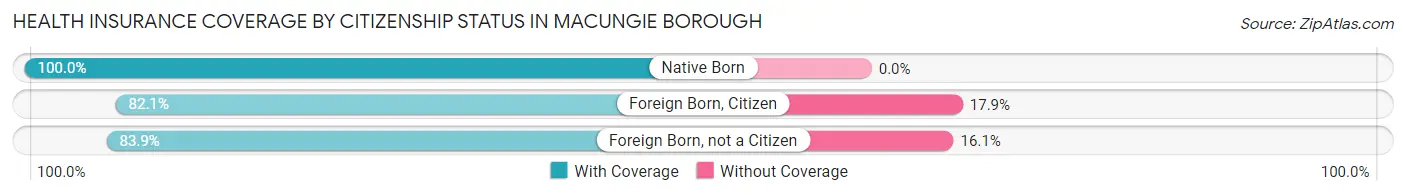
| Citizenship Status | With Coverage | Without Coverage |
| Native Born | 171 (100.0%) | 0 (0.0%) |
| Foreign Born, Citizen | 399 (82.1%) | 87 (17.9%) |
| Foreign Born, not a Citizen | 266 (83.9%) | 51 (16.1%) |
Health Insurance Coverage by Household Income in Macungie borough
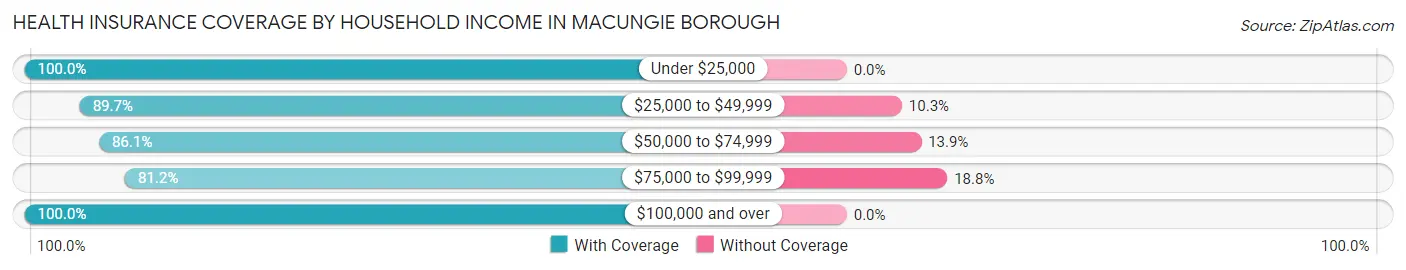
| Household Income | With Coverage | Without Coverage |
| Under $25,000 | 188 (100.0%) | 0 (0.0%) |
| $25,000 to $49,999 | 755 (89.7%) | 87 (10.3%) |
| $50,000 to $74,999 | 358 (86.1%) | 58 (13.9%) |
| $75,000 to $99,999 | 535 (81.2%) | 124 (18.8%) |
| $100,000 and over | 1,144 (100.0%) | 0 (0.0%) |
Public vs Private Health Insurance Coverage by Age in Macungie borough
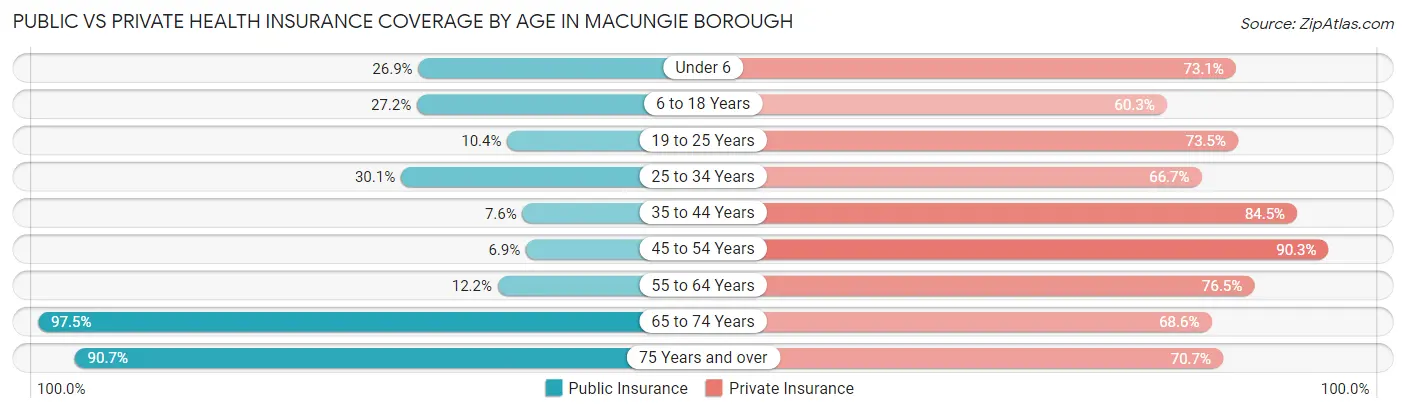
| Age Bracket | Public Insurance | Private Insurance |
| Under 6 | 46 (26.9%) | 125 (73.1%) |
| 6 to 18 Years | 132 (27.2%) | 293 (60.3%) |
| 19 to 25 Years | 33 (10.4%) | 233 (73.5%) |
| 25 to 34 Years | 154 (30.1%) | 341 (66.7%) |
| 35 to 44 Years | 21 (7.6%) | 234 (84.5%) |
| 45 to 54 Years | 50 (6.9%) | 652 (90.3%) |
| 55 to 64 Years | 42 (12.2%) | 264 (76.5%) |
| 65 to 74 Years | 273 (97.5%) | 192 (68.6%) |
| 75 Years and over | 127 (90.7%) | 99 (70.7%) |
| Total | 878 (27.0%) | 2,433 (74.9%) |
Disability Status by Sex by Age in Macungie borough
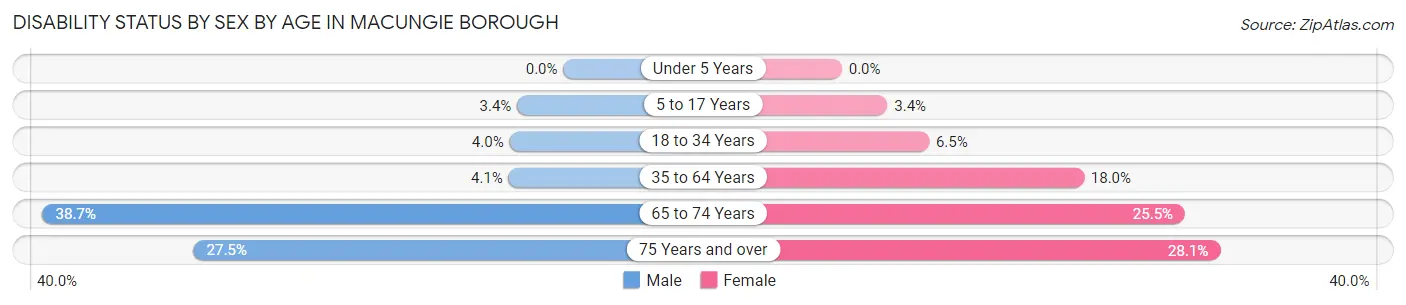
| Age Bracket | Male | Female |
| Under 5 Years | 0 (0.0%) | 0 (0.0%) |
| 5 to 17 Years | 11 (3.4%) | 7 (3.4%) |
| 18 to 34 Years | 18 (4.0%) | 27 (6.5%) |
| 35 to 64 Years | 29 (4.1%) | 113 (18.0%) |
| 65 to 74 Years | 46 (38.7%) | 41 (25.5%) |
| 75 Years and over | 14 (27.5%) | 25 (28.1%) |
Disability Class by Sex by Age in Macungie borough
Disability Class: Hearing Difficulty
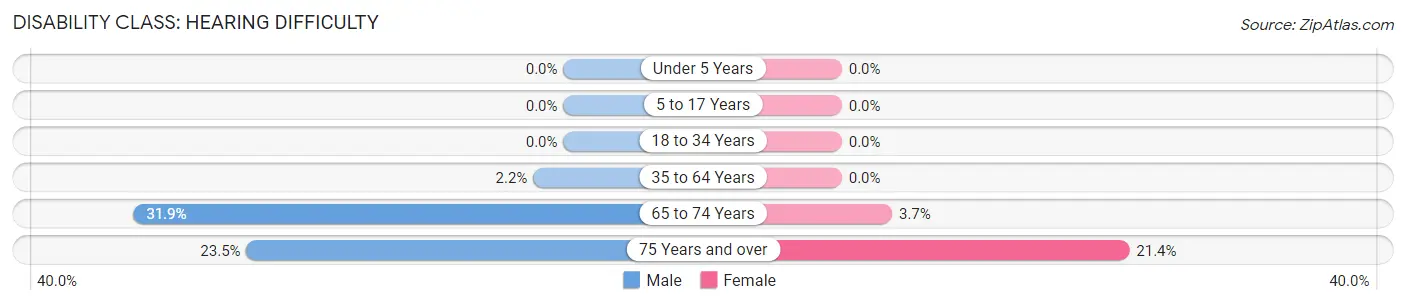
| Age Bracket | Male | Female |
| Under 5 Years | 0 (0.0%) | 0 (0.0%) |
| 5 to 17 Years | 0 (0.0%) | 0 (0.0%) |
| 18 to 34 Years | 0 (0.0%) | 0 (0.0%) |
| 35 to 64 Years | 16 (2.2%) | 0 (0.0%) |
| 65 to 74 Years | 38 (31.9%) | 6 (3.7%) |
| 75 Years and over | 12 (23.5%) | 19 (21.3%) |
Disability Class: Vision Difficulty
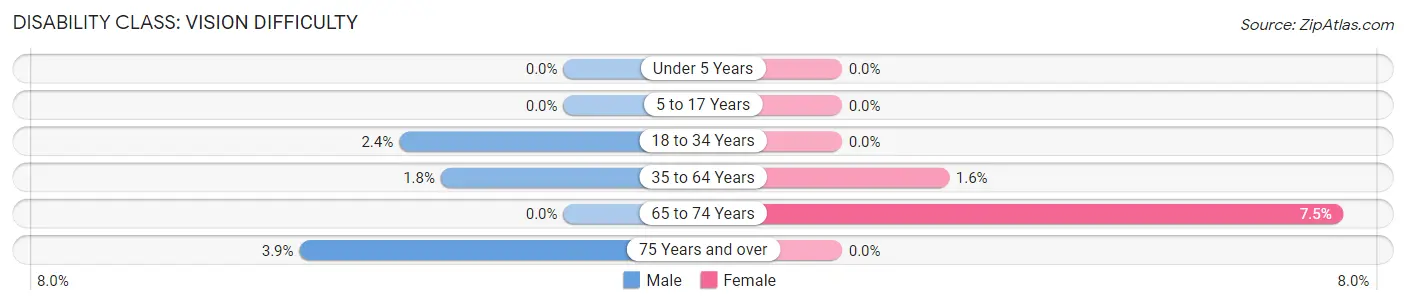
| Age Bracket | Male | Female |
| Under 5 Years | 0 (0.0%) | 0 (0.0%) |
| 5 to 17 Years | 0 (0.0%) | 0 (0.0%) |
| 18 to 34 Years | 11 (2.4%) | 0 (0.0%) |
| 35 to 64 Years | 13 (1.8%) | 10 (1.6%) |
| 65 to 74 Years | 0 (0.0%) | 12 (7.4%) |
| 75 Years and over | 2 (3.9%) | 0 (0.0%) |
Disability Class: Cognitive Difficulty
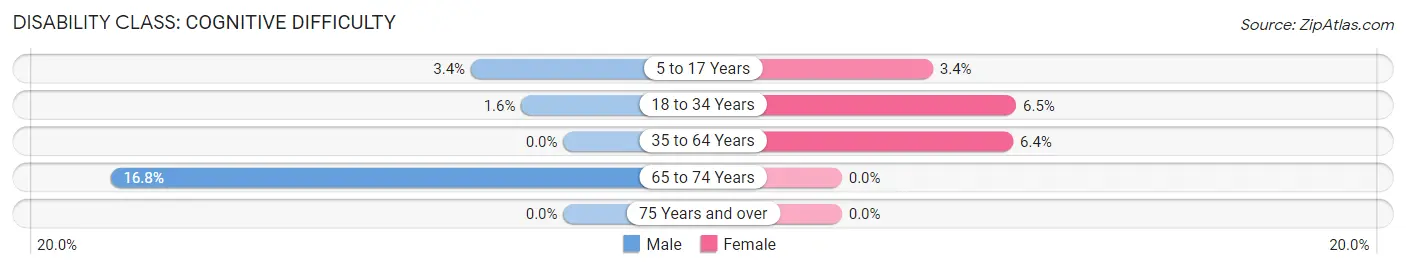
| Age Bracket | Male | Female |
| 5 to 17 Years | 11 (3.4%) | 7 (3.4%) |
| 18 to 34 Years | 7 (1.6%) | 27 (6.5%) |
| 35 to 64 Years | 0 (0.0%) | 40 (6.4%) |
| 65 to 74 Years | 20 (16.8%) | 0 (0.0%) |
| 75 Years and over | 0 (0.0%) | 0 (0.0%) |
Disability Class: Ambulatory Difficulty
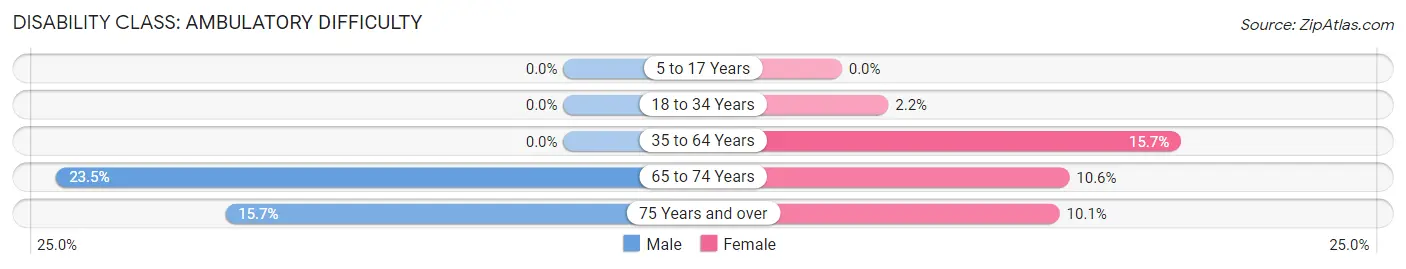
| Age Bracket | Male | Female |
| 5 to 17 Years | 0 (0.0%) | 0 (0.0%) |
| 18 to 34 Years | 0 (0.0%) | 9 (2.2%) |
| 35 to 64 Years | 0 (0.0%) | 99 (15.7%) |
| 65 to 74 Years | 28 (23.5%) | 17 (10.6%) |
| 75 Years and over | 8 (15.7%) | 9 (10.1%) |
Disability Class: Self-Care Difficulty
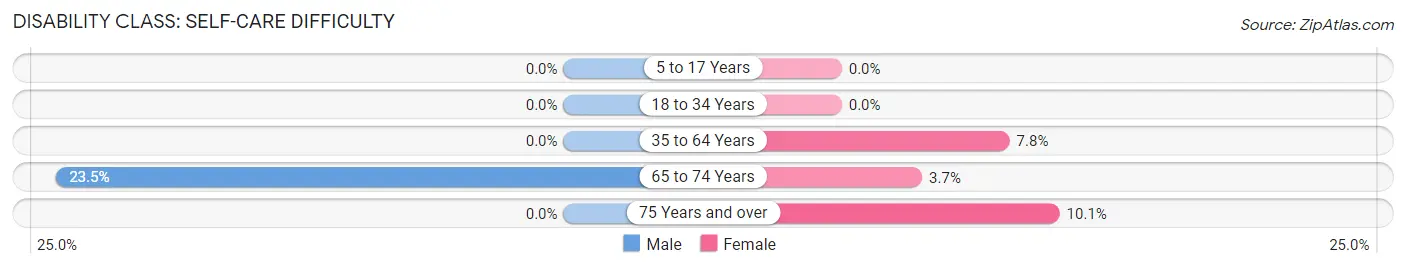
| Age Bracket | Male | Female |
| 5 to 17 Years | 0 (0.0%) | 0 (0.0%) |
| 18 to 34 Years | 0 (0.0%) | 0 (0.0%) |
| 35 to 64 Years | 0 (0.0%) | 49 (7.8%) |
| 65 to 74 Years | 28 (23.5%) | 6 (3.7%) |
| 75 Years and over | 0 (0.0%) | 9 (10.1%) |
Technology Access in Macungie borough
Computing Device Access in Macungie borough
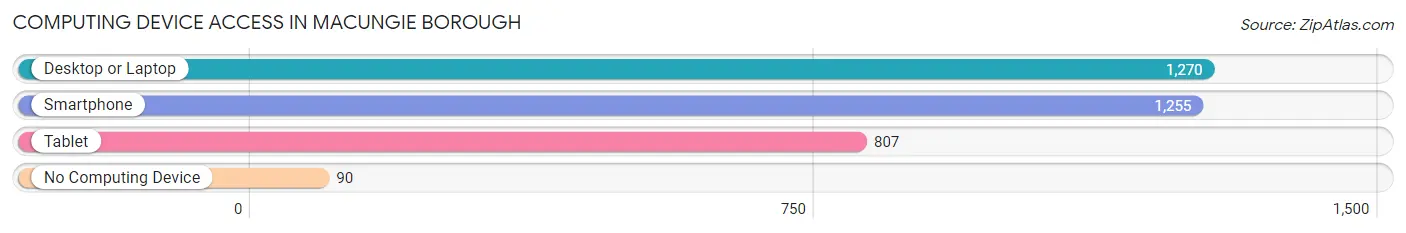
| Device Type | # Households | % Households |
| Desktop or Laptop | 1,270 | 87.7% |
| Smartphone | 1,255 | 86.7% |
| Tablet | 807 | 55.7% |
| No Computing Device | 90 | 6.2% |
| Total | 1,448 | 100.0% |
Internet Access in Macungie borough
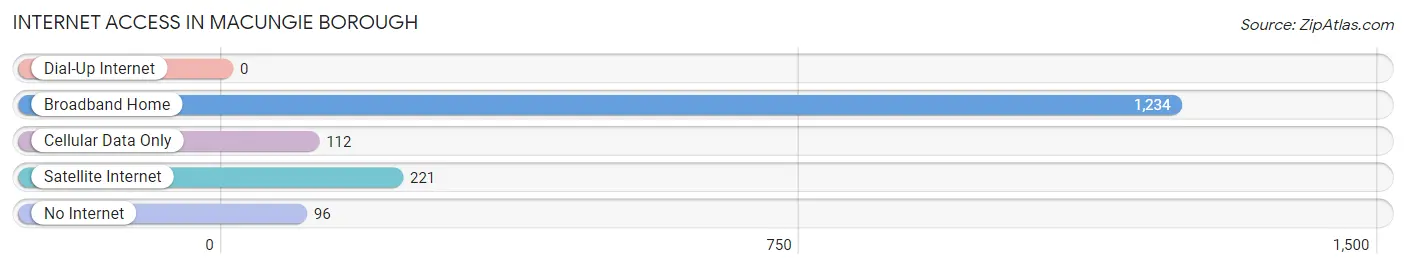
| Internet Type | # Households | % Households |
| Dial-Up Internet | 0 | 0.0% |
| Broadband Home | 1,234 | 85.2% |
| Cellular Data Only | 112 | 7.7% |
| Satellite Internet | 221 | 15.3% |
| No Internet | 96 | 6.6% |
| Total | 1,448 | 100.0% |
Macungie borough Summary
Macungie Borough is a small borough located in Lehigh County, Pennsylvania. It is situated in the Lehigh Valley region of the state, approximately 10 miles east of Allentown. The borough is home to a population of 3,072 people, according to the 2010 census.
History
The area that is now Macungie Borough was first settled in 1735 by a group of German immigrants. The town was originally known as Macungieville, and was incorporated as a borough in 1857. The name Macungie is derived from the Lenape Indian word “Makungi”, which means “bear”.
The town was an important stop on the Lehigh Valley Railroad, which ran through the borough from 1855 to 1976. The railroad was a major factor in the growth of the town, as it allowed for the transportation of goods and people to and from the area.
Geography
Macungie Borough is located in the Lehigh Valley region of Pennsylvania. It is situated in the southeastern corner of Lehigh County, approximately 10 miles east of Allentown. The borough is bordered by Lower Macungie Township to the north, Upper Milford Township to the east, Emmaus Borough to the south, and Alburtis Borough to the west.
The borough covers an area of 1.2 square miles, all of which is land. The terrain is mostly flat, with some rolling hills in the northern part of the borough. The borough is located in the Appalachian Mountains, and is part of the Lehigh Valley watershed.
Economy
The economy of Macungie Borough is largely based on manufacturing and retail. The borough is home to several manufacturing companies, including a plastics manufacturer, a metal fabricator, and a printing company. The borough is also home to several retail stores, including a grocery store, a hardware store, and a variety of specialty shops.
The borough is also home to several restaurants, including a pizzeria, a Mexican restaurant, and a Chinese restaurant. The borough is also home to several small businesses, including a barber shop, a beauty salon, and a pet store.
Demographics
According to the 2010 census, Macungie Borough has a population of 3,072 people. The racial makeup of the borough is 94.3% White, 1.3% African American, 0.3% Native American, 1.2% Asian, 0.1% Pacific Islander, 1.2% from other races, and 1.7% from two or more races. Hispanic or Latino of any race make up 3.3% of the population.
The median household income in the borough is $60,938, and the median family income is $68,958. The per capita income in the borough is $27,945. Approximately 8.3% of the population is below the poverty line.
The population of Macungie Borough is well-educated, with 92.3% of the population having a high school diploma or higher, and 33.2% having a bachelor’s degree or higher. The borough is served by the East Penn School District.
Common Questions
What is Per Capita Income in Macungie borough?
Per Capita income in Macungie borough is $35,905.
What is the Median Family Income in Macungie borough?
Median Family Income in Macungie borough is $80,240.
What is the Median Household income in Macungie borough?
Median Household Income in Macungie borough is $60,313.
What is Income or Wage Gap in Macungie borough?
Income or Wage Gap in Macungie borough is 41.8%.
Women in Macungie borough earn 58.2 cents for every dollar earned by a man.
What is Inequality or Gini Index in Macungie borough?
Inequality or Gini Index in Macungie borough is 0.40.
What is the Total Population of Macungie borough?
Total Population of Macungie borough is 3,249.
What is the Total Male Population of Macungie borough?
Total Male Population of Macungie borough is 1,712.
What is the Total Female Population of Macungie borough?
Total Female Population of Macungie borough is 1,537.
What is the Ratio of Males per 100 Females in Macungie borough?
There are 111.39 Males per 100 Females in Macungie borough.
What is the Ratio of Females per 100 Males in Macungie borough?
There are 89.78 Females per 100 Males in Macungie borough.
What is the Median Population Age in Macungie borough?
Median Population Age in Macungie borough is 39.9 Years.
What is the Average Family Size in Macungie borough
Average Family Size in Macungie borough is 3.0 People.
What is the Average Household Size in Macungie borough
Average Household Size in Macungie borough is 2.2 People.
How Large is the Labor Force in Macungie borough?
There are 1,913 People in the Labor Forcein in Macungie borough.
What is the Percentage of People in the Labor Force in Macungie borough?
69.0% of People are in the Labor Force in Macungie borough.
What is the Unemployment Rate in Macungie borough?
Unemployment Rate in Macungie borough is 2.1%.