Fullerton, PA Map & Demographics
Fullerton Map
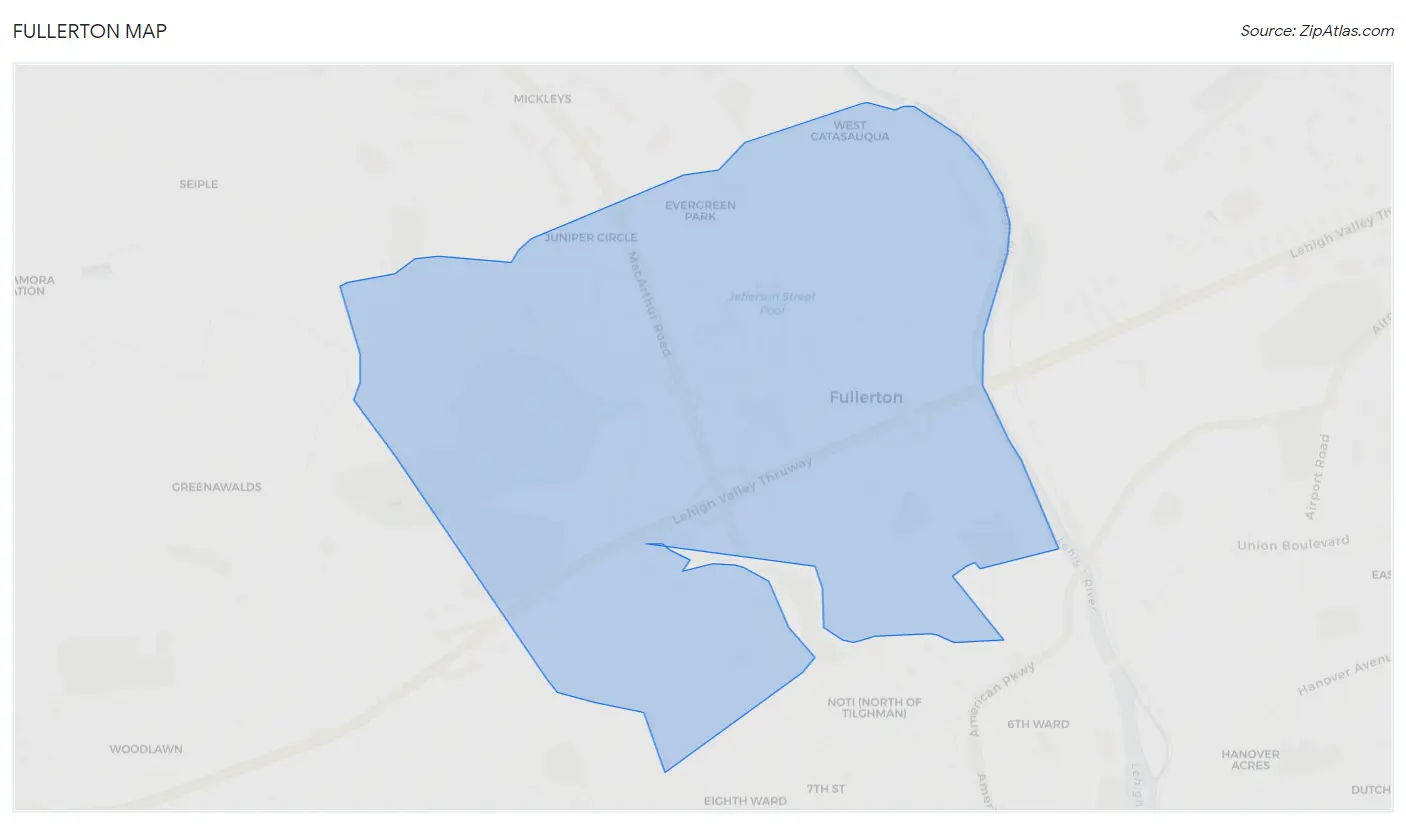
Fullerton Overview
$31,517
PER CAPITA INCOME
$77,634
AVG FAMILY INCOME
$63,423
AVG HOUSEHOLD INCOME
20.1%
WAGE / INCOME GAP [ % ]
79.9¢/ $1
WAGE / INCOME GAP [ $ ]
0.39
INEQUALITY / GINI INDEX
16,358
TOTAL POPULATION
8,549
MALE POPULATION
7,809
FEMALE POPULATION
109.48
MALES / 100 FEMALES
91.34
FEMALES / 100 MALES
34.6
MEDIAN AGE
3.0
AVG FAMILY SIZE
2.5
AVG HOUSEHOLD SIZE
9,608
LABOR FORCE [ PEOPLE ]
73.5%
PERCENT IN LABOR FORCE
4.6%
UNEMPLOYMENT RATE
Income in Fullerton
Income Overview in Fullerton
Per Capita Income in Fullerton is $31,517, while median incomes of families and households are $77,634 and $63,423 respectively.
| Characteristic | Number | Measure |
| Per Capita Income | 16,358 | $31,517 |
| Median Family Income | 4,431 | $77,634 |
| Mean Family Income | 4,431 | $86,107 |
| Median Household Income | 6,474 | $63,423 |
| Mean Household Income | 6,474 | $78,231 |
| Income Deficit | 4,431 | $0 |
| Wage / Income Gap (%) | 16,358 | 20.08% |
| Wage / Income Gap ($) | 16,358 | 79.92¢ per $1 |
| Gini / Inequality Index | 16,358 | 0.39 |
Earnings by Sex in Fullerton
Average Earnings in Fullerton are $38,980, $43,147 for men and $34,485 for women, a difference of 20.1%.
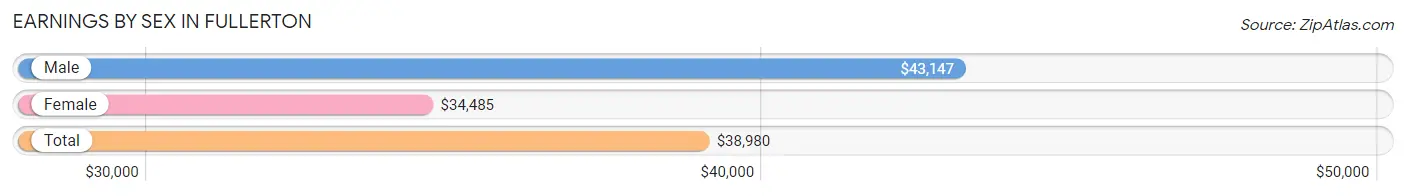
| Sex | Number | Average Earnings |
| Male | 5,249 (54.7%) | $43,147 |
| Female | 4,338 (45.3%) | $34,485 |
| Total | 9,587 (100.0%) | $38,980 |
Earnings by Sex by Income Bracket in Fullerton
The most common earnings brackets in Fullerton are $55,000 to $64,999 for men (520 | 9.9%) and $30,000 to $34,999 for women (456 | 10.5%).
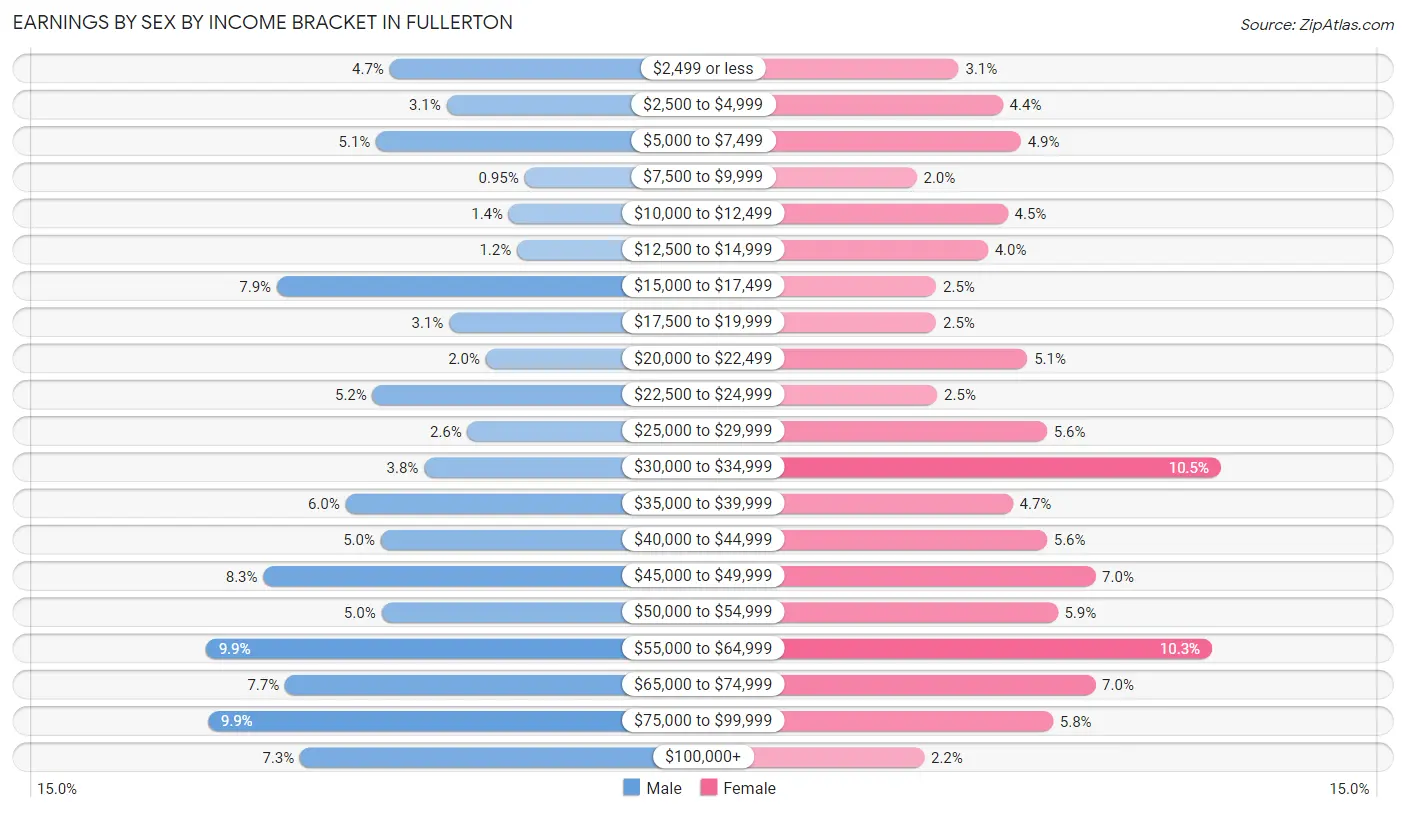
| Income | Male | Female |
| $2,499 or less | 249 (4.7%) | 136 (3.1%) |
| $2,500 to $4,999 | 165 (3.1%) | 190 (4.4%) |
| $5,000 to $7,499 | 269 (5.1%) | 212 (4.9%) |
| $7,500 to $9,999 | 50 (0.9%) | 85 (2.0%) |
| $10,000 to $12,499 | 73 (1.4%) | 196 (4.5%) |
| $12,500 to $14,999 | 61 (1.2%) | 172 (4.0%) |
| $15,000 to $17,499 | 415 (7.9%) | 109 (2.5%) |
| $17,500 to $19,999 | 161 (3.1%) | 109 (2.5%) |
| $20,000 to $22,499 | 107 (2.0%) | 220 (5.1%) |
| $22,500 to $24,999 | 274 (5.2%) | 110 (2.5%) |
| $25,000 to $29,999 | 134 (2.5%) | 244 (5.6%) |
| $30,000 to $34,999 | 198 (3.8%) | 456 (10.5%) |
| $35,000 to $39,999 | 314 (6.0%) | 202 (4.7%) |
| $40,000 to $44,999 | 262 (5.0%) | 244 (5.6%) |
| $45,000 to $49,999 | 435 (8.3%) | 303 (7.0%) |
| $50,000 to $54,999 | 261 (5.0%) | 257 (5.9%) |
| $55,000 to $64,999 | 520 (9.9%) | 445 (10.3%) |
| $65,000 to $74,999 | 403 (7.7%) | 303 (7.0%) |
| $75,000 to $99,999 | 517 (9.9%) | 251 (5.8%) |
| $100,000+ | 381 (7.3%) | 94 (2.2%) |
| Total | 5,249 (100.0%) | 4,338 (100.0%) |
Earnings by Sex by Educational Attainment in Fullerton
Average earnings in Fullerton are $46,947 for men and $36,472 for women, a difference of 22.3%. Men with an educational attainment of graduate degree enjoy the highest average annual earnings of $111,750, while those with less than high school education earn the least with $39,476. Women with an educational attainment of bachelor's degree earn the most with the average annual earnings of $57,936, while those with less than high school education have the smallest earnings of $20,718.
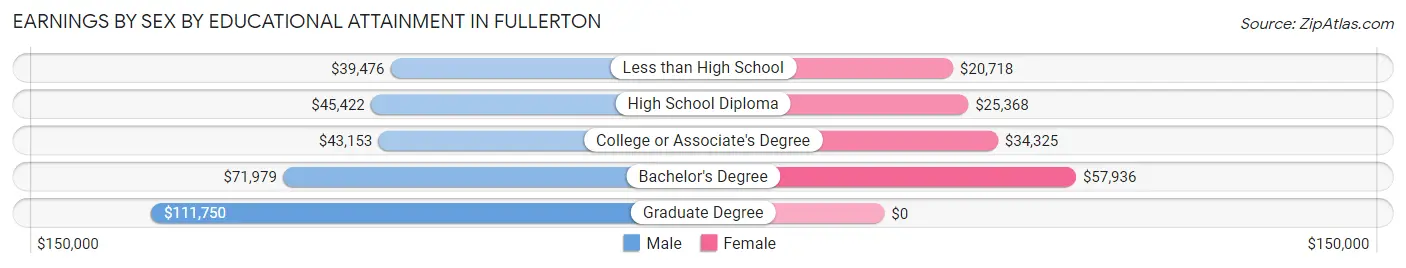
| Educational Attainment | Male Income | Female Income |
| Less than High School | $39,476 | $20,718 |
| High School Diploma | $45,422 | $25,368 |
| College or Associate's Degree | $43,153 | $34,325 |
| Bachelor's Degree | $71,979 | $57,936 |
| Graduate Degree | $111,750 | $0 |
| Total | $46,947 | $36,472 |
Family Income in Fullerton
Family Income Brackets in Fullerton
According to the Fullerton family income data, there are 1,103 families falling into the $75,000 to $99,999 income range, which is the most common income bracket and makes up 24.9% of all families. Conversely, the $10,000 to $14,999 income bracket is the least frequent group with only 31 families (0.7%) belonging to this category.
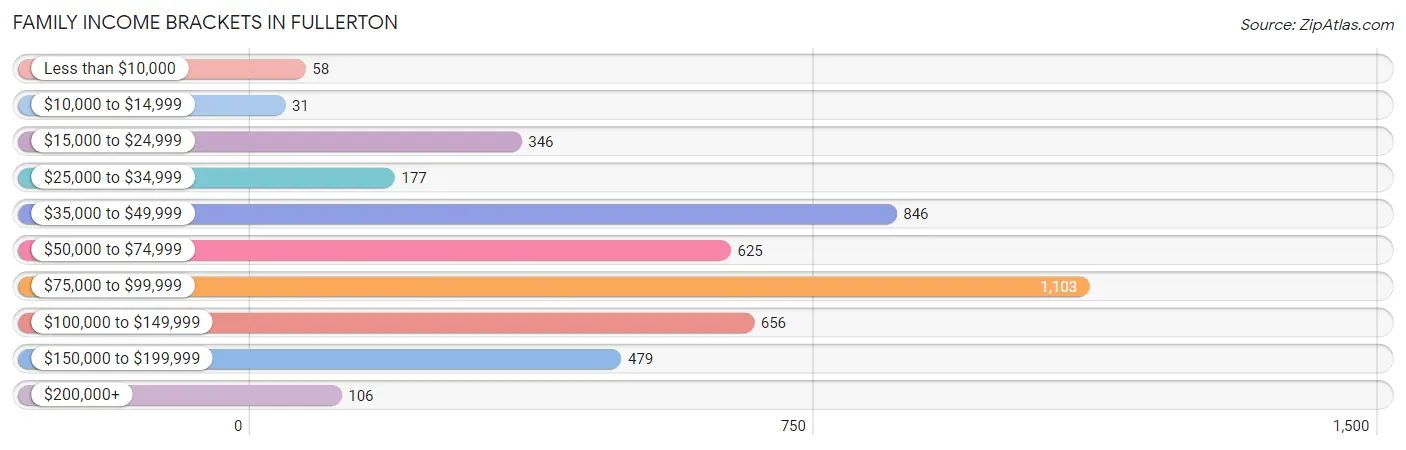
| Income Bracket | # Families | % Families |
| Less than $10,000 | 58 | 1.3% |
| $10,000 to $14,999 | 31 | 0.7% |
| $15,000 to $24,999 | 346 | 7.8% |
| $25,000 to $34,999 | 177 | 4.0% |
| $35,000 to $49,999 | 846 | 19.1% |
| $50,000 to $74,999 | 625 | 14.1% |
| $75,000 to $99,999 | 1,103 | 24.9% |
| $100,000 to $149,999 | 656 | 14.8% |
| $150,000 to $199,999 | 479 | 10.8% |
| $200,000+ | 106 | 2.4% |
Family Income by Famaliy Size in Fullerton
5-person families (548 | 12.4%) account for the highest median family income in Fullerton with $97,125 per family, while 2-person families (2,365 | 53.4%) have the highest median income of $32,098 per family member.
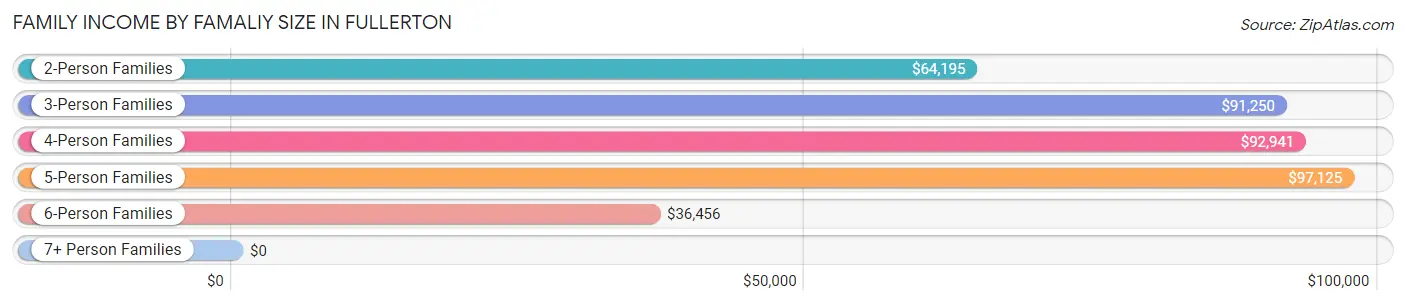
| Income Bracket | # Families | Median Income |
| 2-Person Families | 2,365 (53.4%) | $64,195 |
| 3-Person Families | 642 (14.5%) | $91,250 |
| 4-Person Families | 570 (12.9%) | $92,941 |
| 5-Person Families | 548 (12.4%) | $97,125 |
| 6-Person Families | 237 (5.3%) | $36,456 |
| 7+ Person Families | 69 (1.6%) | $0 |
| Total | 4,431 (100.0%) | $77,634 |
Family Income by Number of Earners in Fullerton
The median family income in Fullerton is $77,634, with families comprising 3+ earners (506) having the highest median family income of $157,716, while families with 1 earner (1,386) have the lowest median family income of $45,942, accounting for 11.4% and 31.3% of families, respectively.
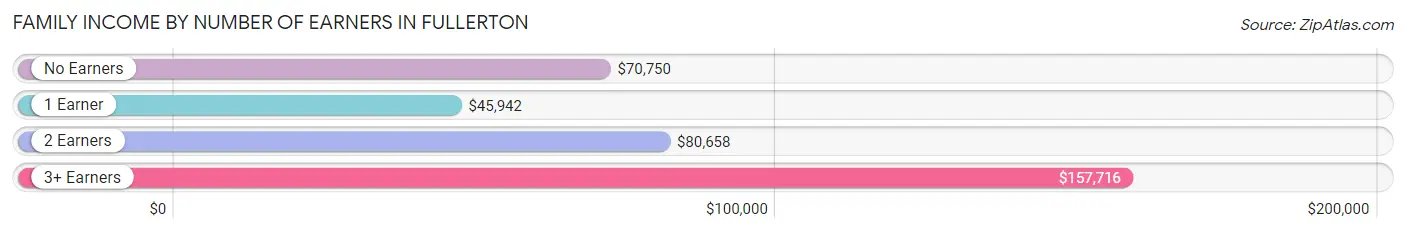
| Number of Earners | # Families | Median Income |
| No Earners | 347 (7.8%) | $70,750 |
| 1 Earner | 1,386 (31.3%) | $45,942 |
| 2 Earners | 2,192 (49.5%) | $80,658 |
| 3+ Earners | 506 (11.4%) | $157,716 |
| Total | 4,431 (100.0%) | $77,634 |
Household Income in Fullerton
Household Income Brackets in Fullerton
With 1,308 households falling in the category, the $75,000 to $99,999 income range is the most frequent in Fullerton, accounting for 20.2% of all households. In contrast, only 162 households (2.5%) fall into the $10,000 to $14,999 income bracket, making it the least populous group.
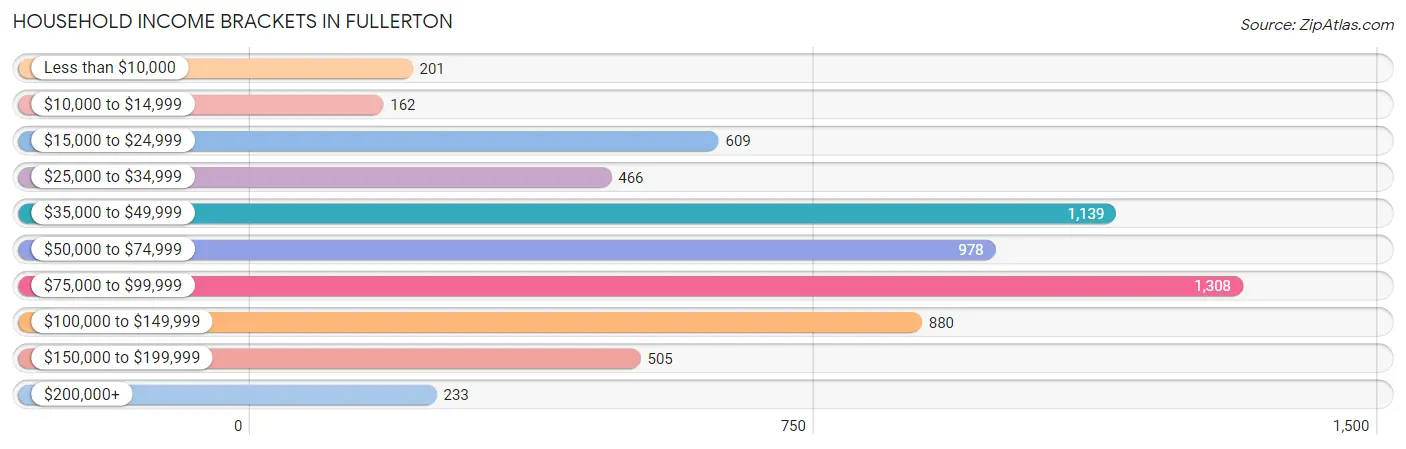
| Income Bracket | # Households | % Households |
| Less than $10,000 | 201 | 3.1% |
| $10,000 to $14,999 | 162 | 2.5% |
| $15,000 to $24,999 | 609 | 9.4% |
| $25,000 to $34,999 | 466 | 7.2% |
| $35,000 to $49,999 | 1,139 | 17.6% |
| $50,000 to $74,999 | 978 | 15.1% |
| $75,000 to $99,999 | 1,308 | 20.2% |
| $100,000 to $149,999 | 880 | 13.6% |
| $150,000 to $199,999 | 505 | 7.8% |
| $200,000+ | 233 | 3.6% |
Household Income by Householder Age in Fullerton
The median household income in Fullerton is $63,423, with the highest median household income of $78,485 found in the 45 to 64 years age bracket for the primary householder. A total of 2,126 households (32.8%) fall into this category. Meanwhile, the 65+ years age bracket for the primary householder has the lowest median household income of $49,286, with 1,438 households (22.2%) in this group.
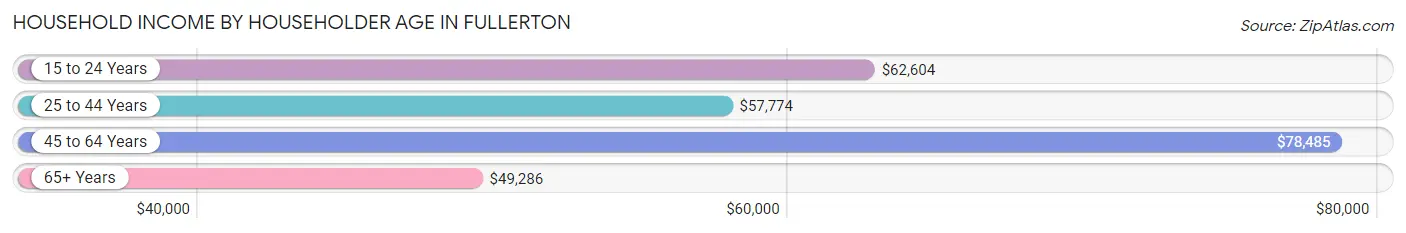
| Income Bracket | # Households | Median Income |
| 15 to 24 Years | 211 (3.3%) | $62,604 |
| 25 to 44 Years | 2,699 (41.7%) | $57,774 |
| 45 to 64 Years | 2,126 (32.8%) | $78,485 |
| 65+ Years | 1,438 (22.2%) | $49,286 |
| Total | 6,474 (100.0%) | $63,423 |
Poverty in Fullerton
Income Below Poverty by Sex and Age in Fullerton
With 16.4% poverty level for males and 11.4% for females among the residents of Fullerton, 15 year old males and 12 to 14 year old females are the most vulnerable to poverty, with 190 males (71.2%) and 70 females (39.8%) in their respective age groups living below the poverty level.
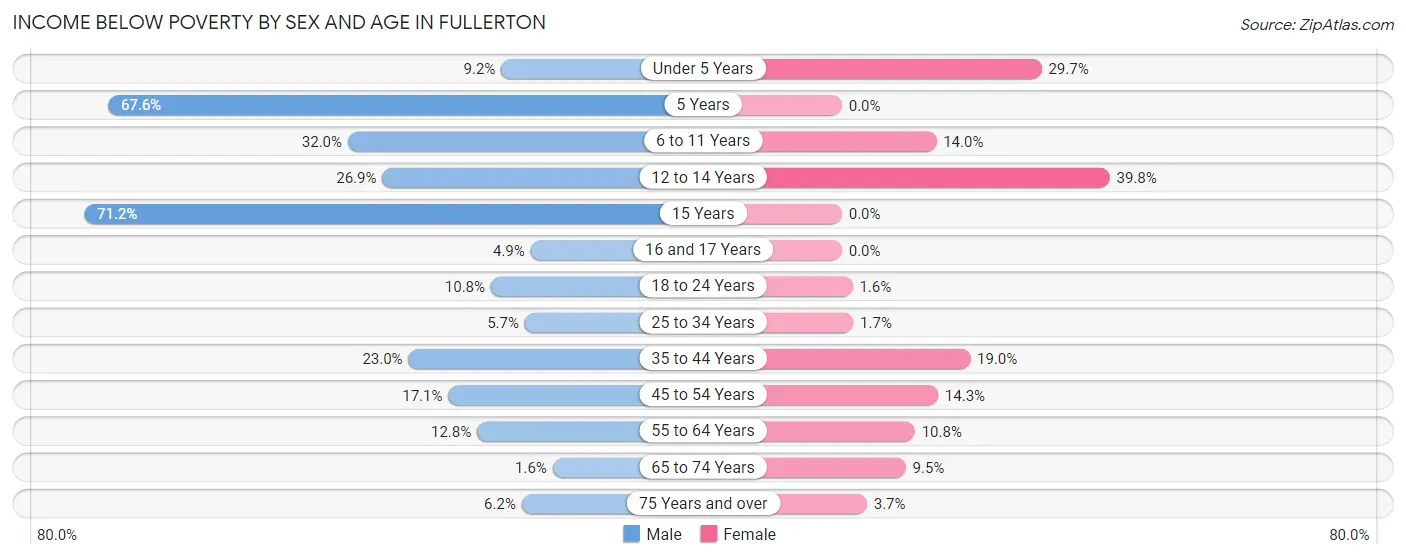
| Age Bracket | Male | Female |
| Under 5 Years | 30 (9.2%) | 193 (29.6%) |
| 5 Years | 71 (67.6%) | 0 (0.0%) |
| 6 to 11 Years | 168 (32.0%) | 74 (14.0%) |
| 12 to 14 Years | 153 (26.9%) | 70 (39.8%) |
| 15 Years | 190 (71.2%) | 0 (0.0%) |
| 16 and 17 Years | 11 (4.9%) | 0 (0.0%) |
| 18 to 24 Years | 111 (10.8%) | 7 (1.6%) |
| 25 to 34 Years | 94 (5.7%) | 26 (1.7%) |
| 35 to 44 Years | 276 (23.0%) | 221 (19.0%) |
| 45 to 54 Years | 139 (17.1%) | 113 (14.3%) |
| 55 to 64 Years | 126 (12.8%) | 99 (10.8%) |
| 65 to 74 Years | 8 (1.6%) | 60 (9.5%) |
| 75 Years and over | 22 (6.2%) | 25 (3.7%) |
| Total | 1,399 (16.4%) | 888 (11.4%) |
Income Above Poverty by Sex and Age in Fullerton
According to the poverty statistics in Fullerton, males aged 65 to 74 years and females aged 5 years are the age groups that are most secure financially, with 98.4% of males and 100.0% of females in these age groups living above the poverty line.
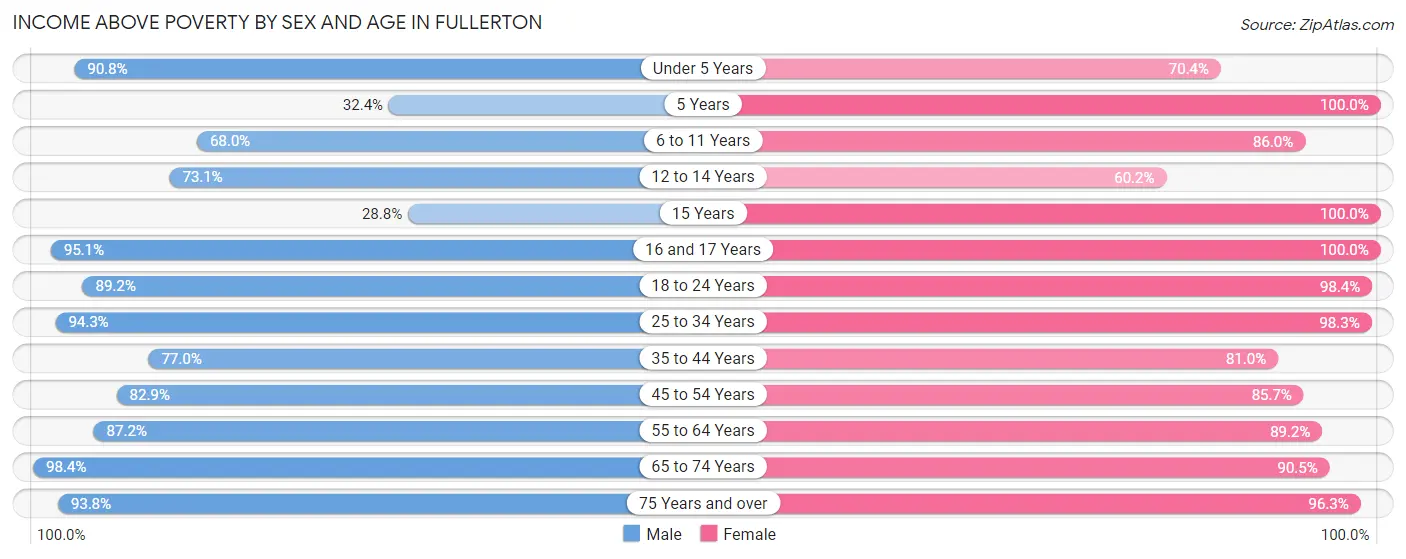
| Age Bracket | Male | Female |
| Under 5 Years | 295 (90.8%) | 458 (70.4%) |
| 5 Years | 34 (32.4%) | 131 (100.0%) |
| 6 to 11 Years | 357 (68.0%) | 454 (86.0%) |
| 12 to 14 Years | 416 (73.1%) | 106 (60.2%) |
| 15 Years | 77 (28.8%) | 9 (100.0%) |
| 16 and 17 Years | 215 (95.1%) | 155 (100.0%) |
| 18 to 24 Years | 921 (89.2%) | 436 (98.4%) |
| 25 to 34 Years | 1,547 (94.3%) | 1,516 (98.3%) |
| 35 to 44 Years | 924 (77.0%) | 940 (81.0%) |
| 45 to 54 Years | 675 (82.9%) | 679 (85.7%) |
| 55 to 64 Years | 857 (87.2%) | 815 (89.2%) |
| 65 to 74 Years | 498 (98.4%) | 573 (90.5%) |
| 75 Years and over | 334 (93.8%) | 649 (96.3%) |
| Total | 7,150 (83.6%) | 6,921 (88.6%) |
Income Below Poverty Among Married-Couple Families in Fullerton
The poverty statistics for married-couple families in Fullerton show that 10.7% or 317 of the total 2,954 families live below the poverty line. Families with 3 or 4 children have the highest poverty rate of 37.8%, comprising of 164 families. On the other hand, families with 5 or more children have the lowest poverty rate of 0.0%, which includes 0 families.
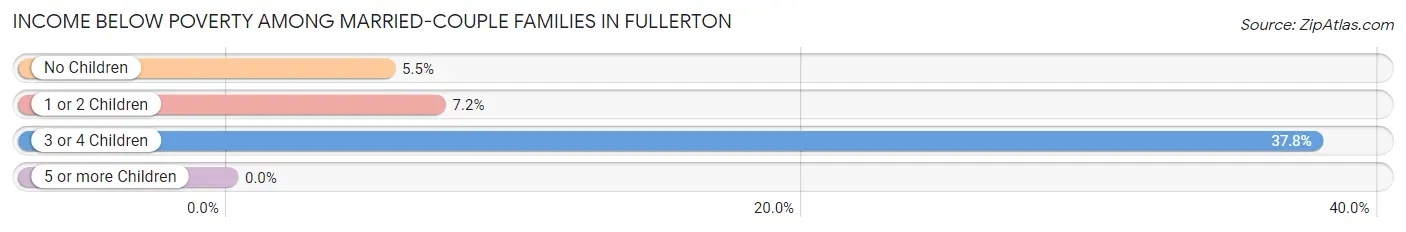
| Children | Above Poverty | Below Poverty |
| No Children | 1,401 (94.5%) | 81 (5.5%) |
| 1 or 2 Children | 924 (92.8%) | 72 (7.2%) |
| 3 or 4 Children | 270 (62.2%) | 164 (37.8%) |
| 5 or more Children | 42 (100.0%) | 0 (0.0%) |
| Total | 2,637 (89.3%) | 317 (10.7%) |
Income Below Poverty Among Single-Parent Households in Fullerton
According to the poverty data in Fullerton, 5.9% or 39 single-father households and 1.0% or 8 single-mother households are living below the poverty line. Among single-father households, those with 5 or more children have the highest poverty rate, with 23 households (100.0%) experiencing poverty. Likewise, among single-mother households, those with no children have the highest poverty rate, with 8 households (2.1%) falling below the poverty line.
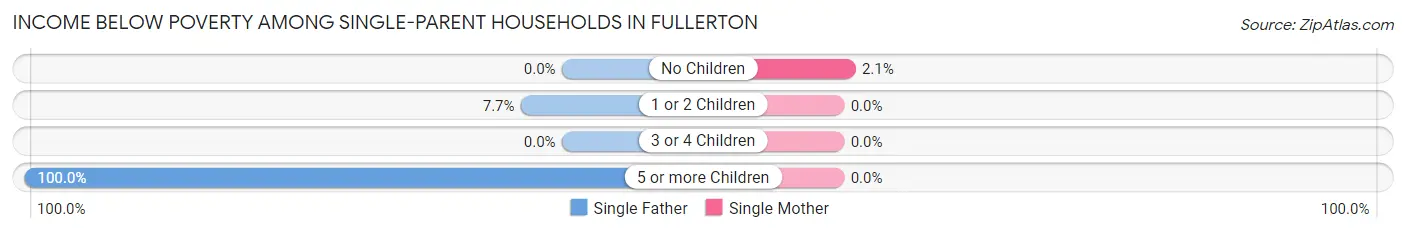
| Children | Single Father | Single Mother |
| No Children | 0 (0.0%) | 8 (2.1%) |
| 1 or 2 Children | 16 (7.7%) | 0 (0.0%) |
| 3 or 4 Children | 0 (0.0%) | 0 (0.0%) |
| 5 or more Children | 23 (100.0%) | 0 (0.0%) |
| Total | 39 (5.9%) | 8 (1.0%) |
Income Below Poverty Among Married-Couple vs Single-Parent Households in Fullerton
The poverty data for Fullerton shows that 317 of the married-couple family households (10.7%) and 47 of the single-parent households (3.2%) are living below the poverty level. Within the married-couple family households, those with 3 or 4 children have the highest poverty rate, with 164 households (37.8%) falling below the poverty line. Among the single-parent households, those with 5 or more children have the highest poverty rate, with 23 household (100.0%) living below poverty.
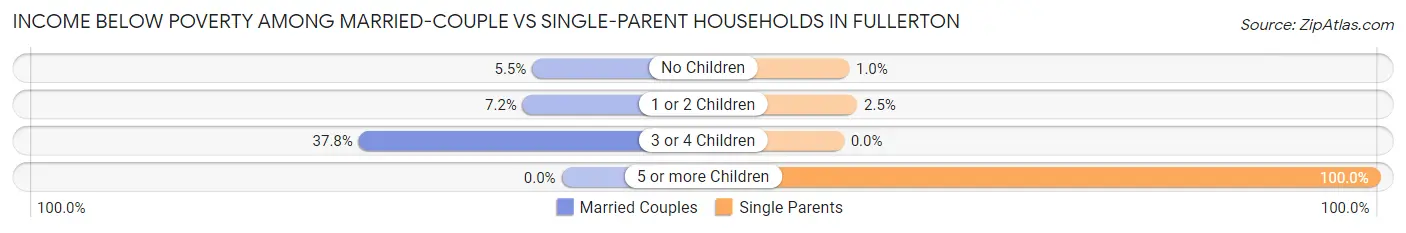
| Children | Married-Couple Families | Single-Parent Households |
| No Children | 81 (5.5%) | 8 (1.0%) |
| 1 or 2 Children | 72 (7.2%) | 16 (2.5%) |
| 3 or 4 Children | 164 (37.8%) | 0 (0.0%) |
| 5 or more Children | 0 (0.0%) | 23 (100.0%) |
| Total | 317 (10.7%) | 47 (3.2%) |
Race in Fullerton
The most populous races in Fullerton are White / Caucasian (10,541 | 64.4%), Hispanic or Latino (5,012 | 30.6%), and Two or more Races (2,886 | 17.6%).
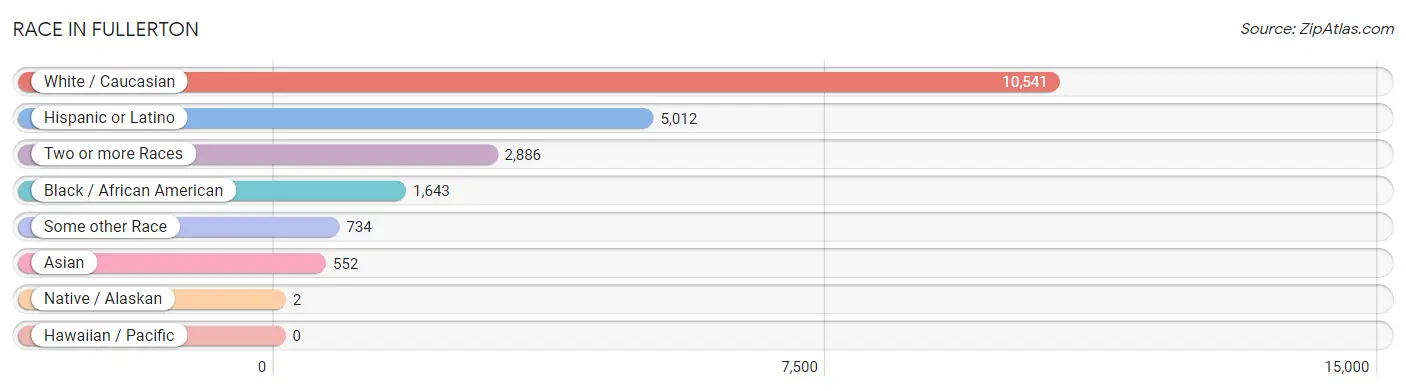
| Race | # Population | % Population |
| Asian | 552 | 3.4% |
| Black / African American | 1,643 | 10.0% |
| Hawaiian / Pacific | 0 | 0.0% |
| Hispanic or Latino | 5,012 | 30.6% |
| Native / Alaskan | 2 | 0.0% |
| White / Caucasian | 10,541 | 64.4% |
| Two or more Races | 2,886 | 17.6% |
| Some other Race | 734 | 4.5% |
| Total | 16,358 | 100.0% |
Ancestry in Fullerton
The most populous ancestries reported in Fullerton are German (2,907 | 17.8%), Puerto Rican (2,384 | 14.6%), Arab (1,945 | 11.9%), Dominican (1,801 | 11.0%), and Syrian (1,485 | 9.1%), together accounting for 64.3% of all Fullerton residents.
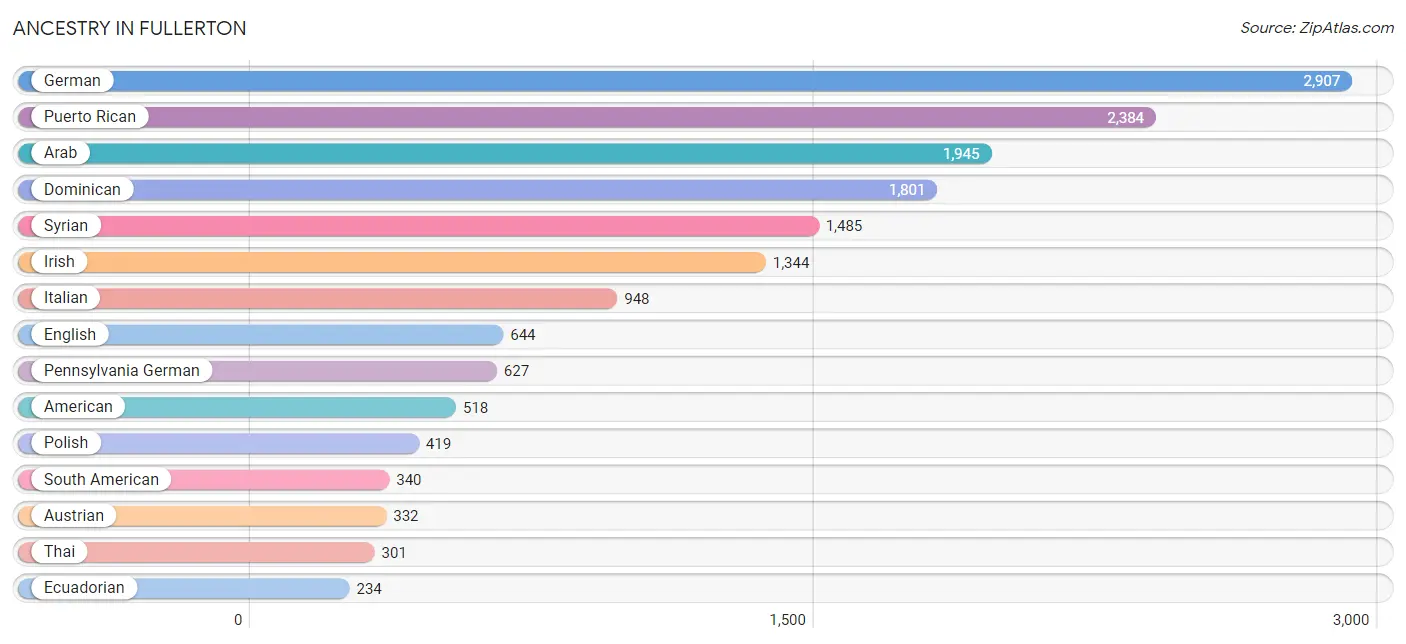
| Ancestry | # Population | % Population |
| African | 13 | 0.1% |
| American | 518 | 3.2% |
| Arab | 1,945 | 11.9% |
| Argentinean | 23 | 0.1% |
| Austrian | 332 | 2.0% |
| Brazilian | 20 | 0.1% |
| British | 66 | 0.4% |
| Burmese | 44 | 0.3% |
| Central American | 181 | 1.1% |
| Cherokee | 5 | 0.0% |
| Chilean | 28 | 0.2% |
| Colombian | 24 | 0.2% |
| Croatian | 21 | 0.1% |
| Cuban | 51 | 0.3% |
| Czech | 12 | 0.1% |
| Czechoslovakian | 29 | 0.2% |
| Delaware | 13 | 0.1% |
| Dominican | 1,801 | 11.0% |
| Dutch | 186 | 1.1% |
| Eastern European | 6 | 0.0% |
| Ecuadorian | 234 | 1.4% |
| English | 644 | 3.9% |
| French | 96 | 0.6% |
| German | 2,907 | 17.8% |
| Greek | 5 | 0.0% |
| Haitian | 15 | 0.1% |
| Honduran | 181 | 1.1% |
| Hungarian | 168 | 1.0% |
| Indian (Asian) | 47 | 0.3% |
| Irish | 1,344 | 8.2% |
| Italian | 948 | 5.8% |
| Jamaican | 96 | 0.6% |
| Kenyan | 110 | 0.7% |
| Korean | 21 | 0.1% |
| Lebanese | 152 | 0.9% |
| Liberian | 17 | 0.1% |
| Lithuanian | 55 | 0.3% |
| Mexican | 188 | 1.1% |
| Mongolian | 78 | 0.5% |
| Moroccan | 83 | 0.5% |
| Norwegian | 40 | 0.2% |
| Pennsylvania German | 627 | 3.8% |
| Peruvian | 31 | 0.2% |
| Polish | 419 | 2.6% |
| Portuguese | 6 | 0.0% |
| Puerto Rican | 2,384 | 14.6% |
| Romanian | 12 | 0.1% |
| Russian | 7 | 0.0% |
| Scandinavian | 8 | 0.1% |
| Scotch-Irish | 24 | 0.2% |
| Scottish | 31 | 0.2% |
| Slovak | 174 | 1.1% |
| South American | 340 | 2.1% |
| Sri Lankan | 63 | 0.4% |
| Subsaharan African | 174 | 1.1% |
| Swedish | 38 | 0.2% |
| Swiss | 15 | 0.1% |
| Syrian | 1,485 | 9.1% |
| Thai | 301 | 1.8% |
| Trinidadian and Tobagonian | 20 | 0.1% |
| Ukrainian | 165 | 1.0% |
| Welsh | 71 | 0.4% |
| Yugoslavian | 18 | 0.1% | View All 63 Rows |
Immigrants in Fullerton
The most numerous immigrant groups reported in Fullerton came from Asia (1,664 | 10.2%), Latin America (1,300 | 8.0%), Western Asia (1,132 | 6.9%), Caribbean (911 | 5.6%), and Syria (907 | 5.5%), together accounting for 36.2% of all Fullerton residents.
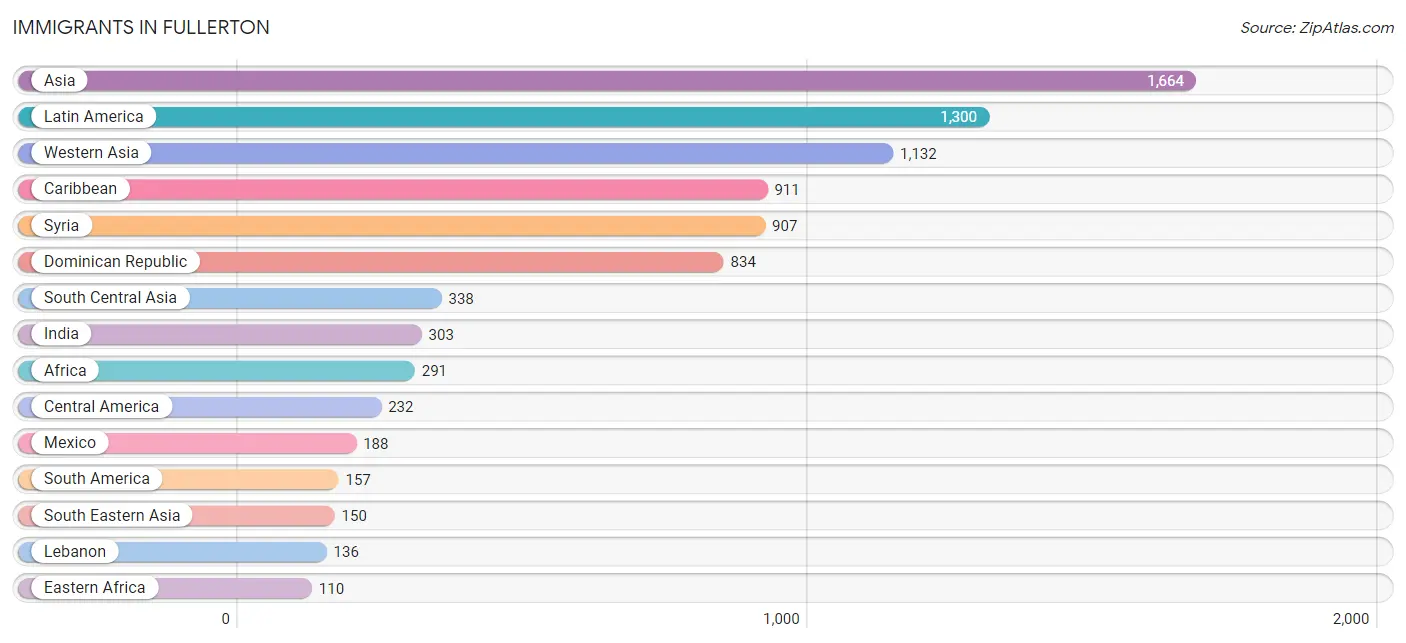
| Immigration Origin | # Population | % Population |
| Africa | 291 | 1.8% |
| Argentina | 23 | 0.1% |
| Asia | 1,664 | 10.2% |
| Austria | 8 | 0.1% |
| Barbados | 19 | 0.1% |
| Brazil | 9 | 0.1% |
| Cameroon | 34 | 0.2% |
| Caribbean | 911 | 5.6% |
| Central America | 232 | 1.4% |
| Chile | 28 | 0.2% |
| Cuba | 8 | 0.1% |
| Czechoslovakia | 6 | 0.0% |
| Dominican Republic | 834 | 5.1% |
| Eastern Africa | 110 | 0.7% |
| Eastern Asia | 44 | 0.3% |
| Eastern Europe | 68 | 0.4% |
| Ecuador | 66 | 0.4% |
| Egypt | 7 | 0.0% |
| Europe | 98 | 0.6% |
| Honduras | 44 | 0.3% |
| India | 303 | 1.8% |
| Italy | 11 | 0.1% |
| Jamaica | 30 | 0.2% |
| Jordan | 25 | 0.2% |
| Kenya | 110 | 0.7% |
| Korea | 44 | 0.3% |
| Latin America | 1,300 | 8.0% |
| Lebanon | 136 | 0.8% |
| Liberia | 17 | 0.1% |
| Malaysia | 88 | 0.5% |
| Mexico | 188 | 1.1% |
| Middle Africa | 34 | 0.2% |
| Morocco | 83 | 0.5% |
| Nigeria | 31 | 0.2% |
| Northern Africa | 99 | 0.6% |
| Northern Europe | 11 | 0.1% |
| Pakistan | 35 | 0.2% |
| Peru | 31 | 0.2% |
| Philippines | 21 | 0.1% |
| Poland | 39 | 0.2% |
| South America | 157 | 1.0% |
| South Central Asia | 338 | 2.1% |
| South Eastern Asia | 150 | 0.9% |
| Southern Europe | 11 | 0.1% |
| Syria | 907 | 5.5% |
| Trinidad and Tobago | 20 | 0.1% |
| Ukraine | 23 | 0.1% |
| Vietnam | 41 | 0.3% |
| Western Africa | 48 | 0.3% |
| Western Asia | 1,132 | 6.9% |
| Western Europe | 8 | 0.1% | View All 51 Rows |
Sex and Age in Fullerton
Sex and Age in Fullerton
The most populous age groups in Fullerton are 15 to 19 Years (904 | 10.6%) for men and 30 to 34 Years (836 | 10.7%) for women.
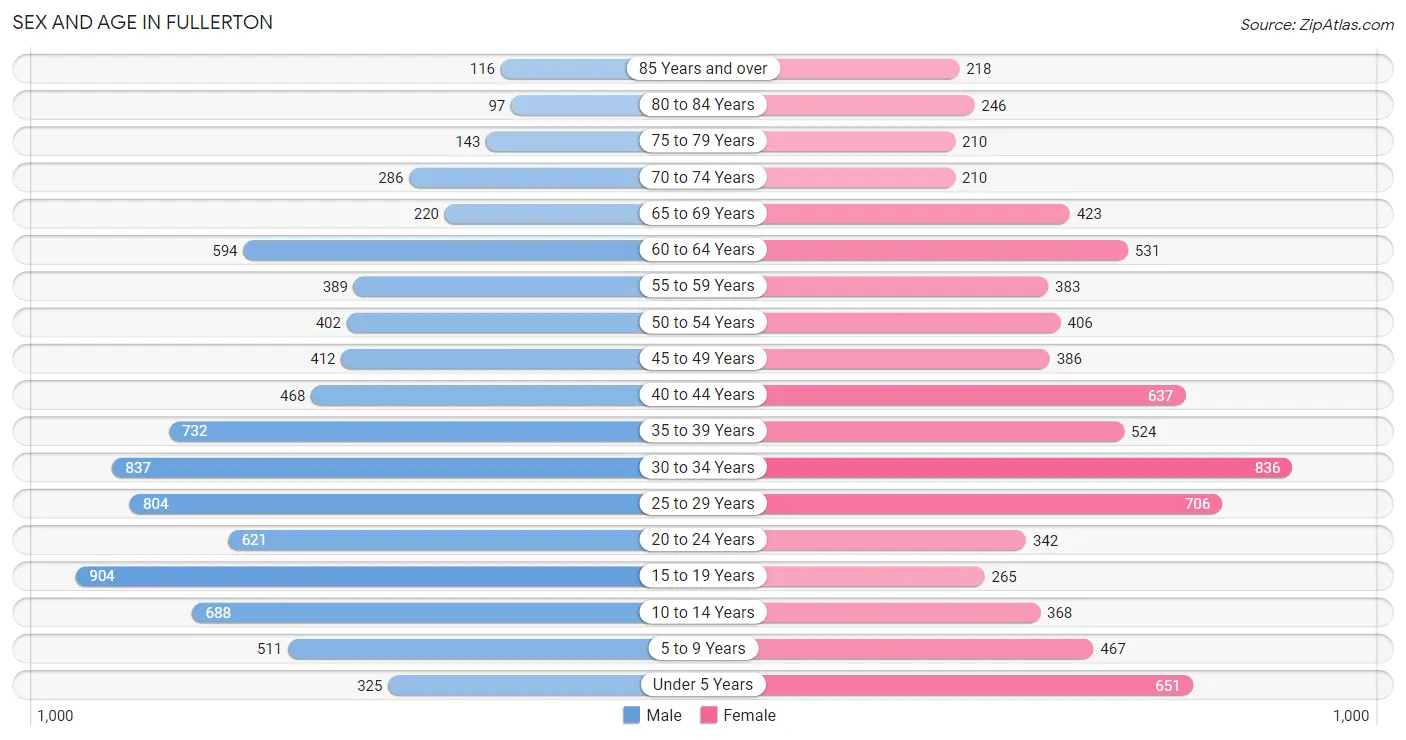
| Age Bracket | Male | Female |
| Under 5 Years | 325 (3.8%) | 651 (8.3%) |
| 5 to 9 Years | 511 (6.0%) | 467 (6.0%) |
| 10 to 14 Years | 688 (8.1%) | 368 (4.7%) |
| 15 to 19 Years | 904 (10.6%) | 265 (3.4%) |
| 20 to 24 Years | 621 (7.3%) | 342 (4.4%) |
| 25 to 29 Years | 804 (9.4%) | 706 (9.0%) |
| 30 to 34 Years | 837 (9.8%) | 836 (10.7%) |
| 35 to 39 Years | 732 (8.6%) | 524 (6.7%) |
| 40 to 44 Years | 468 (5.5%) | 637 (8.2%) |
| 45 to 49 Years | 412 (4.8%) | 386 (4.9%) |
| 50 to 54 Years | 402 (4.7%) | 406 (5.2%) |
| 55 to 59 Years | 389 (4.5%) | 383 (4.9%) |
| 60 to 64 Years | 594 (7.0%) | 531 (6.8%) |
| 65 to 69 Years | 220 (2.6%) | 423 (5.4%) |
| 70 to 74 Years | 286 (3.4%) | 210 (2.7%) |
| 75 to 79 Years | 143 (1.7%) | 210 (2.7%) |
| 80 to 84 Years | 97 (1.1%) | 246 (3.2%) |
| 85 Years and over | 116 (1.4%) | 218 (2.8%) |
| Total | 8,549 (100.0%) | 7,809 (100.0%) |
Families and Households in Fullerton
Median Family Size in Fullerton
The median family size in Fullerton is 3.02 persons per family, with married-couple families (2,954 | 66.7%) accounting for the largest median family size of 3.34 persons per family. On the other hand, single female/mother families (822 | 18.5%) represent the smallest median family size with 2.28 persons per family.
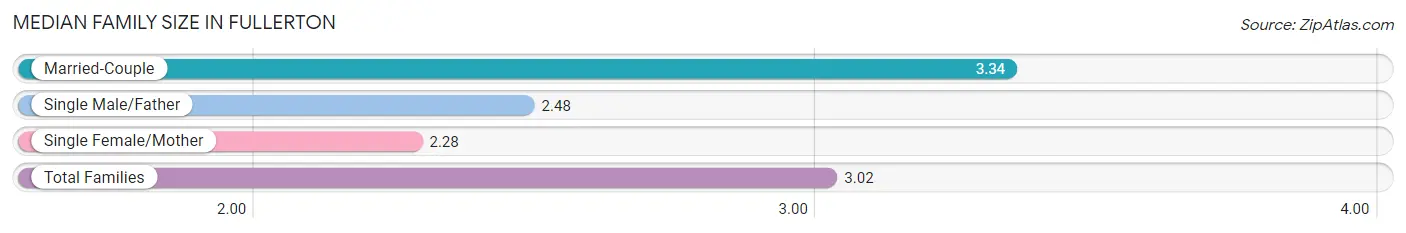
| Family Type | # Families | Family Size |
| Married-Couple | 2,954 (66.7%) | 3.34 |
| Single Male/Father | 655 (14.8%) | 2.48 |
| Single Female/Mother | 822 (18.5%) | 2.28 |
| Total Families | 4,431 (100.0%) | 3.02 |
Median Household Size in Fullerton
The median household size in Fullerton is 2.52 persons per household, with married-couple households (2,954 | 45.6%) accounting for the largest median household size of 3.36 persons per household. non-family households (2,043 | 31.6%) represent the smallest median household size with 1.25 persons per household.
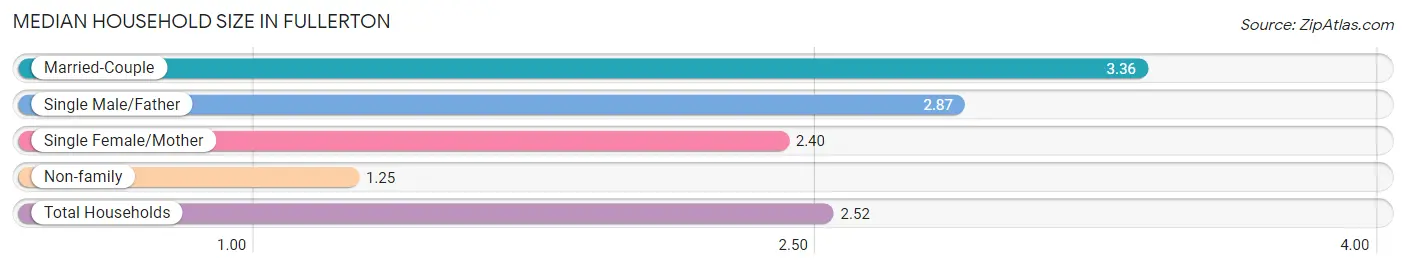
| Household Type | # Households | Household Size |
| Married-Couple | 2,954 (45.6%) | 3.36 |
| Single Male/Father | 655 (10.1%) | 2.87 |
| Single Female/Mother | 822 (12.7%) | 2.40 |
| Non-family | 2,043 (31.6%) | 1.25 |
| Total Households | 6,474 (100.0%) | 2.52 |
Household Size by Marriage Status in Fullerton
Out of a total of 6,474 households in Fullerton, 4,431 (68.4%) are family households, while 2,043 (31.6%) are nonfamily households. The most numerous type of family households are 2-person households, comprising 2,134, and the most common type of nonfamily households are 1-person households, comprising 1,640.
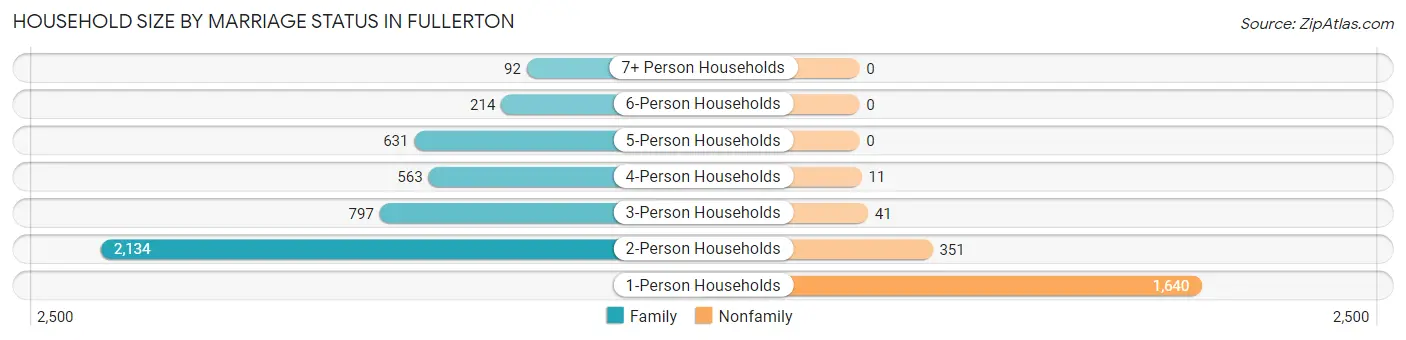
| Household Size | Family Households | Nonfamily Households |
| 1-Person Households | - | 1,640 (25.3%) |
| 2-Person Households | 2,134 (33.0%) | 351 (5.4%) |
| 3-Person Households | 797 (12.3%) | 41 (0.6%) |
| 4-Person Households | 563 (8.7%) | 11 (0.2%) |
| 5-Person Households | 631 (9.8%) | 0 (0.0%) |
| 6-Person Households | 214 (3.3%) | 0 (0.0%) |
| 7+ Person Households | 92 (1.4%) | 0 (0.0%) |
| Total | 4,431 (68.4%) | 2,043 (31.6%) |
Female Fertility in Fullerton
Fertility by Age in Fullerton
Average fertility rate in Fullerton is 50.0 births per 1,000 women. Women in the age bracket of 15 to 19 years have the highest fertility rate with 113.0 births per 1,000 women. Women in the age bracket of 35 to 50 years acount for 46.3% of all women with births.
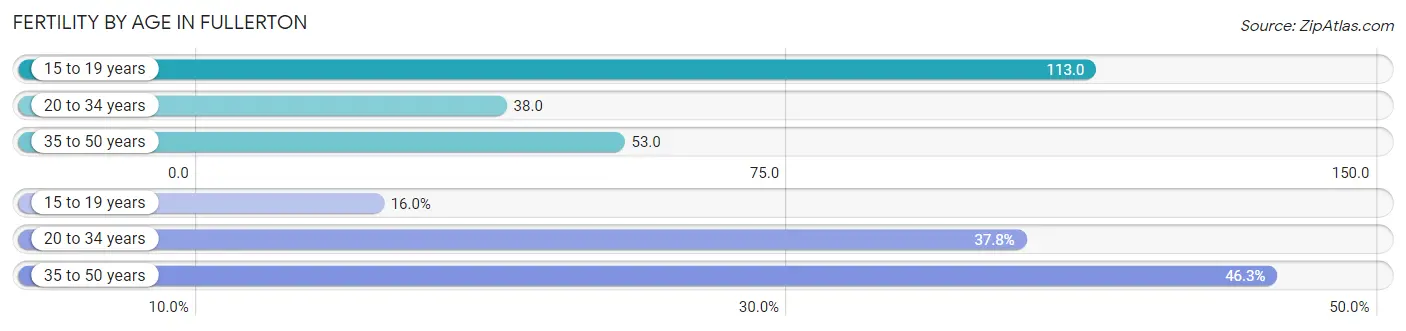
| Age Bracket | Women with Births | Births / 1,000 Women |
| 15 to 19 years | 30 (16.0%) | 113.0 |
| 20 to 34 years | 71 (37.8%) | 38.0 |
| 35 to 50 years | 87 (46.3%) | 53.0 |
| Total | 188 (100.0%) | 50.0 |
Fertility by Age by Marriage Status in Fullerton
46.3% of women with births (188) in Fullerton are married. The highest percentage of unmarried women with births falls into 15 to 19 years age bracket with 100.0% of them unmarried at the time of birth, while the lowest percentage of unmarried women with births belong to 35 to 50 years age bracket with 0.0% of them unmarried.
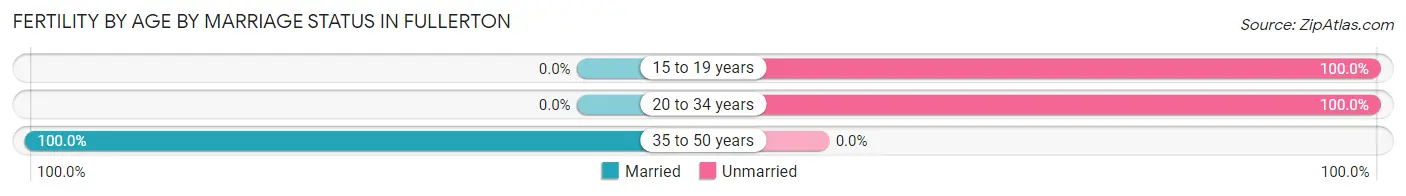
| Age Bracket | Married | Unmarried |
| 15 to 19 years | 0 (0.0%) | 30 (100.0%) |
| 20 to 34 years | 0 (0.0%) | 71 (100.0%) |
| 35 to 50 years | 87 (100.0%) | 0 (0.0%) |
| Total | 87 (46.3%) | 101 (53.7%) |
Fertility by Education in Fullerton
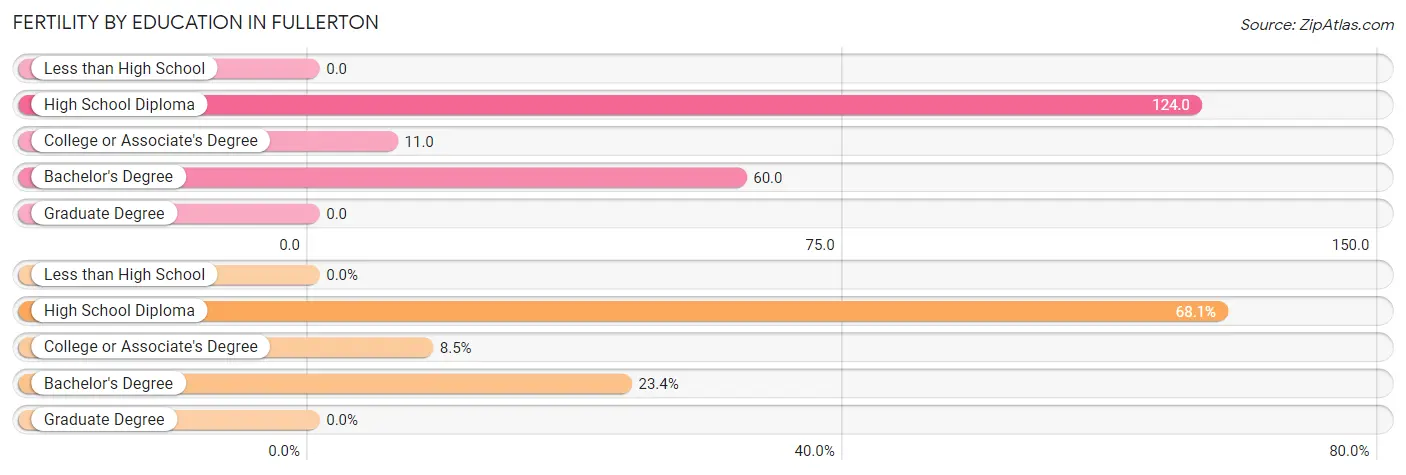
| Educational Attainment | Women with Births | Births / 1,000 Women |
| Less than High School | 0 (0.0%) | 0.0 |
| High School Diploma | 128 (68.1%) | 124.0 |
| College or Associate's Degree | 16 (8.5%) | 11.0 |
| Bachelor's Degree | 44 (23.4%) | 60.0 |
| Graduate Degree | 0 (0.0%) | 0.0 |
| Total | 188 (100.0%) | 50.0 |
Fertility by Education by Marriage Status in Fullerton
53.7% of women with births in Fullerton are unmarried. Women with the educational attainment of college or associate's degree are most likely to be married with 100.0% of them married at childbirth, while women with the educational attainment of high school diploma are least likely to be married with 78.9% of them unmarried at childbirth.
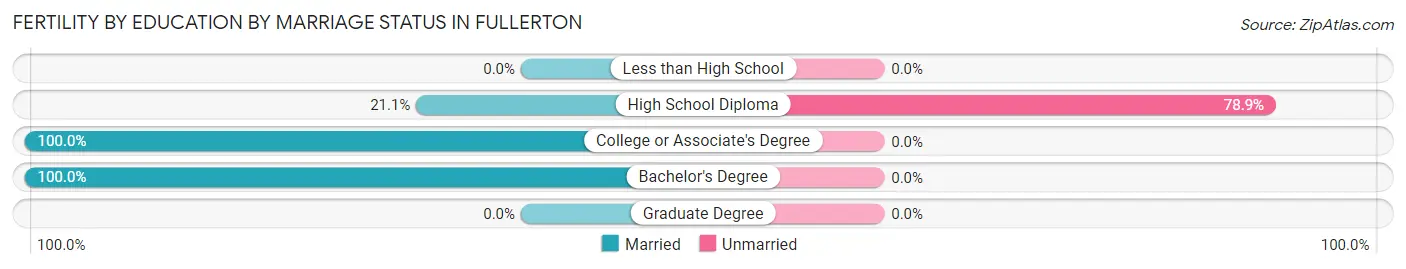
| Educational Attainment | Married | Unmarried |
| Less than High School | 0 (0.0%) | 0 (0.0%) |
| High School Diploma | 27 (21.1%) | 101 (78.9%) |
| College or Associate's Degree | 16 (100.0%) | 0 (0.0%) |
| Bachelor's Degree | 44 (100.0%) | 0 (0.0%) |
| Graduate Degree | 0 (0.0%) | 0 (0.0%) |
| Total | 87 (46.3%) | 101 (53.7%) |
Employment Characteristics in Fullerton
Employment by Class of Employer in Fullerton
Among the 8,954 employed individuals in Fullerton, private company employees (7,047 | 78.7%), not-for-profit organizations (778 | 8.7%), and local government employees (509 | 5.7%) make up the most common classes of employment.
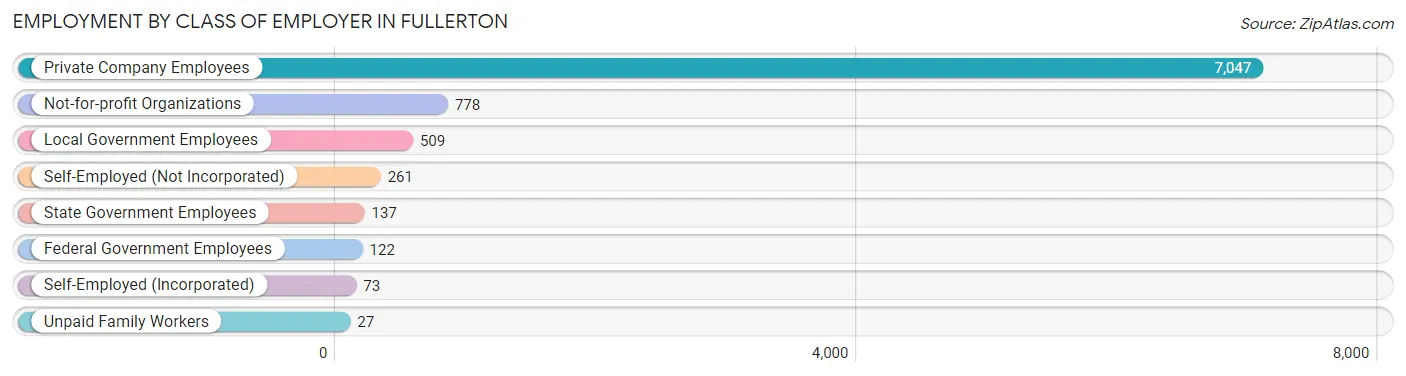
| Employer Class | # Employees | % Employees |
| Private Company Employees | 7,047 | 78.7% |
| Self-Employed (Incorporated) | 73 | 0.8% |
| Self-Employed (Not Incorporated) | 261 | 2.9% |
| Not-for-profit Organizations | 778 | 8.7% |
| Local Government Employees | 509 | 5.7% |
| State Government Employees | 137 | 1.5% |
| Federal Government Employees | 122 | 1.4% |
| Unpaid Family Workers | 27 | 0.3% |
| Total | 8,954 | 100.0% |
Employment Status by Age in Fullerton
According to the labor force statistics for Fullerton, out of the total population over 16 years of age (13,072), 73.5% or 9,608 individuals are in the labor force, with 4.6% or 442 of them unemployed. The age group with the highest labor force participation rate is 30 to 34 years, with 95.8% or 1,603 individuals in the labor force. Within the labor force, the 16 to 19 years age range has the highest percentage of unemployed individuals, with 24.0% or 143 of them being unemployed.
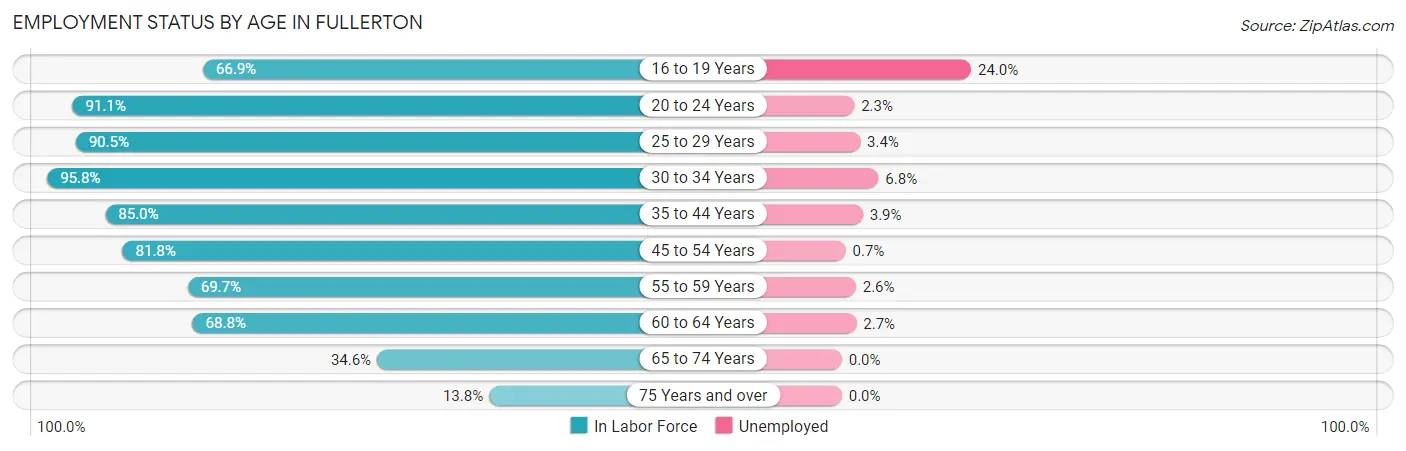
| Age Bracket | In Labor Force | Unemployed |
| 16 to 19 Years | 597 (66.9%) | 143 (24.0%) |
| 20 to 24 Years | 877 (91.1%) | 20 (2.3%) |
| 25 to 29 Years | 1,367 (90.5%) | 46 (3.4%) |
| 30 to 34 Years | 1,603 (95.8%) | 109 (6.8%) |
| 35 to 44 Years | 2,007 (85.0%) | 78 (3.9%) |
| 45 to 54 Years | 1,314 (81.8%) | 9 (0.7%) |
| 55 to 59 Years | 538 (69.7%) | 14 (2.6%) |
| 60 to 64 Years | 774 (68.8%) | 21 (2.7%) |
| 65 to 74 Years | 394 (34.6%) | 0 (0.0%) |
| 75 Years and over | 142 (13.8%) | 0 (0.0%) |
| Total | 9,608 (73.5%) | 442 (4.6%) |
Employment Status by Educational Attainment in Fullerton
According to labor force statistics for Fullerton, 84.0% of individuals (7,599) out of the total population between 25 and 64 years of age (9,047) are in the labor force, with 3.6% or 274 of them being unemployed. The group with the highest labor force participation rate are those with the educational attainment of college / associate degree, with 91.6% or 2,573 individuals in the labor force. Within the labor force, individuals with high school diploma education have the highest percentage of unemployment, with 5.8% or 165 of them being unemployed.
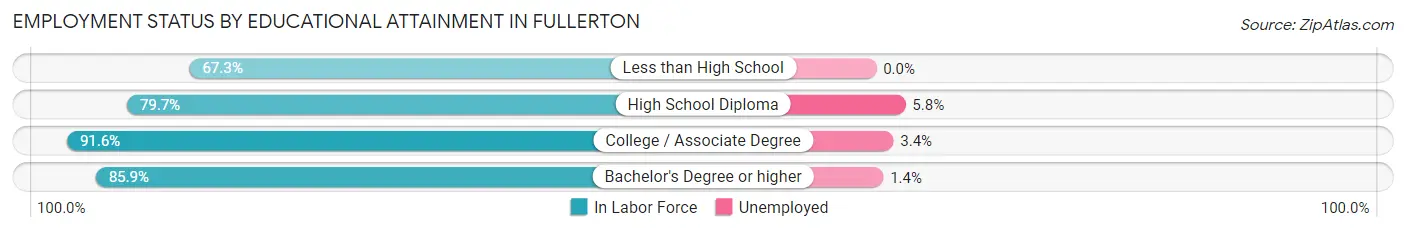
| Educational Attainment | In Labor Force | Unemployed |
| Less than High School | 399 (67.3%) | 0 (0.0%) |
| High School Diploma | 2,846 (79.7%) | 207 (5.8%) |
| College / Associate Degree | 2,573 (91.6%) | 96 (3.4%) |
| Bachelor's Degree or higher | 1,782 (85.9%) | 29 (1.4%) |
| Total | 7,599 (84.0%) | 326 (3.6%) |
Employment Occupations by Sex in Fullerton
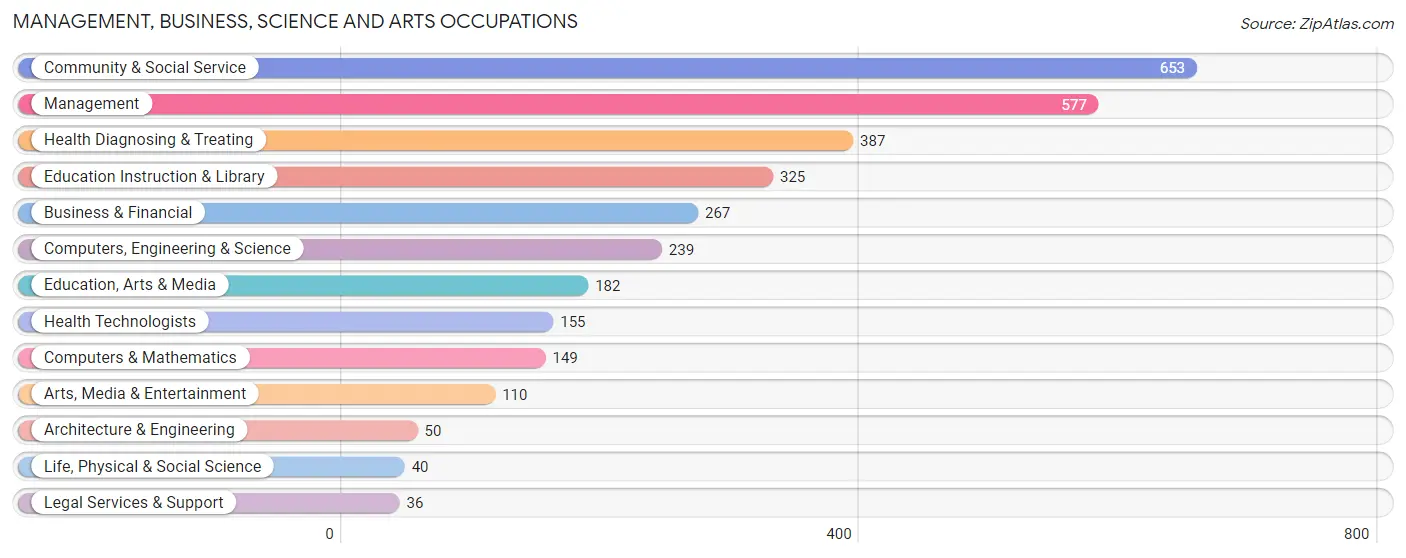
Management, Business, Science and Arts Occupations
The most common Management, Business, Science and Arts occupations in Fullerton are Community & Social Service (653 | 7.1%), Management (577 | 6.3%), Health Diagnosing & Treating (387 | 4.2%), Education Instruction & Library (325 | 3.5%), and Business & Financial (267 | 2.9%).
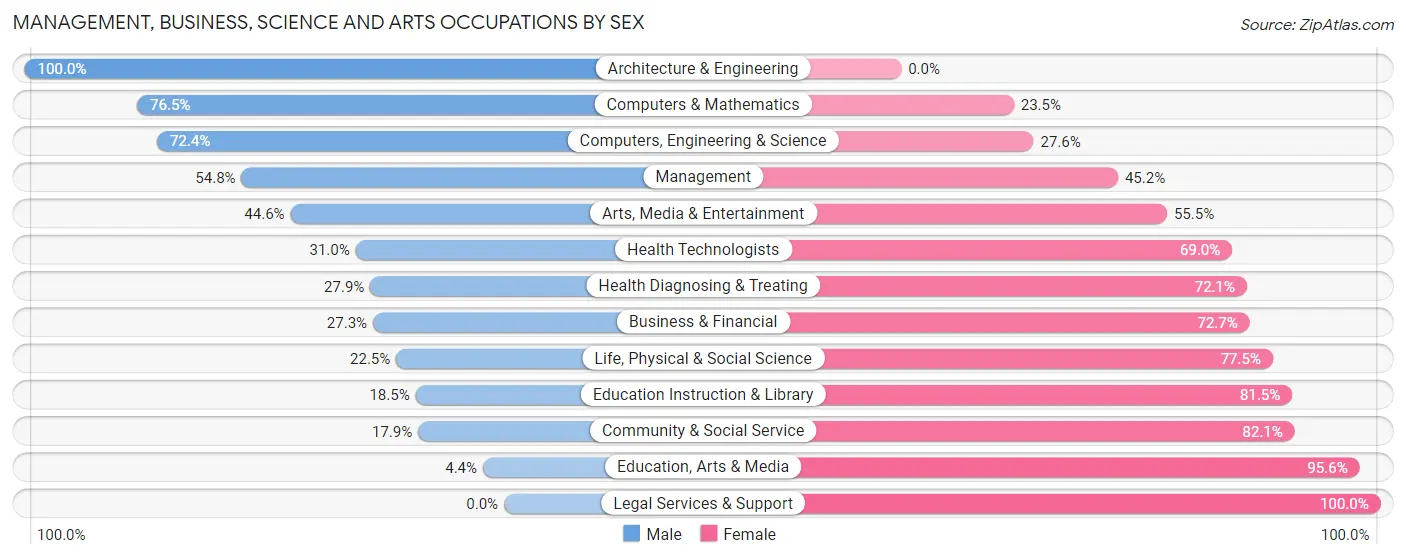
Management, Business, Science and Arts Occupations by Sex
Within the Management, Business, Science and Arts occupations in Fullerton, the most male-oriented occupations are Architecture & Engineering (100.0%), Computers & Mathematics (76.5%), and Computers, Engineering & Science (72.4%), while the most female-oriented occupations are Legal Services & Support (100.0%), Education, Arts & Media (95.6%), and Community & Social Service (82.1%).
| Occupation | Male | Female |
| Management | 316 (54.8%) | 261 (45.2%) |
| Business & Financial | 73 (27.3%) | 194 (72.7%) |
| Computers, Engineering & Science | 173 (72.4%) | 66 (27.6%) |
| Computers & Mathematics | 114 (76.5%) | 35 (23.5%) |
| Architecture & Engineering | 50 (100.0%) | 0 (0.0%) |
| Life, Physical & Social Science | 9 (22.5%) | 31 (77.5%) |
| Community & Social Service | 117 (17.9%) | 536 (82.1%) |
| Education, Arts & Media | 8 (4.4%) | 174 (95.6%) |
| Legal Services & Support | 0 (0.0%) | 36 (100.0%) |
| Education Instruction & Library | 60 (18.5%) | 265 (81.5%) |
| Arts, Media & Entertainment | 49 (44.6%) | 61 (55.4%) |
| Health Diagnosing & Treating | 108 (27.9%) | 279 (72.1%) |
| Health Technologists | 48 (31.0%) | 107 (69.0%) |
| Total (Category) | 787 (37.1%) | 1,336 (62.9%) |
| Total (Overall) | 5,013 (54.8%) | 4,140 (45.2%) |
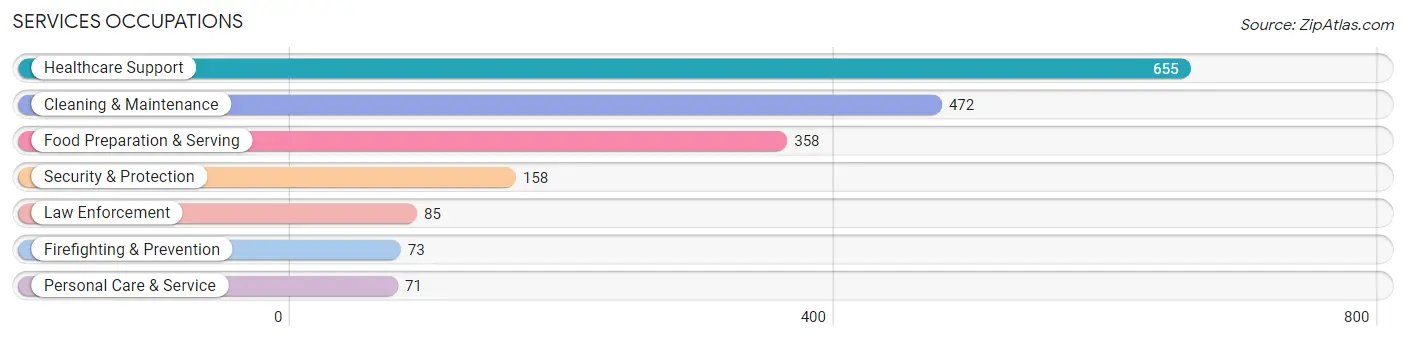
Services Occupations
The most common Services occupations in Fullerton are Healthcare Support (655 | 7.2%), Cleaning & Maintenance (472 | 5.2%), Food Preparation & Serving (358 | 3.9%), Security & Protection (158 | 1.7%), and Law Enforcement (85 | 0.9%).
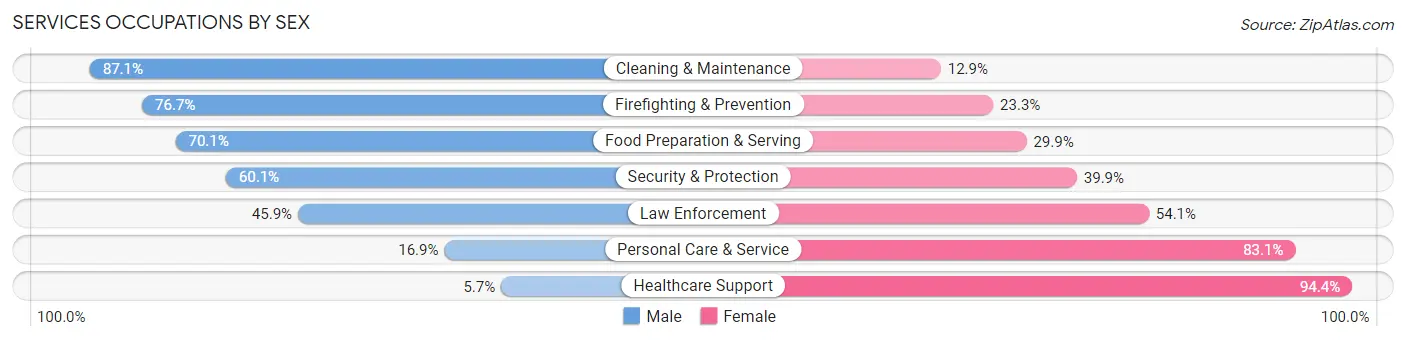
Services Occupations by Sex
Within the Services occupations in Fullerton, the most male-oriented occupations are Cleaning & Maintenance (87.1%), Firefighting & Prevention (76.7%), and Food Preparation & Serving (70.1%), while the most female-oriented occupations are Healthcare Support (94.4%), Personal Care & Service (83.1%), and Law Enforcement (54.1%).
| Occupation | Male | Female |
| Healthcare Support | 37 (5.7%) | 618 (94.4%) |
| Security & Protection | 95 (60.1%) | 63 (39.9%) |
| Firefighting & Prevention | 56 (76.7%) | 17 (23.3%) |
| Law Enforcement | 39 (45.9%) | 46 (54.1%) |
| Food Preparation & Serving | 251 (70.1%) | 107 (29.9%) |
| Cleaning & Maintenance | 411 (87.1%) | 61 (12.9%) |
| Personal Care & Service | 12 (16.9%) | 59 (83.1%) |
| Total (Category) | 806 (47.0%) | 908 (53.0%) |
| Total (Overall) | 5,013 (54.8%) | 4,140 (45.2%) |
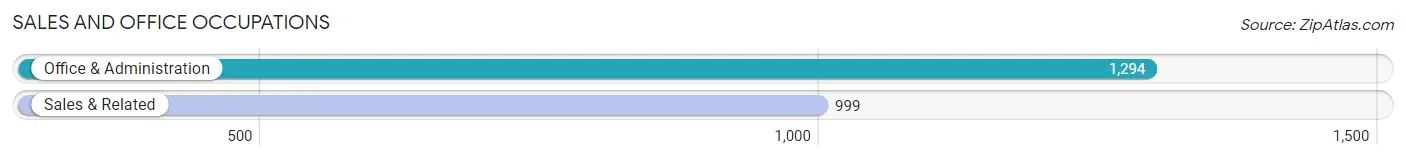
Sales and Office Occupations
The most common Sales and Office occupations in Fullerton are Office & Administration (1,294 | 14.1%), and Sales & Related (999 | 10.9%).
Sales and Office Occupations by Sex
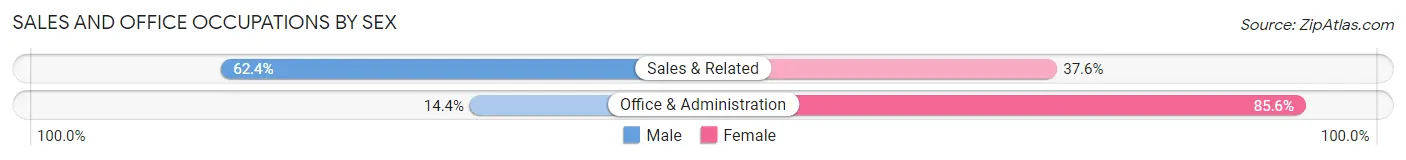
| Occupation | Male | Female |
| Sales & Related | 623 (62.4%) | 376 (37.6%) |
| Office & Administration | 186 (14.4%) | 1,108 (85.6%) |
| Total (Category) | 809 (35.3%) | 1,484 (64.7%) |
| Total (Overall) | 5,013 (54.8%) | 4,140 (45.2%) |
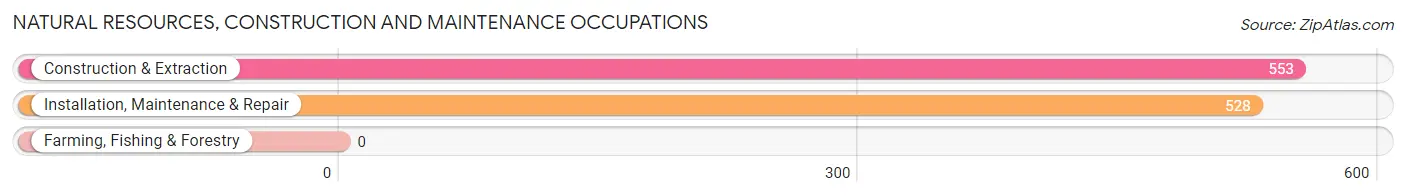
Natural Resources, Construction and Maintenance Occupations
The most common Natural Resources, Construction and Maintenance occupations in Fullerton are Construction & Extraction (553 | 6.0%), and Installation, Maintenance & Repair (528 | 5.8%).
Natural Resources, Construction and Maintenance Occupations by Sex
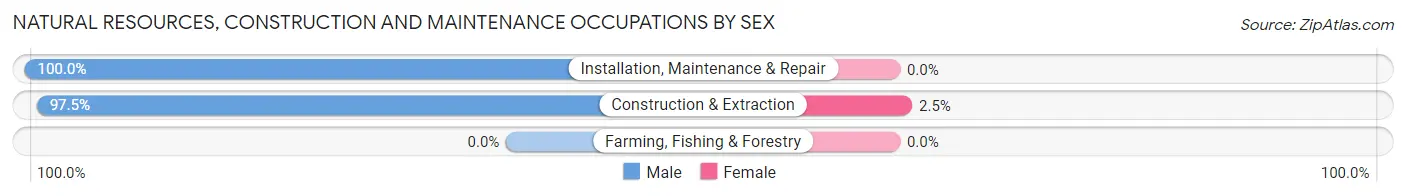
| Occupation | Male | Female |
| Farming, Fishing & Forestry | 0 (0.0%) | 0 (0.0%) |
| Construction & Extraction | 539 (97.5%) | 14 (2.5%) |
| Installation, Maintenance & Repair | 528 (100.0%) | 0 (0.0%) |
| Total (Category) | 1,067 (98.7%) | 14 (1.3%) |
| Total (Overall) | 5,013 (54.8%) | 4,140 (45.2%) |
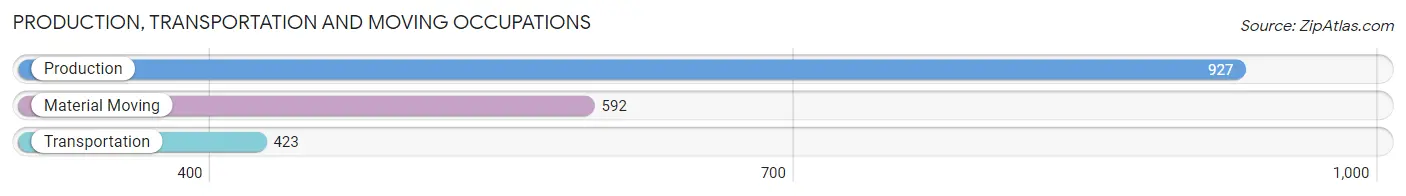
Production, Transportation and Moving Occupations
The most common Production, Transportation and Moving occupations in Fullerton are Production (927 | 10.1%), Material Moving (592 | 6.5%), and Transportation (423 | 4.6%).
Production, Transportation and Moving Occupations by Sex
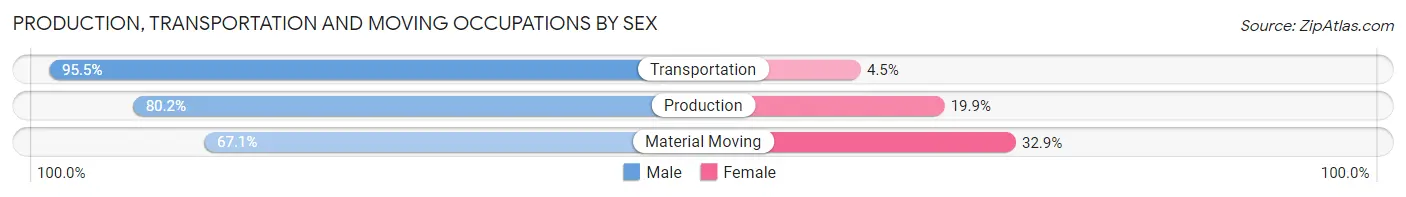
| Occupation | Male | Female |
| Production | 743 (80.1%) | 184 (19.9%) |
| Transportation | 404 (95.5%) | 19 (4.5%) |
| Material Moving | 397 (67.1%) | 195 (32.9%) |
| Total (Category) | 1,544 (79.5%) | 398 (20.5%) |
| Total (Overall) | 5,013 (54.8%) | 4,140 (45.2%) |
Employment Industries by Sex in Fullerton
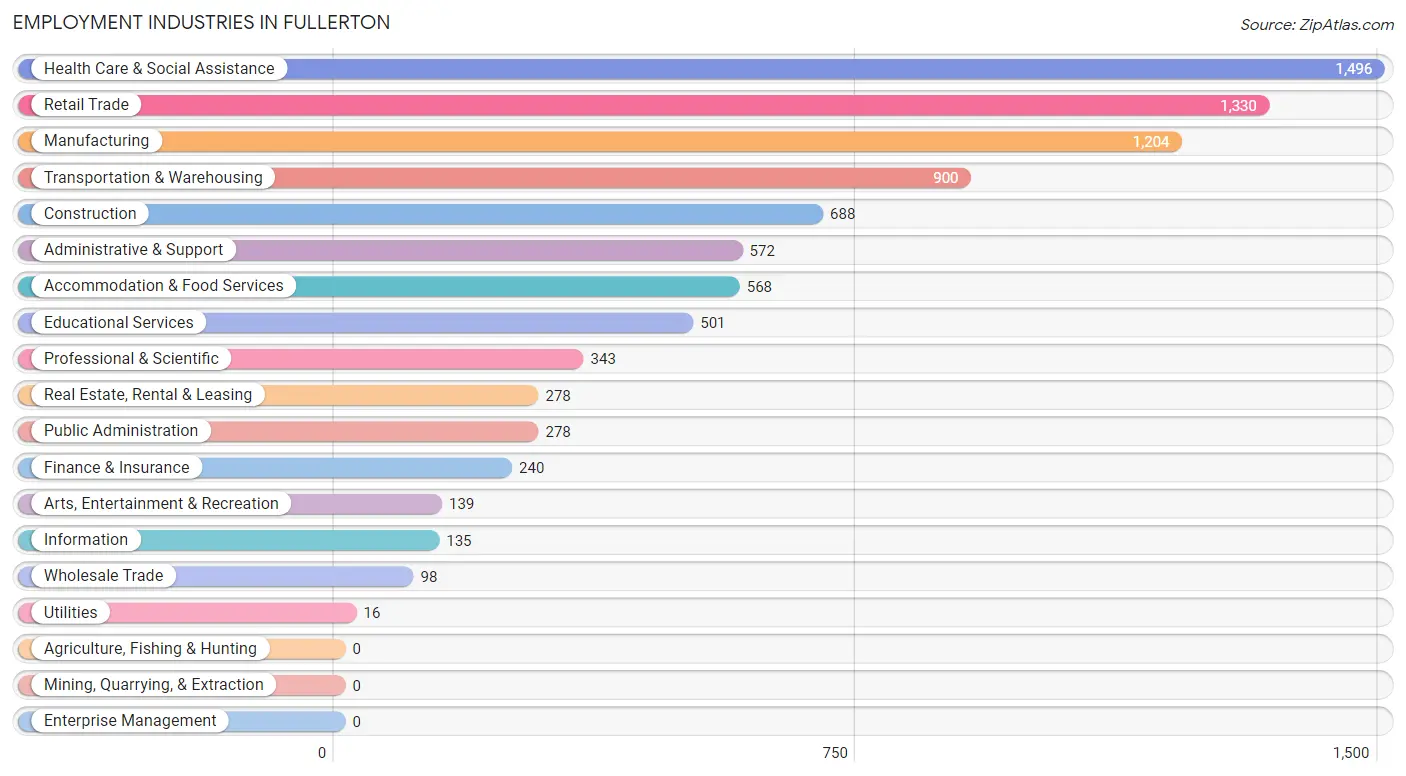
Employment Industries in Fullerton
The major employment industries in Fullerton include Health Care & Social Assistance (1,496 | 16.3%), Retail Trade (1,330 | 14.5%), Manufacturing (1,204 | 13.2%), Transportation & Warehousing (900 | 9.8%), and Construction (688 | 7.5%).
Employment Industries by Sex in Fullerton
The Fullerton industries that see more men than women are Utilities (100.0%), Real Estate, Rental & Leasing (88.8%), and Construction (87.1%), whereas the industries that tend to have a higher number of women are Health Care & Social Assistance (89.5%), Educational Services (80.4%), and Public Administration (67.6%).
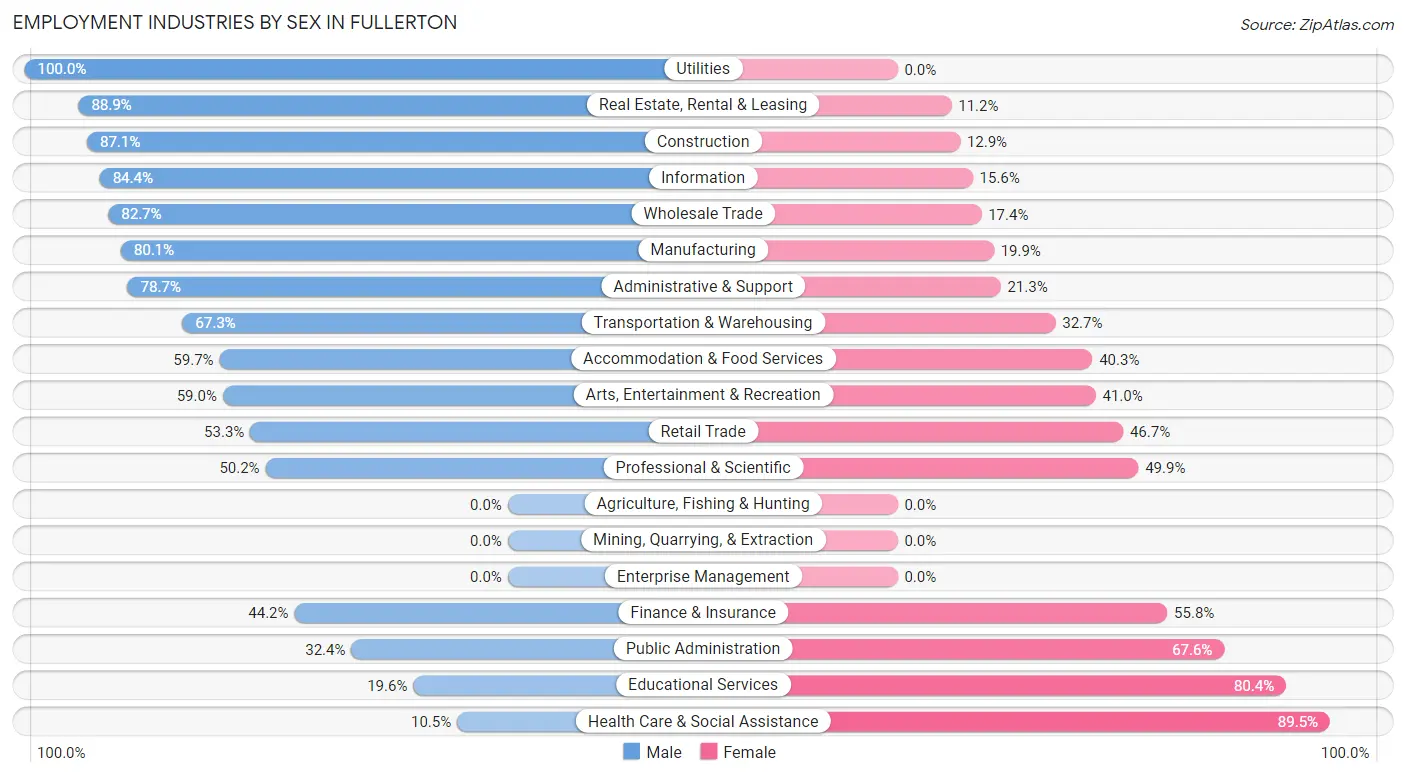
| Industry | Male | Female |
| Agriculture, Fishing & Hunting | 0 (0.0%) | 0 (0.0%) |
| Mining, Quarrying, & Extraction | 0 (0.0%) | 0 (0.0%) |
| Construction | 599 (87.1%) | 89 (12.9%) |
| Manufacturing | 964 (80.1%) | 240 (19.9%) |
| Wholesale Trade | 81 (82.7%) | 17 (17.3%) |
| Retail Trade | 709 (53.3%) | 621 (46.7%) |
| Transportation & Warehousing | 606 (67.3%) | 294 (32.7%) |
| Utilities | 16 (100.0%) | 0 (0.0%) |
| Information | 114 (84.4%) | 21 (15.6%) |
| Finance & Insurance | 106 (44.2%) | 134 (55.8%) |
| Real Estate, Rental & Leasing | 247 (88.8%) | 31 (11.2%) |
| Professional & Scientific | 172 (50.1%) | 171 (49.8%) |
| Enterprise Management | 0 (0.0%) | 0 (0.0%) |
| Administrative & Support | 450 (78.7%) | 122 (21.3%) |
| Educational Services | 98 (19.6%) | 403 (80.4%) |
| Health Care & Social Assistance | 157 (10.5%) | 1,339 (89.5%) |
| Arts, Entertainment & Recreation | 82 (59.0%) | 57 (41.0%) |
| Accommodation & Food Services | 339 (59.7%) | 229 (40.3%) |
| Public Administration | 90 (32.4%) | 188 (67.6%) |
| Total | 5,013 (54.8%) | 4,140 (45.2%) |
Education in Fullerton
School Enrollment in Fullerton
The most common levels of schooling among the 3,873 students in Fullerton are high school (884 | 22.8%), college / undergraduate (830 | 21.4%), and elementary school (778 | 20.1%).
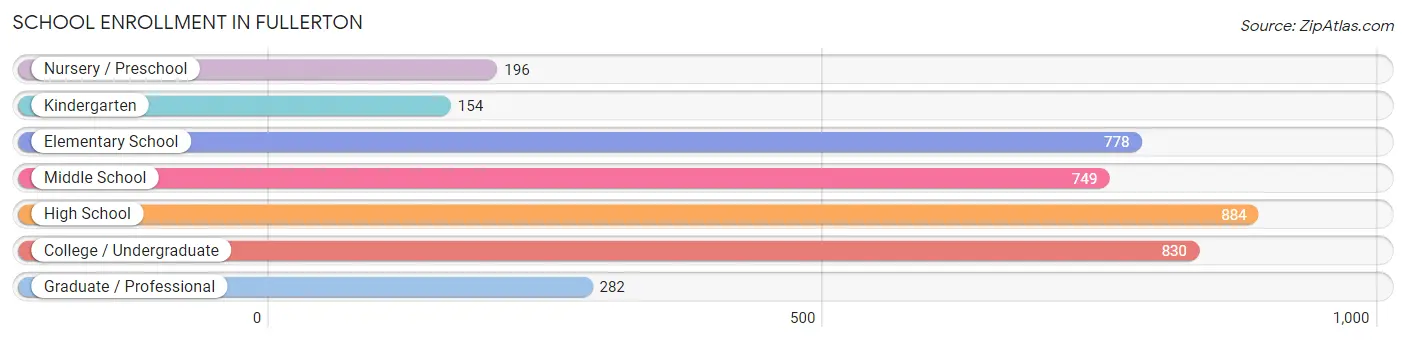
| School Level | # Students | % Students |
| Nursery / Preschool | 196 | 5.1% |
| Kindergarten | 154 | 4.0% |
| Elementary School | 778 | 20.1% |
| Middle School | 749 | 19.3% |
| High School | 884 | 22.8% |
| College / Undergraduate | 830 | 21.4% |
| Graduate / Professional | 282 | 7.3% |
| Total | 3,873 | 100.0% |
School Enrollment by Age by Funding Source in Fullerton
Out of a total of 3,873 students who are enrolled in schools in Fullerton, 577 (14.9%) attend a private institution, while the remaining 3,296 (85.1%) are enrolled in public schools. The age group of 25 to 34 year olds has the highest likelihood of being enrolled in private schools, with 267 (65.8% in the age bracket) enrolled. Conversely, the age group of 15 to 17 year olds has the lowest likelihood of being enrolled in a private school, with 638 (97.1% in the age bracket) attending a public institution.
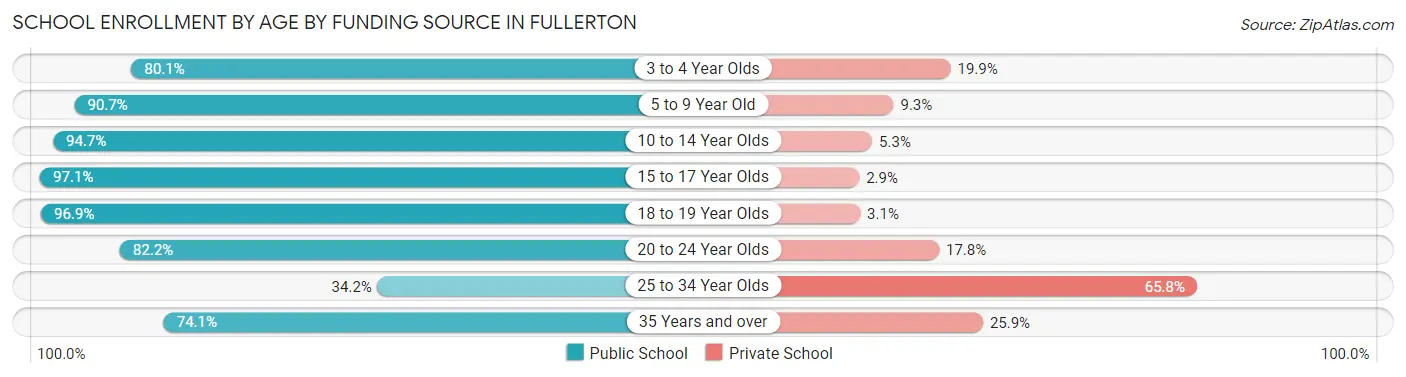
| Age Bracket | Public School | Private School |
| 3 to 4 Year Olds | 157 (80.1%) | 39 (19.9%) |
| 5 to 9 Year Old | 742 (90.7%) | 76 (9.3%) |
| 10 to 14 Year Olds | 909 (94.7%) | 51 (5.3%) |
| 15 to 17 Year Olds | 638 (97.1%) | 19 (2.9%) |
| 18 to 19 Year Olds | 284 (96.9%) | 9 (3.1%) |
| 20 to 24 Year Olds | 250 (82.2%) | 54 (17.8%) |
| 25 to 34 Year Olds | 139 (34.2%) | 267 (65.8%) |
| 35 Years and over | 177 (74.1%) | 62 (25.9%) |
| Total | 3,296 (85.1%) | 577 (14.9%) |
Educational Attainment by Field of Study in Fullerton
Business (647 | 25.4%), education (438 | 17.2%), arts & humanities (233 | 9.2%), communications (230 | 9.0%), and science & technology (195 | 7.7%) are the most common fields of study among 2,544 individuals in Fullerton who have obtained a bachelor's degree or higher.
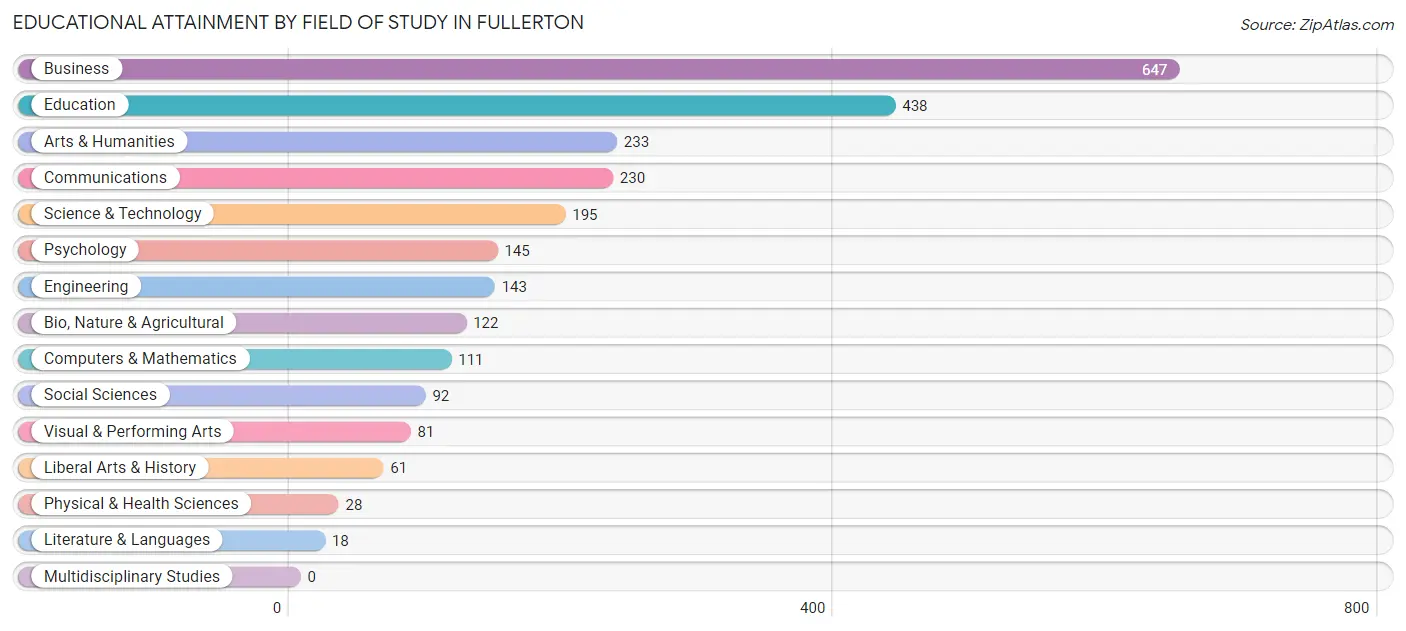
| Field of Study | # Graduates | % Graduates |
| Computers & Mathematics | 111 | 4.4% |
| Bio, Nature & Agricultural | 122 | 4.8% |
| Physical & Health Sciences | 28 | 1.1% |
| Psychology | 145 | 5.7% |
| Social Sciences | 92 | 3.6% |
| Engineering | 143 | 5.6% |
| Multidisciplinary Studies | 0 | 0.0% |
| Science & Technology | 195 | 7.7% |
| Business | 647 | 25.4% |
| Education | 438 | 17.2% |
| Literature & Languages | 18 | 0.7% |
| Liberal Arts & History | 61 | 2.4% |
| Visual & Performing Arts | 81 | 3.2% |
| Communications | 230 | 9.0% |
| Arts & Humanities | 233 | 9.2% |
| Total | 2,544 | 100.0% |
Transportation & Commute in Fullerton
Vehicle Availability by Sex in Fullerton
The most prevalent vehicle ownership categories in Fullerton are males with 2 vehicles (2,464, accounting for 49.8%) and females with 2 vehicles (1,877, making up 61.5%).
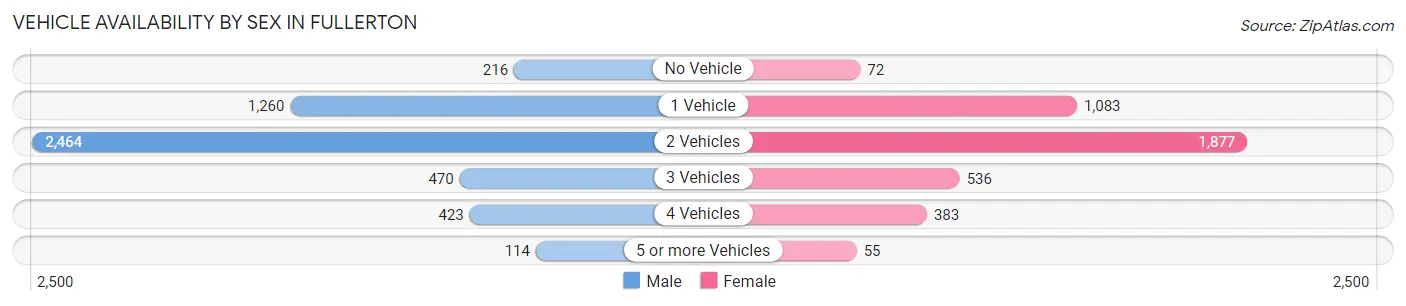
| Vehicles Available | Male | Female |
| No Vehicle | 216 (4.4%) | 72 (1.8%) |
| 1 Vehicle | 1,260 (25.5%) | 1,083 (27.0%) |
| 2 Vehicles | 2,464 (49.8%) | 1,877 (46.9%) |
| 3 Vehicles | 470 (9.5%) | 536 (13.4%) |
| 4 Vehicles | 423 (8.6%) | 383 (9.6%) |
| 5 or more Vehicles | 114 (2.3%) | 55 (1.4%) |
| Total | 4,947 (100.0%) | 4,006 (100.0%) |
Commute Time in Fullerton
The most frequently occuring commute durations in Fullerton are 20 to 24 minutes (1,887 commuters, 22.3%), 15 to 19 minutes (1,572 commuters, 18.6%), and 10 to 14 minutes (1,124 commuters, 13.3%).
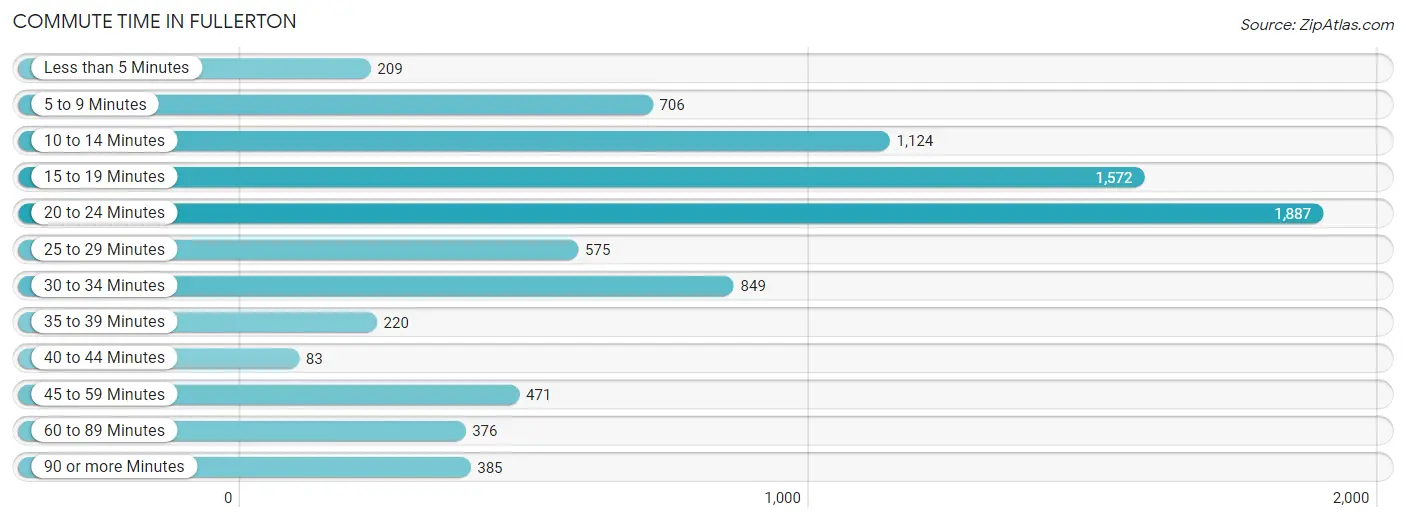
| Commute Time | # Commuters | % Commuters |
| Less than 5 Minutes | 209 | 2.5% |
| 5 to 9 Minutes | 706 | 8.4% |
| 10 to 14 Minutes | 1,124 | 13.3% |
| 15 to 19 Minutes | 1,572 | 18.6% |
| 20 to 24 Minutes | 1,887 | 22.3% |
| 25 to 29 Minutes | 575 | 6.8% |
| 30 to 34 Minutes | 849 | 10.0% |
| 35 to 39 Minutes | 220 | 2.6% |
| 40 to 44 Minutes | 83 | 1.0% |
| 45 to 59 Minutes | 471 | 5.6% |
| 60 to 89 Minutes | 376 | 4.4% |
| 90 or more Minutes | 385 | 4.5% |
Commute Time by Sex in Fullerton
The most common commute times in Fullerton are 20 to 24 minutes (1,155 commuters, 24.3%) for males and 15 to 19 minutes (944 commuters, 25.4%) for females.
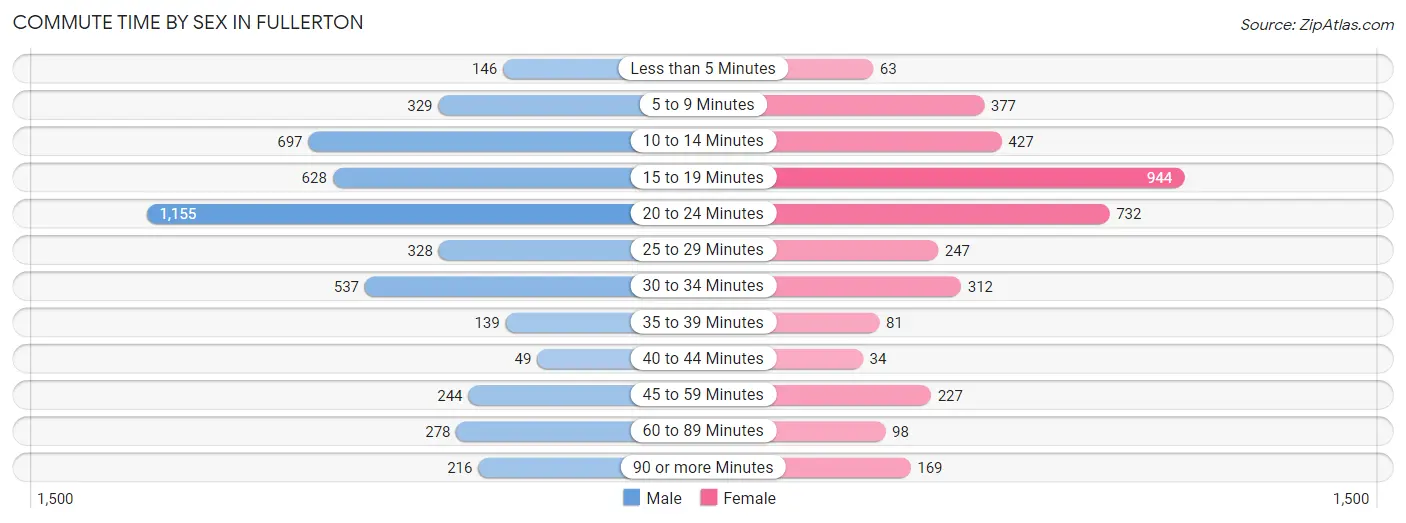
| Commute Time | Male | Female |
| Less than 5 Minutes | 146 (3.1%) | 63 (1.7%) |
| 5 to 9 Minutes | 329 (6.9%) | 377 (10.2%) |
| 10 to 14 Minutes | 697 (14.7%) | 427 (11.5%) |
| 15 to 19 Minutes | 628 (13.2%) | 944 (25.4%) |
| 20 to 24 Minutes | 1,155 (24.3%) | 732 (19.7%) |
| 25 to 29 Minutes | 328 (6.9%) | 247 (6.7%) |
| 30 to 34 Minutes | 537 (11.3%) | 312 (8.4%) |
| 35 to 39 Minutes | 139 (2.9%) | 81 (2.2%) |
| 40 to 44 Minutes | 49 (1.0%) | 34 (0.9%) |
| 45 to 59 Minutes | 244 (5.1%) | 227 (6.1%) |
| 60 to 89 Minutes | 278 (5.9%) | 98 (2.6%) |
| 90 or more Minutes | 216 (4.5%) | 169 (4.5%) |
Time of Departure to Work by Sex in Fullerton
The most frequent times of departure to work in Fullerton are 4:00 PM to 11:59 PM (723, 15.2%) for males and 8:00 AM to 8:29 AM (569, 15.3%) for females.
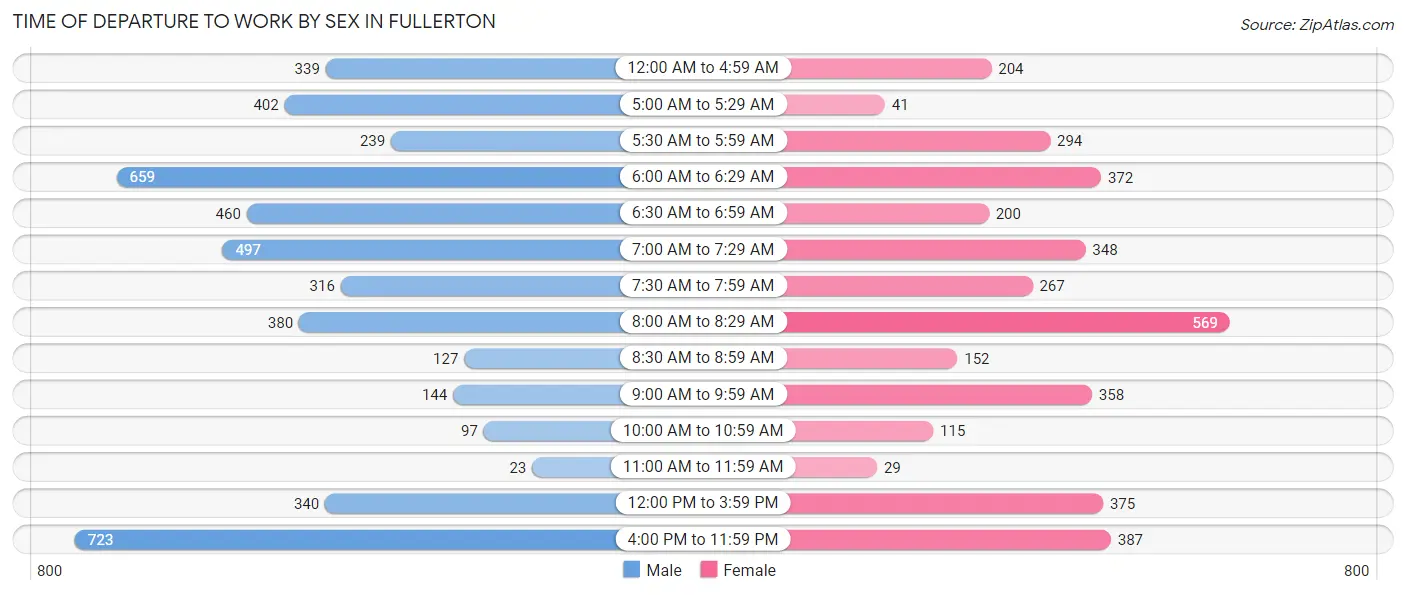
| Time of Departure | Male | Female |
| 12:00 AM to 4:59 AM | 339 (7.1%) | 204 (5.5%) |
| 5:00 AM to 5:29 AM | 402 (8.5%) | 41 (1.1%) |
| 5:30 AM to 5:59 AM | 239 (5.0%) | 294 (7.9%) |
| 6:00 AM to 6:29 AM | 659 (13.9%) | 372 (10.0%) |
| 6:30 AM to 6:59 AM | 460 (9.7%) | 200 (5.4%) |
| 7:00 AM to 7:29 AM | 497 (10.5%) | 348 (9.4%) |
| 7:30 AM to 7:59 AM | 316 (6.7%) | 267 (7.2%) |
| 8:00 AM to 8:29 AM | 380 (8.0%) | 569 (15.3%) |
| 8:30 AM to 8:59 AM | 127 (2.7%) | 152 (4.1%) |
| 9:00 AM to 9:59 AM | 144 (3.0%) | 358 (9.7%) |
| 10:00 AM to 10:59 AM | 97 (2.0%) | 115 (3.1%) |
| 11:00 AM to 11:59 AM | 23 (0.5%) | 29 (0.8%) |
| 12:00 PM to 3:59 PM | 340 (7.2%) | 375 (10.1%) |
| 4:00 PM to 11:59 PM | 723 (15.2%) | 387 (10.4%) |
| Total | 4,746 (100.0%) | 3,711 (100.0%) |
Housing Occupancy in Fullerton
Occupancy by Ownership in Fullerton
Of the total 6,474 dwellings in Fullerton, owner-occupied units account for 3,355 (51.8%), while renter-occupied units make up 3,119 (48.2%).
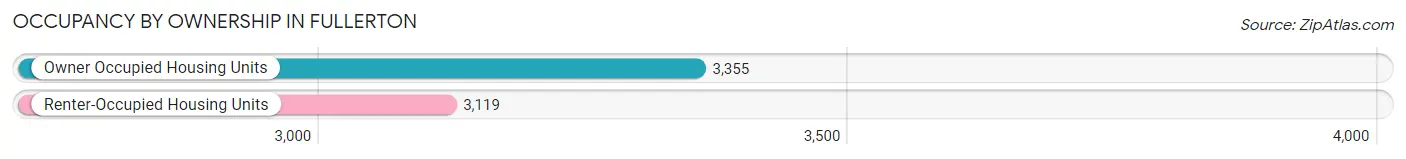
| Occupancy | # Housing Units | % Housing Units |
| Owner Occupied Housing Units | 3,355 | 51.8% |
| Renter-Occupied Housing Units | 3,119 | 48.2% |
| Total Occupied Housing Units | 6,474 | 100.0% |
Occupancy by Household Size in Fullerton
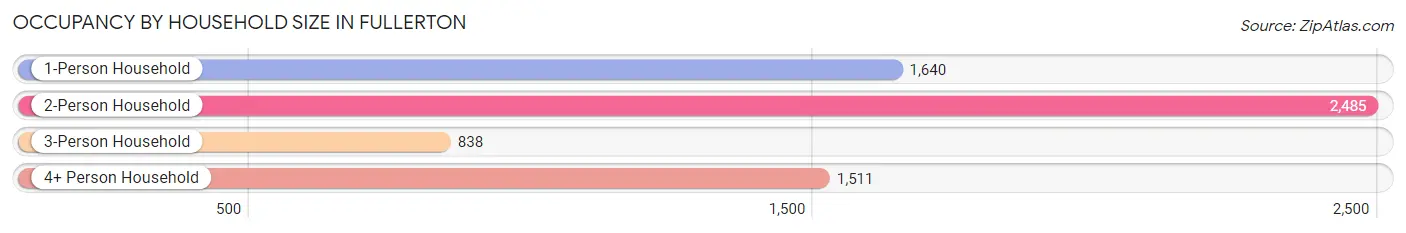
| Household Size | # Housing Units | % Housing Units |
| 1-Person Household | 1,640 | 25.3% |
| 2-Person Household | 2,485 | 38.4% |
| 3-Person Household | 838 | 12.9% |
| 4+ Person Household | 1,511 | 23.3% |
| Total Housing Units | 6,474 | 100.0% |
Occupancy by Ownership by Household Size in Fullerton
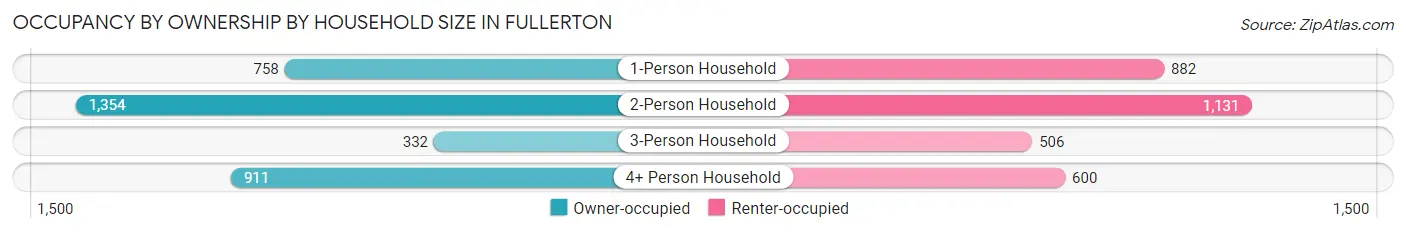
| Household Size | Owner-occupied | Renter-occupied |
| 1-Person Household | 758 (46.2%) | 882 (53.8%) |
| 2-Person Household | 1,354 (54.5%) | 1,131 (45.5%) |
| 3-Person Household | 332 (39.6%) | 506 (60.4%) |
| 4+ Person Household | 911 (60.3%) | 600 (39.7%) |
| Total Housing Units | 3,355 (51.8%) | 3,119 (48.2%) |
Occupancy by Educational Attainment in Fullerton
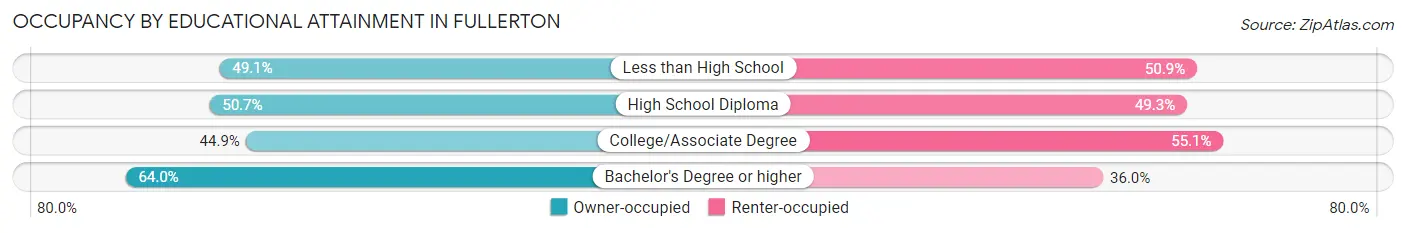
| Household Size | Owner-occupied | Renter-occupied |
| Less than High School | 164 (49.1%) | 170 (50.9%) |
| High School Diploma | 1,301 (50.7%) | 1,265 (49.3%) |
| College/Associate Degree | 937 (44.9%) | 1,148 (55.1%) |
| Bachelor's Degree or higher | 953 (64.0%) | 536 (36.0%) |
Occupancy by Age of Householder in Fullerton
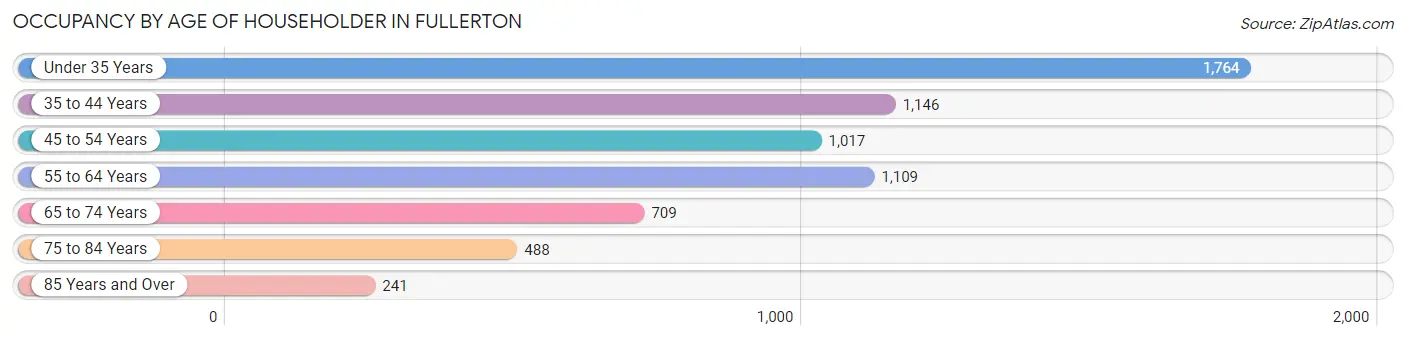
| Age Bracket | # Households | % Households |
| Under 35 Years | 1,764 | 27.3% |
| 35 to 44 Years | 1,146 | 17.7% |
| 45 to 54 Years | 1,017 | 15.7% |
| 55 to 64 Years | 1,109 | 17.1% |
| 65 to 74 Years | 709 | 11.0% |
| 75 to 84 Years | 488 | 7.5% |
| 85 Years and Over | 241 | 3.7% |
| Total | 6,474 | 100.0% |
Housing Finances in Fullerton
Median Income by Occupancy in Fullerton
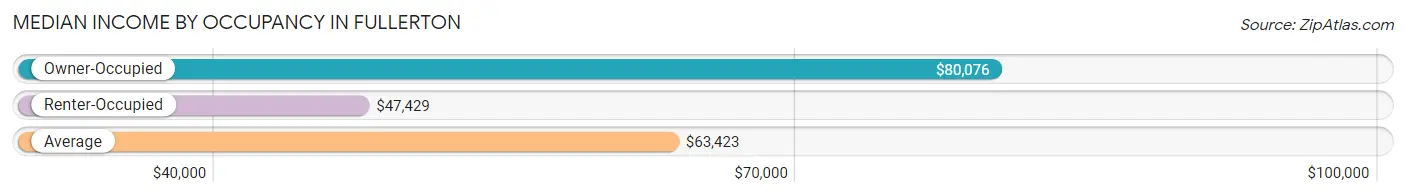
| Occupancy Type | # Households | Median Income |
| Owner-Occupied | 3,355 (51.8%) | $80,076 |
| Renter-Occupied | 3,119 (48.2%) | $47,429 |
| Average | 6,474 (100.0%) | $63,423 |
Occupancy by Householder Income Bracket in Fullerton
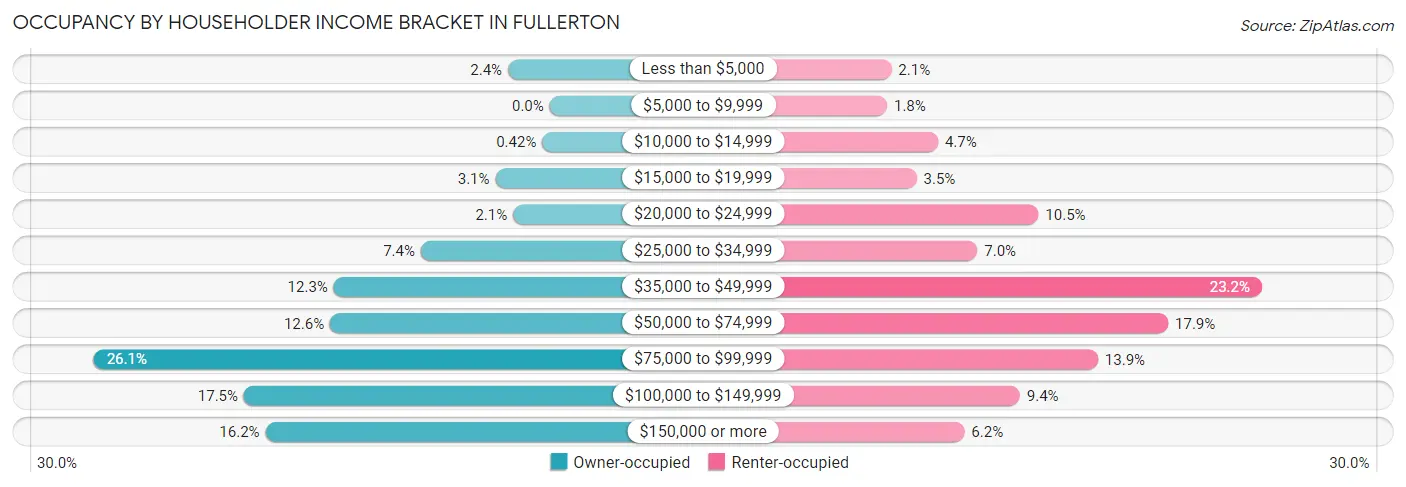
| Income Bracket | Owner-occupied | Renter-occupied |
| Less than $5,000 | 80 (2.4%) | 64 (2.1%) |
| $5,000 to $9,999 | 0 (0.0%) | 56 (1.8%) |
| $10,000 to $14,999 | 14 (0.4%) | 147 (4.7%) |
| $15,000 to $19,999 | 104 (3.1%) | 109 (3.5%) |
| $20,000 to $24,999 | 70 (2.1%) | 326 (10.4%) |
| $25,000 to $34,999 | 247 (7.4%) | 217 (7.0%) |
| $35,000 to $49,999 | 414 (12.3%) | 724 (23.2%) |
| $50,000 to $74,999 | 421 (12.6%) | 557 (17.9%) |
| $75,000 to $99,999 | 874 (26.1%) | 432 (13.9%) |
| $100,000 to $149,999 | 586 (17.5%) | 293 (9.4%) |
| $150,000 or more | 545 (16.2%) | 194 (6.2%) |
| Total | 3,355 (100.0%) | 3,119 (100.0%) |
Monthly Housing Cost Tiers in Fullerton
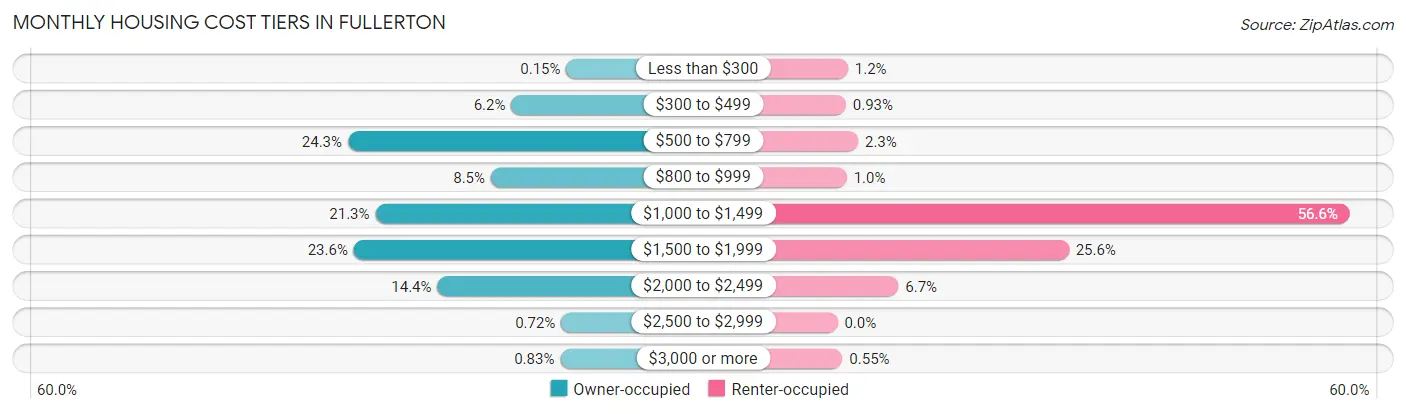
| Monthly Cost | Owner-occupied | Renter-occupied |
| Less than $300 | 5 (0.2%) | 36 (1.1%) |
| $300 to $499 | 209 (6.2%) | 29 (0.9%) |
| $500 to $799 | 815 (24.3%) | 71 (2.3%) |
| $800 to $999 | 285 (8.5%) | 32 (1.0%) |
| $1,000 to $1,499 | 713 (21.2%) | 1,765 (56.6%) |
| $1,500 to $1,999 | 793 (23.6%) | 797 (25.6%) |
| $2,000 to $2,499 | 483 (14.4%) | 210 (6.7%) |
| $2,500 to $2,999 | 24 (0.7%) | 0 (0.0%) |
| $3,000 or more | 28 (0.8%) | 17 (0.5%) |
| Total | 3,355 (100.0%) | 3,119 (100.0%) |
Physical Housing Characteristics in Fullerton
Housing Structures in Fullerton
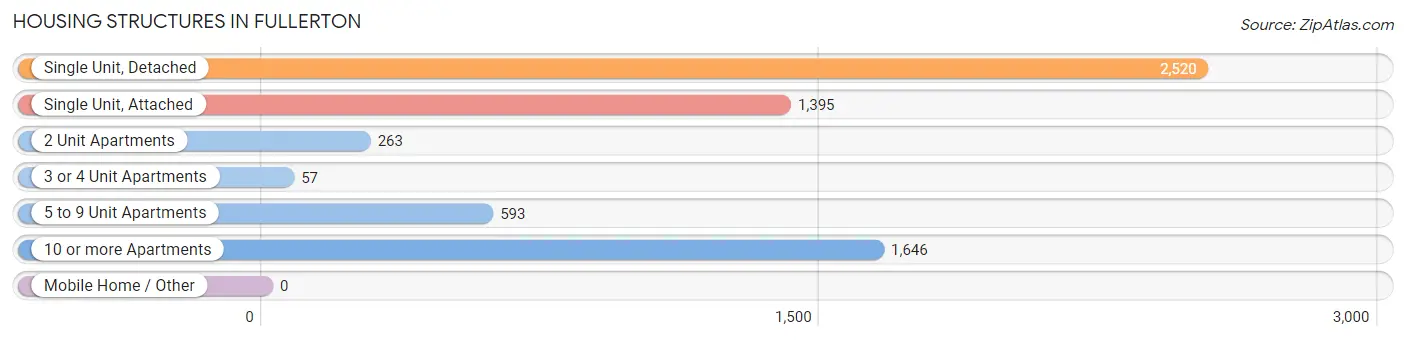
| Structure Type | # Housing Units | % Housing Units |
| Single Unit, Detached | 2,520 | 38.9% |
| Single Unit, Attached | 1,395 | 21.5% |
| 2 Unit Apartments | 263 | 4.1% |
| 3 or 4 Unit Apartments | 57 | 0.9% |
| 5 to 9 Unit Apartments | 593 | 9.2% |
| 10 or more Apartments | 1,646 | 25.4% |
| Mobile Home / Other | 0 | 0.0% |
| Total | 6,474 | 100.0% |
Housing Structures by Occupancy in Fullerton
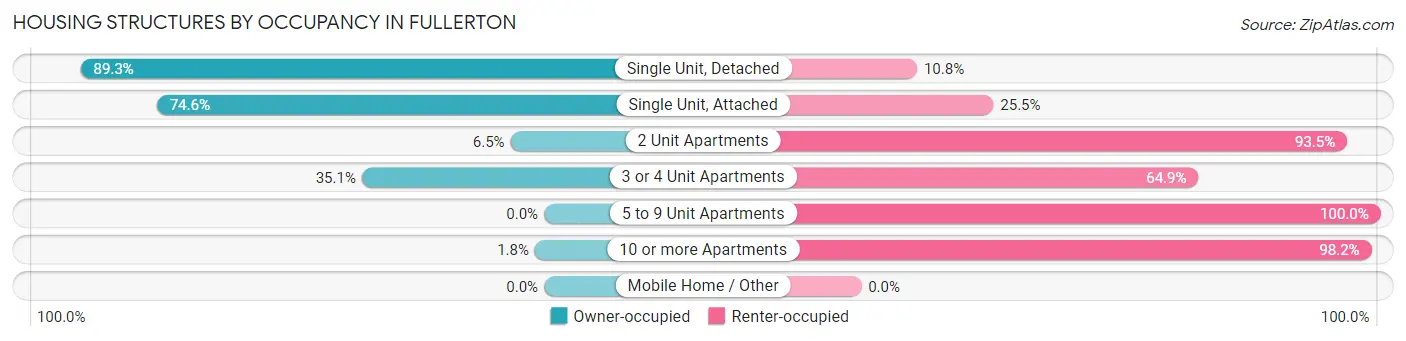
| Structure Type | Owner-occupied | Renter-occupied |
| Single Unit, Detached | 2,249 (89.2%) | 271 (10.7%) |
| Single Unit, Attached | 1,040 (74.6%) | 355 (25.5%) |
| 2 Unit Apartments | 17 (6.5%) | 246 (93.5%) |
| 3 or 4 Unit Apartments | 20 (35.1%) | 37 (64.9%) |
| 5 to 9 Unit Apartments | 0 (0.0%) | 593 (100.0%) |
| 10 or more Apartments | 29 (1.8%) | 1,617 (98.2%) |
| Mobile Home / Other | 0 (0.0%) | 0 (0.0%) |
| Total | 3,355 (51.8%) | 3,119 (48.2%) |
Housing Structures by Number of Rooms in Fullerton
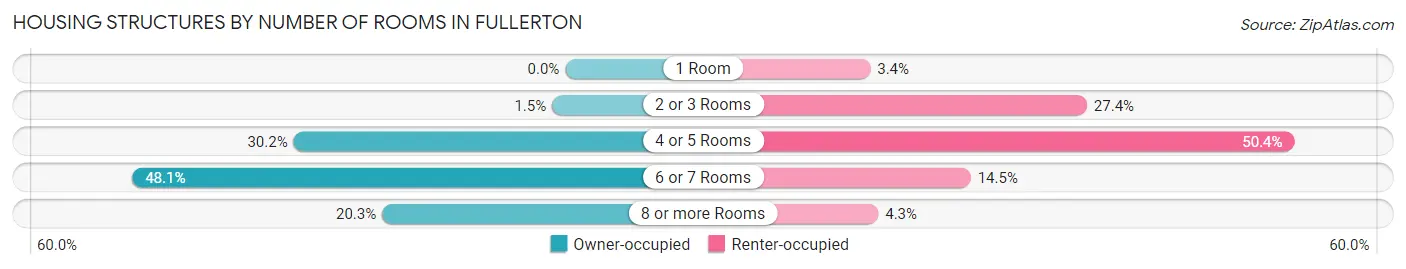
| Number of Rooms | Owner-occupied | Renter-occupied |
| 1 Room | 0 (0.0%) | 105 (3.4%) |
| 2 or 3 Rooms | 49 (1.5%) | 855 (27.4%) |
| 4 or 5 Rooms | 1,012 (30.2%) | 1,573 (50.4%) |
| 6 or 7 Rooms | 1,612 (48.0%) | 453 (14.5%) |
| 8 or more Rooms | 682 (20.3%) | 133 (4.3%) |
| Total | 3,355 (100.0%) | 3,119 (100.0%) |
Housing Structure by Heating Type in Fullerton
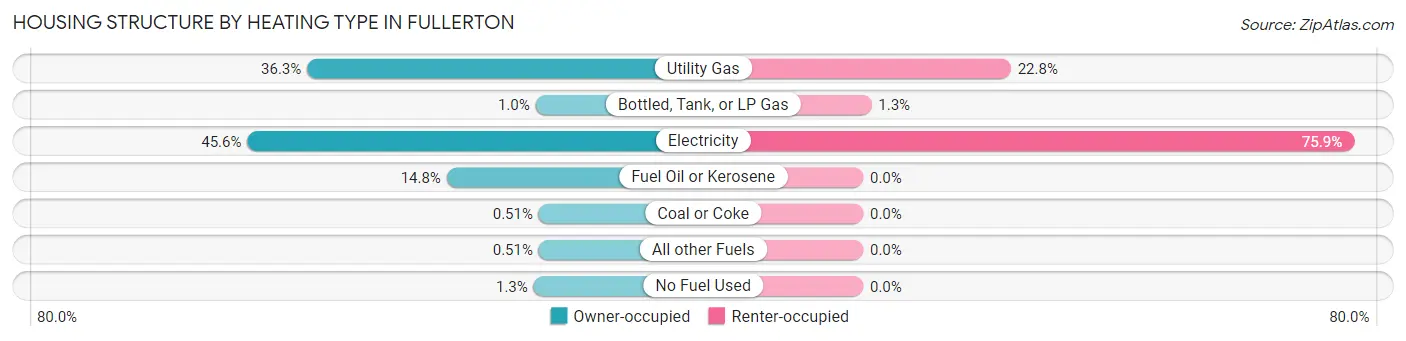
| Heating Type | Owner-occupied | Renter-occupied |
| Utility Gas | 1,219 (36.3%) | 712 (22.8%) |
| Bottled, Tank, or LP Gas | 34 (1.0%) | 40 (1.3%) |
| Electricity | 1,529 (45.6%) | 2,367 (75.9%) |
| Fuel Oil or Kerosene | 495 (14.7%) | 0 (0.0%) |
| Coal or Coke | 17 (0.5%) | 0 (0.0%) |
| All other Fuels | 17 (0.5%) | 0 (0.0%) |
| No Fuel Used | 44 (1.3%) | 0 (0.0%) |
| Total | 3,355 (100.0%) | 3,119 (100.0%) |
Household Vehicle Usage in Fullerton
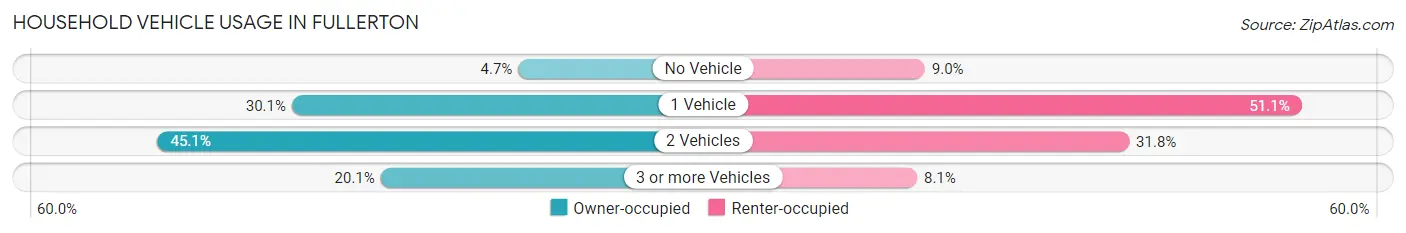
| Vehicles per Household | Owner-occupied | Renter-occupied |
| No Vehicle | 158 (4.7%) | 279 (8.9%) |
| 1 Vehicle | 1,009 (30.1%) | 1,595 (51.1%) |
| 2 Vehicles | 1,513 (45.1%) | 993 (31.8%) |
| 3 or more Vehicles | 675 (20.1%) | 252 (8.1%) |
| Total | 3,355 (100.0%) | 3,119 (100.0%) |
Real Estate & Mortgages in Fullerton
Real Estate and Mortgage Overview in Fullerton
| Characteristic | Without Mortgage | With Mortgage |
| Housing Units | 1,308 | 2,047 |
| Median Property Value | $221,500 | $218,300 |
| Median Household Income | $64,746 | $460 |
| Monthly Housing Costs | $689 | $28 |
| Real Estate Taxes | $4,330 | $15 |
Property Value by Mortgage Status in Fullerton
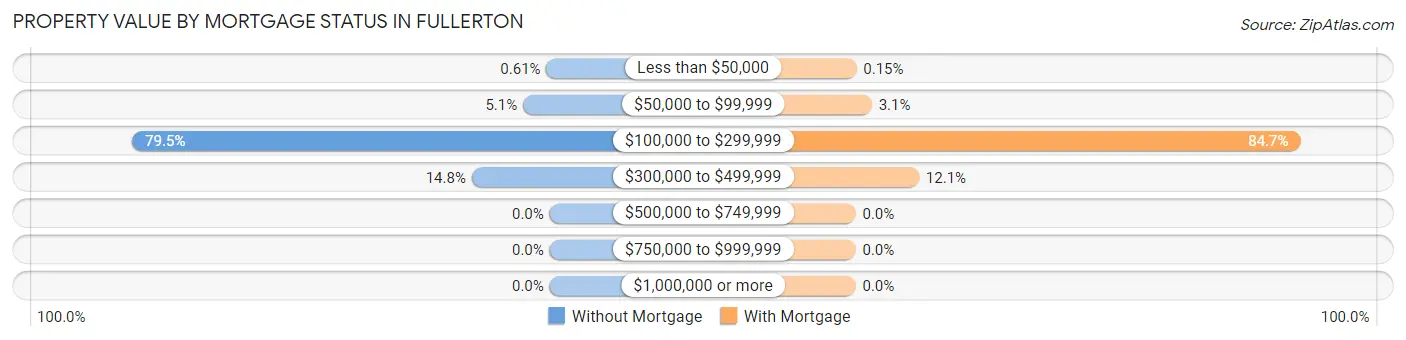
| Property Value | Without Mortgage | With Mortgage |
| Less than $50,000 | 8 (0.6%) | 3 (0.2%) |
| $50,000 to $99,999 | 66 (5.1%) | 63 (3.1%) |
| $100,000 to $299,999 | 1,040 (79.5%) | 1,734 (84.7%) |
| $300,000 to $499,999 | 194 (14.8%) | 247 (12.1%) |
| $500,000 to $749,999 | 0 (0.0%) | 0 (0.0%) |
| $750,000 to $999,999 | 0 (0.0%) | 0 (0.0%) |
| $1,000,000 or more | 0 (0.0%) | 0 (0.0%) |
| Total | 1,308 (100.0%) | 2,047 (100.0%) |
Household Income by Mortgage Status in Fullerton
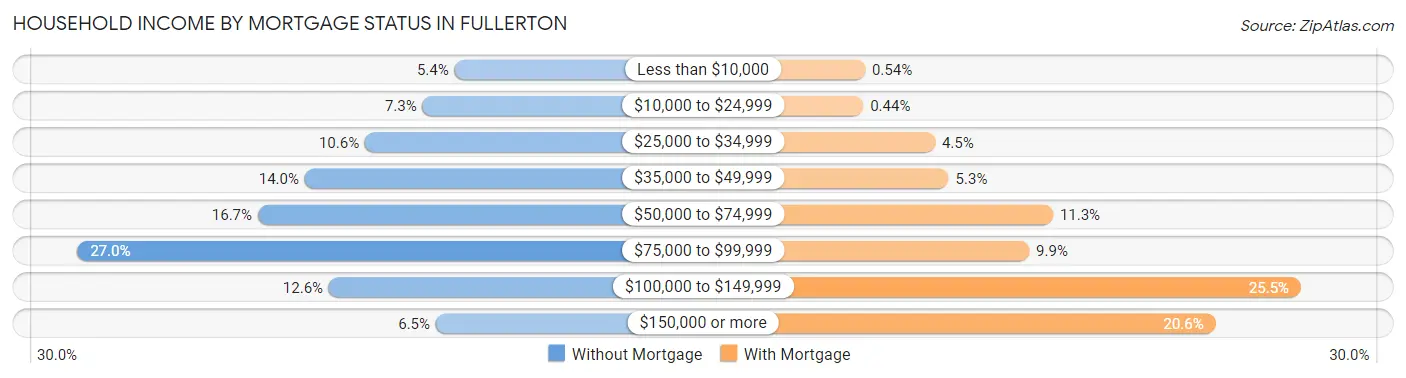
| Household Income | Without Mortgage | With Mortgage |
| Less than $10,000 | 71 (5.4%) | 11 (0.5%) |
| $10,000 to $24,999 | 95 (7.3%) | 9 (0.4%) |
| $25,000 to $34,999 | 138 (10.5%) | 93 (4.5%) |
| $35,000 to $49,999 | 183 (14.0%) | 109 (5.3%) |
| $50,000 to $74,999 | 218 (16.7%) | 231 (11.3%) |
| $75,000 to $99,999 | 353 (27.0%) | 203 (9.9%) |
| $100,000 to $149,999 | 165 (12.6%) | 521 (25.5%) |
| $150,000 or more | 85 (6.5%) | 421 (20.6%) |
| Total | 1,308 (100.0%) | 2,047 (100.0%) |
Property Value to Household Income Ratio in Fullerton
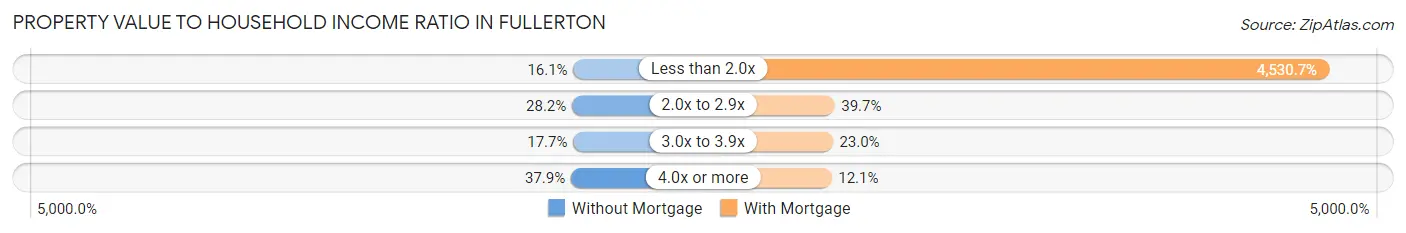
| Value-to-Income Ratio | Without Mortgage | With Mortgage |
| Less than 2.0x | 211 (16.1%) | 92,744 (4,530.7%) |
| 2.0x to 2.9x | 369 (28.2%) | 812 (39.7%) |
| 3.0x to 3.9x | 232 (17.7%) | 471 (23.0%) |
| 4.0x or more | 496 (37.9%) | 247 (12.1%) |
| Total | 1,308 (100.0%) | 2,047 (100.0%) |
Real Estate Taxes by Mortgage Status in Fullerton
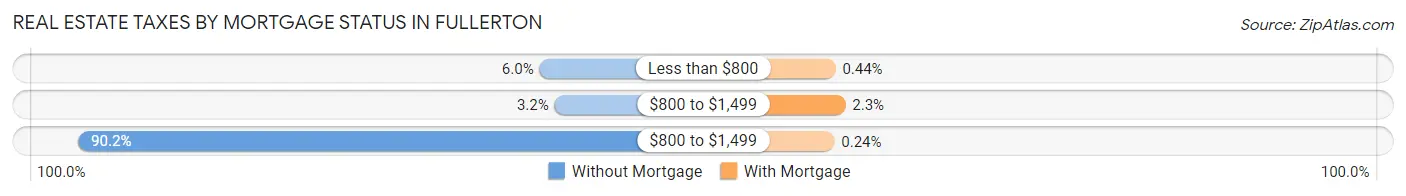
| Property Taxes | Without Mortgage | With Mortgage |
| Less than $800 | 78 (6.0%) | 9 (0.4%) |
| $800 to $1,499 | 42 (3.2%) | 46 (2.2%) |
| $800 to $1,499 | 1,180 (90.2%) | 5 (0.2%) |
| Total | 1,308 (100.0%) | 2,047 (100.0%) |
Health & Disability in Fullerton
Health Insurance Coverage by Age in Fullerton
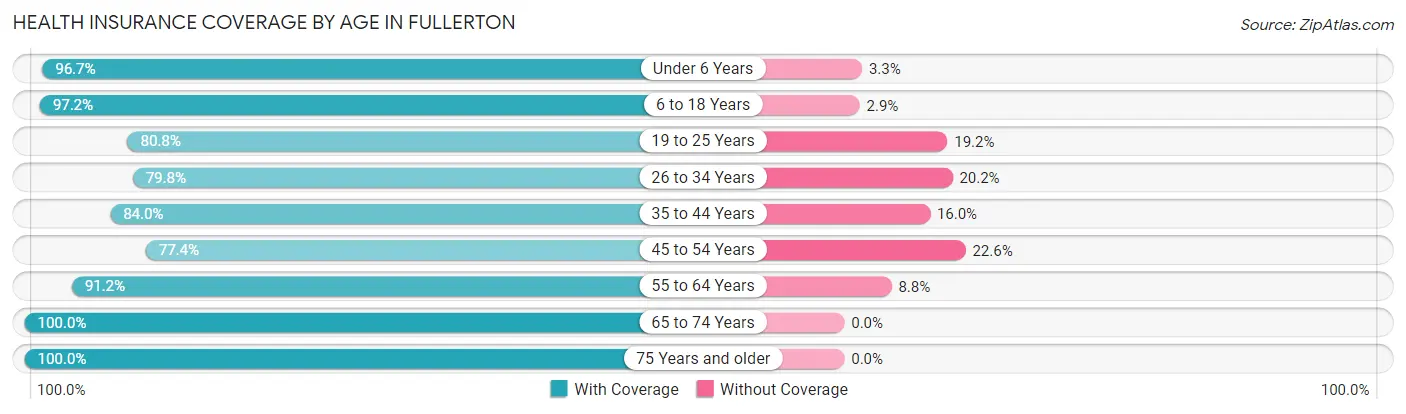
| Age Bracket | With Coverage | Without Coverage |
| Under 6 Years | 1,172 (96.7%) | 40 (3.3%) |
| 6 to 18 Years | 2,691 (97.2%) | 79 (2.9%) |
| 19 to 25 Years | 1,089 (80.8%) | 259 (19.2%) |
| 26 to 34 Years | 2,378 (79.8%) | 601 (20.2%) |
| 35 to 44 Years | 1,984 (84.0%) | 377 (16.0%) |
| 45 to 54 Years | 1,243 (77.4%) | 363 (22.6%) |
| 55 to 64 Years | 1,730 (91.2%) | 167 (8.8%) |
| 65 to 74 Years | 1,139 (100.0%) | 0 (0.0%) |
| 75 Years and older | 1,030 (100.0%) | 0 (0.0%) |
| Total | 14,456 (88.5%) | 1,886 (11.5%) |
Health Insurance Coverage by Citizenship Status in Fullerton
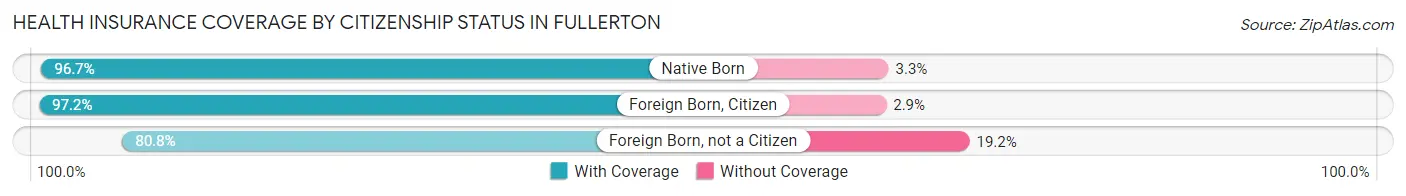
| Citizenship Status | With Coverage | Without Coverage |
| Native Born | 1,172 (96.7%) | 40 (3.3%) |
| Foreign Born, Citizen | 2,691 (97.2%) | 79 (2.9%) |
| Foreign Born, not a Citizen | 1,089 (80.8%) | 259 (19.2%) |
Health Insurance Coverage by Household Income in Fullerton
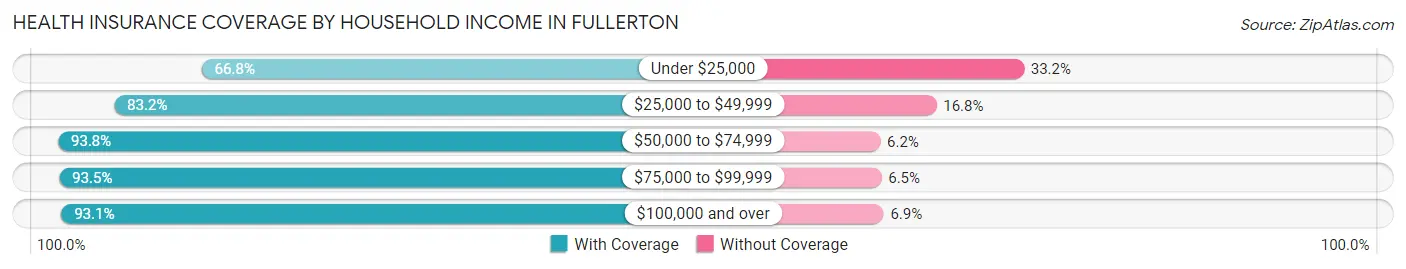
| Household Income | With Coverage | Without Coverage |
| Under $25,000 | 1,040 (66.8%) | 516 (33.2%) |
| $25,000 to $49,999 | 3,203 (83.2%) | 645 (16.8%) |
| $50,000 to $74,999 | 1,848 (93.8%) | 123 (6.2%) |
| $75,000 to $99,999 | 3,275 (93.5%) | 226 (6.5%) |
| $100,000 and over | 5,070 (93.1%) | 374 (6.9%) |
Public vs Private Health Insurance Coverage by Age in Fullerton
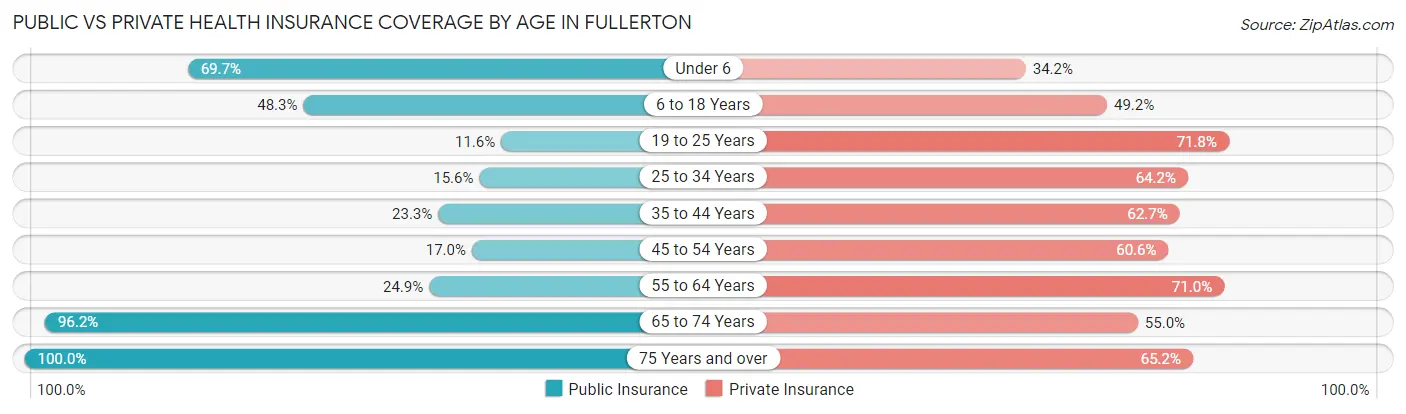
| Age Bracket | Public Insurance | Private Insurance |
| Under 6 | 845 (69.7%) | 414 (34.2%) |
| 6 to 18 Years | 1,337 (48.3%) | 1,364 (49.2%) |
| 19 to 25 Years | 156 (11.6%) | 968 (71.8%) |
| 25 to 34 Years | 465 (15.6%) | 1,913 (64.2%) |
| 35 to 44 Years | 549 (23.3%) | 1,480 (62.7%) |
| 45 to 54 Years | 273 (17.0%) | 973 (60.6%) |
| 55 to 64 Years | 473 (24.9%) | 1,346 (71.0%) |
| 65 to 74 Years | 1,096 (96.2%) | 626 (55.0%) |
| 75 Years and over | 1,030 (100.0%) | 671 (65.1%) |
| Total | 6,224 (38.1%) | 9,755 (59.7%) |
Disability Status by Sex by Age in Fullerton
| Age Bracket | Male | Female |
| Under 5 Years | 0 (0.0%) | 0 (0.0%) |
| 5 to 17 Years | 227 (13.4%) | 0 (0.0%) |
| 18 to 34 Years | 84 (3.2%) | 164 (8.3%) |
| 35 to 64 Years | 380 (12.7%) | 395 (13.8%) |
| 65 to 74 Years | 50 (9.9%) | 144 (22.8%) |
| 75 Years and over | 186 (52.2%) | 294 (43.6%) |
Disability Class by Sex by Age in Fullerton
Disability Class: Hearing Difficulty
| Age Bracket | Male | Female |
| Under 5 Years | 0 (0.0%) | 0 (0.0%) |
| 5 to 17 Years | 0 (0.0%) | 0 (0.0%) |
| 18 to 34 Years | 9 (0.3%) | 0 (0.0%) |
| 35 to 64 Years | 73 (2.4%) | 9 (0.3%) |
| 65 to 74 Years | 16 (3.2%) | 36 (5.7%) |
| 75 Years and over | 69 (19.4%) | 80 (11.9%) |
Disability Class: Vision Difficulty
| Age Bracket | Male | Female |
| Under 5 Years | 0 (0.0%) | 0 (0.0%) |
| 5 to 17 Years | 0 (0.0%) | 0 (0.0%) |
| 18 to 34 Years | 52 (2.0%) | 109 (5.5%) |
| 35 to 64 Years | 12 (0.4%) | 74 (2.6%) |
| 65 to 74 Years | 0 (0.0%) | 29 (4.6%) |
| 75 Years and over | 42 (11.8%) | 108 (16.0%) |
Disability Class: Cognitive Difficulty
| Age Bracket | Male | Female |
| 5 to 17 Years | 193 (11.4%) | 0 (0.0%) |
| 18 to 34 Years | 20 (0.7%) | 55 (2.8%) |
| 35 to 64 Years | 214 (7.1%) | 186 (6.5%) |
| 65 to 74 Years | 9 (1.8%) | 27 (4.3%) |
| 75 Years and over | 21 (5.9%) | 105 (15.6%) |
Disability Class: Ambulatory Difficulty
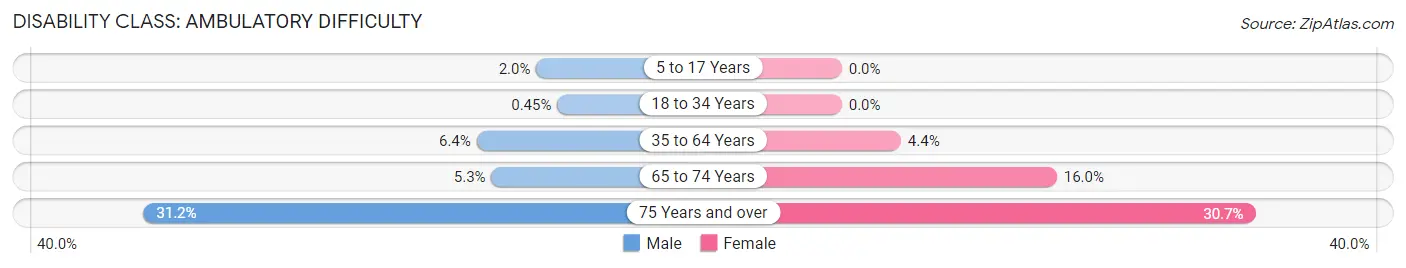
| Age Bracket | Male | Female |
| 5 to 17 Years | 34 (2.0%) | 0 (0.0%) |
| 18 to 34 Years | 12 (0.4%) | 0 (0.0%) |
| 35 to 64 Years | 193 (6.4%) | 126 (4.4%) |
| 65 to 74 Years | 27 (5.3%) | 101 (16.0%) |
| 75 Years and over | 111 (31.2%) | 207 (30.7%) |
Disability Class: Self-Care Difficulty
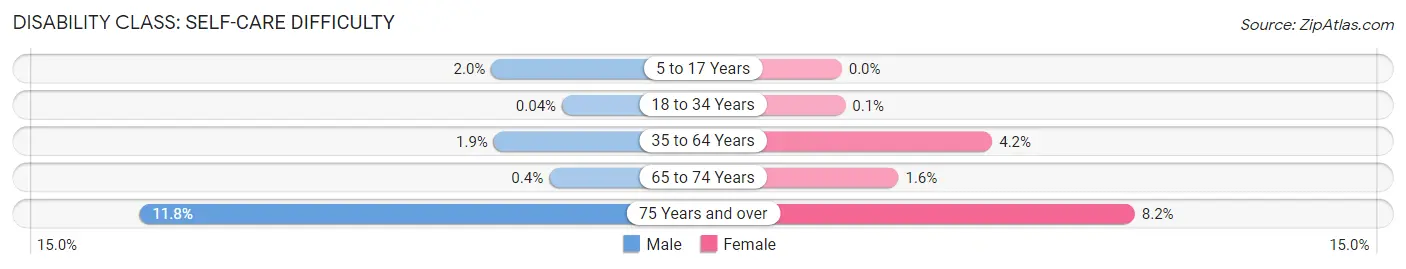
| Age Bracket | Male | Female |
| 5 to 17 Years | 34 (2.0%) | 0 (0.0%) |
| 18 to 34 Years | 1 (0.0%) | 2 (0.1%) |
| 35 to 64 Years | 58 (1.9%) | 120 (4.2%) |
| 65 to 74 Years | 2 (0.4%) | 10 (1.6%) |
| 75 Years and over | 42 (11.8%) | 55 (8.2%) |
Technology Access in Fullerton
Computing Device Access in Fullerton
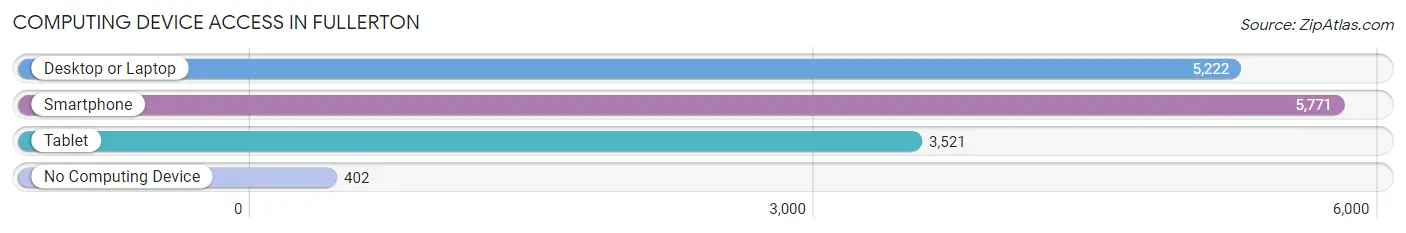
| Device Type | # Households | % Households |
| Desktop or Laptop | 5,222 | 80.7% |
| Smartphone | 5,771 | 89.1% |
| Tablet | 3,521 | 54.4% |
| No Computing Device | 402 | 6.2% |
| Total | 6,474 | 100.0% |
Internet Access in Fullerton
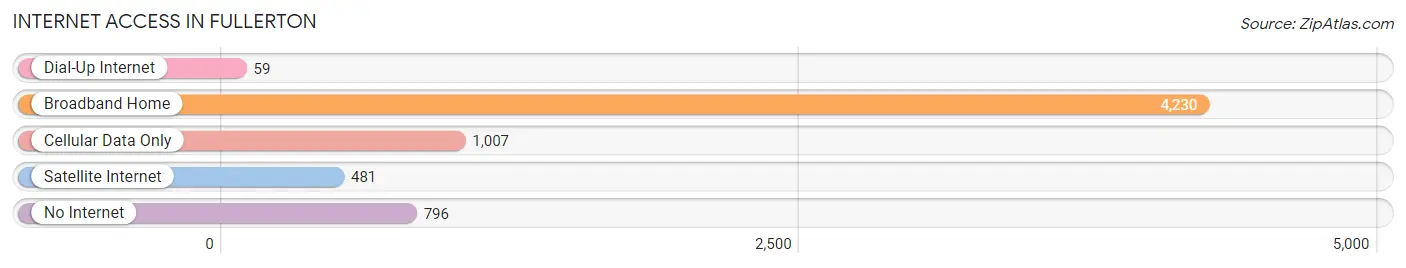
| Internet Type | # Households | % Households |
| Dial-Up Internet | 59 | 0.9% |
| Broadband Home | 4,230 | 65.3% |
| Cellular Data Only | 1,007 | 15.5% |
| Satellite Internet | 481 | 7.4% |
| No Internet | 796 | 12.3% |
| Total | 6,474 | 100.0% |
Fullerton Summary
Fullerton is a small borough located in Northampton County, Pennsylvania. It is situated in the Lehigh Valley region of the state, and is part of the Allentown-Bethlehem-Easton metropolitan area. The borough has a population of 1,845 as of the 2010 census, and is located approximately 8 miles north of Easton and 10 miles south of Allentown.
History
Fullerton was first settled in 1750 by a group of German immigrants, who named the area after the town of Fullerton in Scotland. The town was officially incorporated in 1876, and was originally a farming community. In the late 19th century, the town began to develop into a small industrial center, with several factories and mills being built in the area. The town also became a popular tourist destination, with several hotels and resorts being built in the area.
Geography
Fullerton is located in Northampton County, Pennsylvania, in the Lehigh Valley region of the state. It is situated in the Lehigh Valley region of the state, and is part of the Allentown-Bethlehem-Easton metropolitan area. The borough has a total area of 0.7 square miles, all of which is land. The town is located approximately 8 miles north of Easton and 10 miles south of Allentown.
Economy
Fullerton’s economy is largely based on tourism and small businesses. The town is home to several small businesses, including restaurants, shops, and other services. The town is also home to several tourist attractions, including the Fullerton Hotel, the Fullerton Museum, and the Fullerton Arboretum. The town is also home to several industrial parks, which provide employment opportunities for local residents.
Demographics
As of the 2010 census, Fullerton had a population of 1,845. The racial makeup of the town was 94.2% White, 1.2% African American, 0.2% Native American, 0.7% Asian, 0.1% Pacific Islander, 1.7% from other races, and 1.9% from two or more races. Hispanic or Latino of any race were 4.2% of the population.
The median income for a household in the town was $45,938, and the median income for a family was $51,250. Males had a median income of $37,500 versus $27,500 for females. The per capita income for the town was $20,945. About 4.2% of families and 5.7% of the population were below the poverty line, including 6.3% of those under age 18 and 4.2% of those age 65 or over.
Common Questions
What is Per Capita Income in Fullerton?
Per Capita income in Fullerton is $31,517.
What is the Median Family Income in Fullerton?
Median Family Income in Fullerton is $77,634.
What is the Median Household income in Fullerton?
Median Household Income in Fullerton is $63,423.
What is Income or Wage Gap in Fullerton?
Income or Wage Gap in Fullerton is 20.1%.
Women in Fullerton earn 79.9 cents for every dollar earned by a man.
What is Inequality or Gini Index in Fullerton?
Inequality or Gini Index in Fullerton is 0.39.
What is the Total Population of Fullerton?
Total Population of Fullerton is 16,358.
What is the Total Male Population of Fullerton?
Total Male Population of Fullerton is 8,549.
What is the Total Female Population of Fullerton?
Total Female Population of Fullerton is 7,809.
What is the Ratio of Males per 100 Females in Fullerton?
There are 109.48 Males per 100 Females in Fullerton.
What is the Ratio of Females per 100 Males in Fullerton?
There are 91.34 Females per 100 Males in Fullerton.
What is the Median Population Age in Fullerton?
Median Population Age in Fullerton is 34.6 Years.
What is the Average Family Size in Fullerton
Average Family Size in Fullerton is 3.0 People.
What is the Average Household Size in Fullerton
Average Household Size in Fullerton is 2.5 People.
How Large is the Labor Force in Fullerton?
There are 9,608 People in the Labor Forcein in Fullerton.
What is the Percentage of People in the Labor Force in Fullerton?
73.5% of People are in the Labor Force in Fullerton.
What is the Unemployment Rate in Fullerton?
Unemployment Rate in Fullerton is 4.6%.