Saylorsburg, PA Map & Demographics
Saylorsburg Map
Saylorsburg Overview
$41,367
PER CAPITA INCOME
$70,694
AVG FAMILY INCOME
$85,073
AVG HOUSEHOLD INCOME
37.0%
WAGE / INCOME GAP [ % ]
63.0¢/ $1
WAGE / INCOME GAP [ $ ]
0.29
INEQUALITY / GINI INDEX
1,077
TOTAL POPULATION
568
MALE POPULATION
509
FEMALE POPULATION
111.59
MALES / 100 FEMALES
89.61
FEMALES / 100 MALES
48.3
MEDIAN AGE
3.7
AVG FAMILY SIZE
1.9
AVG HOUSEHOLD SIZE
580
LABOR FORCE [ PEOPLE ]
58.5%
PERCENT IN LABOR FORCE
Saylorsburg Zip Codes
Saylorsburg Area Codes
Income in Saylorsburg
Income Overview in Saylorsburg
Per Capita Income in Saylorsburg is $41,367, while median incomes of families and households are $70,694 and $85,073 respectively.
| Characteristic | Number | Measure |
| Per Capita Income | 1,077 | $41,367 |
| Median Family Income | 153 | $70,694 |
| Mean Family Income | 153 | $101,008 |
| Median Household Income | 554 | $85,073 |
| Mean Household Income | 554 | $75,598 |
| Income Deficit | 153 | $0 |
| Wage / Income Gap (%) | 1,077 | 37.03% |
| Wage / Income Gap ($) | 1,077 | 62.97¢ per $1 |
| Gini / Inequality Index | 1,077 | 0.29 |
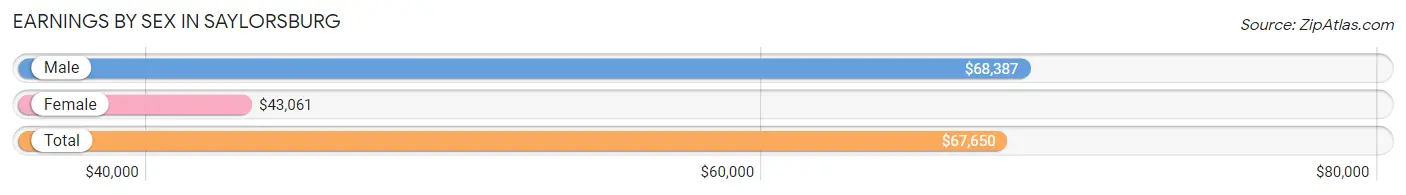
Earnings by Sex in Saylorsburg
Average Earnings in Saylorsburg are $67,650, $68,387 for men and $43,061 for women, a difference of 37.0%.
| Sex | Number | Average Earnings |
| Male | 403 (63.5%) | $68,387 |
| Female | 232 (36.5%) | $43,061 |
| Total | 635 (100.0%) | $67,650 |
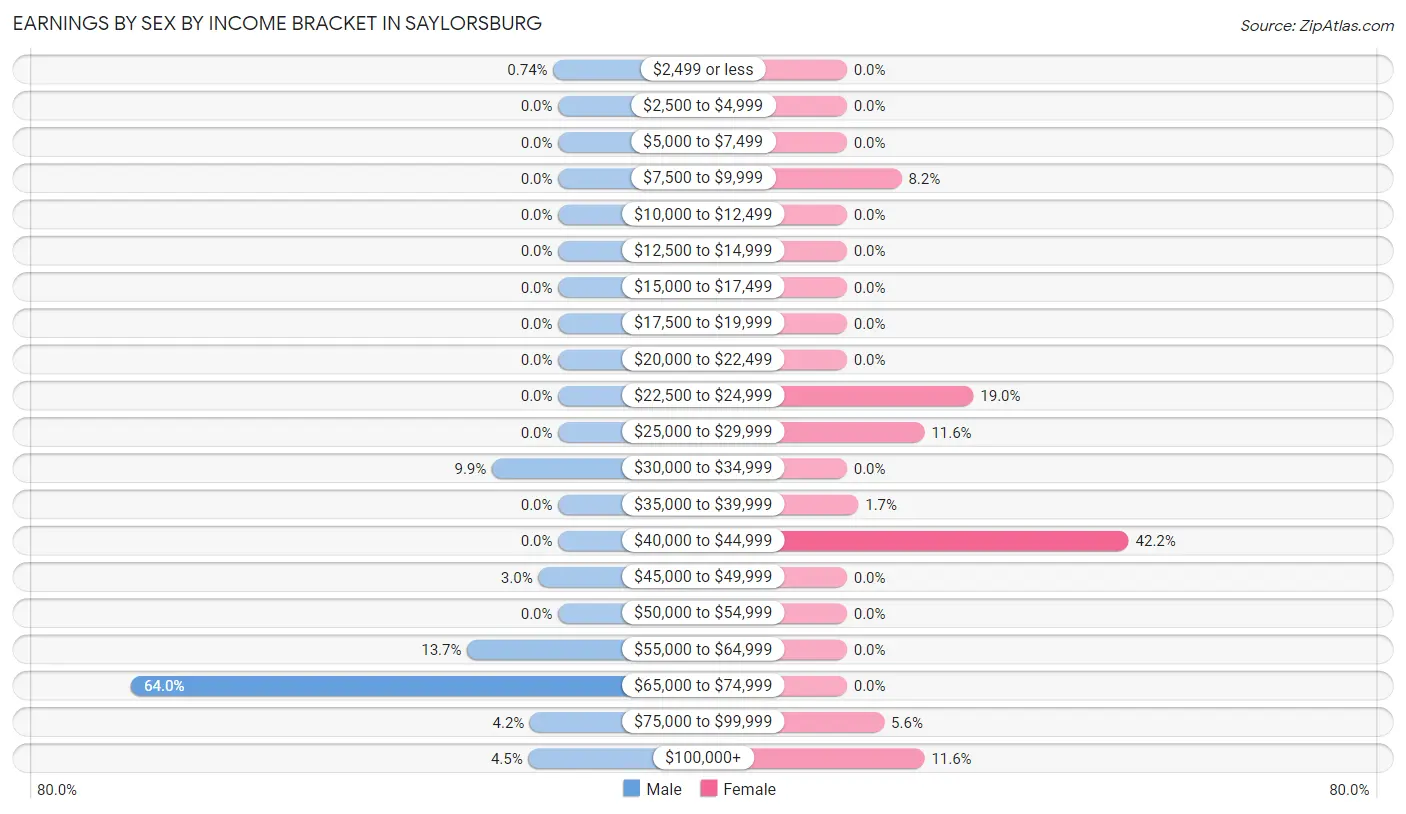
Earnings by Sex by Income Bracket in Saylorsburg
The most common earnings brackets in Saylorsburg are $65,000 to $74,999 for men (258 | 64.0%) and $40,000 to $44,999 for women (98 | 42.2%).
| Income | Male | Female |
| $2,499 or less | 3 (0.7%) | 0 (0.0%) |
| $2,500 to $4,999 | 0 (0.0%) | 0 (0.0%) |
| $5,000 to $7,499 | 0 (0.0%) | 0 (0.0%) |
| $7,500 to $9,999 | 0 (0.0%) | 19 (8.2%) |
| $10,000 to $12,499 | 0 (0.0%) | 0 (0.0%) |
| $12,500 to $14,999 | 0 (0.0%) | 0 (0.0%) |
| $15,000 to $17,499 | 0 (0.0%) | 0 (0.0%) |
| $17,500 to $19,999 | 0 (0.0%) | 0 (0.0%) |
| $20,000 to $22,499 | 0 (0.0%) | 0 (0.0%) |
| $22,500 to $24,999 | 0 (0.0%) | 44 (19.0%) |
| $25,000 to $29,999 | 0 (0.0%) | 27 (11.6%) |
| $30,000 to $34,999 | 40 (9.9%) | 0 (0.0%) |
| $35,000 to $39,999 | 0 (0.0%) | 4 (1.7%) |
| $40,000 to $44,999 | 0 (0.0%) | 98 (42.2%) |
| $45,000 to $49,999 | 12 (3.0%) | 0 (0.0%) |
| $50,000 to $54,999 | 0 (0.0%) | 0 (0.0%) |
| $55,000 to $64,999 | 55 (13.7%) | 0 (0.0%) |
| $65,000 to $74,999 | 258 (64.0%) | 0 (0.0%) |
| $75,000 to $99,999 | 17 (4.2%) | 13 (5.6%) |
| $100,000+ | 18 (4.5%) | 27 (11.6%) |
| Total | 403 (100.0%) | 232 (100.0%) |
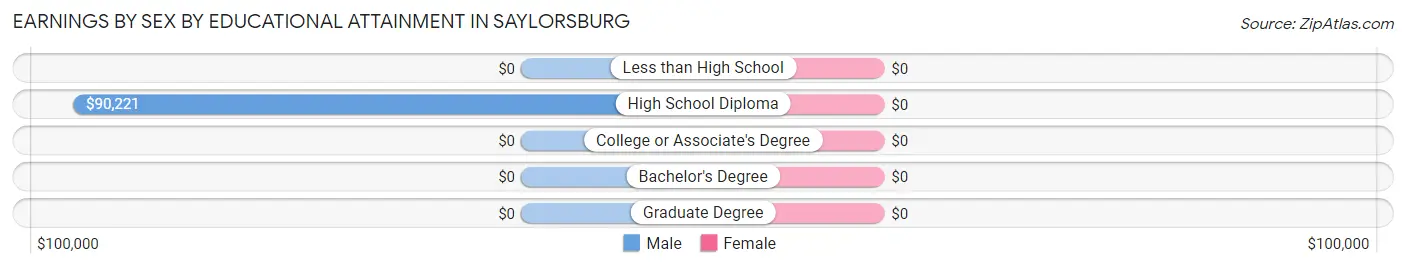
Earnings by Sex by Educational Attainment in Saylorsburg
| Educational Attainment | Male Income | Female Income |
| Less than High School | - | - |
| High School Diploma | $90,221 | $0 |
| College or Associate's Degree | - | - |
| Bachelor's Degree | - | - |
| Graduate Degree | - | - |
| Total | $68,527 | $43,393 |
Family Income in Saylorsburg
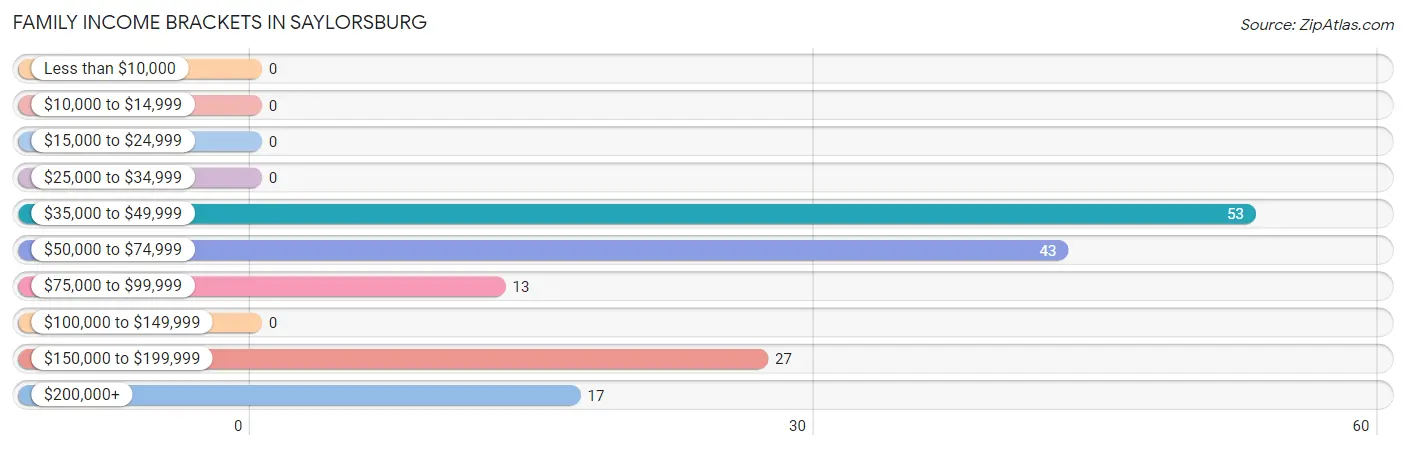
Family Income Brackets in Saylorsburg
According to the Saylorsburg family income data, there are 53 families falling into the $35,000 to $49,999 income range, which is the most common income bracket and makes up 34.6% of all families.
| Income Bracket | # Families | % Families |
| Less than $10,000 | 0 | 0.0% |
| $10,000 to $14,999 | 0 | 0.0% |
| $15,000 to $24,999 | 0 | 0.0% |
| $25,000 to $34,999 | 0 | 0.0% |
| $35,000 to $49,999 | 53 | 34.6% |
| $50,000 to $74,999 | 43 | 28.1% |
| $75,000 to $99,999 | 13 | 8.5% |
| $100,000 to $149,999 | 0 | 0.0% |
| $150,000 to $199,999 | 27 | 17.6% |
| $200,000+ | 17 | 11.1% |
Family Income by Famaliy Size in Saylorsburg
| Income Bracket | # Families | Median Income |
| 2-Person Families | 83 (54.2%) | $0 |
| 3-Person Families | 44 (28.8%) | $0 |
| 4-Person Families | 14 (9.1%) | $0 |
| 5-Person Families | 0 (0.0%) | $0 |
| 6-Person Families | 0 (0.0%) | $0 |
| 7+ Person Families | 12 (7.8%) | $0 |
| Total | 153 (100.0%) | $70,694 |
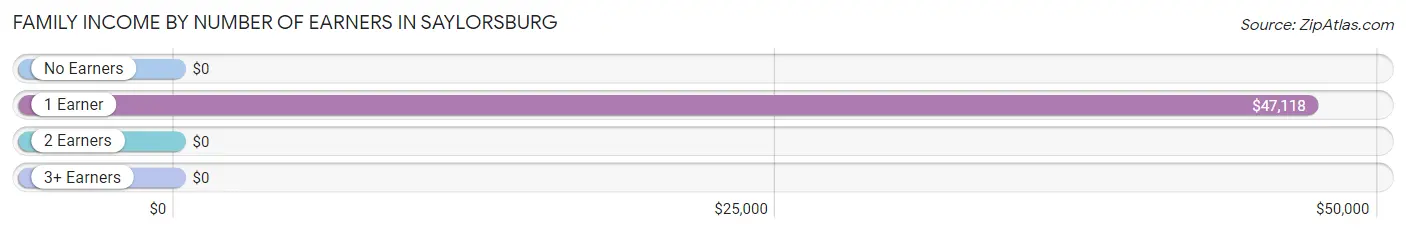
Family Income by Number of Earners in Saylorsburg
| Number of Earners | # Families | Median Income |
| No Earners | 17 (11.1%) | $0 |
| 1 Earner | 61 (39.9%) | $47,118 |
| 2 Earners | 58 (37.9%) | $0 |
| 3+ Earners | 17 (11.1%) | $0 |
| Total | 153 (100.0%) | $70,694 |
Household Income in Saylorsburg
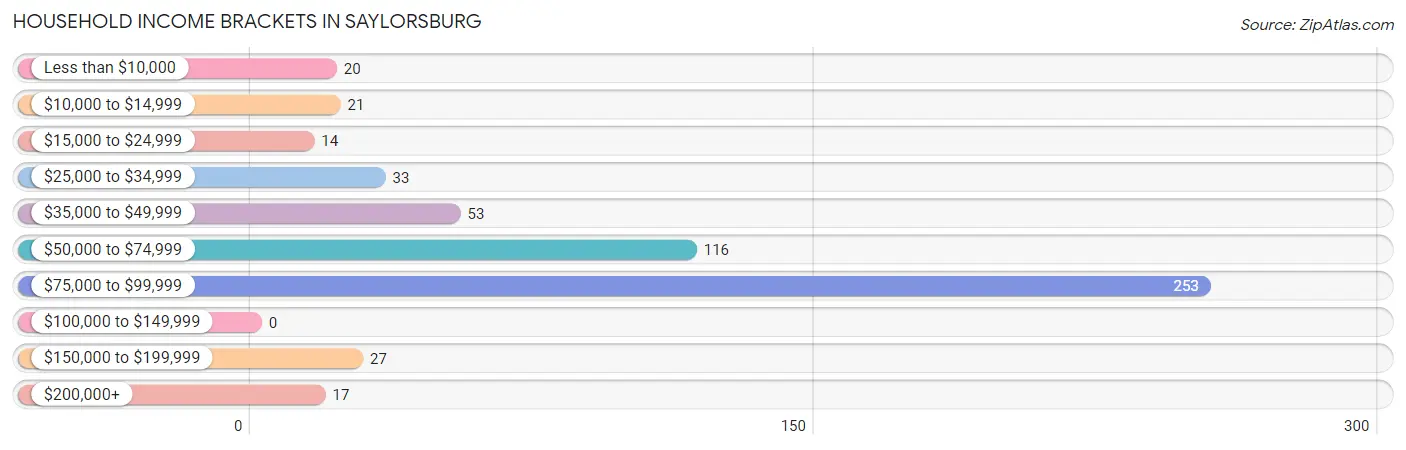
Household Income Brackets in Saylorsburg
With 253 households falling in the category, the $75,000 to $99,999 income range is the most frequent in Saylorsburg, accounting for 45.7% of all households.
| Income Bracket | # Households | % Households |
| Less than $10,000 | 20 | 3.6% |
| $10,000 to $14,999 | 21 | 3.8% |
| $15,000 to $24,999 | 14 | 2.5% |
| $25,000 to $34,999 | 33 | 6.0% |
| $35,000 to $49,999 | 53 | 9.6% |
| $50,000 to $74,999 | 116 | 20.9% |
| $75,000 to $99,999 | 253 | 45.7% |
| $100,000 to $149,999 | 0 | 0.0% |
| $150,000 to $199,999 | 27 | 4.9% |
| $200,000+ | 17 | 3.1% |
Household Income by Householder Age in Saylorsburg
The median household income in Saylorsburg is $85,073, with the highest median household income of $86,089 found in the 25 to 44 years age bracket for the primary householder. A total of 271 households (48.9%) fall into this category.
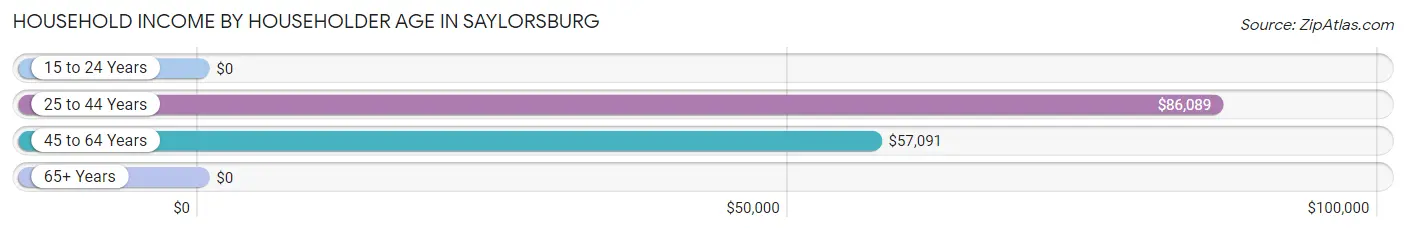
| Income Bracket | # Households | Median Income |
| 15 to 24 Years | 0 (0.0%) | $0 |
| 25 to 44 Years | 271 (48.9%) | $86,089 |
| 45 to 64 Years | 192 (34.7%) | $57,091 |
| 65+ Years | 91 (16.4%) | $0 |
| Total | 554 (100.0%) | $85,073 |
Poverty in Saylorsburg
Income Below Poverty by Sex and Age in Saylorsburg
With 8.6% poverty level for males and 20.4% for females among the residents of Saylorsburg, 75 year old and over males and 65 to 74 year old females are the most vulnerable to poverty, with 21 males (100.0%) and 20 females (100.0%) in their respective age groups living below the poverty level.
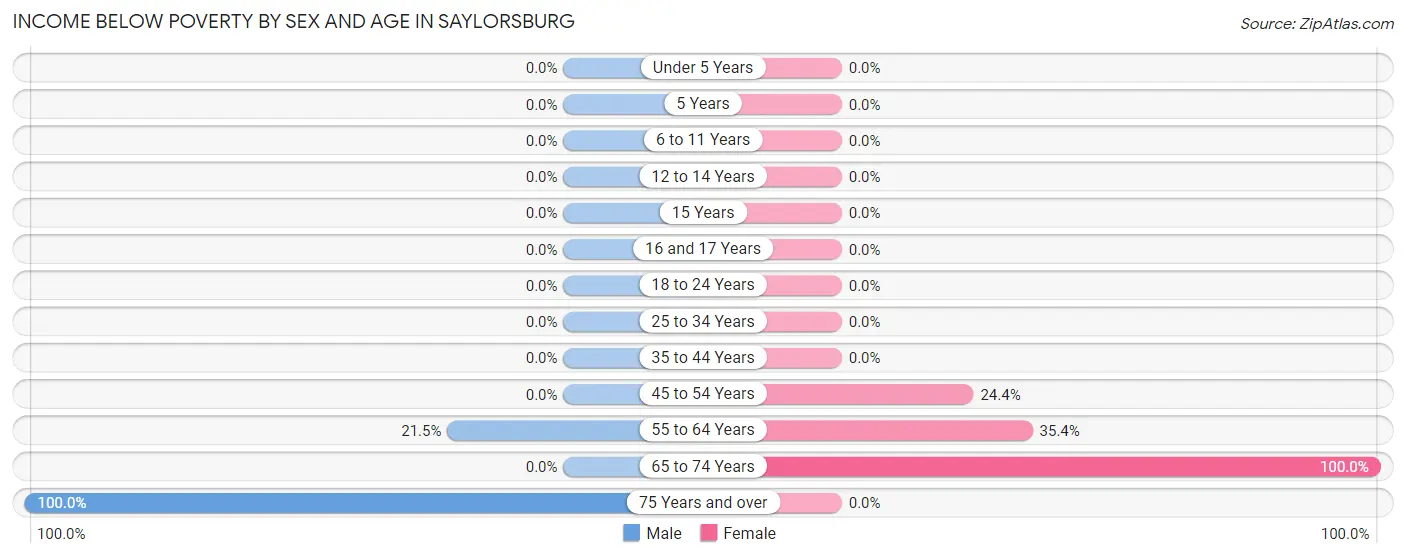
| Age Bracket | Male | Female |
| Under 5 Years | 0 (0.0%) | 0 (0.0%) |
| 5 Years | 0 (0.0%) | 0 (0.0%) |
| 6 to 11 Years | 0 (0.0%) | 0 (0.0%) |
| 12 to 14 Years | 0 (0.0%) | 0 (0.0%) |
| 15 Years | 0 (0.0%) | 0 (0.0%) |
| 16 and 17 Years | 0 (0.0%) | 0 (0.0%) |
| 18 to 24 Years | 0 (0.0%) | 0 (0.0%) |
| 25 to 34 Years | 0 (0.0%) | 0 (0.0%) |
| 35 to 44 Years | 0 (0.0%) | 0 (0.0%) |
| 45 to 54 Years | 0 (0.0%) | 33 (24.4%) |
| 55 to 64 Years | 28 (21.5%) | 51 (35.4%) |
| 65 to 74 Years | 0 (0.0%) | 20 (100.0%) |
| 75 Years and over | 21 (100.0%) | 0 (0.0%) |
| Total | 49 (8.6%) | 104 (20.4%) |
Income Above Poverty by Sex and Age in Saylorsburg
According to the poverty statistics in Saylorsburg, males aged 6 to 11 years and females aged 6 to 11 years are the age groups that are most secure financially, with 100.0% of males and 100.0% of females in these age groups living above the poverty line.
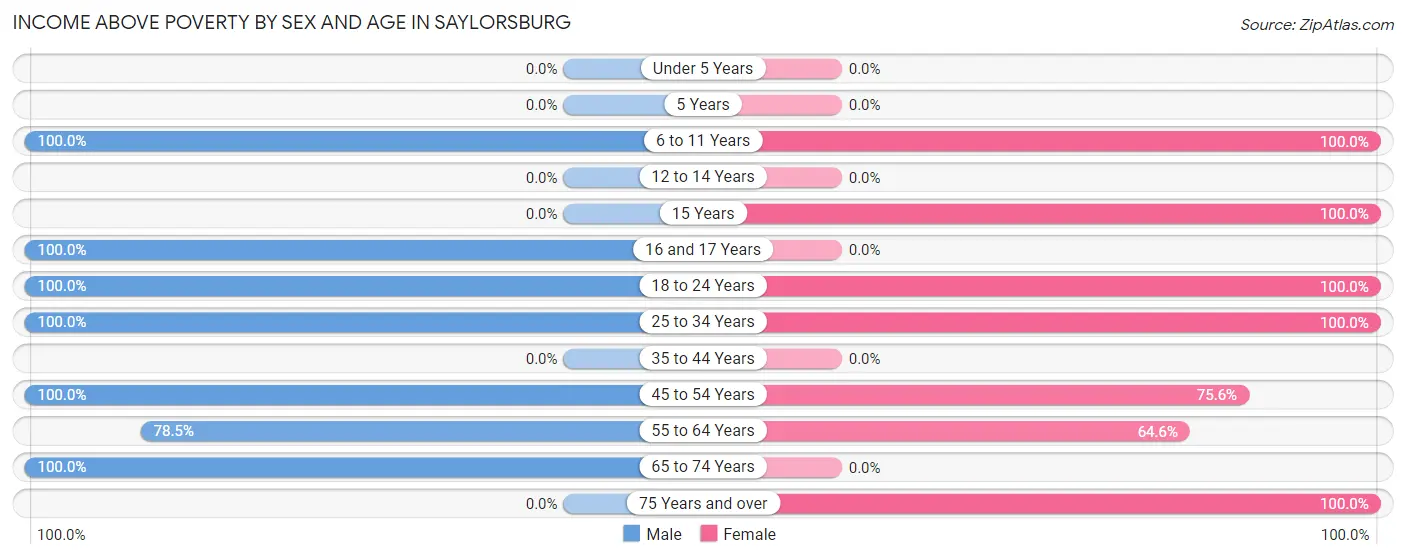
| Age Bracket | Male | Female |
| Under 5 Years | 0 (0.0%) | 0 (0.0%) |
| 5 Years | 0 (0.0%) | 0 (0.0%) |
| 6 to 11 Years | 41 (100.0%) | 23 (100.0%) |
| 12 to 14 Years | 0 (0.0%) | 0 (0.0%) |
| 15 Years | 0 (0.0%) | 22 (100.0%) |
| 16 and 17 Years | 22 (100.0%) | 0 (0.0%) |
| 18 to 24 Years | 48 (100.0%) | 59 (100.0%) |
| 25 to 34 Years | 261 (100.0%) | 31 (100.0%) |
| 35 to 44 Years | 0 (0.0%) | 0 (0.0%) |
| 45 to 54 Years | 34 (100.0%) | 102 (75.6%) |
| 55 to 64 Years | 102 (78.5%) | 93 (64.6%) |
| 65 to 74 Years | 11 (100.0%) | 0 (0.0%) |
| 75 Years and over | 0 (0.0%) | 75 (100.0%) |
| Total | 519 (91.4%) | 405 (79.6%) |
Income Below Poverty Among Married-Couple Families in Saylorsburg
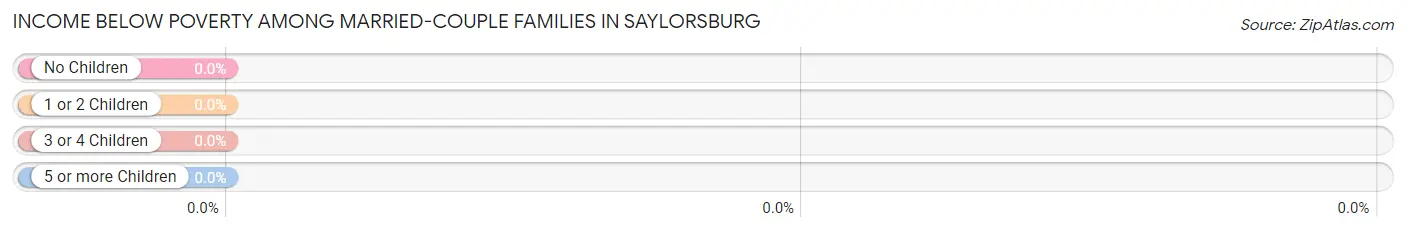
| Children | Above Poverty | Below Poverty |
| No Children | 17 (100.0%) | 0 (0.0%) |
| 1 or 2 Children | 14 (100.0%) | 0 (0.0%) |
| 3 or 4 Children | 12 (100.0%) | 0 (0.0%) |
| 5 or more Children | 0 (0.0%) | 0 (0.0%) |
| Total | 43 (100.0%) | 0 (0.0%) |
Income Below Poverty Among Single-Parent Households in Saylorsburg
| Children | Single Father | Single Mother |
| No Children | 0 (0.0%) | 0 (0.0%) |
| 1 or 2 Children | 0 (0.0%) | 0 (0.0%) |
| 3 or 4 Children | 0 (0.0%) | 0 (0.0%) |
| 5 or more Children | 0 (0.0%) | 0 (0.0%) |
| Total | 0 (0.0%) | 0 (0.0%) |
Income Below Poverty Among Married-Couple vs Single-Parent Households in Saylorsburg
| Children | Married-Couple Families | Single-Parent Households |
| No Children | 0 (0.0%) | 0 (0.0%) |
| 1 or 2 Children | 0 (0.0%) | 0 (0.0%) |
| 3 or 4 Children | 0 (0.0%) | 0 (0.0%) |
| 5 or more Children | 0 (0.0%) | 0 (0.0%) |
| Total | 0 (0.0%) | 0 (0.0%) |
Race in Saylorsburg
The most populous races in Saylorsburg are White / Caucasian (927 | 86.1%), Hispanic or Latino (330 | 30.6%), and Asian (130 | 12.1%).
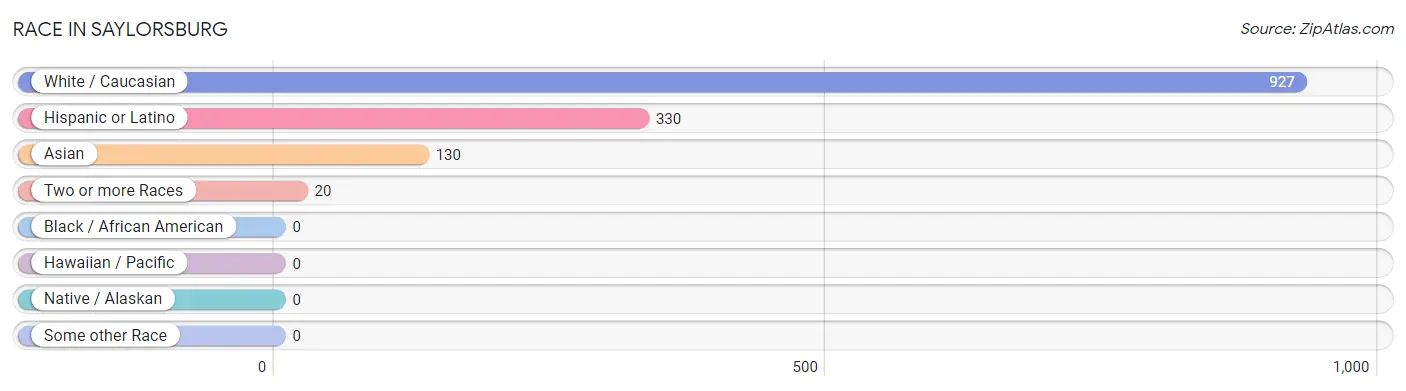
| Race | # Population | % Population |
| Asian | 130 | 12.1% |
| Black / African American | 0 | 0.0% |
| Hawaiian / Pacific | 0 | 0.0% |
| Hispanic or Latino | 330 | 30.6% |
| Native / Alaskan | 0 | 0.0% |
| White / Caucasian | 927 | 86.1% |
| Two or more Races | 20 | 1.9% |
| Some other Race | 0 | 0.0% |
| Total | 1,077 | 100.0% |
Ancestry in Saylorsburg
The most populous ancestries reported in Saylorsburg are German (446 | 41.4%), Irish (334 | 31.0%), Ecuadorian (240 | 22.3%), South American (240 | 22.3%), and American (188 | 17.5%), together accounting for 134.4% of all Saylorsburg residents.
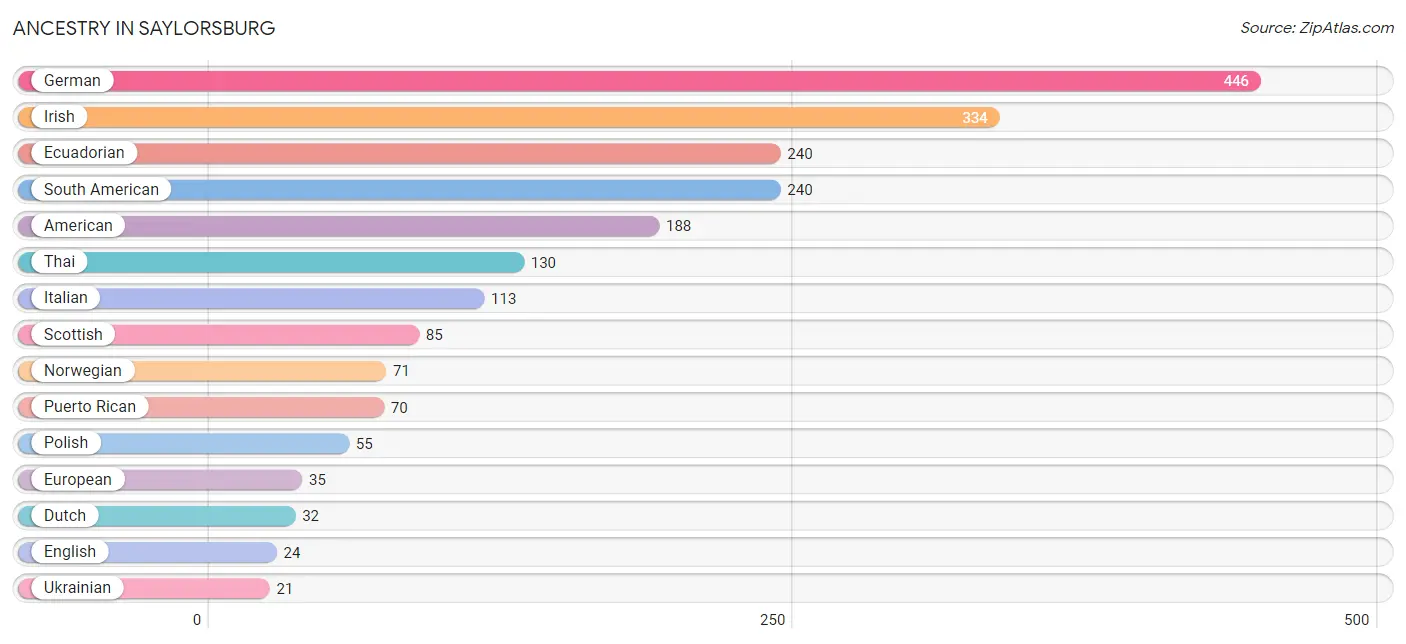
| Ancestry | # Population | % Population |
| American | 188 | 17.5% |
| Dutch | 32 | 3.0% |
| Ecuadorian | 240 | 22.3% |
| English | 24 | 2.2% |
| European | 35 | 3.3% |
| German | 446 | 41.4% |
| Irish | 334 | 31.0% |
| Italian | 113 | 10.5% |
| Mexican | 20 | 1.9% |
| Mexican American Indian | 20 | 1.9% |
| Norwegian | 71 | 6.6% |
| Polish | 55 | 5.1% |
| Puerto Rican | 70 | 6.5% |
| Scottish | 85 | 7.9% |
| South American | 240 | 22.3% |
| Thai | 130 | 12.1% |
| Ukrainian | 21 | 1.9% | View All 17 Rows |
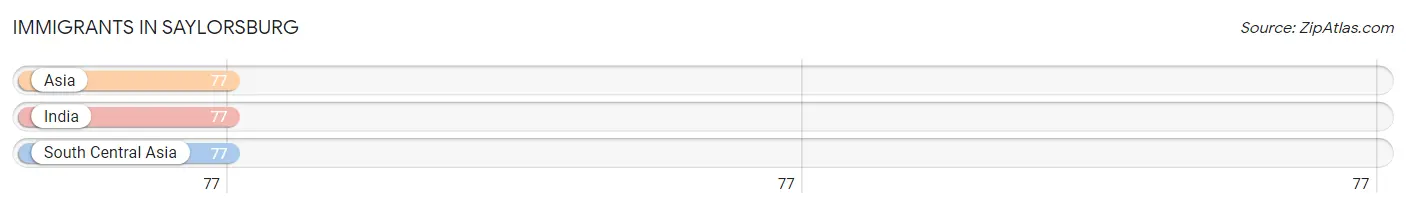
Immigrants in Saylorsburg
The most numerous immigrant groups reported in Saylorsburg came from Asia (77 | 7.1%), India (77 | 7.1%), and South Central Asia (77 | 7.1%), together accounting for 21.4% of all Saylorsburg residents.
| Immigration Origin | # Population | % Population |
| Asia | 77 | 7.1% |
| India | 77 | 7.1% |
| South Central Asia | 77 | 7.1% | View All 3 Rows |
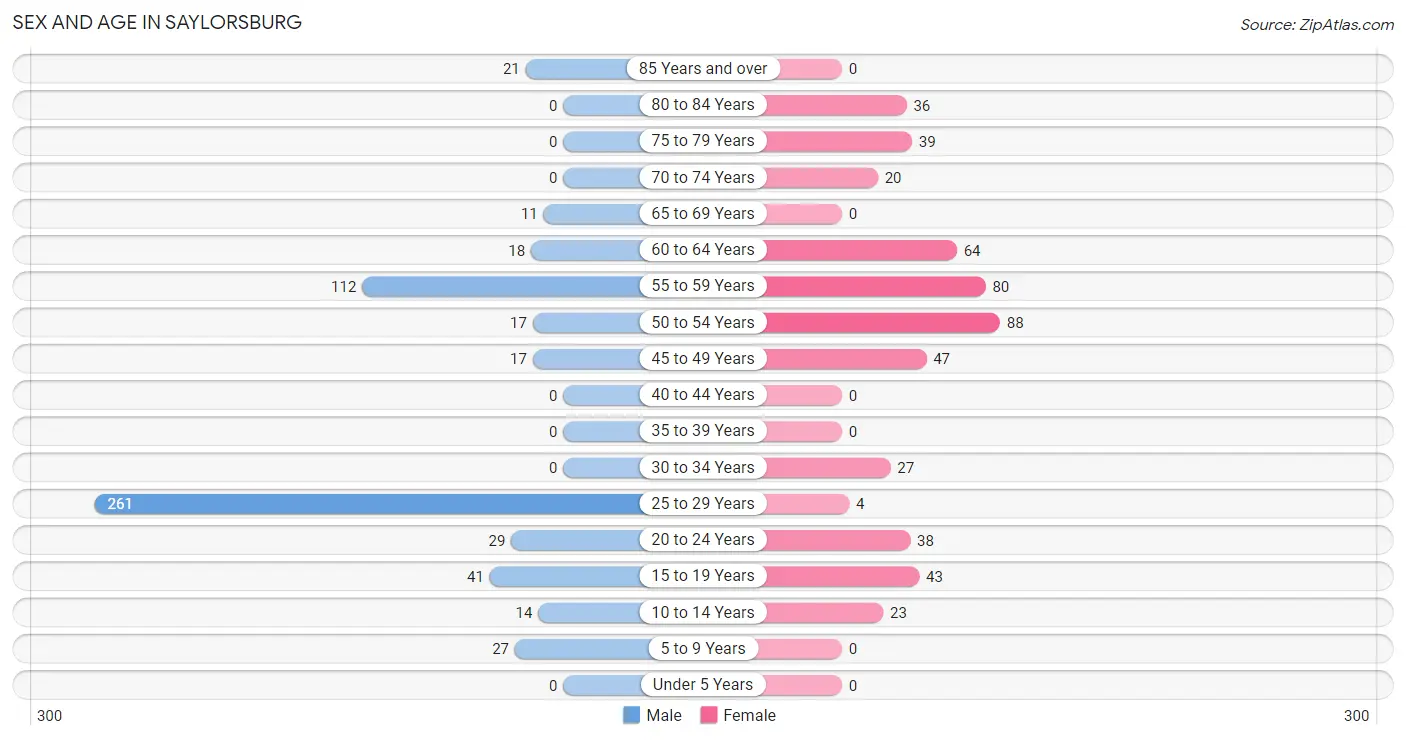
Sex and Age in Saylorsburg
Sex and Age in Saylorsburg
The most populous age groups in Saylorsburg are 25 to 29 Years (261 | 46.0%) for men and 50 to 54 Years (88 | 17.3%) for women.
| Age Bracket | Male | Female |
| Under 5 Years | 0 (0.0%) | 0 (0.0%) |
| 5 to 9 Years | 27 (4.8%) | 0 (0.0%) |
| 10 to 14 Years | 14 (2.5%) | 23 (4.5%) |
| 15 to 19 Years | 41 (7.2%) | 43 (8.5%) |
| 20 to 24 Years | 29 (5.1%) | 38 (7.5%) |
| 25 to 29 Years | 261 (46.0%) | 4 (0.8%) |
| 30 to 34 Years | 0 (0.0%) | 27 (5.3%) |
| 35 to 39 Years | 0 (0.0%) | 0 (0.0%) |
| 40 to 44 Years | 0 (0.0%) | 0 (0.0%) |
| 45 to 49 Years | 17 (3.0%) | 47 (9.2%) |
| 50 to 54 Years | 17 (3.0%) | 88 (17.3%) |
| 55 to 59 Years | 112 (19.7%) | 80 (15.7%) |
| 60 to 64 Years | 18 (3.2%) | 64 (12.6%) |
| 65 to 69 Years | 11 (1.9%) | 0 (0.0%) |
| 70 to 74 Years | 0 (0.0%) | 20 (3.9%) |
| 75 to 79 Years | 0 (0.0%) | 39 (7.7%) |
| 80 to 84 Years | 0 (0.0%) | 36 (7.1%) |
| 85 Years and over | 21 (3.7%) | 0 (0.0%) |
| Total | 568 (100.0%) | 509 (100.0%) |
Families and Households in Saylorsburg
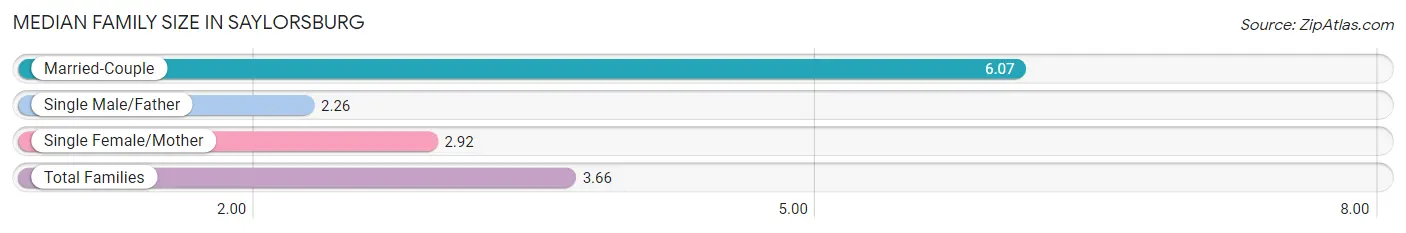
Median Family Size in Saylorsburg
The median family size in Saylorsburg is 3.66 persons per family, with married-couple families (43 | 28.1%) accounting for the largest median family size of 6.07 persons per family. On the other hand, single male/father families (34 | 22.2%) represent the smallest median family size with 2.26 persons per family.
| Family Type | # Families | Family Size |
| Married-Couple | 43 (28.1%) | 6.07 |
| Single Male/Father | 34 (22.2%) | 2.26 |
| Single Female/Mother | 76 (49.7%) | 2.92 |
| Total Families | 153 (100.0%) | 3.66 |
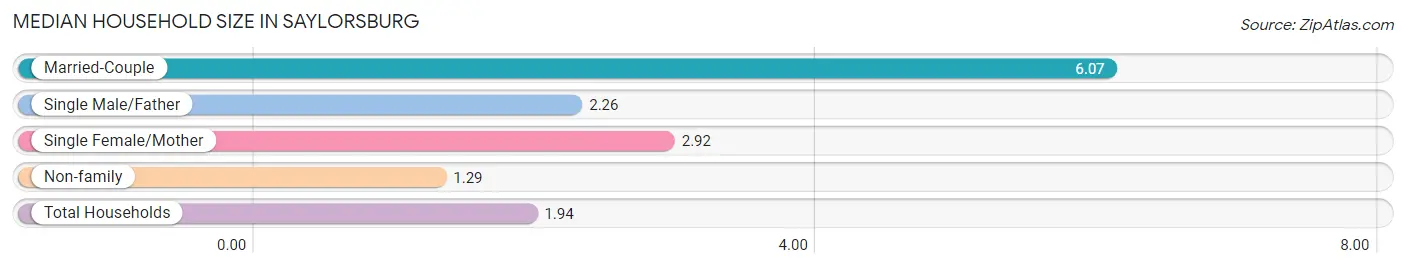
Median Household Size in Saylorsburg
The median household size in Saylorsburg is 1.94 persons per household, with married-couple households (43 | 7.8%) accounting for the largest median household size of 6.07 persons per household. non-family households (401 | 72.4%) represent the smallest median household size with 1.29 persons per household.
| Household Type | # Households | Household Size |
| Married-Couple | 43 (7.8%) | 6.07 |
| Single Male/Father | 34 (6.1%) | 2.26 |
| Single Female/Mother | 76 (13.7%) | 2.92 |
| Non-family | 401 (72.4%) | 1.29 |
| Total Households | 554 (100.0%) | 1.94 |
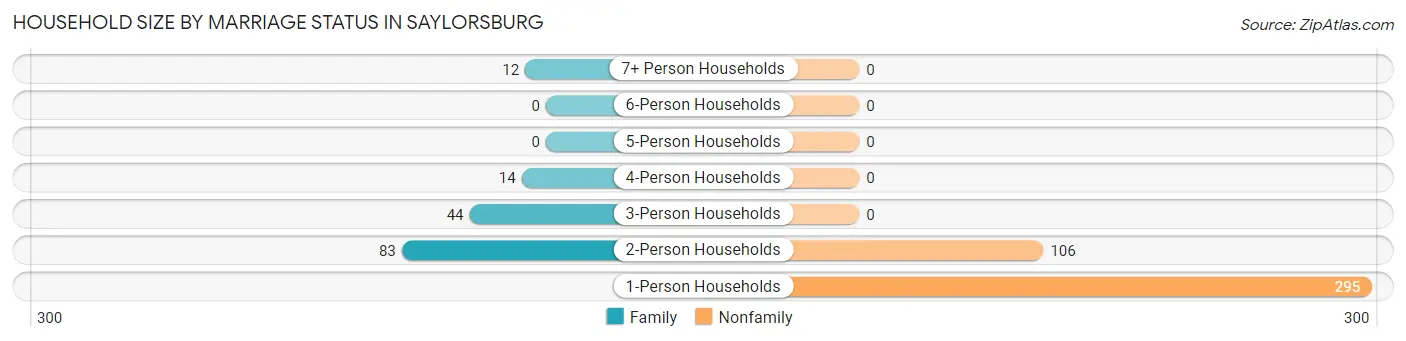
Household Size by Marriage Status in Saylorsburg
Out of a total of 554 households in Saylorsburg, 153 (27.6%) are family households, while 401 (72.4%) are nonfamily households. The most numerous type of family households are 2-person households, comprising 83, and the most common type of nonfamily households are 1-person households, comprising 295.
| Household Size | Family Households | Nonfamily Households |
| 1-Person Households | - | 295 (53.2%) |
| 2-Person Households | 83 (15.0%) | 106 (19.1%) |
| 3-Person Households | 44 (7.9%) | 0 (0.0%) |
| 4-Person Households | 14 (2.5%) | 0 (0.0%) |
| 5-Person Households | 0 (0.0%) | 0 (0.0%) |
| 6-Person Households | 0 (0.0%) | 0 (0.0%) |
| 7+ Person Households | 12 (2.2%) | 0 (0.0%) |
| Total | 153 (27.6%) | 401 (72.4%) |
Female Fertility in Saylorsburg
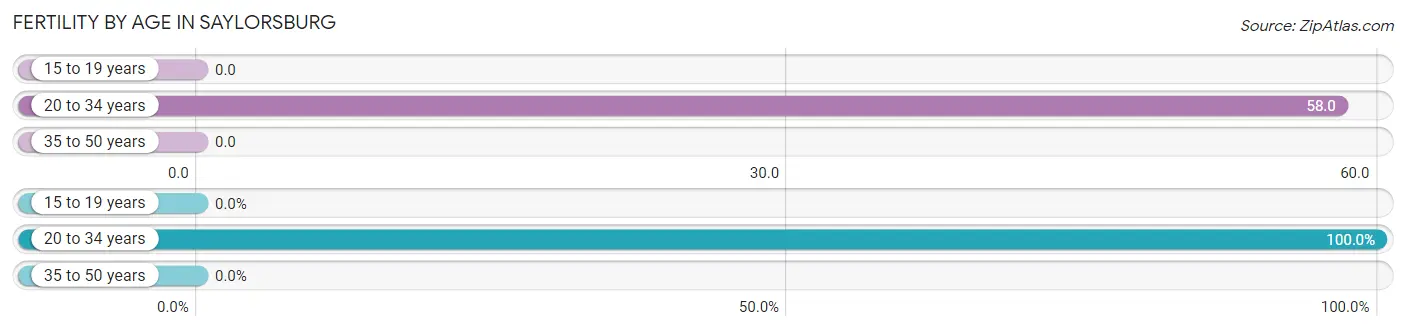
Fertility by Age in Saylorsburg
Average fertility rate in Saylorsburg is 25.0 births per 1,000 women. Women in the age bracket of 20 to 34 years have the highest fertility rate with 58.0 births per 1,000 women. Women in the age bracket of 20 to 34 years acount for 100.0% of all women with births.
| Age Bracket | Women with Births | Births / 1,000 Women |
| 15 to 19 years | 0 (0.0%) | 0.0 |
| 20 to 34 years | 4 (100.0%) | 58.0 |
| 35 to 50 years | 0 (0.0%) | 0.0 |
| Total | 4 (100.0%) | 25.0 |
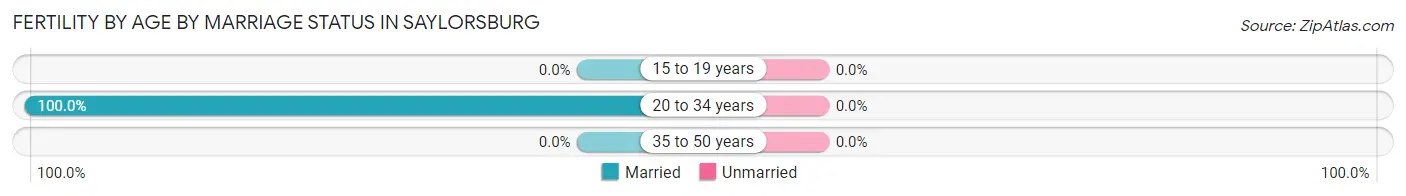
Fertility by Age by Marriage Status in Saylorsburg
| Age Bracket | Married | Unmarried |
| 15 to 19 years | 0 (0.0%) | 0 (0.0%) |
| 20 to 34 years | 4 (100.0%) | 0 (0.0%) |
| 35 to 50 years | 0 (0.0%) | 0 (0.0%) |
| Total | 4 (100.0%) | 0 (0.0%) |
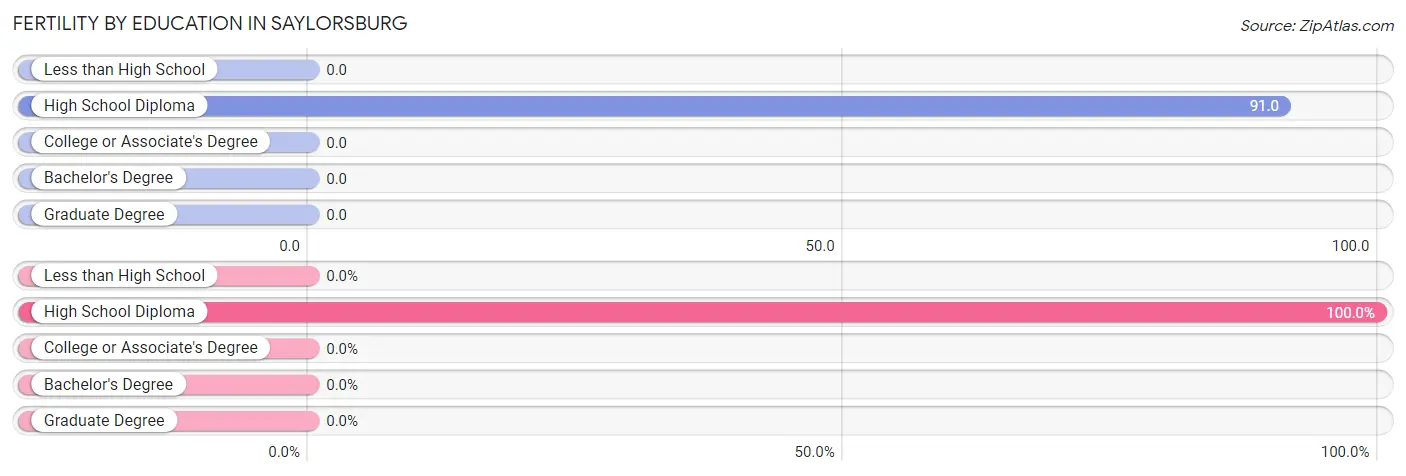
Fertility by Education in Saylorsburg
| Educational Attainment | Women with Births | Births / 1,000 Women |
| Less than High School | 0 (0.0%) | 0.0 |
| High School Diploma | 4 (100.0%) | 91.0 |
| College or Associate's Degree | 0 (0.0%) | 0.0 |
| Bachelor's Degree | 0 (0.0%) | 0.0 |
| Graduate Degree | 0 (0.0%) | 0.0 |
| Total | 4 (100.0%) | 25.0 |
Fertility by Education by Marriage Status in Saylorsburg
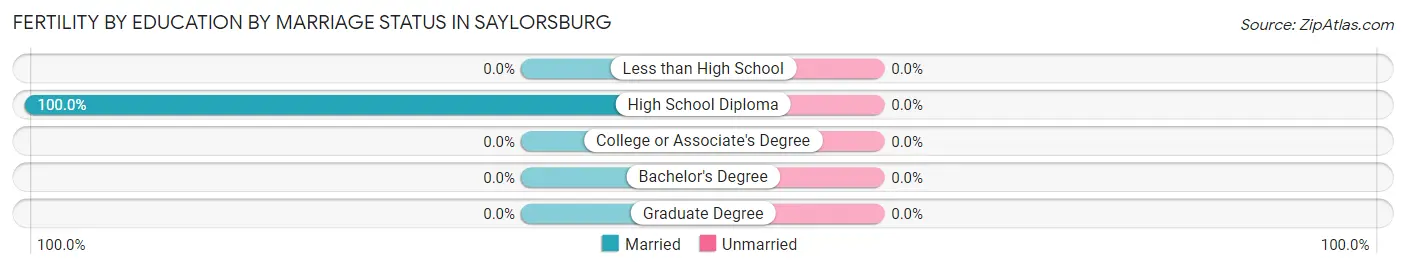
| Educational Attainment | Married | Unmarried |
| Less than High School | 0 (0.0%) | 0 (0.0%) |
| High School Diploma | 4 (100.0%) | 0 (0.0%) |
| College or Associate's Degree | 0 (0.0%) | 0 (0.0%) |
| Bachelor's Degree | 0 (0.0%) | 0 (0.0%) |
| Graduate Degree | 0 (0.0%) | 0 (0.0%) |
| Total | 4 (100.0%) | 0 (0.0%) |
Employment Characteristics in Saylorsburg
Employment by Class of Employer in Saylorsburg
Among the 543 employed individuals in Saylorsburg, private company employees (448 | 82.5%), self-employed (incorporated) (29 | 5.3%), and state government employees (27 | 5.0%) make up the most common classes of employment.
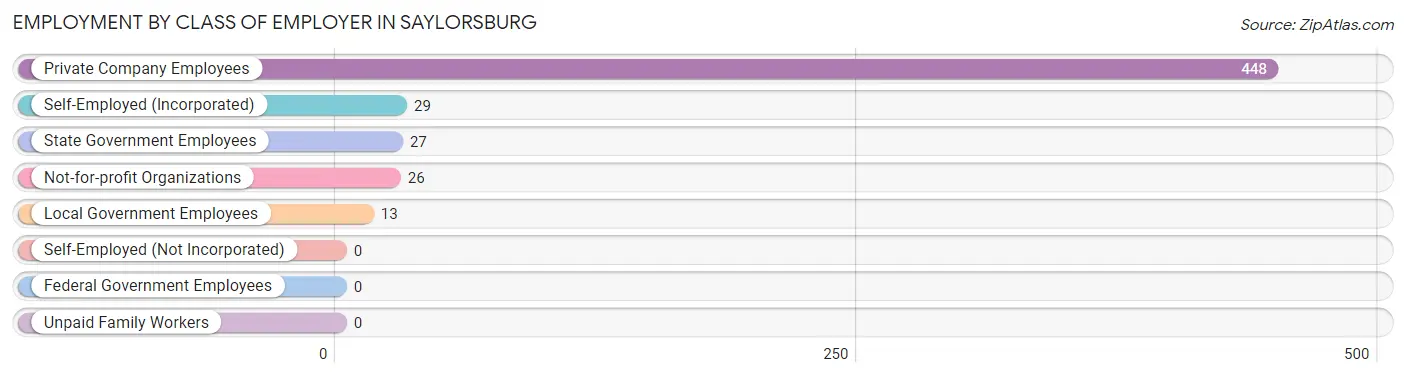
| Employer Class | # Employees | % Employees |
| Private Company Employees | 448 | 82.5% |
| Self-Employed (Incorporated) | 29 | 5.3% |
| Self-Employed (Not Incorporated) | 0 | 0.0% |
| Not-for-profit Organizations | 26 | 4.8% |
| Local Government Employees | 13 | 2.4% |
| State Government Employees | 27 | 5.0% |
| Federal Government Employees | 0 | 0.0% |
| Unpaid Family Workers | 0 | 0.0% |
| Total | 543 | 100.0% |
Employment Status by Age in Saylorsburg
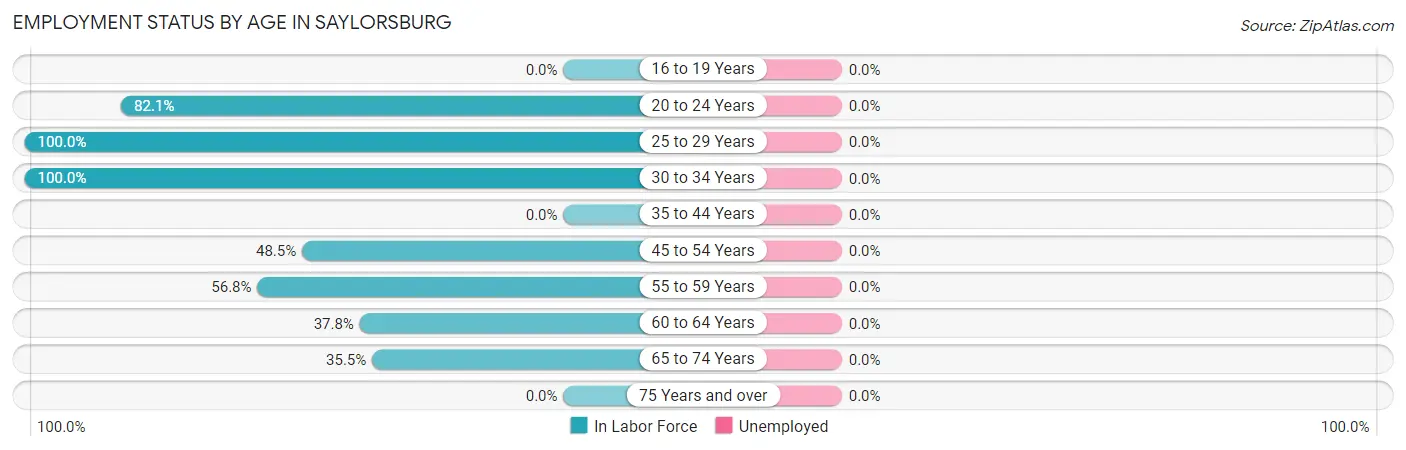
| Age Bracket | In Labor Force | Unemployed |
| 16 to 19 Years | 0 (0.0%) | 0 (0.0%) |
| 20 to 24 Years | 55 (82.1%) | 0 (0.0%) |
| 25 to 29 Years | 265 (100.0%) | 0 (0.0%) |
| 30 to 34 Years | 27 (100.0%) | 0 (0.0%) |
| 35 to 44 Years | 0 (0.0%) | 0 (0.0%) |
| 45 to 54 Years | 82 (48.5%) | 0 (0.0%) |
| 55 to 59 Years | 109 (56.8%) | 0 (0.0%) |
| 60 to 64 Years | 31 (37.8%) | 0 (0.0%) |
| 65 to 74 Years | 11 (35.5%) | 0 (0.0%) |
| 75 Years and over | 0 (0.0%) | 0 (0.0%) |
| Total | 580 (58.5%) | 0 (0.0%) |
Employment Status by Educational Attainment in Saylorsburg
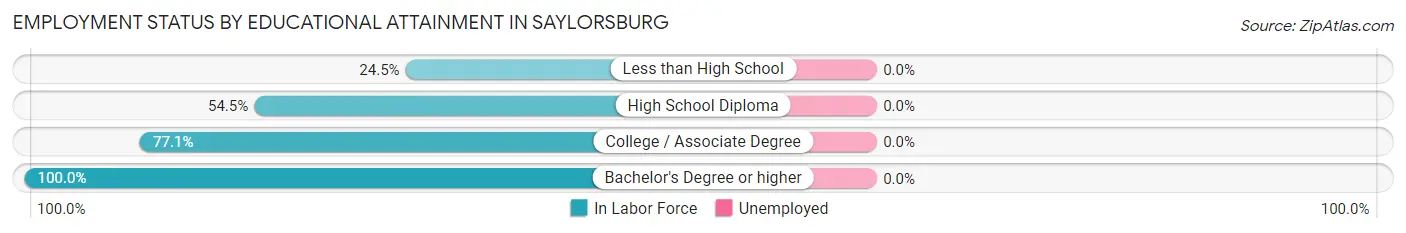
| Educational Attainment | In Labor Force | Unemployed |
| Less than High School | 12 (24.5%) | 0 (0.0%) |
| High School Diploma | 115 (54.5%) | 0 (0.0%) |
| College / Associate Degree | 296 (77.1%) | 0 (0.0%) |
| Bachelor's Degree or higher | 91 (100.0%) | 0 (0.0%) |
| Total | 514 (69.9%) | 0 (0.0%) |
Employment Occupations by Sex in Saylorsburg
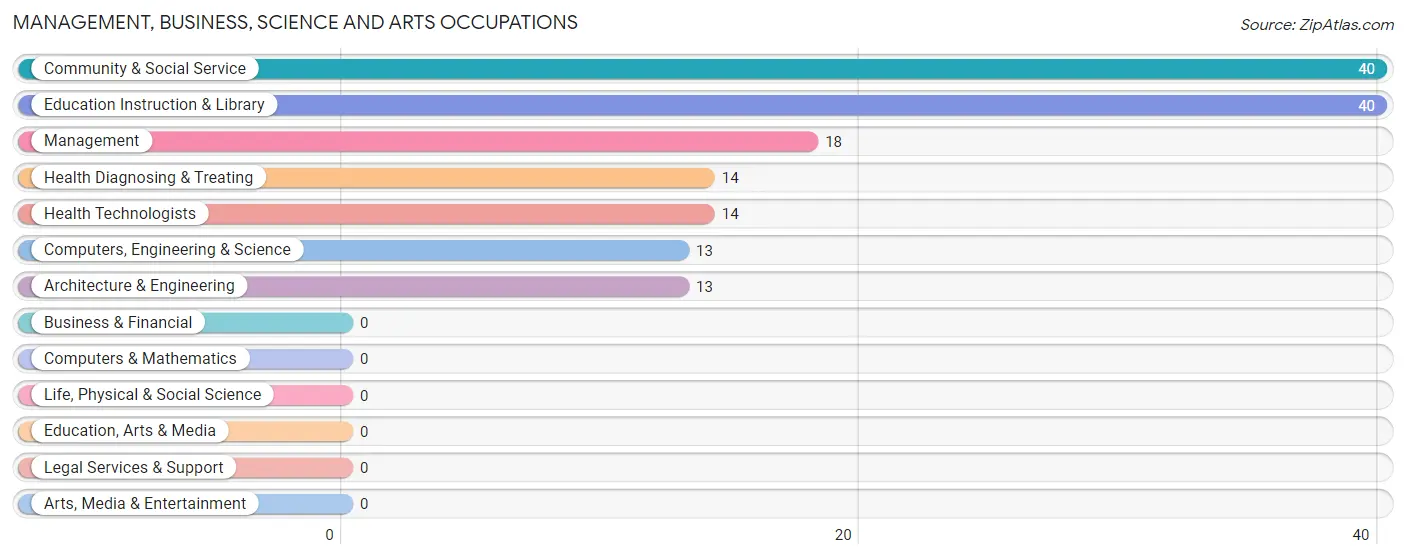
Management, Business, Science and Arts Occupations
The most common Management, Business, Science and Arts occupations in Saylorsburg are Community & Social Service (40 | 6.9%), Education Instruction & Library (40 | 6.9%), Management (18 | 3.1%), Health Diagnosing & Treating (14 | 2.4%), and Health Technologists (14 | 2.4%).
Management, Business, Science and Arts Occupations by Sex
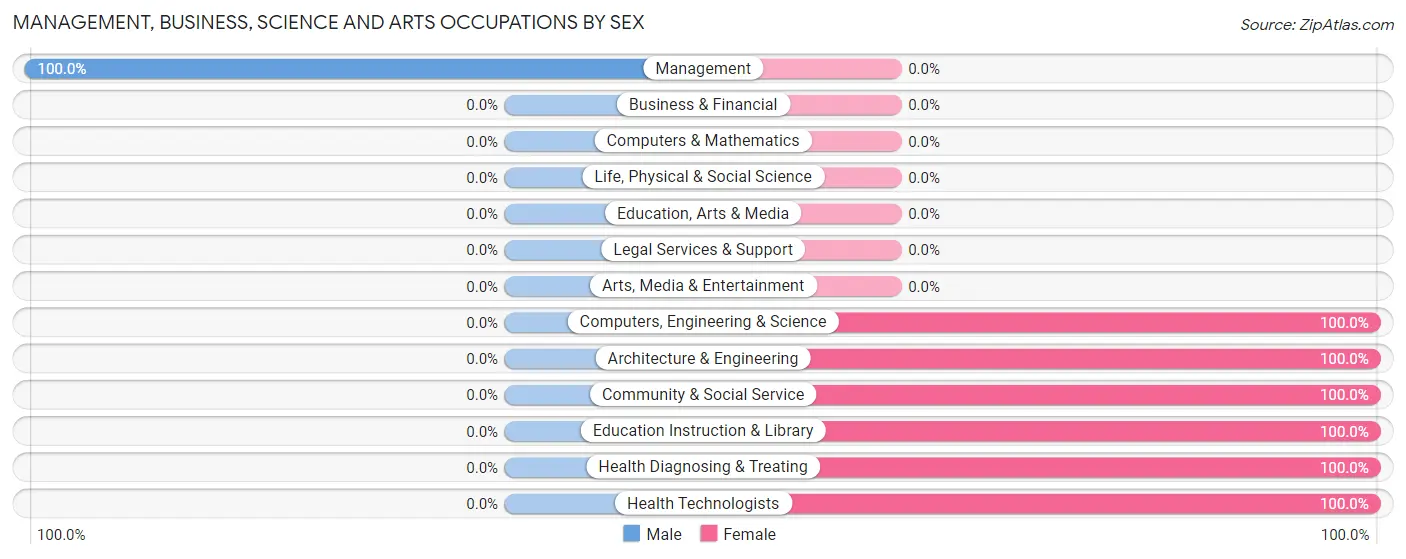
| Occupation | Male | Female |
| Management | 18 (100.0%) | 0 (0.0%) |
| Business & Financial | 0 (0.0%) | 0 (0.0%) |
| Computers, Engineering & Science | 0 (0.0%) | 13 (100.0%) |
| Computers & Mathematics | 0 (0.0%) | 0 (0.0%) |
| Architecture & Engineering | 0 (0.0%) | 13 (100.0%) |
| Life, Physical & Social Science | 0 (0.0%) | 0 (0.0%) |
| Community & Social Service | 0 (0.0%) | 40 (100.0%) |
| Education, Arts & Media | 0 (0.0%) | 0 (0.0%) |
| Legal Services & Support | 0 (0.0%) | 0 (0.0%) |
| Education Instruction & Library | 0 (0.0%) | 40 (100.0%) |
| Arts, Media & Entertainment | 0 (0.0%) | 0 (0.0%) |
| Health Diagnosing & Treating | 0 (0.0%) | 14 (100.0%) |
| Health Technologists | 0 (0.0%) | 14 (100.0%) |
| Total (Category) | 18 (21.2%) | 67 (78.8%) |
| Total (Overall) | 348 (60.0%) | 232 (40.0%) |
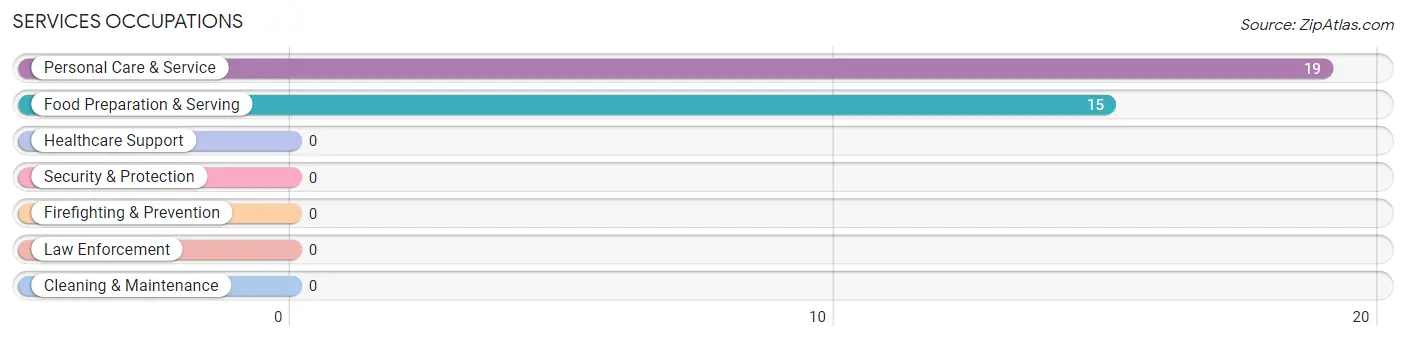
Services Occupations
The most common Services occupations in Saylorsburg are Personal Care & Service (19 | 3.3%), and Food Preparation & Serving (15 | 2.6%).
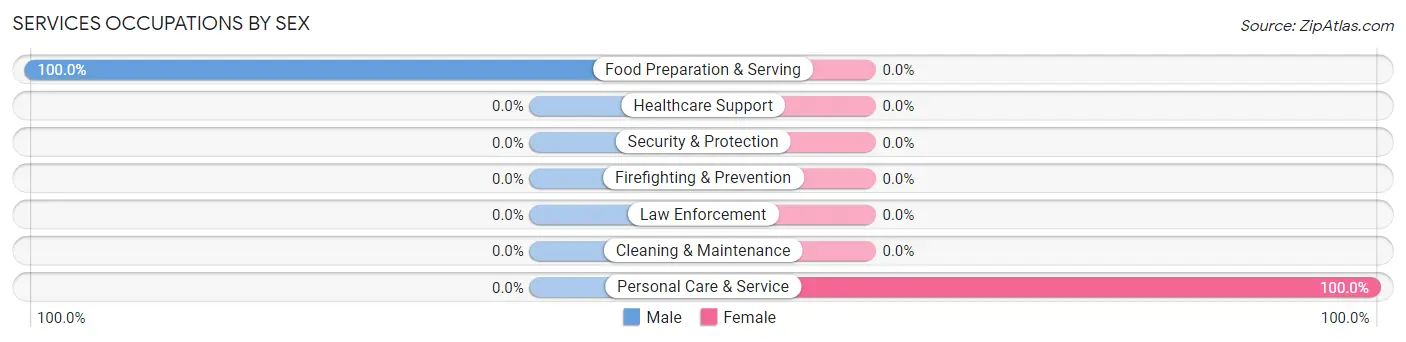
Services Occupations by Sex
| Occupation | Male | Female |
| Healthcare Support | 0 (0.0%) | 0 (0.0%) |
| Security & Protection | 0 (0.0%) | 0 (0.0%) |
| Firefighting & Prevention | 0 (0.0%) | 0 (0.0%) |
| Law Enforcement | 0 (0.0%) | 0 (0.0%) |
| Food Preparation & Serving | 15 (100.0%) | 0 (0.0%) |
| Cleaning & Maintenance | 0 (0.0%) | 0 (0.0%) |
| Personal Care & Service | 0 (0.0%) | 19 (100.0%) |
| Total (Category) | 15 (44.1%) | 19 (55.9%) |
| Total (Overall) | 348 (60.0%) | 232 (40.0%) |
Sales and Office Occupations
The most common Sales and Office occupations in Saylorsburg are Office & Administration (47 | 8.1%), and Sales & Related (7 | 1.2%).
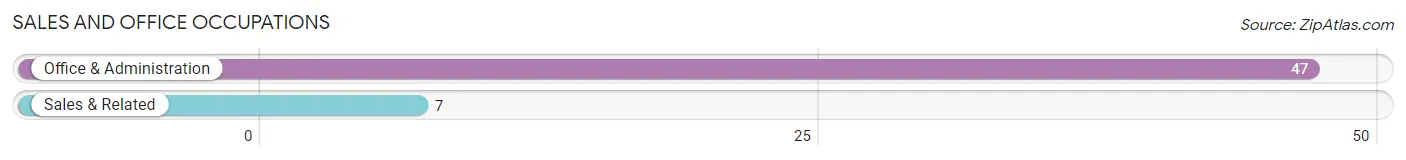
Sales and Office Occupations by Sex
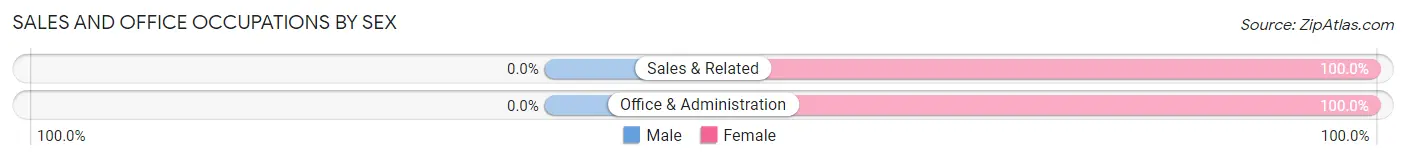
| Occupation | Male | Female |
| Sales & Related | 0 (0.0%) | 7 (100.0%) |
| Office & Administration | 0 (0.0%) | 47 (100.0%) |
| Total (Category) | 0 (0.0%) | 54 (100.0%) |
| Total (Overall) | 348 (60.0%) | 232 (40.0%) |
Natural Resources, Construction and Maintenance Occupations
The most common Natural Resources, Construction and Maintenance occupations in Saylorsburg are Installation, Maintenance & Repair (35 | 6.0%), and Construction & Extraction (11 | 1.9%).
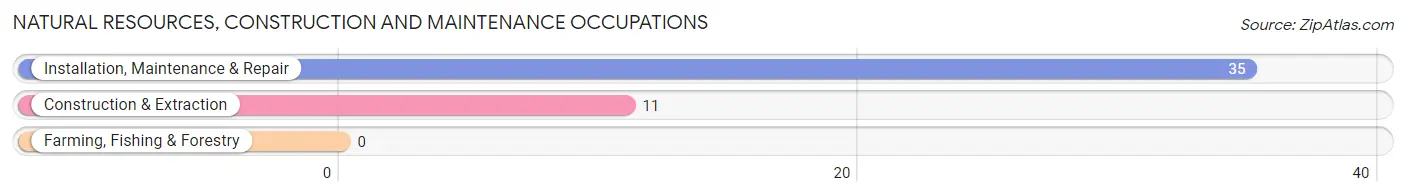
Natural Resources, Construction and Maintenance Occupations by Sex
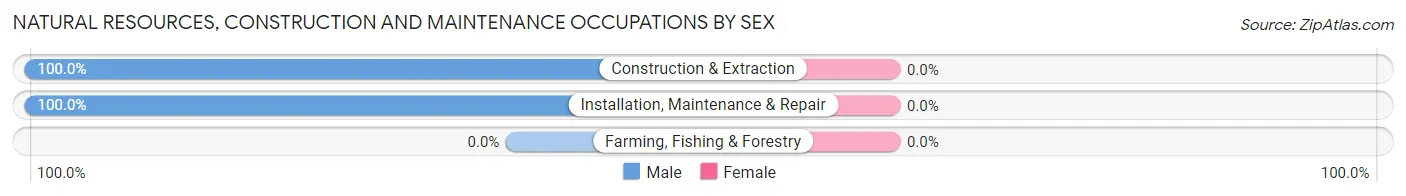
| Occupation | Male | Female |
| Farming, Fishing & Forestry | 0 (0.0%) | 0 (0.0%) |
| Construction & Extraction | 11 (100.0%) | 0 (0.0%) |
| Installation, Maintenance & Repair | 35 (100.0%) | 0 (0.0%) |
| Total (Category) | 46 (100.0%) | 0 (0.0%) |
| Total (Overall) | 348 (60.0%) | 232 (40.0%) |
Production, Transportation and Moving Occupations
The most common Production, Transportation and Moving occupations in Saylorsburg are Transportation (269 | 46.4%), and Material Moving (92 | 15.9%).
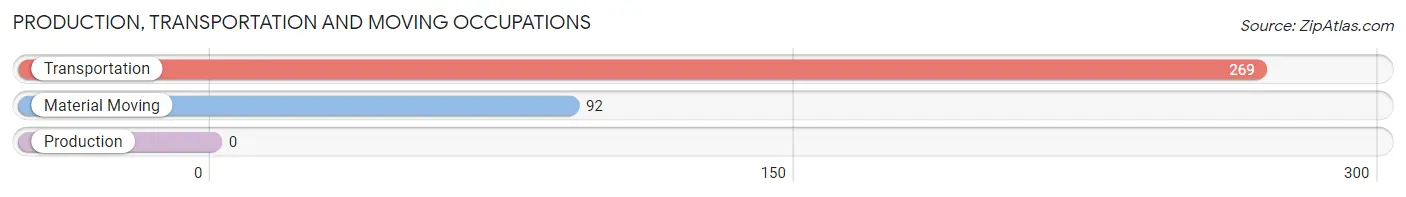
Production, Transportation and Moving Occupations by Sex
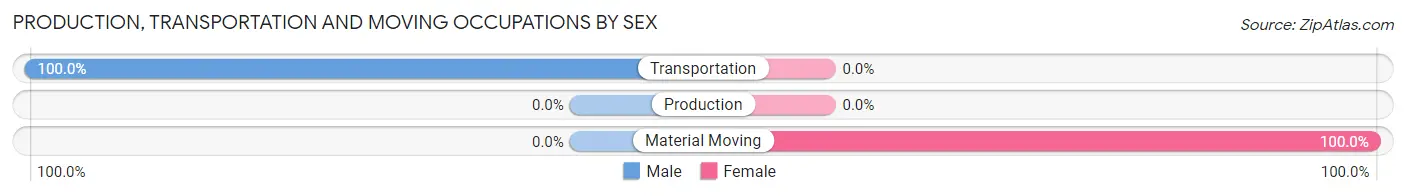
| Occupation | Male | Female |
| Production | 0 (0.0%) | 0 (0.0%) |
| Transportation | 269 (100.0%) | 0 (0.0%) |
| Material Moving | 0 (0.0%) | 92 (100.0%) |
| Total (Category) | 269 (74.5%) | 92 (25.5%) |
| Total (Overall) | 348 (60.0%) | 232 (40.0%) |
Employment Industries by Sex in Saylorsburg
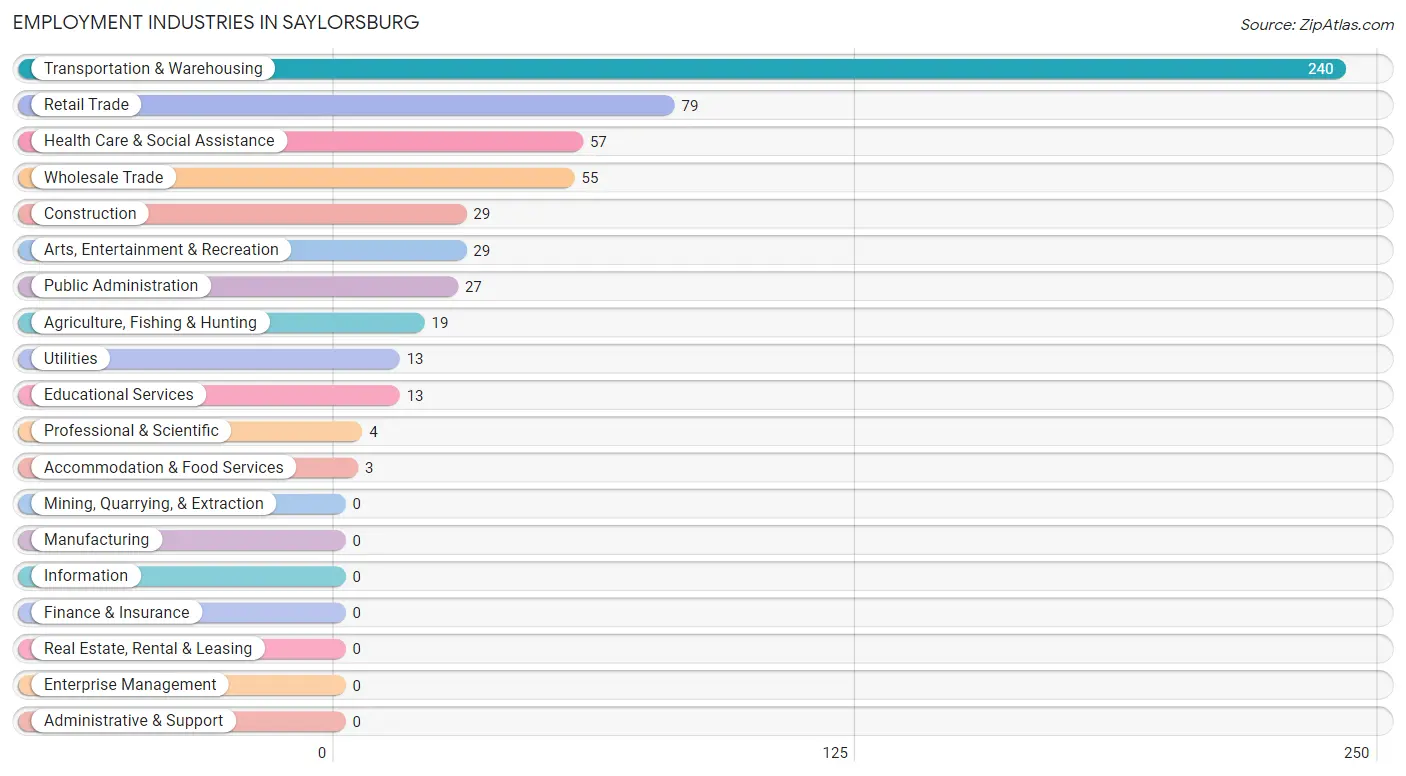
Employment Industries in Saylorsburg
The major employment industries in Saylorsburg include Transportation & Warehousing (240 | 41.4%), Retail Trade (79 | 13.6%), Health Care & Social Assistance (57 | 9.8%), Wholesale Trade (55 | 9.5%), and Construction (29 | 5.0%).
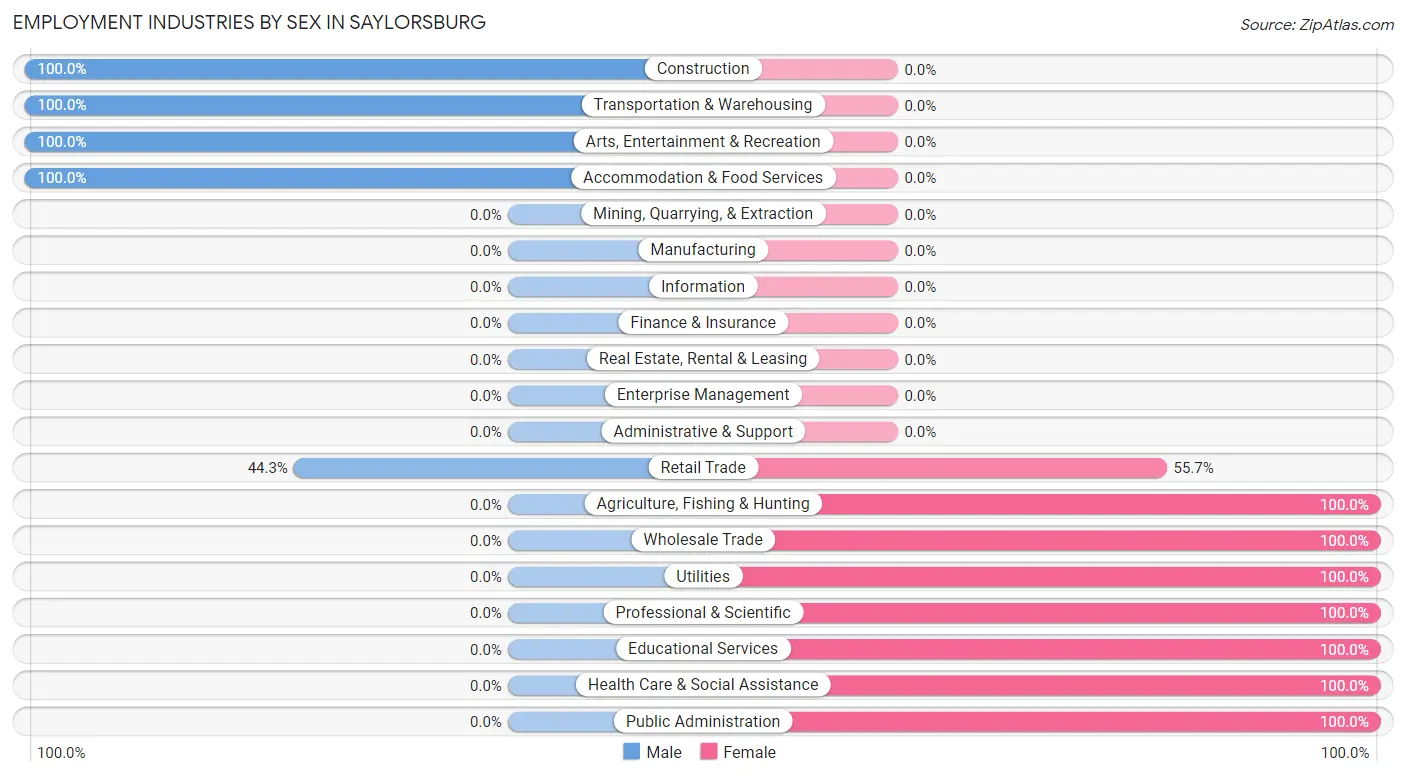
Employment Industries by Sex in Saylorsburg
The Saylorsburg industries that see more men than women are Construction (100.0%), Transportation & Warehousing (100.0%), and Arts, Entertainment & Recreation (100.0%), whereas the industries that tend to have a higher number of women are Agriculture, Fishing & Hunting (100.0%), Wholesale Trade (100.0%), and Utilities (100.0%).
| Industry | Male | Female |
| Agriculture, Fishing & Hunting | 0 (0.0%) | 19 (100.0%) |
| Mining, Quarrying, & Extraction | 0 (0.0%) | 0 (0.0%) |
| Construction | 29 (100.0%) | 0 (0.0%) |
| Manufacturing | 0 (0.0%) | 0 (0.0%) |
| Wholesale Trade | 0 (0.0%) | 55 (100.0%) |
| Retail Trade | 35 (44.3%) | 44 (55.7%) |
| Transportation & Warehousing | 240 (100.0%) | 0 (0.0%) |
| Utilities | 0 (0.0%) | 13 (100.0%) |
| Information | 0 (0.0%) | 0 (0.0%) |
| Finance & Insurance | 0 (0.0%) | 0 (0.0%) |
| Real Estate, Rental & Leasing | 0 (0.0%) | 0 (0.0%) |
| Professional & Scientific | 0 (0.0%) | 4 (100.0%) |
| Enterprise Management | 0 (0.0%) | 0 (0.0%) |
| Administrative & Support | 0 (0.0%) | 0 (0.0%) |
| Educational Services | 0 (0.0%) | 13 (100.0%) |
| Health Care & Social Assistance | 0 (0.0%) | 57 (100.0%) |
| Arts, Entertainment & Recreation | 29 (100.0%) | 0 (0.0%) |
| Accommodation & Food Services | 3 (100.0%) | 0 (0.0%) |
| Public Administration | 0 (0.0%) | 27 (100.0%) |
| Total | 348 (60.0%) | 232 (40.0%) |
Education in Saylorsburg
School Enrollment in Saylorsburg
The most common levels of schooling among the 160 students in Saylorsburg are high school (63 | 39.4%), middle school (37 | 23.1%), and college / undergraduate (33 | 20.6%).
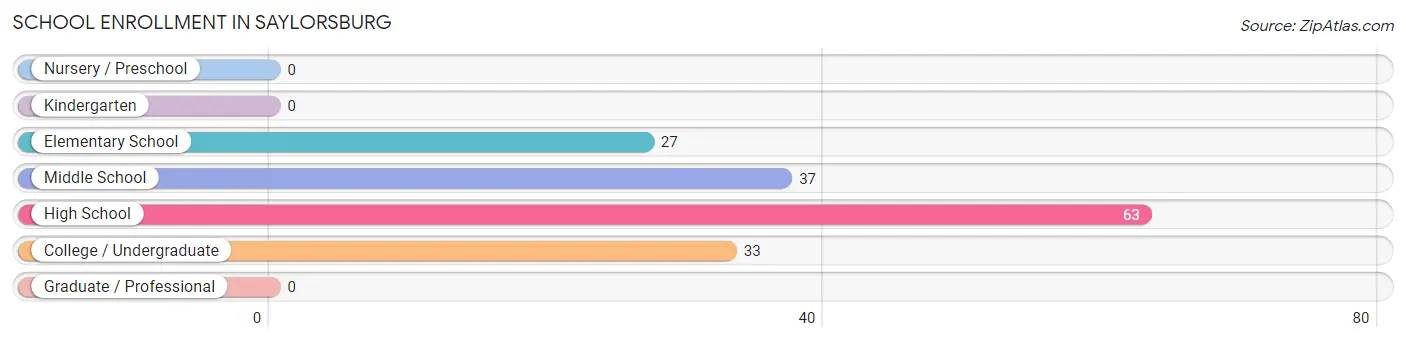
| School Level | # Students | % Students |
| Nursery / Preschool | 0 | 0.0% |
| Kindergarten | 0 | 0.0% |
| Elementary School | 27 | 16.9% |
| Middle School | 37 | 23.1% |
| High School | 63 | 39.4% |
| College / Undergraduate | 33 | 20.6% |
| Graduate / Professional | 0 | 0.0% |
| Total | 160 | 100.0% |
School Enrollment by Age by Funding Source in Saylorsburg
Out of a total of 160 students who are enrolled in schools in Saylorsburg, 21 (13.1%) attend a private institution, while the remaining 139 (86.9%) are enrolled in public schools. The age group of 18 to 19 year olds has the highest likelihood of being enrolled in private schools, with 21 (52.5% in the age bracket) enrolled. Conversely, the age group of 5 to 9 year old has the lowest likelihood of being enrolled in a private school, with 27 (100.0% in the age bracket) attending a public institution.
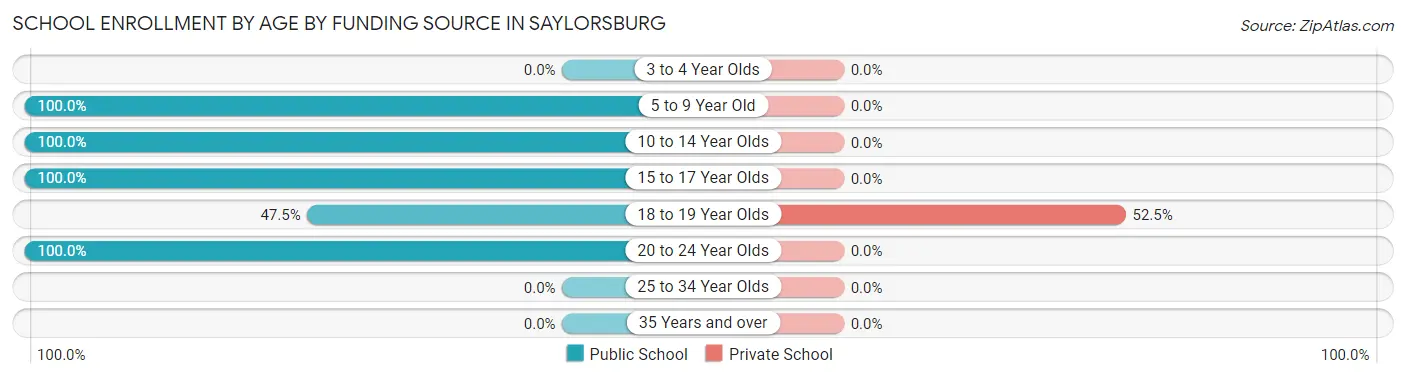
| Age Bracket | Public School | Private School |
| 3 to 4 Year Olds | 0 (0.0%) | 0 (0.0%) |
| 5 to 9 Year Old | 27 (100.0%) | 0 (0.0%) |
| 10 to 14 Year Olds | 37 (100.0%) | 0 (0.0%) |
| 15 to 17 Year Olds | 44 (100.0%) | 0 (0.0%) |
| 18 to 19 Year Olds | 19 (47.5%) | 21 (52.5%) |
| 20 to 24 Year Olds | 12 (100.0%) | 0 (0.0%) |
| 25 to 34 Year Olds | 0 (0.0%) | 0 (0.0%) |
| 35 Years and over | 0 (0.0%) | 0 (0.0%) |
| Total | 139 (86.9%) | 21 (13.1%) |
Educational Attainment by Field of Study in Saylorsburg
Science & technology (41 | 39.4%), visual & performing arts (37 | 35.6%), business (13 | 12.5%), and education (13 | 12.5%) are the most common fields of study among 104 individuals in Saylorsburg who have obtained a bachelor's degree or higher.
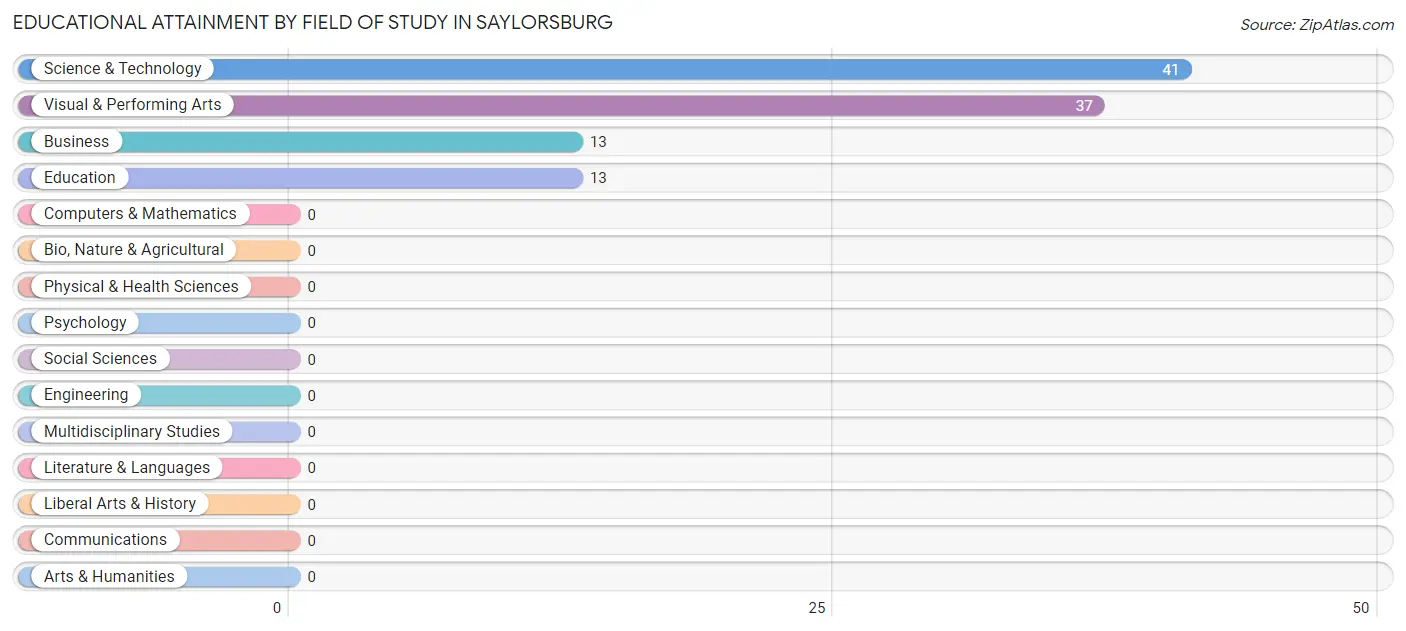
| Field of Study | # Graduates | % Graduates |
| Computers & Mathematics | 0 | 0.0% |
| Bio, Nature & Agricultural | 0 | 0.0% |
| Physical & Health Sciences | 0 | 0.0% |
| Psychology | 0 | 0.0% |
| Social Sciences | 0 | 0.0% |
| Engineering | 0 | 0.0% |
| Multidisciplinary Studies | 0 | 0.0% |
| Science & Technology | 41 | 39.4% |
| Business | 13 | 12.5% |
| Education | 13 | 12.5% |
| Literature & Languages | 0 | 0.0% |
| Liberal Arts & History | 0 | 0.0% |
| Visual & Performing Arts | 37 | 35.6% |
| Communications | 0 | 0.0% |
| Arts & Humanities | 0 | 0.0% |
| Total | 104 | 100.0% |
Transportation & Commute in Saylorsburg
Vehicle Availability by Sex in Saylorsburg
The most prevalent vehicle ownership categories in Saylorsburg are males with 1 vehicle (240, accounting for 69.0%) and females with 1 vehicle (13, making up 123.1%).
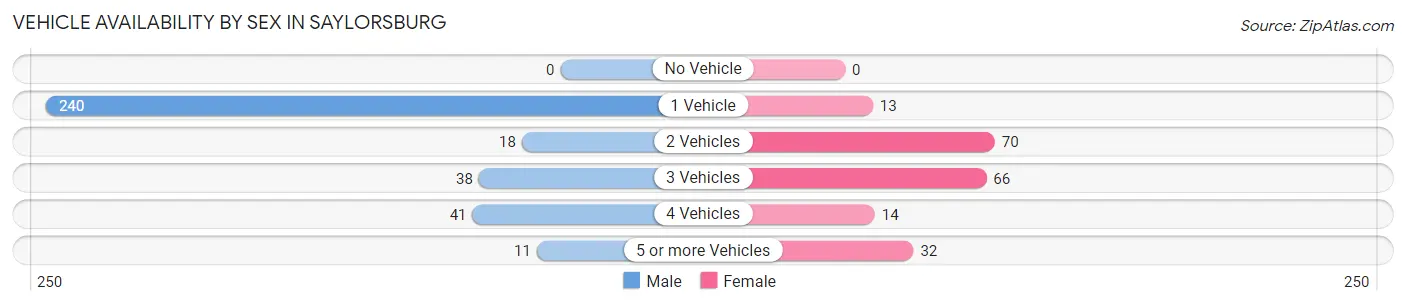
| Vehicles Available | Male | Female |
| No Vehicle | 0 (0.0%) | 0 (0.0%) |
| 1 Vehicle | 240 (69.0%) | 13 (6.7%) |
| 2 Vehicles | 18 (5.2%) | 70 (35.9%) |
| 3 Vehicles | 38 (10.9%) | 66 (33.9%) |
| 4 Vehicles | 41 (11.8%) | 14 (7.2%) |
| 5 or more Vehicles | 11 (3.2%) | 32 (16.4%) |
| Total | 348 (100.0%) | 195 (100.0%) |
Commute Time in Saylorsburg
The most frequently occuring commute durations in Saylorsburg are 90 or more minutes (240 commuters, 44.2%), 15 to 19 minutes (115 commuters, 21.2%), and 5 to 9 minutes (55 commuters, 10.1%).
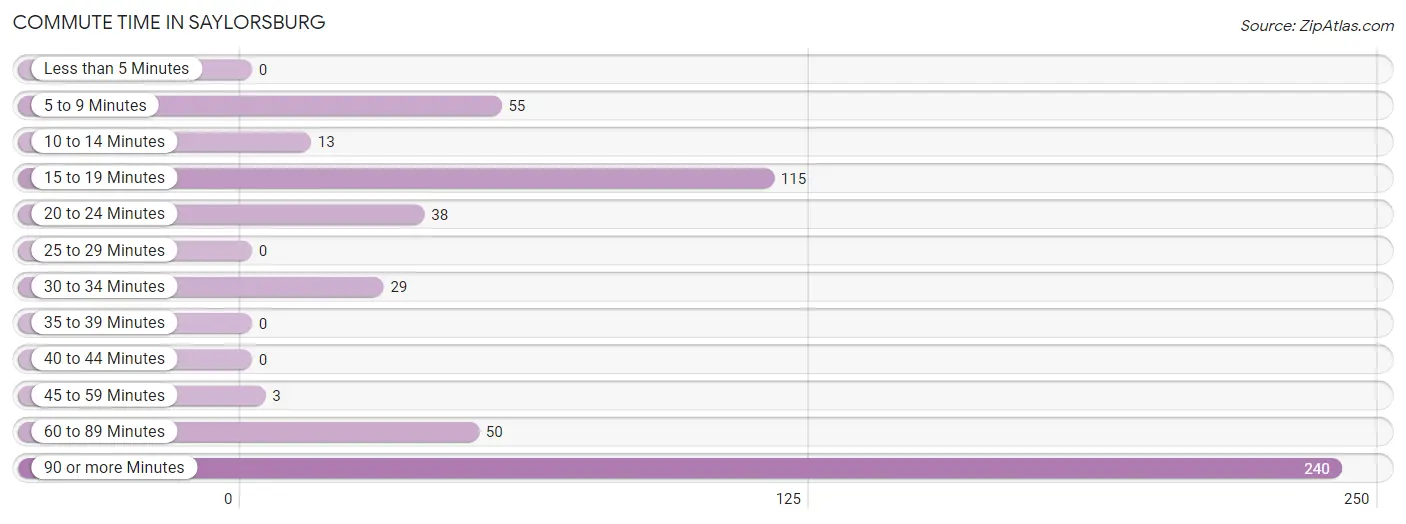
| Commute Time | # Commuters | % Commuters |
| Less than 5 Minutes | 0 | 0.0% |
| 5 to 9 Minutes | 55 | 10.1% |
| 10 to 14 Minutes | 13 | 2.4% |
| 15 to 19 Minutes | 115 | 21.2% |
| 20 to 24 Minutes | 38 | 7.0% |
| 25 to 29 Minutes | 0 | 0.0% |
| 30 to 34 Minutes | 29 | 5.3% |
| 35 to 39 Minutes | 0 | 0.0% |
| 40 to 44 Minutes | 0 | 0.0% |
| 45 to 59 Minutes | 3 | 0.5% |
| 60 to 89 Minutes | 50 | 9.2% |
| 90 or more Minutes | 240 | 44.2% |
Commute Time by Sex in Saylorsburg
The most common commute times in Saylorsburg are 90 or more minutes (240 commuters, 69.0%) for males and 15 to 19 minutes (62 commuters, 31.8%) for females.
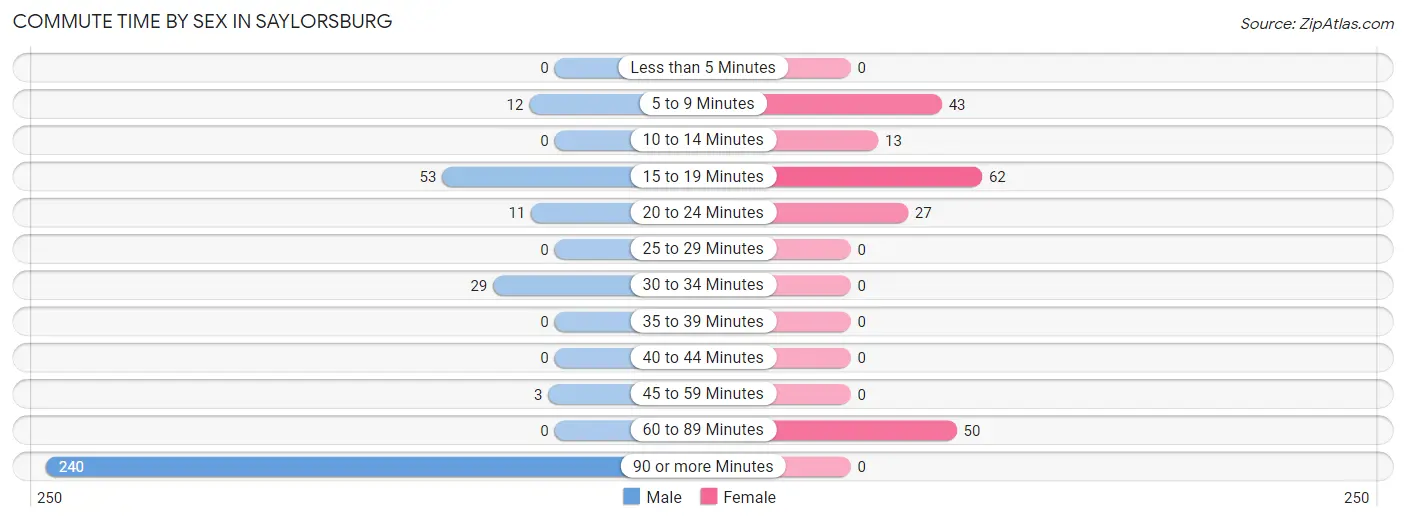
| Commute Time | Male | Female |
| Less than 5 Minutes | 0 (0.0%) | 0 (0.0%) |
| 5 to 9 Minutes | 12 (3.5%) | 43 (22.1%) |
| 10 to 14 Minutes | 0 (0.0%) | 13 (6.7%) |
| 15 to 19 Minutes | 53 (15.2%) | 62 (31.8%) |
| 20 to 24 Minutes | 11 (3.2%) | 27 (13.9%) |
| 25 to 29 Minutes | 0 (0.0%) | 0 (0.0%) |
| 30 to 34 Minutes | 29 (8.3%) | 0 (0.0%) |
| 35 to 39 Minutes | 0 (0.0%) | 0 (0.0%) |
| 40 to 44 Minutes | 0 (0.0%) | 0 (0.0%) |
| 45 to 59 Minutes | 3 (0.9%) | 0 (0.0%) |
| 60 to 89 Minutes | 0 (0.0%) | 50 (25.6%) |
| 90 or more Minutes | 240 (69.0%) | 0 (0.0%) |
Time of Departure to Work by Sex in Saylorsburg
The most frequent times of departure to work in Saylorsburg are 12:00 PM to 3:59 PM (243, 69.8%) for males and 7:00 AM to 7:29 AM (98, 50.3%) for females.
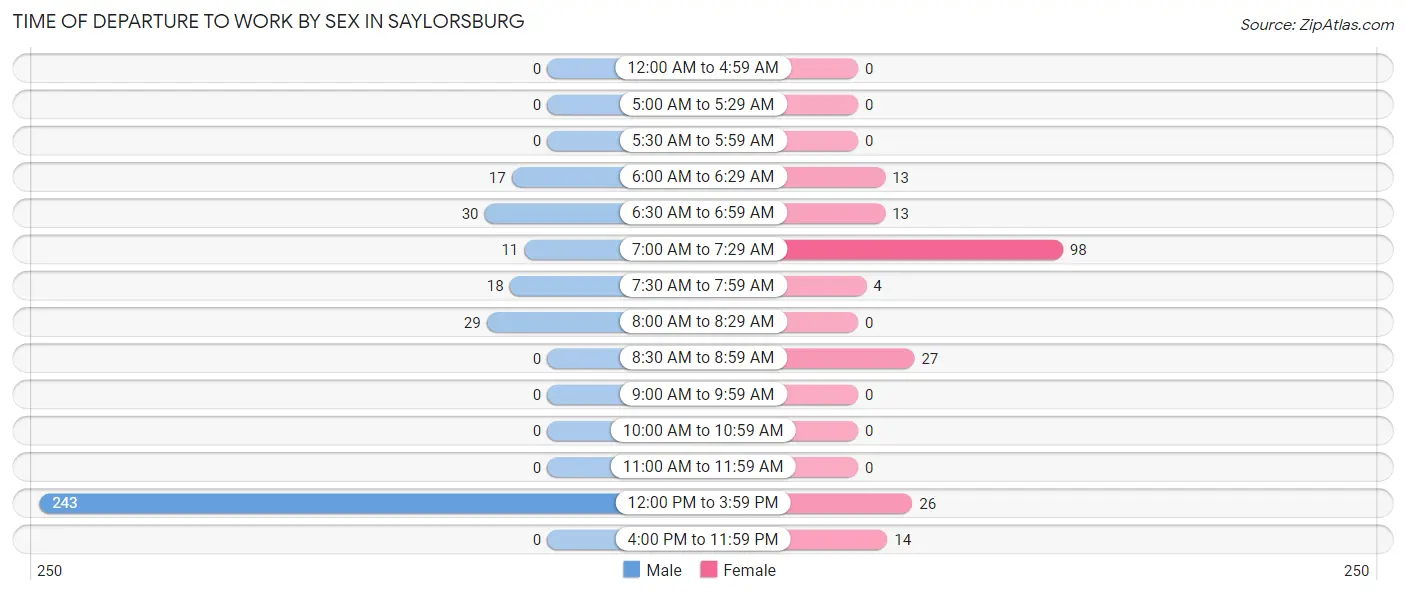
| Time of Departure | Male | Female |
| 12:00 AM to 4:59 AM | 0 (0.0%) | 0 (0.0%) |
| 5:00 AM to 5:29 AM | 0 (0.0%) | 0 (0.0%) |
| 5:30 AM to 5:59 AM | 0 (0.0%) | 0 (0.0%) |
| 6:00 AM to 6:29 AM | 17 (4.9%) | 13 (6.7%) |
| 6:30 AM to 6:59 AM | 30 (8.6%) | 13 (6.7%) |
| 7:00 AM to 7:29 AM | 11 (3.2%) | 98 (50.3%) |
| 7:30 AM to 7:59 AM | 18 (5.2%) | 4 (2.1%) |
| 8:00 AM to 8:29 AM | 29 (8.3%) | 0 (0.0%) |
| 8:30 AM to 8:59 AM | 0 (0.0%) | 27 (13.9%) |
| 9:00 AM to 9:59 AM | 0 (0.0%) | 0 (0.0%) |
| 10:00 AM to 10:59 AM | 0 (0.0%) | 0 (0.0%) |
| 11:00 AM to 11:59 AM | 0 (0.0%) | 0 (0.0%) |
| 12:00 PM to 3:59 PM | 243 (69.8%) | 26 (13.3%) |
| 4:00 PM to 11:59 PM | 0 (0.0%) | 14 (7.2%) |
| Total | 348 (100.0%) | 195 (100.0%) |
Housing Occupancy in Saylorsburg
Occupancy by Ownership in Saylorsburg
Of the total 554 dwellings in Saylorsburg, owner-occupied units account for 214 (38.6%), while renter-occupied units make up 340 (61.4%).
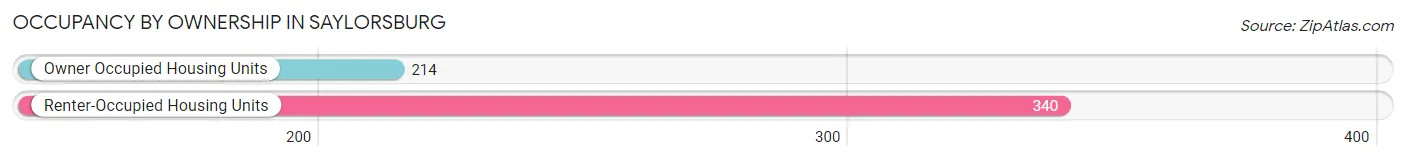
| Occupancy | # Housing Units | % Housing Units |
| Owner Occupied Housing Units | 214 | 38.6% |
| Renter-Occupied Housing Units | 340 | 61.4% |
| Total Occupied Housing Units | 554 | 100.0% |
Occupancy by Household Size in Saylorsburg
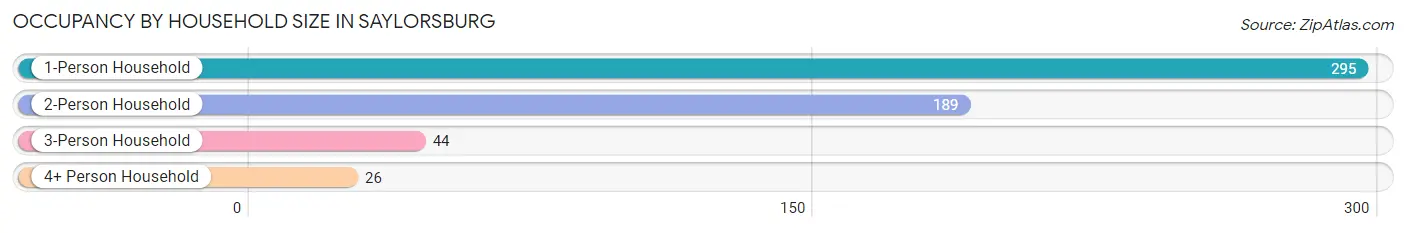
| Household Size | # Housing Units | % Housing Units |
| 1-Person Household | 295 | 53.2% |
| 2-Person Household | 189 | 34.1% |
| 3-Person Household | 44 | 7.9% |
| 4+ Person Household | 26 | 4.7% |
| Total Housing Units | 554 | 100.0% |
Occupancy by Ownership by Household Size in Saylorsburg
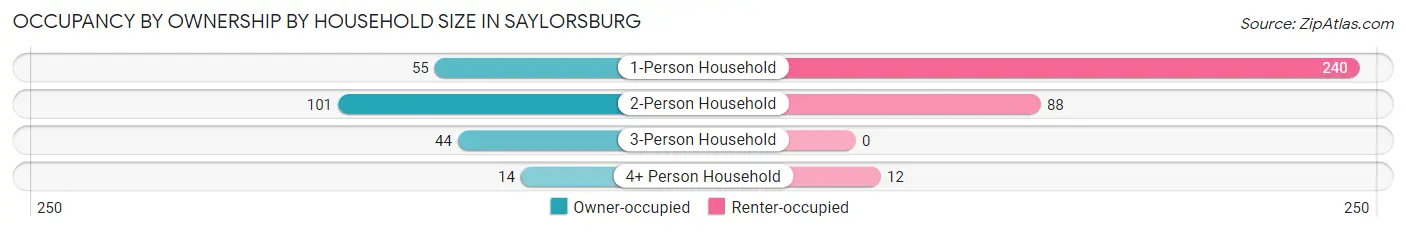
| Household Size | Owner-occupied | Renter-occupied |
| 1-Person Household | 55 (18.6%) | 240 (81.4%) |
| 2-Person Household | 101 (53.4%) | 88 (46.6%) |
| 3-Person Household | 44 (100.0%) | 0 (0.0%) |
| 4+ Person Household | 14 (53.8%) | 12 (46.2%) |
| Total Housing Units | 214 (38.6%) | 340 (61.4%) |
Occupancy by Educational Attainment in Saylorsburg
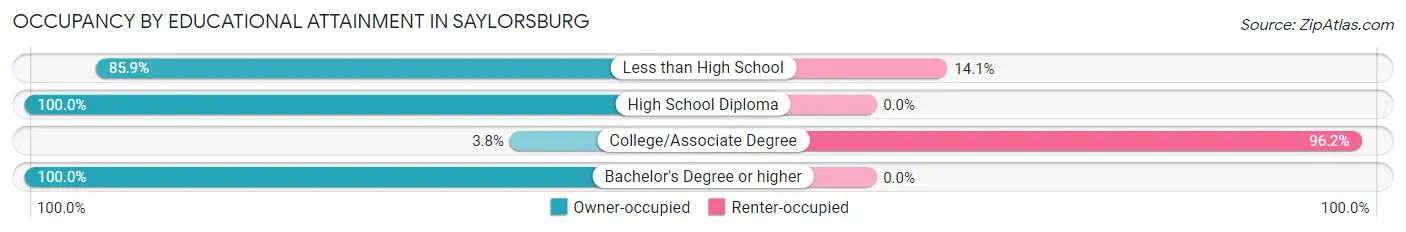
| Household Size | Owner-occupied | Renter-occupied |
| Less than High School | 73 (85.9%) | 12 (14.1%) |
| High School Diploma | 74 (100.0%) | 0 (0.0%) |
| College/Associate Degree | 13 (3.8%) | 328 (96.2%) |
| Bachelor's Degree or higher | 54 (100.0%) | 0 (0.0%) |
Occupancy by Age of Householder in Saylorsburg
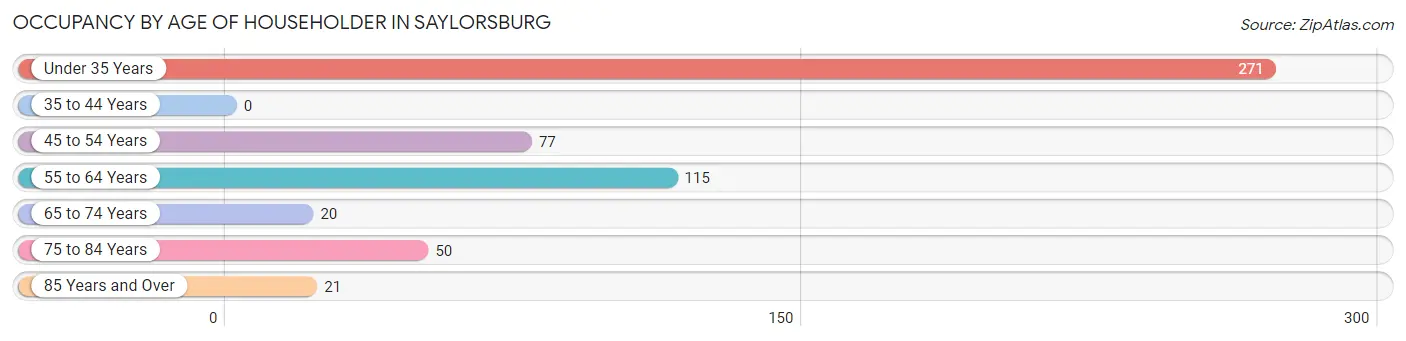
| Age Bracket | # Households | % Households |
| Under 35 Years | 271 | 48.9% |
| 35 to 44 Years | 0 | 0.0% |
| 45 to 54 Years | 77 | 13.9% |
| 55 to 64 Years | 115 | 20.8% |
| 65 to 74 Years | 20 | 3.6% |
| 75 to 84 Years | 50 | 9.0% |
| 85 Years and Over | 21 | 3.8% |
| Total | 554 | 100.0% |
Housing Finances in Saylorsburg
Median Income by Occupancy in Saylorsburg
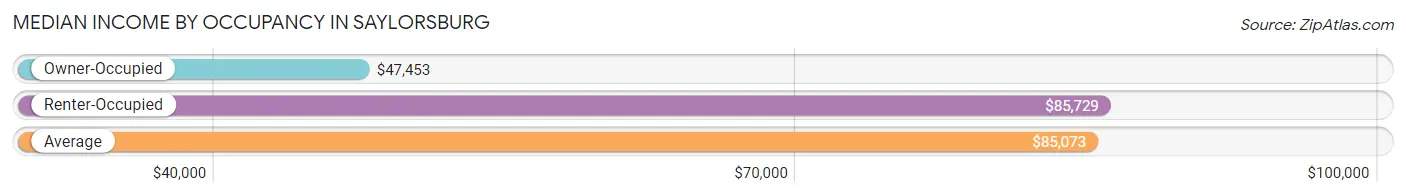
| Occupancy Type | # Households | Median Income |
| Owner-Occupied | 214 (38.6%) | $47,453 |
| Renter-Occupied | 340 (61.4%) | $85,729 |
| Average | 554 (100.0%) | $85,073 |
Occupancy by Householder Income Bracket in Saylorsburg
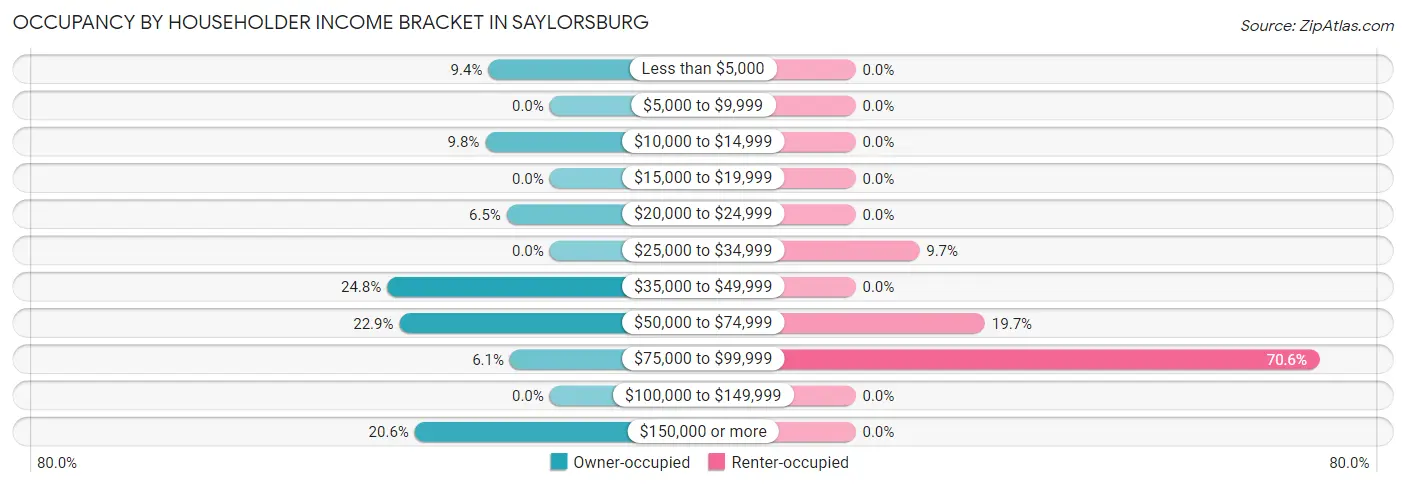
| Income Bracket | Owner-occupied | Renter-occupied |
| Less than $5,000 | 20 (9.3%) | 0 (0.0%) |
| $5,000 to $9,999 | 0 (0.0%) | 0 (0.0%) |
| $10,000 to $14,999 | 21 (9.8%) | 0 (0.0%) |
| $15,000 to $19,999 | 0 (0.0%) | 0 (0.0%) |
| $20,000 to $24,999 | 14 (6.5%) | 0 (0.0%) |
| $25,000 to $34,999 | 0 (0.0%) | 33 (9.7%) |
| $35,000 to $49,999 | 53 (24.8%) | 0 (0.0%) |
| $50,000 to $74,999 | 49 (22.9%) | 67 (19.7%) |
| $75,000 to $99,999 | 13 (6.1%) | 240 (70.6%) |
| $100,000 to $149,999 | 0 (0.0%) | 0 (0.0%) |
| $150,000 or more | 44 (20.6%) | 0 (0.0%) |
| Total | 214 (100.0%) | 340 (100.0%) |
Monthly Housing Cost Tiers in Saylorsburg
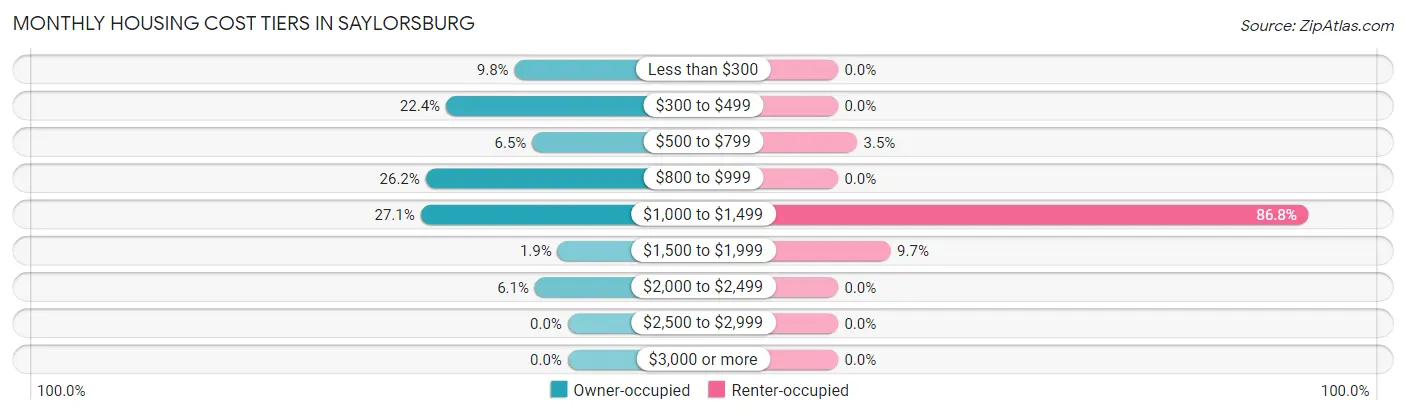
| Monthly Cost | Owner-occupied | Renter-occupied |
| Less than $300 | 21 (9.8%) | 0 (0.0%) |
| $300 to $499 | 48 (22.4%) | 0 (0.0%) |
| $500 to $799 | 14 (6.5%) | 12 (3.5%) |
| $800 to $999 | 56 (26.2%) | 0 (0.0%) |
| $1,000 to $1,499 | 58 (27.1%) | 295 (86.8%) |
| $1,500 to $1,999 | 4 (1.9%) | 33 (9.7%) |
| $2,000 to $2,499 | 13 (6.1%) | 0 (0.0%) |
| $2,500 to $2,999 | 0 (0.0%) | 0 (0.0%) |
| $3,000 or more | 0 (0.0%) | 0 (0.0%) |
| Total | 214 (100.0%) | 340 (100.0%) |
Physical Housing Characteristics in Saylorsburg
Housing Structures in Saylorsburg
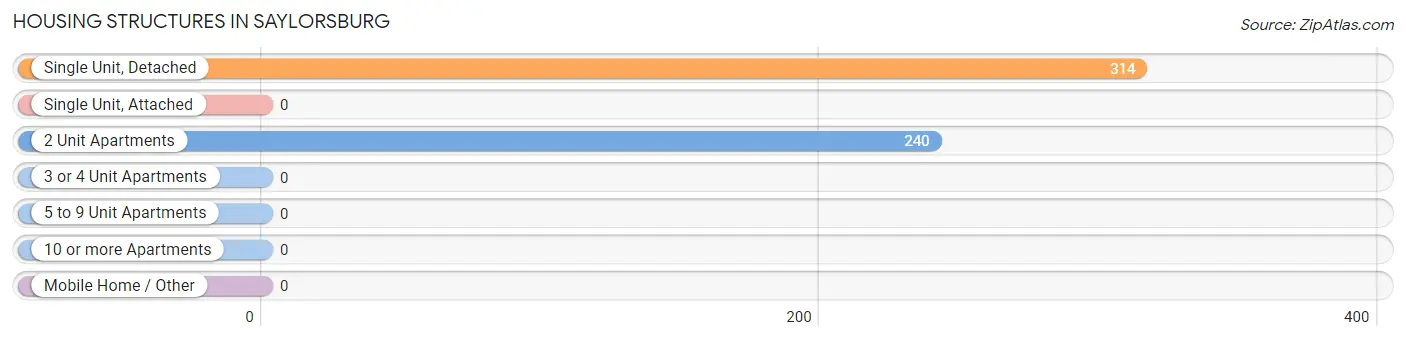
| Structure Type | # Housing Units | % Housing Units |
| Single Unit, Detached | 314 | 56.7% |
| Single Unit, Attached | 0 | 0.0% |
| 2 Unit Apartments | 240 | 43.3% |
| 3 or 4 Unit Apartments | 0 | 0.0% |
| 5 to 9 Unit Apartments | 0 | 0.0% |
| 10 or more Apartments | 0 | 0.0% |
| Mobile Home / Other | 0 | 0.0% |
| Total | 554 | 100.0% |
Housing Structures by Occupancy in Saylorsburg
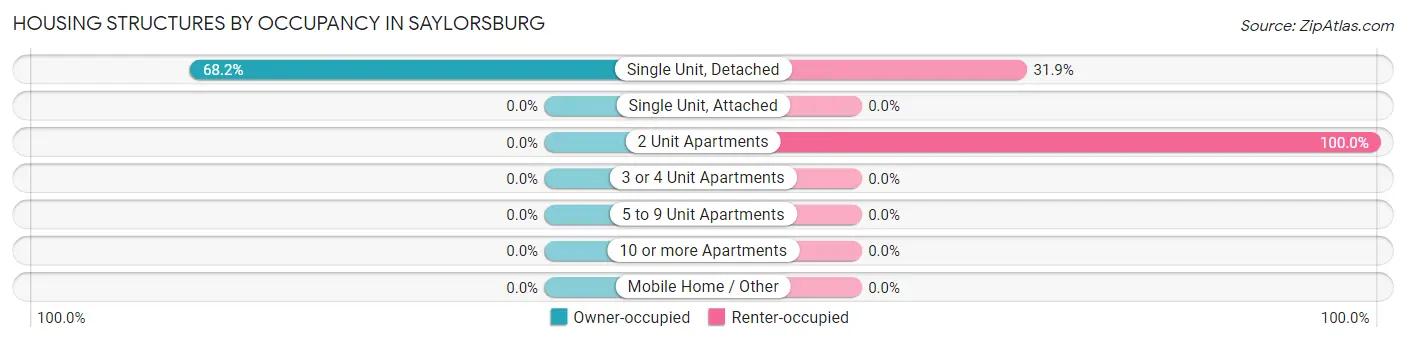
| Structure Type | Owner-occupied | Renter-occupied |
| Single Unit, Detached | 214 (68.1%) | 100 (31.9%) |
| Single Unit, Attached | 0 (0.0%) | 0 (0.0%) |
| 2 Unit Apartments | 0 (0.0%) | 240 (100.0%) |
| 3 or 4 Unit Apartments | 0 (0.0%) | 0 (0.0%) |
| 5 to 9 Unit Apartments | 0 (0.0%) | 0 (0.0%) |
| 10 or more Apartments | 0 (0.0%) | 0 (0.0%) |
| Mobile Home / Other | 0 (0.0%) | 0 (0.0%) |
| Total | 214 (38.6%) | 340 (61.4%) |
Housing Structures by Number of Rooms in Saylorsburg
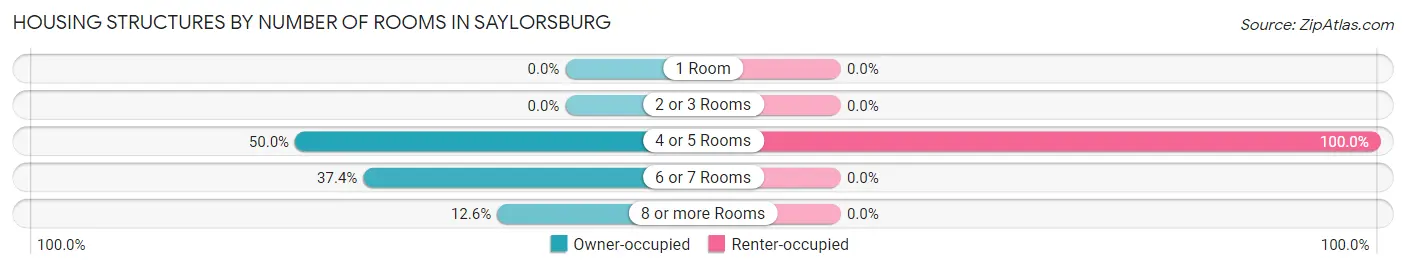
| Number of Rooms | Owner-occupied | Renter-occupied |
| 1 Room | 0 (0.0%) | 0 (0.0%) |
| 2 or 3 Rooms | 0 (0.0%) | 0 (0.0%) |
| 4 or 5 Rooms | 107 (50.0%) | 340 (100.0%) |
| 6 or 7 Rooms | 80 (37.4%) | 0 (0.0%) |
| 8 or more Rooms | 27 (12.6%) | 0 (0.0%) |
| Total | 214 (100.0%) | 340 (100.0%) |
Housing Structure by Heating Type in Saylorsburg
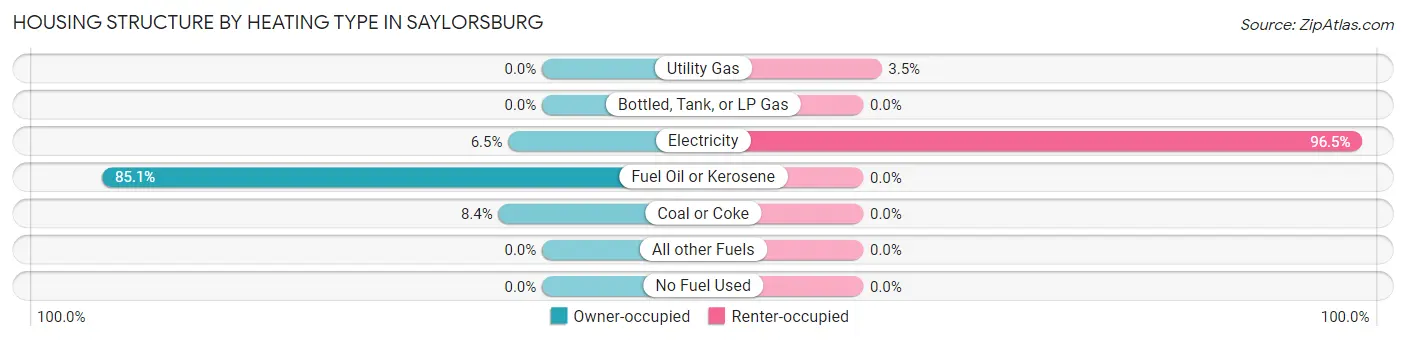
| Heating Type | Owner-occupied | Renter-occupied |
| Utility Gas | 0 (0.0%) | 12 (3.5%) |
| Bottled, Tank, or LP Gas | 0 (0.0%) | 0 (0.0%) |
| Electricity | 14 (6.5%) | 328 (96.5%) |
| Fuel Oil or Kerosene | 182 (85.1%) | 0 (0.0%) |
| Coal or Coke | 18 (8.4%) | 0 (0.0%) |
| All other Fuels | 0 (0.0%) | 0 (0.0%) |
| No Fuel Used | 0 (0.0%) | 0 (0.0%) |
| Total | 214 (100.0%) | 340 (100.0%) |
Household Vehicle Usage in Saylorsburg
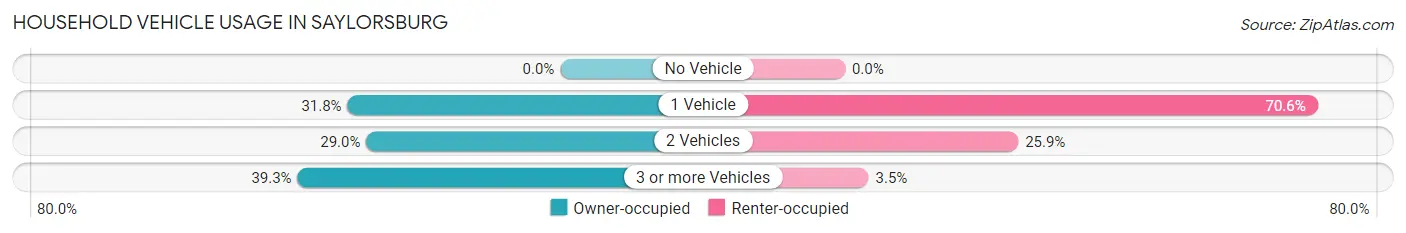
| Vehicles per Household | Owner-occupied | Renter-occupied |
| No Vehicle | 0 (0.0%) | 0 (0.0%) |
| 1 Vehicle | 68 (31.8%) | 240 (70.6%) |
| 2 Vehicles | 62 (29.0%) | 88 (25.9%) |
| 3 or more Vehicles | 84 (39.3%) | 12 (3.5%) |
| Total | 214 (100.0%) | 340 (100.0%) |
Real Estate & Mortgages in Saylorsburg
Real Estate and Mortgage Overview in Saylorsburg
| Characteristic | Without Mortgage | With Mortgage |
| Housing Units | 132 | 82 |
| Median Property Value | - | - |
| Median Household Income | - | - |
| Monthly Housing Costs | $482 | $0 |
| Real Estate Taxes | $1,750 | $4 |
Property Value by Mortgage Status in Saylorsburg
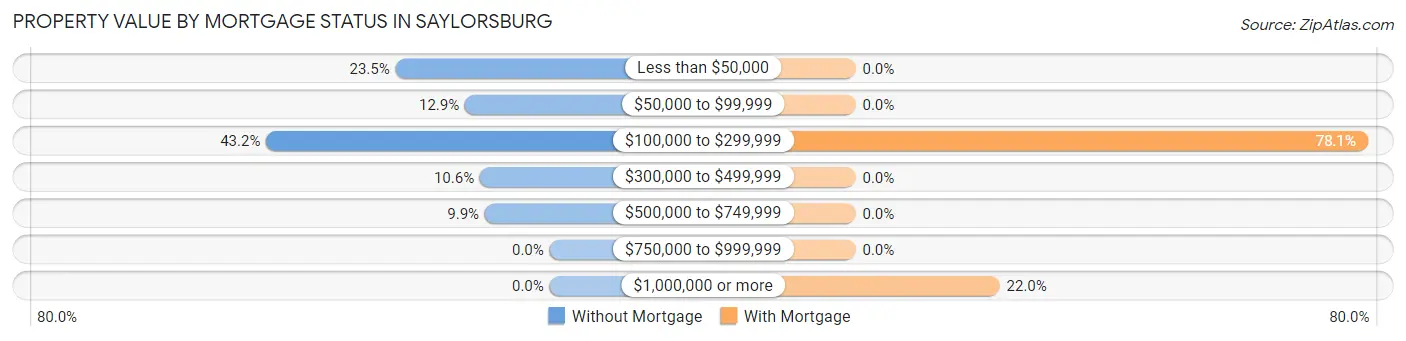
| Property Value | Without Mortgage | With Mortgage |
| Less than $50,000 | 31 (23.5%) | 0 (0.0%) |
| $50,000 to $99,999 | 17 (12.9%) | 0 (0.0%) |
| $100,000 to $299,999 | 57 (43.2%) | 64 (78.0%) |
| $300,000 to $499,999 | 14 (10.6%) | 0 (0.0%) |
| $500,000 to $749,999 | 13 (9.9%) | 0 (0.0%) |
| $750,000 to $999,999 | 0 (0.0%) | 0 (0.0%) |
| $1,000,000 or more | 0 (0.0%) | 18 (22.0%) |
| Total | 132 (100.0%) | 82 (100.0%) |
Household Income by Mortgage Status in Saylorsburg
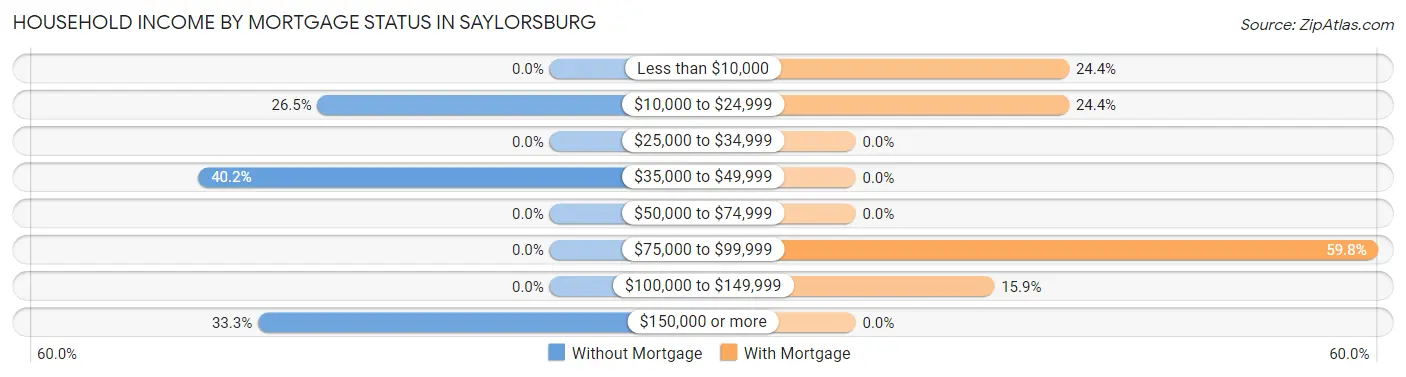
| Household Income | Without Mortgage | With Mortgage |
| Less than $10,000 | 0 (0.0%) | 20 (24.4%) |
| $10,000 to $24,999 | 35 (26.5%) | 20 (24.4%) |
| $25,000 to $34,999 | 0 (0.0%) | 0 (0.0%) |
| $35,000 to $49,999 | 53 (40.2%) | 0 (0.0%) |
| $50,000 to $74,999 | 0 (0.0%) | 0 (0.0%) |
| $75,000 to $99,999 | 0 (0.0%) | 49 (59.8%) |
| $100,000 to $149,999 | 0 (0.0%) | 13 (15.9%) |
| $150,000 or more | 44 (33.3%) | 0 (0.0%) |
| Total | 132 (100.0%) | 82 (100.0%) |
Property Value to Household Income Ratio in Saylorsburg
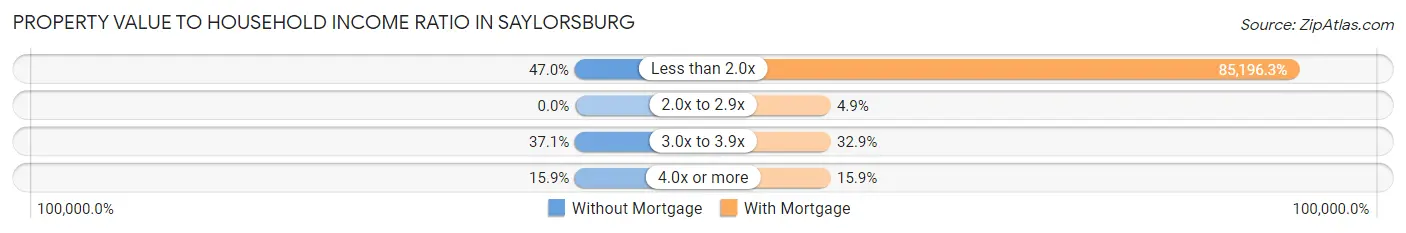
| Value-to-Income Ratio | Without Mortgage | With Mortgage |
| Less than 2.0x | 62 (47.0%) | 69,861 (85,196.3%) |
| 2.0x to 2.9x | 0 (0.0%) | 4 (4.9%) |
| 3.0x to 3.9x | 49 (37.1%) | 27 (32.9%) |
| 4.0x or more | 21 (15.9%) | 13 (15.9%) |
| Total | 132 (100.0%) | 82 (100.0%) |
Real Estate Taxes by Mortgage Status in Saylorsburg
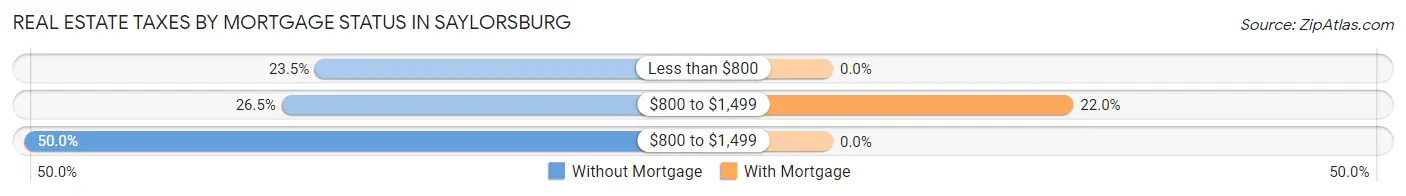
| Property Taxes | Without Mortgage | With Mortgage |
| Less than $800 | 31 (23.5%) | 0 (0.0%) |
| $800 to $1,499 | 35 (26.5%) | 18 (22.0%) |
| $800 to $1,499 | 66 (50.0%) | 0 (0.0%) |
| Total | 132 (100.0%) | 82 (100.0%) |
Health & Disability in Saylorsburg
Health Insurance Coverage by Age in Saylorsburg
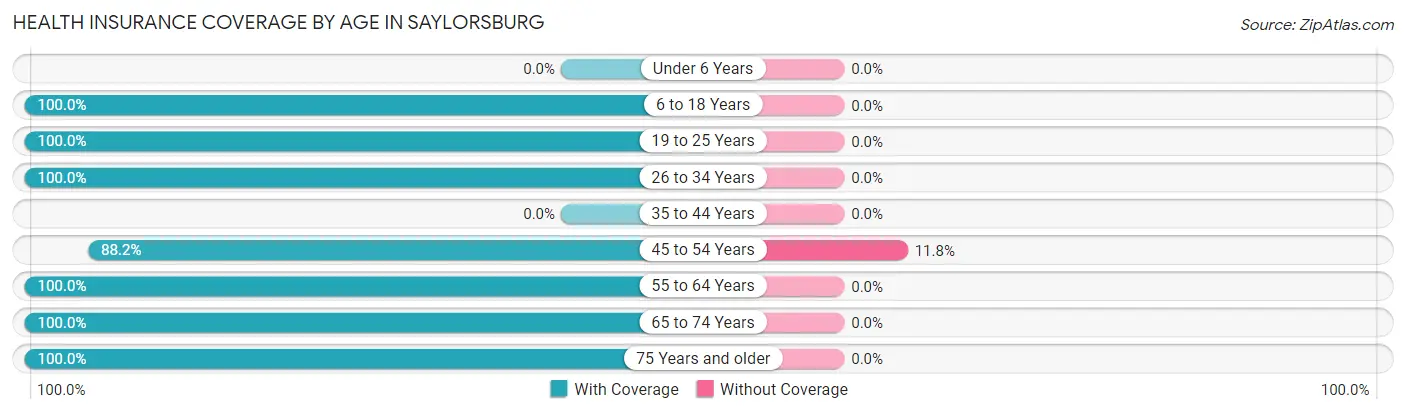
| Age Bracket | With Coverage | Without Coverage |
| Under 6 Years | 0 (0.0%) | 0 (0.0%) |
| 6 to 18 Years | 148 (100.0%) | 0 (0.0%) |
| 19 to 25 Years | 67 (100.0%) | 0 (0.0%) |
| 26 to 34 Years | 292 (100.0%) | 0 (0.0%) |
| 35 to 44 Years | 0 (0.0%) | 0 (0.0%) |
| 45 to 54 Years | 149 (88.2%) | 20 (11.8%) |
| 55 to 64 Years | 274 (100.0%) | 0 (0.0%) |
| 65 to 74 Years | 31 (100.0%) | 0 (0.0%) |
| 75 Years and older | 96 (100.0%) | 0 (0.0%) |
| Total | 1,057 (98.1%) | 20 (1.9%) |
Health Insurance Coverage by Citizenship Status in Saylorsburg
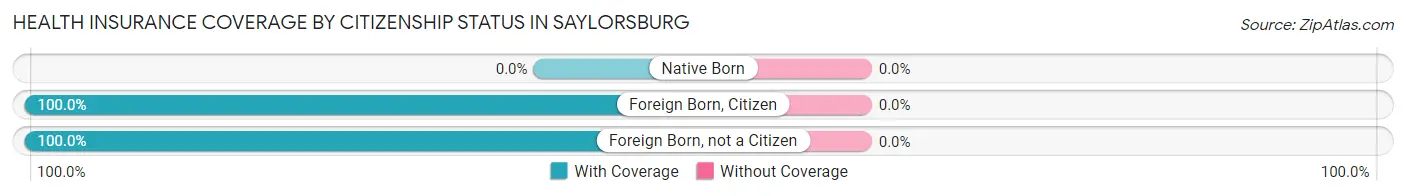
| Citizenship Status | With Coverage | Without Coverage |
| Native Born | 0 (0.0%) | 0 (0.0%) |
| Foreign Born, Citizen | 148 (100.0%) | 0 (0.0%) |
| Foreign Born, not a Citizen | 67 (100.0%) | 0 (0.0%) |
Health Insurance Coverage by Household Income in Saylorsburg
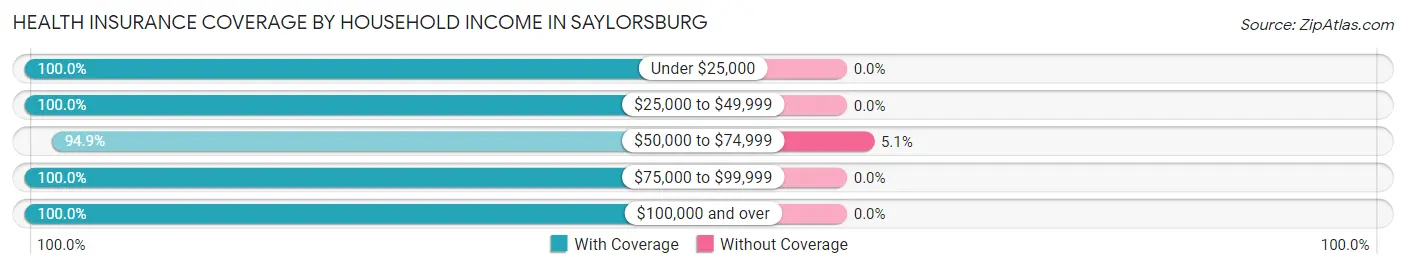
| Household Income | With Coverage | Without Coverage |
| Under $25,000 | 55 (100.0%) | 0 (0.0%) |
| $25,000 to $49,999 | 203 (100.0%) | 0 (0.0%) |
| $50,000 to $74,999 | 373 (94.9%) | 20 (5.1%) |
| $75,000 to $99,999 | 274 (100.0%) | 0 (0.0%) |
| $100,000 and over | 152 (100.0%) | 0 (0.0%) |
Public vs Private Health Insurance Coverage by Age in Saylorsburg
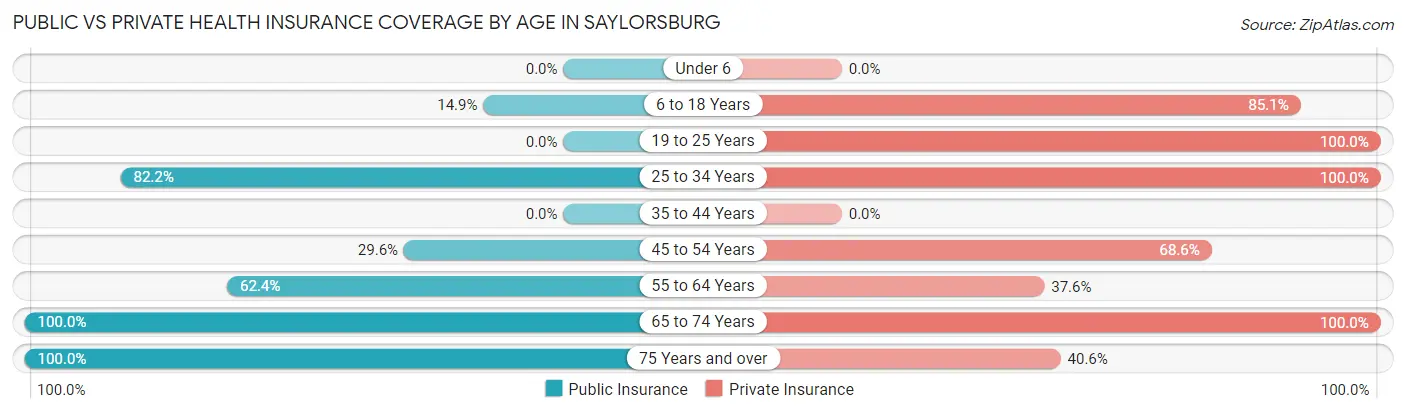
| Age Bracket | Public Insurance | Private Insurance |
| Under 6 | 0 (0.0%) | 0 (0.0%) |
| 6 to 18 Years | 22 (14.9%) | 126 (85.1%) |
| 19 to 25 Years | 0 (0.0%) | 67 (100.0%) |
| 25 to 34 Years | 240 (82.2%) | 292 (100.0%) |
| 35 to 44 Years | 0 (0.0%) | 0 (0.0%) |
| 45 to 54 Years | 50 (29.6%) | 116 (68.6%) |
| 55 to 64 Years | 171 (62.4%) | 103 (37.6%) |
| 65 to 74 Years | 31 (100.0%) | 31 (100.0%) |
| 75 Years and over | 96 (100.0%) | 39 (40.6%) |
| Total | 610 (56.6%) | 774 (71.9%) |
Disability Status by Sex by Age in Saylorsburg
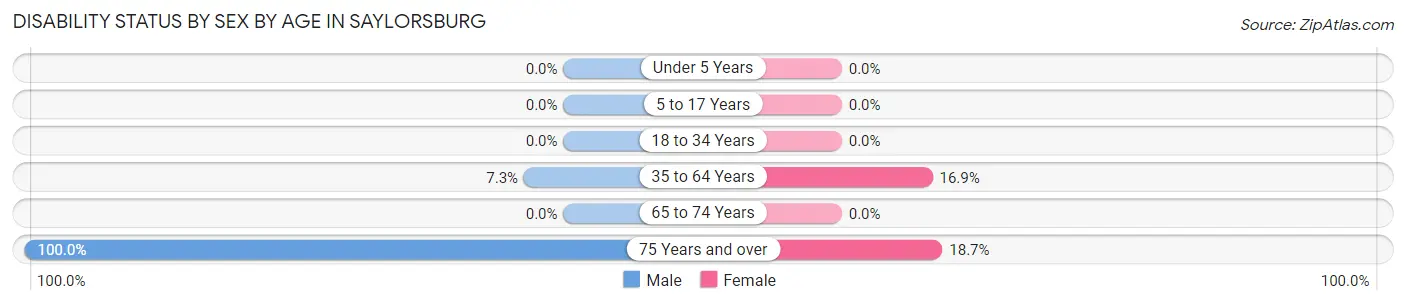
| Age Bracket | Male | Female |
| Under 5 Years | 0 (0.0%) | 0 (0.0%) |
| 5 to 17 Years | 0 (0.0%) | 0 (0.0%) |
| 18 to 34 Years | 0 (0.0%) | 0 (0.0%) |
| 35 to 64 Years | 12 (7.3%) | 47 (16.9%) |
| 65 to 74 Years | 0 (0.0%) | 0 (0.0%) |
| 75 Years and over | 21 (100.0%) | 14 (18.7%) |
Disability Class by Sex by Age in Saylorsburg
Disability Class: Hearing Difficulty
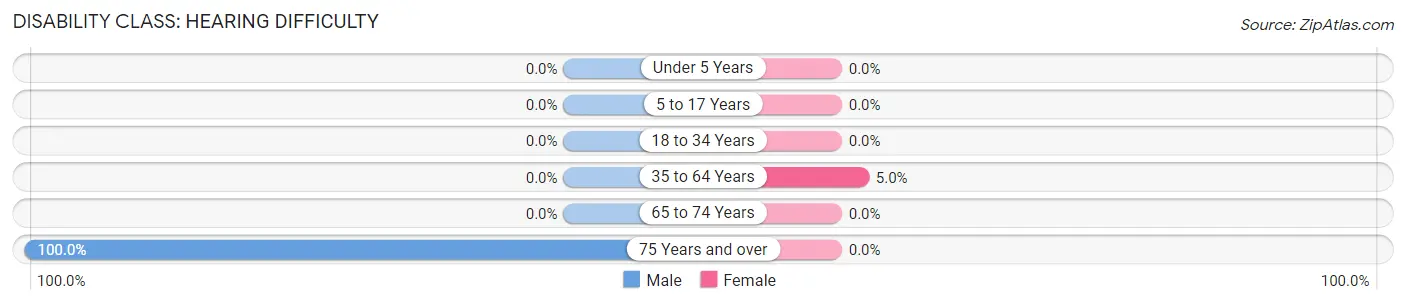
| Age Bracket | Male | Female |
| Under 5 Years | 0 (0.0%) | 0 (0.0%) |
| 5 to 17 Years | 0 (0.0%) | 0 (0.0%) |
| 18 to 34 Years | 0 (0.0%) | 0 (0.0%) |
| 35 to 64 Years | 0 (0.0%) | 14 (5.0%) |
| 65 to 74 Years | 0 (0.0%) | 0 (0.0%) |
| 75 Years and over | 21 (100.0%) | 0 (0.0%) |
Disability Class: Vision Difficulty
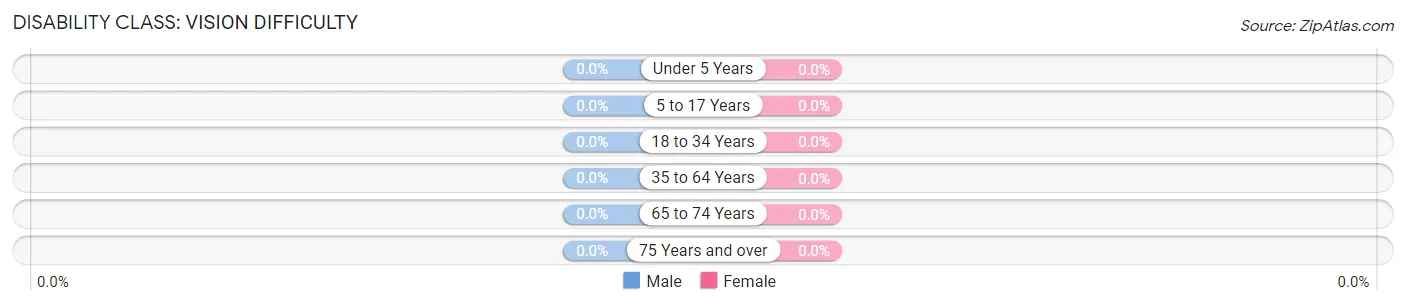
| Age Bracket | Male | Female |
| Under 5 Years | 0 (0.0%) | 0 (0.0%) |
| 5 to 17 Years | 0 (0.0%) | 0 (0.0%) |
| 18 to 34 Years | 0 (0.0%) | 0 (0.0%) |
| 35 to 64 Years | 0 (0.0%) | 0 (0.0%) |
| 65 to 74 Years | 0 (0.0%) | 0 (0.0%) |
| 75 Years and over | 0 (0.0%) | 0 (0.0%) |
Disability Class: Cognitive Difficulty
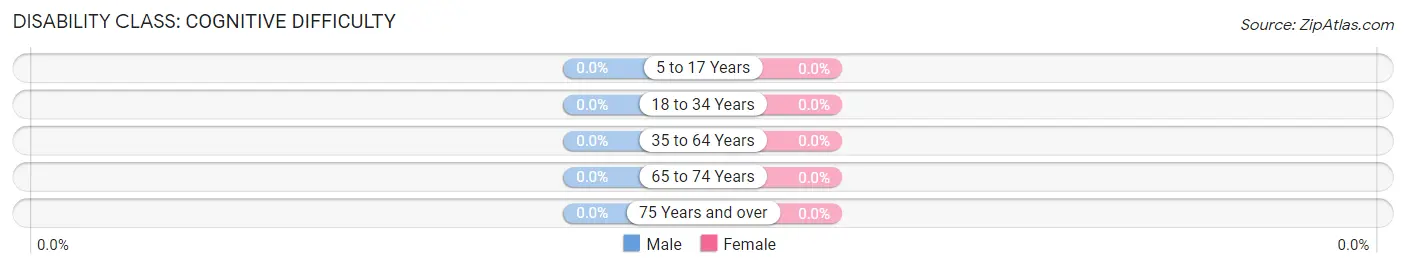
| Age Bracket | Male | Female |
| 5 to 17 Years | 0 (0.0%) | 0 (0.0%) |
| 18 to 34 Years | 0 (0.0%) | 0 (0.0%) |
| 35 to 64 Years | 0 (0.0%) | 0 (0.0%) |
| 65 to 74 Years | 0 (0.0%) | 0 (0.0%) |
| 75 Years and over | 0 (0.0%) | 0 (0.0%) |
Disability Class: Ambulatory Difficulty
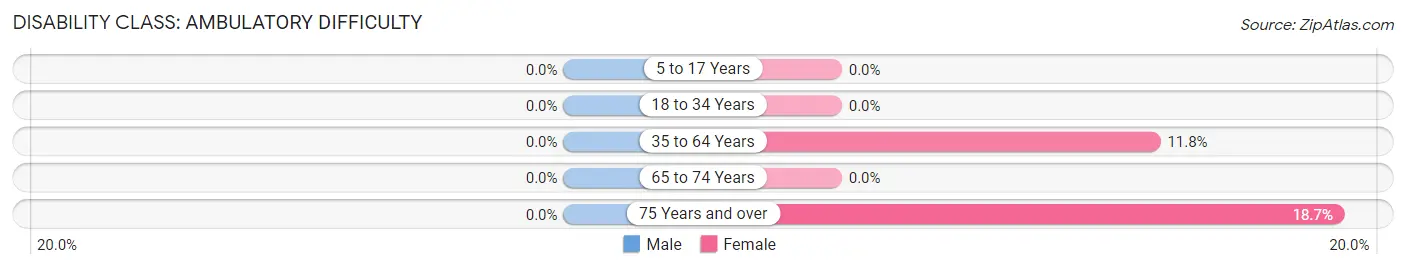
| Age Bracket | Male | Female |
| 5 to 17 Years | 0 (0.0%) | 0 (0.0%) |
| 18 to 34 Years | 0 (0.0%) | 0 (0.0%) |
| 35 to 64 Years | 0 (0.0%) | 33 (11.8%) |
| 65 to 74 Years | 0 (0.0%) | 0 (0.0%) |
| 75 Years and over | 0 (0.0%) | 14 (18.7%) |
Disability Class: Self-Care Difficulty
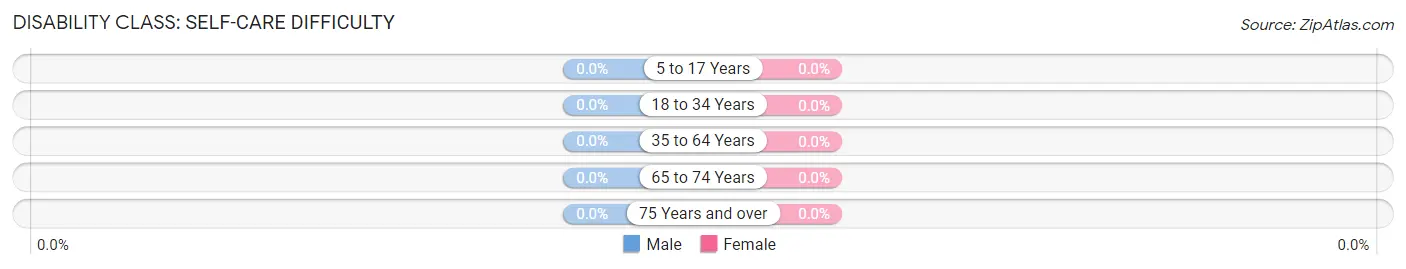
| Age Bracket | Male | Female |
| 5 to 17 Years | 0 (0.0%) | 0 (0.0%) |
| 18 to 34 Years | 0 (0.0%) | 0 (0.0%) |
| 35 to 64 Years | 0 (0.0%) | 0 (0.0%) |
| 65 to 74 Years | 0 (0.0%) | 0 (0.0%) |
| 75 Years and over | 0 (0.0%) | 0 (0.0%) |
Technology Access in Saylorsburg
Computing Device Access in Saylorsburg
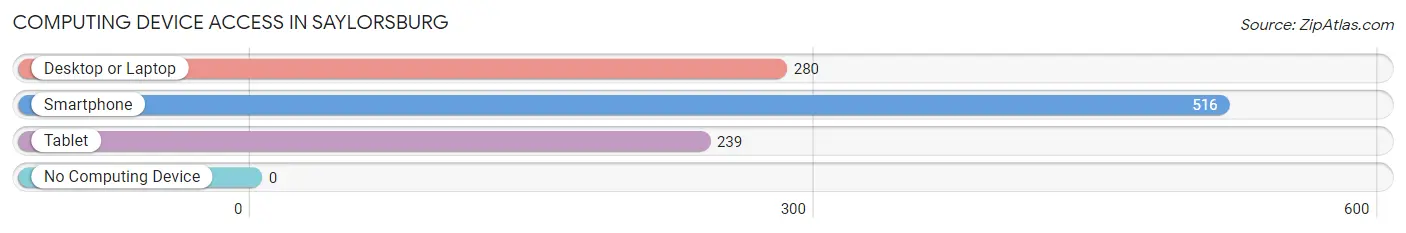
| Device Type | # Households | % Households |
| Desktop or Laptop | 280 | 50.5% |
| Smartphone | 516 | 93.1% |
| Tablet | 239 | 43.1% |
| No Computing Device | 0 | 0.0% |
| Total | 554 | 100.0% |
Internet Access in Saylorsburg
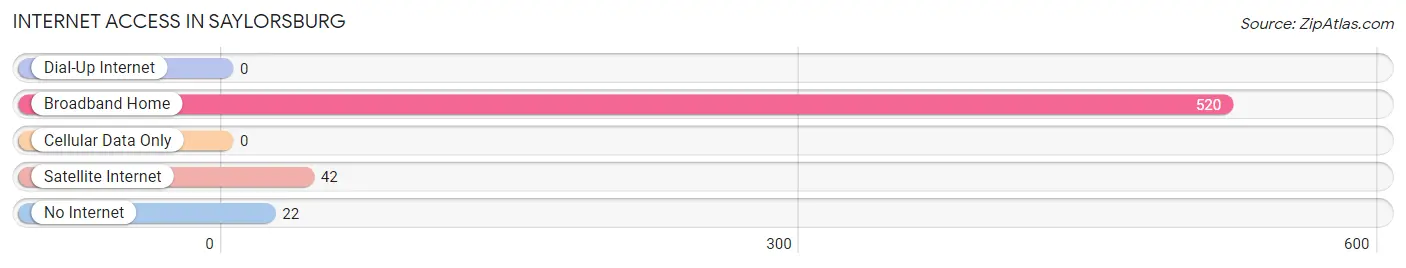
| Internet Type | # Households | % Households |
| Dial-Up Internet | 0 | 0.0% |
| Broadband Home | 520 | 93.9% |
| Cellular Data Only | 0 | 0.0% |
| Satellite Internet | 42 | 7.6% |
| No Internet | 22 | 4.0% |
| Total | 554 | 100.0% |
Saylorsburg Summary
Saylorsburg is a small unincorporated community located in Monroe County, Pennsylvania. It is situated in the Pocono Mountains region of the state, and is part of the Stroudsburg-East Stroudsburg Metropolitan Statistical Area. The population of Saylorsburg was estimated to be 1,845 in the 2010 census.
History
The area that is now Saylorsburg was first settled in the late 1700s by German immigrants. The town was originally known as “Sayler’s Settlement” after the Sayler family, who were among the first settlers. The town was officially incorporated in 1845 and was renamed Saylorsburg in 1875.
The town was a popular destination for vacationers in the late 19th and early 20th centuries. The Saylorsburg Hotel, which was built in 1891, was a popular destination for visitors. The hotel was destroyed by fire in the 1950s.
Geography
Saylorsburg is located in the Pocono Mountains region of Pennsylvania. It is situated in the western part of Monroe County, about 10 miles east of Stroudsburg. The town is bordered by Chestnuthill Township to the north, Ross Township to the east, and Polk Township to the south.
The terrain of Saylorsburg is mostly hilly, with elevations ranging from 500 to 1,000 feet above sea level. The town is located in the Appalachian Mountains, and is part of the Appalachian Plateau. The climate of Saylorsburg is humid continental, with cold winters and warm summers.
Economy
The economy of Saylorsburg is largely based on tourism and agriculture. The town is home to several small businesses, including restaurants, shops, and lodging. The town is also home to several farms, which produce a variety of crops, including corn, soybeans, and hay.
The town is also home to several manufacturing companies, including a plastics factory and a furniture factory. The town is also home to a number of small businesses, including a bakery, a hardware store, and a grocery store.
Demographics
The population of Saylorsburg was estimated to be 1,845 in the 2010 census. The racial makeup of the town was 94.3% White, 2.2% African American, 0.7% Native American, 0.4% Asian, 0.1% Pacific Islander, and 2.3% from other races. The median household income in Saylorsburg was $45,938 in 2017.
The town is home to a number of churches, including the Saylorsburg United Methodist Church, the Saylorsburg Presbyterian Church, and the Saylorsburg Baptist Church. The town is also home to a number of schools, including the Saylorsburg Elementary School, the Saylorsburg Middle School, and the Saylorsburg High School.
Conclusion
Saylorsburg is a small unincorporated community located in Monroe County, Pennsylvania. It is situated in the Pocono Mountains region of the state, and is part of the Stroudsburg-East Stroudsburg Metropolitan Statistical Area. The population of Saylorsburg was estimated to be 1,845 in the 2010 census. The town has a long history, dating back to the late 1700s, and is home to a variety of businesses and industries. The economy of Saylorsburg is largely based on tourism and agriculture, and the town is home to several churches and schools.
Common Questions
What is Per Capita Income in Saylorsburg?
Per Capita income in Saylorsburg is $41,367.
What is the Median Family Income in Saylorsburg?
Median Family Income in Saylorsburg is $70,694.
What is the Median Household income in Saylorsburg?
Median Household Income in Saylorsburg is $85,073.
What is Income or Wage Gap in Saylorsburg?
Income or Wage Gap in Saylorsburg is 37.0%.
Women in Saylorsburg earn 63.0 cents for every dollar earned by a man.
What is Inequality or Gini Index in Saylorsburg?
Inequality or Gini Index in Saylorsburg is 0.29.
What is the Total Population of Saylorsburg?
Total Population of Saylorsburg is 1,077.
What is the Total Male Population of Saylorsburg?
Total Male Population of Saylorsburg is 568.
What is the Total Female Population of Saylorsburg?
Total Female Population of Saylorsburg is 509.
What is the Ratio of Males per 100 Females in Saylorsburg?
There are 111.59 Males per 100 Females in Saylorsburg.
What is the Ratio of Females per 100 Males in Saylorsburg?
There are 89.61 Females per 100 Males in Saylorsburg.
What is the Median Population Age in Saylorsburg?
Median Population Age in Saylorsburg is 48.3 Years.
What is the Average Family Size in Saylorsburg
Average Family Size in Saylorsburg is 3.7 People.
What is the Average Household Size in Saylorsburg
Average Household Size in Saylorsburg is 1.9 People.
How Large is the Labor Force in Saylorsburg?
There are 580 People in the Labor Forcein in Saylorsburg.
What is the Percentage of People in the Labor Force in Saylorsburg?
58.5% of People are in the Labor Force in Saylorsburg.