Norristown borough, PA Map & Demographics
Norristown borough Overview
$26,938
PER CAPITA INCOME
$64,841
AVG FAMILY INCOME
$59,068
AVG HOUSEHOLD INCOME
4.5%
WAGE / INCOME GAP [ % ]
95.5¢/ $1
WAGE / INCOME GAP [ $ ]
$13,793
FAMILY INCOME DEFICIT
0.43
INEQUALITY / GINI INDEX
35,712
TOTAL POPULATION
17,812
MALE POPULATION
17,900
FEMALE POPULATION
99.51
MALES / 100 FEMALES
100.49
FEMALES / 100 MALES
32.4
MEDIAN AGE
3.5
AVG FAMILY SIZE
2.7
AVG HOUSEHOLD SIZE
18,998
LABOR FORCE [ PEOPLE ]
70.0%
PERCENT IN LABOR FORCE
6.2%
UNEMPLOYMENT RATE
Income in Norristown borough
Income Overview in Norristown borough
Per Capita Income in Norristown borough is $26,938, while median incomes of families and households are $64,841 and $59,068 respectively.
| Characteristic | Number | Measure |
| Per Capita Income | 35,712 | $26,938 |
| Median Family Income | 7,923 | $64,841 |
| Mean Family Income | 7,923 | $80,467 |
| Median Household Income | 12,918 | $59,068 |
| Mean Household Income | 12,918 | $72,202 |
| Income Deficit | 7,923 | $13,793 |
| Wage / Income Gap (%) | 35,712 | 4.47% |
| Wage / Income Gap ($) | 35,712 | 95.53¢ per $1 |
| Gini / Inequality Index | 35,712 | 0.43 |
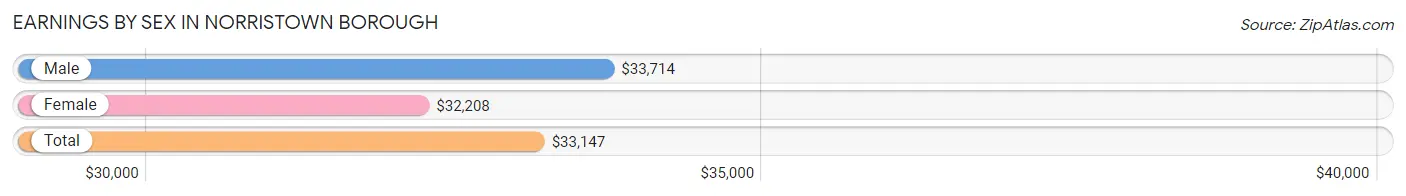
Earnings by Sex in Norristown borough
Average Earnings in Norristown borough are $33,147, $33,714 for men and $32,208 for women, a difference of 4.5%.
| Sex | Number | Average Earnings |
| Male | 10,154 (52.0%) | $33,714 |
| Female | 9,382 (48.0%) | $32,208 |
| Total | 19,536 (100.0%) | $33,147 |
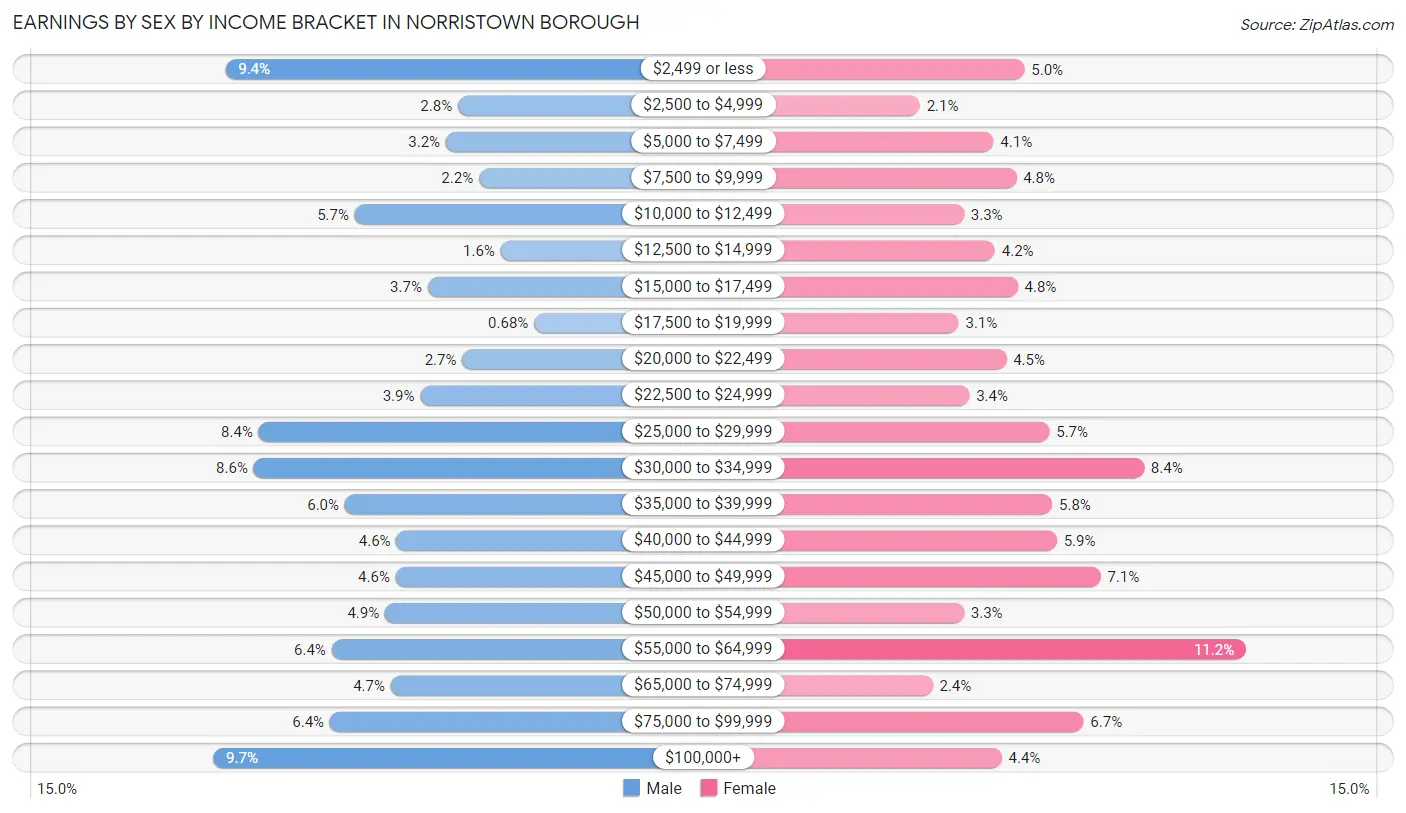
Earnings by Sex by Income Bracket in Norristown borough
The most common earnings brackets in Norristown borough are $100,000+ for men (985 | 9.7%) and $55,000 to $64,999 for women (1,053 | 11.2%).
| Income | Male | Female |
| $2,499 or less | 950 (9.4%) | 468 (5.0%) |
| $2,500 to $4,999 | 286 (2.8%) | 192 (2.1%) |
| $5,000 to $7,499 | 321 (3.2%) | 387 (4.1%) |
| $7,500 to $9,999 | 226 (2.2%) | 447 (4.8%) |
| $10,000 to $12,499 | 581 (5.7%) | 309 (3.3%) |
| $12,500 to $14,999 | 165 (1.6%) | 390 (4.2%) |
| $15,000 to $17,499 | 373 (3.7%) | 450 (4.8%) |
| $17,500 to $19,999 | 69 (0.7%) | 295 (3.1%) |
| $20,000 to $22,499 | 274 (2.7%) | 420 (4.5%) |
| $22,500 to $24,999 | 394 (3.9%) | 323 (3.4%) |
| $25,000 to $29,999 | 855 (8.4%) | 534 (5.7%) |
| $30,000 to $34,999 | 869 (8.6%) | 783 (8.4%) |
| $35,000 to $39,999 | 609 (6.0%) | 541 (5.8%) |
| $40,000 to $44,999 | 462 (4.5%) | 554 (5.9%) |
| $45,000 to $49,999 | 464 (4.6%) | 669 (7.1%) |
| $50,000 to $54,999 | 494 (4.9%) | 309 (3.3%) |
| $55,000 to $64,999 | 647 (6.4%) | 1,053 (11.2%) |
| $65,000 to $74,999 | 478 (4.7%) | 226 (2.4%) |
| $75,000 to $99,999 | 652 (6.4%) | 624 (6.7%) |
| $100,000+ | 985 (9.7%) | 408 (4.3%) |
| Total | 10,154 (100.0%) | 9,382 (100.0%) |
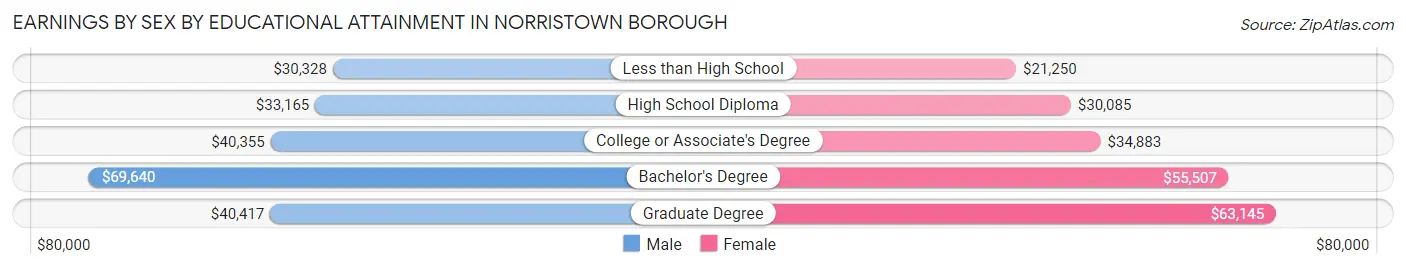
Earnings by Sex by Educational Attainment in Norristown borough
Average earnings in Norristown borough are $38,010 for men and $36,064 for women, a difference of 5.1%. Men with an educational attainment of bachelor's degree enjoy the highest average annual earnings of $69,640, while those with less than high school education earn the least with $30,328. Women with an educational attainment of graduate degree earn the most with the average annual earnings of $63,145, while those with less than high school education have the smallest earnings of $21,250.
| Educational Attainment | Male Income | Female Income |
| Less than High School | $30,328 | $21,250 |
| High School Diploma | $33,165 | $30,085 |
| College or Associate's Degree | $40,355 | $34,883 |
| Bachelor's Degree | $69,640 | $55,507 |
| Graduate Degree | $40,417 | $63,145 |
| Total | $38,010 | $36,064 |
Family Income in Norristown borough
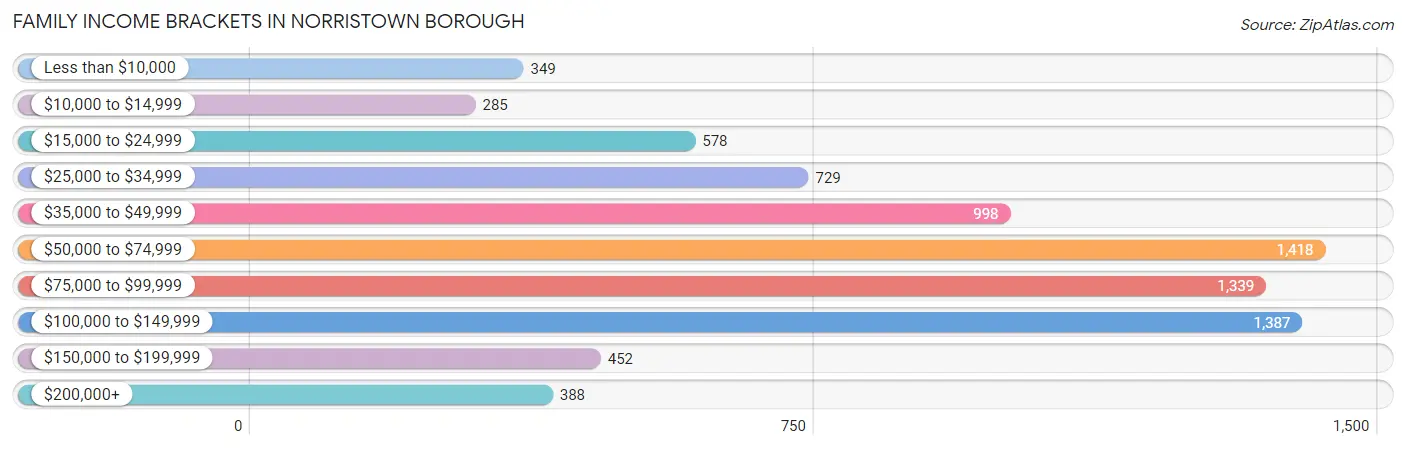
Family Income Brackets in Norristown borough
According to the Norristown borough family income data, there are 1,418 families falling into the $50,000 to $74,999 income range, which is the most common income bracket and makes up 17.9% of all families. Conversely, the $10,000 to $14,999 income bracket is the least frequent group with only 285 families (3.6%) belonging to this category.
| Income Bracket | # Families | % Families |
| Less than $10,000 | 349 | 4.4% |
| $10,000 to $14,999 | 285 | 3.6% |
| $15,000 to $24,999 | 578 | 7.3% |
| $25,000 to $34,999 | 729 | 9.2% |
| $35,000 to $49,999 | 998 | 12.6% |
| $50,000 to $74,999 | 1,418 | 17.9% |
| $75,000 to $99,999 | 1,339 | 16.9% |
| $100,000 to $149,999 | 1,387 | 17.5% |
| $150,000 to $199,999 | 452 | 5.7% |
| $200,000+ | 388 | 4.9% |
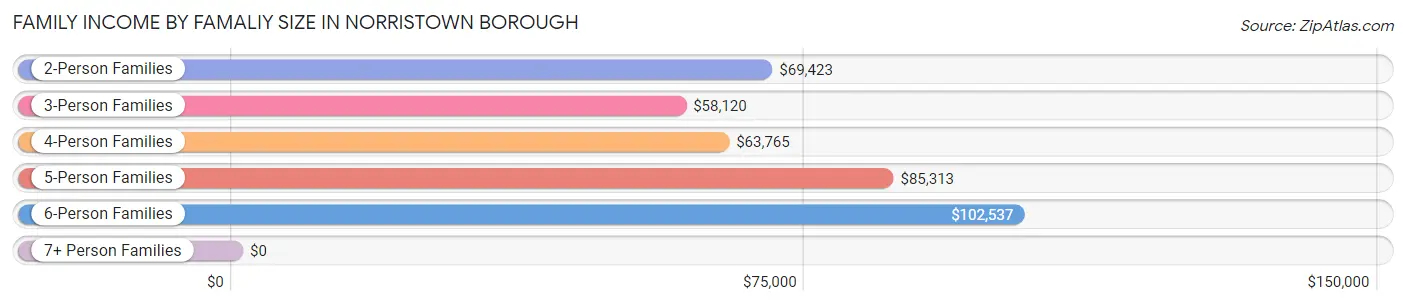
Family Income by Famaliy Size in Norristown borough
6-person families (508 | 6.4%) account for the highest median family income in Norristown borough with $102,537 per family, while 2-person families (3,060 | 38.6%) have the highest median income of $34,712 per family member.
| Income Bracket | # Families | Median Income |
| 2-Person Families | 3,060 (38.6%) | $69,423 |
| 3-Person Families | 2,118 (26.7%) | $58,120 |
| 4-Person Families | 1,355 (17.1%) | $63,765 |
| 5-Person Families | 554 (7.0%) | $85,313 |
| 6-Person Families | 508 (6.4%) | $102,537 |
| 7+ Person Families | 328 (4.1%) | $0 |
| Total | 7,923 (100.0%) | $64,841 |
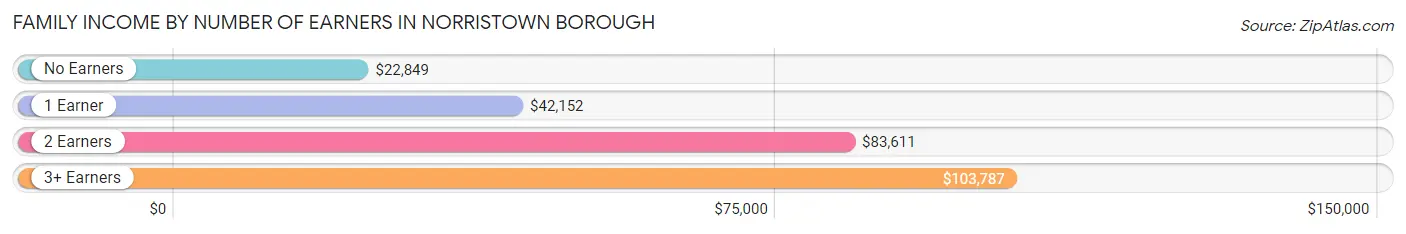
Family Income by Number of Earners in Norristown borough
The median family income in Norristown borough is $64,841, with families comprising 3+ earners (1,494) having the highest median family income of $103,787, while families with no earners (625) have the lowest median family income of $22,849, accounting for 18.9% and 7.9% of families, respectively.
| Number of Earners | # Families | Median Income |
| No Earners | 625 (7.9%) | $22,849 |
| 1 Earner | 2,656 (33.5%) | $42,152 |
| 2 Earners | 3,148 (39.7%) | $83,611 |
| 3+ Earners | 1,494 (18.9%) | $103,787 |
| Total | 7,923 (100.0%) | $64,841 |
Household Income in Norristown borough
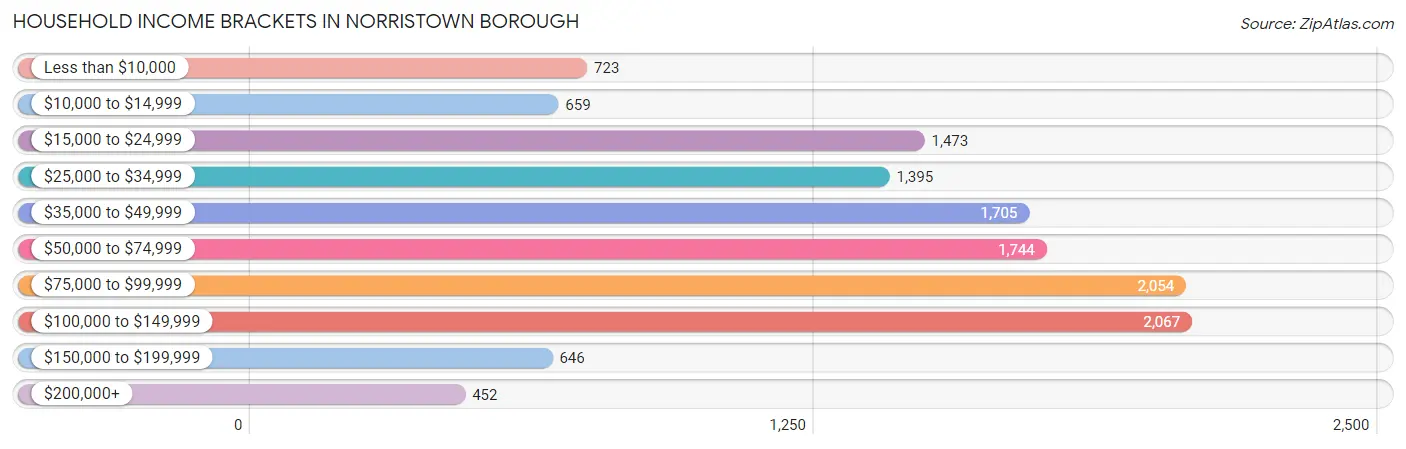
Household Income Brackets in Norristown borough
With 2,067 households falling in the category, the $100,000 to $149,999 income range is the most frequent in Norristown borough, accounting for 16.0% of all households. In contrast, only 452 households (3.5%) fall into the $200,000+ income bracket, making it the least populous group.
| Income Bracket | # Households | % Households |
| Less than $10,000 | 723 | 5.6% |
| $10,000 to $14,999 | 659 | 5.1% |
| $15,000 to $24,999 | 1,473 | 11.4% |
| $25,000 to $34,999 | 1,395 | 10.8% |
| $35,000 to $49,999 | 1,705 | 13.2% |
| $50,000 to $74,999 | 1,744 | 13.5% |
| $75,000 to $99,999 | 2,054 | 15.9% |
| $100,000 to $149,999 | 2,067 | 16.0% |
| $150,000 to $199,999 | 646 | 5.0% |
| $200,000+ | 452 | 3.5% |
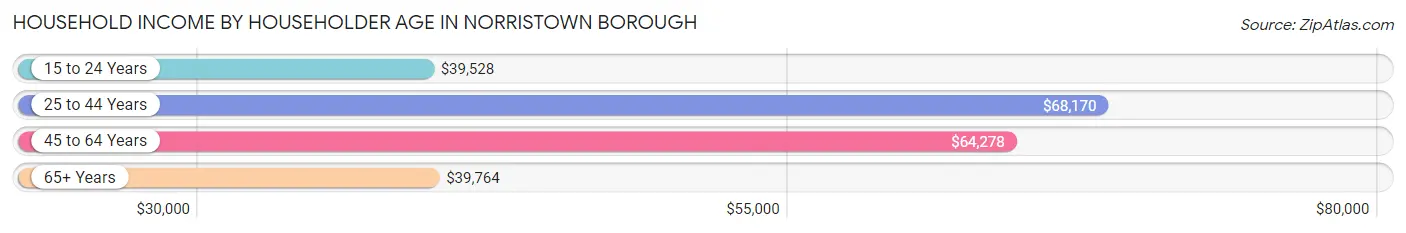
Household Income by Householder Age in Norristown borough
The median household income in Norristown borough is $59,068, with the highest median household income of $68,170 found in the 25 to 44 years age bracket for the primary householder. A total of 5,554 households (43.0%) fall into this category. Meanwhile, the 15 to 24 years age bracket for the primary householder has the lowest median household income of $39,528, with 720 households (5.6%) in this group.
| Income Bracket | # Households | Median Income |
| 15 to 24 Years | 720 (5.6%) | $39,528 |
| 25 to 44 Years | 5,554 (43.0%) | $68,170 |
| 45 to 64 Years | 4,342 (33.6%) | $64,278 |
| 65+ Years | 2,302 (17.8%) | $39,764 |
| Total | 12,918 (100.0%) | $59,068 |
Poverty in Norristown borough
Income Below Poverty by Sex and Age in Norristown borough
With 17.8% poverty level for males and 19.0% for females among the residents of Norristown borough, 16 and 17 year old males and 5 year old females are the most vulnerable to poverty, with 154 males (32.1%) and 97 females (57.7%) in their respective age groups living below the poverty level.
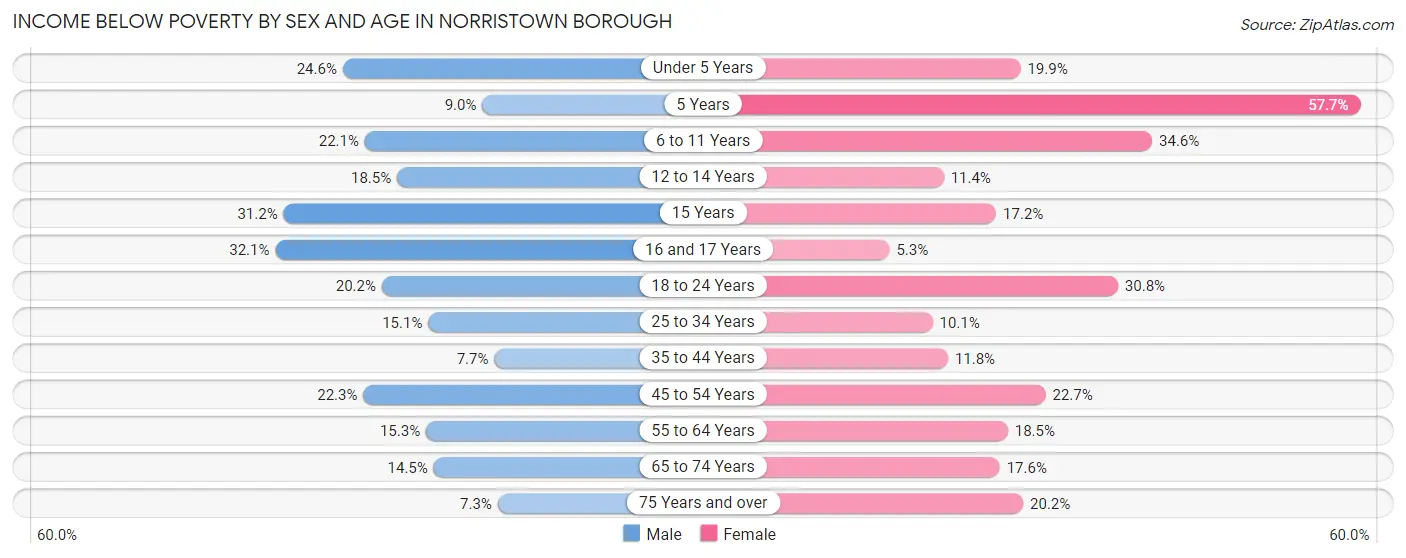
| Age Bracket | Male | Female |
| Under 5 Years | 424 (24.6%) | 238 (19.9%) |
| 5 Years | 28 (9.0%) | 97 (57.7%) |
| 6 to 11 Years | 300 (22.1%) | 470 (34.6%) |
| 12 to 14 Years | 110 (18.5%) | 86 (11.4%) |
| 15 Years | 139 (31.2%) | 82 (17.2%) |
| 16 and 17 Years | 154 (32.1%) | 17 (5.3%) |
| 18 to 24 Years | 451 (20.2%) | 583 (30.7%) |
| 25 to 34 Years | 461 (15.0%) | 261 (10.1%) |
| 35 to 44 Years | 175 (7.7%) | 364 (11.8%) |
| 45 to 54 Years | 473 (22.3%) | 435 (22.7%) |
| 55 to 64 Years | 269 (15.3%) | 336 (18.5%) |
| 65 to 74 Years | 128 (14.4%) | 212 (17.6%) |
| 75 Years and over | 28 (7.3%) | 168 (20.2%) |
| Total | 3,140 (17.8%) | 3,349 (19.0%) |
Income Above Poverty by Sex and Age in Norristown borough
According to the poverty statistics in Norristown borough, males aged 75 years and over and females aged 16 and 17 years are the age groups that are most secure financially, with 92.7% of males and 94.7% of females in these age groups living above the poverty line.
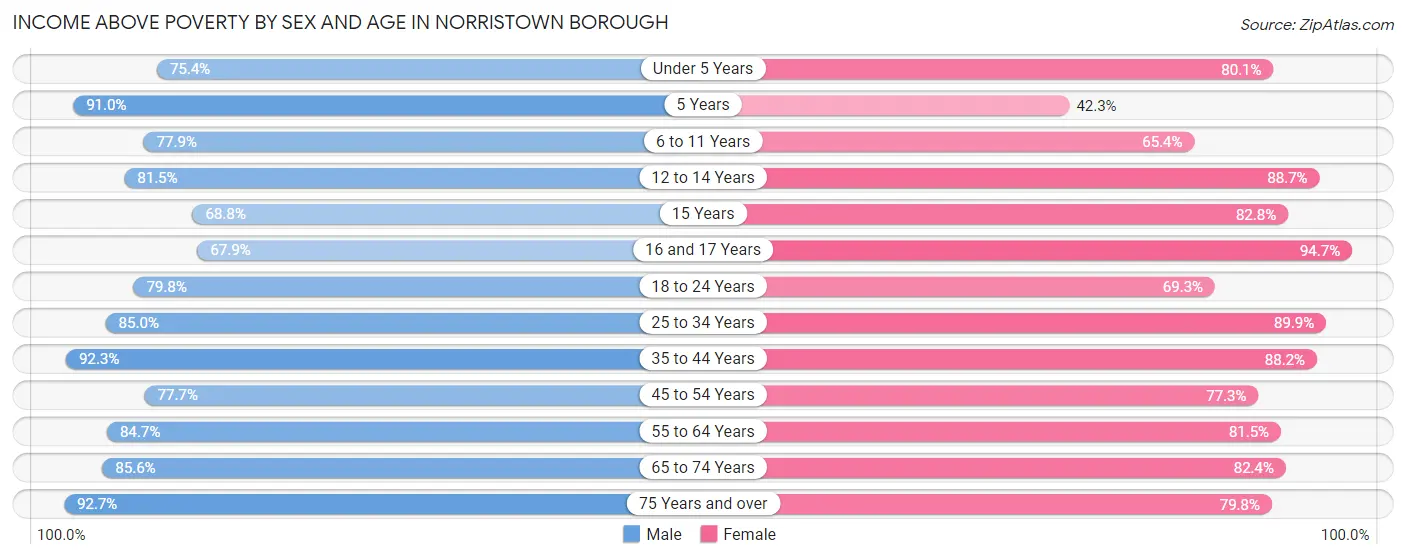
| Age Bracket | Male | Female |
| Under 5 Years | 1,302 (75.4%) | 958 (80.1%) |
| 5 Years | 282 (91.0%) | 71 (42.3%) |
| 6 to 11 Years | 1,057 (77.9%) | 890 (65.4%) |
| 12 to 14 Years | 484 (81.5%) | 672 (88.6%) |
| 15 Years | 307 (68.8%) | 395 (82.8%) |
| 16 and 17 Years | 326 (67.9%) | 303 (94.7%) |
| 18 to 24 Years | 1,779 (79.8%) | 1,313 (69.3%) |
| 25 to 34 Years | 2,603 (85.0%) | 2,321 (89.9%) |
| 35 to 44 Years | 2,101 (92.3%) | 2,715 (88.2%) |
| 45 to 54 Years | 1,650 (77.7%) | 1,482 (77.3%) |
| 55 to 64 Years | 1,489 (84.7%) | 1,481 (81.5%) |
| 65 to 74 Years | 758 (85.6%) | 993 (82.4%) |
| 75 Years and over | 355 (92.7%) | 664 (79.8%) |
| Total | 14,493 (82.2%) | 14,258 (81.0%) |
Income Below Poverty Among Married-Couple Families in Norristown borough
The poverty statistics for married-couple families in Norristown borough show that 6.4% or 251 of the total 3,951 families live below the poverty line. Families with 3 or 4 children have the highest poverty rate of 14.2%, comprising of 87 families. On the other hand, families with no children have the lowest poverty rate of 0.0%, which includes 0 families.
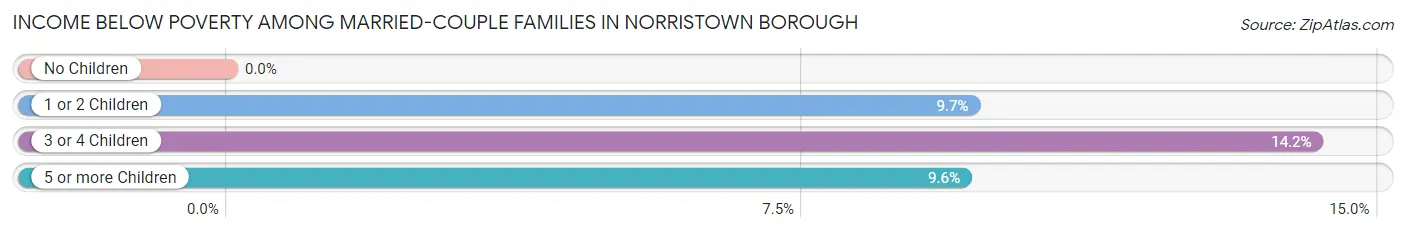
| Children | Above Poverty | Below Poverty |
| No Children | 1,643 (100.0%) | 0 (0.0%) |
| 1 or 2 Children | 1,379 (90.3%) | 148 (9.7%) |
| 3 or 4 Children | 527 (85.8%) | 87 (14.2%) |
| 5 or more Children | 151 (90.4%) | 16 (9.6%) |
| Total | 3,700 (93.6%) | 251 (6.4%) |
Income Below Poverty Among Single-Parent Households in Norristown borough
According to the poverty data in Norristown borough, 6.1% or 70 single-father households and 26.7% or 754 single-mother households are living below the poverty line. Among single-father households, those with no children have the highest poverty rate, with 52 households (8.2%) experiencing poverty. Likewise, among single-mother households, those with 3 or 4 children have the highest poverty rate, with 139 households (63.8%) falling below the poverty line.
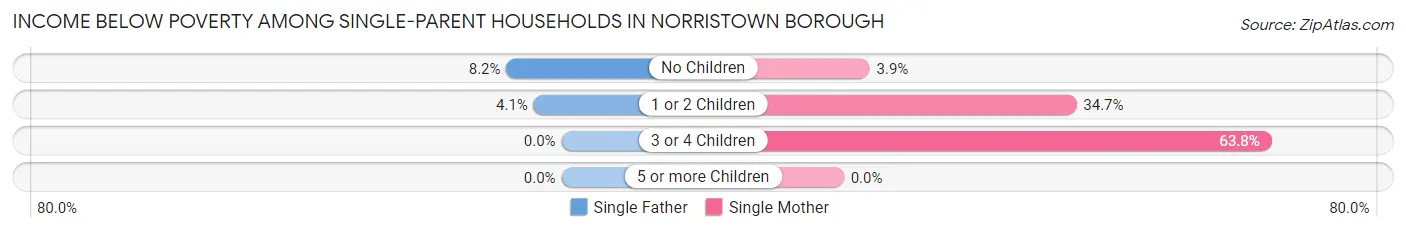
| Children | Single Father | Single Mother |
| No Children | 52 (8.2%) | 36 (3.9%) |
| 1 or 2 Children | 18 (4.1%) | 579 (34.7%) |
| 3 or 4 Children | 0 (0.0%) | 139 (63.8%) |
| 5 or more Children | 0 (0.0%) | 0 (0.0%) |
| Total | 70 (6.1%) | 754 (26.7%) |
Income Below Poverty Among Married-Couple vs Single-Parent Households in Norristown borough
The poverty data for Norristown borough shows that 251 of the married-couple family households (6.4%) and 824 of the single-parent households (20.7%) are living below the poverty level. Within the married-couple family households, those with 3 or 4 children have the highest poverty rate, with 87 households (14.2%) falling below the poverty line. Among the single-parent households, those with 3 or 4 children have the highest poverty rate, with 139 household (46.0%) living below poverty.
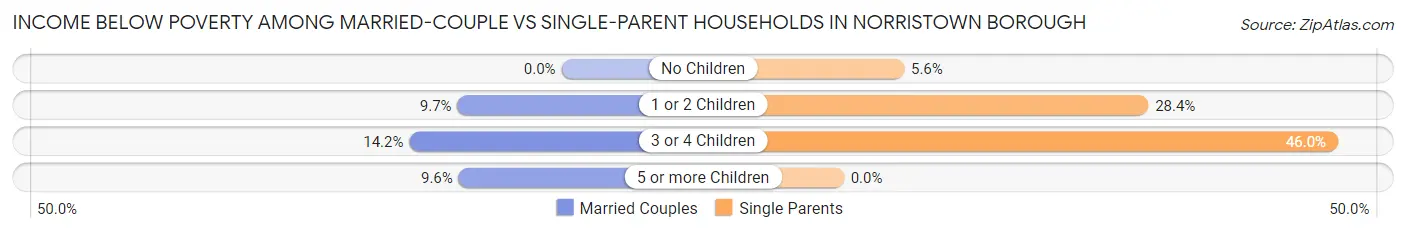
| Children | Married-Couple Families | Single-Parent Households |
| No Children | 0 (0.0%) | 88 (5.6%) |
| 1 or 2 Children | 148 (9.7%) | 597 (28.4%) |
| 3 or 4 Children | 87 (14.2%) | 139 (46.0%) |
| 5 or more Children | 16 (9.6%) | 0 (0.0%) |
| Total | 251 (6.4%) | 824 (20.7%) |
Race in Norristown borough
The most populous races in Norristown borough are White / Caucasian (12,650 | 35.4%), Black / African American (11,707 | 32.8%), and Hispanic or Latino (9,783 | 27.4%).
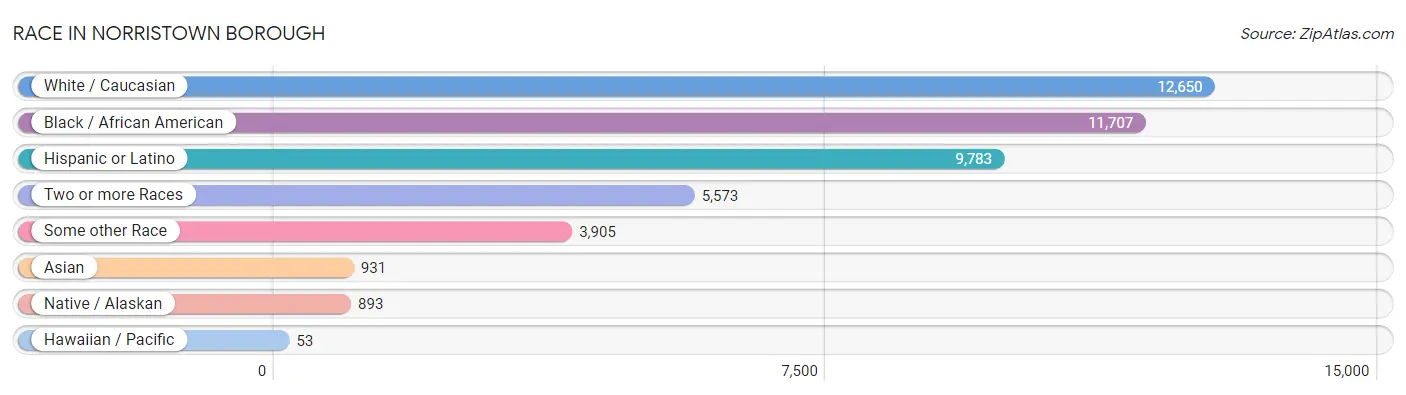
| Race | # Population | % Population |
| Asian | 931 | 2.6% |
| Black / African American | 11,707 | 32.8% |
| Hawaiian / Pacific | 53 | 0.2% |
| Hispanic or Latino | 9,783 | 27.4% |
| Native / Alaskan | 893 | 2.5% |
| White / Caucasian | 12,650 | 35.4% |
| Two or more Races | 5,573 | 15.6% |
| Some other Race | 3,905 | 10.9% |
| Total | 35,712 | 100.0% |
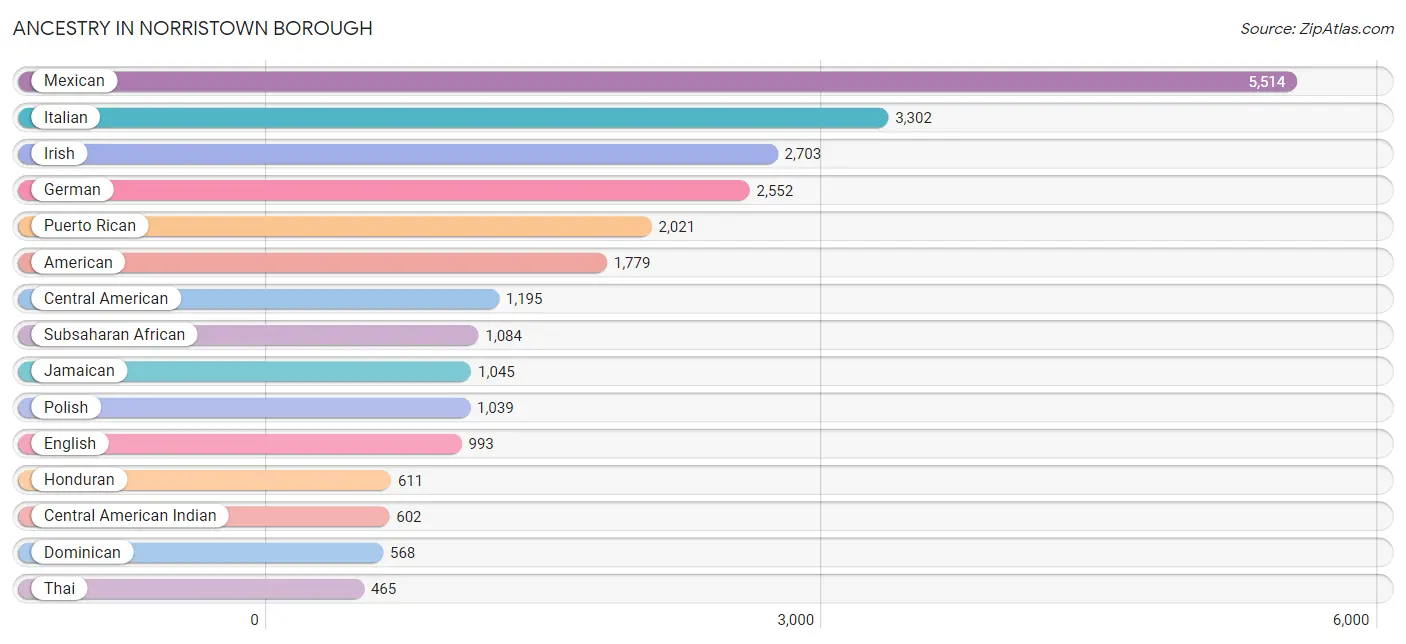
Ancestry in Norristown borough
The most populous ancestries reported in Norristown borough are Mexican (5,514 | 15.4%), Italian (3,302 | 9.2%), Irish (2,703 | 7.6%), German (2,552 | 7.1%), and Puerto Rican (2,021 | 5.7%), together accounting for 45.1% of all Norristown borough residents.
| Ancestry | # Population | % Population |
| African | 200 | 0.6% |
| American | 1,779 | 5.0% |
| Arab | 125 | 0.4% |
| Austrian | 9 | 0.0% |
| Bahamian | 23 | 0.1% |
| Barbadian | 14 | 0.0% |
| Blackfeet | 23 | 0.1% |
| British | 105 | 0.3% |
| Burmese | 200 | 0.6% |
| Cajun | 16 | 0.0% |
| Canadian | 10 | 0.0% |
| Central American | 1,195 | 3.4% |
| Central American Indian | 602 | 1.7% |
| Cherokee | 53 | 0.2% |
| Chilean | 98 | 0.3% |
| Colombian | 22 | 0.1% |
| Costa Rican | 51 | 0.1% |
| Croatian | 9 | 0.0% |
| Cuban | 67 | 0.2% |
| Danish | 68 | 0.2% |
| Delaware | 28 | 0.1% |
| Dominican | 568 | 1.6% |
| Dutch | 135 | 0.4% |
| Eastern European | 83 | 0.2% |
| Ecuadorian | 57 | 0.2% |
| Egyptian | 20 | 0.1% |
| English | 993 | 2.8% |
| Ethiopian | 8 | 0.0% |
| European | 117 | 0.3% |
| French | 130 | 0.4% |
| French Canadian | 17 | 0.1% |
| German | 2,552 | 7.1% |
| Greek | 48 | 0.1% |
| Guamanian / Chamorro | 51 | 0.1% |
| Guatemalan | 29 | 0.1% |
| Guyanese | 20 | 0.1% |
| Haitian | 164 | 0.5% |
| Honduran | 611 | 1.7% |
| Hungarian | 27 | 0.1% |
| Indian (Asian) | 37 | 0.1% |
| Iranian | 16 | 0.0% |
| Irish | 2,703 | 7.6% |
| Italian | 3,302 | 9.2% |
| Jamaican | 1,045 | 2.9% |
| Japanese | 31 | 0.1% |
| Korean | 169 | 0.5% |
| Lebanese | 1 | 0.0% |
| Lithuanian | 297 | 0.8% |
| Mexican | 5,514 | 15.4% |
| Mexican American Indian | 194 | 0.5% |
| Moroccan | 104 | 0.3% |
| Native Hawaiian | 9 | 0.0% |
| Navajo | 8 | 0.0% |
| New Zealander | 25 | 0.1% |
| Nicaraguan | 2 | 0.0% |
| Nigerian | 22 | 0.1% |
| Northern European | 12 | 0.0% |
| Okinawan | 40 | 0.1% |
| Panamanian | 38 | 0.1% |
| Pennsylvania German | 69 | 0.2% |
| Polish | 1,039 | 2.9% |
| Portuguese | 14 | 0.0% |
| Puerto Rican | 2,021 | 5.7% |
| Romanian | 94 | 0.3% |
| Russian | 53 | 0.2% |
| Salvadoran | 464 | 1.3% |
| Scandinavian | 9 | 0.0% |
| Scotch-Irish | 130 | 0.4% |
| Scottish | 173 | 0.5% |
| Slovak | 44 | 0.1% |
| South American | 200 | 0.6% |
| South American Indian | 10 | 0.0% |
| Spanish | 14 | 0.0% |
| Sri Lankan | 82 | 0.2% |
| Subsaharan African | 1,084 | 3.0% |
| Swedish | 14 | 0.0% |
| Swiss | 6 | 0.0% |
| Thai | 465 | 1.3% |
| Trinidadian and Tobagonian | 98 | 0.3% |
| Ukrainian | 161 | 0.4% |
| Welsh | 74 | 0.2% |
| West Indian | 17 | 0.1% |
| Yugoslavian | 11 | 0.0% | View All 83 Rows |
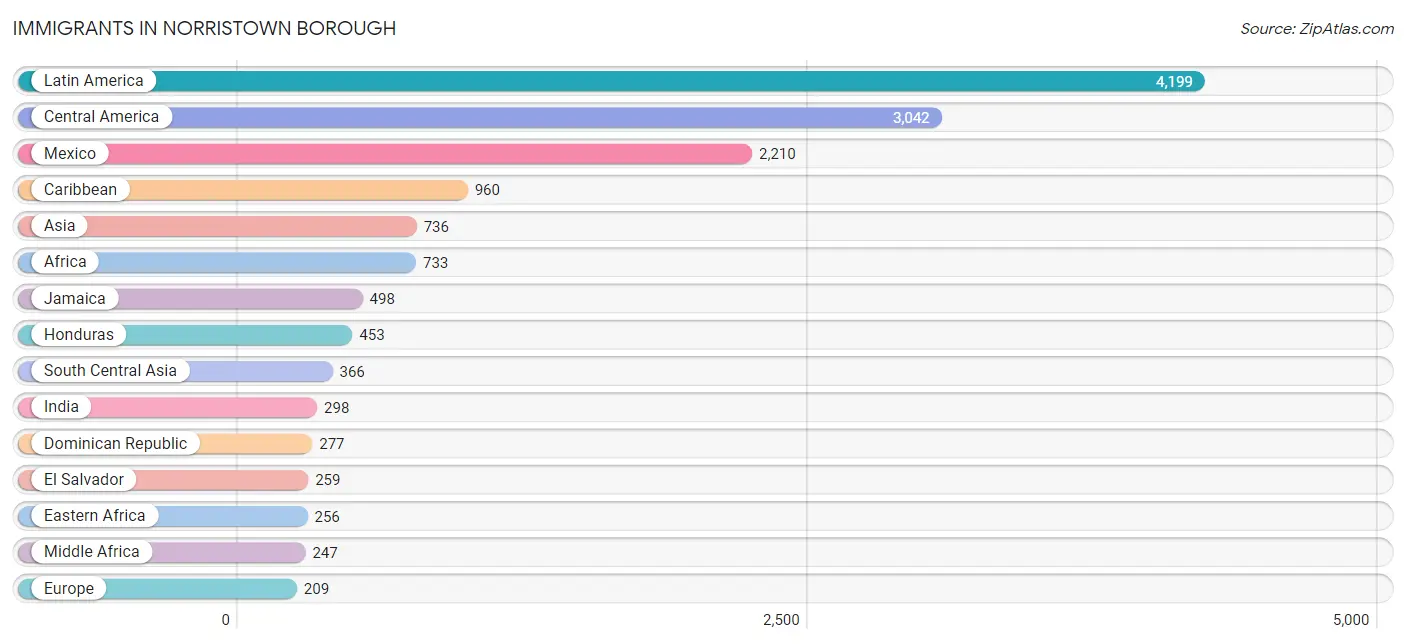
Immigrants in Norristown borough
The most numerous immigrant groups reported in Norristown borough came from Latin America (4,199 | 11.8%), Central America (3,042 | 8.5%), Mexico (2,210 | 6.2%), Caribbean (960 | 2.7%), and Asia (736 | 2.1%), together accounting for 31.2% of all Norristown borough residents.
| Immigration Origin | # Population | % Population |
| Africa | 733 | 2.1% |
| Asia | 736 | 2.1% |
| Barbados | 31 | 0.1% |
| Bosnia and Herzegovina | 17 | 0.1% |
| Cameroon | 45 | 0.1% |
| Canada | 25 | 0.1% |
| Caribbean | 960 | 2.7% |
| Central America | 3,042 | 8.5% |
| Chile | 91 | 0.3% |
| Colombia | 22 | 0.1% |
| Costa Rica | 51 | 0.1% |
| Cuba | 30 | 0.1% |
| Dominica | 12 | 0.0% |
| Dominican Republic | 277 | 0.8% |
| Eastern Africa | 256 | 0.7% |
| Eastern Asia | 171 | 0.5% |
| Eastern Europe | 187 | 0.5% |
| Ecuador | 27 | 0.1% |
| Egypt | 20 | 0.1% |
| El Salvador | 259 | 0.7% |
| Ethiopia | 8 | 0.0% |
| Europe | 209 | 0.6% |
| Greece | 13 | 0.0% |
| Guatemala | 29 | 0.1% |
| Guyana | 20 | 0.1% |
| Haiti | 30 | 0.1% |
| Honduras | 453 | 1.3% |
| India | 298 | 0.8% |
| Italy | 9 | 0.0% |
| Jamaica | 498 | 1.4% |
| Kazakhstan | 27 | 0.1% |
| Korea | 171 | 0.5% |
| Latin America | 4,199 | 11.8% |
| Mexico | 2,210 | 6.2% |
| Middle Africa | 247 | 0.7% |
| Morocco | 118 | 0.3% |
| Nepal | 6 | 0.0% |
| Nicaragua | 2 | 0.0% |
| Nigeria | 43 | 0.1% |
| Northern Africa | 138 | 0.4% |
| Panama | 38 | 0.1% |
| Philippines | 96 | 0.3% |
| Poland | 32 | 0.1% |
| Romania | 17 | 0.1% |
| Singapore | 40 | 0.1% |
| South Africa | 23 | 0.1% |
| South America | 197 | 0.5% |
| South Central Asia | 366 | 1.0% |
| South Eastern Asia | 199 | 0.6% |
| Southern Europe | 22 | 0.1% |
| Trinidad and Tobago | 82 | 0.2% |
| Ukraine | 27 | 0.1% |
| Uzbekistan | 35 | 0.1% |
| Vietnam | 63 | 0.2% |
| Western Africa | 69 | 0.2% | View All 55 Rows |
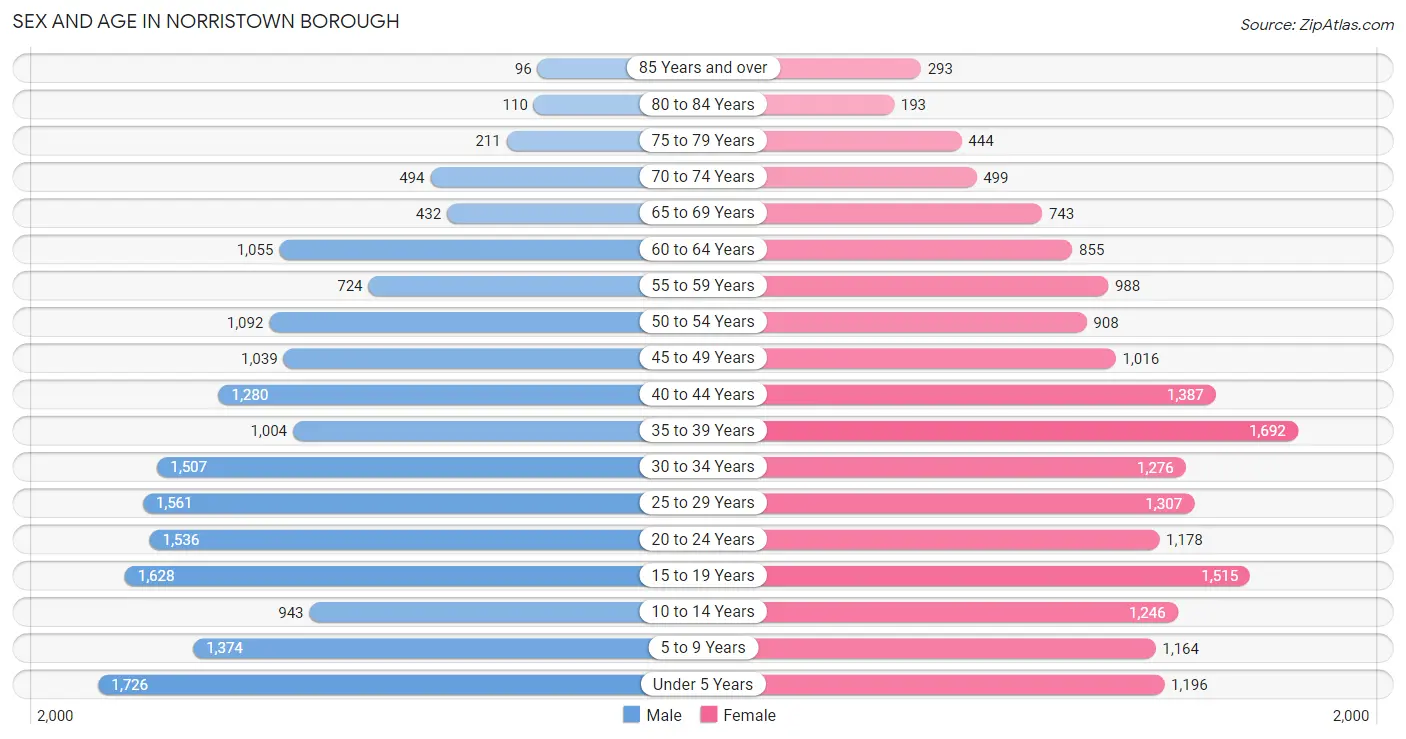
Sex and Age in Norristown borough
Sex and Age in Norristown borough
The most populous age groups in Norristown borough are Under 5 Years (1,726 | 9.7%) for men and 35 to 39 Years (1,692 | 9.5%) for women.
| Age Bracket | Male | Female |
| Under 5 Years | 1,726 (9.7%) | 1,196 (6.7%) |
| 5 to 9 Years | 1,374 (7.7%) | 1,164 (6.5%) |
| 10 to 14 Years | 943 (5.3%) | 1,246 (7.0%) |
| 15 to 19 Years | 1,628 (9.1%) | 1,515 (8.5%) |
| 20 to 24 Years | 1,536 (8.6%) | 1,178 (6.6%) |
| 25 to 29 Years | 1,561 (8.8%) | 1,307 (7.3%) |
| 30 to 34 Years | 1,507 (8.5%) | 1,276 (7.1%) |
| 35 to 39 Years | 1,004 (5.6%) | 1,692 (9.5%) |
| 40 to 44 Years | 1,280 (7.2%) | 1,387 (7.7%) |
| 45 to 49 Years | 1,039 (5.8%) | 1,016 (5.7%) |
| 50 to 54 Years | 1,092 (6.1%) | 908 (5.1%) |
| 55 to 59 Years | 724 (4.1%) | 988 (5.5%) |
| 60 to 64 Years | 1,055 (5.9%) | 855 (4.8%) |
| 65 to 69 Years | 432 (2.4%) | 743 (4.2%) |
| 70 to 74 Years | 494 (2.8%) | 499 (2.8%) |
| 75 to 79 Years | 211 (1.2%) | 444 (2.5%) |
| 80 to 84 Years | 110 (0.6%) | 193 (1.1%) |
| 85 Years and over | 96 (0.5%) | 293 (1.6%) |
| Total | 17,812 (100.0%) | 17,900 (100.0%) |
Families and Households in Norristown borough
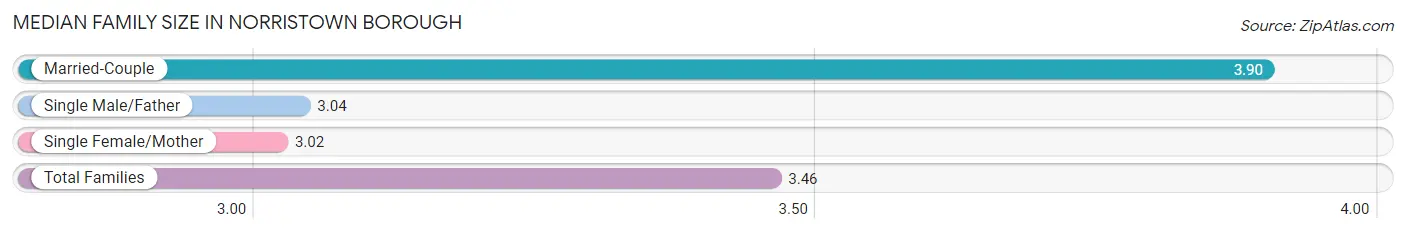
Median Family Size in Norristown borough
The median family size in Norristown borough is 3.46 persons per family, with married-couple families (3,951 | 49.9%) accounting for the largest median family size of 3.9 persons per family. On the other hand, single female/mother families (2,820 | 35.6%) represent the smallest median family size with 3.02 persons per family.
| Family Type | # Families | Family Size |
| Married-Couple | 3,951 (49.9%) | 3.90 |
| Single Male/Father | 1,152 (14.5%) | 3.04 |
| Single Female/Mother | 2,820 (35.6%) | 3.02 |
| Total Families | 7,923 (100.0%) | 3.46 |
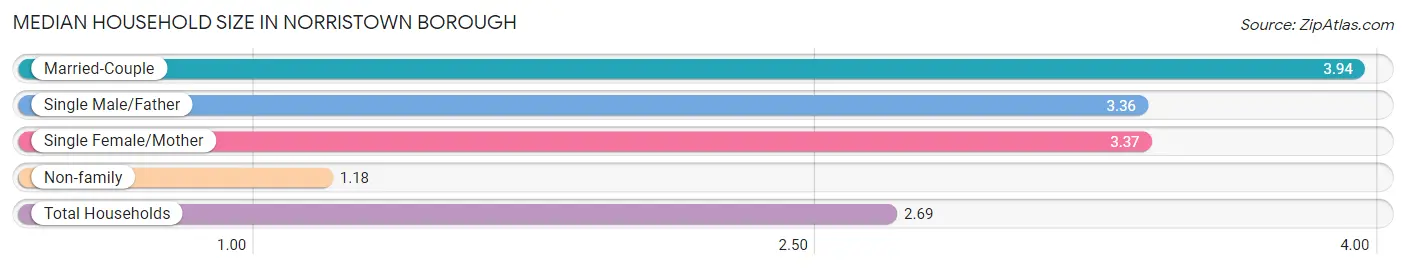
Median Household Size in Norristown borough
The median household size in Norristown borough is 2.69 persons per household, with married-couple households (3,951 | 30.6%) accounting for the largest median household size of 3.94 persons per household. non-family households (4,995 | 38.7%) represent the smallest median household size with 1.18 persons per household.
| Household Type | # Households | Household Size |
| Married-Couple | 3,951 (30.6%) | 3.94 |
| Single Male/Father | 1,152 (8.9%) | 3.36 |
| Single Female/Mother | 2,820 (21.8%) | 3.37 |
| Non-family | 4,995 (38.7%) | 1.18 |
| Total Households | 12,918 (100.0%) | 2.69 |
Household Size by Marriage Status in Norristown borough
Out of a total of 12,918 households in Norristown borough, 7,923 (61.3%) are family households, while 4,995 (38.7%) are nonfamily households. The most numerous type of family households are 2-person households, comprising 2,712, and the most common type of nonfamily households are 1-person households, comprising 4,225.

| Household Size | Family Households | Nonfamily Households |
| 1-Person Households | - | 4,225 (32.7%) |
| 2-Person Households | 2,712 (21.0%) | 663 (5.1%) |
| 3-Person Households | 1,931 (14.9%) | 107 (0.8%) |
| 4-Person Households | 1,652 (12.8%) | 0 (0.0%) |
| 5-Person Households | 732 (5.7%) | 0 (0.0%) |
| 6-Person Households | 516 (4.0%) | 0 (0.0%) |
| 7+ Person Households | 380 (2.9%) | 0 (0.0%) |
| Total | 7,923 (61.3%) | 4,995 (38.7%) |
Female Fertility in Norristown borough
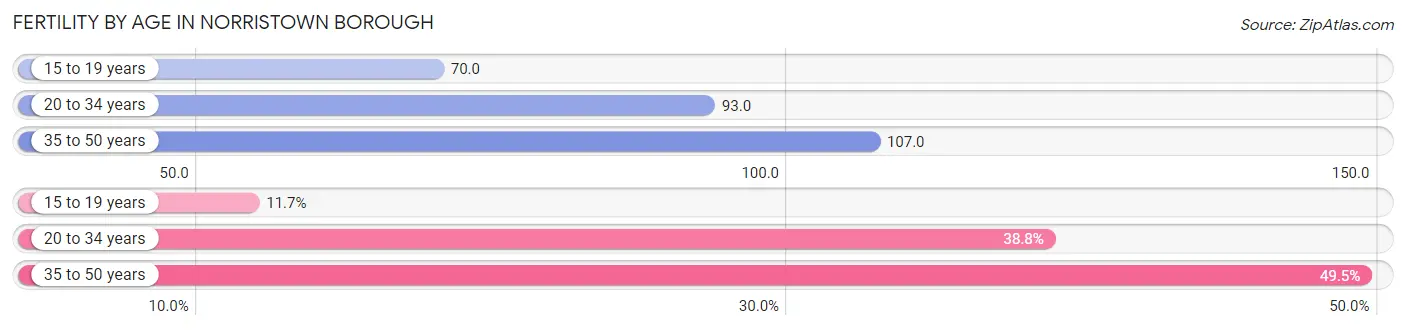
Fertility by Age in Norristown borough
Average fertility rate in Norristown borough is 96.0 births per 1,000 women. Women in the age bracket of 35 to 50 years have the highest fertility rate with 107.0 births per 1,000 women. Women in the age bracket of 35 to 50 years acount for 49.5% of all women with births.
| Age Bracket | Women with Births | Births / 1,000 Women |
| 15 to 19 years | 106 (11.7%) | 70.0 |
| 20 to 34 years | 350 (38.8%) | 93.0 |
| 35 to 50 years | 447 (49.5%) | 107.0 |
| Total | 903 (100.0%) | 96.0 |
Fertility by Age by Marriage Status in Norristown borough
65.2% of women with births (903) in Norristown borough are married. The highest percentage of unmarried women with births falls into 15 to 19 years age bracket with 100.0% of them unmarried at the time of birth, while the lowest percentage of unmarried women with births belong to 35 to 50 years age bracket with 14.5% of them unmarried.
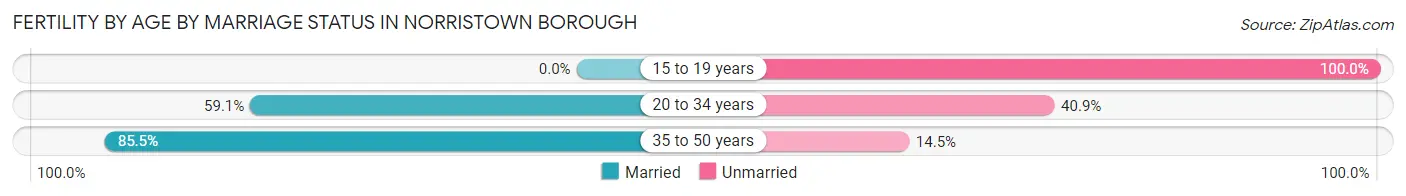
| Age Bracket | Married | Unmarried |
| 15 to 19 years | 0 (0.0%) | 106 (100.0%) |
| 20 to 34 years | 207 (59.1%) | 143 (40.9%) |
| 35 to 50 years | 382 (85.5%) | 65 (14.5%) |
| Total | 589 (65.2%) | 314 (34.8%) |
Fertility by Education in Norristown borough
Average fertility rate in Norristown borough is 96.0 births per 1,000 women. Women with the education attainment of college or associate's degree have the highest fertility rate of 146.0 births per 1,000 women, while women with the education attainment of high school diploma have the lowest fertility at 73.0 births per 1,000 women. Women with the education attainment of college or associate's degree represent 42.9% of all women with births.
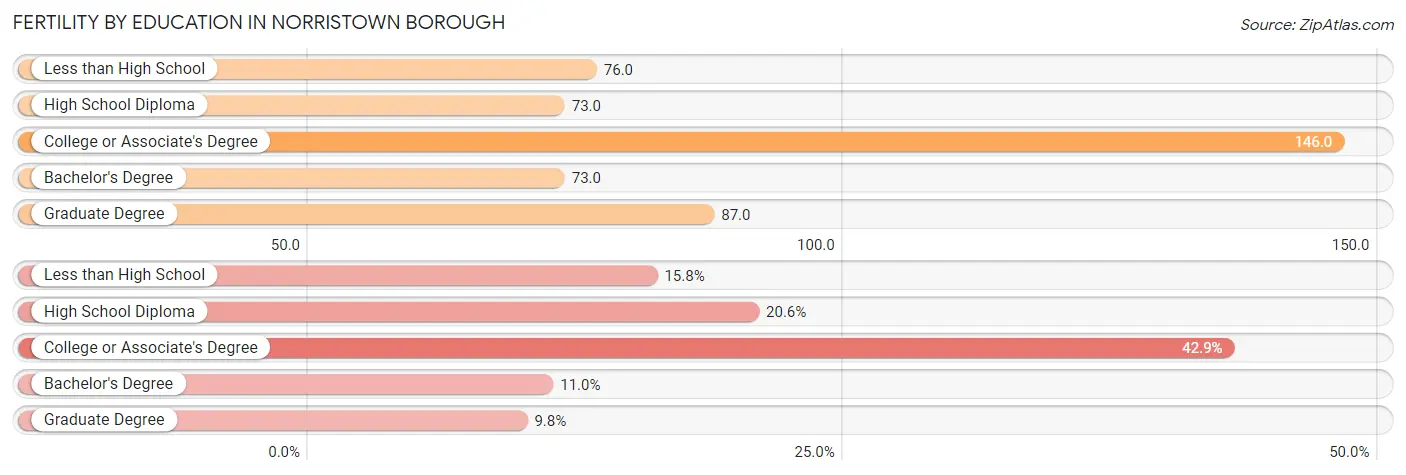
| Educational Attainment | Women with Births | Births / 1,000 Women |
| Less than High School | 143 (15.8%) | 76.0 |
| High School Diploma | 186 (20.6%) | 73.0 |
| College or Associate's Degree | 387 (42.9%) | 146.0 |
| Bachelor's Degree | 99 (11.0%) | 73.0 |
| Graduate Degree | 88 (9.8%) | 87.0 |
| Total | 903 (100.0%) | 96.0 |
Fertility by Education by Marriage Status in Norristown borough
34.8% of women with births in Norristown borough are unmarried. Women with the educational attainment of bachelor's degree are most likely to be married with 82.8% of them married at childbirth, while women with the educational attainment of less than high school are least likely to be married with 46.9% of them unmarried at childbirth.
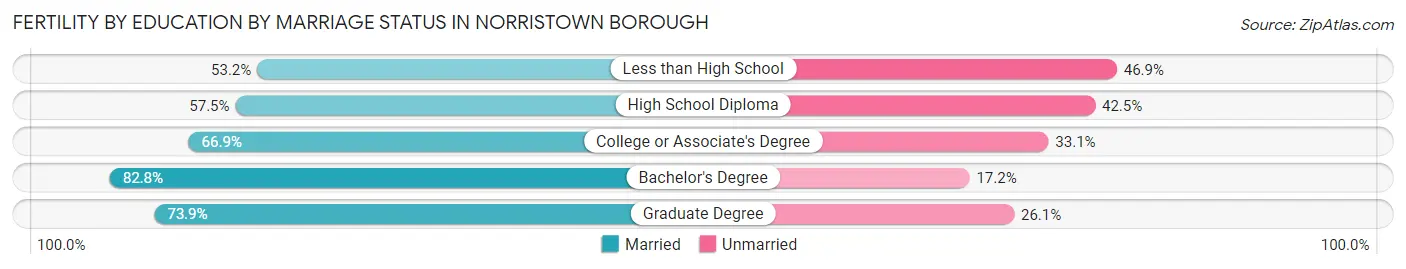
| Educational Attainment | Married | Unmarried |
| Less than High School | 76 (53.1%) | 67 (46.9%) |
| High School Diploma | 107 (57.5%) | 79 (42.5%) |
| College or Associate's Degree | 259 (66.9%) | 128 (33.1%) |
| Bachelor's Degree | 82 (82.8%) | 17 (17.2%) |
| Graduate Degree | 65 (73.9%) | 23 (26.1%) |
| Total | 589 (65.2%) | 314 (34.8%) |
Employment Characteristics in Norristown borough
Employment by Class of Employer in Norristown borough
Among the 17,354 employed individuals in Norristown borough, private company employees (13,225 | 76.2%), not-for-profit organizations (1,787 | 10.3%), and self-employed (not incorporated) (707 | 4.1%) make up the most common classes of employment.
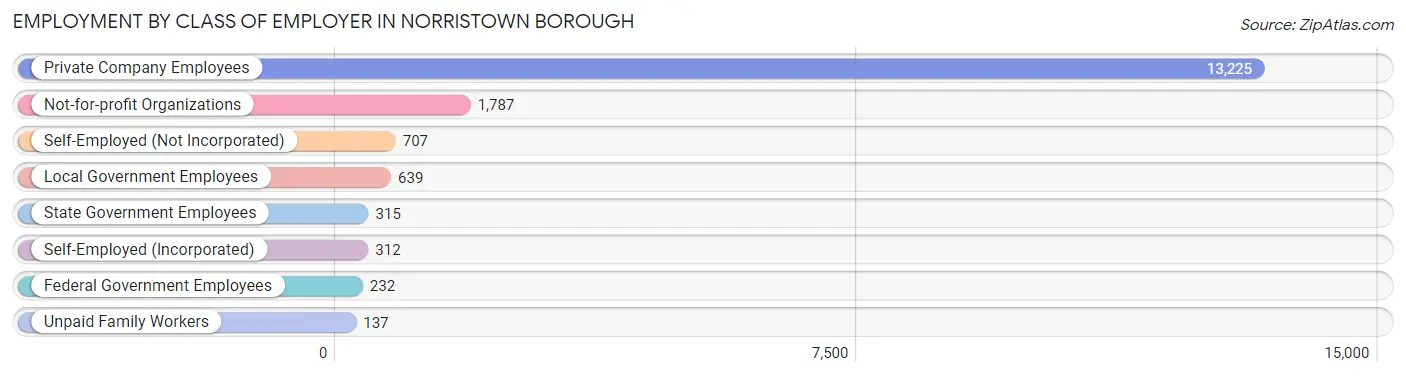
| Employer Class | # Employees | % Employees |
| Private Company Employees | 13,225 | 76.2% |
| Self-Employed (Incorporated) | 312 | 1.8% |
| Self-Employed (Not Incorporated) | 707 | 4.1% |
| Not-for-profit Organizations | 1,787 | 10.3% |
| Local Government Employees | 639 | 3.7% |
| State Government Employees | 315 | 1.8% |
| Federal Government Employees | 232 | 1.3% |
| Unpaid Family Workers | 137 | 0.8% |
| Total | 17,354 | 100.0% |
Employment Status by Age in Norristown borough
According to the labor force statistics for Norristown borough, out of the total population over 16 years of age (27,140), 70.0% or 18,998 individuals are in the labor force, with 6.2% or 1,178 of them unemployed. The age group with the highest labor force participation rate is 25 to 29 years, with 90.6% or 2,598 individuals in the labor force. Within the labor force, the 75 years and over age range has the highest percentage of unemployed individuals, with 17.8% or 34 of them being unemployed.
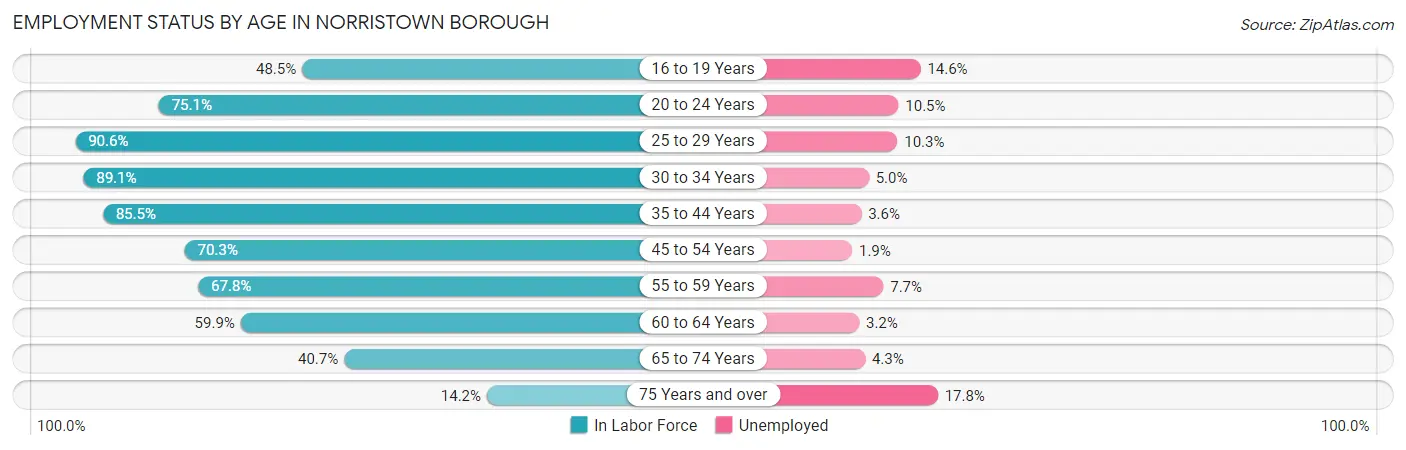
| Age Bracket | In Labor Force | Unemployed |
| 16 to 19 Years | 1,077 (48.5%) | 157 (14.6%) |
| 20 to 24 Years | 2,038 (75.1%) | 214 (10.5%) |
| 25 to 29 Years | 2,598 (90.6%) | 268 (10.3%) |
| 30 to 34 Years | 2,480 (89.1%) | 124 (5.0%) |
| 35 to 44 Years | 4,585 (85.5%) | 165 (3.6%) |
| 45 to 54 Years | 2,851 (70.3%) | 54 (1.9%) |
| 55 to 59 Years | 1,161 (67.8%) | 89 (7.7%) |
| 60 to 64 Years | 1,144 (59.9%) | 37 (3.2%) |
| 65 to 74 Years | 882 (40.7%) | 38 (4.3%) |
| 75 Years and over | 191 (14.2%) | 34 (17.8%) |
| Total | 18,998 (70.0%) | 1,178 (6.2%) |
Employment Status by Educational Attainment in Norristown borough
According to labor force statistics for Norristown borough, 79.3% of individuals (14,822) out of the total population between 25 and 64 years of age (18,691) are in the labor force, with 5.0% or 741 of them being unemployed. The group with the highest labor force participation rate are those with the educational attainment of bachelor's degree or higher, with 92.4% or 4,134 individuals in the labor force. Within the labor force, individuals with college / associate degree education have the highest percentage of unemployment, with 7.7% or 311 of them being unemployed.
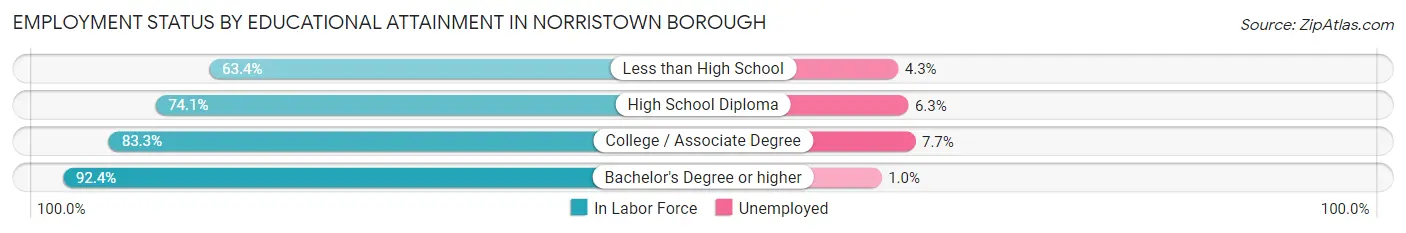
| Educational Attainment | In Labor Force | Unemployed |
| Less than High School | 1,716 (63.4%) | 116 (4.3%) |
| High School Diploma | 4,940 (74.1%) | 420 (6.3%) |
| College / Associate Degree | 4,035 (83.3%) | 373 (7.7%) |
| Bachelor's Degree or higher | 4,134 (92.4%) | 45 (1.0%) |
| Total | 14,822 (79.3%) | 935 (5.0%) |
Employment Occupations by Sex in Norristown borough
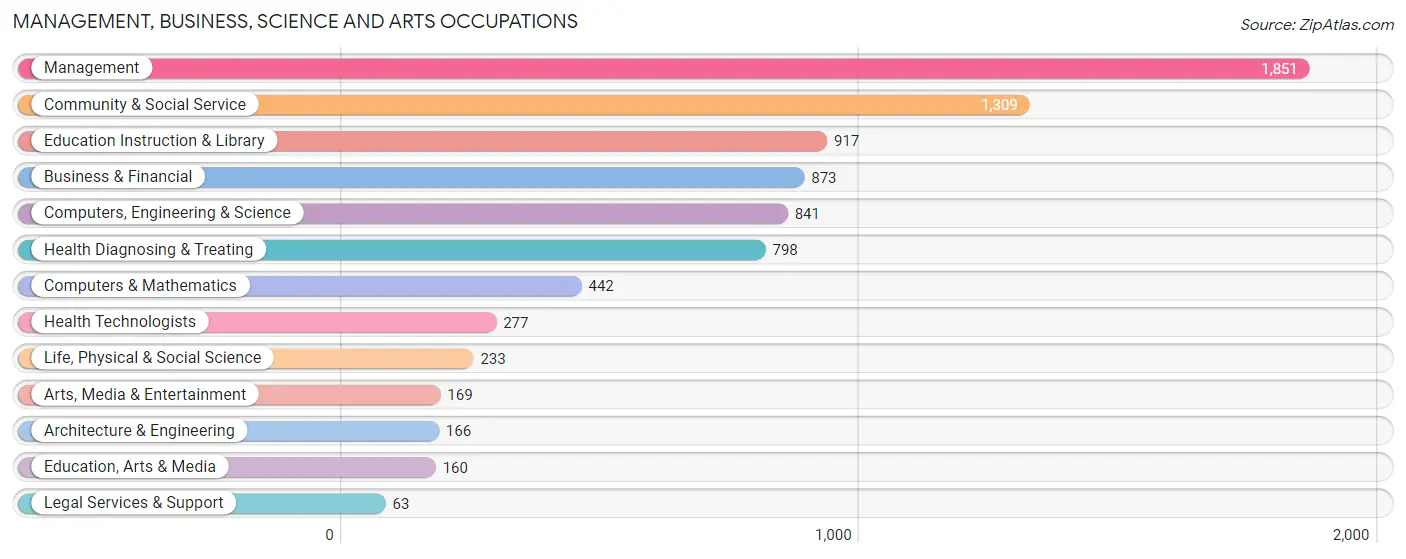
Management, Business, Science and Arts Occupations
The most common Management, Business, Science and Arts occupations in Norristown borough are Management (1,851 | 10.4%), Community & Social Service (1,309 | 7.3%), Education Instruction & Library (917 | 5.1%), Business & Financial (873 | 4.9%), and Computers, Engineering & Science (841 | 4.7%).
Management, Business, Science and Arts Occupations by Sex
Within the Management, Business, Science and Arts occupations in Norristown borough, the most male-oriented occupations are Legal Services & Support (92.1%), Architecture & Engineering (86.1%), and Computers & Mathematics (61.3%), while the most female-oriented occupations are Education Instruction & Library (89.9%), Health Diagnosing & Treating (82.1%), and Health Technologists (81.6%).
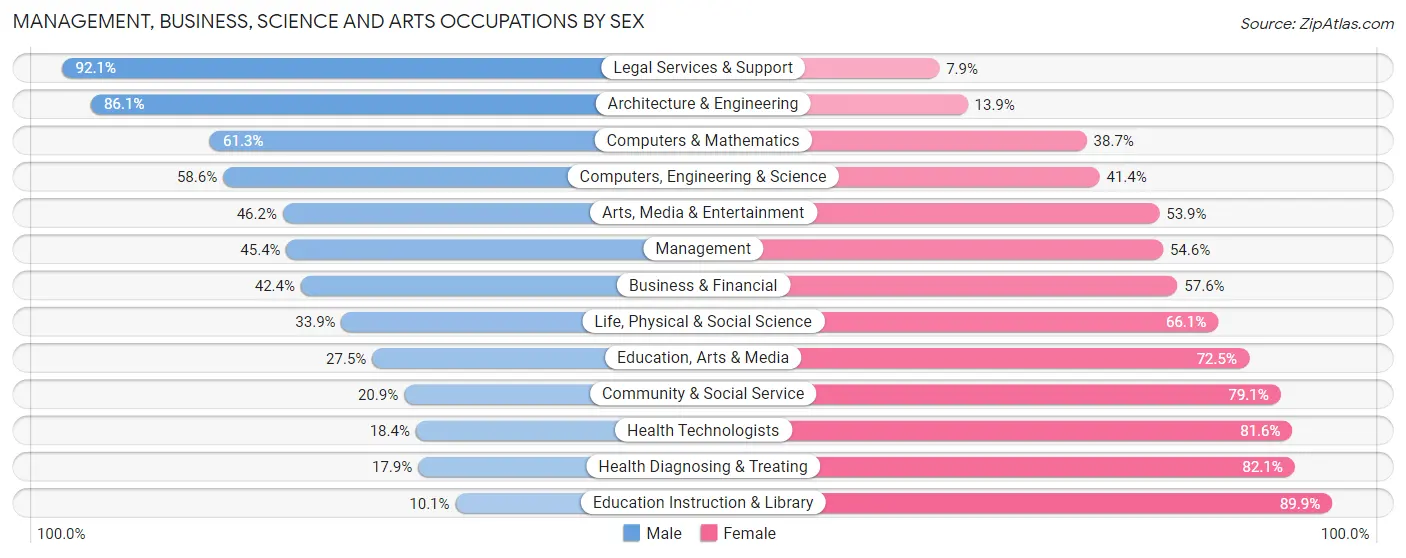
| Occupation | Male | Female |
| Management | 840 (45.4%) | 1,011 (54.6%) |
| Business & Financial | 370 (42.4%) | 503 (57.6%) |
| Computers, Engineering & Science | 493 (58.6%) | 348 (41.4%) |
| Computers & Mathematics | 271 (61.3%) | 171 (38.7%) |
| Architecture & Engineering | 143 (86.1%) | 23 (13.9%) |
| Life, Physical & Social Science | 79 (33.9%) | 154 (66.1%) |
| Community & Social Service | 273 (20.9%) | 1,036 (79.1%) |
| Education, Arts & Media | 44 (27.5%) | 116 (72.5%) |
| Legal Services & Support | 58 (92.1%) | 5 (7.9%) |
| Education Instruction & Library | 93 (10.1%) | 824 (89.9%) |
| Arts, Media & Entertainment | 78 (46.2%) | 91 (53.8%) |
| Health Diagnosing & Treating | 143 (17.9%) | 655 (82.1%) |
| Health Technologists | 51 (18.4%) | 226 (81.6%) |
| Total (Category) | 2,119 (37.4%) | 3,553 (62.6%) |
| Total (Overall) | 8,899 (49.9%) | 8,926 (50.1%) |
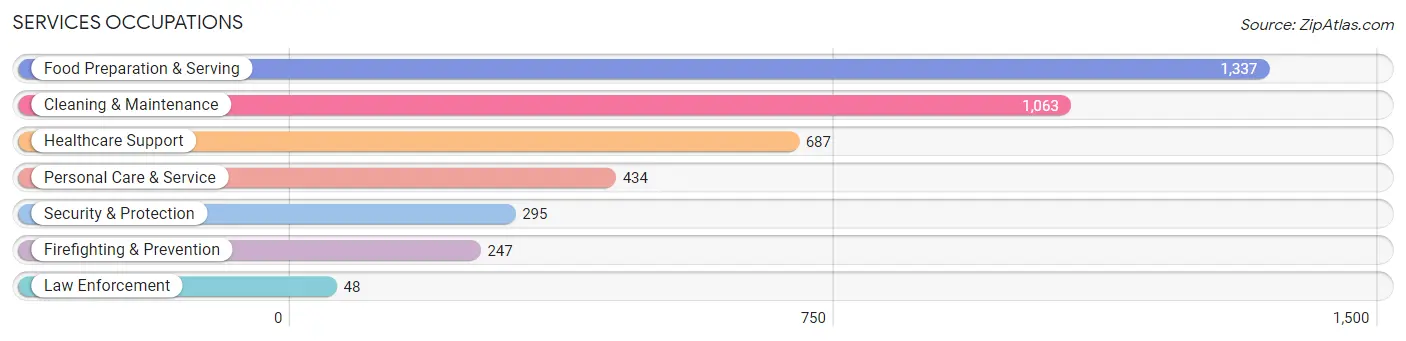
Services Occupations
The most common Services occupations in Norristown borough are Food Preparation & Serving (1,337 | 7.5%), Cleaning & Maintenance (1,063 | 6.0%), Healthcare Support (687 | 3.8%), Personal Care & Service (434 | 2.4%), and Security & Protection (295 | 1.7%).
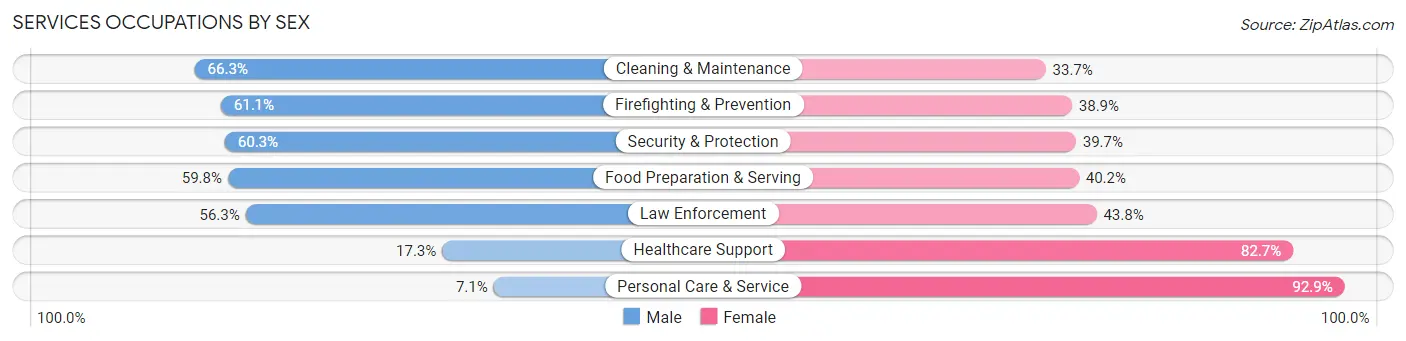
Services Occupations by Sex
Within the Services occupations in Norristown borough, the most male-oriented occupations are Cleaning & Maintenance (66.3%), Firefighting & Prevention (61.1%), and Security & Protection (60.3%), while the most female-oriented occupations are Personal Care & Service (92.9%), Healthcare Support (82.7%), and Law Enforcement (43.8%).
| Occupation | Male | Female |
| Healthcare Support | 119 (17.3%) | 568 (82.7%) |
| Security & Protection | 178 (60.3%) | 117 (39.7%) |
| Firefighting & Prevention | 151 (61.1%) | 96 (38.9%) |
| Law Enforcement | 27 (56.2%) | 21 (43.8%) |
| Food Preparation & Serving | 799 (59.8%) | 538 (40.2%) |
| Cleaning & Maintenance | 705 (66.3%) | 358 (33.7%) |
| Personal Care & Service | 31 (7.1%) | 403 (92.9%) |
| Total (Category) | 1,832 (48.0%) | 1,984 (52.0%) |
| Total (Overall) | 8,899 (49.9%) | 8,926 (50.1%) |
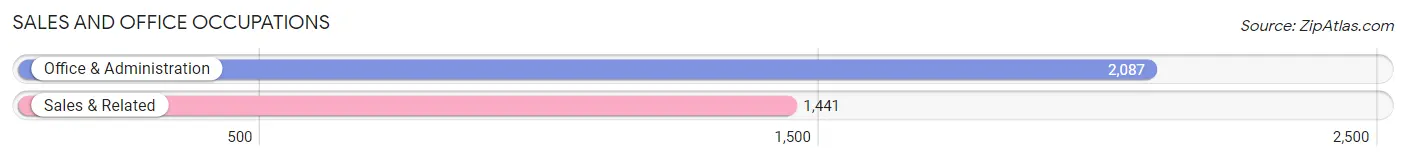
Sales and Office Occupations
The most common Sales and Office occupations in Norristown borough are Office & Administration (2,087 | 11.7%), and Sales & Related (1,441 | 8.1%).
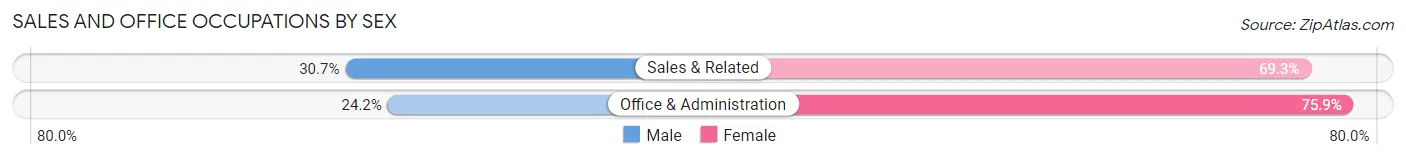
Sales and Office Occupations by Sex
| Occupation | Male | Female |
| Sales & Related | 442 (30.7%) | 999 (69.3%) |
| Office & Administration | 504 (24.1%) | 1,583 (75.8%) |
| Total (Category) | 946 (26.8%) | 2,582 (73.2%) |
| Total (Overall) | 8,899 (49.9%) | 8,926 (50.1%) |
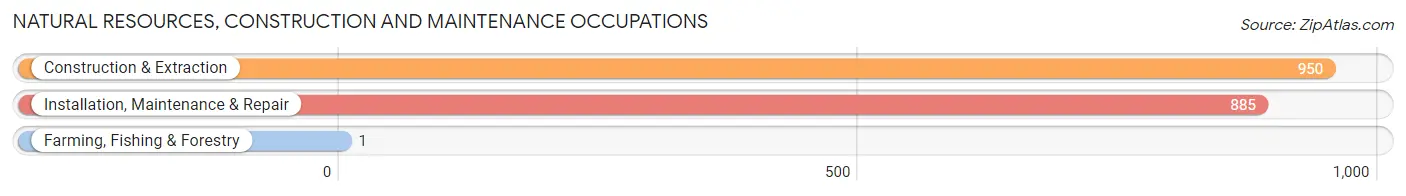
Natural Resources, Construction and Maintenance Occupations
The most common Natural Resources, Construction and Maintenance occupations in Norristown borough are Construction & Extraction (950 | 5.3%), Installation, Maintenance & Repair (885 | 5.0%), and Farming, Fishing & Forestry (1 | 0.0%).
Natural Resources, Construction and Maintenance Occupations by Sex
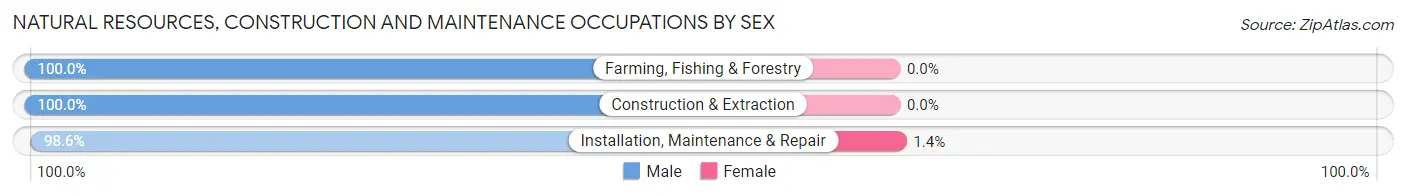
| Occupation | Male | Female |
| Farming, Fishing & Forestry | 1 (100.0%) | 0 (0.0%) |
| Construction & Extraction | 950 (100.0%) | 0 (0.0%) |
| Installation, Maintenance & Repair | 873 (98.6%) | 12 (1.4%) |
| Total (Category) | 1,824 (99.4%) | 12 (0.6%) |
| Total (Overall) | 8,899 (49.9%) | 8,926 (50.1%) |
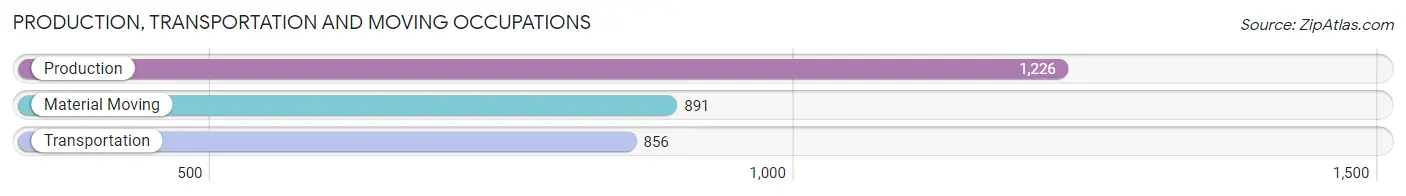
Production, Transportation and Moving Occupations
The most common Production, Transportation and Moving occupations in Norristown borough are Production (1,226 | 6.9%), Material Moving (891 | 5.0%), and Transportation (856 | 4.8%).
Production, Transportation and Moving Occupations by Sex
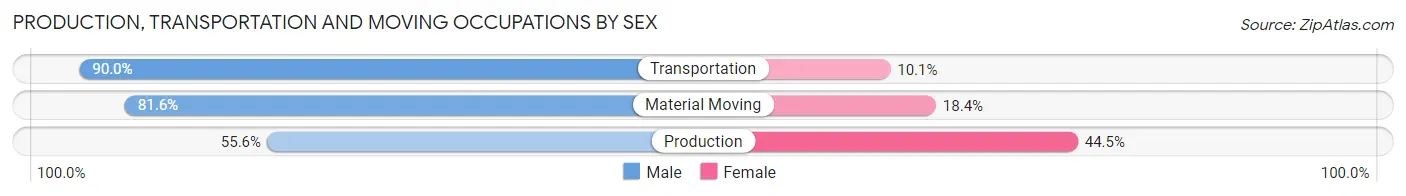
| Occupation | Male | Female |
| Production | 681 (55.5%) | 545 (44.5%) |
| Transportation | 770 (89.9%) | 86 (10.1%) |
| Material Moving | 727 (81.6%) | 164 (18.4%) |
| Total (Category) | 2,178 (73.3%) | 795 (26.7%) |
| Total (Overall) | 8,899 (49.9%) | 8,926 (50.1%) |
Employment Industries by Sex in Norristown borough
Employment Industries in Norristown borough
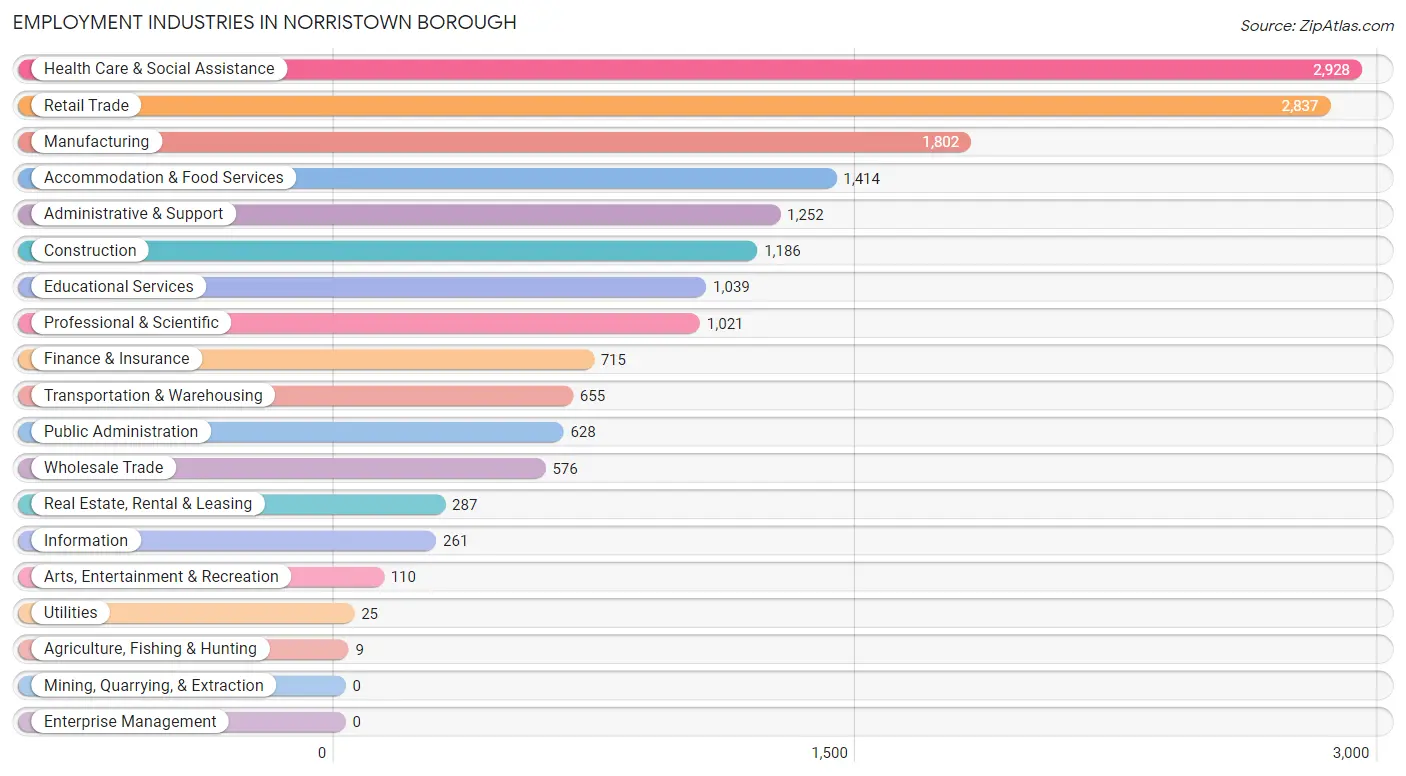
The major employment industries in Norristown borough include Health Care & Social Assistance (2,928 | 16.4%), Retail Trade (2,837 | 15.9%), Manufacturing (1,802 | 10.1%), Accommodation & Food Services (1,414 | 7.9%), and Administrative & Support (1,252 | 7.0%).
Employment Industries by Sex in Norristown borough
The Norristown borough industries that see more men than women are Utilities (100.0%), Arts, Entertainment & Recreation (100.0%), and Construction (92.0%), whereas the industries that tend to have a higher number of women are Agriculture, Fishing & Hunting (88.9%), Health Care & Social Assistance (79.9%), and Educational Services (71.7%).
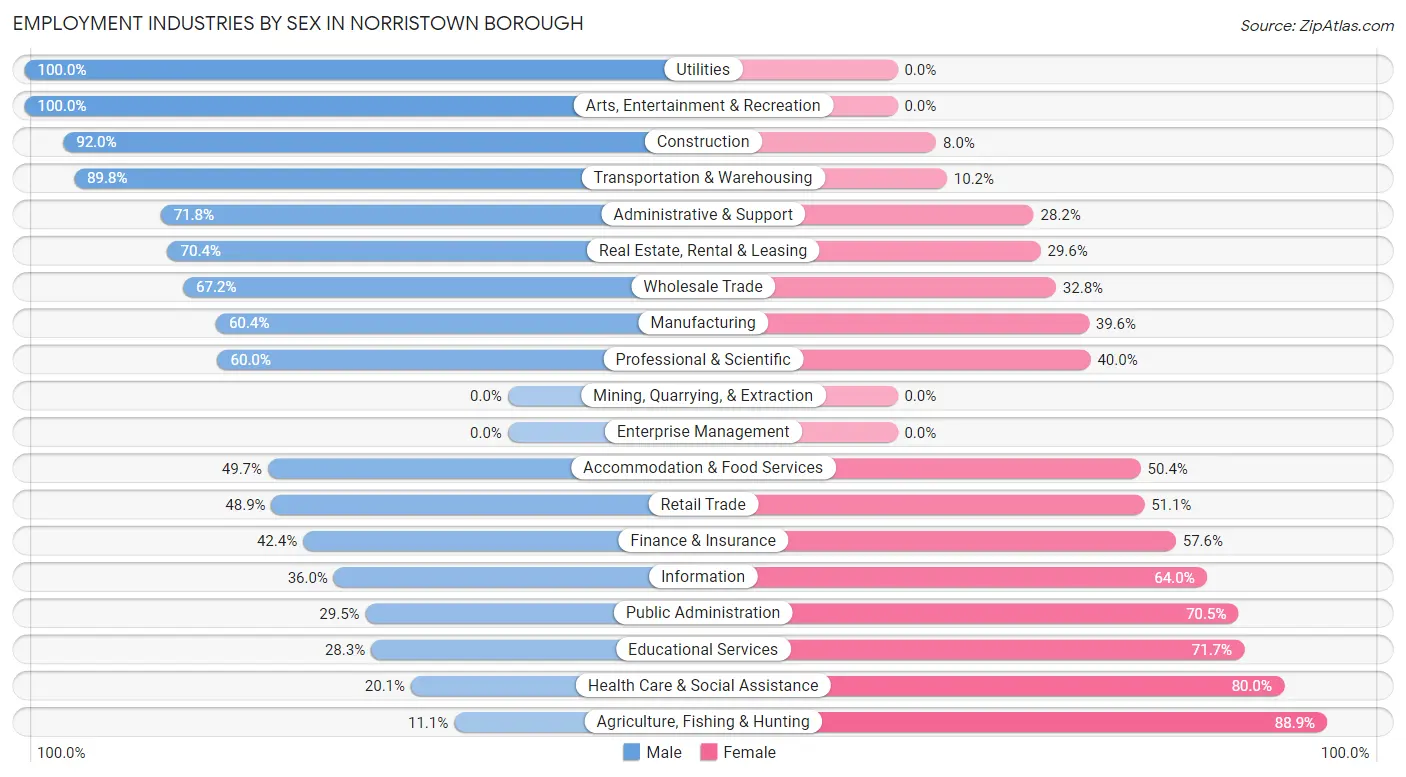
| Industry | Male | Female |
| Agriculture, Fishing & Hunting | 1 (11.1%) | 8 (88.9%) |
| Mining, Quarrying, & Extraction | 0 (0.0%) | 0 (0.0%) |
| Construction | 1,091 (92.0%) | 95 (8.0%) |
| Manufacturing | 1,088 (60.4%) | 714 (39.6%) |
| Wholesale Trade | 387 (67.2%) | 189 (32.8%) |
| Retail Trade | 1,388 (48.9%) | 1,449 (51.1%) |
| Transportation & Warehousing | 588 (89.8%) | 67 (10.2%) |
| Utilities | 25 (100.0%) | 0 (0.0%) |
| Information | 94 (36.0%) | 167 (64.0%) |
| Finance & Insurance | 303 (42.4%) | 412 (57.6%) |
| Real Estate, Rental & Leasing | 202 (70.4%) | 85 (29.6%) |
| Professional & Scientific | 613 (60.0%) | 408 (40.0%) |
| Enterprise Management | 0 (0.0%) | 0 (0.0%) |
| Administrative & Support | 899 (71.8%) | 353 (28.2%) |
| Educational Services | 294 (28.3%) | 745 (71.7%) |
| Health Care & Social Assistance | 587 (20.1%) | 2,341 (79.9%) |
| Arts, Entertainment & Recreation | 110 (100.0%) | 0 (0.0%) |
| Accommodation & Food Services | 702 (49.6%) | 712 (50.3%) |
| Public Administration | 185 (29.5%) | 443 (70.5%) |
| Total | 8,899 (49.9%) | 8,926 (50.1%) |
Education in Norristown borough
School Enrollment in Norristown borough
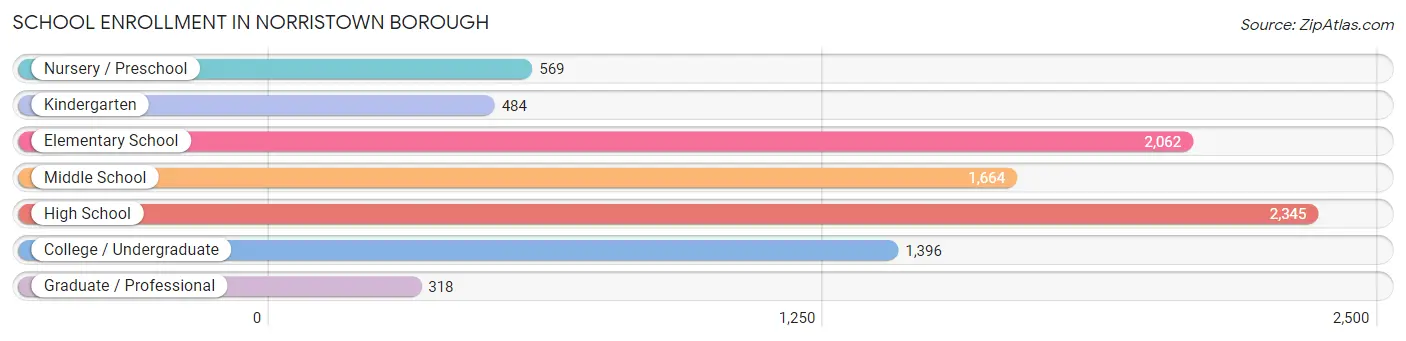
The most common levels of schooling among the 8,838 students in Norristown borough are high school (2,345 | 26.5%), elementary school (2,062 | 23.3%), and middle school (1,664 | 18.8%).
| School Level | # Students | % Students |
| Nursery / Preschool | 569 | 6.4% |
| Kindergarten | 484 | 5.5% |
| Elementary School | 2,062 | 23.3% |
| Middle School | 1,664 | 18.8% |
| High School | 2,345 | 26.5% |
| College / Undergraduate | 1,396 | 15.8% |
| Graduate / Professional | 318 | 3.6% |
| Total | 8,838 | 100.0% |
School Enrollment by Age by Funding Source in Norristown borough
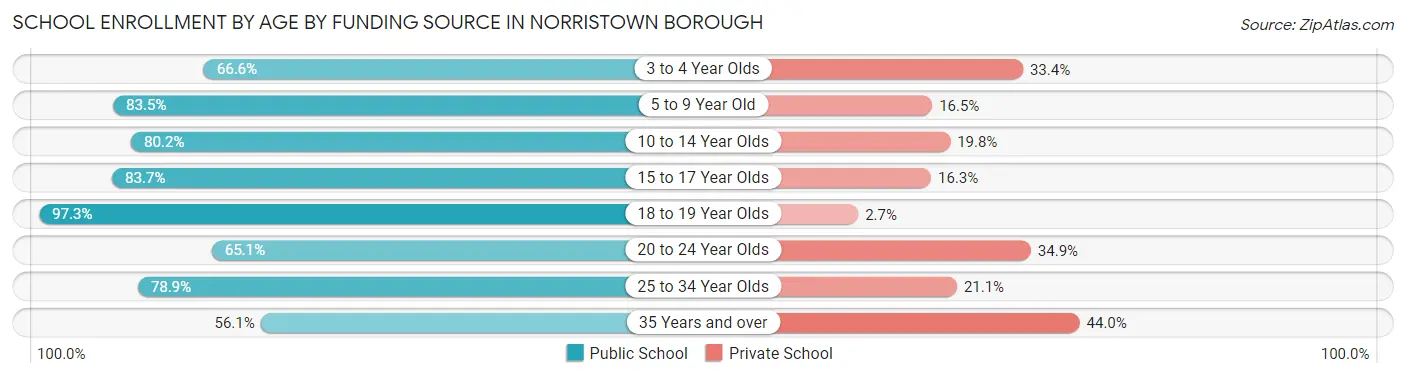
Out of a total of 8,838 students who are enrolled in schools in Norristown borough, 1,776 (20.1%) attend a private institution, while the remaining 7,062 (79.9%) are enrolled in public schools. The age group of 35 years and over has the highest likelihood of being enrolled in private schools, with 189 (44.0% in the age bracket) enrolled. Conversely, the age group of 18 to 19 year olds has the lowest likelihood of being enrolled in a private school, with 610 (97.3% in the age bracket) attending a public institution.
| Age Bracket | Public School | Private School |
| 3 to 4 Year Olds | 347 (66.6%) | 174 (33.4%) |
| 5 to 9 Year Old | 1,975 (83.5%) | 390 (16.5%) |
| 10 to 14 Year Olds | 1,745 (80.2%) | 432 (19.8%) |
| 15 to 17 Year Olds | 1,423 (83.7%) | 277 (16.3%) |
| 18 to 19 Year Olds | 610 (97.3%) | 17 (2.7%) |
| 20 to 24 Year Olds | 379 (65.1%) | 203 (34.9%) |
| 25 to 34 Year Olds | 344 (78.9%) | 92 (21.1%) |
| 35 Years and over | 241 (56.0%) | 189 (44.0%) |
| Total | 7,062 (79.9%) | 1,776 (20.1%) |
Educational Attainment by Field of Study in Norristown borough
Business (980 | 17.9%), education (747 | 13.7%), science & technology (449 | 8.2%), arts & humanities (394 | 7.2%), and bio, nature & agricultural (393 | 7.2%) are the most common fields of study among 5,471 individuals in Norristown borough who have obtained a bachelor's degree or higher.
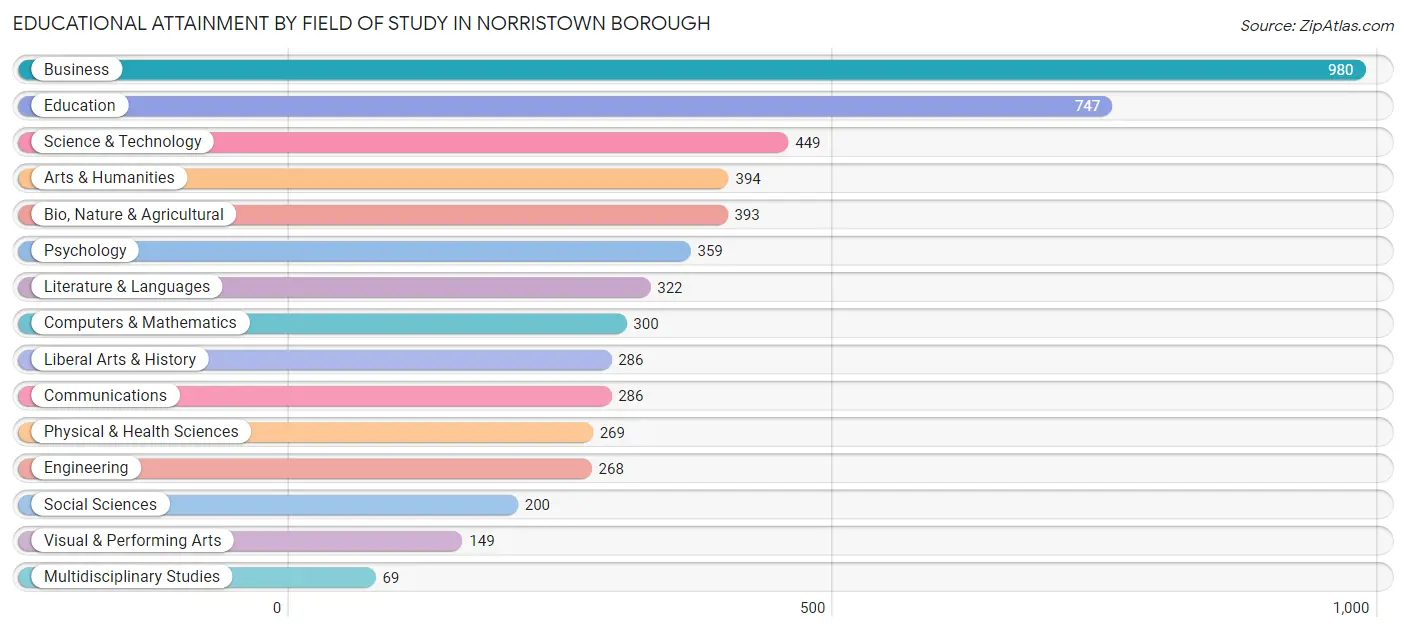
| Field of Study | # Graduates | % Graduates |
| Computers & Mathematics | 300 | 5.5% |
| Bio, Nature & Agricultural | 393 | 7.2% |
| Physical & Health Sciences | 269 | 4.9% |
| Psychology | 359 | 6.6% |
| Social Sciences | 200 | 3.7% |
| Engineering | 268 | 4.9% |
| Multidisciplinary Studies | 69 | 1.3% |
| Science & Technology | 449 | 8.2% |
| Business | 980 | 17.9% |
| Education | 747 | 13.7% |
| Literature & Languages | 322 | 5.9% |
| Liberal Arts & History | 286 | 5.2% |
| Visual & Performing Arts | 149 | 2.7% |
| Communications | 286 | 5.2% |
| Arts & Humanities | 394 | 7.2% |
| Total | 5,471 | 100.0% |
Transportation & Commute in Norristown borough
Vehicle Availability by Sex in Norristown borough
The most prevalent vehicle ownership categories in Norristown borough are males with 2 vehicles (3,424, accounting for 39.4%) and females with 2 vehicles (3,331, making up 39.7%).
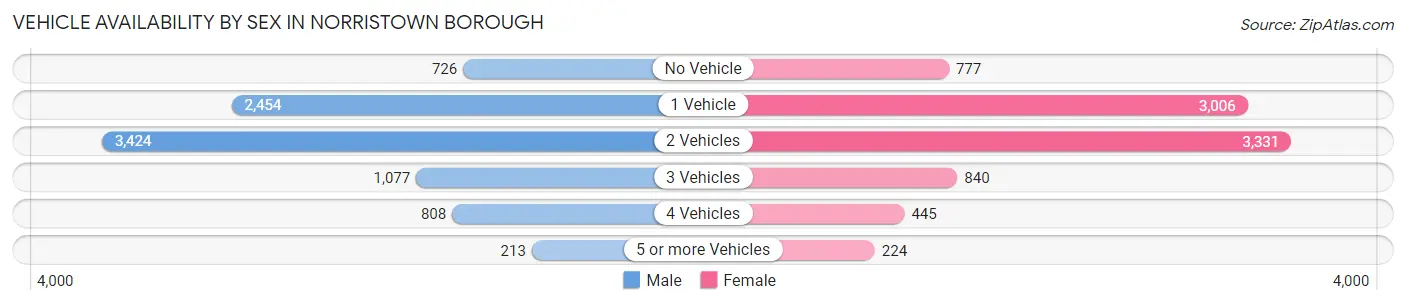
| Vehicles Available | Male | Female |
| No Vehicle | 726 (8.3%) | 777 (9.0%) |
| 1 Vehicle | 2,454 (28.2%) | 3,006 (34.9%) |
| 2 Vehicles | 3,424 (39.4%) | 3,331 (38.6%) |
| 3 Vehicles | 1,077 (12.4%) | 840 (9.7%) |
| 4 Vehicles | 808 (9.3%) | 445 (5.2%) |
| 5 or more Vehicles | 213 (2.5%) | 224 (2.6%) |
| Total | 8,702 (100.0%) | 8,623 (100.0%) |
Commute Time in Norristown borough
The most frequently occuring commute durations in Norristown borough are 30 to 34 minutes (2,996 commuters, 18.8%), 20 to 24 minutes (2,769 commuters, 17.4%), and 15 to 19 minutes (2,289 commuters, 14.4%).
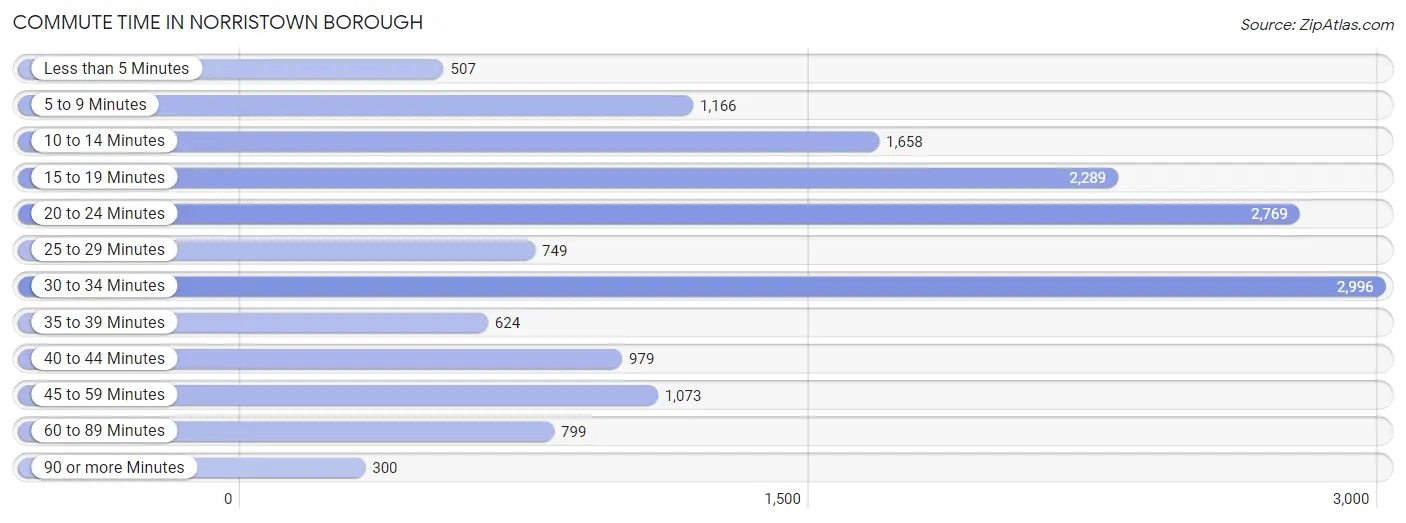
| Commute Time | # Commuters | % Commuters |
| Less than 5 Minutes | 507 | 3.2% |
| 5 to 9 Minutes | 1,166 | 7.3% |
| 10 to 14 Minutes | 1,658 | 10.4% |
| 15 to 19 Minutes | 2,289 | 14.4% |
| 20 to 24 Minutes | 2,769 | 17.4% |
| 25 to 29 Minutes | 749 | 4.7% |
| 30 to 34 Minutes | 2,996 | 18.8% |
| 35 to 39 Minutes | 624 | 3.9% |
| 40 to 44 Minutes | 979 | 6.1% |
| 45 to 59 Minutes | 1,073 | 6.7% |
| 60 to 89 Minutes | 799 | 5.0% |
| 90 or more Minutes | 300 | 1.9% |
Commute Time by Sex in Norristown borough
The most common commute times in Norristown borough are 30 to 34 minutes (1,649 commuters, 20.2%) for males and 15 to 19 minutes (1,462 commuters, 18.9%) for females.
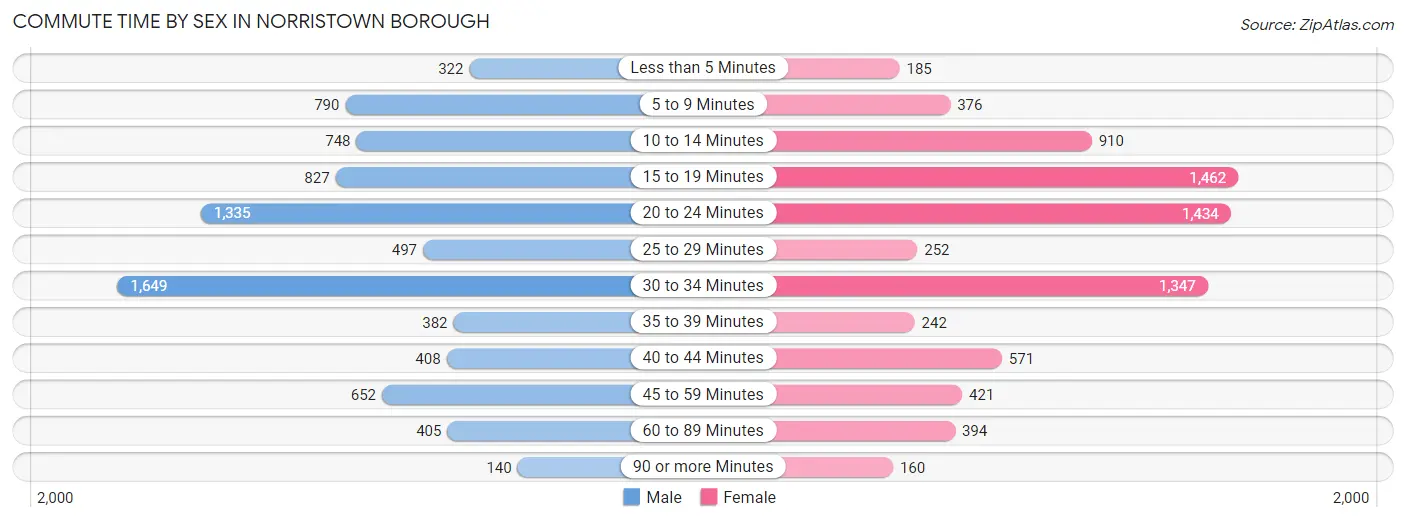
| Commute Time | Male | Female |
| Less than 5 Minutes | 322 (4.0%) | 185 (2.4%) |
| 5 to 9 Minutes | 790 (9.7%) | 376 (4.9%) |
| 10 to 14 Minutes | 748 (9.2%) | 910 (11.7%) |
| 15 to 19 Minutes | 827 (10.1%) | 1,462 (18.9%) |
| 20 to 24 Minutes | 1,335 (16.4%) | 1,434 (18.5%) |
| 25 to 29 Minutes | 497 (6.1%) | 252 (3.3%) |
| 30 to 34 Minutes | 1,649 (20.2%) | 1,347 (17.4%) |
| 35 to 39 Minutes | 382 (4.7%) | 242 (3.1%) |
| 40 to 44 Minutes | 408 (5.0%) | 571 (7.4%) |
| 45 to 59 Minutes | 652 (8.0%) | 421 (5.4%) |
| 60 to 89 Minutes | 405 (5.0%) | 394 (5.1%) |
| 90 or more Minutes | 140 (1.7%) | 160 (2.1%) |
Time of Departure to Work by Sex in Norristown borough
The most frequent times of departure to work in Norristown borough are 7:00 AM to 7:29 AM (1,236, 15.2%) for males and 8:00 AM to 8:29 AM (1,077, 13.9%) for females.
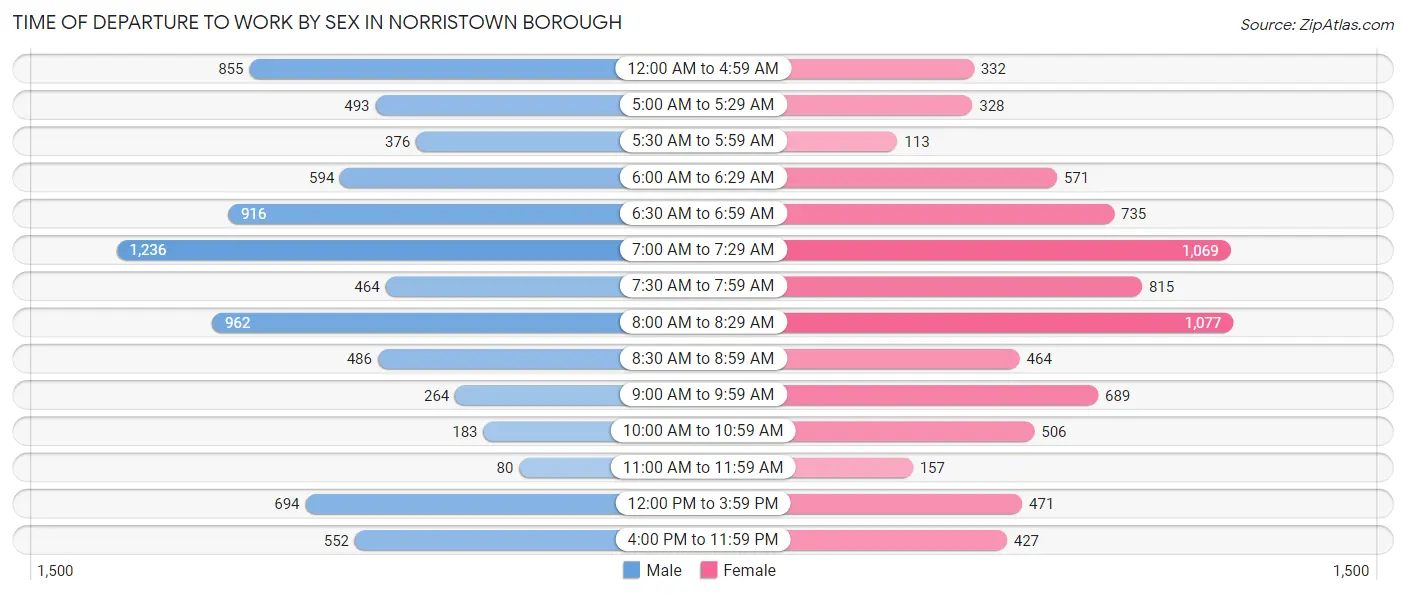
| Time of Departure | Male | Female |
| 12:00 AM to 4:59 AM | 855 (10.5%) | 332 (4.3%) |
| 5:00 AM to 5:29 AM | 493 (6.0%) | 328 (4.2%) |
| 5:30 AM to 5:59 AM | 376 (4.6%) | 113 (1.5%) |
| 6:00 AM to 6:29 AM | 594 (7.3%) | 571 (7.4%) |
| 6:30 AM to 6:59 AM | 916 (11.2%) | 735 (9.5%) |
| 7:00 AM to 7:29 AM | 1,236 (15.2%) | 1,069 (13.8%) |
| 7:30 AM to 7:59 AM | 464 (5.7%) | 815 (10.5%) |
| 8:00 AM to 8:29 AM | 962 (11.8%) | 1,077 (13.9%) |
| 8:30 AM to 8:59 AM | 486 (6.0%) | 464 (6.0%) |
| 9:00 AM to 9:59 AM | 264 (3.2%) | 689 (8.9%) |
| 10:00 AM to 10:59 AM | 183 (2.2%) | 506 (6.5%) |
| 11:00 AM to 11:59 AM | 80 (1.0%) | 157 (2.0%) |
| 12:00 PM to 3:59 PM | 694 (8.5%) | 471 (6.1%) |
| 4:00 PM to 11:59 PM | 552 (6.8%) | 427 (5.5%) |
| Total | 8,155 (100.0%) | 7,754 (100.0%) |
Housing Occupancy in Norristown borough
Occupancy by Ownership in Norristown borough
Of the total 12,918 dwellings in Norristown borough, owner-occupied units account for 5,021 (38.9%), while renter-occupied units make up 7,897 (61.1%).
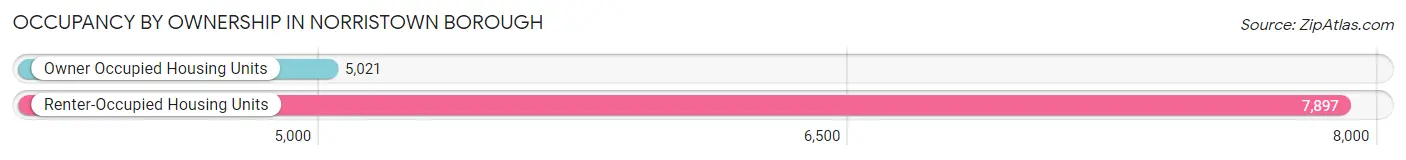
| Occupancy | # Housing Units | % Housing Units |
| Owner Occupied Housing Units | 5,021 | 38.9% |
| Renter-Occupied Housing Units | 7,897 | 61.1% |
| Total Occupied Housing Units | 12,918 | 100.0% |
Occupancy by Household Size in Norristown borough
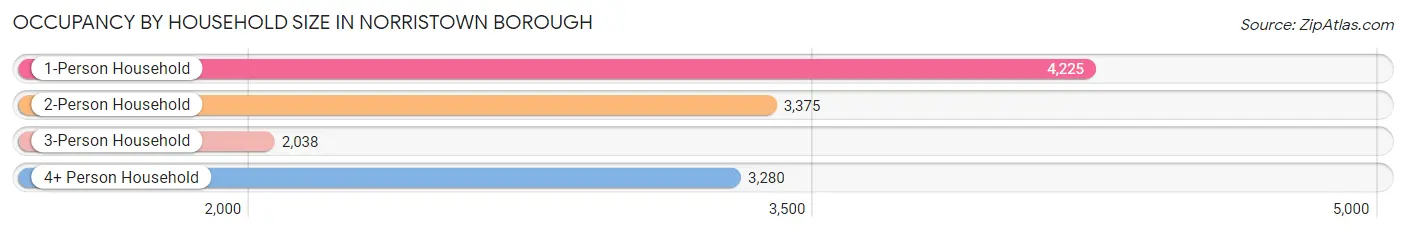
| Household Size | # Housing Units | % Housing Units |
| 1-Person Household | 4,225 | 32.7% |
| 2-Person Household | 3,375 | 26.1% |
| 3-Person Household | 2,038 | 15.8% |
| 4+ Person Household | 3,280 | 25.4% |
| Total Housing Units | 12,918 | 100.0% |
Occupancy by Ownership by Household Size in Norristown borough
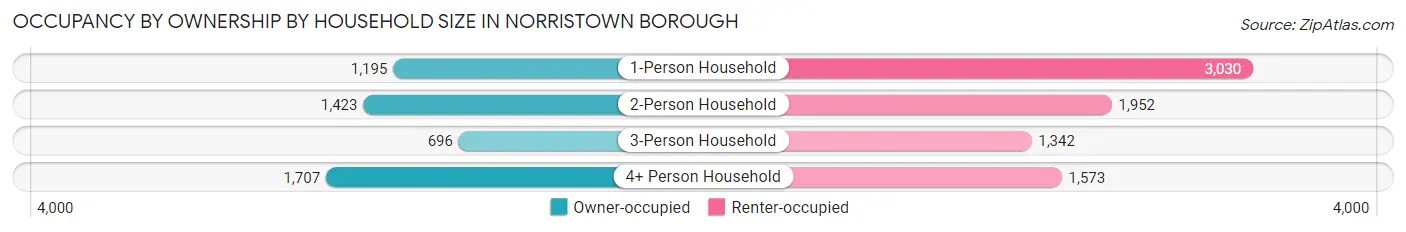
| Household Size | Owner-occupied | Renter-occupied |
| 1-Person Household | 1,195 (28.3%) | 3,030 (71.7%) |
| 2-Person Household | 1,423 (42.2%) | 1,952 (57.8%) |
| 3-Person Household | 696 (34.2%) | 1,342 (65.8%) |
| 4+ Person Household | 1,707 (52.0%) | 1,573 (48.0%) |
| Total Housing Units | 5,021 (38.9%) | 7,897 (61.1%) |
Occupancy by Educational Attainment in Norristown borough
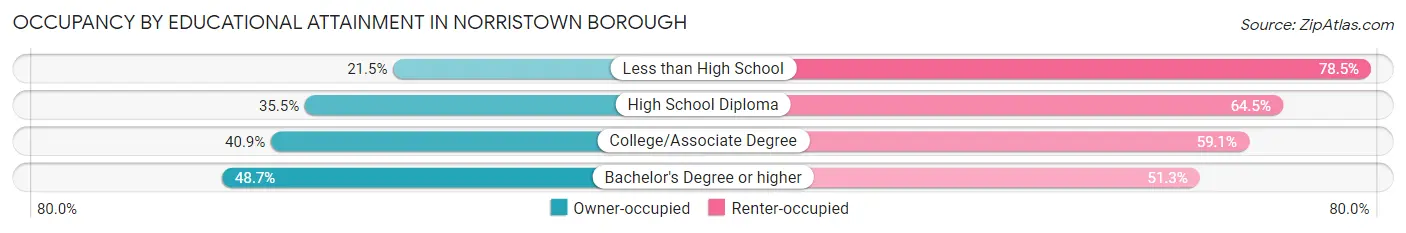
| Household Size | Owner-occupied | Renter-occupied |
| Less than High School | 352 (21.5%) | 1,283 (78.5%) |
| High School Diploma | 1,399 (35.5%) | 2,540 (64.5%) |
| College/Associate Degree | 1,606 (40.9%) | 2,321 (59.1%) |
| Bachelor's Degree or higher | 1,664 (48.7%) | 1,753 (51.3%) |
Occupancy by Age of Householder in Norristown borough
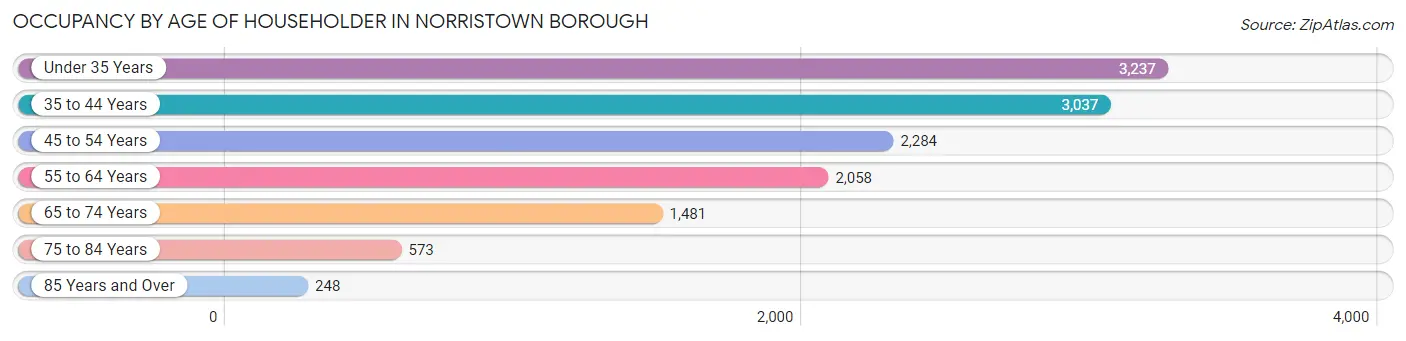
| Age Bracket | # Households | % Households |
| Under 35 Years | 3,237 | 25.1% |
| 35 to 44 Years | 3,037 | 23.5% |
| 45 to 54 Years | 2,284 | 17.7% |
| 55 to 64 Years | 2,058 | 15.9% |
| 65 to 74 Years | 1,481 | 11.5% |
| 75 to 84 Years | 573 | 4.4% |
| 85 Years and Over | 248 | 1.9% |
| Total | 12,918 | 100.0% |
Housing Finances in Norristown borough
Median Income by Occupancy in Norristown borough
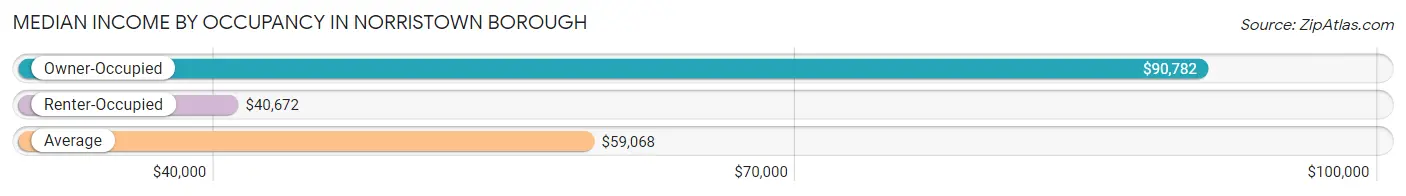
| Occupancy Type | # Households | Median Income |
| Owner-Occupied | 5,021 (38.9%) | $90,782 |
| Renter-Occupied | 7,897 (61.1%) | $40,672 |
| Average | 12,918 (100.0%) | $59,068 |
Occupancy by Householder Income Bracket in Norristown borough
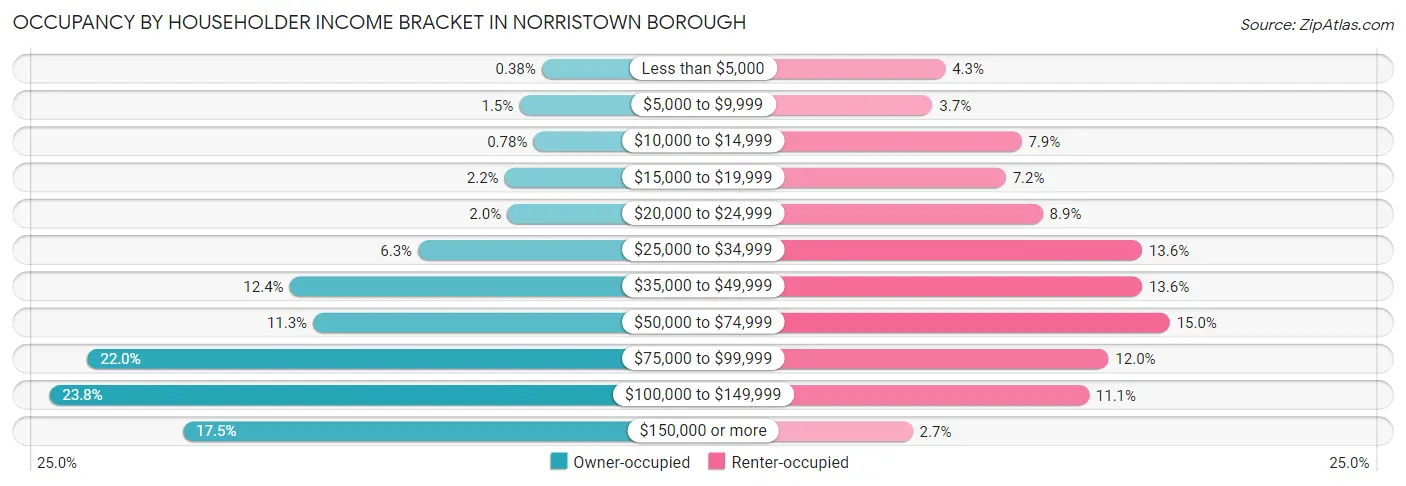
| Income Bracket | Owner-occupied | Renter-occupied |
| Less than $5,000 | 19 (0.4%) | 337 (4.3%) |
| $5,000 to $9,999 | 73 (1.5%) | 289 (3.7%) |
| $10,000 to $14,999 | 39 (0.8%) | 624 (7.9%) |
| $15,000 to $19,999 | 108 (2.1%) | 565 (7.1%) |
| $20,000 to $24,999 | 102 (2.0%) | 704 (8.9%) |
| $25,000 to $34,999 | 315 (6.3%) | 1,077 (13.6%) |
| $35,000 to $49,999 | 622 (12.4%) | 1,077 (13.6%) |
| $50,000 to $74,999 | 566 (11.3%) | 1,181 (15.0%) |
| $75,000 to $99,999 | 1,105 (22.0%) | 951 (12.0%) |
| $100,000 to $149,999 | 1,196 (23.8%) | 877 (11.1%) |
| $150,000 or more | 876 (17.4%) | 215 (2.7%) |
| Total | 5,021 (100.0%) | 7,897 (100.0%) |
Monthly Housing Cost Tiers in Norristown borough
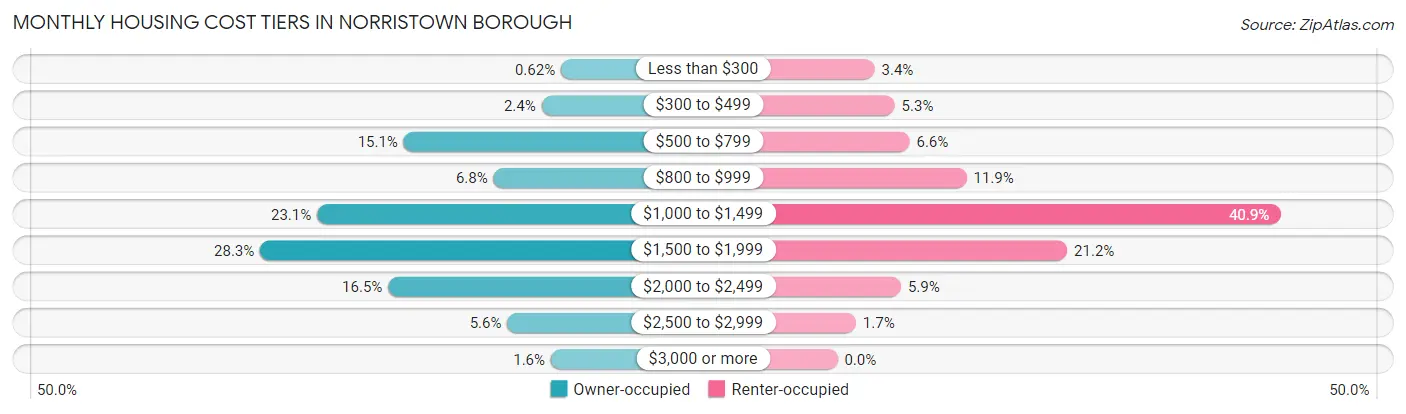
| Monthly Cost | Owner-occupied | Renter-occupied |
| Less than $300 | 31 (0.6%) | 270 (3.4%) |
| $300 to $499 | 121 (2.4%) | 416 (5.3%) |
| $500 to $799 | 758 (15.1%) | 524 (6.6%) |
| $800 to $999 | 343 (6.8%) | 939 (11.9%) |
| $1,000 to $1,499 | 1,159 (23.1%) | 3,226 (40.8%) |
| $1,500 to $1,999 | 1,422 (28.3%) | 1,670 (21.1%) |
| $2,000 to $2,499 | 830 (16.5%) | 462 (5.9%) |
| $2,500 to $2,999 | 279 (5.6%) | 134 (1.7%) |
| $3,000 or more | 78 (1.5%) | 0 (0.0%) |
| Total | 5,021 (100.0%) | 7,897 (100.0%) |
Physical Housing Characteristics in Norristown borough
Housing Structures in Norristown borough
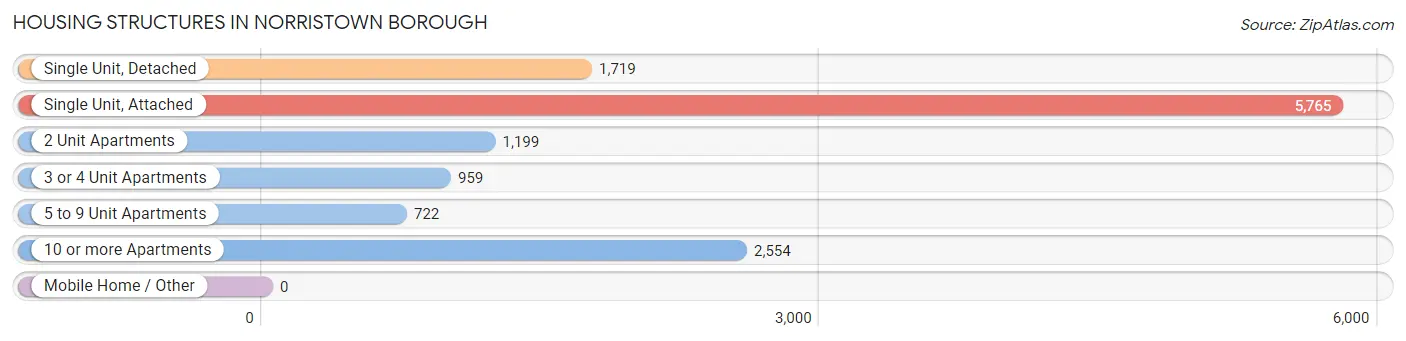
| Structure Type | # Housing Units | % Housing Units |
| Single Unit, Detached | 1,719 | 13.3% |
| Single Unit, Attached | 5,765 | 44.6% |
| 2 Unit Apartments | 1,199 | 9.3% |
| 3 or 4 Unit Apartments | 959 | 7.4% |
| 5 to 9 Unit Apartments | 722 | 5.6% |
| 10 or more Apartments | 2,554 | 19.8% |
| Mobile Home / Other | 0 | 0.0% |
| Total | 12,918 | 100.0% |
Housing Structures by Occupancy in Norristown borough
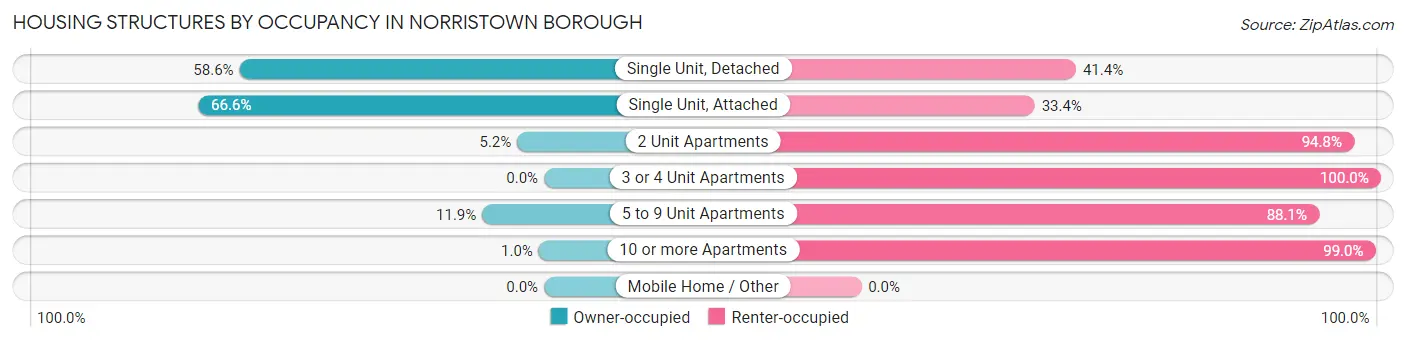
| Structure Type | Owner-occupied | Renter-occupied |
| Single Unit, Detached | 1,008 (58.6%) | 711 (41.4%) |
| Single Unit, Attached | 3,839 (66.6%) | 1,926 (33.4%) |
| 2 Unit Apartments | 62 (5.2%) | 1,137 (94.8%) |
| 3 or 4 Unit Apartments | 0 (0.0%) | 959 (100.0%) |
| 5 to 9 Unit Apartments | 86 (11.9%) | 636 (88.1%) |
| 10 or more Apartments | 26 (1.0%) | 2,528 (99.0%) |
| Mobile Home / Other | 0 (0.0%) | 0 (0.0%) |
| Total | 5,021 (38.9%) | 7,897 (61.1%) |
Housing Structures by Number of Rooms in Norristown borough
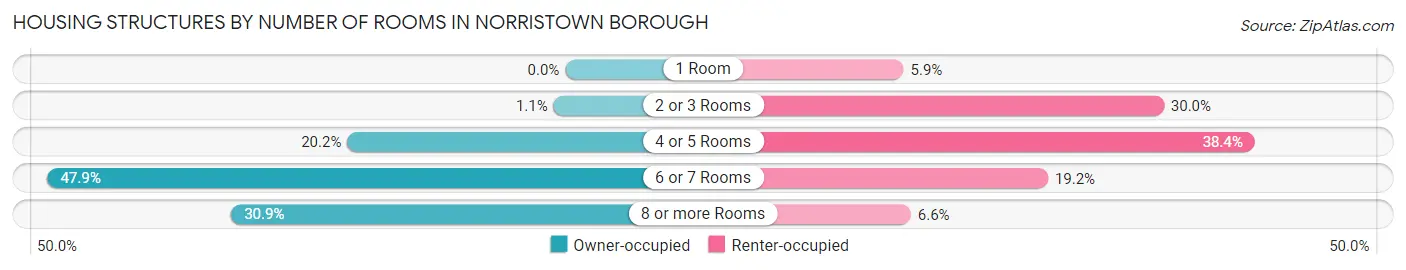
| Number of Rooms | Owner-occupied | Renter-occupied |
| 1 Room | 0 (0.0%) | 465 (5.9%) |
| 2 or 3 Rooms | 54 (1.1%) | 2,366 (30.0%) |
| 4 or 5 Rooms | 1,012 (20.2%) | 3,029 (38.4%) |
| 6 or 7 Rooms | 2,404 (47.9%) | 1,519 (19.2%) |
| 8 or more Rooms | 1,551 (30.9%) | 518 (6.6%) |
| Total | 5,021 (100.0%) | 7,897 (100.0%) |
Housing Structure by Heating Type in Norristown borough
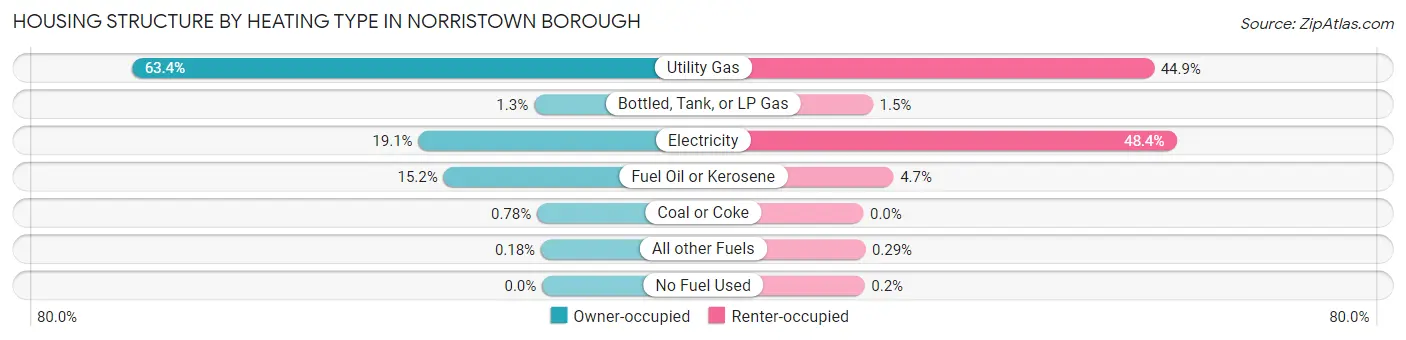
| Heating Type | Owner-occupied | Renter-occupied |
| Utility Gas | 3,185 (63.4%) | 3,548 (44.9%) |
| Bottled, Tank, or LP Gas | 63 (1.3%) | 117 (1.5%) |
| Electricity | 960 (19.1%) | 3,824 (48.4%) |
| Fuel Oil or Kerosene | 765 (15.2%) | 369 (4.7%) |
| Coal or Coke | 39 (0.8%) | 0 (0.0%) |
| All other Fuels | 9 (0.2%) | 23 (0.3%) |
| No Fuel Used | 0 (0.0%) | 16 (0.2%) |
| Total | 5,021 (100.0%) | 7,897 (100.0%) |
Household Vehicle Usage in Norristown borough
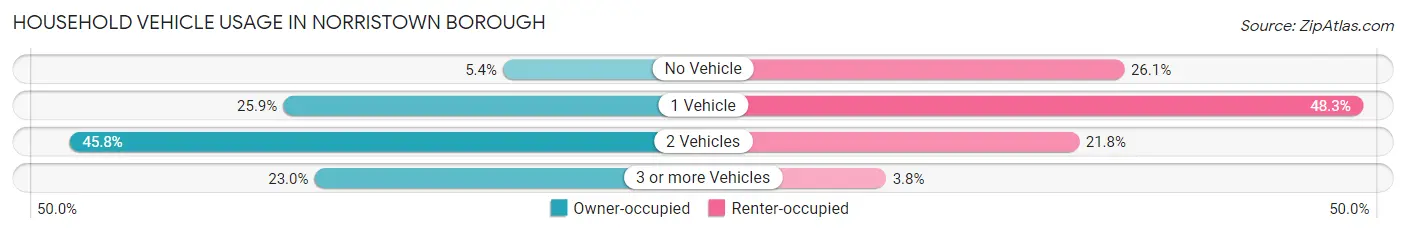
| Vehicles per Household | Owner-occupied | Renter-occupied |
| No Vehicle | 269 (5.4%) | 2,057 (26.1%) |
| 1 Vehicle | 1,299 (25.9%) | 3,815 (48.3%) |
| 2 Vehicles | 2,300 (45.8%) | 1,724 (21.8%) |
| 3 or more Vehicles | 1,153 (23.0%) | 301 (3.8%) |
| Total | 5,021 (100.0%) | 7,897 (100.0%) |
Real Estate & Mortgages in Norristown borough
Real Estate and Mortgage Overview in Norristown borough
| Characteristic | Without Mortgage | With Mortgage |
| Housing Units | 1,272 | 3,749 |
| Median Property Value | $176,300 | $192,100 |
| Median Household Income | $65,441 | $686 |
| Monthly Housing Costs | $735 | $78 |
| Real Estate Taxes | $4,238 | $39 |
Property Value by Mortgage Status in Norristown borough
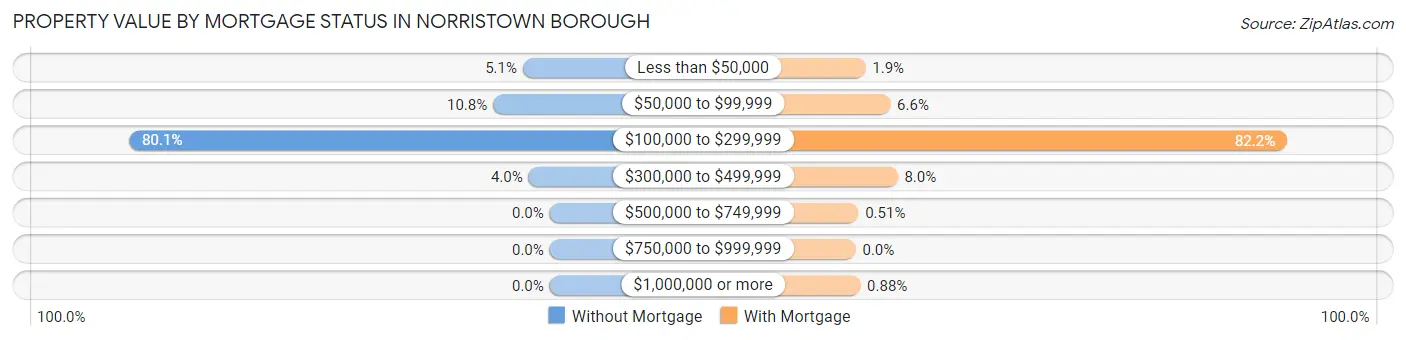
| Property Value | Without Mortgage | With Mortgage |
| Less than $50,000 | 65 (5.1%) | 70 (1.9%) |
| $50,000 to $99,999 | 137 (10.8%) | 247 (6.6%) |
| $100,000 to $299,999 | 1,019 (80.1%) | 3,081 (82.2%) |
| $300,000 to $499,999 | 51 (4.0%) | 299 (8.0%) |
| $500,000 to $749,999 | 0 (0.0%) | 19 (0.5%) |
| $750,000 to $999,999 | 0 (0.0%) | 0 (0.0%) |
| $1,000,000 or more | 0 (0.0%) | 33 (0.9%) |
| Total | 1,272 (100.0%) | 3,749 (100.0%) |
Household Income by Mortgage Status in Norristown borough
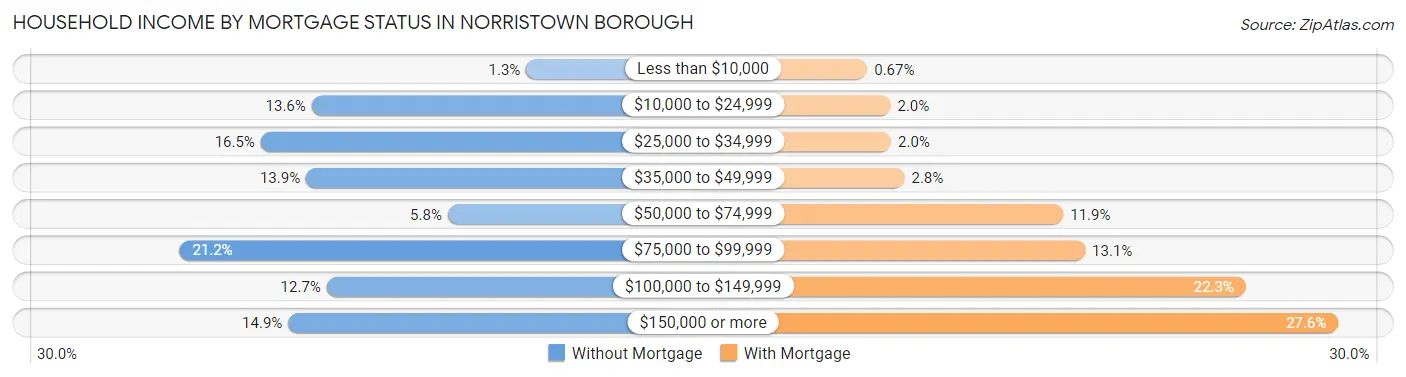
| Household Income | Without Mortgage | With Mortgage |
| Less than $10,000 | 17 (1.3%) | 25 (0.7%) |
| $10,000 to $24,999 | 173 (13.6%) | 75 (2.0%) |
| $25,000 to $34,999 | 210 (16.5%) | 76 (2.0%) |
| $35,000 to $49,999 | 177 (13.9%) | 105 (2.8%) |
| $50,000 to $74,999 | 74 (5.8%) | 445 (11.9%) |
| $75,000 to $99,999 | 269 (21.1%) | 492 (13.1%) |
| $100,000 to $149,999 | 162 (12.7%) | 836 (22.3%) |
| $150,000 or more | 190 (14.9%) | 1,034 (27.6%) |
| Total | 1,272 (100.0%) | 3,749 (100.0%) |
Property Value to Household Income Ratio in Norristown borough
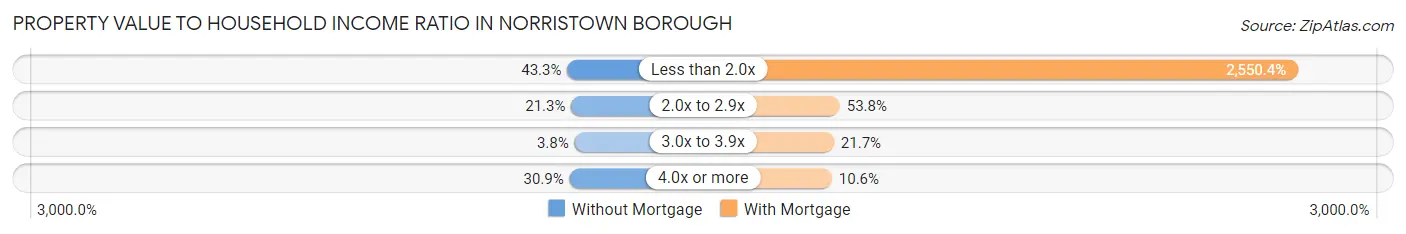
| Value-to-Income Ratio | Without Mortgage | With Mortgage |
| Less than 2.0x | 551 (43.3%) | 95,613 (2,550.4%) |
| 2.0x to 2.9x | 271 (21.3%) | 2,016 (53.8%) |
| 3.0x to 3.9x | 48 (3.8%) | 813 (21.7%) |
| 4.0x or more | 393 (30.9%) | 398 (10.6%) |
| Total | 1,272 (100.0%) | 3,749 (100.0%) |
Real Estate Taxes by Mortgage Status in Norristown borough
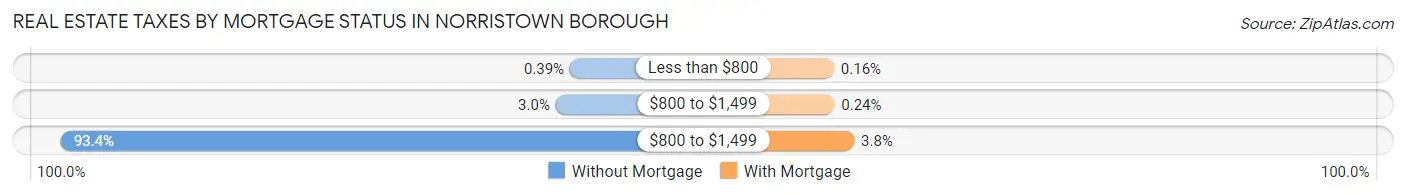
| Property Taxes | Without Mortgage | With Mortgage |
| Less than $800 | 5 (0.4%) | 6 (0.2%) |
| $800 to $1,499 | 38 (3.0%) | 9 (0.2%) |
| $800 to $1,499 | 1,188 (93.4%) | 144 (3.8%) |
| Total | 1,272 (100.0%) | 3,749 (100.0%) |
Health & Disability in Norristown borough
Health Insurance Coverage by Age in Norristown borough
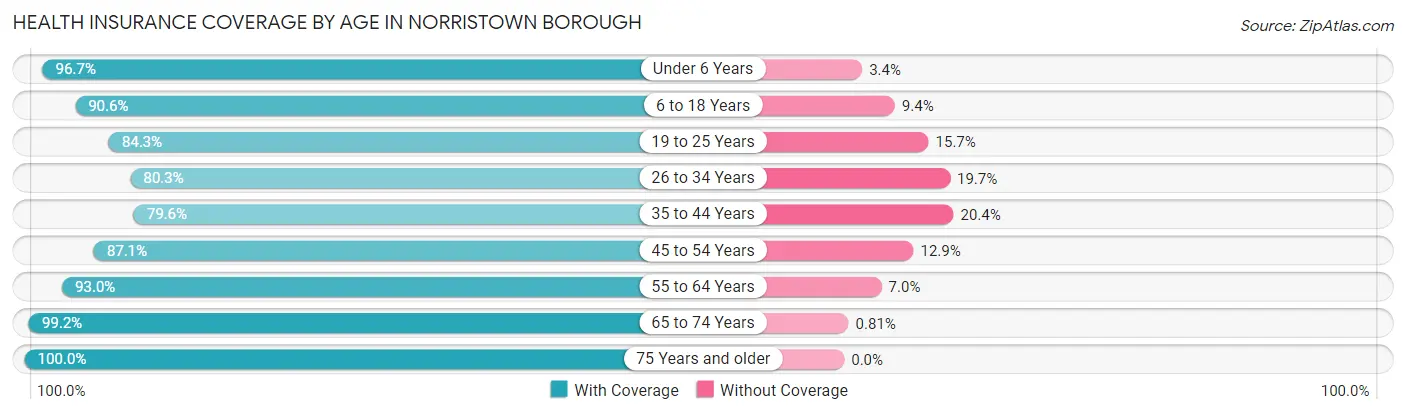
| Age Bracket | With Coverage | Without Coverage |
| Under 6 Years | 3,286 (96.7%) | 114 (3.4%) |
| 6 to 18 Years | 6,054 (90.6%) | 631 (9.4%) |
| 19 to 25 Years | 3,173 (84.3%) | 592 (15.7%) |
| 26 to 34 Years | 4,250 (80.3%) | 1,044 (19.7%) |
| 35 to 44 Years | 4,264 (79.6%) | 1,091 (20.4%) |
| 45 to 54 Years | 3,518 (87.1%) | 522 (12.9%) |
| 55 to 64 Years | 3,326 (93.0%) | 249 (7.0%) |
| 65 to 74 Years | 2,074 (99.2%) | 17 (0.8%) |
| 75 Years and older | 1,215 (100.0%) | 0 (0.0%) |
| Total | 31,160 (88.0%) | 4,260 (12.0%) |
Health Insurance Coverage by Citizenship Status in Norristown borough
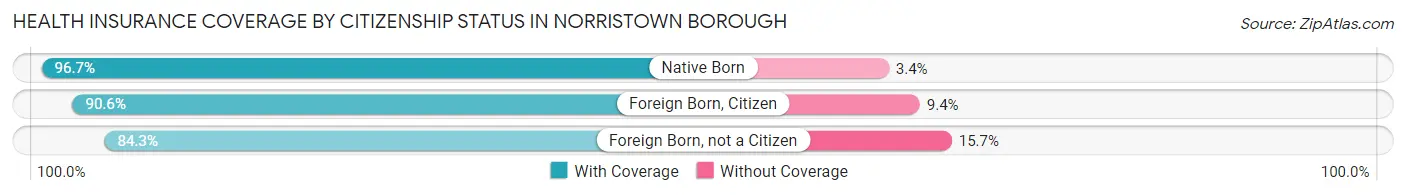
| Citizenship Status | With Coverage | Without Coverage |
| Native Born | 3,286 (96.7%) | 114 (3.4%) |
| Foreign Born, Citizen | 6,054 (90.6%) | 631 (9.4%) |
| Foreign Born, not a Citizen | 3,173 (84.3%) | 592 (15.7%) |
Health Insurance Coverage by Household Income in Norristown borough
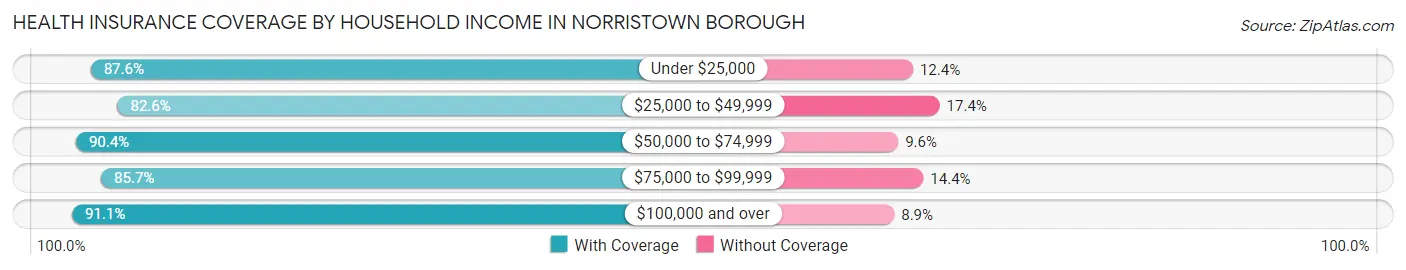
| Household Income | With Coverage | Without Coverage |
| Under $25,000 | 4,931 (87.6%) | 698 (12.4%) |
| $25,000 to $49,999 | 5,938 (82.6%) | 1,251 (17.4%) |
| $50,000 to $74,999 | 4,626 (90.4%) | 493 (9.6%) |
| $75,000 to $99,999 | 4,961 (85.7%) | 831 (14.3%) |
| $100,000 and over | 10,093 (91.1%) | 986 (8.9%) |
Public vs Private Health Insurance Coverage by Age in Norristown borough
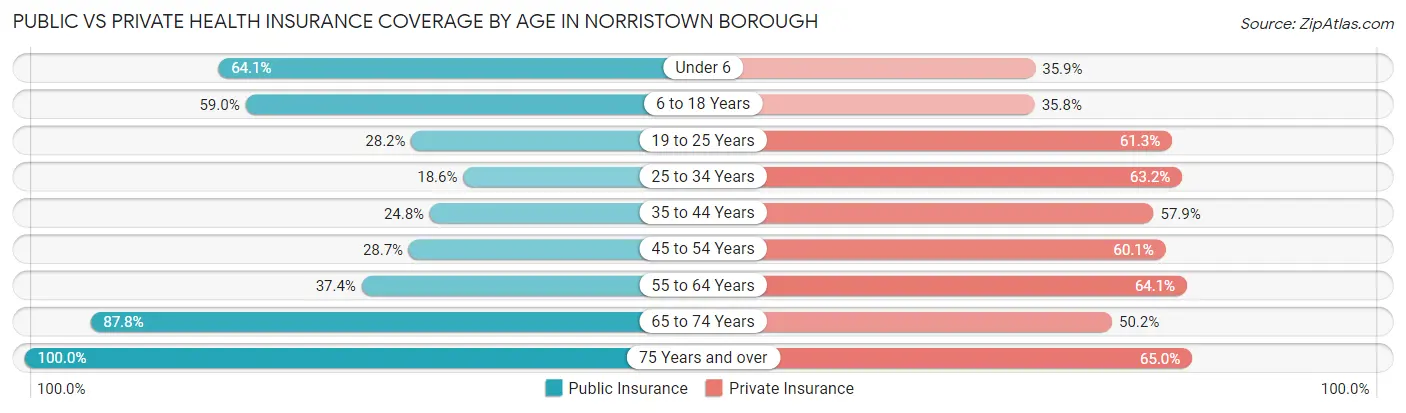
| Age Bracket | Public Insurance | Private Insurance |
| Under 6 | 2,178 (64.1%) | 1,221 (35.9%) |
| 6 to 18 Years | 3,944 (59.0%) | 2,394 (35.8%) |
| 19 to 25 Years | 1,062 (28.2%) | 2,308 (61.3%) |
| 25 to 34 Years | 983 (18.6%) | 3,344 (63.2%) |
| 35 to 44 Years | 1,326 (24.8%) | 3,099 (57.9%) |
| 45 to 54 Years | 1,158 (28.7%) | 2,428 (60.1%) |
| 55 to 64 Years | 1,338 (37.4%) | 2,290 (64.1%) |
| 65 to 74 Years | 1,836 (87.8%) | 1,049 (50.2%) |
| 75 Years and over | 1,215 (100.0%) | 790 (65.0%) |
| Total | 15,040 (42.5%) | 18,923 (53.4%) |
Disability Status by Sex by Age in Norristown borough
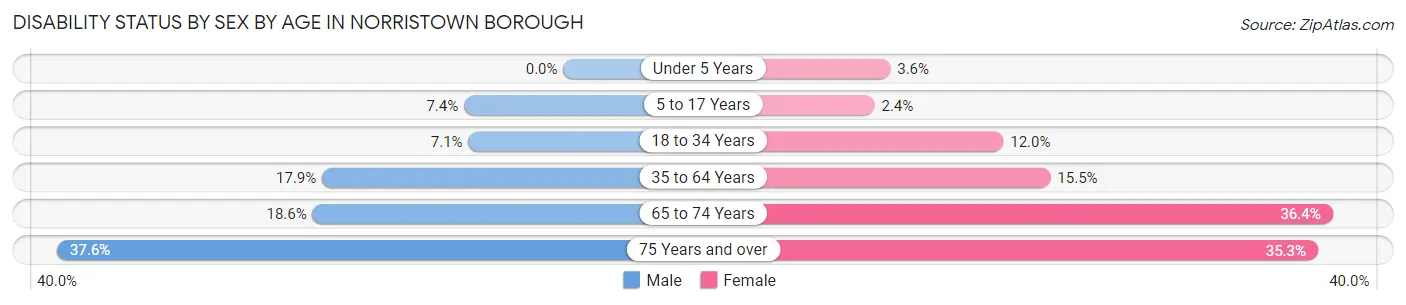
| Age Bracket | Male | Female |
| Under 5 Years | 0 (0.0%) | 43 (3.6%) |
| 5 to 17 Years | 239 (7.4%) | 78 (2.4%) |
| 18 to 34 Years | 373 (7.0%) | 537 (12.0%) |
| 35 to 64 Years | 1,103 (17.9%) | 1,055 (15.5%) |
| 65 to 74 Years | 165 (18.6%) | 439 (36.4%) |
| 75 Years and over | 144 (37.6%) | 294 (35.3%) |
Disability Class by Sex by Age in Norristown borough
Disability Class: Hearing Difficulty
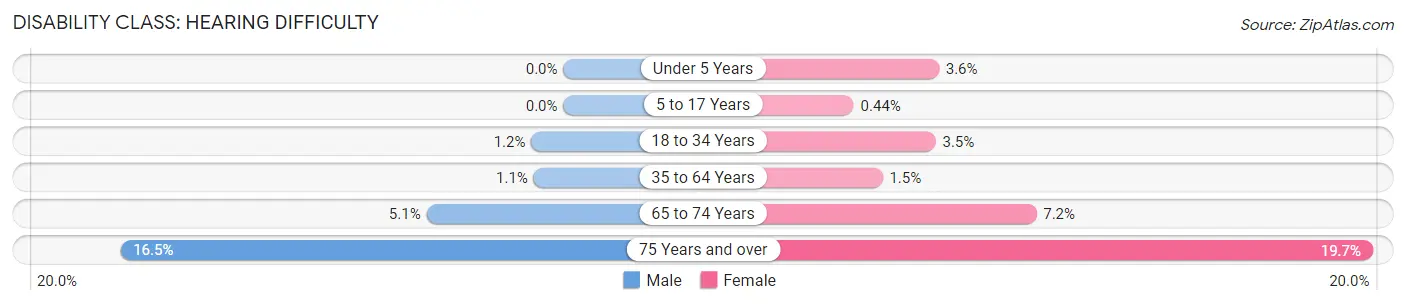
| Age Bracket | Male | Female |
| Under 5 Years | 0 (0.0%) | 43 (3.6%) |
| 5 to 17 Years | 0 (0.0%) | 14 (0.4%) |
| 18 to 34 Years | 63 (1.2%) | 156 (3.5%) |
| 35 to 64 Years | 68 (1.1%) | 103 (1.5%) |
| 65 to 74 Years | 45 (5.1%) | 87 (7.2%) |
| 75 Years and over | 63 (16.5%) | 164 (19.7%) |
Disability Class: Vision Difficulty
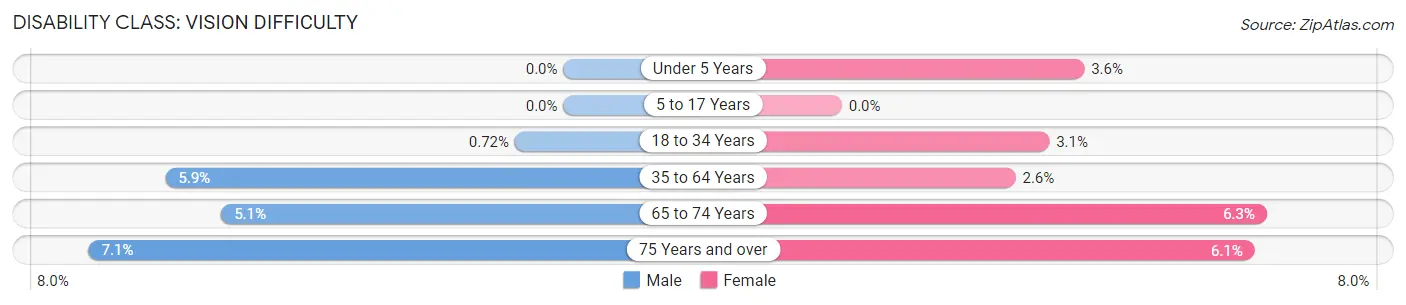
| Age Bracket | Male | Female |
| Under 5 Years | 0 (0.0%) | 43 (3.6%) |
| 5 to 17 Years | 0 (0.0%) | 0 (0.0%) |
| 18 to 34 Years | 38 (0.7%) | 138 (3.1%) |
| 35 to 64 Years | 364 (5.9%) | 176 (2.6%) |
| 65 to 74 Years | 45 (5.1%) | 76 (6.3%) |
| 75 Years and over | 27 (7.0%) | 51 (6.1%) |
Disability Class: Cognitive Difficulty
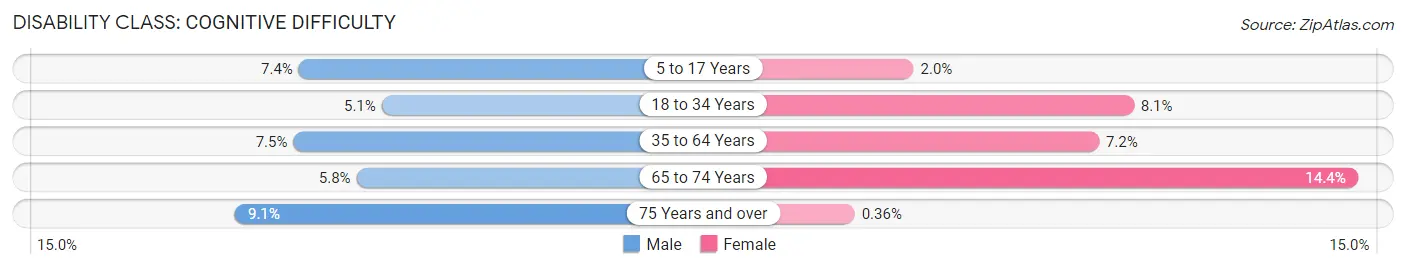
| Age Bracket | Male | Female |
| 5 to 17 Years | 239 (7.4%) | 64 (2.0%) |
| 18 to 34 Years | 268 (5.1%) | 364 (8.1%) |
| 35 to 64 Years | 463 (7.5%) | 488 (7.2%) |
| 65 to 74 Years | 51 (5.8%) | 173 (14.4%) |
| 75 Years and over | 35 (9.1%) | 3 (0.4%) |
Disability Class: Ambulatory Difficulty
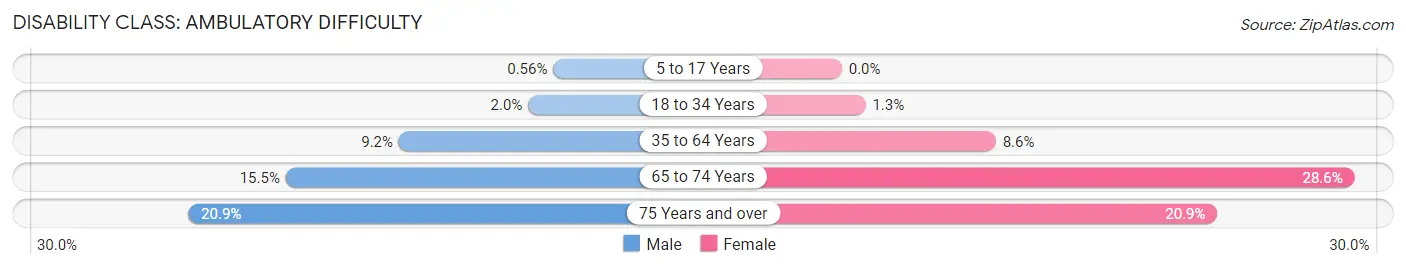
| Age Bracket | Male | Female |
| 5 to 17 Years | 18 (0.6%) | 0 (0.0%) |
| 18 to 34 Years | 104 (2.0%) | 59 (1.3%) |
| 35 to 64 Years | 564 (9.2%) | 584 (8.6%) |
| 65 to 74 Years | 137 (15.5%) | 344 (28.5%) |
| 75 Years and over | 80 (20.9%) | 174 (20.9%) |
Disability Class: Self-Care Difficulty
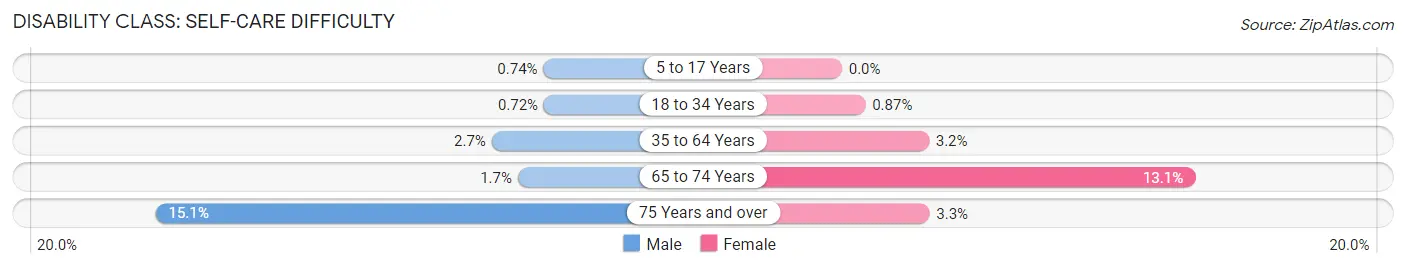
| Age Bracket | Male | Female |
| 5 to 17 Years | 24 (0.7%) | 0 (0.0%) |
| 18 to 34 Years | 38 (0.7%) | 39 (0.9%) |
| 35 to 64 Years | 164 (2.7%) | 220 (3.2%) |
| 65 to 74 Years | 15 (1.7%) | 158 (13.1%) |
| 75 Years and over | 58 (15.1%) | 27 (3.3%) |
Technology Access in Norristown borough
Computing Device Access in Norristown borough
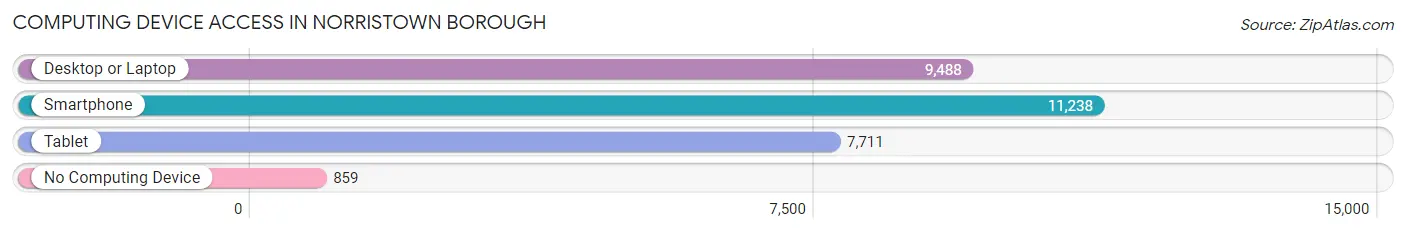
| Device Type | # Households | % Households |
| Desktop or Laptop | 9,488 | 73.5% |
| Smartphone | 11,238 | 87.0% |
| Tablet | 7,711 | 59.7% |
| No Computing Device | 859 | 6.7% |
| Total | 12,918 | 100.0% |
Internet Access in Norristown borough
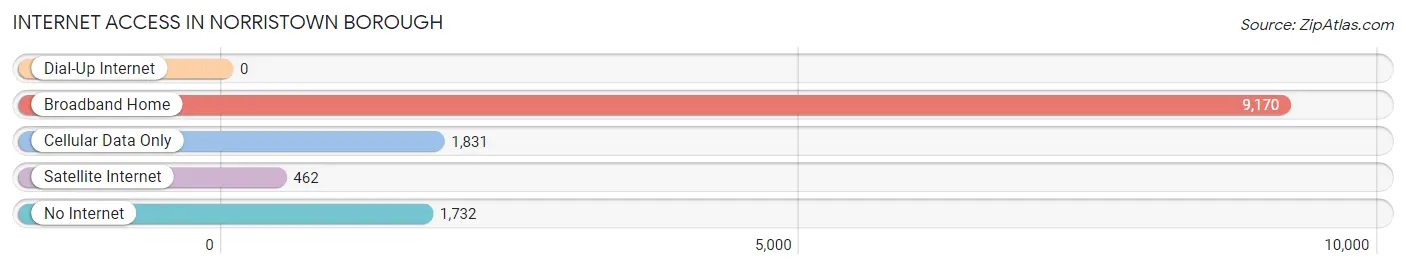
| Internet Type | # Households | % Households |
| Dial-Up Internet | 0 | 0.0% |
| Broadband Home | 9,170 | 71.0% |
| Cellular Data Only | 1,831 | 14.2% |
| Satellite Internet | 462 | 3.6% |
| No Internet | 1,732 | 13.4% |
| Total | 12,918 | 100.0% |
Norristown borough Summary
Norristown Borough is a borough located in Montgomery County, Pennsylvania, United States. The population was 34,324 at the 2010 census. It is the county seat of Montgomery County.
History
Norristown was founded in 1784 by Isaac Norris, a wealthy Quaker from Philadelphia. The town was named after Norris, who was the first to settle in the area. The town was incorporated in 1812 and became the county seat of Montgomery County in 1813.
Norristown was an important center of industry in the 19th century. It was home to several large factories, including the Norristown Iron Works, which produced iron products for the U.S. Navy during the Civil War. The town was also home to several large breweries, including the John F. Betz Brewery, which was the largest brewery in the United States at the time.
In the early 20th century, Norristown was a major center of the automobile industry, with several car manufacturers, including the Packard Motor Car Company, located in the town. The town was also home to several large department stores, including the John Wanamaker department store.
Geography
Norristown is located at 40°10′N 75°20′W (40.17, -75.33). According to the United States Census Bureau, the borough has a total area of 4.2 square miles (10.8 km2), all of it land.
Economy
Norristown is a major center of commerce and industry in Montgomery County. The town is home to several large employers, including the Montgomery County government, the Montgomery County Court of Common Pleas, the Montgomery County Correctional Facility, and the Montgomery County Public Schools.
The town is also home to several large retail stores, including the King of Prussia Mall, the Montgomery Mall, and the Valley Forge Shopping Center.
Demographics
As of the 2010 census, there were 34,324 people, 13,845 households, and 8,072 families residing in the borough. The population density was 8,093.3 people per square mile (3,122.2/km2). There were 14,845 housing units at an average density of 3,541.3 per square mile (1,366.2/km2). The racial makeup of the borough was 57.2% White, 33.3% African American, 0.2% Native American, 2.3% Asian, 0.1% Pacific Islander, 4.7% from other races, and 2.2% from two or more races. Hispanic or Latino of any race were 11.2% of the population.
There were 13,845 households, out of which 28.2% had children under the age of 18 living with them, 36.2% were married couples living together, 18.7% had a female householder with no husband present, and 39.3% were non-families. 32.3% of all households were made up of individuals, and 11.3% had someone living alone who was 65 years of age or older. The average household size was 2.45 and the average family size was 3.11.
In the borough, the population was spread out, with 24.2% under the age of 18, 9.2% from 18 to 24, 30.2% from 25 to 44, 22.2% from 45 to 64, and 14.2% who were 65 years of age or older. The median age was 36 years. For every 100 females, there were 91.2 males. For every 100 females age 18 and over, there were 87.3 males.
The median income for a household in the borough was $41,945, and the median income for a family was $50,919. Males had a median income of $37,845 versus $30,945 for females. The per capita income for the borough was $20,945. About 11.2% of families and 13.7% of the population were below the poverty line, including 19.2% of those under age 18 and 10.2% of those age 65 or over.
Common Questions
What is Per Capita Income in Norristown borough?
Per Capita income in Norristown borough is $26,938.
What is the Median Family Income in Norristown borough?
Median Family Income in Norristown borough is $64,841.
What is the Median Household income in Norristown borough?
Median Household Income in Norristown borough is $59,068.
What is Income or Wage Gap in Norristown borough?
Income or Wage Gap in Norristown borough is 4.5%.
Women in Norristown borough earn 95.5 cents for every dollar earned by a man.
What is Family Income Deficit in Norristown borough?
Family Income Deficit in Norristown borough is $13,793.
Families that are below poverty line in Norristown borough earn $13,793 less on average than the poverty threshold level.
What is Inequality or Gini Index in Norristown borough?
Inequality or Gini Index in Norristown borough is 0.43.
What is the Total Population of Norristown borough?
Total Population of Norristown borough is 35,712.
What is the Total Male Population of Norristown borough?
Total Male Population of Norristown borough is 17,812.
What is the Total Female Population of Norristown borough?
Total Female Population of Norristown borough is 17,900.
What is the Ratio of Males per 100 Females in Norristown borough?
There are 99.51 Males per 100 Females in Norristown borough.
What is the Ratio of Females per 100 Males in Norristown borough?
There are 100.49 Females per 100 Males in Norristown borough.
What is the Median Population Age in Norristown borough?
Median Population Age in Norristown borough is 32.4 Years.
What is the Average Family Size in Norristown borough
Average Family Size in Norristown borough is 3.5 People.
What is the Average Household Size in Norristown borough
Average Household Size in Norristown borough is 2.7 People.
How Large is the Labor Force in Norristown borough?
There are 18,998 People in the Labor Forcein in Norristown borough.
What is the Percentage of People in the Labor Force in Norristown borough?
70.0% of People are in the Labor Force in Norristown borough.
What is the Unemployment Rate in Norristown borough?
Unemployment Rate in Norristown borough is 6.2%.