Reading, PA Map & Demographics
Reading Map
Reading Overview
$20,782
PER CAPITA INCOME
$52,920
AVG FAMILY INCOME
$42,852
AVG HOUSEHOLD INCOME
28.7%
WAGE / INCOME GAP [ % ]
71.3¢/ $1
WAGE / INCOME GAP [ $ ]
$11,606
FAMILY INCOME DEFICIT
0.47
INEQUALITY / GINI INDEX
94,601
TOTAL POPULATION
45,457
MALE POPULATION
49,144
FEMALE POPULATION
92.50
MALES / 100 FEMALES
108.11
FEMALES / 100 MALES
31.1
MEDIAN AGE
3.5
AVG FAMILY SIZE
2.8
AVG HOUSEHOLD SIZE
43,855
LABOR FORCE [ PEOPLE ]
62.0%
PERCENT IN LABOR FORCE
11.3%
UNEMPLOYMENT RATE
Income in Reading
Income Overview in Reading
Per Capita Income in Reading is $20,782, while median incomes of families and households are $52,920 and $42,852 respectively.
| Characteristic | Number | Measure |
| Per Capita Income | 94,601 | $20,782 |
| Median Family Income | 20,604 | $52,920 |
| Mean Family Income | 20,604 | $63,808 |
| Median Household Income | 32,692 | $42,852 |
| Mean Household Income | 32,692 | $57,867 |
| Income Deficit | 20,604 | $11,606 |
| Wage / Income Gap (%) | 94,601 | 28.72% |
| Wage / Income Gap ($) | 94,601 | 71.28¢ per $1 |
| Gini / Inequality Index | 94,601 | 0.47 |
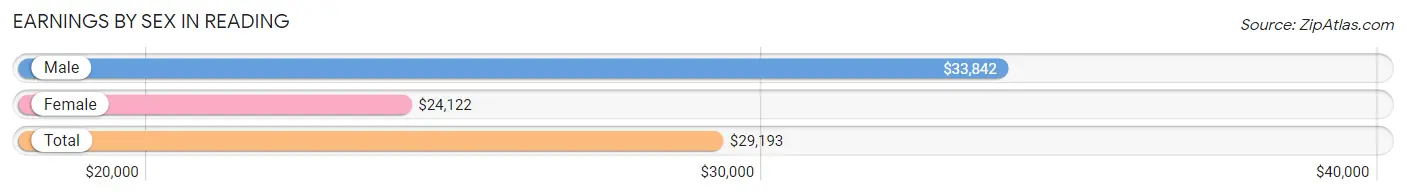
Earnings by Sex in Reading
Average Earnings in Reading are $29,193, $33,842 for men and $24,122 for women, a difference of 28.7%.
| Sex | Number | Average Earnings |
| Male | 23,707 (51.9%) | $33,842 |
| Female | 21,938 (48.1%) | $24,122 |
| Total | 45,645 (100.0%) | $29,193 |
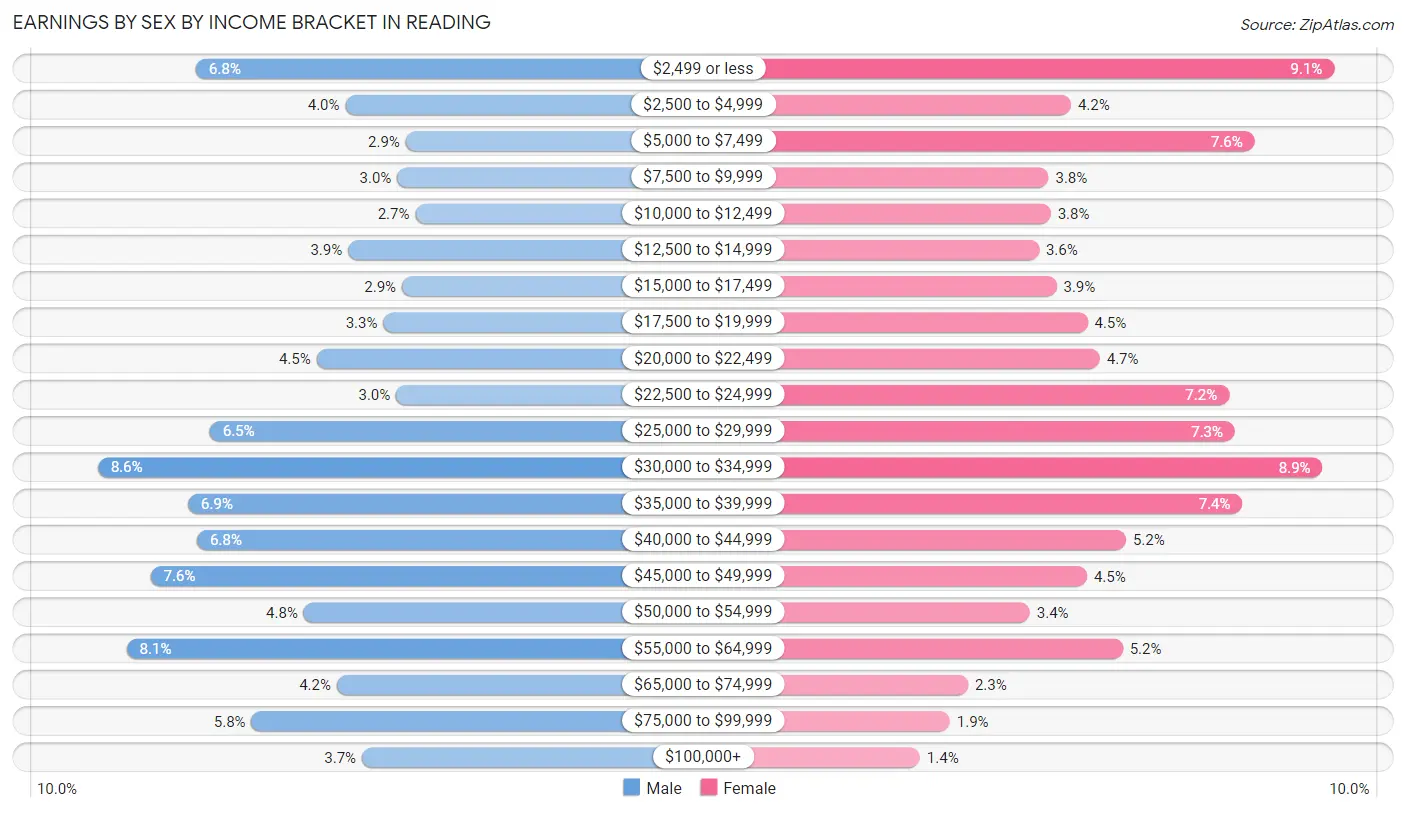
Earnings by Sex by Income Bracket in Reading
The most common earnings brackets in Reading are $30,000 to $34,999 for men (2,046 | 8.6%) and $2,499 or less for women (2,003 | 9.1%).
| Income | Male | Female |
| $2,499 or less | 1,610 (6.8%) | 2,003 (9.1%) |
| $2,500 to $4,999 | 945 (4.0%) | 922 (4.2%) |
| $5,000 to $7,499 | 678 (2.9%) | 1,675 (7.6%) |
| $7,500 to $9,999 | 717 (3.0%) | 829 (3.8%) |
| $10,000 to $12,499 | 635 (2.7%) | 839 (3.8%) |
| $12,500 to $14,999 | 934 (3.9%) | 789 (3.6%) |
| $15,000 to $17,499 | 694 (2.9%) | 863 (3.9%) |
| $17,500 to $19,999 | 777 (3.3%) | 990 (4.5%) |
| $20,000 to $22,499 | 1,073 (4.5%) | 1,040 (4.7%) |
| $22,500 to $24,999 | 720 (3.0%) | 1,571 (7.2%) |
| $25,000 to $29,999 | 1,547 (6.5%) | 1,595 (7.3%) |
| $30,000 to $34,999 | 2,046 (8.6%) | 1,954 (8.9%) |
| $35,000 to $39,999 | 1,646 (6.9%) | 1,625 (7.4%) |
| $40,000 to $44,999 | 1,605 (6.8%) | 1,147 (5.2%) |
| $45,000 to $49,999 | 1,811 (7.6%) | 988 (4.5%) |
| $50,000 to $54,999 | 1,131 (4.8%) | 753 (3.4%) |
| $55,000 to $64,999 | 1,919 (8.1%) | 1,134 (5.2%) |
| $65,000 to $74,999 | 985 (4.2%) | 497 (2.3%) |
| $75,000 to $99,999 | 1,362 (5.8%) | 424 (1.9%) |
| $100,000+ | 872 (3.7%) | 300 (1.4%) |
| Total | 23,707 (100.0%) | 21,938 (100.0%) |
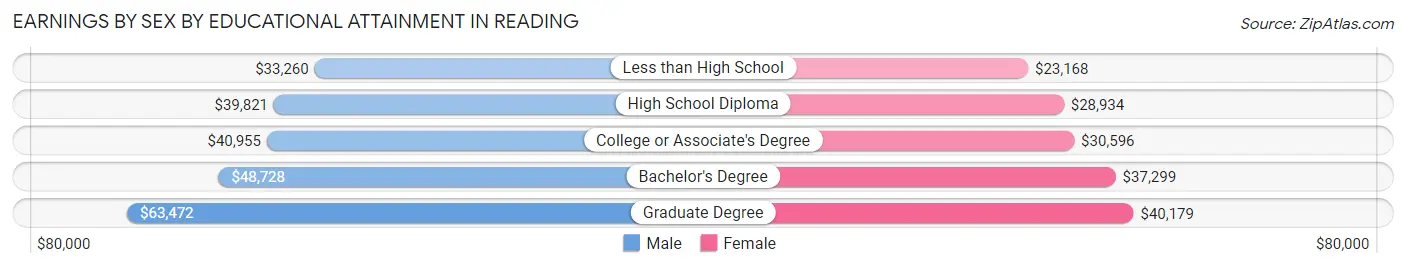
Earnings by Sex by Educational Attainment in Reading
Average earnings in Reading are $39,657 for men and $29,062 for women, a difference of 26.7%. Men with an educational attainment of graduate degree enjoy the highest average annual earnings of $63,472, while those with less than high school education earn the least with $33,260. Women with an educational attainment of graduate degree earn the most with the average annual earnings of $40,179, while those with less than high school education have the smallest earnings of $23,168.
| Educational Attainment | Male Income | Female Income |
| Less than High School | $33,260 | $23,168 |
| High School Diploma | $39,821 | $28,934 |
| College or Associate's Degree | $40,955 | $30,596 |
| Bachelor's Degree | $48,728 | $37,299 |
| Graduate Degree | $63,472 | $40,179 |
| Total | $39,657 | $29,062 |
Family Income in Reading
Family Income Brackets in Reading
According to the Reading family income data, there are 4,657 families falling into the $50,000 to $74,999 income range, which is the most common income bracket and makes up 22.6% of all families. Conversely, the $200,000+ income bracket is the least frequent group with only 453 families (2.2%) belonging to this category.
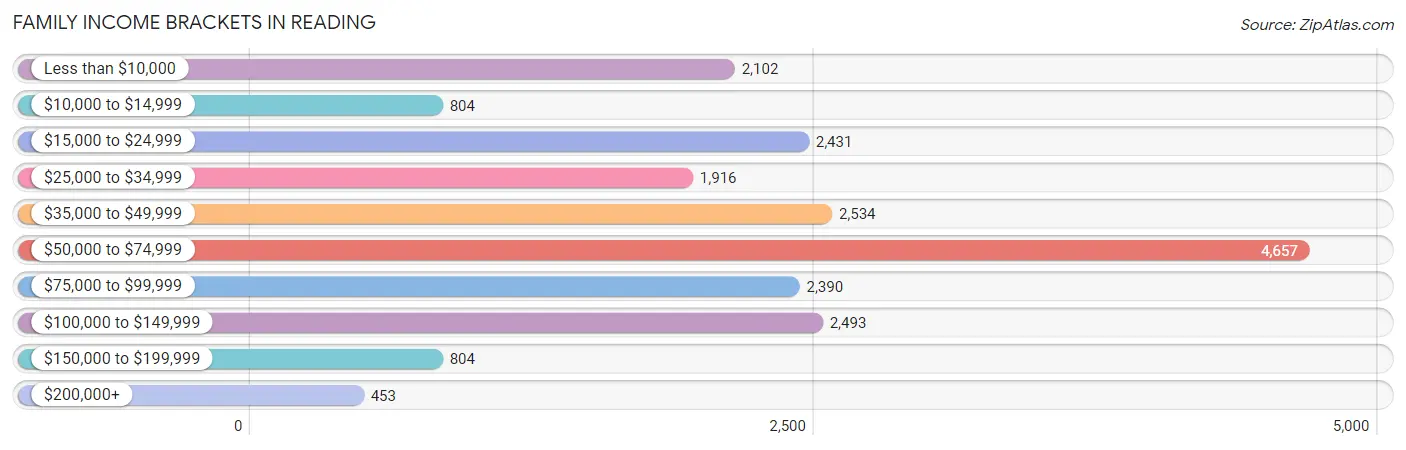
| Income Bracket | # Families | % Families |
| Less than $10,000 | 2,102 | 10.2% |
| $10,000 to $14,999 | 804 | 3.9% |
| $15,000 to $24,999 | 2,431 | 11.8% |
| $25,000 to $34,999 | 1,916 | 9.3% |
| $35,000 to $49,999 | 2,534 | 12.3% |
| $50,000 to $74,999 | 4,657 | 22.6% |
| $75,000 to $99,999 | 2,390 | 11.6% |
| $100,000 to $149,999 | 2,493 | 12.1% |
| $150,000 to $199,999 | 804 | 3.9% |
| $200,000+ | 453 | 2.2% |
Family Income by Famaliy Size in Reading
7+ person families (522 | 2.5%) account for the highest median family income in Reading with $85,742 per family, while 2-person families (7,610 | 36.9%) have the highest median income of $23,827 per family member.
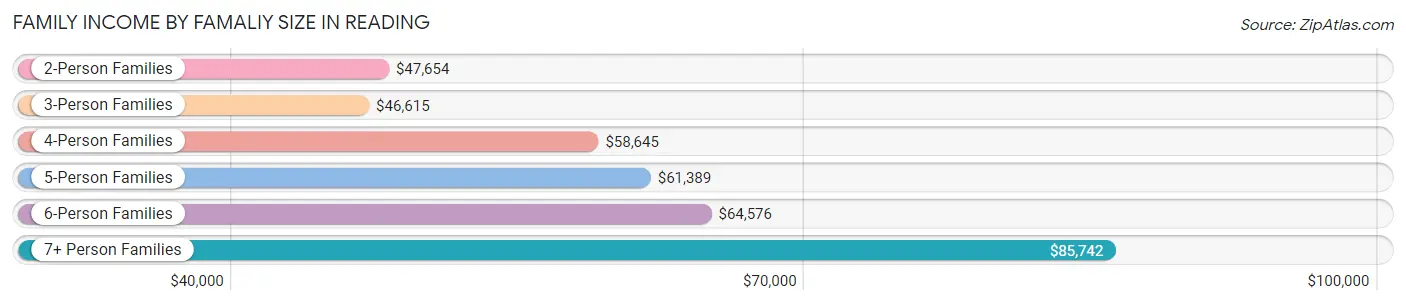
| Income Bracket | # Families | Median Income |
| 2-Person Families | 7,610 (36.9%) | $47,654 |
| 3-Person Families | 5,655 (27.5%) | $46,615 |
| 4-Person Families | 3,350 (16.3%) | $58,645 |
| 5-Person Families | 2,430 (11.8%) | $61,389 |
| 6-Person Families | 1,037 (5.0%) | $64,576 |
| 7+ Person Families | 522 (2.5%) | $85,742 |
| Total | 20,604 (100.0%) | $52,920 |
Family Income by Number of Earners in Reading
The median family income in Reading is $52,920, with families comprising 3+ earners (2,730) having the highest median family income of $110,613, while families with no earners (2,712) have the lowest median family income of $16,276, accounting for 13.3% and 13.2% of families, respectively.
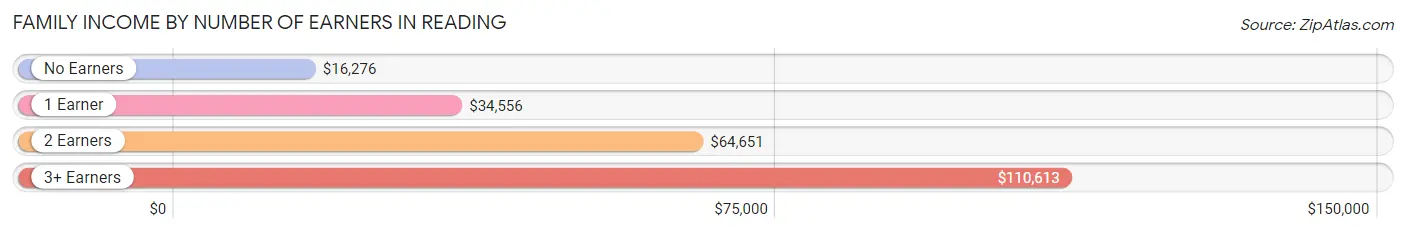
| Number of Earners | # Families | Median Income |
| No Earners | 2,712 (13.2%) | $16,276 |
| 1 Earner | 7,576 (36.8%) | $34,556 |
| 2 Earners | 7,586 (36.8%) | $64,651 |
| 3+ Earners | 2,730 (13.3%) | $110,613 |
| Total | 20,604 (100.0%) | $52,920 |
Household Income in Reading
Household Income Brackets in Reading
With 6,113 households falling in the category, the $50,000 to $74,999 income range is the most frequent in Reading, accounting for 18.7% of all households. In contrast, only 621 households (1.9%) fall into the $200,000+ income bracket, making it the least populous group.
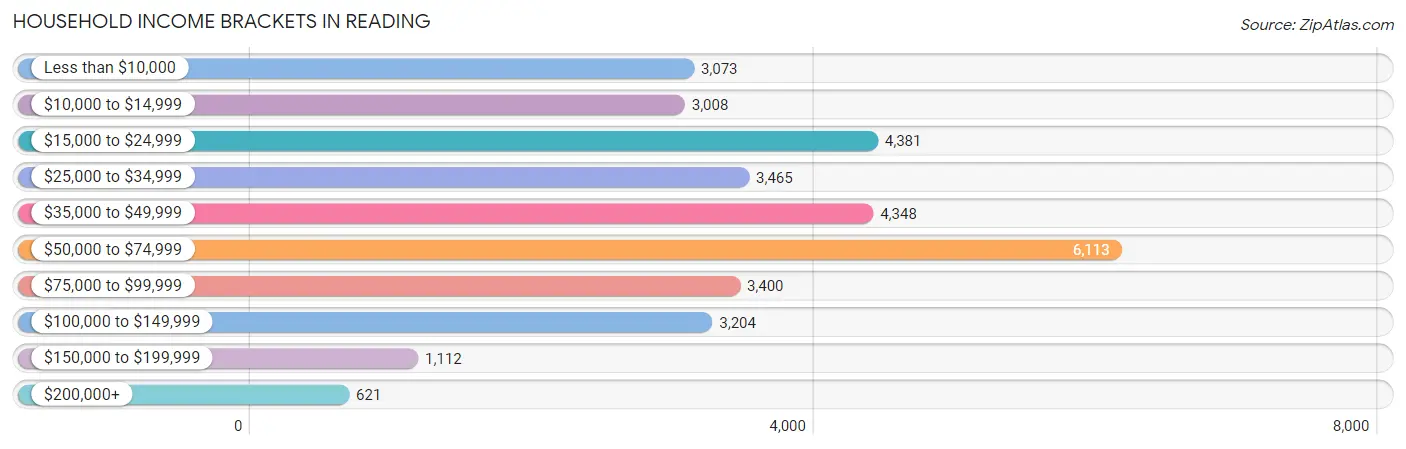
| Income Bracket | # Households | % Households |
| Less than $10,000 | 3,073 | 9.4% |
| $10,000 to $14,999 | 3,008 | 9.2% |
| $15,000 to $24,999 | 4,381 | 13.4% |
| $25,000 to $34,999 | 3,465 | 10.6% |
| $35,000 to $49,999 | 4,348 | 13.3% |
| $50,000 to $74,999 | 6,113 | 18.7% |
| $75,000 to $99,999 | 3,400 | 10.4% |
| $100,000 to $149,999 | 3,204 | 9.8% |
| $150,000 to $199,999 | 1,112 | 3.4% |
| $200,000+ | 621 | 1.9% |
Household Income by Householder Age in Reading
The median household income in Reading is $42,852, with the highest median household income of $51,679 found in the 45 to 64 years age bracket for the primary householder. A total of 12,448 households (38.1%) fall into this category. Meanwhile, the 65+ years age bracket for the primary householder has the lowest median household income of $29,694, with 6,646 households (20.3%) in this group.
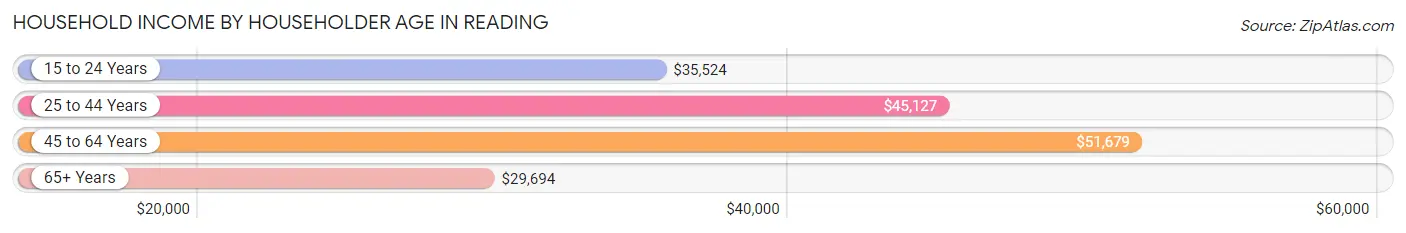
| Income Bracket | # Households | Median Income |
| 15 to 24 Years | 1,840 (5.6%) | $35,524 |
| 25 to 44 Years | 11,758 (36.0%) | $45,127 |
| 45 to 64 Years | 12,448 (38.1%) | $51,679 |
| 65+ Years | 6,646 (20.3%) | $29,694 |
| Total | 32,692 (100.0%) | $42,852 |
Poverty in Reading
Income Below Poverty by Sex and Age in Reading
With 26.9% poverty level for males and 30.2% for females among the residents of Reading, under 5 year old males and 6 to 11 year old females are the most vulnerable to poverty, with 1,707 males (48.6%) and 1,868 females (45.2%) in their respective age groups living below the poverty level.
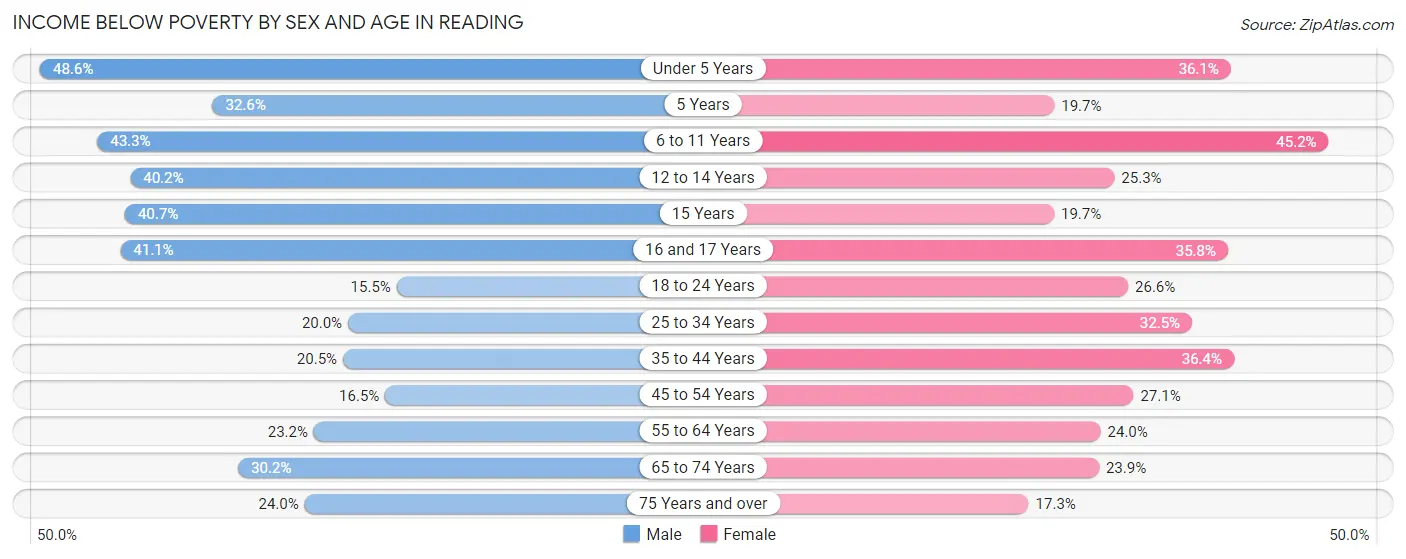
| Age Bracket | Male | Female |
| Under 5 Years | 1,707 (48.6%) | 1,350 (36.1%) |
| 5 Years | 225 (32.6%) | 168 (19.7%) |
| 6 to 11 Years | 1,810 (43.2%) | 1,868 (45.2%) |
| 12 to 14 Years | 940 (40.2%) | 593 (25.3%) |
| 15 Years | 334 (40.7%) | 143 (19.7%) |
| 16 and 17 Years | 513 (41.1%) | 659 (35.8%) |
| 18 to 24 Years | 842 (15.5%) | 1,308 (26.6%) |
| 25 to 34 Years | 1,246 (20.0%) | 2,262 (32.5%) |
| 35 to 44 Years | 1,189 (20.5%) | 2,111 (36.4%) |
| 45 to 54 Years | 840 (16.5%) | 1,524 (27.1%) |
| 55 to 64 Years | 1,123 (23.2%) | 1,207 (24.0%) |
| 65 to 74 Years | 836 (30.2%) | 778 (23.9%) |
| 75 Years and over | 317 (24.0%) | 427 (17.3%) |
| Total | 11,922 (26.9%) | 14,398 (30.2%) |
Income Above Poverty by Sex and Age in Reading
According to the poverty statistics in Reading, males aged 18 to 24 years and females aged 75 years and over are the age groups that are most secure financially, with 84.5% of males and 82.7% of females in these age groups living above the poverty line.
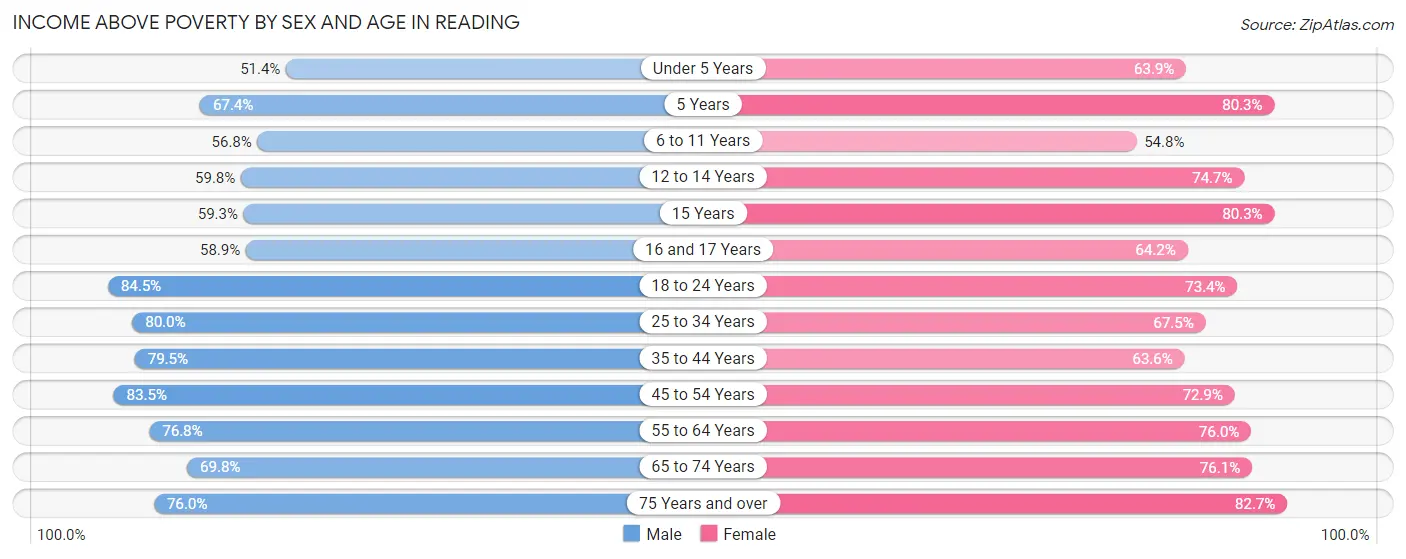
| Age Bracket | Male | Female |
| Under 5 Years | 1,808 (51.4%) | 2,391 (63.9%) |
| 5 Years | 466 (67.4%) | 684 (80.3%) |
| 6 to 11 Years | 2,375 (56.8%) | 2,268 (54.8%) |
| 12 to 14 Years | 1,399 (59.8%) | 1,751 (74.7%) |
| 15 Years | 487 (59.3%) | 583 (80.3%) |
| 16 and 17 Years | 735 (58.9%) | 1,181 (64.2%) |
| 18 to 24 Years | 4,602 (84.5%) | 3,615 (73.4%) |
| 25 to 34 Years | 4,986 (80.0%) | 4,701 (67.5%) |
| 35 to 44 Years | 4,622 (79.5%) | 3,691 (63.6%) |
| 45 to 54 Years | 4,238 (83.5%) | 4,106 (72.9%) |
| 55 to 64 Years | 3,725 (76.8%) | 3,819 (76.0%) |
| 65 to 74 Years | 1,934 (69.8%) | 2,482 (76.1%) |
| 75 Years and over | 1,003 (76.0%) | 2,036 (82.7%) |
| Total | 32,380 (73.1%) | 33,308 (69.8%) |
Income Below Poverty Among Married-Couple Families in Reading
The poverty statistics for married-couple families in Reading show that 14.5% or 1,287 of the total 8,851 families live below the poverty line. Families with 1 or 2 children have the highest poverty rate of 16.1%, comprising of 484 families. On the other hand, families with 3 or 4 children have the lowest poverty rate of 10.4%, which includes 93 families.
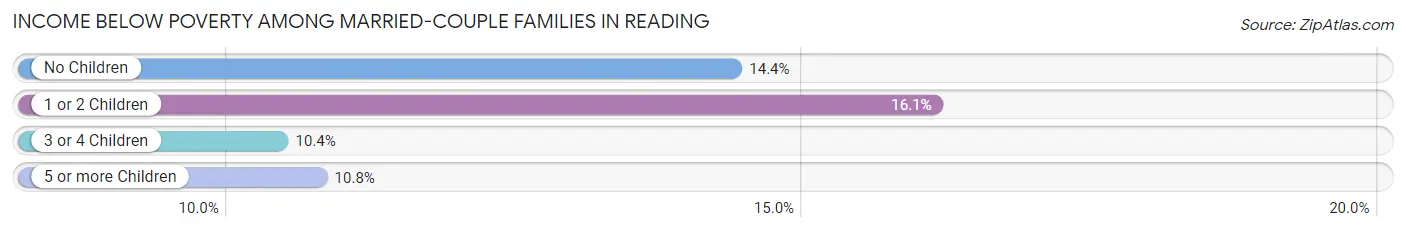
| Children | Above Poverty | Below Poverty |
| No Children | 4,160 (85.6%) | 699 (14.4%) |
| 1 or 2 Children | 2,515 (83.9%) | 484 (16.1%) |
| 3 or 4 Children | 798 (89.6%) | 93 (10.4%) |
| 5 or more Children | 91 (89.2%) | 11 (10.8%) |
| Total | 7,564 (85.5%) | 1,287 (14.5%) |
Income Below Poverty Among Single-Parent Households in Reading
According to the poverty data in Reading, 14.3% or 364 single-father households and 38.3% or 3,523 single-mother households are living below the poverty line. Among single-father households, those with 5 or more children have the highest poverty rate, with 13 households (72.2%) experiencing poverty. Likewise, among single-mother households, those with 5 or more children have the highest poverty rate, with 146 households (61.1%) falling below the poverty line.
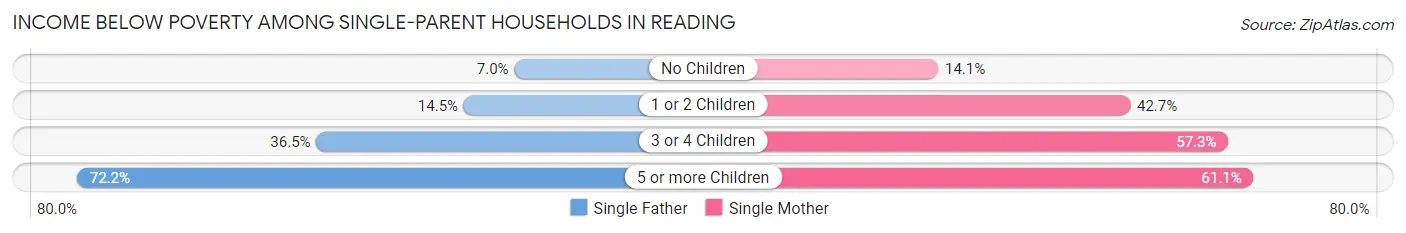
| Children | Single Father | Single Mother |
| No Children | 88 (7.0%) | 333 (14.1%) |
| 1 or 2 Children | 133 (14.5%) | 2,155 (42.7%) |
| 3 or 4 Children | 130 (36.5%) | 889 (57.3%) |
| 5 or more Children | 13 (72.2%) | 146 (61.1%) |
| Total | 364 (14.3%) | 3,523 (38.3%) |
Income Below Poverty Among Married-Couple vs Single-Parent Households in Reading
The poverty data for Reading shows that 1,287 of the married-couple family households (14.5%) and 3,887 of the single-parent households (33.1%) are living below the poverty level. Within the married-couple family households, those with 1 or 2 children have the highest poverty rate, with 484 households (16.1%) falling below the poverty line. Among the single-parent households, those with 5 or more children have the highest poverty rate, with 159 household (61.9%) living below poverty.
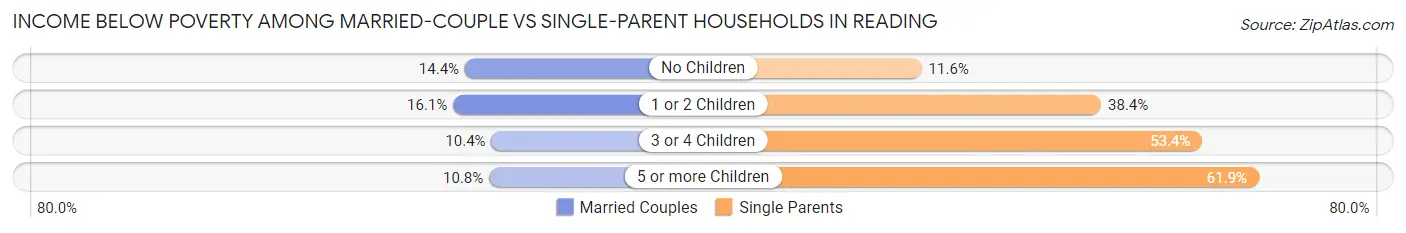
| Children | Married-Couple Families | Single-Parent Households |
| No Children | 699 (14.4%) | 421 (11.6%) |
| 1 or 2 Children | 484 (16.1%) | 2,288 (38.4%) |
| 3 or 4 Children | 93 (10.4%) | 1,019 (53.4%) |
| 5 or more Children | 11 (10.8%) | 159 (61.9%) |
| Total | 1,287 (14.5%) | 3,887 (33.1%) |
Race in Reading
The most populous races in Reading are Hispanic or Latino (63,542 | 67.2%), White / Caucasian (35,572 | 37.6%), and Some other Race (26,142 | 27.6%).
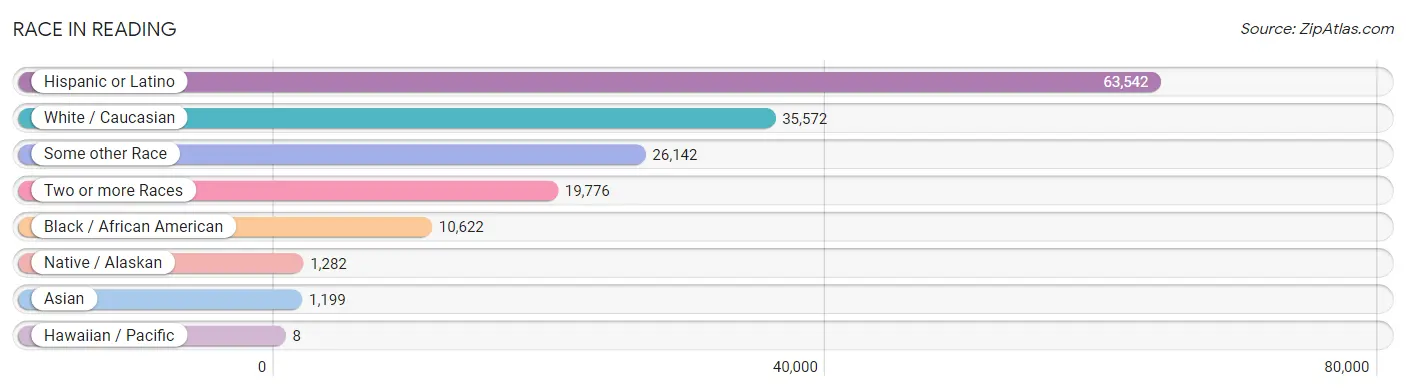
| Race | # Population | % Population |
| Asian | 1,199 | 1.3% |
| Black / African American | 10,622 | 11.2% |
| Hawaiian / Pacific | 8 | 0.0% |
| Hispanic or Latino | 63,542 | 67.2% |
| Native / Alaskan | 1,282 | 1.4% |
| White / Caucasian | 35,572 | 37.6% |
| Two or more Races | 19,776 | 20.9% |
| Some other Race | 26,142 | 27.6% |
| Total | 94,601 | 100.0% |
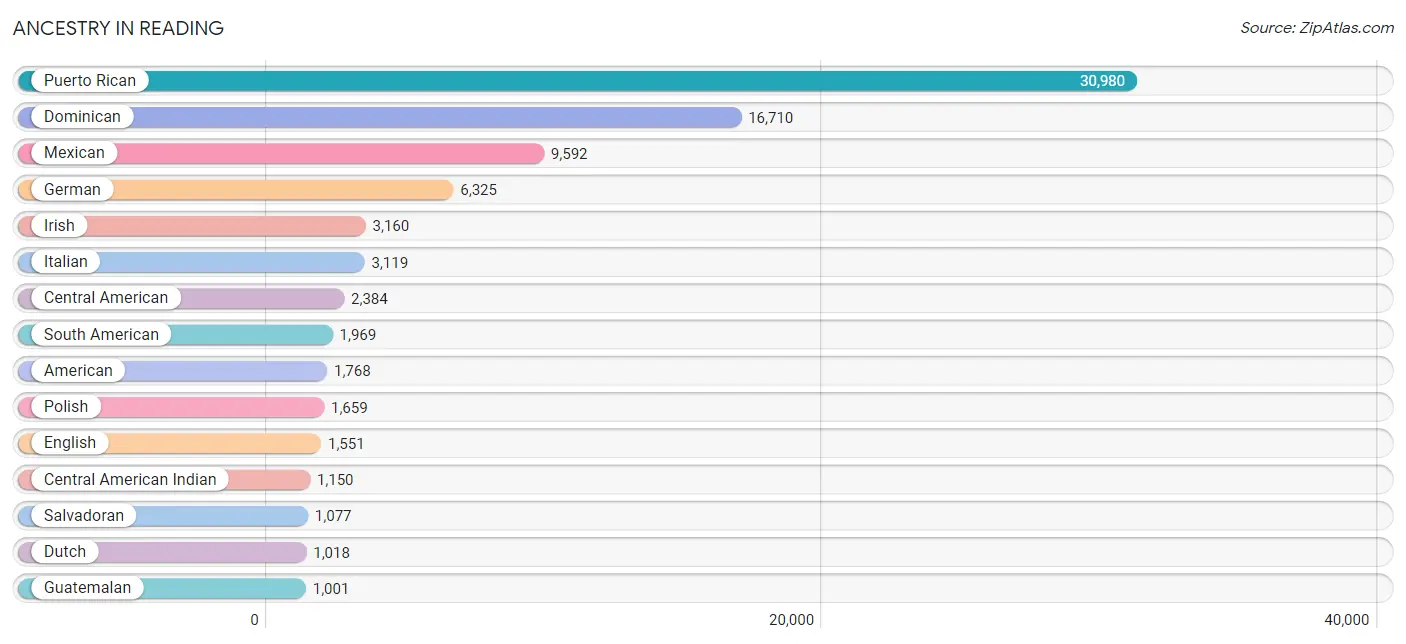
Ancestry in Reading
The most populous ancestries reported in Reading are Puerto Rican (30,980 | 32.8%), Dominican (16,710 | 17.7%), Mexican (9,592 | 10.1%), German (6,325 | 6.7%), and Irish (3,160 | 3.3%), together accounting for 70.6% of all Reading residents.
| Ancestry | # Population | % Population |
| Afghan | 6 | 0.0% |
| African | 192 | 0.2% |
| American | 1,768 | 1.9% |
| Arab | 61 | 0.1% |
| Argentinean | 93 | 0.1% |
| Armenian | 8 | 0.0% |
| Australian | 10 | 0.0% |
| Austrian | 8 | 0.0% |
| Belgian | 1 | 0.0% |
| Bhutanese | 16 | 0.0% |
| Blackfeet | 17 | 0.0% |
| Bolivian | 72 | 0.1% |
| Brazilian | 17 | 0.0% |
| British | 54 | 0.1% |
| British West Indian | 24 | 0.0% |
| Burmese | 313 | 0.3% |
| Canadian | 44 | 0.1% |
| Central American | 2,384 | 2.5% |
| Central American Indian | 1,150 | 1.2% |
| Cherokee | 77 | 0.1% |
| Chilean | 25 | 0.0% |
| Colombian | 697 | 0.7% |
| Cuban | 547 | 0.6% |
| Czech | 34 | 0.0% |
| Czechoslovakian | 15 | 0.0% |
| Danish | 18 | 0.0% |
| Delaware | 4 | 0.0% |
| Dominican | 16,710 | 17.7% |
| Dutch | 1,018 | 1.1% |
| Eastern European | 17 | 0.0% |
| Ecuadorian | 499 | 0.5% |
| English | 1,551 | 1.6% |
| Ethiopian | 5 | 0.0% |
| European | 129 | 0.1% |
| Finnish | 15 | 0.0% |
| French | 520 | 0.5% |
| French Canadian | 35 | 0.0% |
| German | 6,325 | 6.7% |
| German Russian | 19 | 0.0% |
| Greek | 384 | 0.4% |
| Guamanian / Chamorro | 8 | 0.0% |
| Guatemalan | 1,001 | 1.1% |
| Guyanese | 215 | 0.2% |
| Haitian | 297 | 0.3% |
| Honduran | 196 | 0.2% |
| Hungarian | 85 | 0.1% |
| Indian (Asian) | 331 | 0.4% |
| Irish | 3,160 | 3.3% |
| Iroquois | 4 | 0.0% |
| Israeli | 8 | 0.0% |
| Italian | 3,119 | 3.3% |
| Jamaican | 363 | 0.4% |
| Korean | 81 | 0.1% |
| Latvian | 13 | 0.0% |
| Lebanese | 8 | 0.0% |
| Lithuanian | 125 | 0.1% |
| Malaysian | 6 | 0.0% |
| Mexican | 9,592 | 10.1% |
| Mexican American Indian | 830 | 0.9% |
| Native Hawaiian | 20 | 0.0% |
| Nicaraguan | 105 | 0.1% |
| Nigerian | 39 | 0.0% |
| Norwegian | 62 | 0.1% |
| Pakistani | 44 | 0.1% |
| Pennsylvania German | 881 | 0.9% |
| Peruvian | 565 | 0.6% |
| Polish | 1,659 | 1.8% |
| Portuguese | 120 | 0.1% |
| Potawatomi | 27 | 0.0% |
| Puerto Rican | 30,980 | 32.8% |
| Romanian | 58 | 0.1% |
| Russian | 134 | 0.1% |
| Salvadoran | 1,077 | 1.1% |
| Scotch-Irish | 76 | 0.1% |
| Scottish | 255 | 0.3% |
| Serbian | 7 | 0.0% |
| Sierra Leonean | 35 | 0.0% |
| Slavic | 9 | 0.0% |
| Slovak | 114 | 0.1% |
| South American | 1,969 | 2.1% |
| South American Indian | 25 | 0.0% |
| Spaniard | 122 | 0.1% |
| Spanish | 149 | 0.2% |
| Sri Lankan | 384 | 0.4% |
| Subsaharan African | 296 | 0.3% |
| Swedish | 198 | 0.2% |
| Swiss | 112 | 0.1% |
| Thai | 97 | 0.1% |
| Trinidadian and Tobagonian | 213 | 0.2% |
| U.S. Virgin Islander | 47 | 0.1% |
| Ukrainian | 176 | 0.2% |
| Venezuelan | 18 | 0.0% |
| Welsh | 401 | 0.4% |
| West Indian | 85 | 0.1% |
| Yugoslavian | 26 | 0.0% | View All 95 Rows |
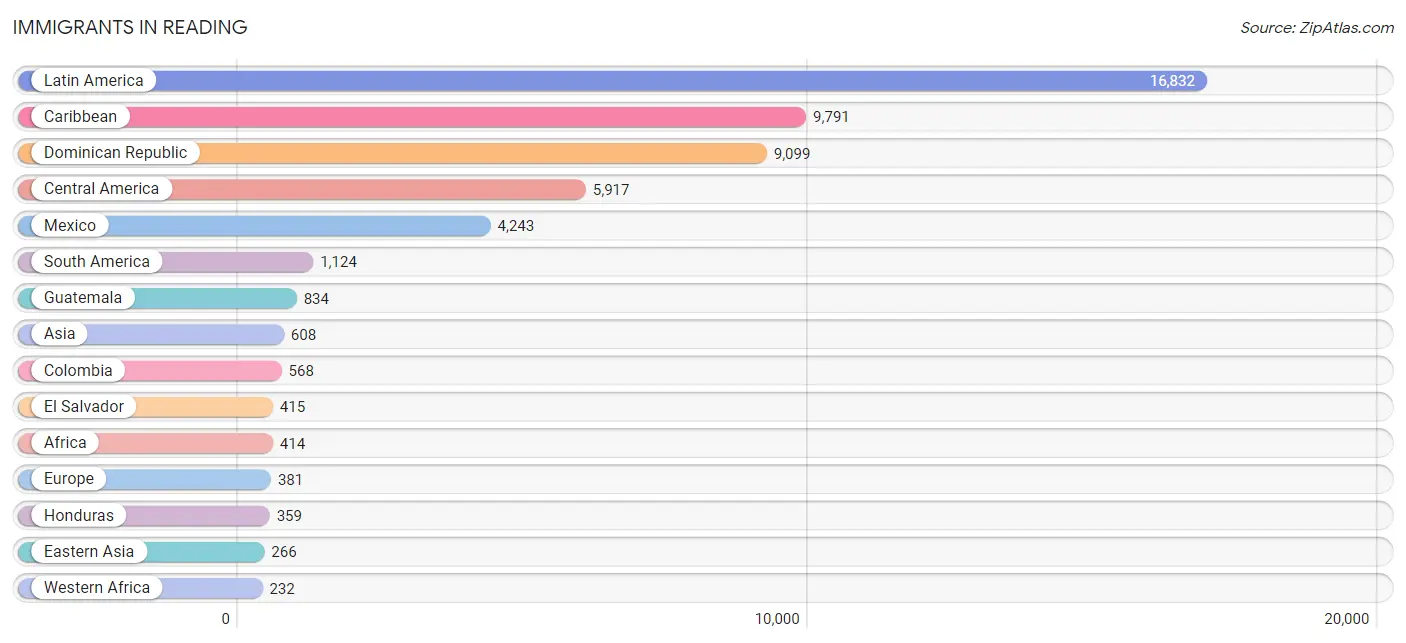
Immigrants in Reading
The most numerous immigrant groups reported in Reading came from Latin America (16,832 | 17.8%), Caribbean (9,791 | 10.3%), Dominican Republic (9,099 | 9.6%), Central America (5,917 | 6.2%), and Mexico (4,243 | 4.5%), together accounting for 48.5% of all Reading residents.
| Immigration Origin | # Population | % Population |
| Afghanistan | 6 | 0.0% |
| Africa | 414 | 0.4% |
| Argentina | 109 | 0.1% |
| Asia | 608 | 0.6% |
| Australia | 10 | 0.0% |
| Bolivia | 16 | 0.0% |
| Brazil | 7 | 0.0% |
| Canada | 85 | 0.1% |
| Caribbean | 9,791 | 10.3% |
| Central America | 5,917 | 6.2% |
| Chile | 17 | 0.0% |
| China | 134 | 0.1% |
| Colombia | 568 | 0.6% |
| Cuba | 55 | 0.1% |
| Denmark | 13 | 0.0% |
| Dominica | 151 | 0.2% |
| Dominican Republic | 9,099 | 9.6% |
| Eastern Africa | 5 | 0.0% |
| Eastern Asia | 266 | 0.3% |
| Eastern Europe | 155 | 0.2% |
| Ecuador | 221 | 0.2% |
| Egypt | 4 | 0.0% |
| El Salvador | 415 | 0.4% |
| England | 17 | 0.0% |
| Ethiopia | 5 | 0.0% |
| Europe | 381 | 0.4% |
| France | 6 | 0.0% |
| Germany | 33 | 0.0% |
| Greece | 5 | 0.0% |
| Grenada | 71 | 0.1% |
| Guatemala | 834 | 0.9% |
| Guyana | 106 | 0.1% |
| Haiti | 224 | 0.2% |
| Honduras | 359 | 0.4% |
| India | 80 | 0.1% |
| Indonesia | 11 | 0.0% |
| Italy | 108 | 0.1% |
| Jamaica | 106 | 0.1% |
| Korea | 132 | 0.1% |
| Latin America | 16,832 | 17.8% |
| Mexico | 4,243 | 4.5% |
| Nepal | 12 | 0.0% |
| Nicaragua | 66 | 0.1% |
| Nigeria | 28 | 0.0% |
| Northern Africa | 101 | 0.1% |
| Northern Europe | 74 | 0.1% |
| Oceania | 10 | 0.0% |
| Peru | 59 | 0.1% |
| Philippines | 16 | 0.0% |
| Poland | 13 | 0.0% |
| Romania | 61 | 0.1% |
| Russia | 43 | 0.1% |
| Scotland | 34 | 0.0% |
| Sierra Leone | 151 | 0.2% |
| South America | 1,124 | 1.2% |
| South Central Asia | 172 | 0.2% |
| South Eastern Asia | 166 | 0.2% |
| Southern Europe | 113 | 0.1% |
| Thailand | 6 | 0.0% |
| Trinidad and Tobago | 85 | 0.1% |
| Venezuela | 21 | 0.0% |
| Vietnam | 133 | 0.1% |
| Western Africa | 232 | 0.3% |
| Western Asia | 4 | 0.0% |
| Western Europe | 39 | 0.0% | View All 65 Rows |
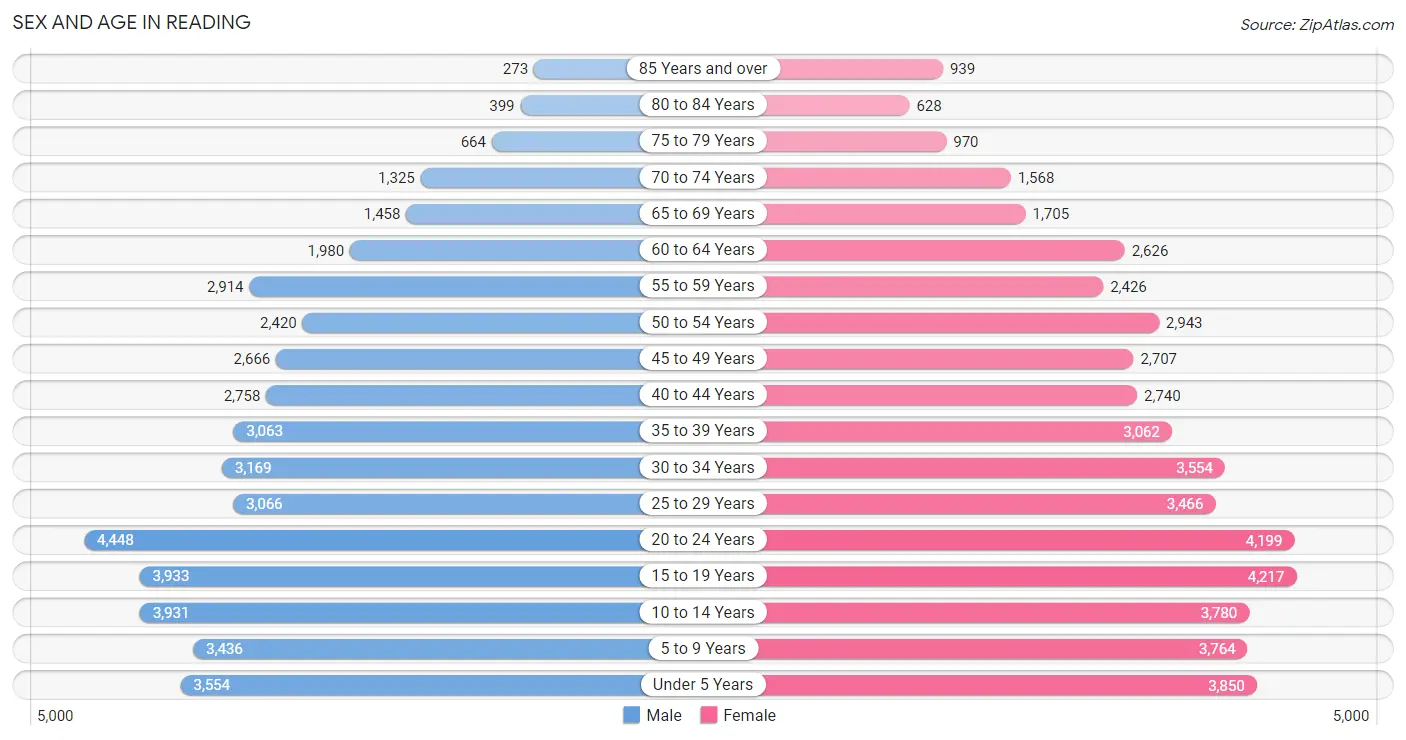
Sex and Age in Reading
Sex and Age in Reading
The most populous age groups in Reading are 20 to 24 Years (4,448 | 9.8%) for men and 15 to 19 Years (4,217 | 8.6%) for women.
| Age Bracket | Male | Female |
| Under 5 Years | 3,554 (7.8%) | 3,850 (7.8%) |
| 5 to 9 Years | 3,436 (7.6%) | 3,764 (7.7%) |
| 10 to 14 Years | 3,931 (8.6%) | 3,780 (7.7%) |
| 15 to 19 Years | 3,933 (8.6%) | 4,217 (8.6%) |
| 20 to 24 Years | 4,448 (9.8%) | 4,199 (8.5%) |
| 25 to 29 Years | 3,066 (6.7%) | 3,466 (7.0%) |
| 30 to 34 Years | 3,169 (7.0%) | 3,554 (7.2%) |
| 35 to 39 Years | 3,063 (6.7%) | 3,062 (6.2%) |
| 40 to 44 Years | 2,758 (6.1%) | 2,740 (5.6%) |
| 45 to 49 Years | 2,666 (5.9%) | 2,707 (5.5%) |
| 50 to 54 Years | 2,420 (5.3%) | 2,943 (6.0%) |
| 55 to 59 Years | 2,914 (6.4%) | 2,426 (4.9%) |
| 60 to 64 Years | 1,980 (4.4%) | 2,626 (5.3%) |
| 65 to 69 Years | 1,458 (3.2%) | 1,705 (3.5%) |
| 70 to 74 Years | 1,325 (2.9%) | 1,568 (3.2%) |
| 75 to 79 Years | 664 (1.5%) | 970 (2.0%) |
| 80 to 84 Years | 399 (0.9%) | 628 (1.3%) |
| 85 Years and over | 273 (0.6%) | 939 (1.9%) |
| Total | 45,457 (100.0%) | 49,144 (100.0%) |
Families and Households in Reading
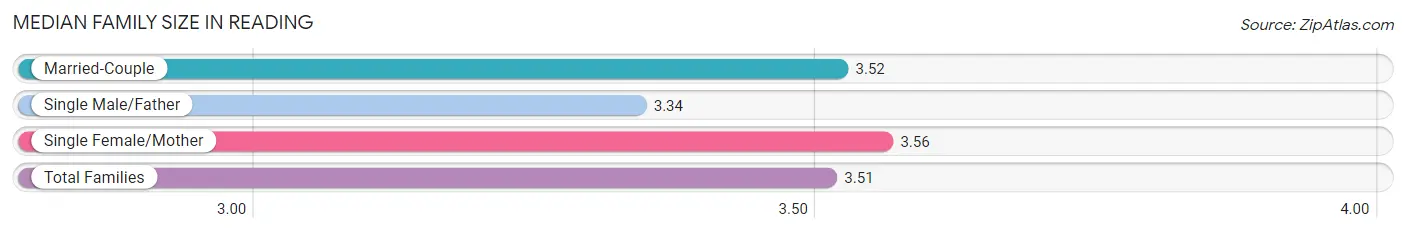
Median Family Size in Reading
The median family size in Reading is 3.51 persons per family, with single female/mother families (9,209 | 44.7%) accounting for the largest median family size of 3.56 persons per family. On the other hand, single male/father families (2,544 | 12.3%) represent the smallest median family size with 3.34 persons per family.
| Family Type | # Families | Family Size |
| Married-Couple | 8,851 (43.0%) | 3.52 |
| Single Male/Father | 2,544 (12.3%) | 3.34 |
| Single Female/Mother | 9,209 (44.7%) | 3.56 |
| Total Families | 20,604 (100.0%) | 3.51 |
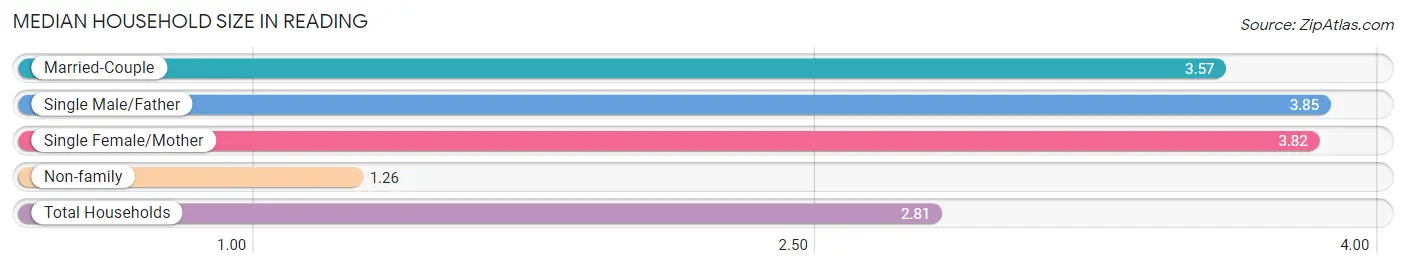
Median Household Size in Reading
The median household size in Reading is 2.81 persons per household, with single male/father households (2,544 | 7.8%) accounting for the largest median household size of 3.85 persons per household. non-family households (12,088 | 37.0%) represent the smallest median household size with 1.26 persons per household.
| Household Type | # Households | Household Size |
| Married-Couple | 8,851 (27.1%) | 3.57 |
| Single Male/Father | 2,544 (7.8%) | 3.85 |
| Single Female/Mother | 9,209 (28.2%) | 3.82 |
| Non-family | 12,088 (37.0%) | 1.26 |
| Total Households | 32,692 (100.0%) | 2.81 |
Household Size by Marriage Status in Reading
Out of a total of 32,692 households in Reading, 20,604 (63.0%) are family households, while 12,088 (37.0%) are nonfamily households. The most numerous type of family households are 2-person households, comprising 6,283, and the most common type of nonfamily households are 1-person households, comprising 9,772.
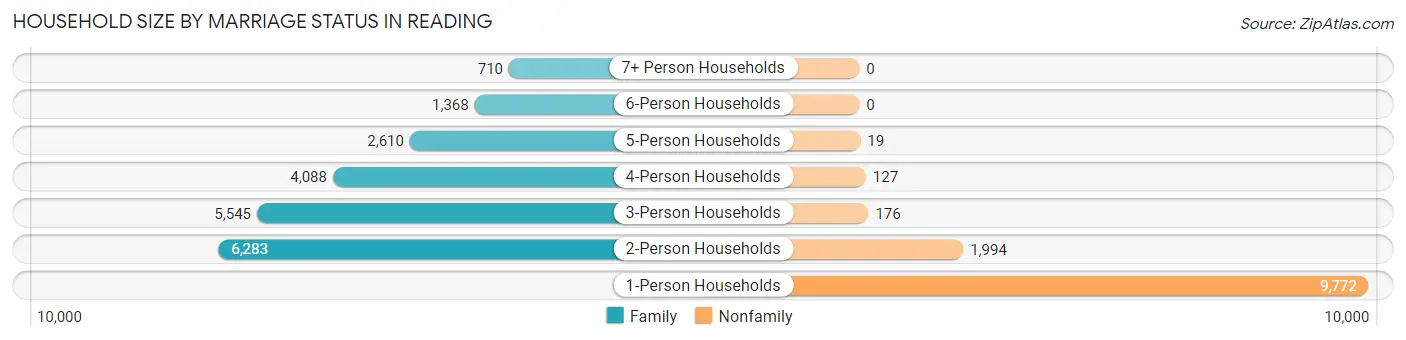
| Household Size | Family Households | Nonfamily Households |
| 1-Person Households | - | 9,772 (29.9%) |
| 2-Person Households | 6,283 (19.2%) | 1,994 (6.1%) |
| 3-Person Households | 5,545 (17.0%) | 176 (0.5%) |
| 4-Person Households | 4,088 (12.5%) | 127 (0.4%) |
| 5-Person Households | 2,610 (8.0%) | 19 (0.1%) |
| 6-Person Households | 1,368 (4.2%) | 0 (0.0%) |
| 7+ Person Households | 710 (2.2%) | 0 (0.0%) |
| Total | 20,604 (63.0%) | 12,088 (37.0%) |
Female Fertility in Reading
Fertility by Age in Reading
Average fertility rate in Reading is 74.0 births per 1,000 women. Women in the age bracket of 20 to 34 years have the highest fertility rate with 125.0 births per 1,000 women. Women in the age bracket of 20 to 34 years acount for 77.9% of all women with births.
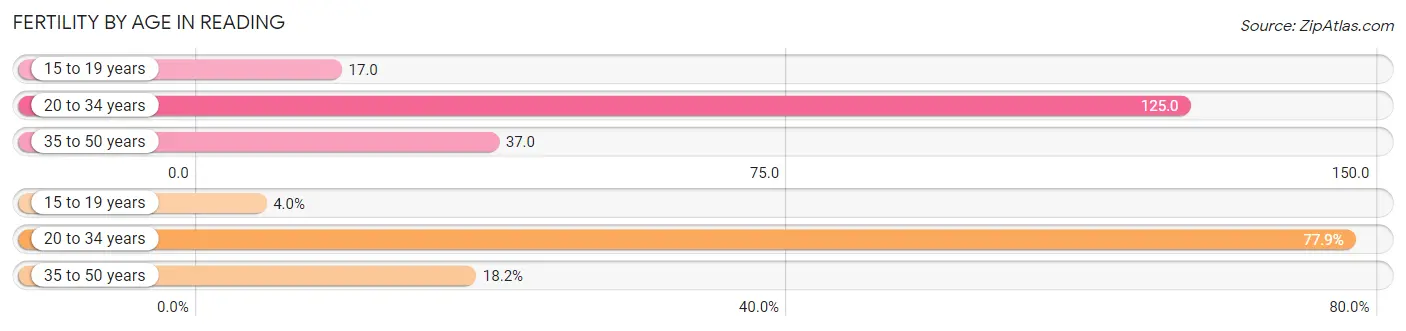
| Age Bracket | Women with Births | Births / 1,000 Women |
| 15 to 19 years | 71 (4.0%) | 17.0 |
| 20 to 34 years | 1,401 (77.9%) | 125.0 |
| 35 to 50 years | 327 (18.2%) | 37.0 |
| Total | 1,799 (100.0%) | 74.0 |
Fertility by Age by Marriage Status in Reading
34.0% of women with births (1,799) in Reading are married. The highest percentage of unmarried women with births falls into 15 to 19 years age bracket with 88.7% of them unmarried at the time of birth, while the lowest percentage of unmarried women with births belong to 35 to 50 years age bracket with 55.3% of them unmarried.
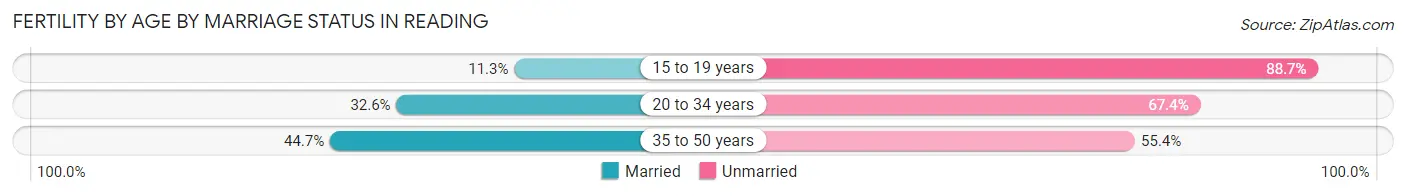
| Age Bracket | Married | Unmarried |
| 15 to 19 years | 8 (11.3%) | 63 (88.7%) |
| 20 to 34 years | 457 (32.6%) | 944 (67.4%) |
| 35 to 50 years | 146 (44.7%) | 181 (55.3%) |
| Total | 612 (34.0%) | 1,187 (66.0%) |
Fertility by Education in Reading
Average fertility rate in Reading is 74.0 births per 1,000 women. Women with the education attainment of graduate degree have the highest fertility rate of 138.0 births per 1,000 women, while women with the education attainment of bachelor's degree have the lowest fertility at 52.0 births per 1,000 women. Women with the education attainment of high school diploma represent 35.7% of all women with births.
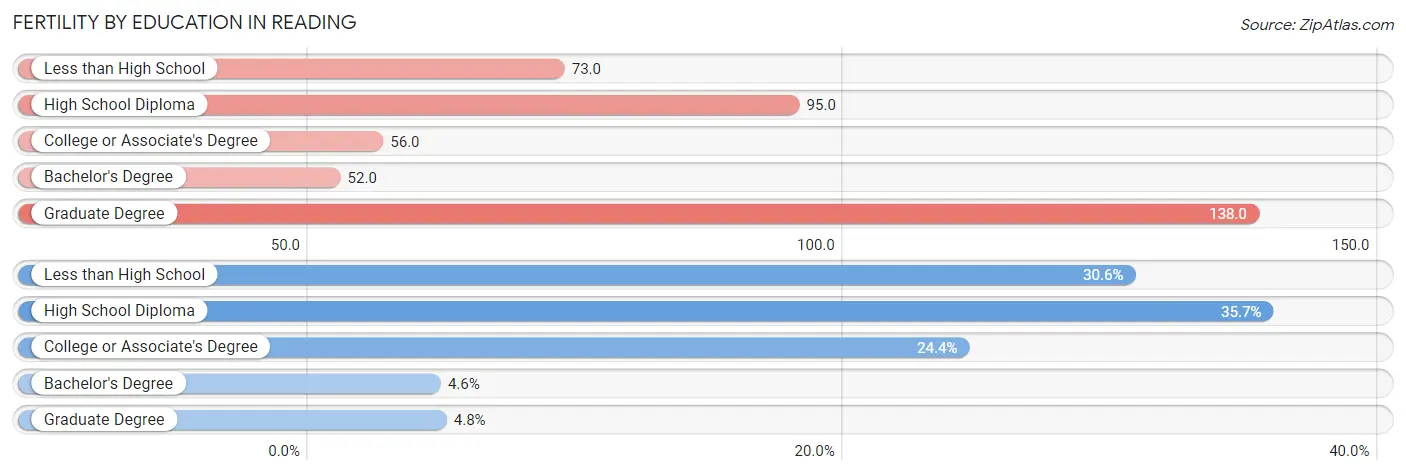
| Educational Attainment | Women with Births | Births / 1,000 Women |
| Less than High School | 550 (30.6%) | 73.0 |
| High School Diploma | 643 (35.7%) | 95.0 |
| College or Associate's Degree | 438 (24.3%) | 56.0 |
| Bachelor's Degree | 82 (4.6%) | 52.0 |
| Graduate Degree | 86 (4.8%) | 138.0 |
| Total | 1,799 (100.0%) | 74.0 |
Fertility by Education by Marriage Status in Reading
66.0% of women with births in Reading are unmarried. Women with the educational attainment of bachelor's degree are most likely to be married with 50.0% of them married at childbirth, while women with the educational attainment of high school diploma are least likely to be married with 73.4% of them unmarried at childbirth.
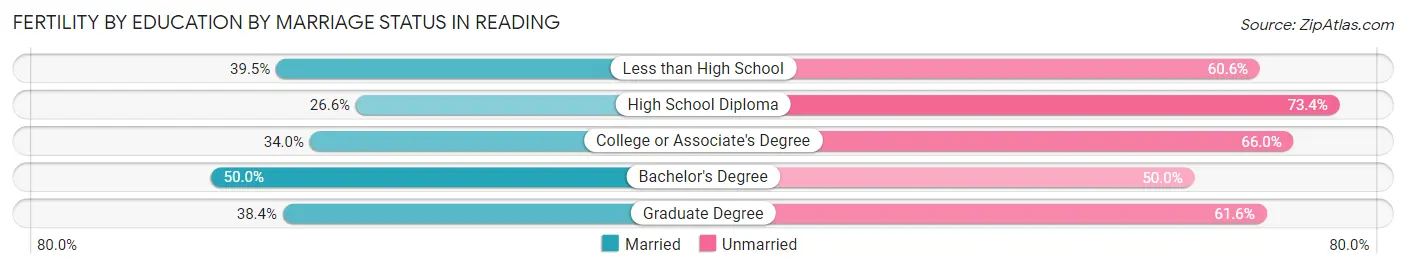
| Educational Attainment | Married | Unmarried |
| Less than High School | 217 (39.5%) | 333 (60.6%) |
| High School Diploma | 171 (26.6%) | 472 (73.4%) |
| College or Associate's Degree | 149 (34.0%) | 289 (66.0%) |
| Bachelor's Degree | 41 (50.0%) | 41 (50.0%) |
| Graduate Degree | 33 (38.4%) | 53 (61.6%) |
| Total | 612 (34.0%) | 1,187 (66.0%) |
Employment Characteristics in Reading
Employment by Class of Employer in Reading
Among the 37,493 employed individuals in Reading, private company employees (29,270 | 78.1%), not-for-profit organizations (3,208 | 8.6%), and local government employees (1,735 | 4.6%) make up the most common classes of employment.
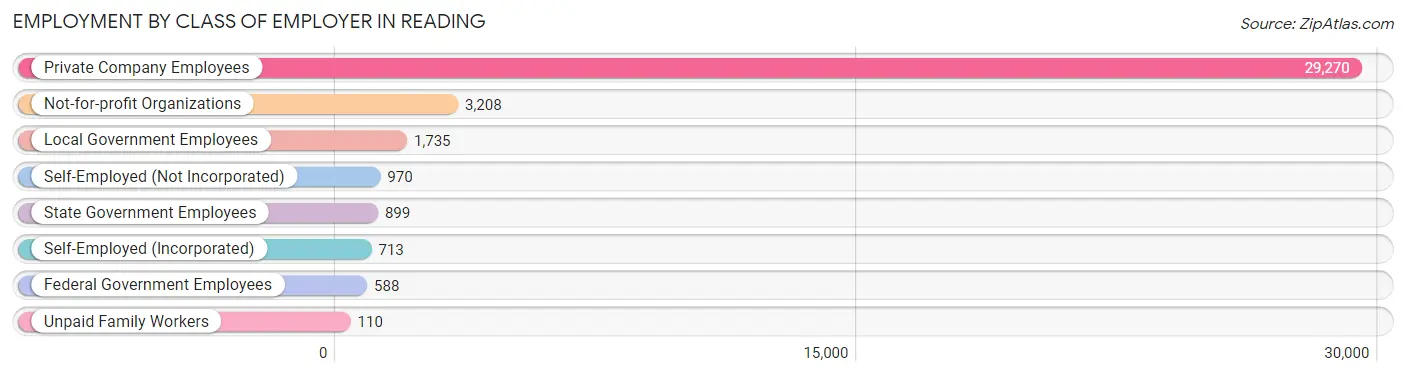
| Employer Class | # Employees | % Employees |
| Private Company Employees | 29,270 | 78.1% |
| Self-Employed (Incorporated) | 713 | 1.9% |
| Self-Employed (Not Incorporated) | 970 | 2.6% |
| Not-for-profit Organizations | 3,208 | 8.6% |
| Local Government Employees | 1,735 | 4.6% |
| State Government Employees | 899 | 2.4% |
| Federal Government Employees | 588 | 1.6% |
| Unpaid Family Workers | 110 | 0.3% |
| Total | 37,493 | 100.0% |
Employment Status by Age in Reading
According to the labor force statistics for Reading, out of the total population over 16 years of age (70,734), 62.0% or 43,855 individuals are in the labor force, with 11.3% or 4,956 of them unemployed. The age group with the highest labor force participation rate is 25 to 29 years, with 77.4% or 5,056 individuals in the labor force. Within the labor force, the 16 to 19 years age range has the highest percentage of unemployed individuals, with 26.5% or 745 of them being unemployed.
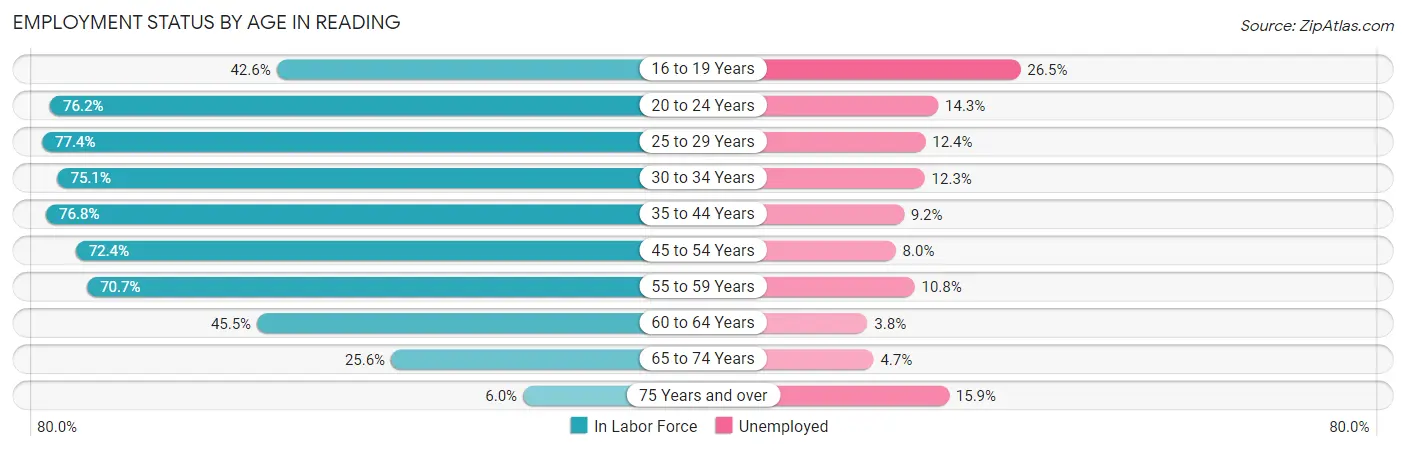
| Age Bracket | In Labor Force | Unemployed |
| 16 to 19 Years | 2,811 (42.6%) | 745 (26.5%) |
| 20 to 24 Years | 6,589 (76.2%) | 942 (14.3%) |
| 25 to 29 Years | 5,056 (77.4%) | 627 (12.4%) |
| 30 to 34 Years | 5,049 (75.1%) | 621 (12.3%) |
| 35 to 44 Years | 8,926 (76.8%) | 821 (9.2%) |
| 45 to 54 Years | 7,773 (72.4%) | 622 (8.0%) |
| 55 to 59 Years | 3,775 (70.7%) | 408 (10.8%) |
| 60 to 64 Years | 2,096 (45.5%) | 80 (3.8%) |
| 65 to 74 Years | 1,550 (25.6%) | 73 (4.7%) |
| 75 Years and over | 232 (6.0%) | 37 (15.9%) |
| Total | 43,855 (62.0%) | 4,956 (11.3%) |
Employment Status by Educational Attainment in Reading
According to labor force statistics for Reading, 71.7% of individuals (32,667) out of the total population between 25 and 64 years of age (45,560) are in the labor force, with 9.7% or 3,169 of them being unemployed. The group with the highest labor force participation rate are those with the educational attainment of bachelor's degree or higher, with 86.1% or 4,335 individuals in the labor force. Within the labor force, individuals with high school diploma education have the highest percentage of unemployment, with 12.5% or 1,564 of them being unemployed.
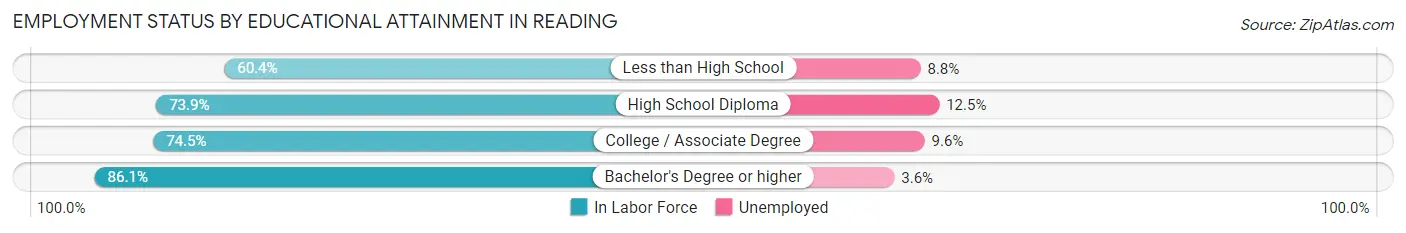
| Educational Attainment | In Labor Force | Unemployed |
| Less than High School | 7,505 (60.4%) | 1,093 (8.8%) |
| High School Diploma | 12,509 (73.9%) | 2,116 (12.5%) |
| College / Associate Degree | 8,324 (74.5%) | 1,073 (9.6%) |
| Bachelor's Degree or higher | 4,335 (86.1%) | 181 (3.6%) |
| Total | 32,667 (71.7%) | 4,419 (9.7%) |
Employment Occupations by Sex in Reading
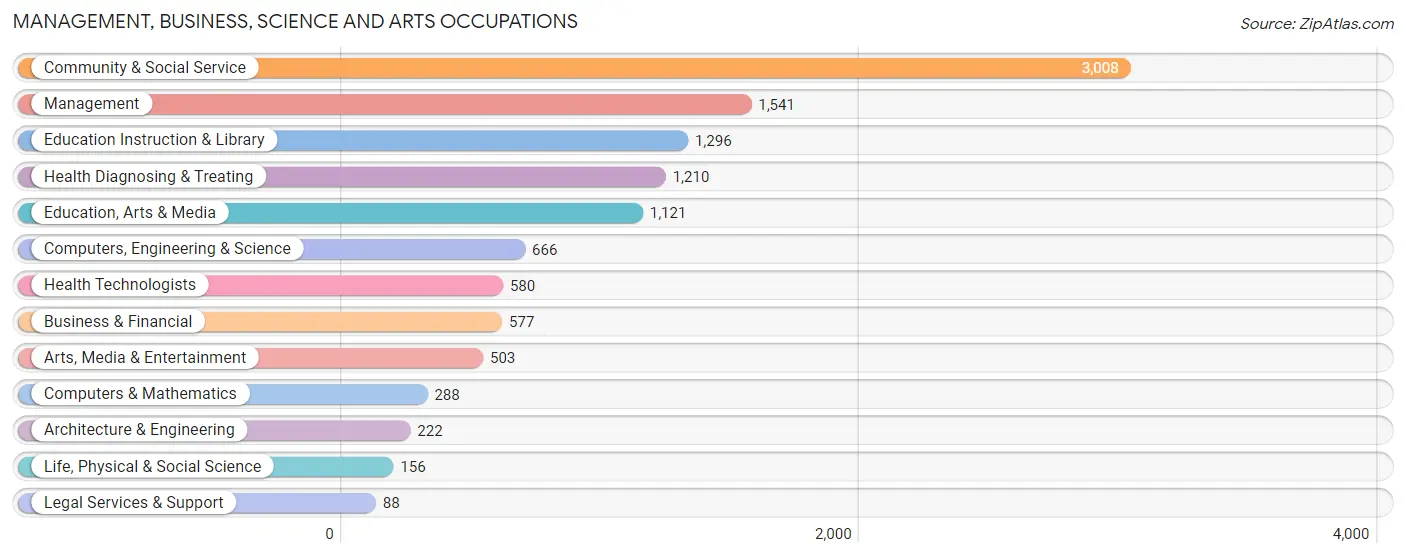
Management, Business, Science and Arts Occupations
The most common Management, Business, Science and Arts occupations in Reading are Community & Social Service (3,008 | 7.7%), Management (1,541 | 4.0%), Education Instruction & Library (1,296 | 3.3%), Health Diagnosing & Treating (1,210 | 3.1%), and Education, Arts & Media (1,121 | 2.9%).
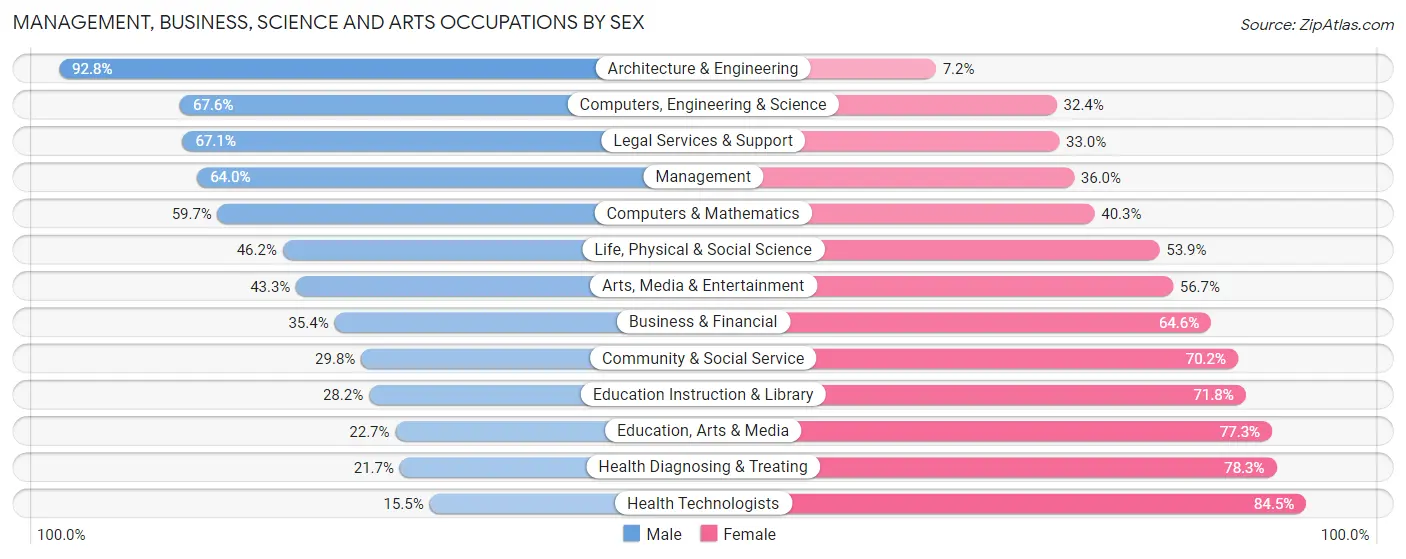
Management, Business, Science and Arts Occupations by Sex
Within the Management, Business, Science and Arts occupations in Reading, the most male-oriented occupations are Architecture & Engineering (92.8%), Computers, Engineering & Science (67.6%), and Legal Services & Support (67.0%), while the most female-oriented occupations are Health Technologists (84.5%), Health Diagnosing & Treating (78.3%), and Education, Arts & Media (77.3%).
| Occupation | Male | Female |
| Management | 986 (64.0%) | 555 (36.0%) |
| Business & Financial | 204 (35.4%) | 373 (64.6%) |
| Computers, Engineering & Science | 450 (67.6%) | 216 (32.4%) |
| Computers & Mathematics | 172 (59.7%) | 116 (40.3%) |
| Architecture & Engineering | 206 (92.8%) | 16 (7.2%) |
| Life, Physical & Social Science | 72 (46.2%) | 84 (53.8%) |
| Community & Social Service | 896 (29.8%) | 2,112 (70.2%) |
| Education, Arts & Media | 254 (22.7%) | 867 (77.3%) |
| Legal Services & Support | 59 (67.0%) | 29 (33.0%) |
| Education Instruction & Library | 365 (28.2%) | 931 (71.8%) |
| Arts, Media & Entertainment | 218 (43.3%) | 285 (56.7%) |
| Health Diagnosing & Treating | 263 (21.7%) | 947 (78.3%) |
| Health Technologists | 90 (15.5%) | 490 (84.5%) |
| Total (Category) | 2,799 (40.0%) | 4,203 (60.0%) |
| Total (Overall) | 20,677 (53.2%) | 18,166 (46.8%) |
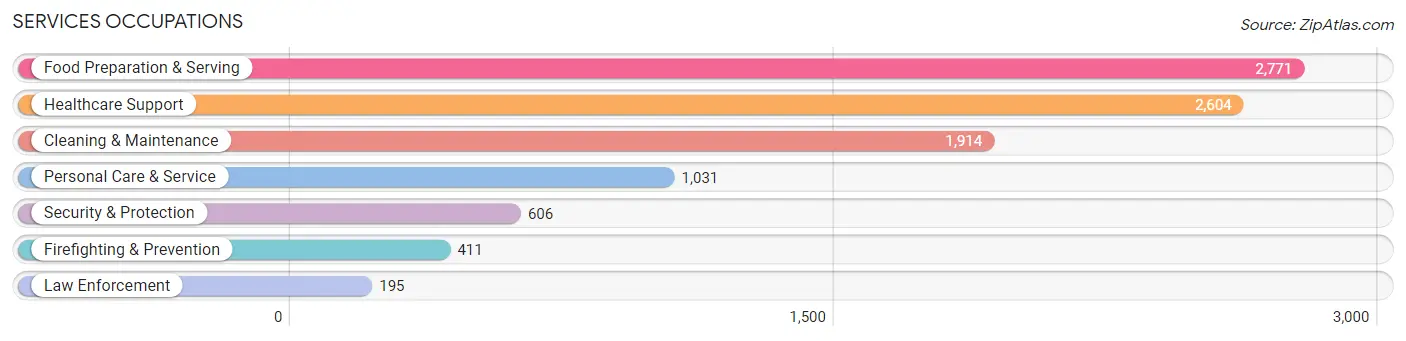
Services Occupations
The most common Services occupations in Reading are Food Preparation & Serving (2,771 | 7.1%), Healthcare Support (2,604 | 6.7%), Cleaning & Maintenance (1,914 | 4.9%), Personal Care & Service (1,031 | 2.6%), and Security & Protection (606 | 1.6%).
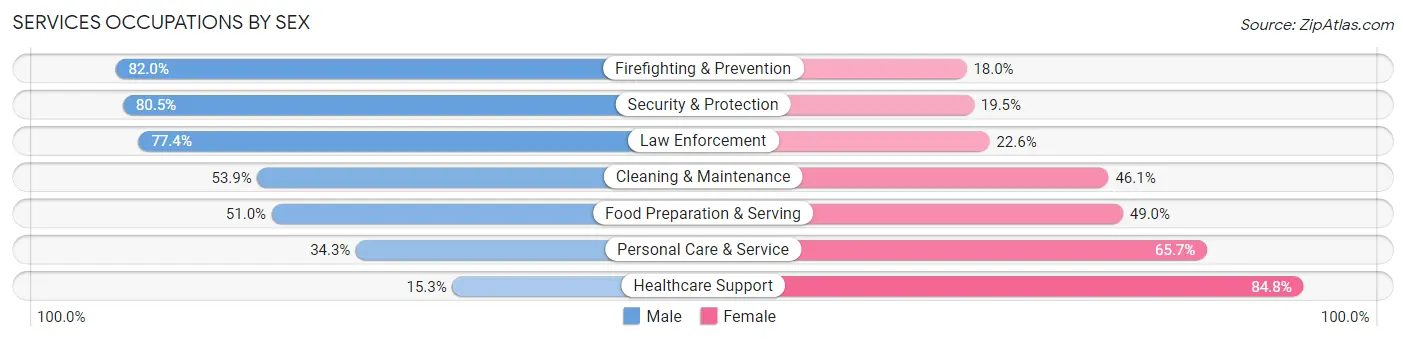
Services Occupations by Sex
Within the Services occupations in Reading, the most male-oriented occupations are Firefighting & Prevention (82.0%), Security & Protection (80.5%), and Law Enforcement (77.4%), while the most female-oriented occupations are Healthcare Support (84.8%), Personal Care & Service (65.7%), and Food Preparation & Serving (49.0%).
| Occupation | Male | Female |
| Healthcare Support | 397 (15.2%) | 2,207 (84.8%) |
| Security & Protection | 488 (80.5%) | 118 (19.5%) |
| Firefighting & Prevention | 337 (82.0%) | 74 (18.0%) |
| Law Enforcement | 151 (77.4%) | 44 (22.6%) |
| Food Preparation & Serving | 1,414 (51.0%) | 1,357 (49.0%) |
| Cleaning & Maintenance | 1,031 (53.9%) | 883 (46.1%) |
| Personal Care & Service | 354 (34.3%) | 677 (65.7%) |
| Total (Category) | 3,684 (41.3%) | 5,242 (58.7%) |
| Total (Overall) | 20,677 (53.2%) | 18,166 (46.8%) |
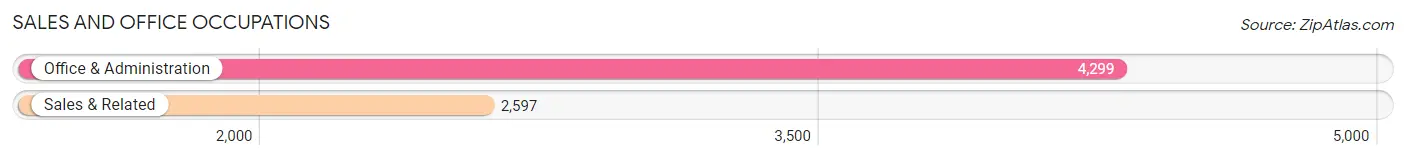
Sales and Office Occupations
The most common Sales and Office occupations in Reading are Office & Administration (4,299 | 11.1%), and Sales & Related (2,597 | 6.7%).
Sales and Office Occupations by Sex
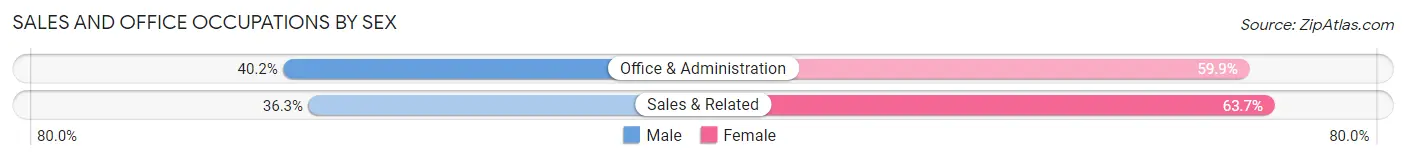
| Occupation | Male | Female |
| Sales & Related | 942 (36.3%) | 1,655 (63.7%) |
| Office & Administration | 1,726 (40.2%) | 2,573 (59.9%) |
| Total (Category) | 2,668 (38.7%) | 4,228 (61.3%) |
| Total (Overall) | 20,677 (53.2%) | 18,166 (46.8%) |
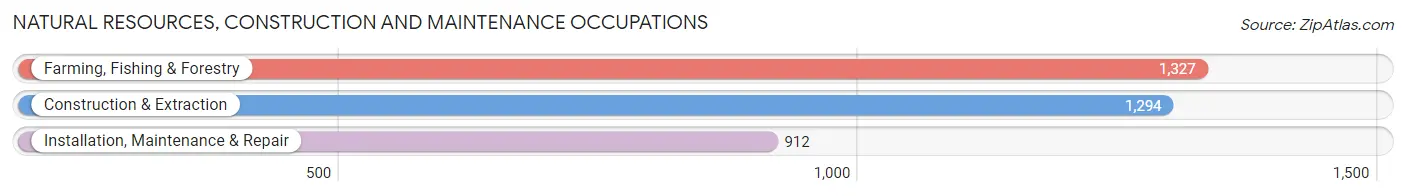
Natural Resources, Construction and Maintenance Occupations
The most common Natural Resources, Construction and Maintenance occupations in Reading are Farming, Fishing & Forestry (1,327 | 3.4%), Construction & Extraction (1,294 | 3.3%), and Installation, Maintenance & Repair (912 | 2.4%).
Natural Resources, Construction and Maintenance Occupations by Sex
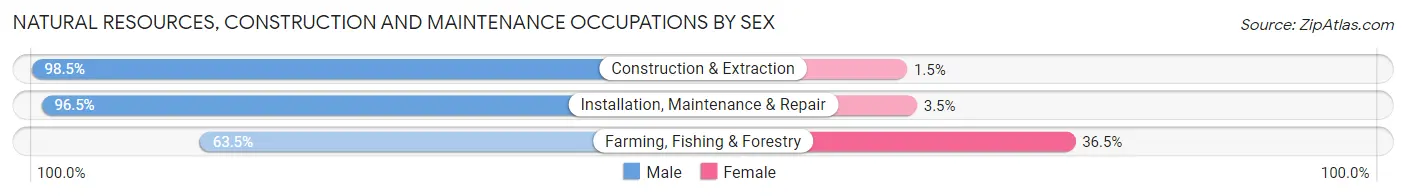
| Occupation | Male | Female |
| Farming, Fishing & Forestry | 843 (63.5%) | 484 (36.5%) |
| Construction & Extraction | 1,275 (98.5%) | 19 (1.5%) |
| Installation, Maintenance & Repair | 880 (96.5%) | 32 (3.5%) |
| Total (Category) | 2,998 (84.9%) | 535 (15.1%) |
| Total (Overall) | 20,677 (53.2%) | 18,166 (46.8%) |
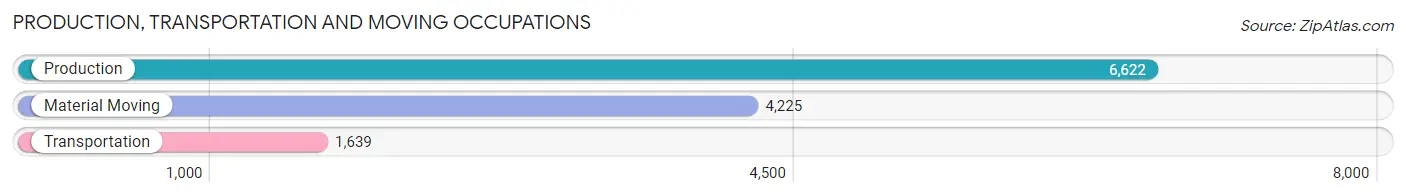
Production, Transportation and Moving Occupations
The most common Production, Transportation and Moving occupations in Reading are Production (6,622 | 17.1%), Material Moving (4,225 | 10.9%), and Transportation (1,639 | 4.2%).
Production, Transportation and Moving Occupations by Sex
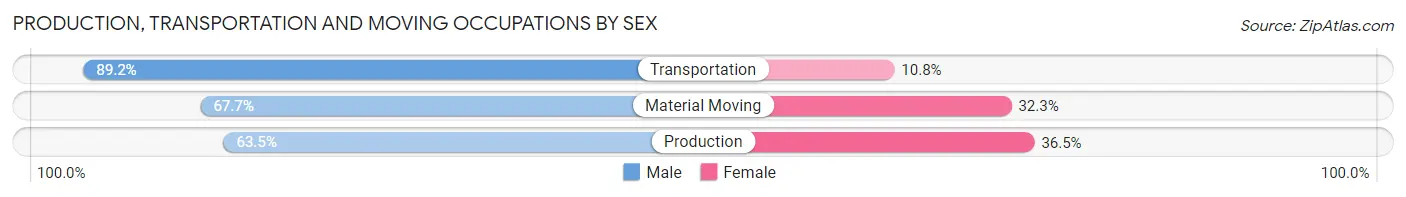
| Occupation | Male | Female |
| Production | 4,205 (63.5%) | 2,417 (36.5%) |
| Transportation | 1,462 (89.2%) | 177 (10.8%) |
| Material Moving | 2,861 (67.7%) | 1,364 (32.3%) |
| Total (Category) | 8,528 (68.3%) | 3,958 (31.7%) |
| Total (Overall) | 20,677 (53.2%) | 18,166 (46.8%) |
Employment Industries by Sex in Reading
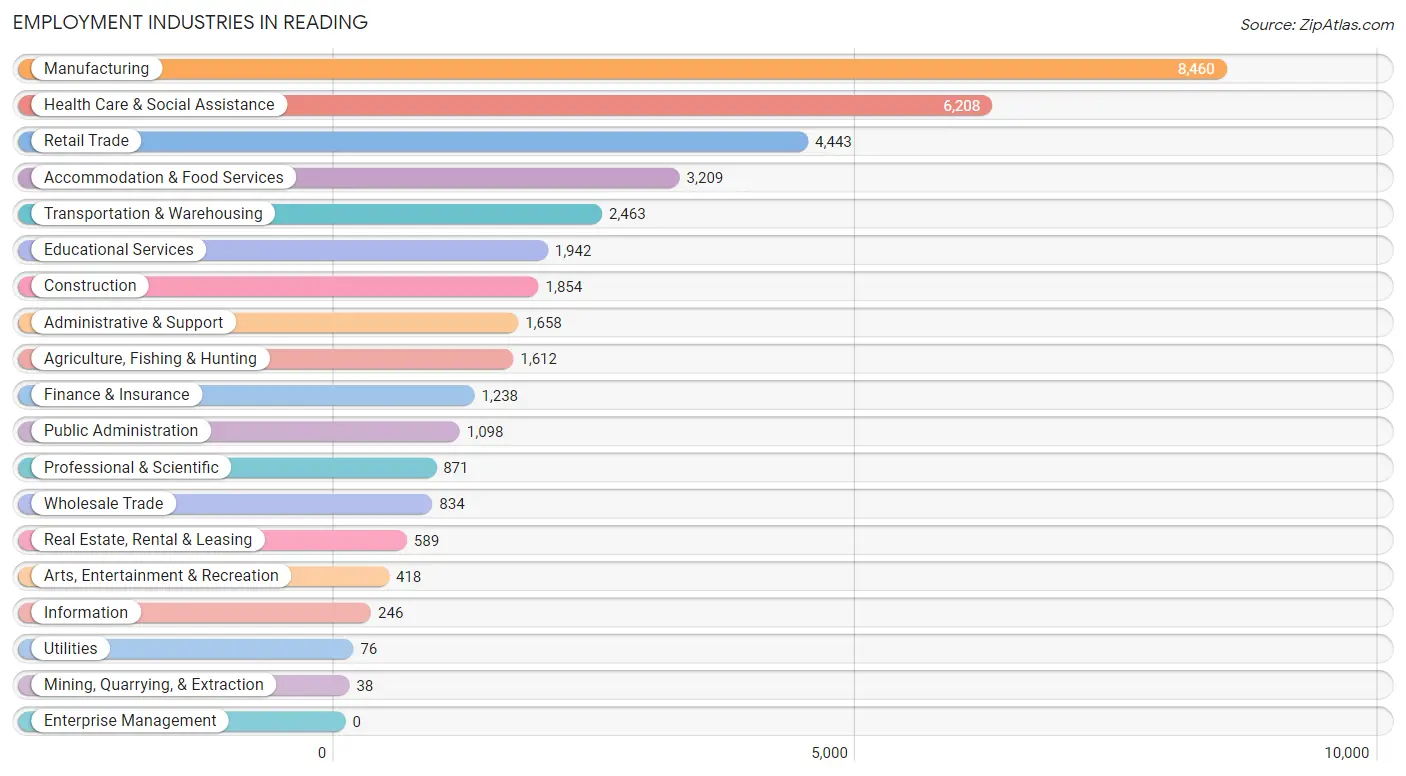
Employment Industries in Reading
The major employment industries in Reading include Manufacturing (8,460 | 21.8%), Health Care & Social Assistance (6,208 | 16.0%), Retail Trade (4,443 | 11.4%), Accommodation & Food Services (3,209 | 8.3%), and Transportation & Warehousing (2,463 | 6.3%).
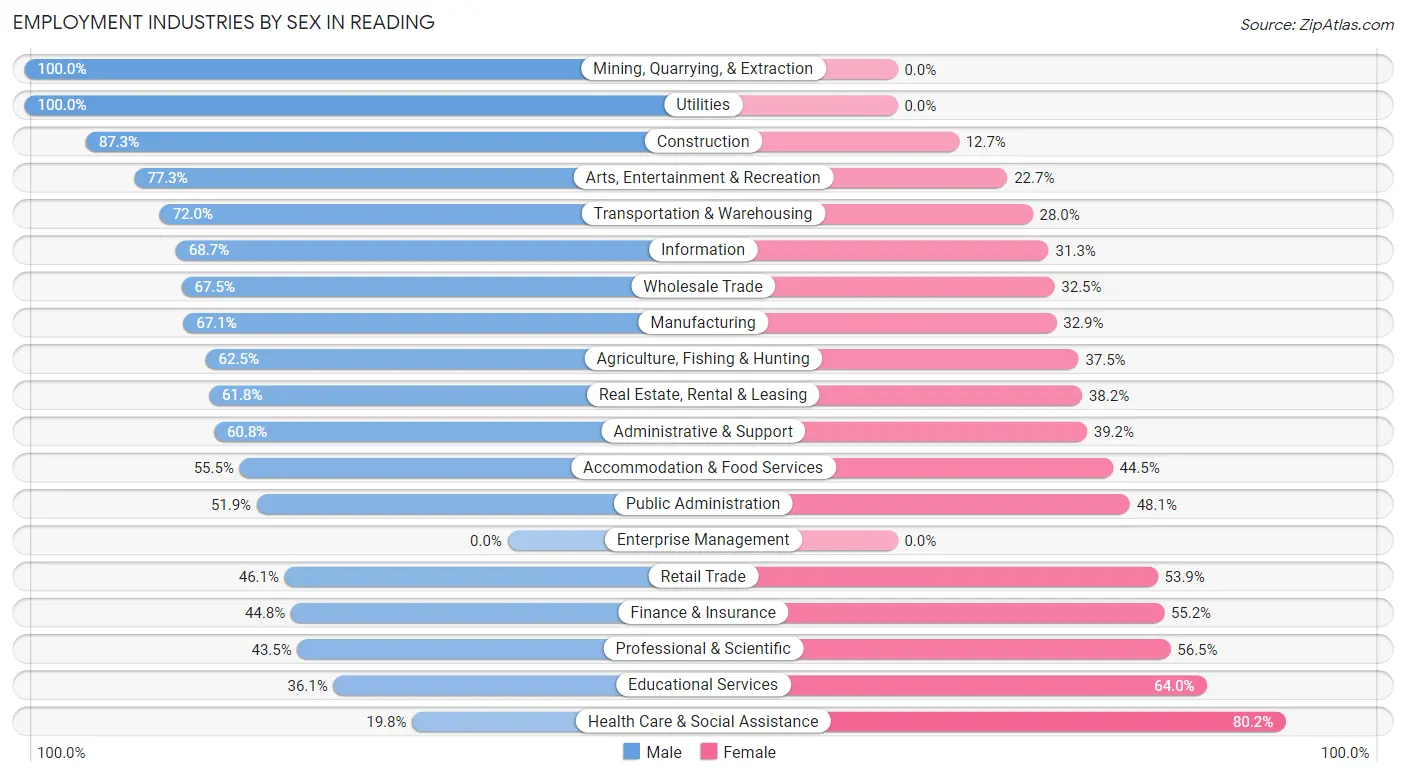
Employment Industries by Sex in Reading
The Reading industries that see more men than women are Mining, Quarrying, & Extraction (100.0%), Utilities (100.0%), and Construction (87.3%), whereas the industries that tend to have a higher number of women are Health Care & Social Assistance (80.2%), Educational Services (63.9%), and Professional & Scientific (56.5%).
| Industry | Male | Female |
| Agriculture, Fishing & Hunting | 1,008 (62.5%) | 604 (37.5%) |
| Mining, Quarrying, & Extraction | 38 (100.0%) | 0 (0.0%) |
| Construction | 1,619 (87.3%) | 235 (12.7%) |
| Manufacturing | 5,678 (67.1%) | 2,782 (32.9%) |
| Wholesale Trade | 563 (67.5%) | 271 (32.5%) |
| Retail Trade | 2,050 (46.1%) | 2,393 (53.9%) |
| Transportation & Warehousing | 1,774 (72.0%) | 689 (28.0%) |
| Utilities | 76 (100.0%) | 0 (0.0%) |
| Information | 169 (68.7%) | 77 (31.3%) |
| Finance & Insurance | 555 (44.8%) | 683 (55.2%) |
| Real Estate, Rental & Leasing | 364 (61.8%) | 225 (38.2%) |
| Professional & Scientific | 379 (43.5%) | 492 (56.5%) |
| Enterprise Management | 0 (0.0%) | 0 (0.0%) |
| Administrative & Support | 1,008 (60.8%) | 650 (39.2%) |
| Educational Services | 700 (36.0%) | 1,242 (63.9%) |
| Health Care & Social Assistance | 1,227 (19.8%) | 4,981 (80.2%) |
| Arts, Entertainment & Recreation | 323 (77.3%) | 95 (22.7%) |
| Accommodation & Food Services | 1,780 (55.5%) | 1,429 (44.5%) |
| Public Administration | 570 (51.9%) | 528 (48.1%) |
| Total | 20,677 (53.2%) | 18,166 (46.8%) |
Education in Reading
School Enrollment in Reading
The most common levels of schooling among the 27,774 students in Reading are middle school (6,836 | 24.6%), high school (6,633 | 23.9%), and college / undergraduate (5,644 | 20.3%).
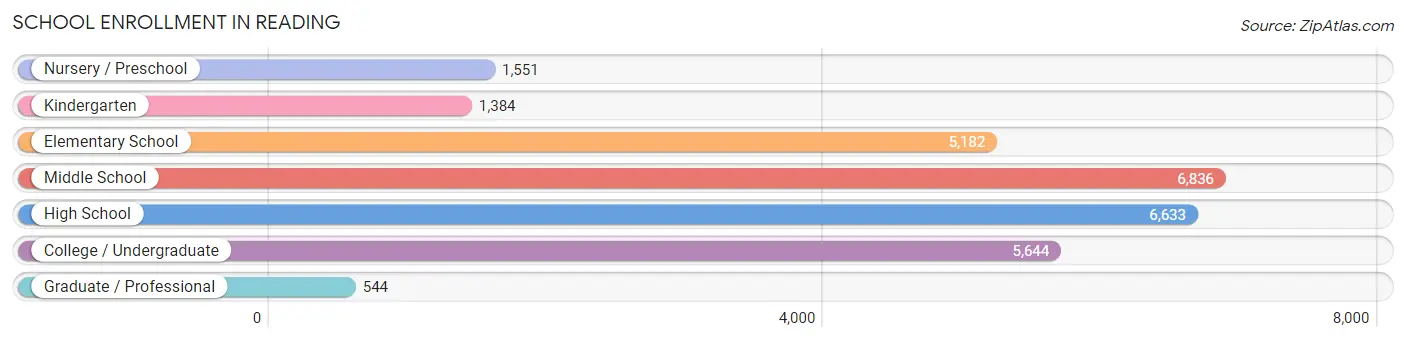
| School Level | # Students | % Students |
| Nursery / Preschool | 1,551 | 5.6% |
| Kindergarten | 1,384 | 5.0% |
| Elementary School | 5,182 | 18.7% |
| Middle School | 6,836 | 24.6% |
| High School | 6,633 | 23.9% |
| College / Undergraduate | 5,644 | 20.3% |
| Graduate / Professional | 544 | 2.0% |
| Total | 27,774 | 100.0% |
School Enrollment by Age by Funding Source in Reading
Out of a total of 27,774 students who are enrolled in schools in Reading, 4,527 (16.3%) attend a private institution, while the remaining 23,247 (83.7%) are enrolled in public schools. The age group of 20 to 24 year olds has the highest likelihood of being enrolled in private schools, with 1,273 (41.7% in the age bracket) enrolled. Conversely, the age group of 10 to 14 year olds has the lowest likelihood of being enrolled in a private school, with 6,958 (91.7% in the age bracket) attending a public institution.
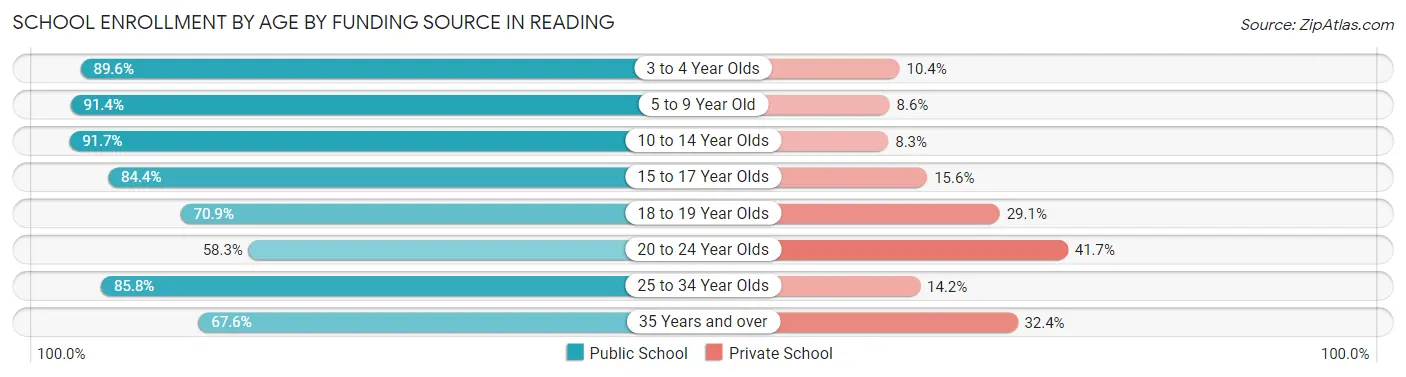
| Age Bracket | Public School | Private School |
| 3 to 4 Year Olds | 877 (89.6%) | 102 (10.4%) |
| 5 to 9 Year Old | 6,278 (91.4%) | 588 (8.6%) |
| 10 to 14 Year Olds | 6,958 (91.7%) | 631 (8.3%) |
| 15 to 17 Year Olds | 3,932 (84.4%) | 725 (15.6%) |
| 18 to 19 Year Olds | 1,796 (70.9%) | 736 (29.1%) |
| 20 to 24 Year Olds | 1,777 (58.3%) | 1,273 (41.7%) |
| 25 to 34 Year Olds | 1,031 (85.8%) | 171 (14.2%) |
| 35 Years and over | 608 (67.6%) | 291 (32.4%) |
| Total | 23,247 (83.7%) | 4,527 (16.3%) |
Educational Attainment by Field of Study in Reading
Business (1,255 | 17.6%), education (1,085 | 15.2%), social sciences (673 | 9.5%), science & technology (629 | 8.8%), and psychology (563 | 7.9%) are the most common fields of study among 7,121 individuals in Reading who have obtained a bachelor's degree or higher.
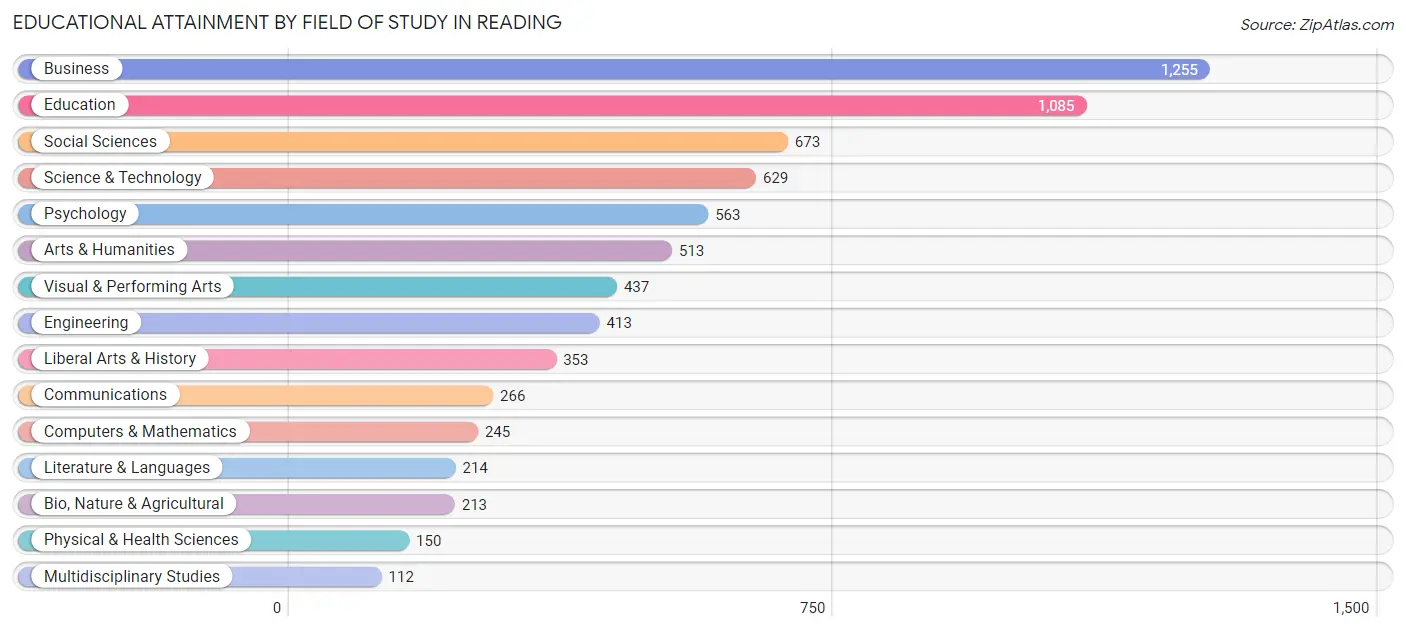
| Field of Study | # Graduates | % Graduates |
| Computers & Mathematics | 245 | 3.4% |
| Bio, Nature & Agricultural | 213 | 3.0% |
| Physical & Health Sciences | 150 | 2.1% |
| Psychology | 563 | 7.9% |
| Social Sciences | 673 | 9.5% |
| Engineering | 413 | 5.8% |
| Multidisciplinary Studies | 112 | 1.6% |
| Science & Technology | 629 | 8.8% |
| Business | 1,255 | 17.6% |
| Education | 1,085 | 15.2% |
| Literature & Languages | 214 | 3.0% |
| Liberal Arts & History | 353 | 5.0% |
| Visual & Performing Arts | 437 | 6.1% |
| Communications | 266 | 3.7% |
| Arts & Humanities | 513 | 7.2% |
| Total | 7,121 | 100.0% |
Transportation & Commute in Reading
Vehicle Availability by Sex in Reading
The most prevalent vehicle ownership categories in Reading are males with 1 vehicle (6,949, accounting for 35.5%) and females with 1 vehicle (6,069, making up 41.4%).
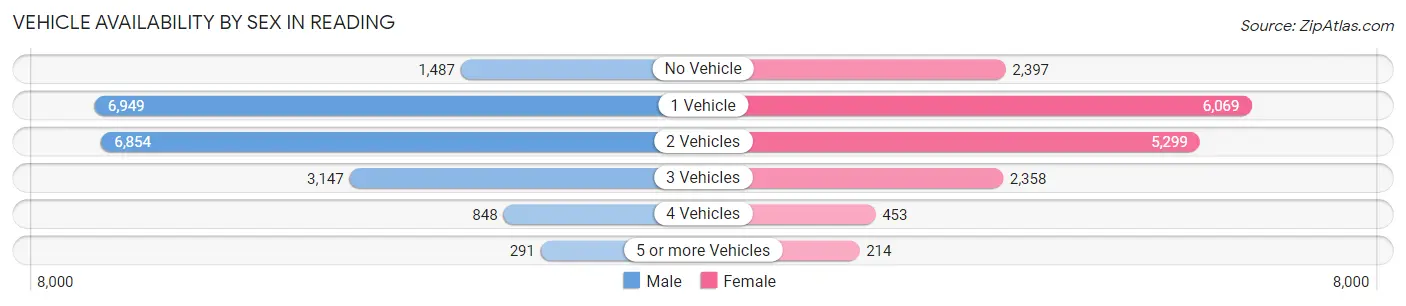
| Vehicles Available | Male | Female |
| No Vehicle | 1,487 (7.6%) | 2,397 (14.3%) |
| 1 Vehicle | 6,949 (35.5%) | 6,069 (36.1%) |
| 2 Vehicles | 6,854 (35.0%) | 5,299 (31.6%) |
| 3 Vehicles | 3,147 (16.1%) | 2,358 (14.0%) |
| 4 Vehicles | 848 (4.3%) | 453 (2.7%) |
| 5 or more Vehicles | 291 (1.5%) | 214 (1.3%) |
| Total | 19,576 (100.0%) | 16,790 (100.0%) |
Commute Time in Reading
The most frequently occuring commute durations in Reading are 15 to 19 minutes (6,995 commuters, 19.5%), 10 to 14 minutes (6,550 commuters, 18.2%), and 20 to 24 minutes (5,643 commuters, 15.7%).
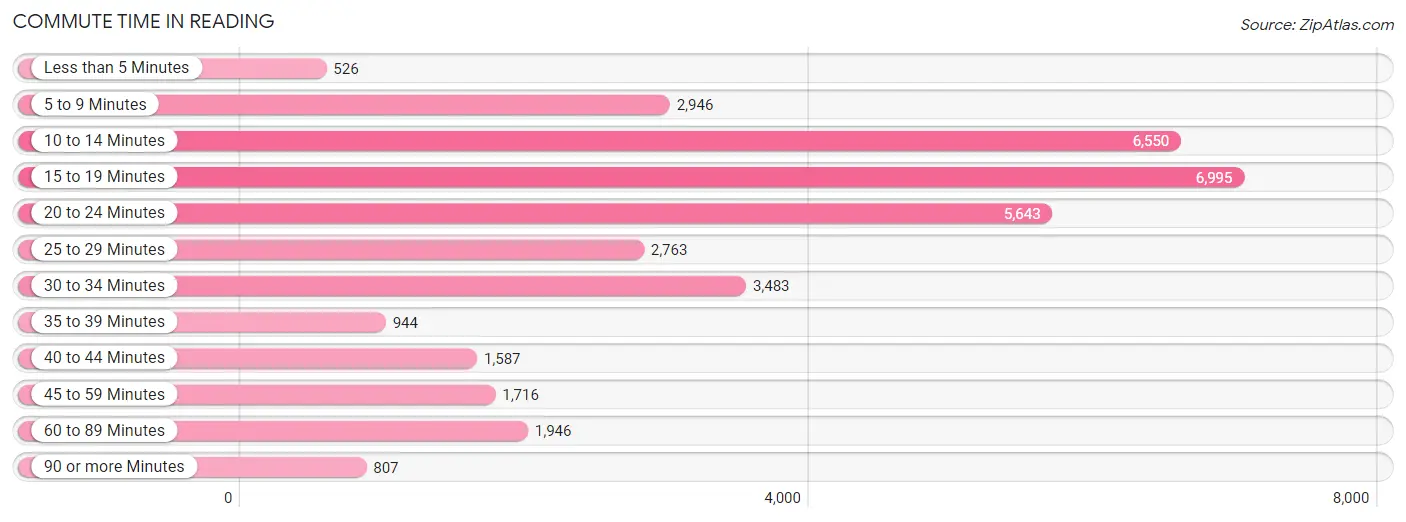
| Commute Time | # Commuters | % Commuters |
| Less than 5 Minutes | 526 | 1.5% |
| 5 to 9 Minutes | 2,946 | 8.2% |
| 10 to 14 Minutes | 6,550 | 18.2% |
| 15 to 19 Minutes | 6,995 | 19.5% |
| 20 to 24 Minutes | 5,643 | 15.7% |
| 25 to 29 Minutes | 2,763 | 7.7% |
| 30 to 34 Minutes | 3,483 | 9.7% |
| 35 to 39 Minutes | 944 | 2.6% |
| 40 to 44 Minutes | 1,587 | 4.4% |
| 45 to 59 Minutes | 1,716 | 4.8% |
| 60 to 89 Minutes | 1,946 | 5.4% |
| 90 or more Minutes | 807 | 2.2% |
Commute Time by Sex in Reading
The most common commute times in Reading are 15 to 19 minutes (3,703 commuters, 19.2%) for males and 10 to 14 minutes (3,534 commuters, 21.3%) for females.
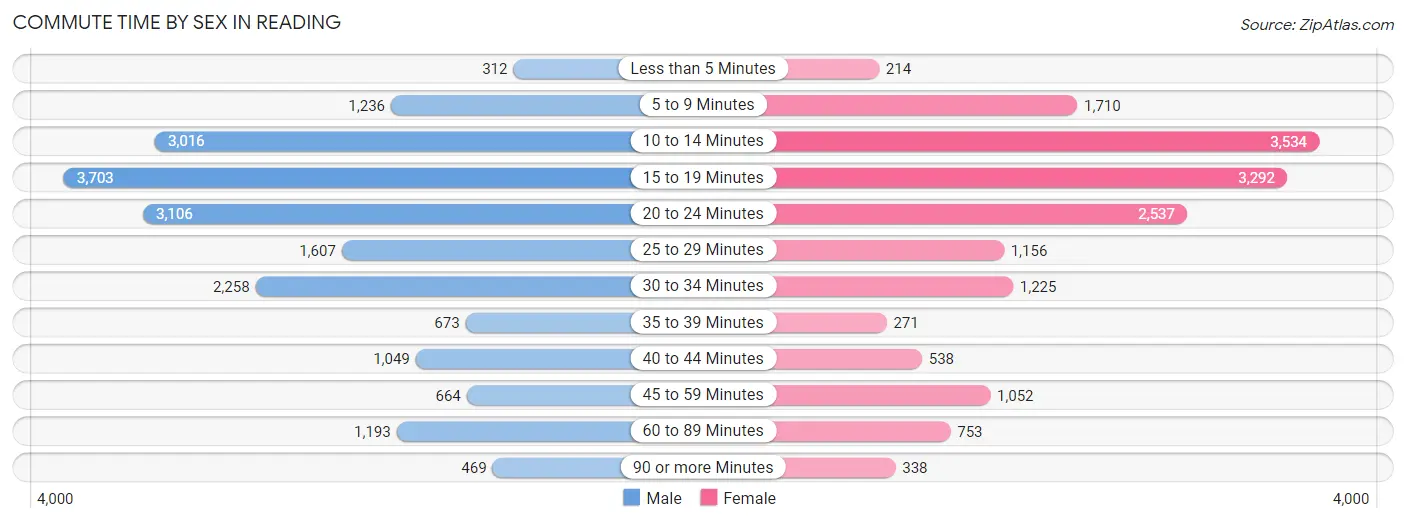
| Commute Time | Male | Female |
| Less than 5 Minutes | 312 (1.6%) | 214 (1.3%) |
| 5 to 9 Minutes | 1,236 (6.4%) | 1,710 (10.3%) |
| 10 to 14 Minutes | 3,016 (15.6%) | 3,534 (21.3%) |
| 15 to 19 Minutes | 3,703 (19.2%) | 3,292 (19.8%) |
| 20 to 24 Minutes | 3,106 (16.1%) | 2,537 (15.3%) |
| 25 to 29 Minutes | 1,607 (8.3%) | 1,156 (7.0%) |
| 30 to 34 Minutes | 2,258 (11.7%) | 1,225 (7.4%) |
| 35 to 39 Minutes | 673 (3.5%) | 271 (1.6%) |
| 40 to 44 Minutes | 1,049 (5.4%) | 538 (3.2%) |
| 45 to 59 Minutes | 664 (3.4%) | 1,052 (6.3%) |
| 60 to 89 Minutes | 1,193 (6.2%) | 753 (4.5%) |
| 90 or more Minutes | 469 (2.4%) | 338 (2.0%) |
Time of Departure to Work by Sex in Reading
The most frequent times of departure to work in Reading are 12:00 AM to 4:59 AM (2,953, 15.3%) for males and 4:00 PM to 11:59 PM (2,134, 12.8%) for females.
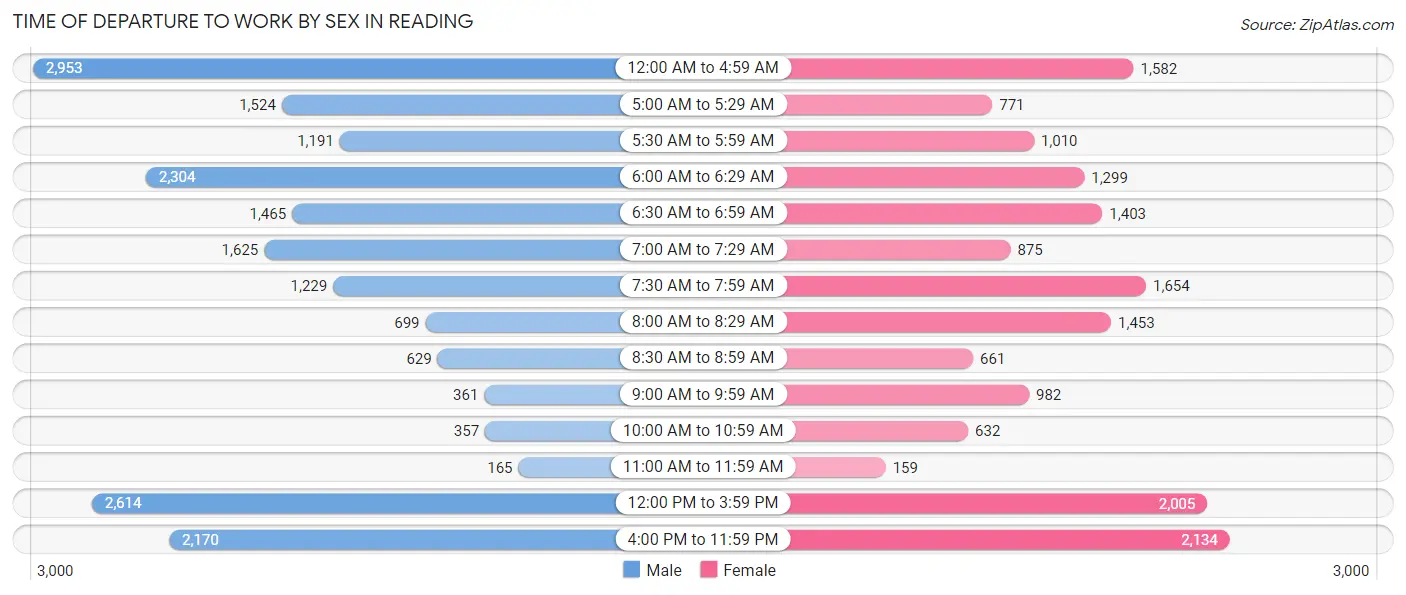
| Time of Departure | Male | Female |
| 12:00 AM to 4:59 AM | 2,953 (15.3%) | 1,582 (9.5%) |
| 5:00 AM to 5:29 AM | 1,524 (7.9%) | 771 (4.6%) |
| 5:30 AM to 5:59 AM | 1,191 (6.2%) | 1,010 (6.1%) |
| 6:00 AM to 6:29 AM | 2,304 (11.9%) | 1,299 (7.8%) |
| 6:30 AM to 6:59 AM | 1,465 (7.6%) | 1,403 (8.4%) |
| 7:00 AM to 7:29 AM | 1,625 (8.4%) | 875 (5.3%) |
| 7:30 AM to 7:59 AM | 1,229 (6.4%) | 1,654 (10.0%) |
| 8:00 AM to 8:29 AM | 699 (3.6%) | 1,453 (8.7%) |
| 8:30 AM to 8:59 AM | 629 (3.3%) | 661 (4.0%) |
| 9:00 AM to 9:59 AM | 361 (1.9%) | 982 (5.9%) |
| 10:00 AM to 10:59 AM | 357 (1.8%) | 632 (3.8%) |
| 11:00 AM to 11:59 AM | 165 (0.9%) | 159 (1.0%) |
| 12:00 PM to 3:59 PM | 2,614 (13.6%) | 2,005 (12.1%) |
| 4:00 PM to 11:59 PM | 2,170 (11.3%) | 2,134 (12.8%) |
| Total | 19,286 (100.0%) | 16,620 (100.0%) |
Housing Occupancy in Reading
Occupancy by Ownership in Reading
Of the total 32,692 dwellings in Reading, owner-occupied units account for 12,838 (39.3%), while renter-occupied units make up 19,854 (60.7%).
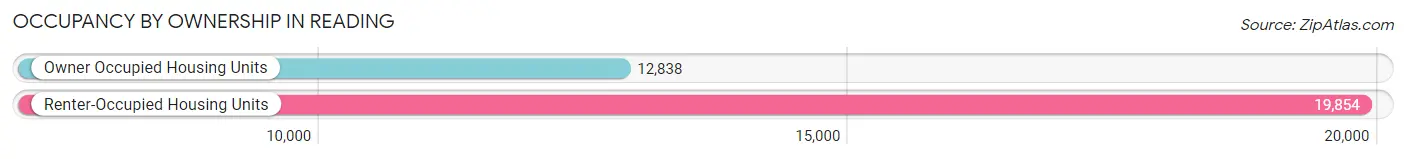
| Occupancy | # Housing Units | % Housing Units |
| Owner Occupied Housing Units | 12,838 | 39.3% |
| Renter-Occupied Housing Units | 19,854 | 60.7% |
| Total Occupied Housing Units | 32,692 | 100.0% |
Occupancy by Household Size in Reading
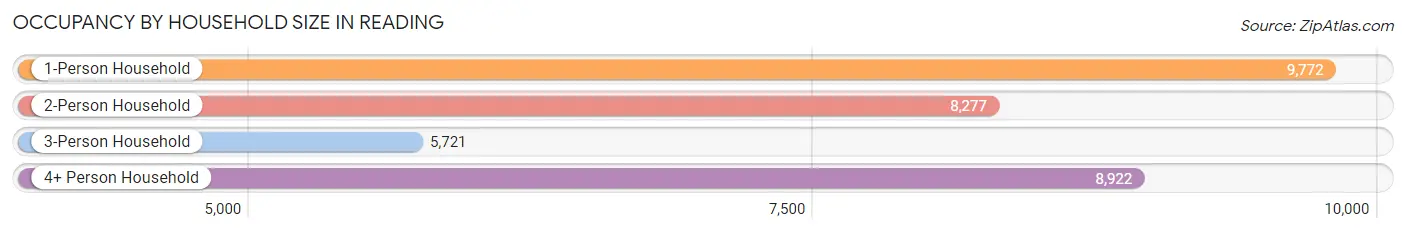
| Household Size | # Housing Units | % Housing Units |
| 1-Person Household | 9,772 | 29.9% |
| 2-Person Household | 8,277 | 25.3% |
| 3-Person Household | 5,721 | 17.5% |
| 4+ Person Household | 8,922 | 27.3% |
| Total Housing Units | 32,692 | 100.0% |
Occupancy by Ownership by Household Size in Reading
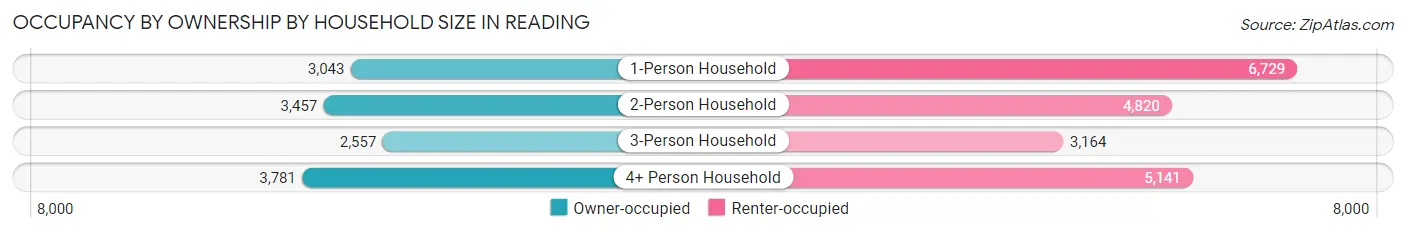
| Household Size | Owner-occupied | Renter-occupied |
| 1-Person Household | 3,043 (31.1%) | 6,729 (68.9%) |
| 2-Person Household | 3,457 (41.8%) | 4,820 (58.2%) |
| 3-Person Household | 2,557 (44.7%) | 3,164 (55.3%) |
| 4+ Person Household | 3,781 (42.4%) | 5,141 (57.6%) |
| Total Housing Units | 12,838 (39.3%) | 19,854 (60.7%) |
Occupancy by Educational Attainment in Reading
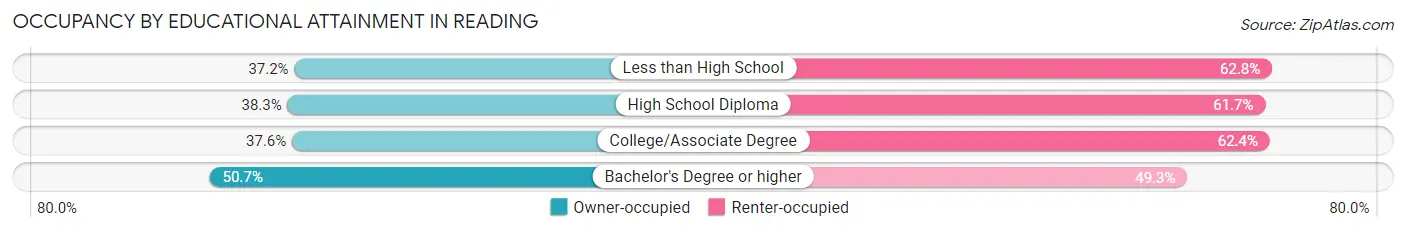
| Household Size | Owner-occupied | Renter-occupied |
| Less than High School | 3,266 (37.2%) | 5,513 (62.8%) |
| High School Diploma | 4,523 (38.3%) | 7,289 (61.7%) |
| College/Associate Degree | 3,104 (37.6%) | 5,158 (62.4%) |
| Bachelor's Degree or higher | 1,945 (50.7%) | 1,894 (49.3%) |
Occupancy by Age of Householder in Reading
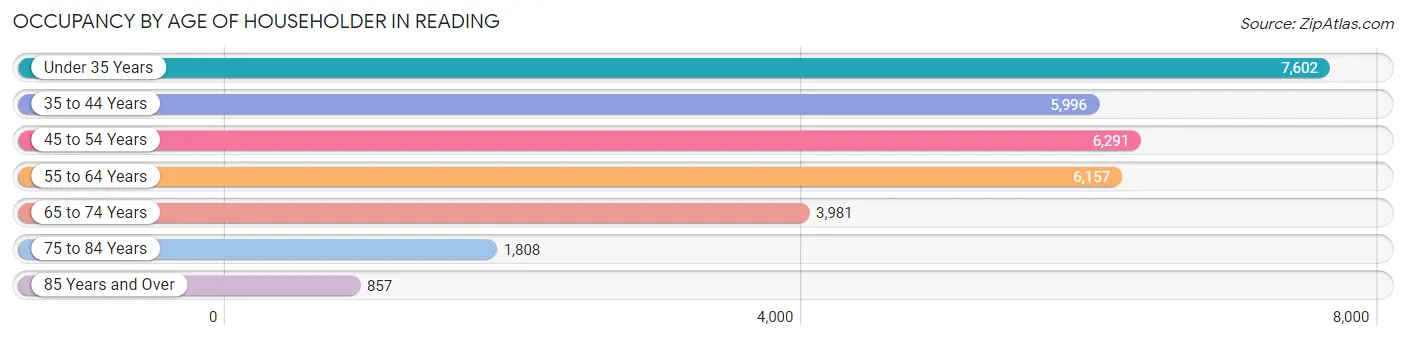
| Age Bracket | # Households | % Households |
| Under 35 Years | 7,602 | 23.3% |
| 35 to 44 Years | 5,996 | 18.3% |
| 45 to 54 Years | 6,291 | 19.2% |
| 55 to 64 Years | 6,157 | 18.8% |
| 65 to 74 Years | 3,981 | 12.2% |
| 75 to 84 Years | 1,808 | 5.5% |
| 85 Years and Over | 857 | 2.6% |
| Total | 32,692 | 100.0% |
Housing Finances in Reading
Median Income by Occupancy in Reading
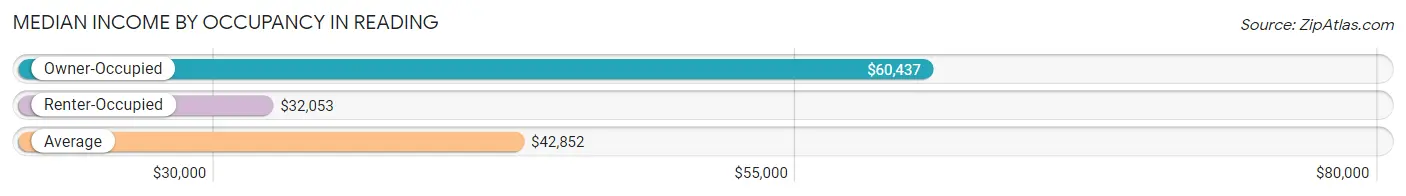
| Occupancy Type | # Households | Median Income |
| Owner-Occupied | 12,838 (39.3%) | $60,437 |
| Renter-Occupied | 19,854 (60.7%) | $32,053 |
| Average | 32,692 (100.0%) | $42,852 |
Occupancy by Householder Income Bracket in Reading
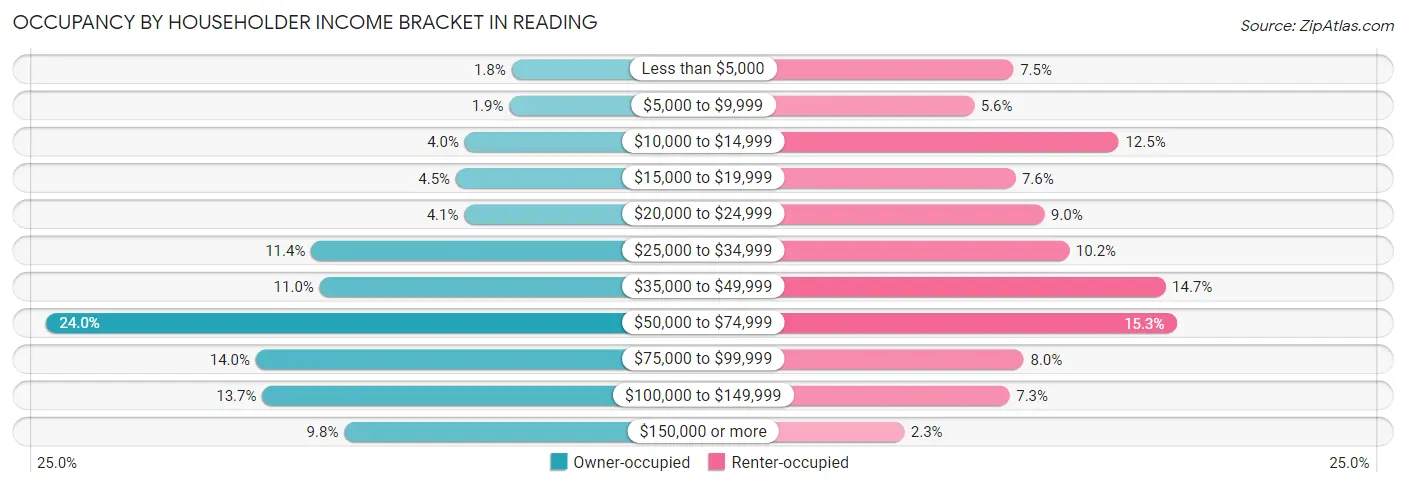
| Income Bracket | Owner-occupied | Renter-occupied |
| Less than $5,000 | 232 (1.8%) | 1,491 (7.5%) |
| $5,000 to $9,999 | 247 (1.9%) | 1,117 (5.6%) |
| $10,000 to $14,999 | 519 (4.0%) | 2,485 (12.5%) |
| $15,000 to $19,999 | 572 (4.5%) | 1,507 (7.6%) |
| $20,000 to $24,999 | 521 (4.1%) | 1,780 (9.0%) |
| $25,000 to $34,999 | 1,457 (11.4%) | 2,017 (10.2%) |
| $35,000 to $49,999 | 1,406 (11.0%) | 2,927 (14.7%) |
| $50,000 to $74,999 | 3,076 (24.0%) | 3,032 (15.3%) |
| $75,000 to $99,999 | 1,796 (14.0%) | 1,588 (8.0%) |
| $100,000 to $149,999 | 1,756 (13.7%) | 1,453 (7.3%) |
| $150,000 or more | 1,256 (9.8%) | 457 (2.3%) |
| Total | 12,838 (100.0%) | 19,854 (100.0%) |
Monthly Housing Cost Tiers in Reading
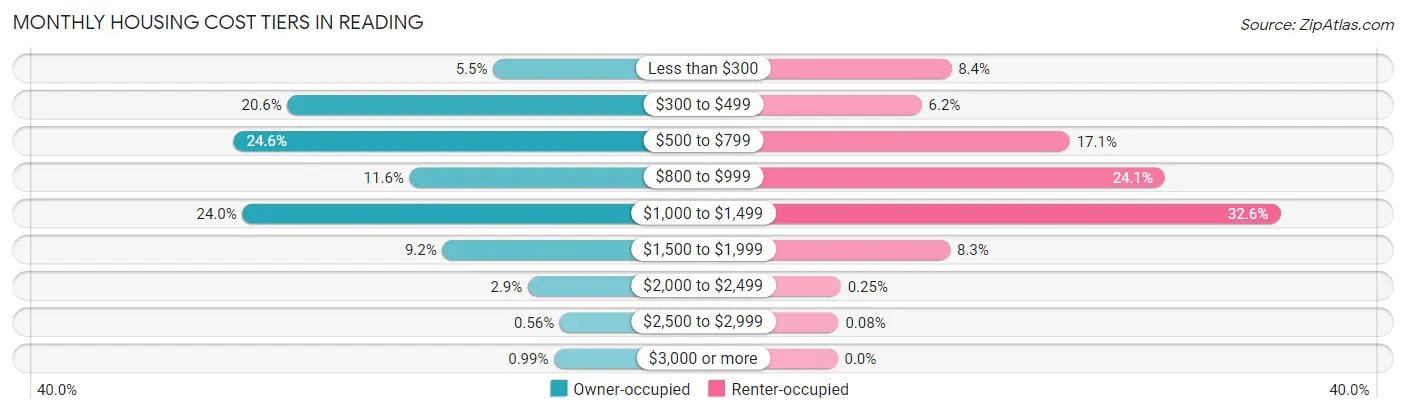
| Monthly Cost | Owner-occupied | Renter-occupied |
| Less than $300 | 703 (5.5%) | 1,663 (8.4%) |
| $300 to $499 | 2,649 (20.6%) | 1,231 (6.2%) |
| $500 to $799 | 3,159 (24.6%) | 3,398 (17.1%) |
| $800 to $999 | 1,494 (11.6%) | 4,786 (24.1%) |
| $1,000 to $1,499 | 3,075 (23.9%) | 6,470 (32.6%) |
| $1,500 to $1,999 | 1,184 (9.2%) | 1,646 (8.3%) |
| $2,000 to $2,499 | 375 (2.9%) | 50 (0.3%) |
| $2,500 to $2,999 | 72 (0.6%) | 16 (0.1%) |
| $3,000 or more | 127 (1.0%) | 0 (0.0%) |
| Total | 12,838 (100.0%) | 19,854 (100.0%) |
Physical Housing Characteristics in Reading
Housing Structures in Reading
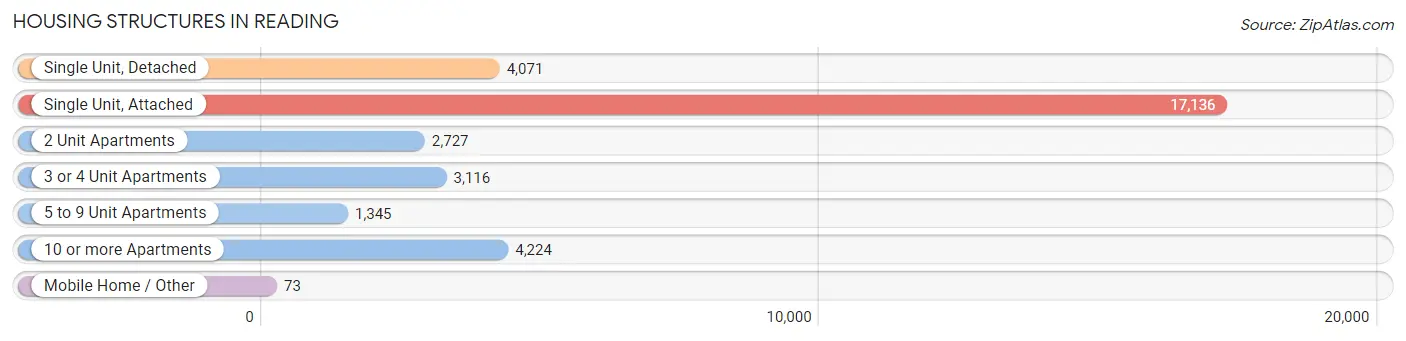
| Structure Type | # Housing Units | % Housing Units |
| Single Unit, Detached | 4,071 | 12.4% |
| Single Unit, Attached | 17,136 | 52.4% |
| 2 Unit Apartments | 2,727 | 8.3% |
| 3 or 4 Unit Apartments | 3,116 | 9.5% |
| 5 to 9 Unit Apartments | 1,345 | 4.1% |
| 10 or more Apartments | 4,224 | 12.9% |
| Mobile Home / Other | 73 | 0.2% |
| Total | 32,692 | 100.0% |
Housing Structures by Occupancy in Reading
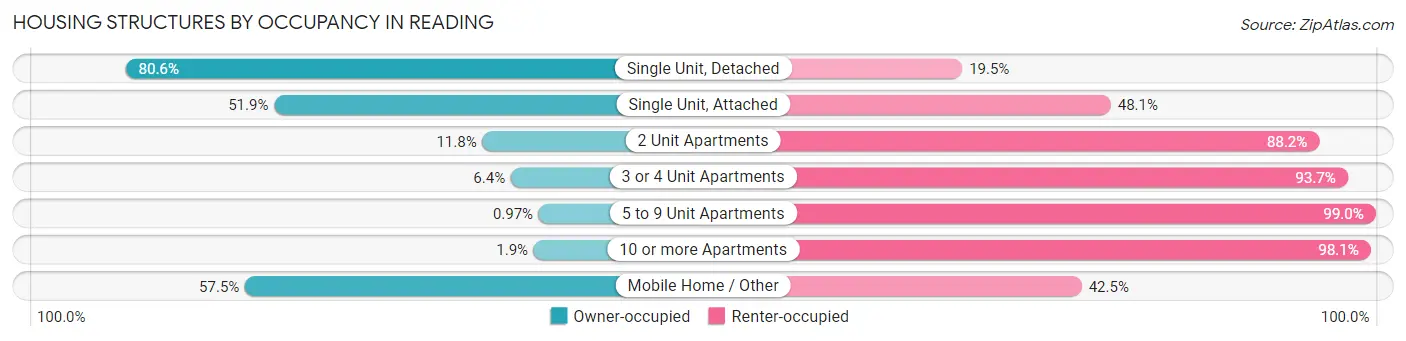
| Structure Type | Owner-occupied | Renter-occupied |
| Single Unit, Detached | 3,279 (80.5%) | 792 (19.5%) |
| Single Unit, Attached | 8,901 (51.9%) | 8,235 (48.1%) |
| 2 Unit Apartments | 323 (11.8%) | 2,404 (88.2%) |
| 3 or 4 Unit Apartments | 198 (6.4%) | 2,918 (93.6%) |
| 5 to 9 Unit Apartments | 13 (1.0%) | 1,332 (99.0%) |
| 10 or more Apartments | 82 (1.9%) | 4,142 (98.1%) |
| Mobile Home / Other | 42 (57.5%) | 31 (42.5%) |
| Total | 12,838 (39.3%) | 19,854 (60.7%) |
Housing Structures by Number of Rooms in Reading
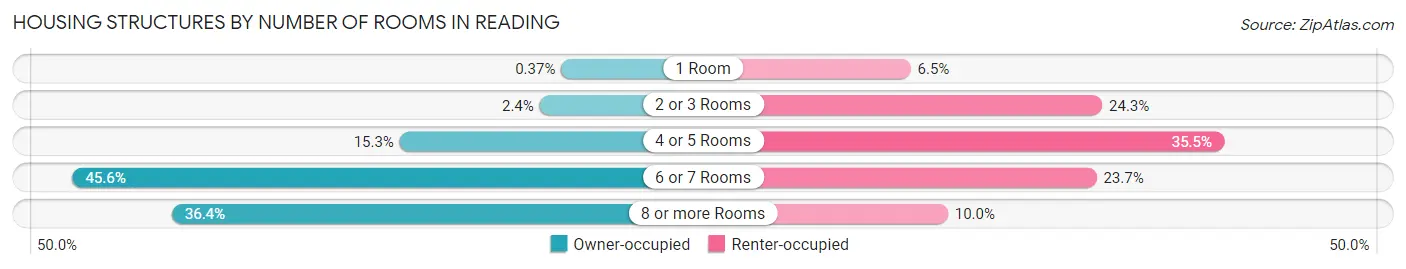
| Number of Rooms | Owner-occupied | Renter-occupied |
| 1 Room | 48 (0.4%) | 1,298 (6.5%) |
| 2 or 3 Rooms | 304 (2.4%) | 4,815 (24.2%) |
| 4 or 5 Rooms | 1,965 (15.3%) | 7,049 (35.5%) |
| 6 or 7 Rooms | 5,850 (45.6%) | 4,711 (23.7%) |
| 8 or more Rooms | 4,671 (36.4%) | 1,981 (10.0%) |
| Total | 12,838 (100.0%) | 19,854 (100.0%) |
Housing Structure by Heating Type in Reading
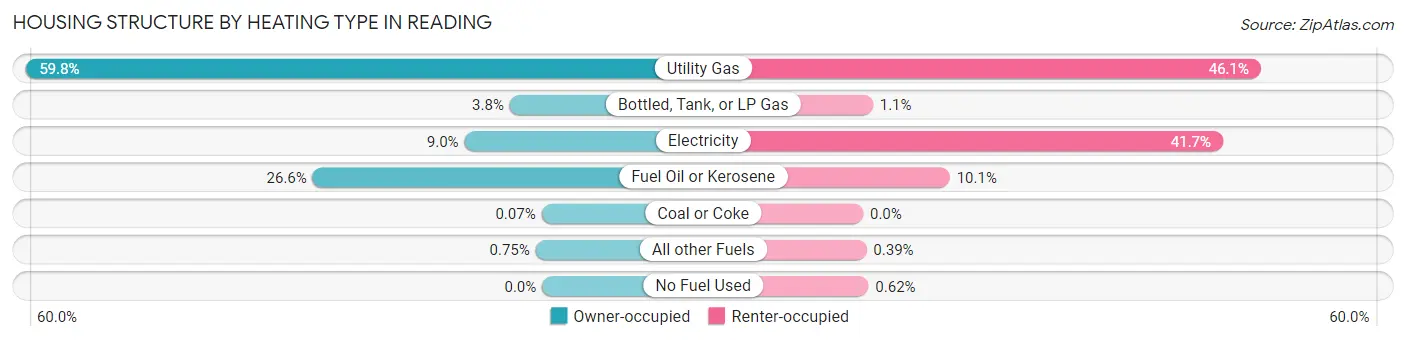
| Heating Type | Owner-occupied | Renter-occupied |
| Utility Gas | 7,678 (59.8%) | 9,154 (46.1%) |
| Bottled, Tank, or LP Gas | 482 (3.7%) | 224 (1.1%) |
| Electricity | 1,157 (9.0%) | 8,281 (41.7%) |
| Fuel Oil or Kerosene | 3,416 (26.6%) | 1,995 (10.1%) |
| Coal or Coke | 9 (0.1%) | 0 (0.0%) |
| All other Fuels | 96 (0.7%) | 77 (0.4%) |
| No Fuel Used | 0 (0.0%) | 123 (0.6%) |
| Total | 12,838 (100.0%) | 19,854 (100.0%) |
Household Vehicle Usage in Reading
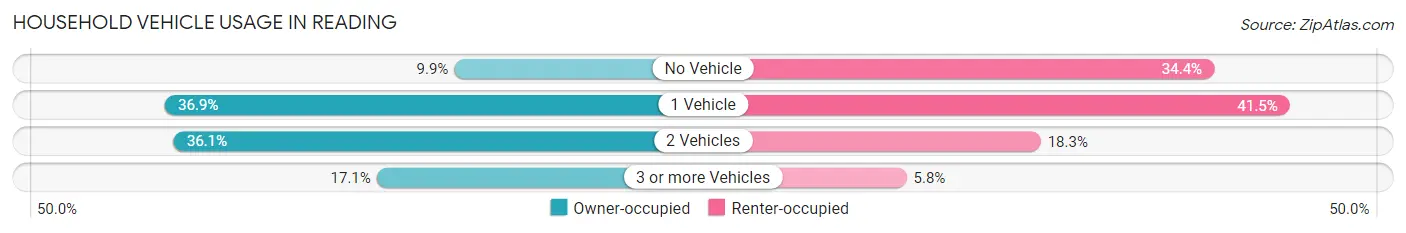
| Vehicles per Household | Owner-occupied | Renter-occupied |
| No Vehicle | 1,271 (9.9%) | 6,838 (34.4%) |
| 1 Vehicle | 4,735 (36.9%) | 8,242 (41.5%) |
| 2 Vehicles | 4,631 (36.1%) | 3,630 (18.3%) |
| 3 or more Vehicles | 2,201 (17.1%) | 1,144 (5.8%) |
| Total | 12,838 (100.0%) | 19,854 (100.0%) |
Real Estate & Mortgages in Reading
Real Estate and Mortgage Overview in Reading
| Characteristic | Without Mortgage | With Mortgage |
| Housing Units | 6,124 | 6,714 |
| Median Property Value | $81,100 | $111,100 |
| Median Household Income | $55,828 | $851 |
| Monthly Housing Costs | $492 | $119 |
| Real Estate Taxes | $1,437 | $232 |
Property Value by Mortgage Status in Reading
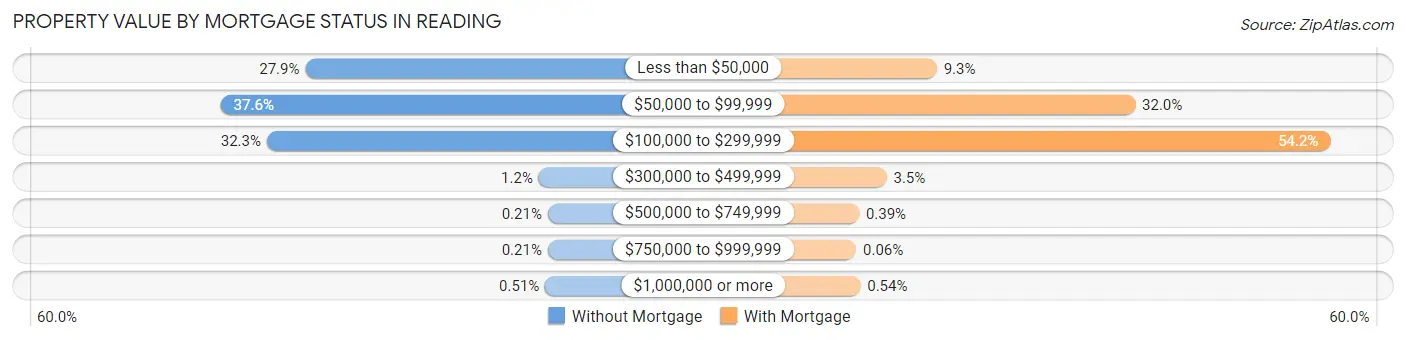
| Property Value | Without Mortgage | With Mortgage |
| Less than $50,000 | 1,710 (27.9%) | 623 (9.3%) |
| $50,000 to $99,999 | 2,302 (37.6%) | 2,145 (32.0%) |
| $100,000 to $299,999 | 1,979 (32.3%) | 3,642 (54.2%) |
| $300,000 to $499,999 | 76 (1.2%) | 238 (3.5%) |
| $500,000 to $749,999 | 13 (0.2%) | 26 (0.4%) |
| $750,000 to $999,999 | 13 (0.2%) | 4 (0.1%) |
| $1,000,000 or more | 31 (0.5%) | 36 (0.5%) |
| Total | 6,124 (100.0%) | 6,714 (100.0%) |
Household Income by Mortgage Status in Reading
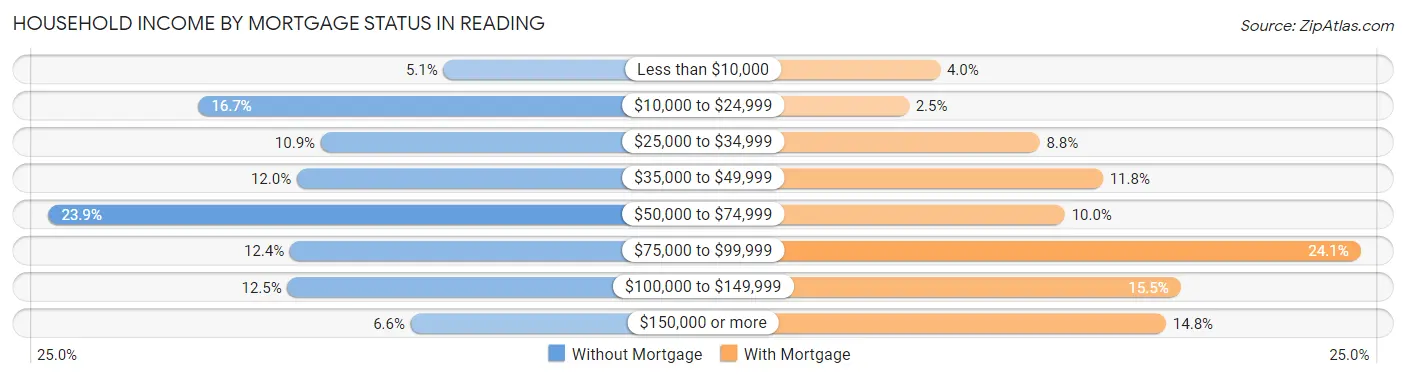
| Household Income | Without Mortgage | With Mortgage |
| Less than $10,000 | 309 (5.1%) | 270 (4.0%) |
| $10,000 to $24,999 | 1,024 (16.7%) | 170 (2.5%) |
| $25,000 to $34,999 | 667 (10.9%) | 588 (8.8%) |
| $35,000 to $49,999 | 737 (12.0%) | 790 (11.8%) |
| $50,000 to $74,999 | 1,461 (23.9%) | 669 (10.0%) |
| $75,000 to $99,999 | 757 (12.4%) | 1,615 (24.0%) |
| $100,000 to $149,999 | 764 (12.5%) | 1,039 (15.5%) |
| $150,000 or more | 405 (6.6%) | 992 (14.8%) |
| Total | 6,124 (100.0%) | 6,714 (100.0%) |
Property Value to Household Income Ratio in Reading
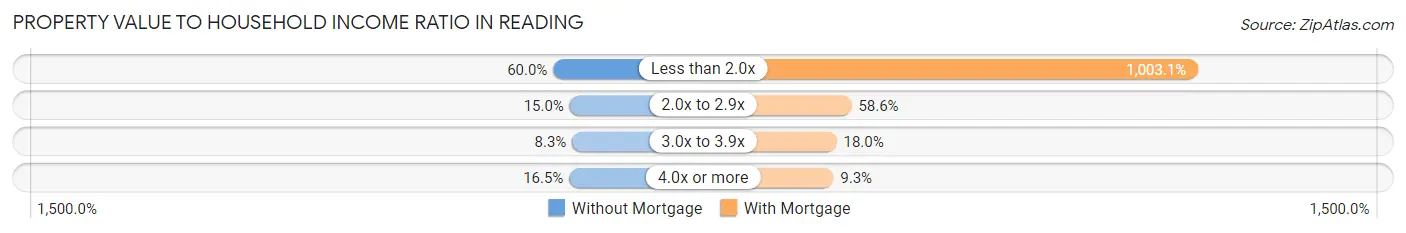
| Value-to-Income Ratio | Without Mortgage | With Mortgage |
| Less than 2.0x | 3,673 (60.0%) | 67,348 (1,003.1%) |
| 2.0x to 2.9x | 921 (15.0%) | 3,937 (58.6%) |
| 3.0x to 3.9x | 507 (8.3%) | 1,207 (18.0%) |
| 4.0x or more | 1,008 (16.5%) | 624 (9.3%) |
| Total | 6,124 (100.0%) | 6,714 (100.0%) |
Real Estate Taxes by Mortgage Status in Reading
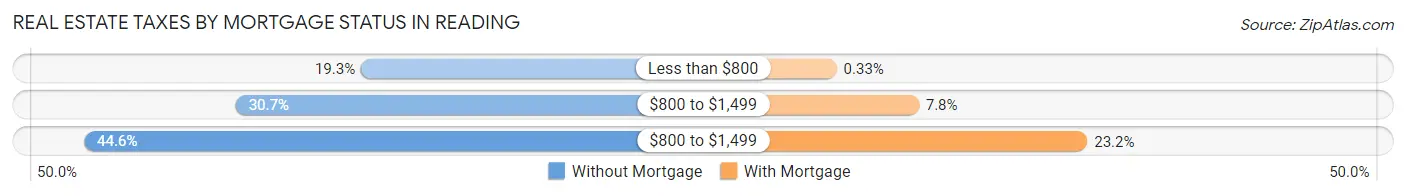
| Property Taxes | Without Mortgage | With Mortgage |
| Less than $800 | 1,181 (19.3%) | 22 (0.3%) |
| $800 to $1,499 | 1,881 (30.7%) | 526 (7.8%) |
| $800 to $1,499 | 2,729 (44.6%) | 1,559 (23.2%) |
| Total | 6,124 (100.0%) | 6,714 (100.0%) |
Health & Disability in Reading
Health Insurance Coverage by Age in Reading
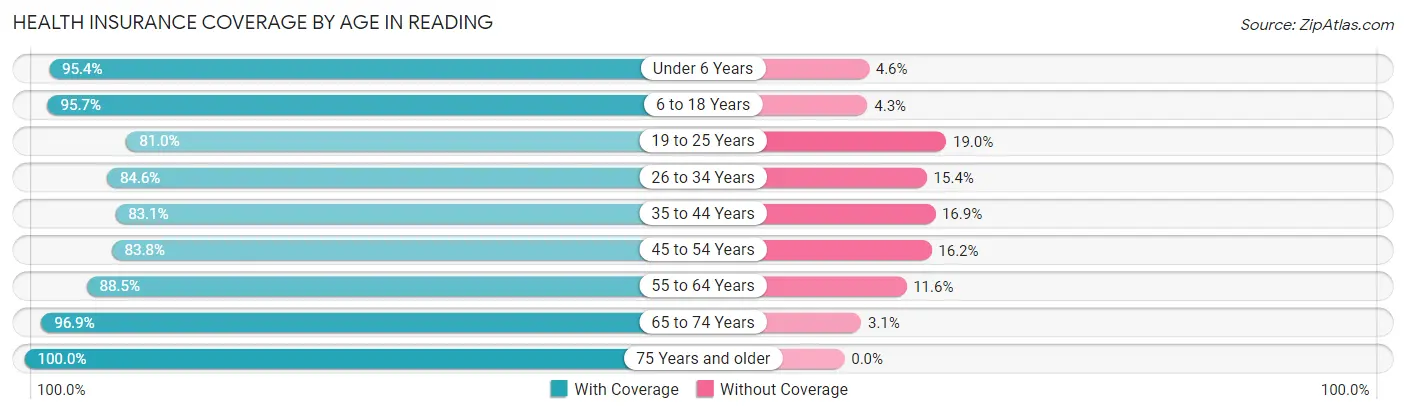
| Age Bracket | With Coverage | Without Coverage |
| Under 6 Years | 8,537 (95.4%) | 409 (4.6%) |
| 6 to 18 Years | 18,957 (95.7%) | 852 (4.3%) |
| 19 to 25 Years | 9,545 (81.0%) | 2,236 (19.0%) |
| 26 to 34 Years | 9,972 (84.6%) | 1,810 (15.4%) |
| 35 to 44 Years | 9,649 (83.1%) | 1,964 (16.9%) |
| 45 to 54 Years | 8,981 (83.8%) | 1,740 (16.2%) |
| 55 to 64 Years | 8,738 (88.4%) | 1,141 (11.6%) |
| 65 to 74 Years | 5,842 (96.9%) | 188 (3.1%) |
| 75 Years and older | 3,783 (100.0%) | 0 (0.0%) |
| Total | 84,004 (89.0%) | 10,340 (11.0%) |
Health Insurance Coverage by Citizenship Status in Reading
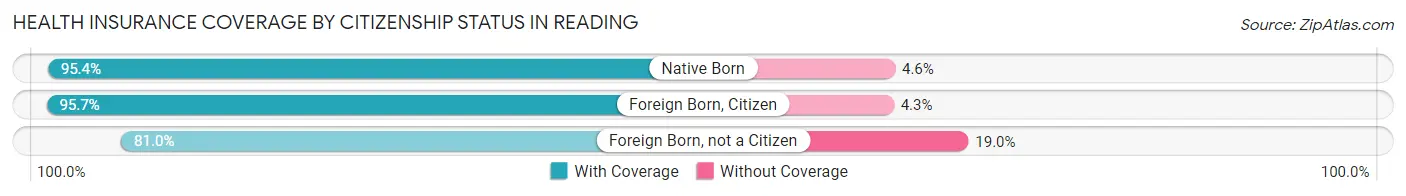
| Citizenship Status | With Coverage | Without Coverage |
| Native Born | 8,537 (95.4%) | 409 (4.6%) |
| Foreign Born, Citizen | 18,957 (95.7%) | 852 (4.3%) |
| Foreign Born, not a Citizen | 9,545 (81.0%) | 2,236 (19.0%) |
Health Insurance Coverage by Household Income in Reading
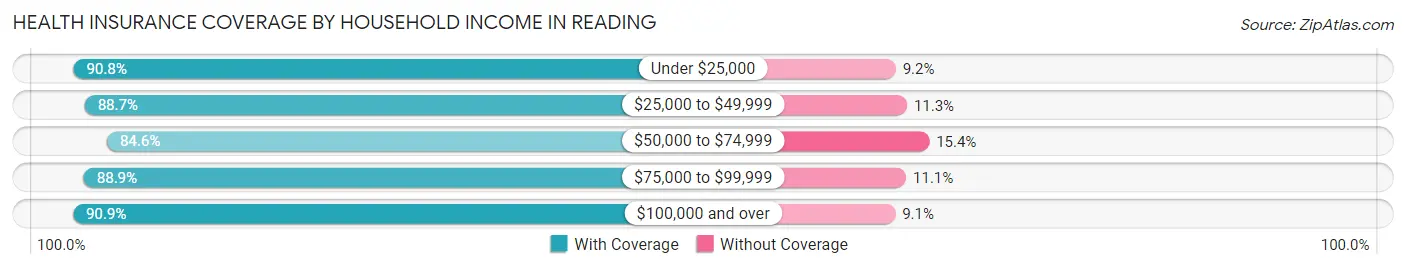
| Household Income | With Coverage | Without Coverage |
| Under $25,000 | 20,168 (90.8%) | 2,035 (9.2%) |
| $25,000 to $49,999 | 18,809 (88.7%) | 2,389 (11.3%) |
| $50,000 to $74,999 | 15,352 (84.6%) | 2,803 (15.4%) |
| $75,000 to $99,999 | 10,229 (88.9%) | 1,279 (11.1%) |
| $100,000 and over | 16,968 (90.9%) | 1,693 (9.1%) |
Public vs Private Health Insurance Coverage by Age in Reading
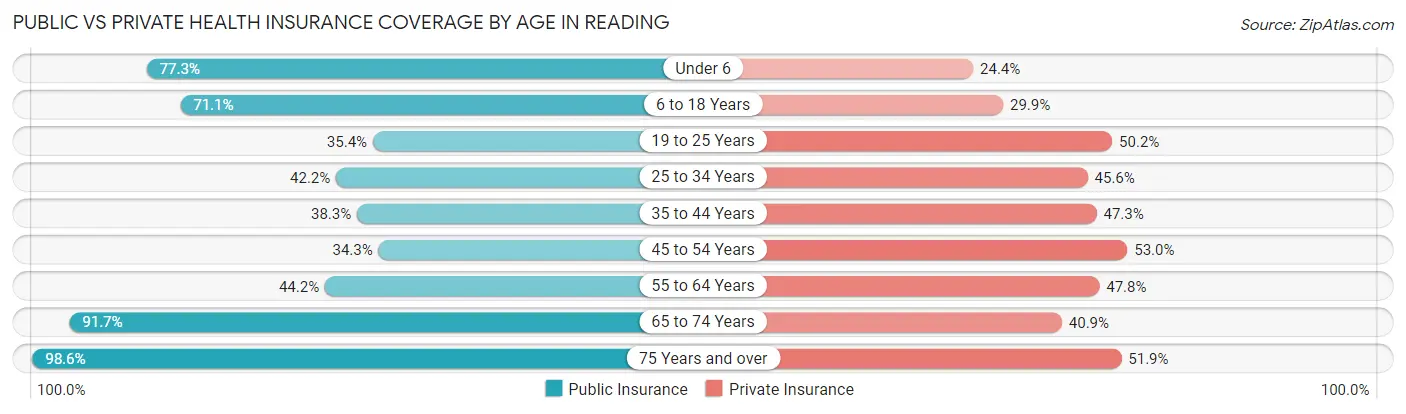
| Age Bracket | Public Insurance | Private Insurance |
| Under 6 | 6,919 (77.3%) | 2,181 (24.4%) |
| 6 to 18 Years | 14,083 (71.1%) | 5,928 (29.9%) |
| 19 to 25 Years | 4,164 (35.3%) | 5,912 (50.2%) |
| 25 to 34 Years | 4,970 (42.2%) | 5,376 (45.6%) |
| 35 to 44 Years | 4,448 (38.3%) | 5,492 (47.3%) |
| 45 to 54 Years | 3,677 (34.3%) | 5,682 (53.0%) |
| 55 to 64 Years | 4,370 (44.2%) | 4,721 (47.8%) |
| 65 to 74 Years | 5,529 (91.7%) | 2,463 (40.8%) |
| 75 Years and over | 3,729 (98.6%) | 1,963 (51.9%) |
| Total | 51,889 (55.0%) | 39,718 (42.1%) |
Disability Status by Sex by Age in Reading
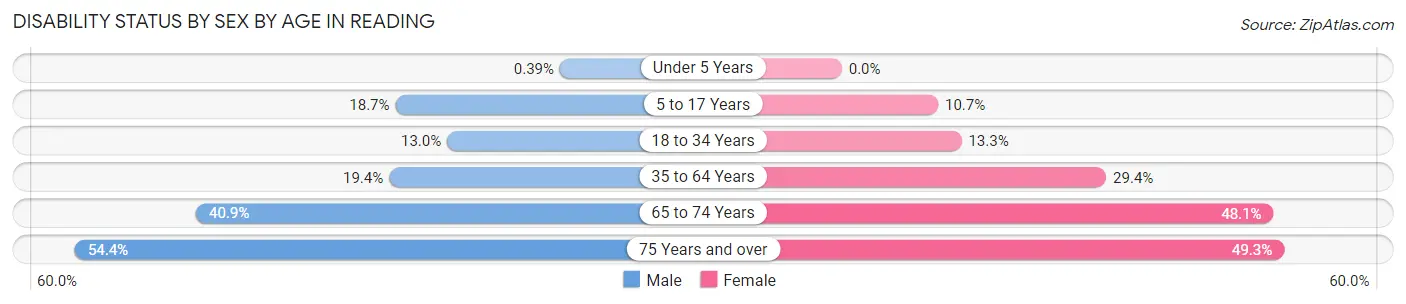
| Age Bracket | Male | Female |
| Under 5 Years | 14 (0.4%) | 0 (0.0%) |
| 5 to 17 Years | 1,771 (18.7%) | 1,084 (10.7%) |
| 18 to 34 Years | 1,615 (13.0%) | 1,716 (13.3%) |
| 35 to 64 Years | 3,057 (19.4%) | 4,846 (29.4%) |
| 65 to 74 Years | 1,133 (40.9%) | 1,567 (48.1%) |
| 75 Years and over | 718 (54.4%) | 1,213 (49.2%) |
Disability Class by Sex by Age in Reading
Disability Class: Hearing Difficulty
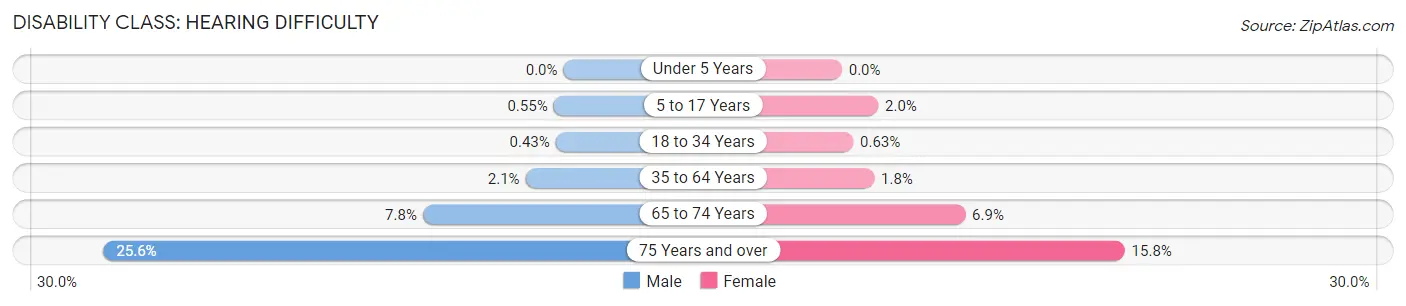
| Age Bracket | Male | Female |
| Under 5 Years | 0 (0.0%) | 0 (0.0%) |
| 5 to 17 Years | 52 (0.5%) | 204 (2.0%) |
| 18 to 34 Years | 53 (0.4%) | 81 (0.6%) |
| 35 to 64 Years | 332 (2.1%) | 297 (1.8%) |
| 65 to 74 Years | 217 (7.8%) | 224 (6.9%) |
| 75 Years and over | 338 (25.6%) | 388 (15.8%) |
Disability Class: Vision Difficulty
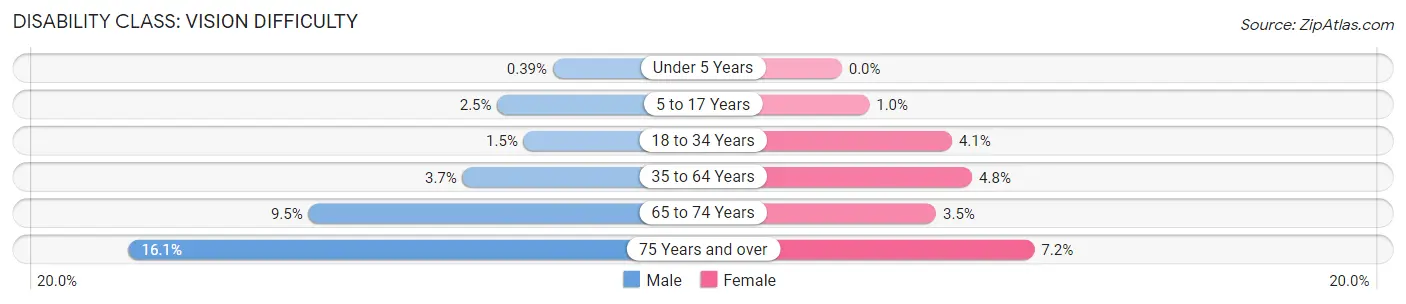
| Age Bracket | Male | Female |
| Under 5 Years | 14 (0.4%) | 0 (0.0%) |
| 5 to 17 Years | 232 (2.5%) | 103 (1.0%) |
| 18 to 34 Years | 183 (1.5%) | 526 (4.1%) |
| 35 to 64 Years | 589 (3.7%) | 797 (4.8%) |
| 65 to 74 Years | 262 (9.5%) | 114 (3.5%) |
| 75 Years and over | 213 (16.1%) | 176 (7.1%) |
Disability Class: Cognitive Difficulty
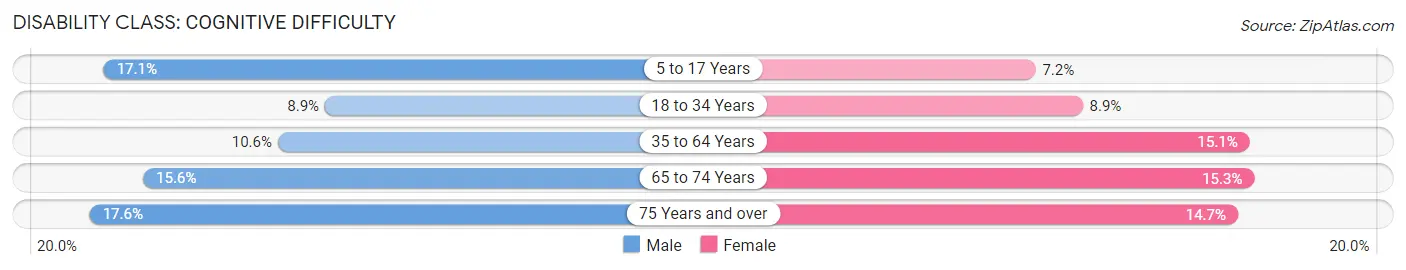
| Age Bracket | Male | Female |
| 5 to 17 Years | 1,615 (17.1%) | 727 (7.2%) |
| 18 to 34 Years | 1,104 (8.8%) | 1,151 (8.9%) |
| 35 to 64 Years | 1,670 (10.6%) | 2,493 (15.1%) |
| 65 to 74 Years | 432 (15.6%) | 499 (15.3%) |
| 75 Years and over | 232 (17.6%) | 362 (14.7%) |
Disability Class: Ambulatory Difficulty
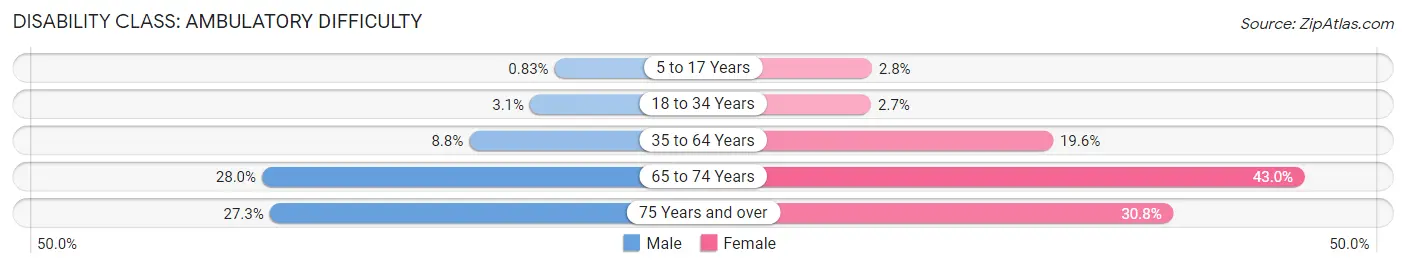
| Age Bracket | Male | Female |
| 5 to 17 Years | 79 (0.8%) | 282 (2.8%) |
| 18 to 34 Years | 388 (3.1%) | 350 (2.7%) |
| 35 to 64 Years | 1,378 (8.7%) | 3,226 (19.6%) |
| 65 to 74 Years | 775 (28.0%) | 1,401 (43.0%) |
| 75 Years and over | 360 (27.3%) | 758 (30.8%) |
Disability Class: Self-Care Difficulty
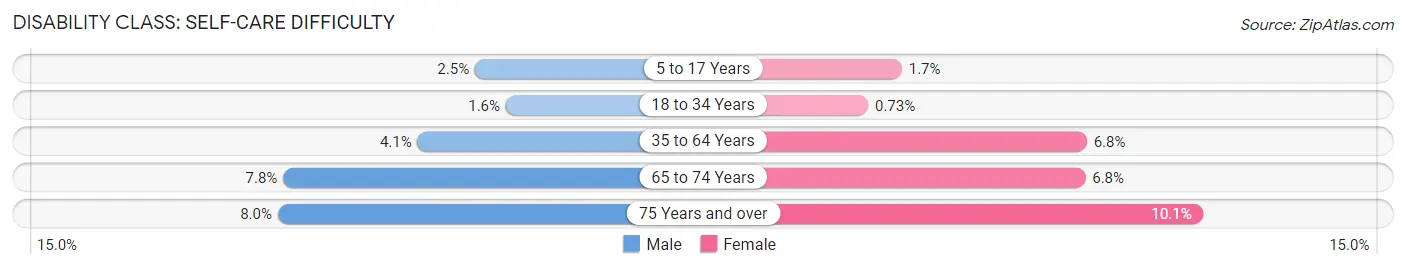
| Age Bracket | Male | Female |
| 5 to 17 Years | 233 (2.5%) | 169 (1.7%) |
| 18 to 34 Years | 200 (1.6%) | 94 (0.7%) |
| 35 to 64 Years | 640 (4.1%) | 1,123 (6.8%) |
| 65 to 74 Years | 216 (7.8%) | 221 (6.8%) |
| 75 Years and over | 105 (8.0%) | 248 (10.1%) |
Technology Access in Reading
Computing Device Access in Reading
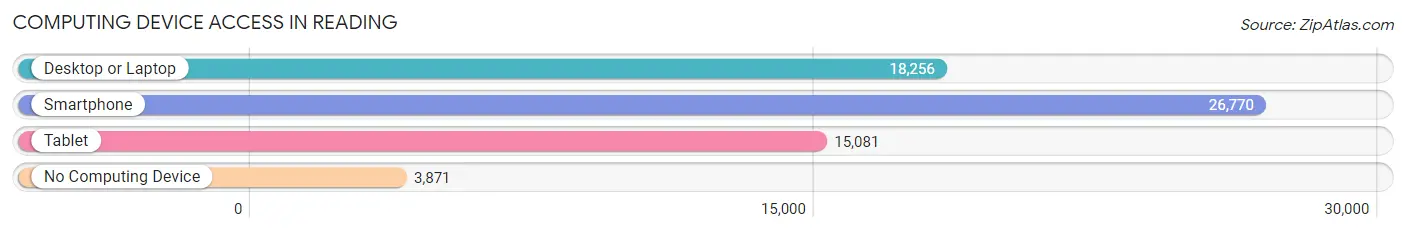
| Device Type | # Households | % Households |
| Desktop or Laptop | 18,256 | 55.8% |
| Smartphone | 26,770 | 81.9% |
| Tablet | 15,081 | 46.1% |
| No Computing Device | 3,871 | 11.8% |
| Total | 32,692 | 100.0% |
Internet Access in Reading
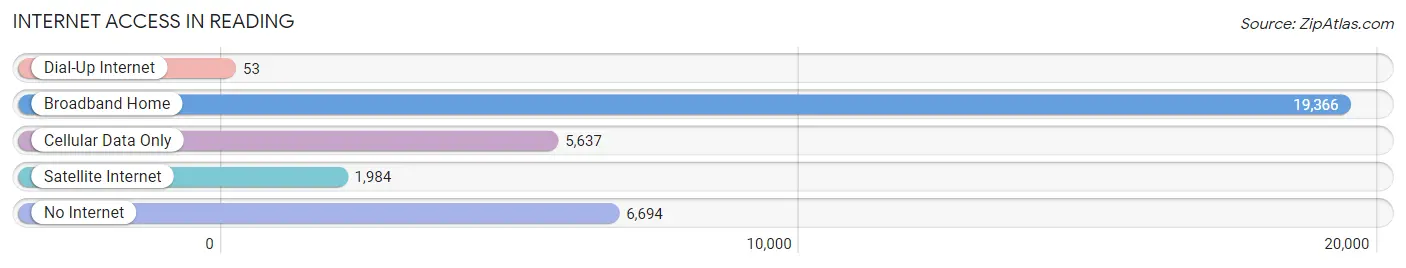
| Internet Type | # Households | % Households |
| Dial-Up Internet | 53 | 0.2% |
| Broadband Home | 19,366 | 59.2% |
| Cellular Data Only | 5,637 | 17.2% |
| Satellite Internet | 1,984 | 6.1% |
| No Internet | 6,694 | 20.5% |
| Total | 32,692 | 100.0% |
Reading Summary
Reading, Pennsylvania is a city located in Berks County, Pennsylvania, United States. It is the county seat of Berks County and the fifth-largest city in the state. The city is situated along the Schuylkill River and is the principal city of the Greater Reading Area. As of the 2010 census, the city had a population of 88,082.
History
The area that is now Reading was originally inhabited by the Lenape Indians. The first European settlers arrived in the area in 1748, when the Reading area was part of the Province of Pennsylvania. The town was officially founded in 1748 by Thomas and Richard Penn, sons of William Penn, the founder of Pennsylvania. The town was named after Reading, England, and was incorporated as a borough in 1783.
In the 19th century, Reading became an important industrial center. The city was a major hub for the Pennsylvania Railroad and the Reading Company, which operated the Reading Railroad. The city was also home to several large manufacturing companies, including the Reading Iron Works and the Reading Hardware Company.
Geography
Reading is located in southeastern Pennsylvania, approximately 50 miles northwest of Philadelphia. The city is situated along the Schuylkill River and is surrounded by several smaller towns and villages. The city has a total area of 10.2 square miles, of which 10.1 square miles is land and 0.1 square miles is water.
Economy
Reading has a diverse economy, with a mix of manufacturing, retail, and service industries. The city is home to several large employers, including the Reading Hospital and Medical Center, the Reading School District, and the Reading Company. The city is also home to several large manufacturing companies, including the Reading Iron Works and the Reading Hardware Company.
Demographics
As of the 2010 census, the city had a population of 88,082. The racial makeup of the city was 79.2% White, 11.3% African American, 0.3% Native American, 1.7% Asian, 0.1% Pacific Islander, 4.7% from other races, and 2.9% from two or more races. Hispanic or Latino of any race were 11.3% of the population.
The median income for a household in the city was $37,837, and the median income for a family was $45,945. The per capita income for the city was $20,945. About 15.3% of families and 18.7% of the population were below the poverty line, including 28.2% of those under age 18 and 9.2% of those age 65 or over.
Common Questions
What is Per Capita Income in Reading?
Per Capita income in Reading is $20,782.
What is the Median Family Income in Reading?
Median Family Income in Reading is $52,920.
What is the Median Household income in Reading?
Median Household Income in Reading is $42,852.
What is Income or Wage Gap in Reading?
Income or Wage Gap in Reading is 28.7%.
Women in Reading earn 71.3 cents for every dollar earned by a man.
What is Family Income Deficit in Reading?
Family Income Deficit in Reading is $11,606.
Families that are below poverty line in Reading earn $11,606 less on average than the poverty threshold level.
What is Inequality or Gini Index in Reading?
Inequality or Gini Index in Reading is 0.47.
What is the Total Population of Reading?
Total Population of Reading is 94,601.
What is the Total Male Population of Reading?
Total Male Population of Reading is 45,457.
What is the Total Female Population of Reading?
Total Female Population of Reading is 49,144.
What is the Ratio of Males per 100 Females in Reading?
There are 92.50 Males per 100 Females in Reading.
What is the Ratio of Females per 100 Males in Reading?
There are 108.11 Females per 100 Males in Reading.
What is the Median Population Age in Reading?
Median Population Age in Reading is 31.1 Years.
What is the Average Family Size in Reading
Average Family Size in Reading is 3.5 People.
What is the Average Household Size in Reading
Average Household Size in Reading is 2.8 People.
How Large is the Labor Force in Reading?
There are 43,855 People in the Labor Forcein in Reading.
What is the Percentage of People in the Labor Force in Reading?
62.0% of People are in the Labor Force in Reading.
What is the Unemployment Rate in Reading?
Unemployment Rate in Reading is 11.3%.