York Springs borough, PA Map & Demographics
York Springs borough Overview
$20,548
PER CAPITA INCOME
$55,250
AVG FAMILY INCOME
$54,167
AVG HOUSEHOLD INCOME
23.5%
WAGE / INCOME GAP [ % ]
76.5¢/ $1
WAGE / INCOME GAP [ $ ]
$17,648
FAMILY INCOME DEFICIT
0.37
INEQUALITY / GINI INDEX
922
TOTAL POPULATION
512
MALE POPULATION
410
FEMALE POPULATION
124.88
MALES / 100 FEMALES
80.08
FEMALES / 100 MALES
31.4
MEDIAN AGE
4.2
AVG FAMILY SIZE
3.7
AVG HOUSEHOLD SIZE
423
LABOR FORCE [ PEOPLE ]
67.9%
PERCENT IN LABOR FORCE
5.2%
UNEMPLOYMENT RATE
Income in York Springs borough
Income Overview in York Springs borough
Per Capita Income in York Springs borough is $20,548, while median incomes of families and households are $55,250 and $54,167 respectively.
| Characteristic | Number | Measure |
| Per Capita Income | 922 | $20,548 |
| Median Family Income | 187 | $55,250 |
| Mean Family Income | 187 | $68,828 |
| Median Household Income | 242 | $54,167 |
| Mean Household Income | 242 | $68,616 |
| Income Deficit | 187 | $17,648 |
| Wage / Income Gap (%) | 922 | 23.53% |
| Wage / Income Gap ($) | 922 | 76.47¢ per $1 |
| Gini / Inequality Index | 922 | 0.37 |
Earnings by Sex in York Springs borough
Average Earnings in York Springs borough are $31,964, $35,729 for men and $27,321 for women, a difference of 23.5%.
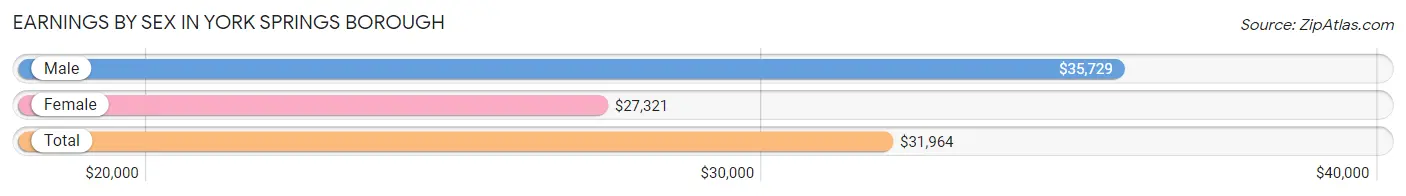
| Sex | Number | Average Earnings |
| Male | 239 (56.8%) | $35,729 |
| Female | 182 (43.2%) | $27,321 |
| Total | 421 (100.0%) | $31,964 |
Earnings by Sex by Income Bracket in York Springs borough
The most common earnings brackets in York Springs borough are $17,500 to $19,999 for men (30 | 12.6%) and $25,000 to $29,999 for women (38 | 20.9%).
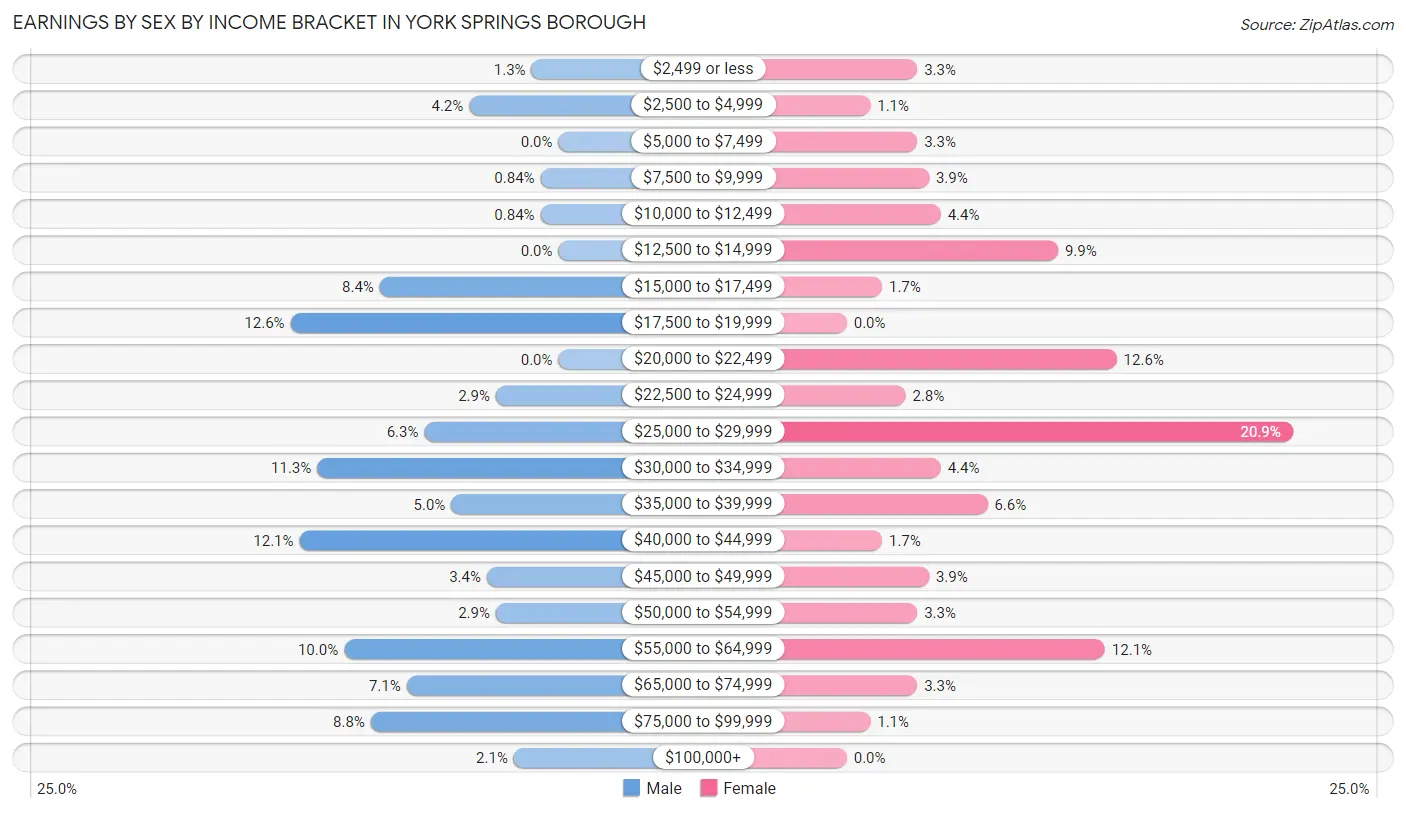
| Income | Male | Female |
| $2,499 or less | 3 (1.3%) | 6 (3.3%) |
| $2,500 to $4,999 | 10 (4.2%) | 2 (1.1%) |
| $5,000 to $7,499 | 0 (0.0%) | 6 (3.3%) |
| $7,500 to $9,999 | 2 (0.8%) | 7 (3.8%) |
| $10,000 to $12,499 | 2 (0.8%) | 8 (4.4%) |
| $12,500 to $14,999 | 0 (0.0%) | 18 (9.9%) |
| $15,000 to $17,499 | 20 (8.4%) | 3 (1.7%) |
| $17,500 to $19,999 | 30 (12.6%) | 0 (0.0%) |
| $20,000 to $22,499 | 0 (0.0%) | 23 (12.6%) |
| $22,500 to $24,999 | 7 (2.9%) | 5 (2.8%) |
| $25,000 to $29,999 | 15 (6.3%) | 38 (20.9%) |
| $30,000 to $34,999 | 27 (11.3%) | 8 (4.4%) |
| $35,000 to $39,999 | 12 (5.0%) | 12 (6.6%) |
| $40,000 to $44,999 | 29 (12.1%) | 3 (1.7%) |
| $45,000 to $49,999 | 8 (3.4%) | 7 (3.8%) |
| $50,000 to $54,999 | 7 (2.9%) | 6 (3.3%) |
| $55,000 to $64,999 | 24 (10.0%) | 22 (12.1%) |
| $65,000 to $74,999 | 17 (7.1%) | 6 (3.3%) |
| $75,000 to $99,999 | 21 (8.8%) | 2 (1.1%) |
| $100,000+ | 5 (2.1%) | 0 (0.0%) |
| Total | 239 (100.0%) | 182 (100.0%) |
Earnings by Sex by Educational Attainment in York Springs borough
Average earnings in York Springs borough are $36,250 for men and $27,760 for women, a difference of 23.4%. Men with an educational attainment of college or associate's degree enjoy the highest average annual earnings of $73,000, while those with less than high school education earn the least with $25,417. Women with an educational attainment of college or associate's degree earn the most with the average annual earnings of $46,250, while those with less than high school education have the smallest earnings of $25,972.
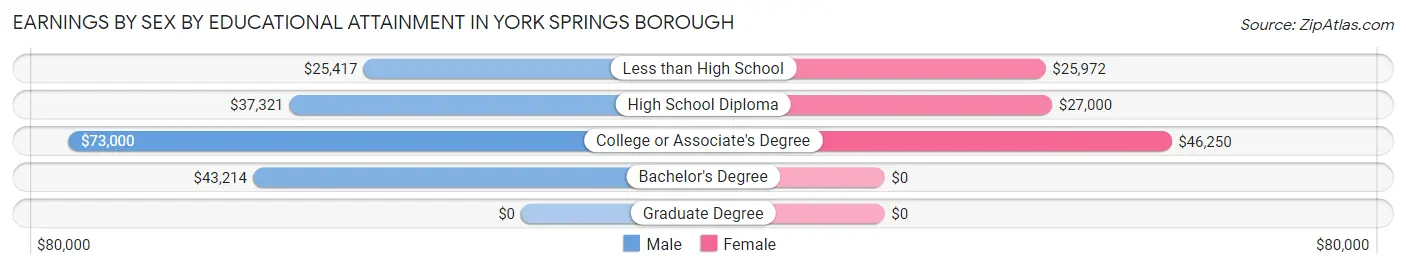
| Educational Attainment | Male Income | Female Income |
| Less than High School | $25,417 | $25,972 |
| High School Diploma | $37,321 | $27,000 |
| College or Associate's Degree | $73,000 | $46,250 |
| Bachelor's Degree | $43,214 | $0 |
| Graduate Degree | - | - |
| Total | $36,250 | $27,760 |
Family Income in York Springs borough
Family Income Brackets in York Springs borough
According to the York Springs borough family income data, there are 40 families falling into the $35,000 to $49,999 income range, which is the most common income bracket and makes up 21.4% of all families. Conversely, the $200,000+ income bracket is the least frequent group with only 2 families (1.1%) belonging to this category.
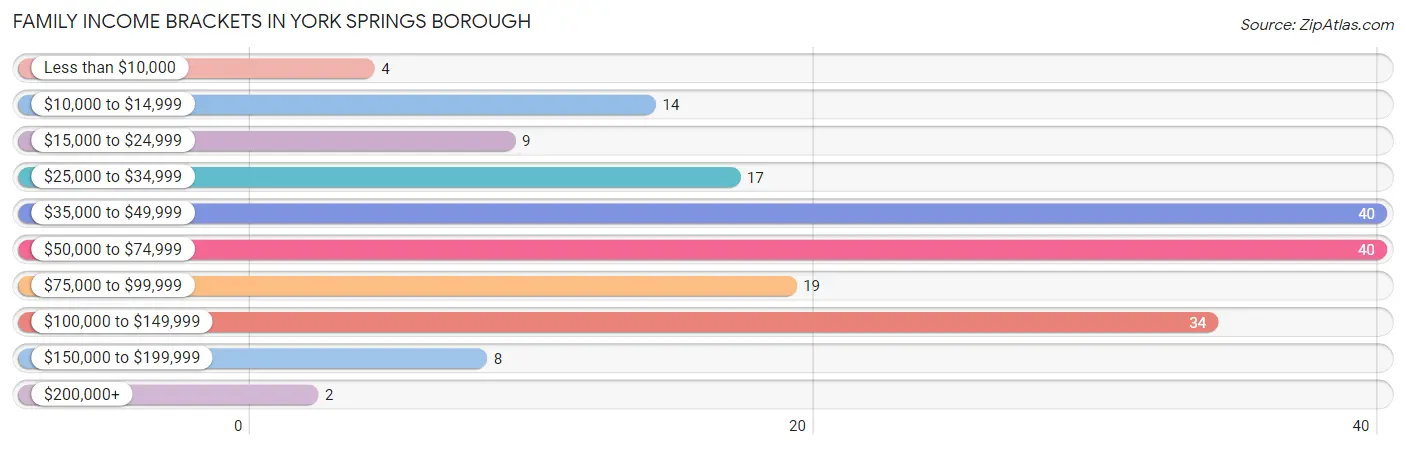
| Income Bracket | # Families | % Families |
| Less than $10,000 | 4 | 2.1% |
| $10,000 to $14,999 | 14 | 7.5% |
| $15,000 to $24,999 | 9 | 4.8% |
| $25,000 to $34,999 | 17 | 9.1% |
| $35,000 to $49,999 | 40 | 21.4% |
| $50,000 to $74,999 | 40 | 21.4% |
| $75,000 to $99,999 | 19 | 10.2% |
| $100,000 to $149,999 | 34 | 18.2% |
| $150,000 to $199,999 | 8 | 4.3% |
| $200,000+ | 2 | 1.1% |
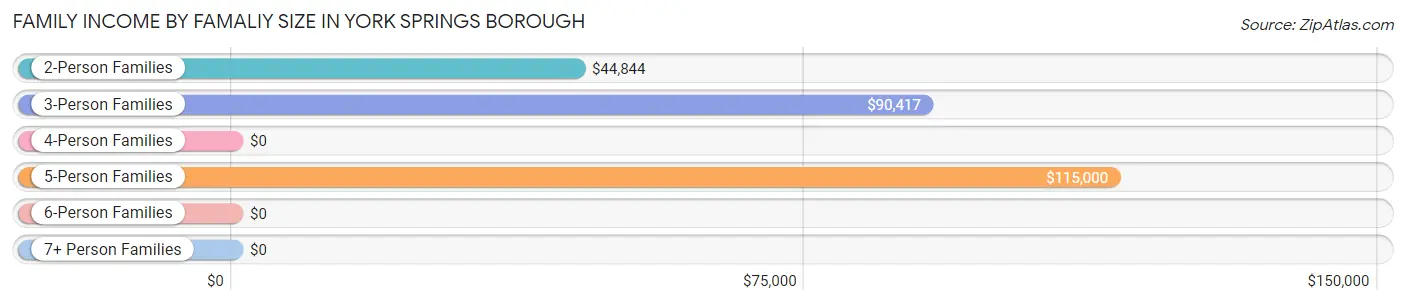
Family Income by Famaliy Size in York Springs borough
5-person families (14 | 7.5%) account for the highest median family income in York Springs borough with $115,000 per family, while 3-person families (19 | 10.2%) have the highest median income of $30,139 per family member.
| Income Bracket | # Families | Median Income |
| 2-Person Families | 84 (44.9%) | $44,844 |
| 3-Person Families | 19 (10.2%) | $90,417 |
| 4-Person Families | 61 (32.6%) | $0 |
| 5-Person Families | 14 (7.5%) | $115,000 |
| 6-Person Families | 0 (0.0%) | $0 |
| 7+ Person Families | 9 (4.8%) | $0 |
| Total | 187 (100.0%) | $55,250 |
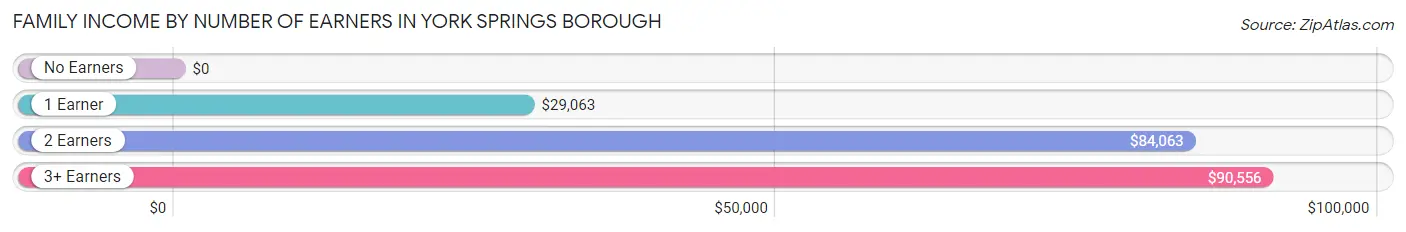
Family Income by Number of Earners in York Springs borough
| Number of Earners | # Families | Median Income |
| No Earners | 16 (8.6%) | $0 |
| 1 Earner | 60 (32.1%) | $29,063 |
| 2 Earners | 95 (50.8%) | $84,063 |
| 3+ Earners | 16 (8.6%) | $90,556 |
| Total | 187 (100.0%) | $55,250 |
Household Income in York Springs borough
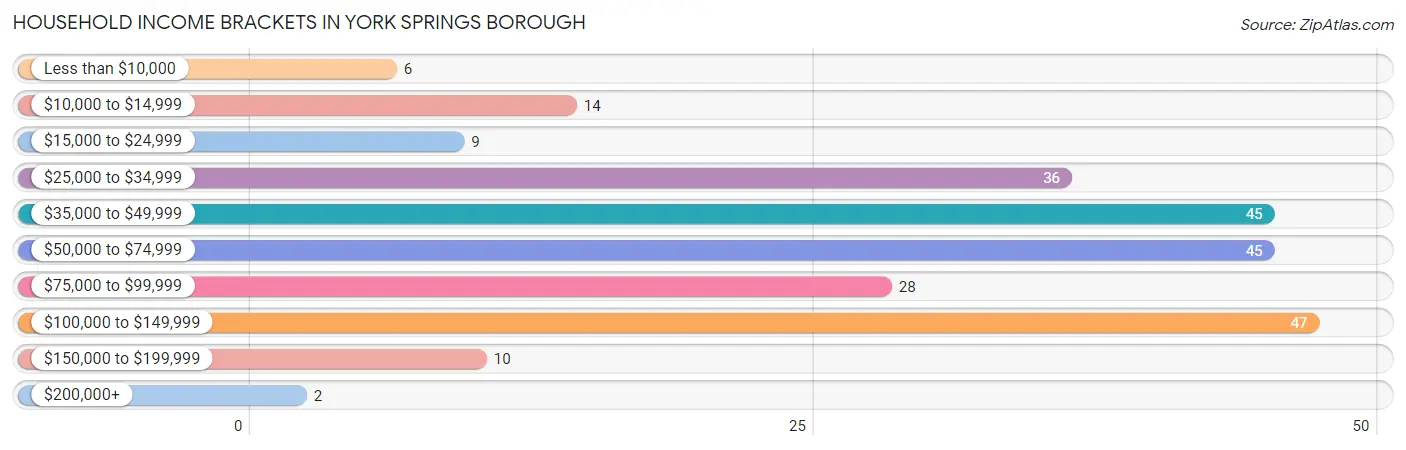
Household Income Brackets in York Springs borough
With 47 households falling in the category, the $100,000 to $149,999 income range is the most frequent in York Springs borough, accounting for 19.4% of all households. In contrast, only 2 households (0.8%) fall into the $200,000+ income bracket, making it the least populous group.
| Income Bracket | # Households | % Households |
| Less than $10,000 | 6 | 2.5% |
| $10,000 to $14,999 | 14 | 5.8% |
| $15,000 to $24,999 | 9 | 3.7% |
| $25,000 to $34,999 | 36 | 14.9% |
| $35,000 to $49,999 | 45 | 18.6% |
| $50,000 to $74,999 | 45 | 18.6% |
| $75,000 to $99,999 | 28 | 11.6% |
| $100,000 to $149,999 | 47 | 19.4% |
| $150,000 to $199,999 | 10 | 4.1% |
| $200,000+ | 2 | 0.8% |
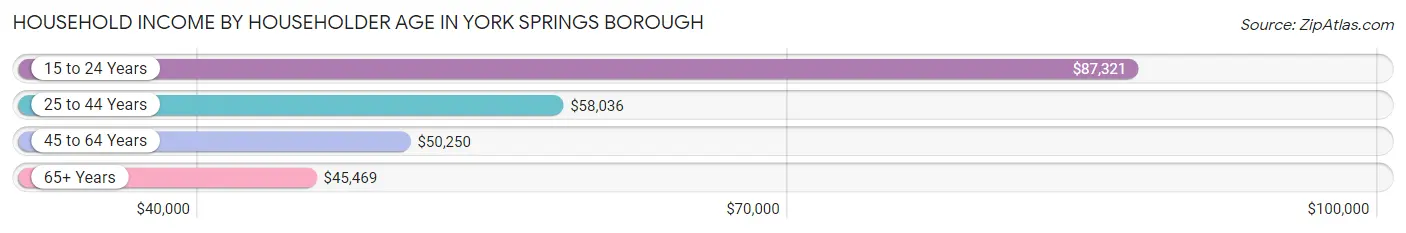
Household Income by Householder Age in York Springs borough
The median household income in York Springs borough is $54,167, with the highest median household income of $87,321 found in the 15 to 24 years age bracket for the primary householder. A total of 17 households (7.0%) fall into this category. Meanwhile, the 65+ years age bracket for the primary householder has the lowest median household income of $45,469, with 33 households (13.6%) in this group.
| Income Bracket | # Households | Median Income |
| 15 to 24 Years | 17 (7.0%) | $87,321 |
| 25 to 44 Years | 119 (49.2%) | $58,036 |
| 45 to 64 Years | 73 (30.2%) | $50,250 |
| 65+ Years | 33 (13.6%) | $45,469 |
| Total | 242 (100.0%) | $54,167 |
Poverty in York Springs borough
Income Below Poverty by Sex and Age in York Springs borough
With 18.5% poverty level for males and 26.1% for females among the residents of York Springs borough, 16 and 17 year old males and 6 to 11 year old females are the most vulnerable to poverty, with 11 males (100.0%) and 24 females (64.9%) in their respective age groups living below the poverty level.
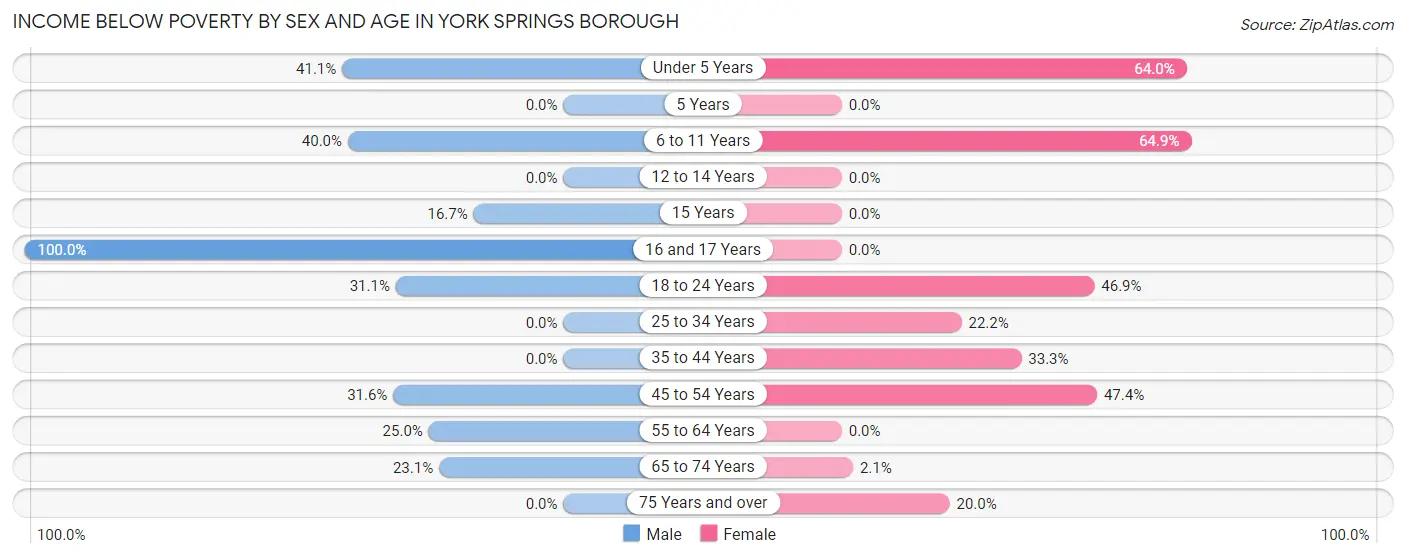
| Age Bracket | Male | Female |
| Under 5 Years | 23 (41.1%) | 16 (64.0%) |
| 5 Years | 0 (0.0%) | 0 (0.0%) |
| 6 to 11 Years | 24 (40.0%) | 24 (64.9%) |
| 12 to 14 Years | 0 (0.0%) | 0 (0.0%) |
| 15 Years | 4 (16.7%) | 0 (0.0%) |
| 16 and 17 Years | 11 (100.0%) | 0 (0.0%) |
| 18 to 24 Years | 14 (31.1%) | 15 (46.9%) |
| 25 to 34 Years | 0 (0.0%) | 18 (22.2%) |
| 35 to 44 Years | 0 (0.0%) | 12 (33.3%) |
| 45 to 54 Years | 12 (31.6%) | 18 (47.4%) |
| 55 to 64 Years | 4 (25.0%) | 0 (0.0%) |
| 65 to 74 Years | 3 (23.1%) | 2 (2.1%) |
| 75 Years and over | 0 (0.0%) | 2 (20.0%) |
| Total | 95 (18.5%) | 107 (26.1%) |
Income Above Poverty by Sex and Age in York Springs borough
According to the poverty statistics in York Springs borough, males aged 5 years and females aged 5 years are the age groups that are most secure financially, with 100.0% of males and 100.0% of females in these age groups living above the poverty line.
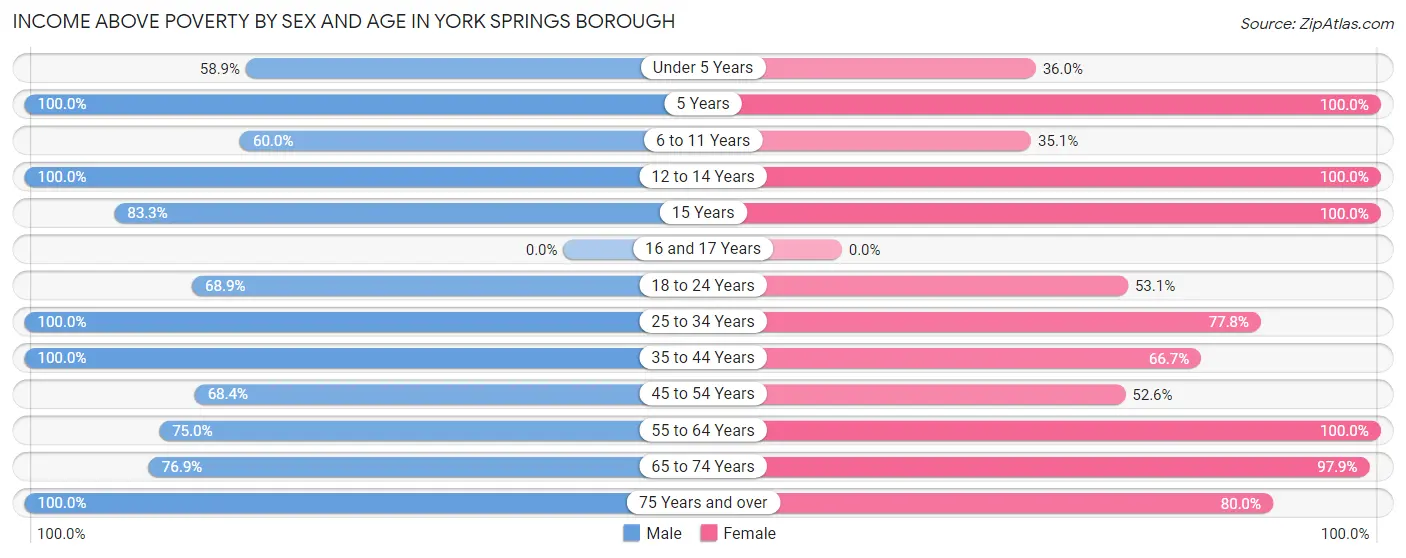
| Age Bracket | Male | Female |
| Under 5 Years | 33 (58.9%) | 9 (36.0%) |
| 5 Years | 1 (100.0%) | 7 (100.0%) |
| 6 to 11 Years | 36 (60.0%) | 13 (35.1%) |
| 12 to 14 Years | 75 (100.0%) | 12 (100.0%) |
| 15 Years | 20 (83.3%) | 2 (100.0%) |
| 16 and 17 Years | 0 (0.0%) | 0 (0.0%) |
| 18 to 24 Years | 31 (68.9%) | 17 (53.1%) |
| 25 to 34 Years | 62 (100.0%) | 63 (77.8%) |
| 35 to 44 Years | 90 (100.0%) | 24 (66.7%) |
| 45 to 54 Years | 26 (68.4%) | 20 (52.6%) |
| 55 to 64 Years | 12 (75.0%) | 34 (100.0%) |
| 65 to 74 Years | 10 (76.9%) | 94 (97.9%) |
| 75 Years and over | 21 (100.0%) | 8 (80.0%) |
| Total | 417 (81.5%) | 303 (73.9%) |
Income Below Poverty Among Married-Couple Families in York Springs borough
The poverty statistics for married-couple families in York Springs borough show that 9.6% or 13 of the total 136 families live below the poverty line. Families with 5 or more children have the highest poverty rate of 100.0%, comprising of 9 families. On the other hand, families with 3 or 4 children have the lowest poverty rate of 0.0%, which includes 0 families.
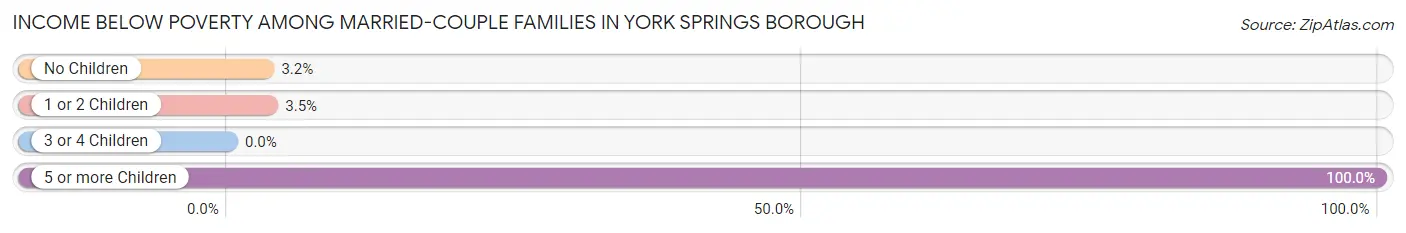
| Children | Above Poverty | Below Poverty |
| No Children | 61 (96.8%) | 2 (3.2%) |
| 1 or 2 Children | 55 (96.5%) | 2 (3.5%) |
| 3 or 4 Children | 7 (100.0%) | 0 (0.0%) |
| 5 or more Children | 0 (0.0%) | 9 (100.0%) |
| Total | 123 (90.4%) | 13 (9.6%) |
Income Below Poverty Among Single-Parent Households in York Springs borough
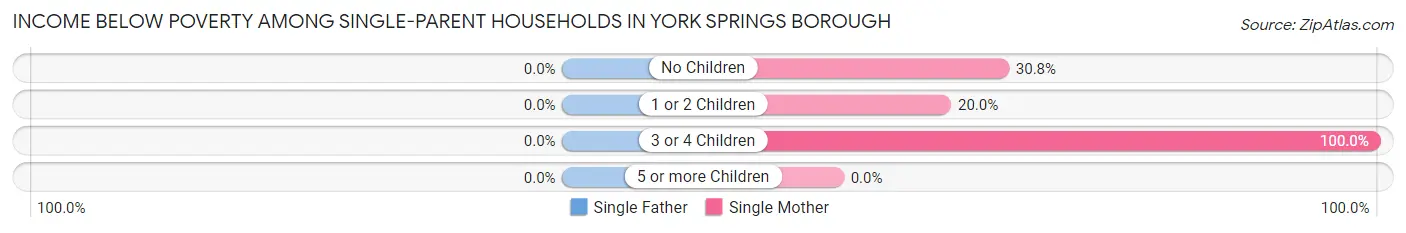
| Children | Single Father | Single Mother |
| No Children | 0 (0.0%) | 4 (30.8%) |
| 1 or 2 Children | 0 (0.0%) | 2 (20.0%) |
| 3 or 4 Children | 0 (0.0%) | 8 (100.0%) |
| 5 or more Children | 0 (0.0%) | 0 (0.0%) |
| Total | 0 (0.0%) | 14 (45.2%) |
Income Below Poverty Among Married-Couple vs Single-Parent Households in York Springs borough
The poverty data for York Springs borough shows that 13 of the married-couple family households (9.6%) and 14 of the single-parent households (27.5%) are living below the poverty level. Within the married-couple family households, those with 5 or more children have the highest poverty rate, with 9 households (100.0%) falling below the poverty line. Among the single-parent households, those with 3 or 4 children have the highest poverty rate, with 8 household (53.3%) living below poverty.
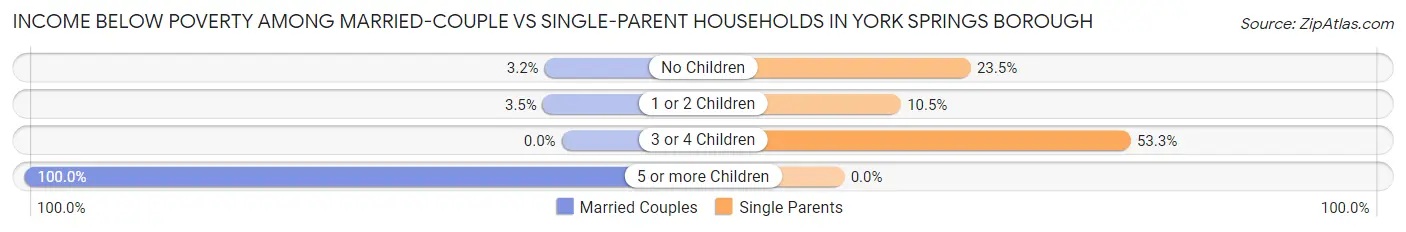
| Children | Married-Couple Families | Single-Parent Households |
| No Children | 2 (3.2%) | 4 (23.5%) |
| 1 or 2 Children | 2 (3.5%) | 2 (10.5%) |
| 3 or 4 Children | 0 (0.0%) | 8 (53.3%) |
| 5 or more Children | 9 (100.0%) | 0 (0.0%) |
| Total | 13 (9.6%) | 14 (27.5%) |
Race in York Springs borough
The most populous races in York Springs borough are White / Caucasian (517 | 56.1%), Hispanic or Latino (385 | 41.8%), and Some other Race (309 | 33.5%).
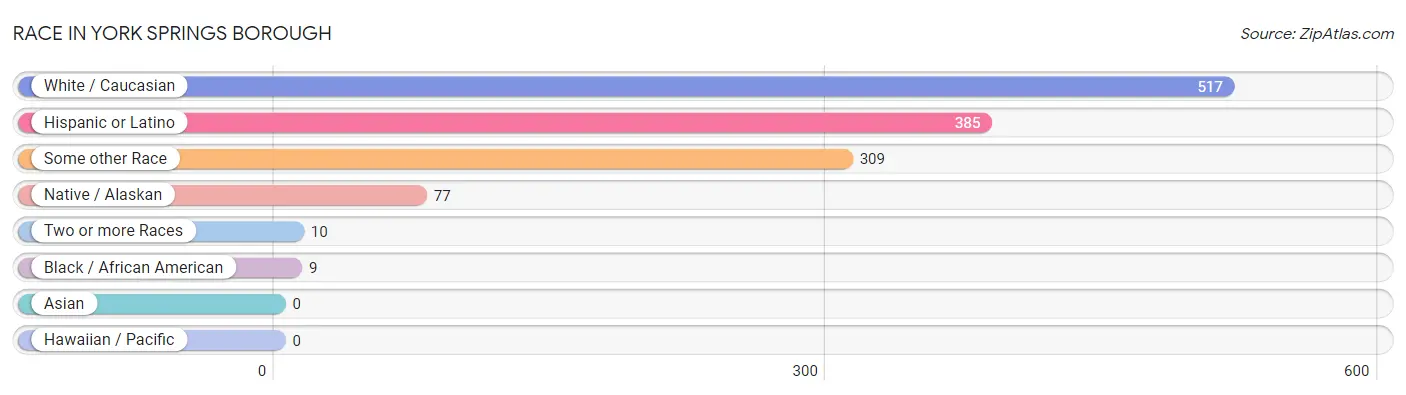
| Race | # Population | % Population |
| Asian | 0 | 0.0% |
| Black / African American | 9 | 1.0% |
| Hawaiian / Pacific | 0 | 0.0% |
| Hispanic or Latino | 385 | 41.8% |
| Native / Alaskan | 77 | 8.4% |
| White / Caucasian | 517 | 56.1% |
| Two or more Races | 10 | 1.1% |
| Some other Race | 309 | 33.5% |
| Total | 922 | 100.0% |
Ancestry in York Springs borough
The most populous ancestries reported in York Springs borough are Mexican (354 | 38.4%), German (219 | 23.7%), American (107 | 11.6%), Mexican American Indian (77 | 8.4%), and Irish (58 | 6.3%), together accounting for 88.4% of all York Springs borough residents.
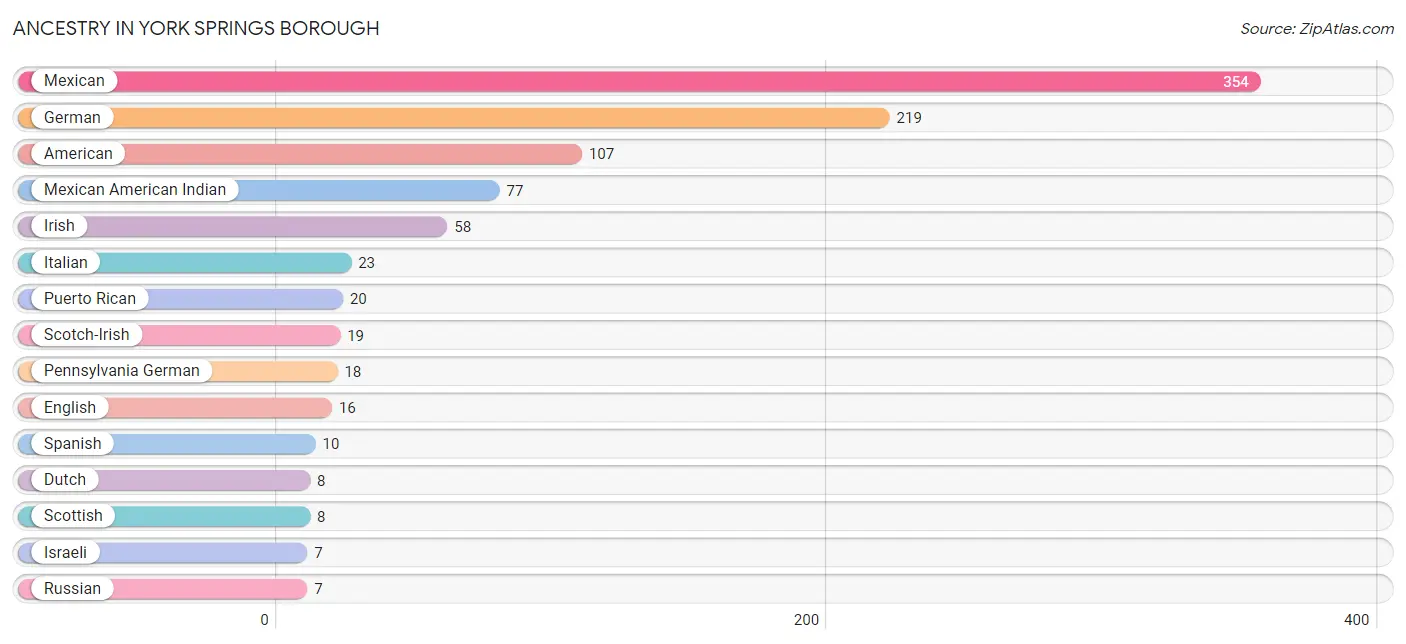
| Ancestry | # Population | % Population |
| American | 107 | 11.6% |
| British | 6 | 0.6% |
| Central American | 1 | 0.1% |
| Dutch | 8 | 0.9% |
| English | 16 | 1.7% |
| European | 2 | 0.2% |
| German | 219 | 23.7% |
| Honduran | 1 | 0.1% |
| Irish | 58 | 6.3% |
| Israeli | 7 | 0.8% |
| Italian | 23 | 2.5% |
| Lithuanian | 2 | 0.2% |
| Mexican | 354 | 38.4% |
| Mexican American Indian | 77 | 8.4% |
| Pennsylvania German | 18 | 1.9% |
| Polish | 2 | 0.2% |
| Puerto Rican | 20 | 2.2% |
| Russian | 7 | 0.8% |
| Scotch-Irish | 19 | 2.1% |
| Scottish | 8 | 0.9% |
| Spanish | 10 | 1.1% |
| Swiss | 3 | 0.3% | View All 22 Rows |
Immigrants in York Springs borough
The most numerous immigrant groups reported in York Springs borough came from Central America (222 | 24.1%), Latin America (222 | 24.1%), Mexico (222 | 24.1%), Asia (9 | 1.0%), and Eastern Asia (9 | 1.0%), together accounting for 74.2% of all York Springs borough residents.
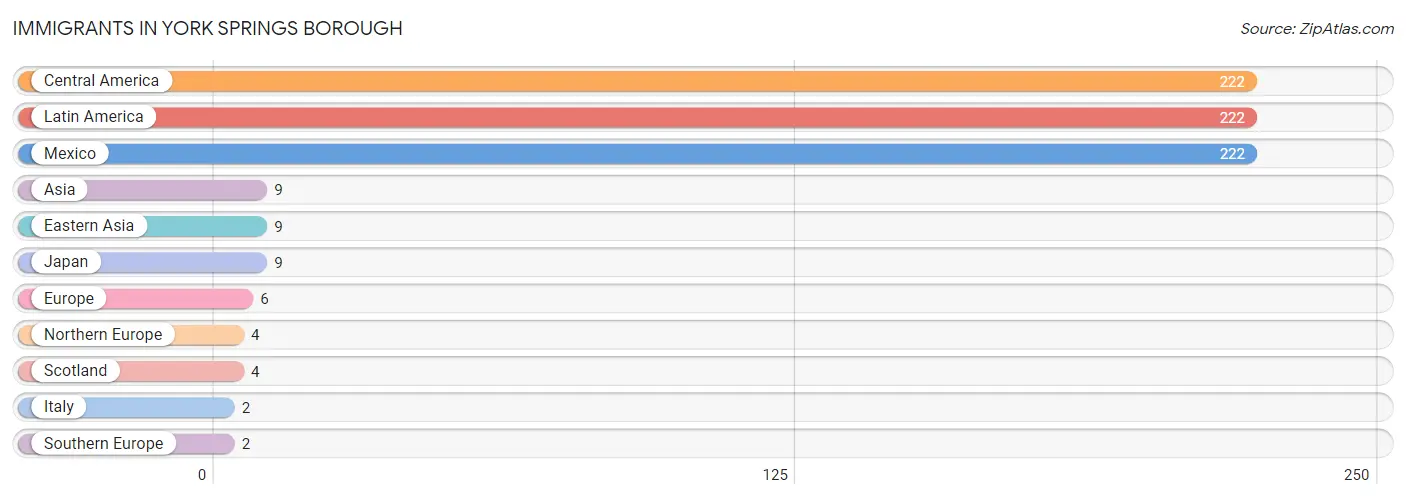
| Immigration Origin | # Population | % Population |
| Asia | 9 | 1.0% |
| Central America | 222 | 24.1% |
| Eastern Asia | 9 | 1.0% |
| Europe | 6 | 0.6% |
| Italy | 2 | 0.2% |
| Japan | 9 | 1.0% |
| Latin America | 222 | 24.1% |
| Mexico | 222 | 24.1% |
| Northern Europe | 4 | 0.4% |
| Scotland | 4 | 0.4% |
| Southern Europe | 2 | 0.2% | View All 11 Rows |
Sex and Age in York Springs borough
Sex and Age in York Springs borough
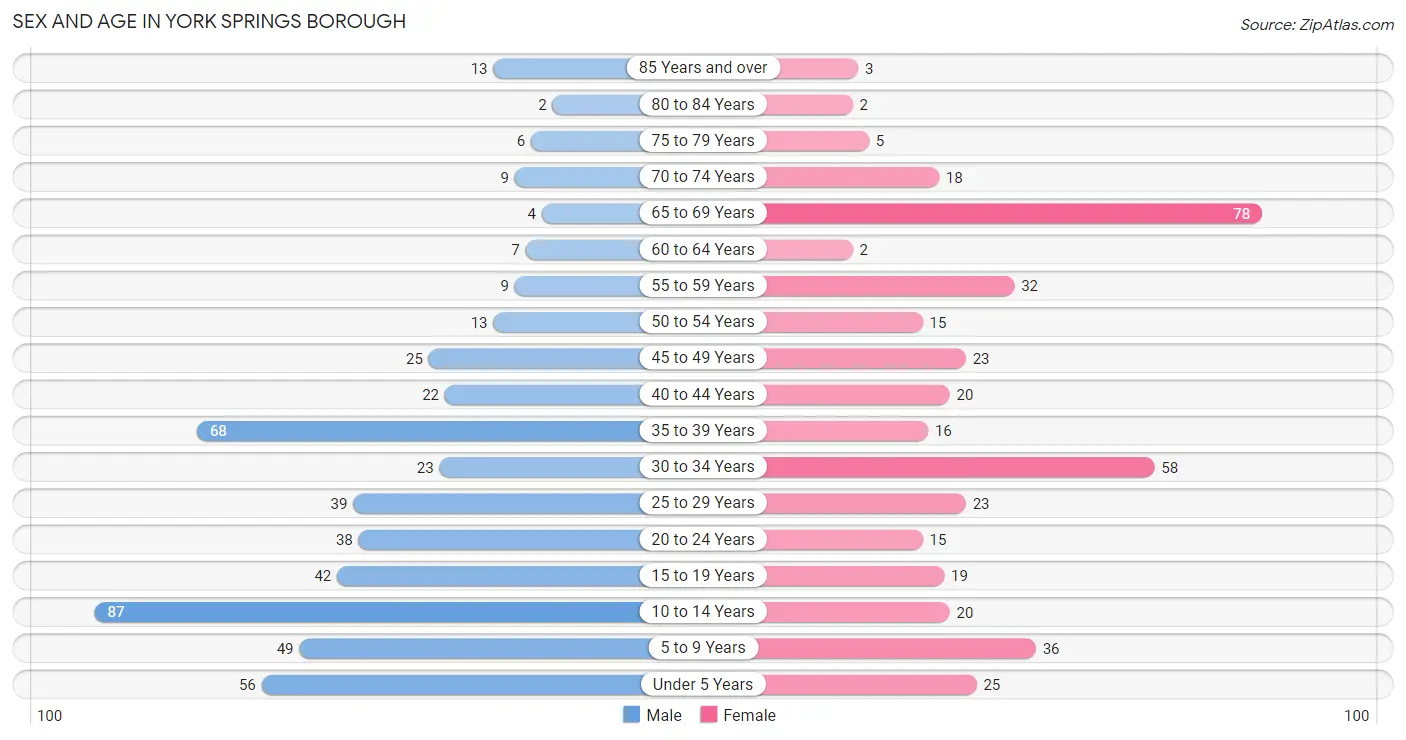
The most populous age groups in York Springs borough are 10 to 14 Years (87 | 17.0%) for men and 65 to 69 Years (78 | 19.0%) for women.
| Age Bracket | Male | Female |
| Under 5 Years | 56 (10.9%) | 25 (6.1%) |
| 5 to 9 Years | 49 (9.6%) | 36 (8.8%) |
| 10 to 14 Years | 87 (17.0%) | 20 (4.9%) |
| 15 to 19 Years | 42 (8.2%) | 19 (4.6%) |
| 20 to 24 Years | 38 (7.4%) | 15 (3.7%) |
| 25 to 29 Years | 39 (7.6%) | 23 (5.6%) |
| 30 to 34 Years | 23 (4.5%) | 58 (14.1%) |
| 35 to 39 Years | 68 (13.3%) | 16 (3.9%) |
| 40 to 44 Years | 22 (4.3%) | 20 (4.9%) |
| 45 to 49 Years | 25 (4.9%) | 23 (5.6%) |
| 50 to 54 Years | 13 (2.5%) | 15 (3.7%) |
| 55 to 59 Years | 9 (1.8%) | 32 (7.8%) |
| 60 to 64 Years | 7 (1.4%) | 2 (0.5%) |
| 65 to 69 Years | 4 (0.8%) | 78 (19.0%) |
| 70 to 74 Years | 9 (1.8%) | 18 (4.4%) |
| 75 to 79 Years | 6 (1.2%) | 5 (1.2%) |
| 80 to 84 Years | 2 (0.4%) | 2 (0.5%) |
| 85 Years and over | 13 (2.5%) | 3 (0.7%) |
| Total | 512 (100.0%) | 410 (100.0%) |
Families and Households in York Springs borough
Median Family Size in York Springs borough
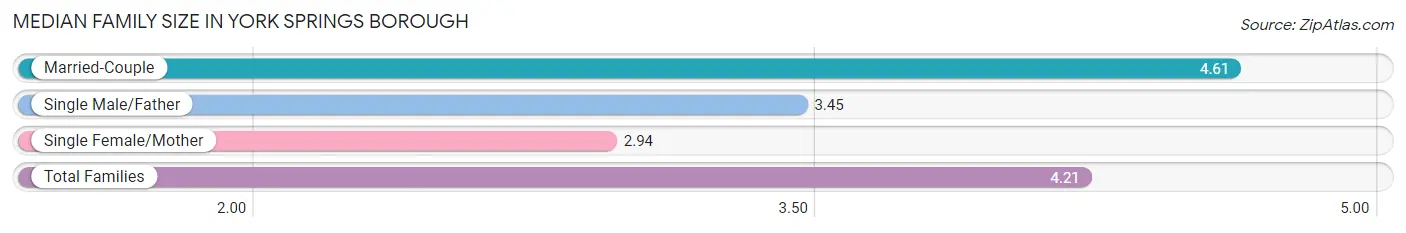
The median family size in York Springs borough is 4.21 persons per family, with married-couple families (136 | 72.7%) accounting for the largest median family size of 4.61 persons per family. On the other hand, single female/mother families (31 | 16.6%) represent the smallest median family size with 2.94 persons per family.
| Family Type | # Families | Family Size |
| Married-Couple | 136 (72.7%) | 4.61 |
| Single Male/Father | 20 (10.7%) | 3.45 |
| Single Female/Mother | 31 (16.6%) | 2.94 |
| Total Families | 187 (100.0%) | 4.21 |
Median Household Size in York Springs borough
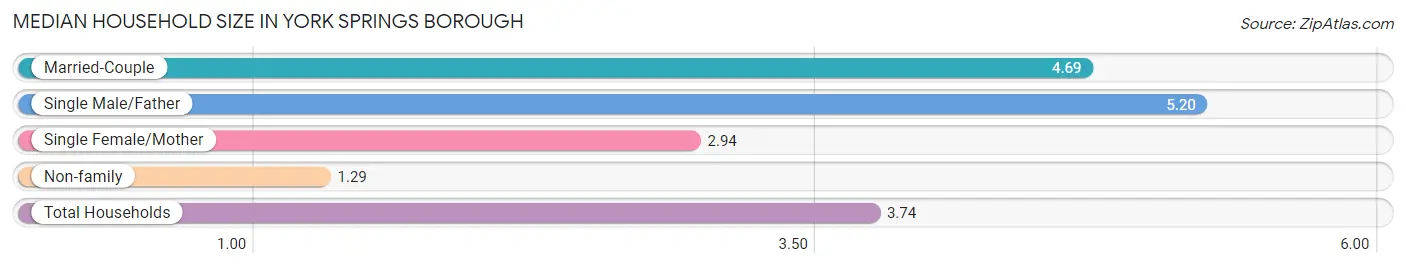
The median household size in York Springs borough is 3.74 persons per household, with single male/father households (20 | 8.3%) accounting for the largest median household size of 5.2 persons per household. non-family households (55 | 22.7%) represent the smallest median household size with 1.29 persons per household.
| Household Type | # Households | Household Size |
| Married-Couple | 136 (56.2%) | 4.69 |
| Single Male/Father | 20 (8.3%) | 5.20 |
| Single Female/Mother | 31 (12.8%) | 2.94 |
| Non-family | 55 (22.7%) | 1.29 |
| Total Households | 242 (100.0%) | 3.74 |
Household Size by Marriage Status in York Springs borough
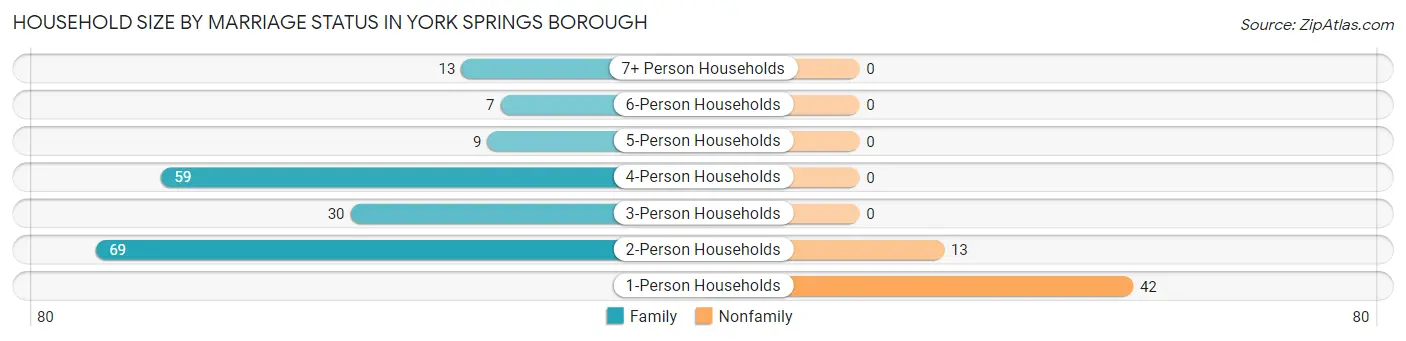
Out of a total of 242 households in York Springs borough, 187 (77.3%) are family households, while 55 (22.7%) are nonfamily households. The most numerous type of family households are 2-person households, comprising 69, and the most common type of nonfamily households are 1-person households, comprising 42.
| Household Size | Family Households | Nonfamily Households |
| 1-Person Households | - | 42 (17.4%) |
| 2-Person Households | 69 (28.5%) | 13 (5.4%) |
| 3-Person Households | 30 (12.4%) | 0 (0.0%) |
| 4-Person Households | 59 (24.4%) | 0 (0.0%) |
| 5-Person Households | 9 (3.7%) | 0 (0.0%) |
| 6-Person Households | 7 (2.9%) | 0 (0.0%) |
| 7+ Person Households | 13 (5.4%) | 0 (0.0%) |
| Total | 187 (77.3%) | 55 (22.7%) |
Female Fertility in York Springs borough
Fertility by Age in York Springs borough
Average fertility rate in York Springs borough is 52.0 births per 1,000 women. Women in the age bracket of 20 to 34 years have the highest fertility rate with 94.0 births per 1,000 women. Women in the age bracket of 20 to 34 years acount for 100.0% of all women with births.
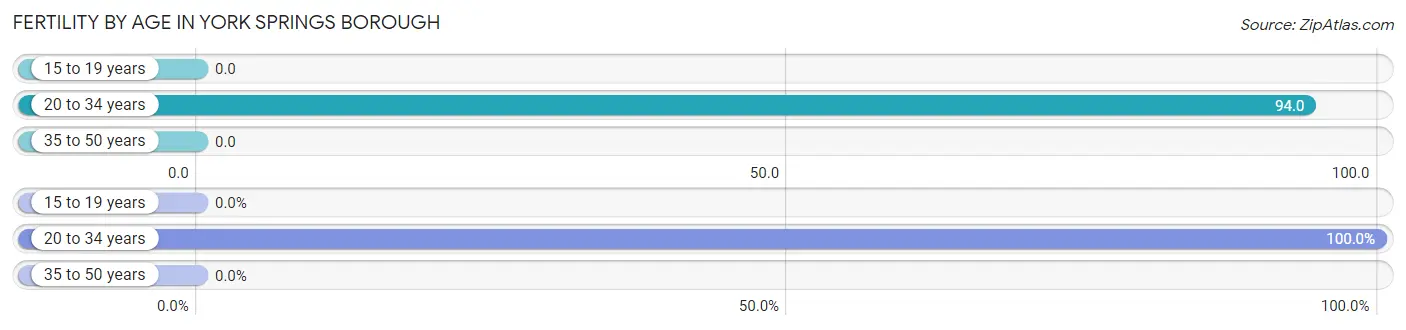
| Age Bracket | Women with Births | Births / 1,000 Women |
| 15 to 19 years | 0 (0.0%) | 0.0 |
| 20 to 34 years | 9 (100.0%) | 94.0 |
| 35 to 50 years | 0 (0.0%) | 0.0 |
| Total | 9 (100.0%) | 52.0 |
Fertility by Age by Marriage Status in York Springs borough
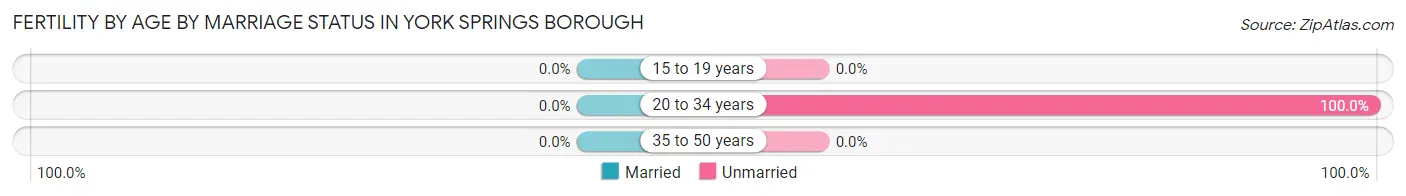
| Age Bracket | Married | Unmarried |
| 15 to 19 years | 0 (0.0%) | 0 (0.0%) |
| 20 to 34 years | 0 (0.0%) | 9 (100.0%) |
| 35 to 50 years | 0 (0.0%) | 0 (0.0%) |
| Total | 0 (0.0%) | 9 (100.0%) |
Fertility by Education in York Springs borough
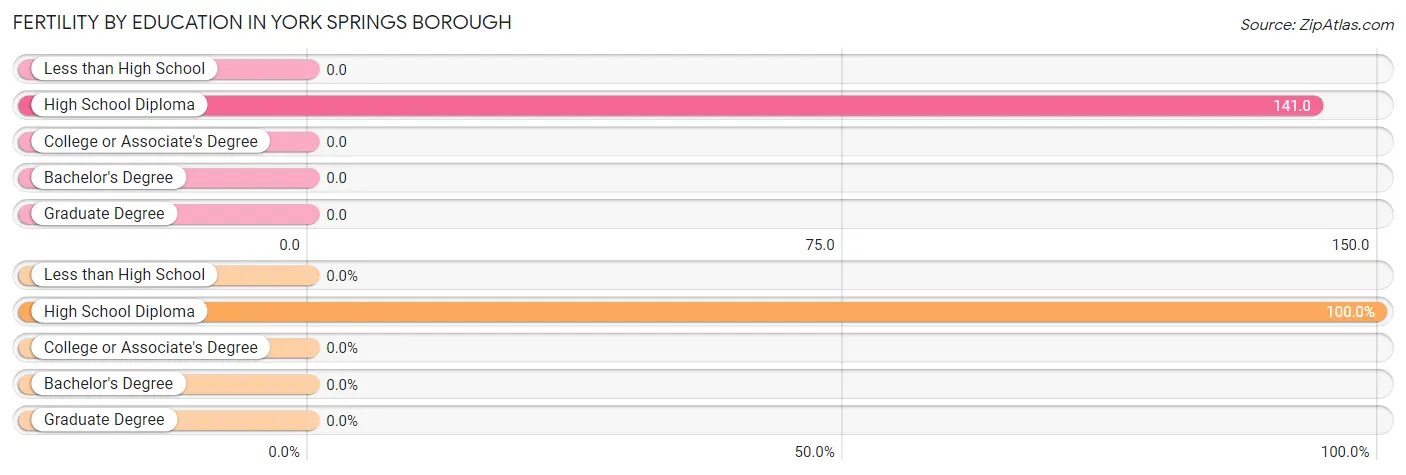
| Educational Attainment | Women with Births | Births / 1,000 Women |
| Less than High School | 0 (0.0%) | 0.0 |
| High School Diploma | 9 (100.0%) | 141.0 |
| College or Associate's Degree | 0 (0.0%) | 0.0 |
| Bachelor's Degree | 0 (0.0%) | 0.0 |
| Graduate Degree | 0 (0.0%) | 0.0 |
| Total | 9 (100.0%) | 52.0 |
Fertility by Education by Marriage Status in York Springs borough
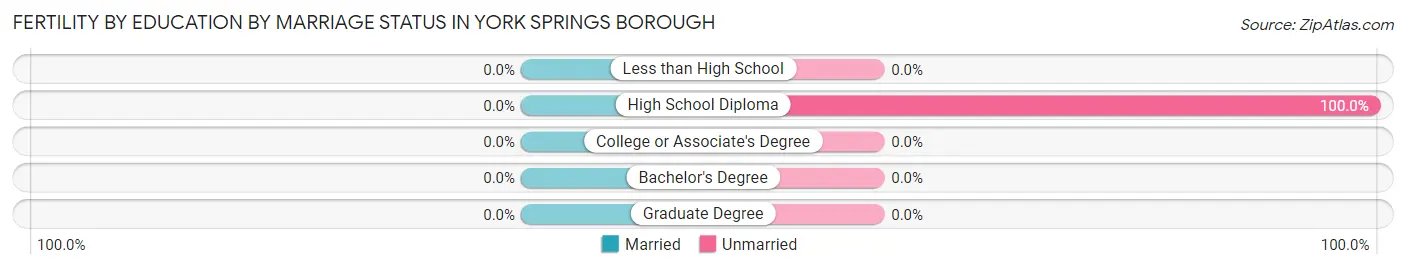
| Educational Attainment | Married | Unmarried |
| Less than High School | 0 (0.0%) | 0 (0.0%) |
| High School Diploma | 0 (0.0%) | 9 (100.0%) |
| College or Associate's Degree | 0 (0.0%) | 0 (0.0%) |
| Bachelor's Degree | 0 (0.0%) | 0 (0.0%) |
| Graduate Degree | 0 (0.0%) | 0 (0.0%) |
| Total | 0 (0.0%) | 9 (100.0%) |
Employment Characteristics in York Springs borough
Employment by Class of Employer in York Springs borough
Among the 401 employed individuals in York Springs borough, private company employees (319 | 79.5%), not-for-profit organizations (34 | 8.5%), and self-employed (not incorporated) (11 | 2.7%) make up the most common classes of employment.
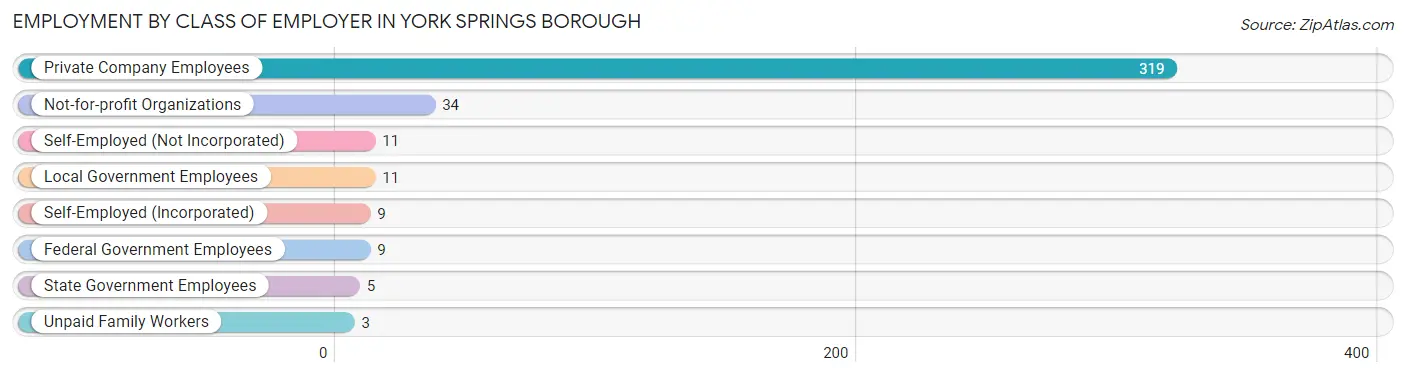
| Employer Class | # Employees | % Employees |
| Private Company Employees | 319 | 79.5% |
| Self-Employed (Incorporated) | 9 | 2.2% |
| Self-Employed (Not Incorporated) | 11 | 2.7% |
| Not-for-profit Organizations | 34 | 8.5% |
| Local Government Employees | 11 | 2.7% |
| State Government Employees | 5 | 1.3% |
| Federal Government Employees | 9 | 2.2% |
| Unpaid Family Workers | 3 | 0.7% |
| Total | 401 | 100.0% |
Employment Status by Age in York Springs borough
According to the labor force statistics for York Springs borough, out of the total population over 16 years of age (623), 67.9% or 423 individuals are in the labor force, with 5.2% or 22 of them unemployed. The age group with the highest labor force participation rate is 20 to 24 years, with 100.0% or 53 individuals in the labor force. Within the labor force, the 16 to 19 years age range has the highest percentage of unemployed individuals, with 37.5% or 6 of them being unemployed.
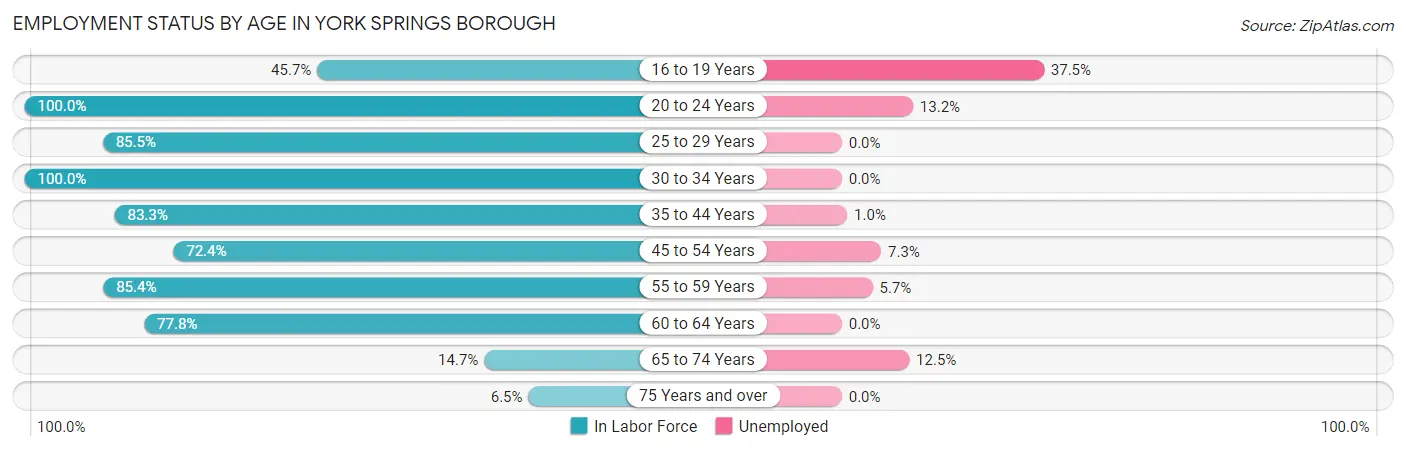
| Age Bracket | In Labor Force | Unemployed |
| 16 to 19 Years | 16 (45.7%) | 6 (37.5%) |
| 20 to 24 Years | 53 (100.0%) | 7 (13.2%) |
| 25 to 29 Years | 53 (85.5%) | 0 (0.0%) |
| 30 to 34 Years | 81 (100.0%) | 0 (0.0%) |
| 35 to 44 Years | 105 (83.3%) | 1 (1.0%) |
| 45 to 54 Years | 55 (72.4%) | 4 (7.3%) |
| 55 to 59 Years | 35 (85.4%) | 2 (5.7%) |
| 60 to 64 Years | 7 (77.8%) | 0 (0.0%) |
| 65 to 74 Years | 16 (14.7%) | 2 (12.5%) |
| 75 Years and over | 2 (6.5%) | 0 (0.0%) |
| Total | 423 (67.9%) | 22 (5.2%) |
Employment Status by Educational Attainment in York Springs borough
According to labor force statistics for York Springs borough, 85.1% of individuals (336) out of the total population between 25 and 64 years of age (395) are in the labor force, with 2.1% or 7 of them being unemployed. The group with the highest labor force participation rate are those with the educational attainment of high school diploma, with 91.3% or 115 individuals in the labor force. Within the labor force, individuals with college / associate degree education have the highest percentage of unemployment, with 9.7% or 7 of them being unemployed.
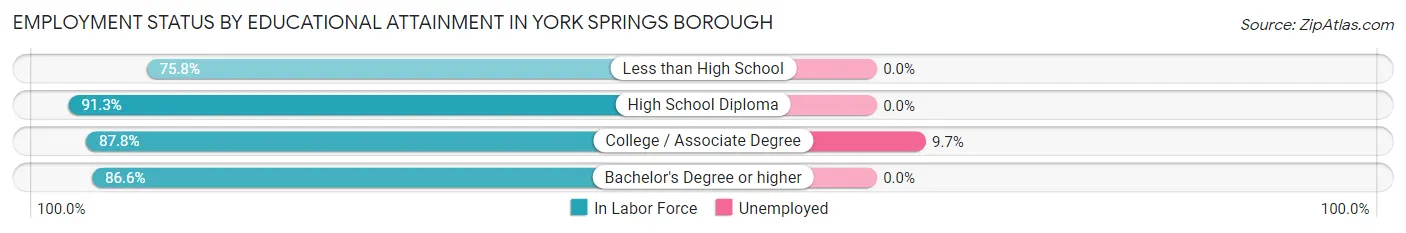
| Educational Attainment | In Labor Force | Unemployed |
| Less than High School | 91 (75.8%) | 0 (0.0%) |
| High School Diploma | 115 (91.3%) | 0 (0.0%) |
| College / Associate Degree | 72 (87.8%) | 8 (9.7%) |
| Bachelor's Degree or higher | 58 (86.6%) | 0 (0.0%) |
| Total | 336 (85.1%) | 8 (2.1%) |
Employment Occupations by Sex in York Springs borough
Management, Business, Science and Arts Occupations
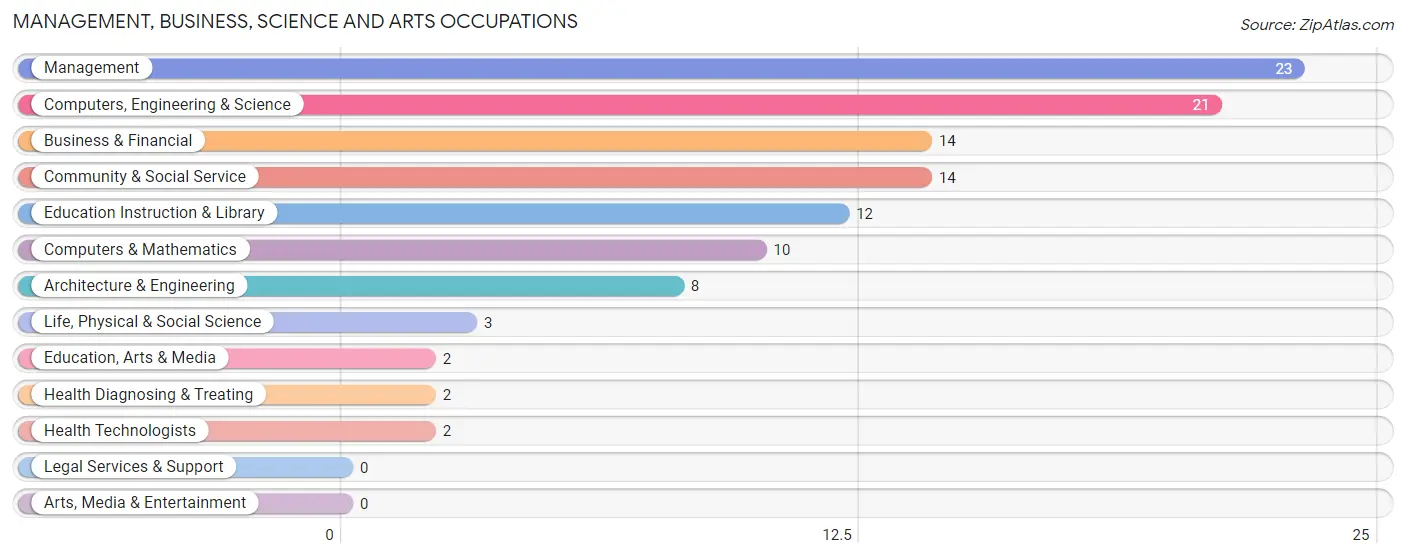
The most common Management, Business, Science and Arts occupations in York Springs borough are Management (23 | 5.7%), Computers, Engineering & Science (21 | 5.2%), Business & Financial (14 | 3.5%), Community & Social Service (14 | 3.5%), and Education Instruction & Library (12 | 3.0%).
Management, Business, Science and Arts Occupations by Sex
Within the Management, Business, Science and Arts occupations in York Springs borough, the most male-oriented occupations are Management (100.0%), Computers & Mathematics (100.0%), and Life, Physical & Social Science (100.0%), while the most female-oriented occupations are Health Diagnosing & Treating (100.0%), Health Technologists (100.0%), and Education Instruction & Library (91.7%).
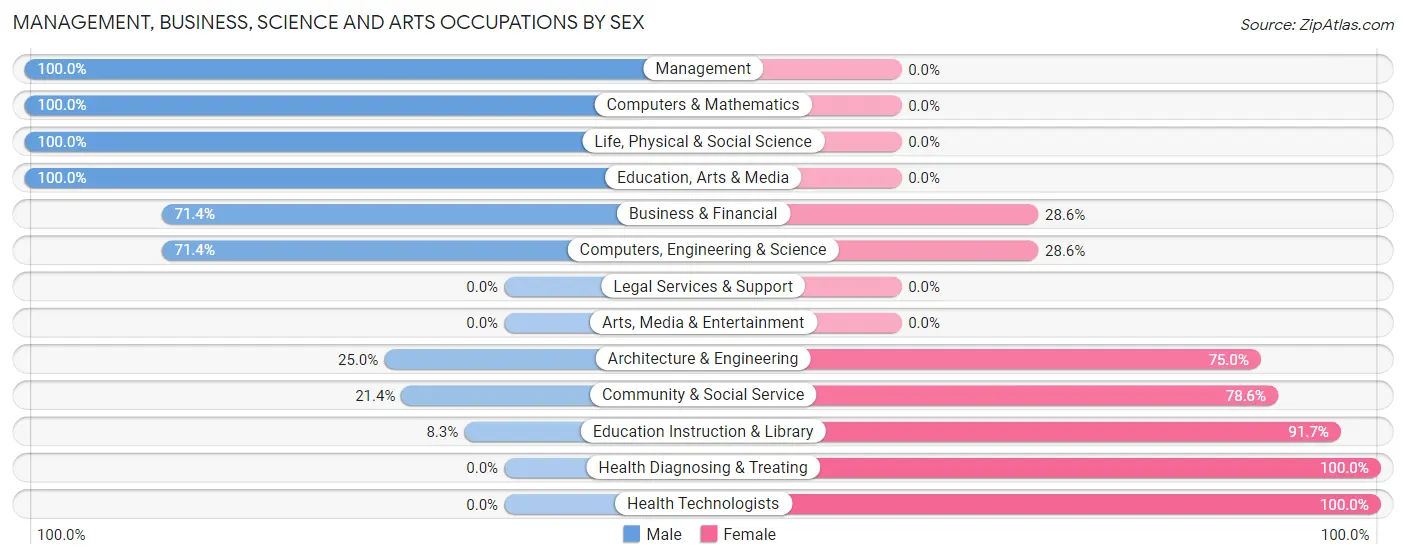
| Occupation | Male | Female |
| Management | 23 (100.0%) | 0 (0.0%) |
| Business & Financial | 10 (71.4%) | 4 (28.6%) |
| Computers, Engineering & Science | 15 (71.4%) | 6 (28.6%) |
| Computers & Mathematics | 10 (100.0%) | 0 (0.0%) |
| Architecture & Engineering | 2 (25.0%) | 6 (75.0%) |
| Life, Physical & Social Science | 3 (100.0%) | 0 (0.0%) |
| Community & Social Service | 3 (21.4%) | 11 (78.6%) |
| Education, Arts & Media | 2 (100.0%) | 0 (0.0%) |
| Legal Services & Support | 0 (0.0%) | 0 (0.0%) |
| Education Instruction & Library | 1 (8.3%) | 11 (91.7%) |
| Arts, Media & Entertainment | 0 (0.0%) | 0 (0.0%) |
| Health Diagnosing & Treating | 0 (0.0%) | 2 (100.0%) |
| Health Technologists | 0 (0.0%) | 2 (100.0%) |
| Total (Category) | 51 (68.9%) | 23 (31.1%) |
| Total (Overall) | 237 (59.1%) | 164 (40.9%) |
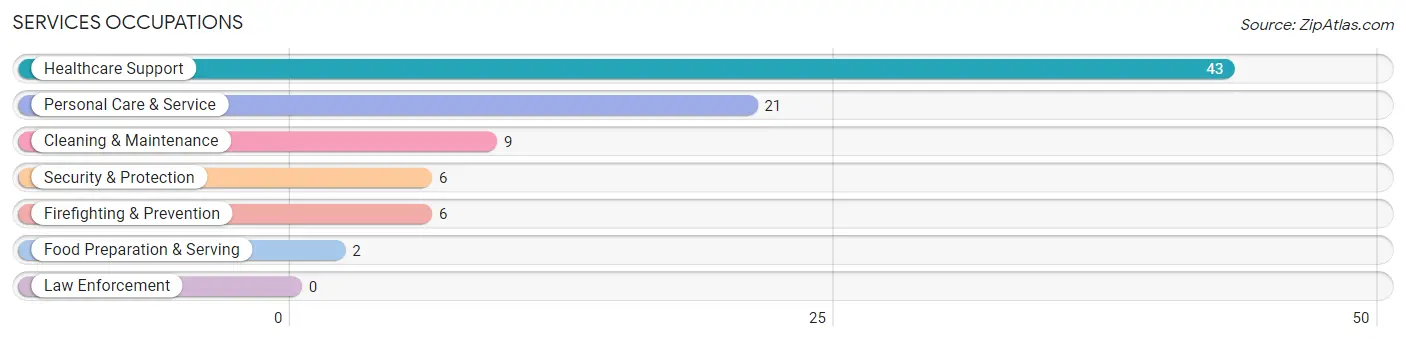
Services Occupations
The most common Services occupations in York Springs borough are Healthcare Support (43 | 10.7%), Personal Care & Service (21 | 5.2%), Cleaning & Maintenance (9 | 2.2%), Security & Protection (6 | 1.5%), and Firefighting & Prevention (6 | 1.5%).
Services Occupations by Sex
Within the Services occupations in York Springs borough, the most male-oriented occupations are Security & Protection (100.0%), Firefighting & Prevention (100.0%), and Food Preparation & Serving (100.0%), while the most female-oriented occupations are Personal Care & Service (100.0%), Healthcare Support (58.1%), and Cleaning & Maintenance (11.1%).
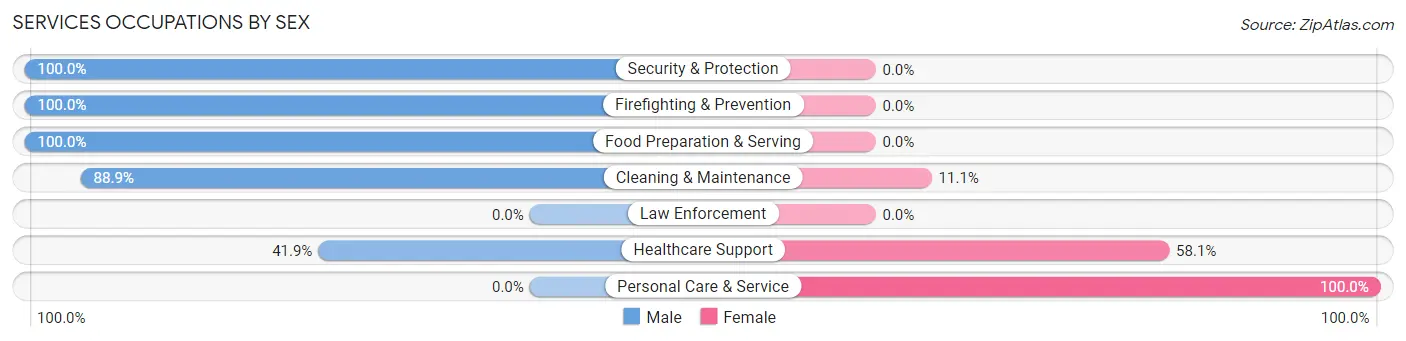
| Occupation | Male | Female |
| Healthcare Support | 18 (41.9%) | 25 (58.1%) |
| Security & Protection | 6 (100.0%) | 0 (0.0%) |
| Firefighting & Prevention | 6 (100.0%) | 0 (0.0%) |
| Law Enforcement | 0 (0.0%) | 0 (0.0%) |
| Food Preparation & Serving | 2 (100.0%) | 0 (0.0%) |
| Cleaning & Maintenance | 8 (88.9%) | 1 (11.1%) |
| Personal Care & Service | 0 (0.0%) | 21 (100.0%) |
| Total (Category) | 34 (42.0%) | 47 (58.0%) |
| Total (Overall) | 237 (59.1%) | 164 (40.9%) |
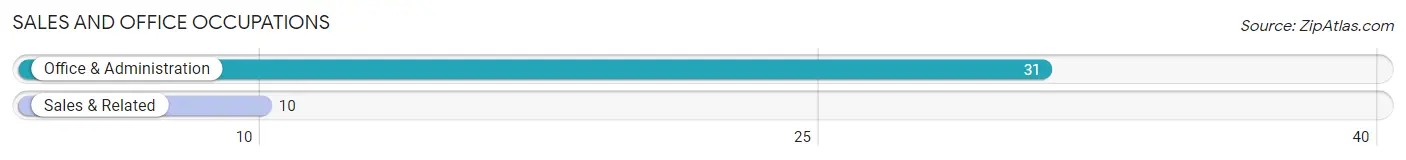
Sales and Office Occupations
The most common Sales and Office occupations in York Springs borough are Office & Administration (31 | 7.7%), and Sales & Related (10 | 2.5%).
Sales and Office Occupations by Sex
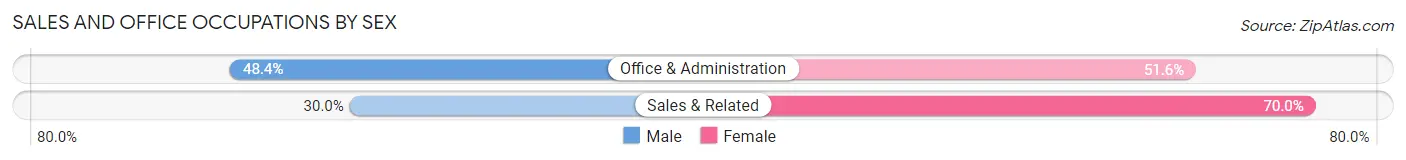
| Occupation | Male | Female |
| Sales & Related | 3 (30.0%) | 7 (70.0%) |
| Office & Administration | 15 (48.4%) | 16 (51.6%) |
| Total (Category) | 18 (43.9%) | 23 (56.1%) |
| Total (Overall) | 237 (59.1%) | 164 (40.9%) |
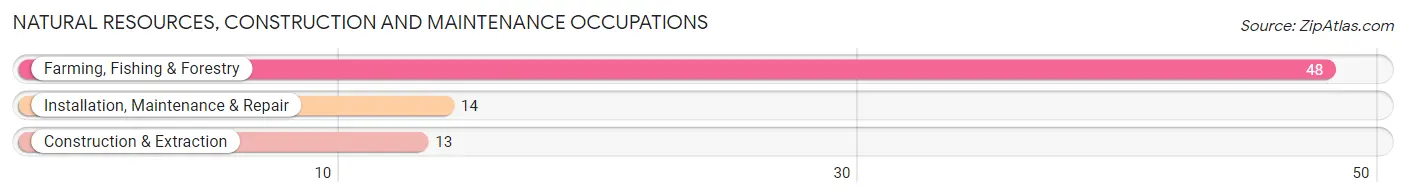
Natural Resources, Construction and Maintenance Occupations
The most common Natural Resources, Construction and Maintenance occupations in York Springs borough are Farming, Fishing & Forestry (48 | 12.0%), Installation, Maintenance & Repair (14 | 3.5%), and Construction & Extraction (13 | 3.2%).
Natural Resources, Construction and Maintenance Occupations by Sex
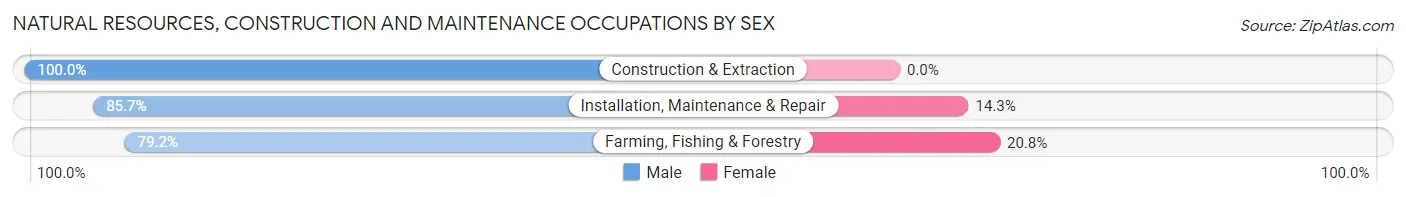
| Occupation | Male | Female |
| Farming, Fishing & Forestry | 38 (79.2%) | 10 (20.8%) |
| Construction & Extraction | 13 (100.0%) | 0 (0.0%) |
| Installation, Maintenance & Repair | 12 (85.7%) | 2 (14.3%) |
| Total (Category) | 63 (84.0%) | 12 (16.0%) |
| Total (Overall) | 237 (59.1%) | 164 (40.9%) |
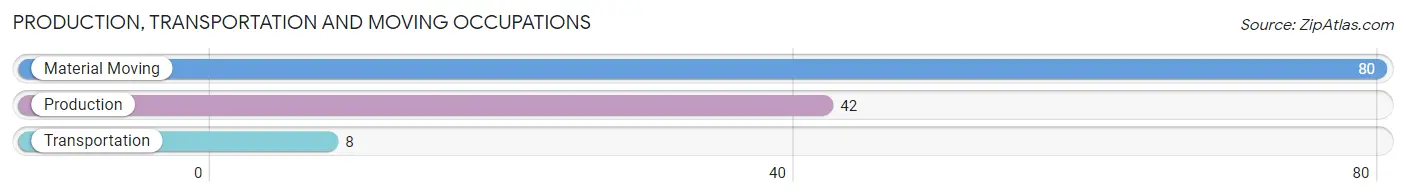
Production, Transportation and Moving Occupations
The most common Production, Transportation and Moving occupations in York Springs borough are Material Moving (80 | 20.0%), Production (42 | 10.5%), and Transportation (8 | 2.0%).
Production, Transportation and Moving Occupations by Sex
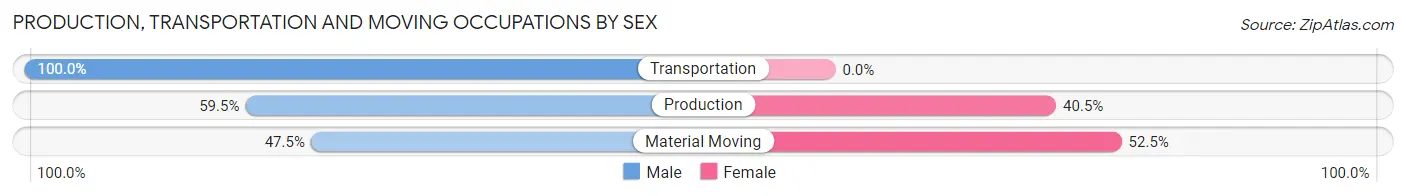
| Occupation | Male | Female |
| Production | 25 (59.5%) | 17 (40.5%) |
| Transportation | 8 (100.0%) | 0 (0.0%) |
| Material Moving | 38 (47.5%) | 42 (52.5%) |
| Total (Category) | 71 (54.6%) | 59 (45.4%) |
| Total (Overall) | 237 (59.1%) | 164 (40.9%) |
Employment Industries by Sex in York Springs borough
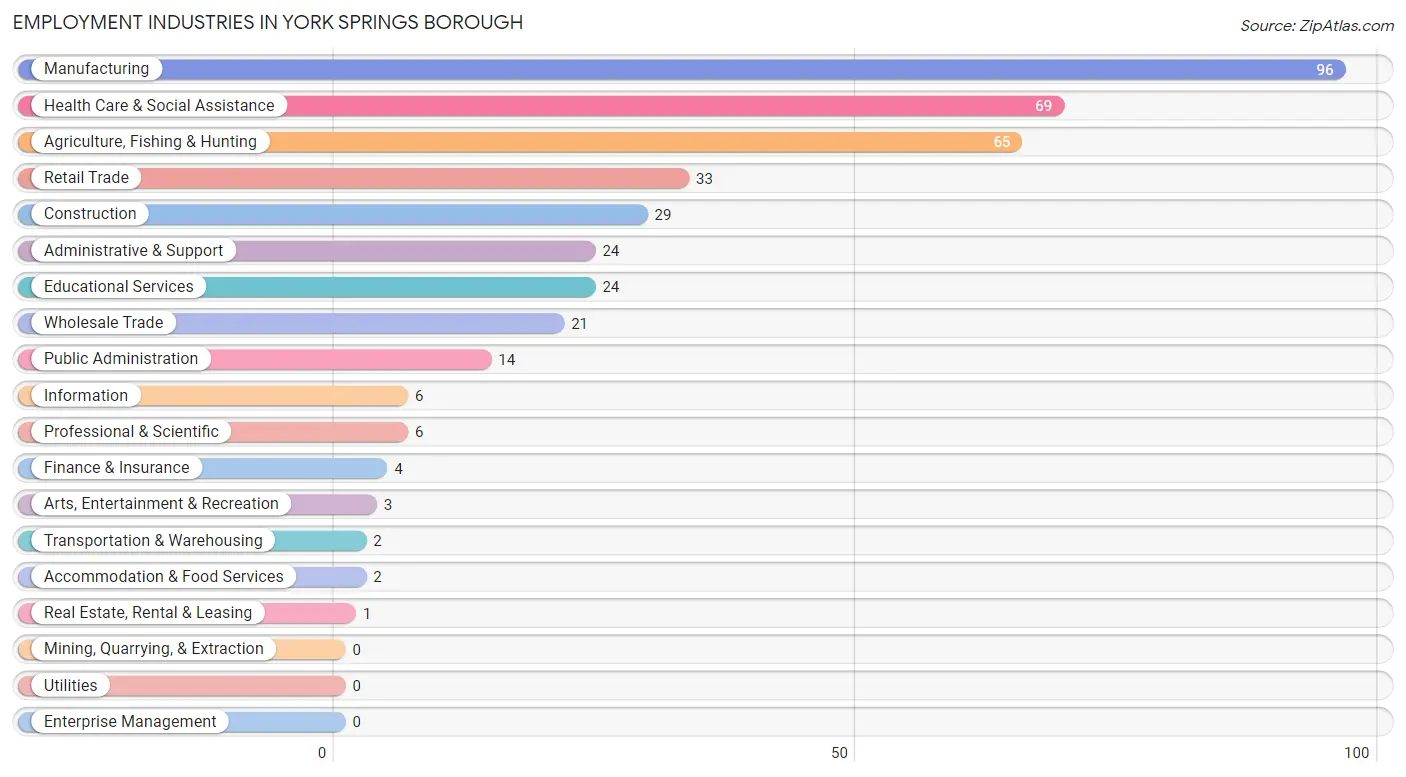
Employment Industries in York Springs borough
The major employment industries in York Springs borough include Manufacturing (96 | 23.9%), Health Care & Social Assistance (69 | 17.2%), Agriculture, Fishing & Hunting (65 | 16.2%), Retail Trade (33 | 8.2%), and Construction (29 | 7.2%).
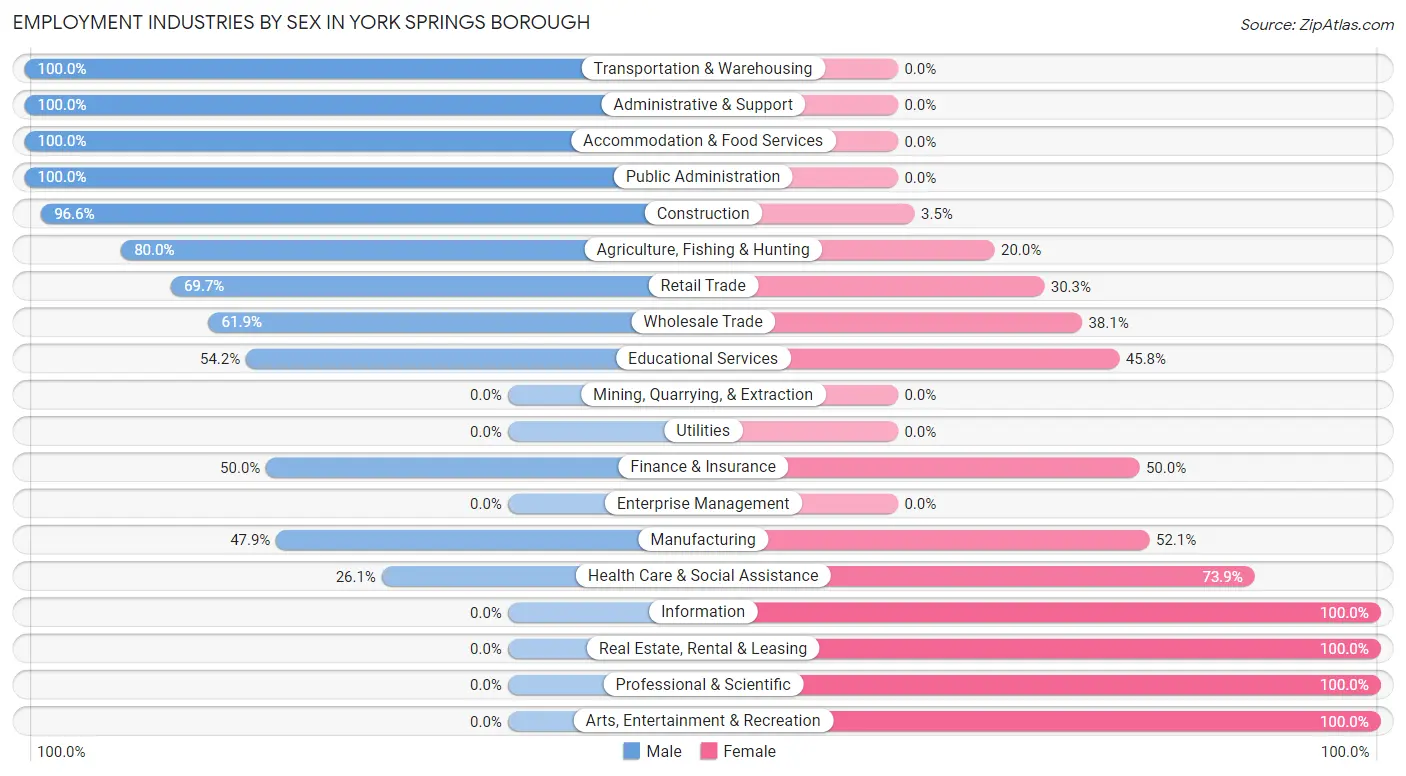
Employment Industries by Sex in York Springs borough
The York Springs borough industries that see more men than women are Transportation & Warehousing (100.0%), Administrative & Support (100.0%), and Accommodation & Food Services (100.0%), whereas the industries that tend to have a higher number of women are Information (100.0%), Real Estate, Rental & Leasing (100.0%), and Professional & Scientific (100.0%).
| Industry | Male | Female |
| Agriculture, Fishing & Hunting | 52 (80.0%) | 13 (20.0%) |
| Mining, Quarrying, & Extraction | 0 (0.0%) | 0 (0.0%) |
| Construction | 28 (96.6%) | 1 (3.5%) |
| Manufacturing | 46 (47.9%) | 50 (52.1%) |
| Wholesale Trade | 13 (61.9%) | 8 (38.1%) |
| Retail Trade | 23 (69.7%) | 10 (30.3%) |
| Transportation & Warehousing | 2 (100.0%) | 0 (0.0%) |
| Utilities | 0 (0.0%) | 0 (0.0%) |
| Information | 0 (0.0%) | 6 (100.0%) |
| Finance & Insurance | 2 (50.0%) | 2 (50.0%) |
| Real Estate, Rental & Leasing | 0 (0.0%) | 1 (100.0%) |
| Professional & Scientific | 0 (0.0%) | 6 (100.0%) |
| Enterprise Management | 0 (0.0%) | 0 (0.0%) |
| Administrative & Support | 24 (100.0%) | 0 (0.0%) |
| Educational Services | 13 (54.2%) | 11 (45.8%) |
| Health Care & Social Assistance | 18 (26.1%) | 51 (73.9%) |
| Arts, Entertainment & Recreation | 0 (0.0%) | 3 (100.0%) |
| Accommodation & Food Services | 2 (100.0%) | 0 (0.0%) |
| Public Administration | 14 (100.0%) | 0 (0.0%) |
| Total | 237 (59.1%) | 164 (40.9%) |
Education in York Springs borough
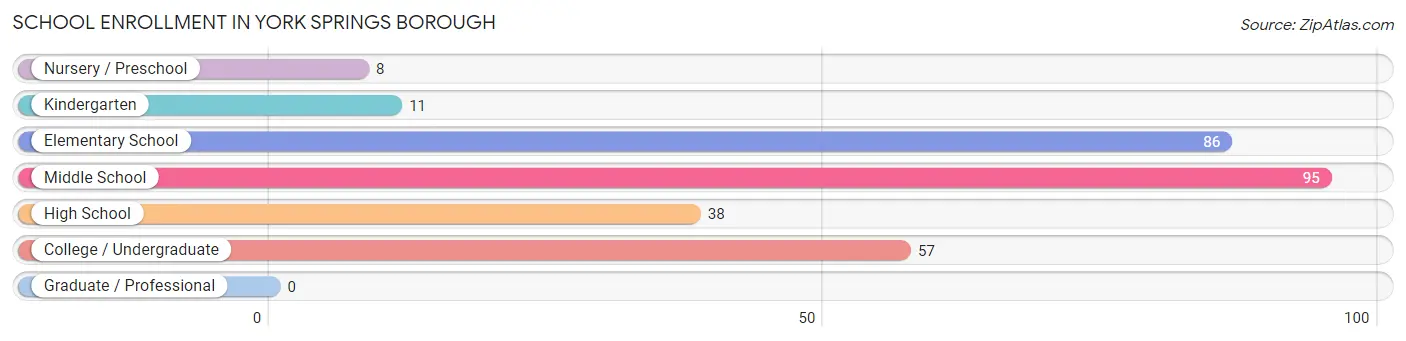
School Enrollment in York Springs borough
The most common levels of schooling among the 295 students in York Springs borough are middle school (95 | 32.2%), elementary school (86 | 29.1%), and college / undergraduate (57 | 19.3%).
| School Level | # Students | % Students |
| Nursery / Preschool | 8 | 2.7% |
| Kindergarten | 11 | 3.7% |
| Elementary School | 86 | 29.1% |
| Middle School | 95 | 32.2% |
| High School | 38 | 12.9% |
| College / Undergraduate | 57 | 19.3% |
| Graduate / Professional | 0 | 0.0% |
| Total | 295 | 100.0% |
School Enrollment by Age by Funding Source in York Springs borough
Out of a total of 295 students who are enrolled in schools in York Springs borough, 8 (2.7%) attend a private institution, while the remaining 287 (97.3%) are enrolled in public schools. The age group of 10 to 14 year olds has the highest likelihood of being enrolled in private schools, with 7 (6.5% in the age bracket) enrolled. Conversely, the age group of 3 to 4 year olds has the lowest likelihood of being enrolled in a private school, with 8 (100.0% in the age bracket) attending a public institution.
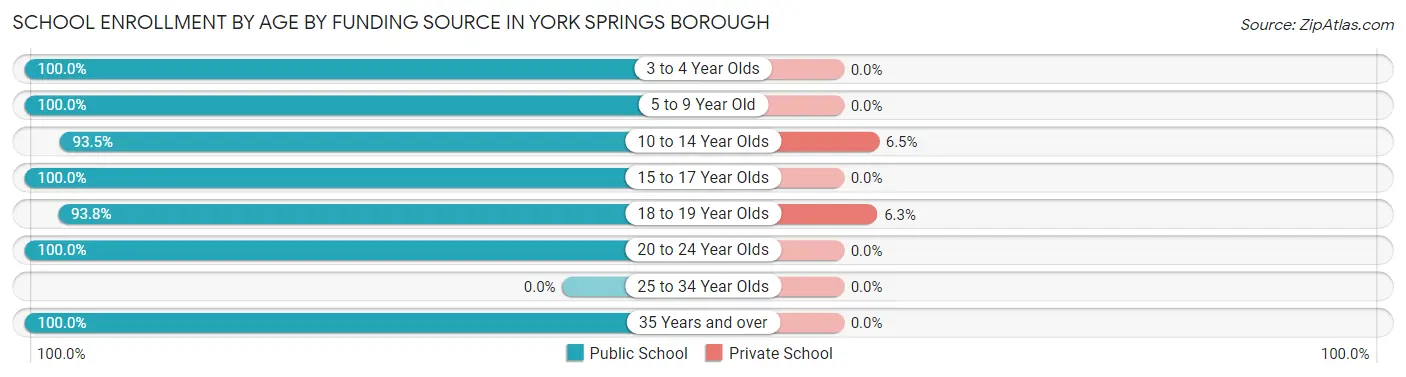
| Age Bracket | Public School | Private School |
| 3 to 4 Year Olds | 8 (100.0%) | 0 (0.0%) |
| 5 to 9 Year Old | 85 (100.0%) | 0 (0.0%) |
| 10 to 14 Year Olds | 100 (93.5%) | 7 (6.5%) |
| 15 to 17 Year Olds | 37 (100.0%) | 0 (0.0%) |
| 18 to 19 Year Olds | 15 (93.8%) | 1 (6.2%) |
| 20 to 24 Year Olds | 32 (100.0%) | 0 (0.0%) |
| 25 to 34 Year Olds | 0 (0.0%) | 0 (0.0%) |
| 35 Years and over | 10 (100.0%) | 0 (0.0%) |
| Total | 287 (97.3%) | 8 (2.7%) |
Educational Attainment by Field of Study in York Springs borough
Business (36 | 37.1%), science & technology (18 | 18.6%), bio, nature & agricultural (11 | 11.3%), education (9 | 9.3%), and social sciences (5 | 5.1%) are the most common fields of study among 97 individuals in York Springs borough who have obtained a bachelor's degree or higher.
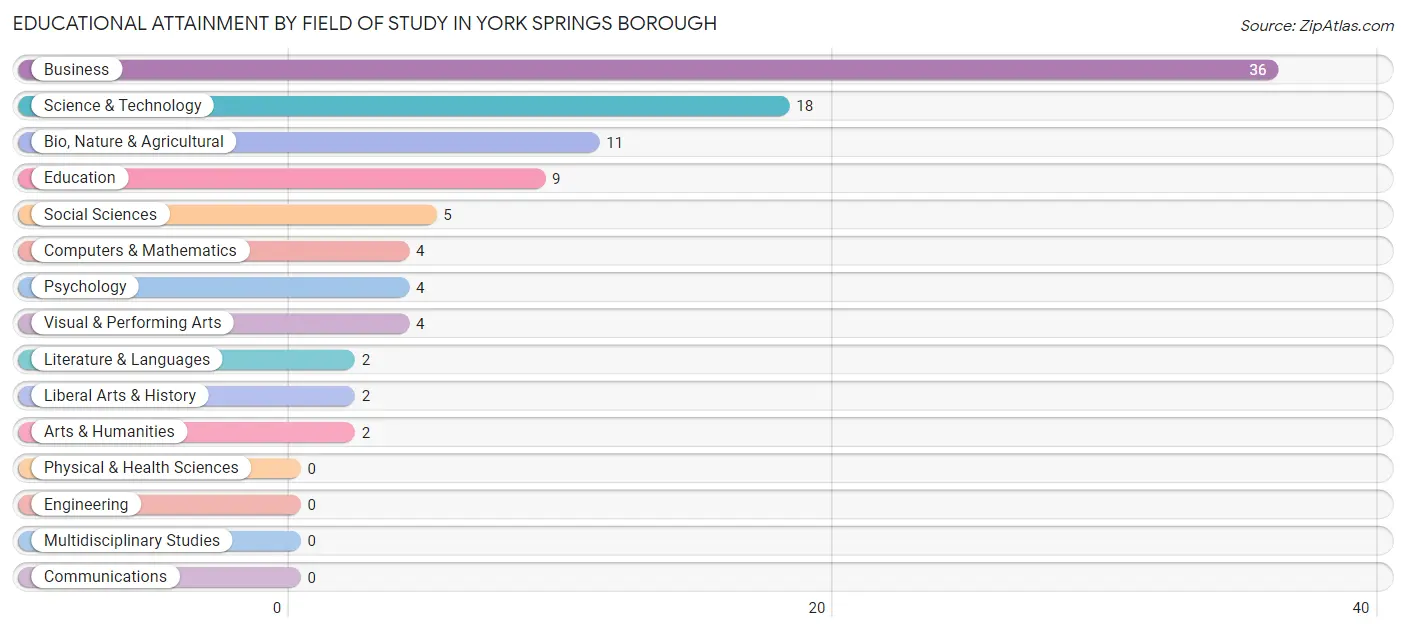
| Field of Study | # Graduates | % Graduates |
| Computers & Mathematics | 4 | 4.1% |
| Bio, Nature & Agricultural | 11 | 11.3% |
| Physical & Health Sciences | 0 | 0.0% |
| Psychology | 4 | 4.1% |
| Social Sciences | 5 | 5.1% |
| Engineering | 0 | 0.0% |
| Multidisciplinary Studies | 0 | 0.0% |
| Science & Technology | 18 | 18.6% |
| Business | 36 | 37.1% |
| Education | 9 | 9.3% |
| Literature & Languages | 2 | 2.1% |
| Liberal Arts & History | 2 | 2.1% |
| Visual & Performing Arts | 4 | 4.1% |
| Communications | 0 | 0.0% |
| Arts & Humanities | 2 | 2.1% |
| Total | 97 | 100.0% |
Transportation & Commute in York Springs borough
Vehicle Availability by Sex in York Springs borough
The most prevalent vehicle ownership categories in York Springs borough are males with 2 vehicles (97, accounting for 43.7%) and females with 2 vehicles (85, making up 59.5%).
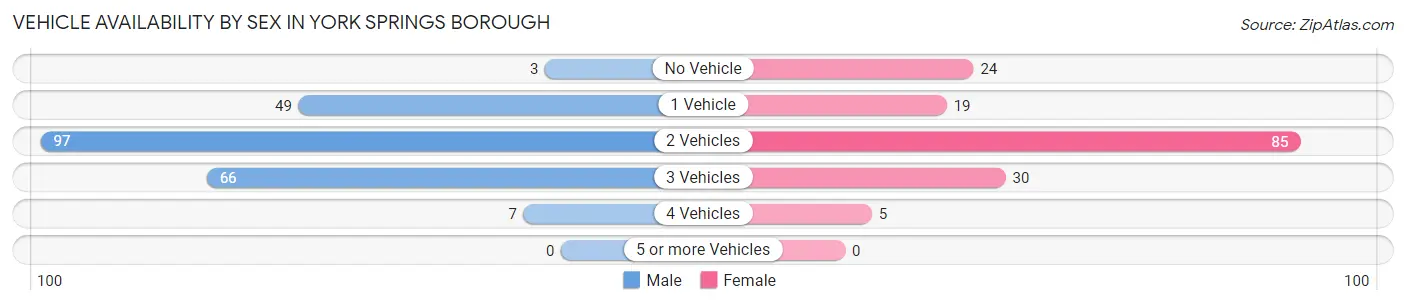
| Vehicles Available | Male | Female |
| No Vehicle | 3 (1.3%) | 24 (14.7%) |
| 1 Vehicle | 49 (22.1%) | 19 (11.7%) |
| 2 Vehicles | 97 (43.7%) | 85 (52.1%) |
| 3 Vehicles | 66 (29.7%) | 30 (18.4%) |
| 4 Vehicles | 7 (3.2%) | 5 (3.1%) |
| 5 or more Vehicles | 0 (0.0%) | 0 (0.0%) |
| Total | 222 (100.0%) | 163 (100.0%) |
Commute Time in York Springs borough
The most frequently occuring commute durations in York Springs borough are 30 to 34 minutes (117 commuters, 32.1%), 20 to 24 minutes (59 commuters, 16.2%), and 40 to 44 minutes (36 commuters, 9.9%).
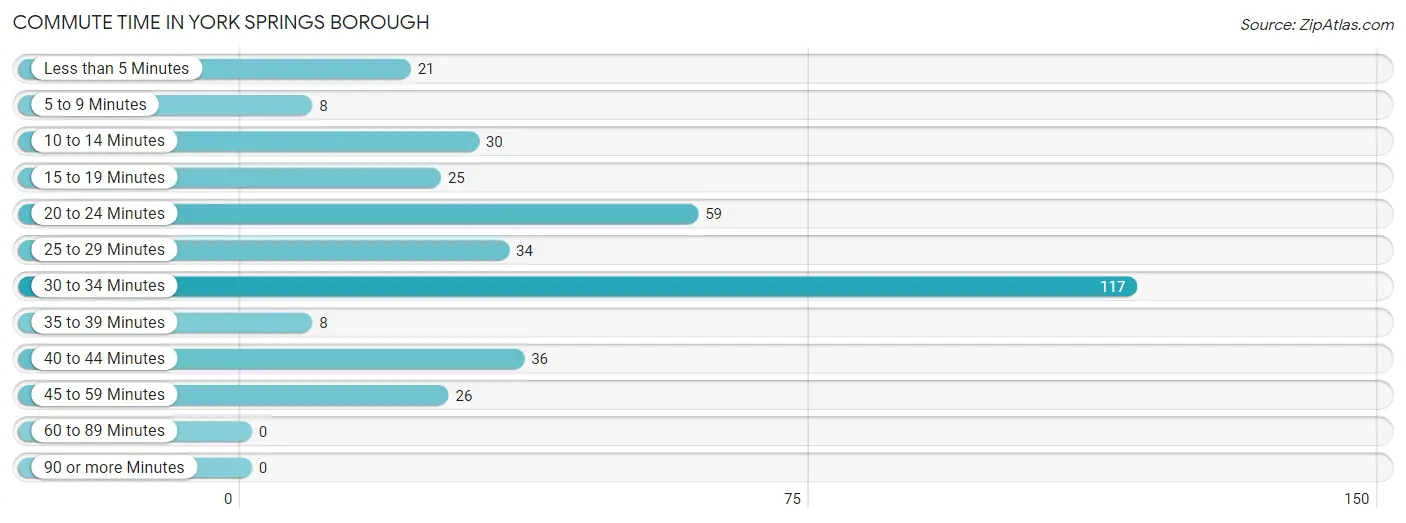
| Commute Time | # Commuters | % Commuters |
| Less than 5 Minutes | 21 | 5.8% |
| 5 to 9 Minutes | 8 | 2.2% |
| 10 to 14 Minutes | 30 | 8.2% |
| 15 to 19 Minutes | 25 | 6.9% |
| 20 to 24 Minutes | 59 | 16.2% |
| 25 to 29 Minutes | 34 | 9.3% |
| 30 to 34 Minutes | 117 | 32.1% |
| 35 to 39 Minutes | 8 | 2.2% |
| 40 to 44 Minutes | 36 | 9.9% |
| 45 to 59 Minutes | 26 | 7.1% |
| 60 to 89 Minutes | 0 | 0.0% |
| 90 or more Minutes | 0 | 0.0% |
Commute Time by Sex in York Springs borough
The most common commute times in York Springs borough are 30 to 34 minutes (54 commuters, 23.8%) for males and 30 to 34 minutes (63 commuters, 46.0%) for females.
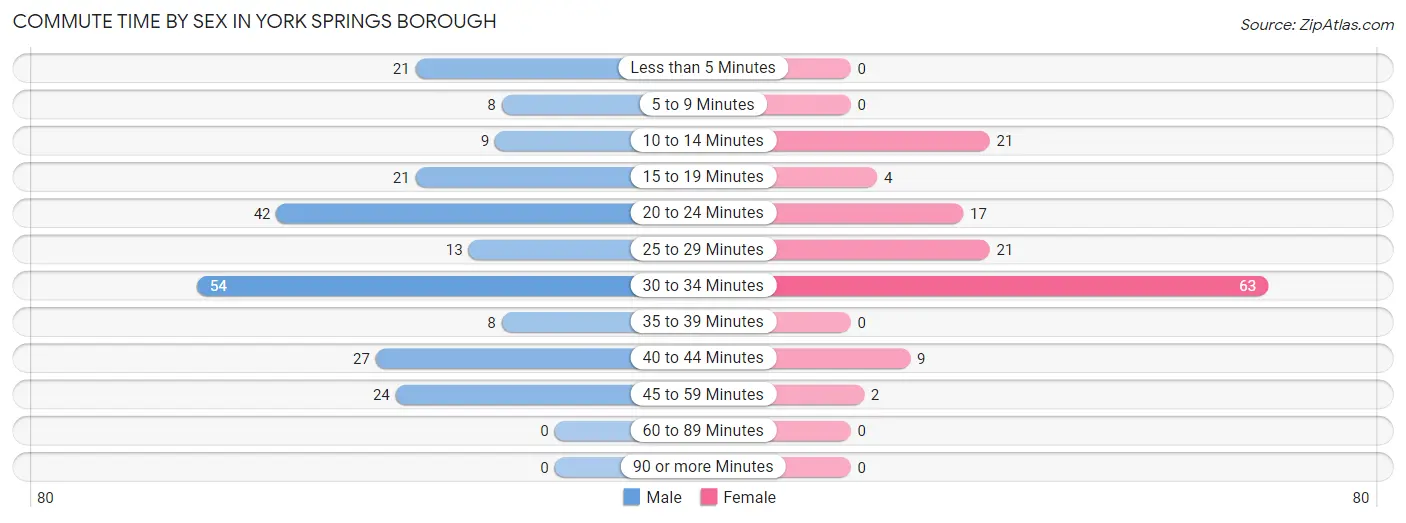
| Commute Time | Male | Female |
| Less than 5 Minutes | 21 (9.2%) | 0 (0.0%) |
| 5 to 9 Minutes | 8 (3.5%) | 0 (0.0%) |
| 10 to 14 Minutes | 9 (4.0%) | 21 (15.3%) |
| 15 to 19 Minutes | 21 (9.2%) | 4 (2.9%) |
| 20 to 24 Minutes | 42 (18.5%) | 17 (12.4%) |
| 25 to 29 Minutes | 13 (5.7%) | 21 (15.3%) |
| 30 to 34 Minutes | 54 (23.8%) | 63 (46.0%) |
| 35 to 39 Minutes | 8 (3.5%) | 0 (0.0%) |
| 40 to 44 Minutes | 27 (11.9%) | 9 (6.6%) |
| 45 to 59 Minutes | 24 (10.6%) | 2 (1.5%) |
| 60 to 89 Minutes | 0 (0.0%) | 0 (0.0%) |
| 90 or more Minutes | 0 (0.0%) | 0 (0.0%) |
Time of Departure to Work by Sex in York Springs borough
The most frequent times of departure to work in York Springs borough are 7:00 AM to 7:29 AM (63, 27.8%) for males and 7:00 AM to 7:29 AM (53, 38.7%) for females.
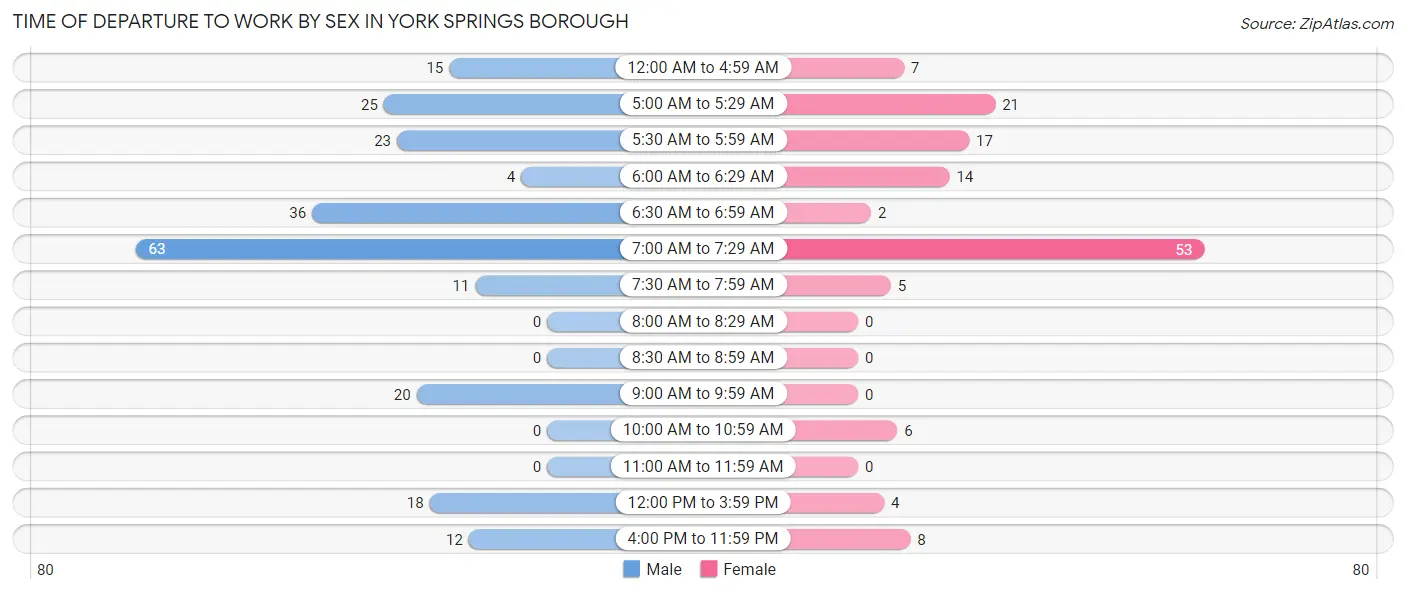
| Time of Departure | Male | Female |
| 12:00 AM to 4:59 AM | 15 (6.6%) | 7 (5.1%) |
| 5:00 AM to 5:29 AM | 25 (11.0%) | 21 (15.3%) |
| 5:30 AM to 5:59 AM | 23 (10.1%) | 17 (12.4%) |
| 6:00 AM to 6:29 AM | 4 (1.8%) | 14 (10.2%) |
| 6:30 AM to 6:59 AM | 36 (15.9%) | 2 (1.5%) |
| 7:00 AM to 7:29 AM | 63 (27.8%) | 53 (38.7%) |
| 7:30 AM to 7:59 AM | 11 (4.9%) | 5 (3.6%) |
| 8:00 AM to 8:29 AM | 0 (0.0%) | 0 (0.0%) |
| 8:30 AM to 8:59 AM | 0 (0.0%) | 0 (0.0%) |
| 9:00 AM to 9:59 AM | 20 (8.8%) | 0 (0.0%) |
| 10:00 AM to 10:59 AM | 0 (0.0%) | 6 (4.4%) |
| 11:00 AM to 11:59 AM | 0 (0.0%) | 0 (0.0%) |
| 12:00 PM to 3:59 PM | 18 (7.9%) | 4 (2.9%) |
| 4:00 PM to 11:59 PM | 12 (5.3%) | 8 (5.8%) |
| Total | 227 (100.0%) | 137 (100.0%) |
Housing Occupancy in York Springs borough
Occupancy by Ownership in York Springs borough
Of the total 242 dwellings in York Springs borough, owner-occupied units account for 112 (46.3%), while renter-occupied units make up 130 (53.7%).
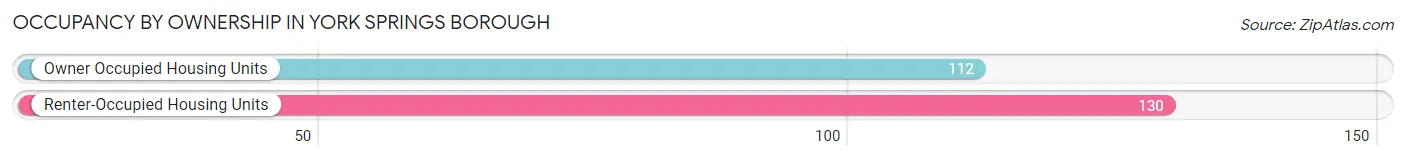
| Occupancy | # Housing Units | % Housing Units |
| Owner Occupied Housing Units | 112 | 46.3% |
| Renter-Occupied Housing Units | 130 | 53.7% |
| Total Occupied Housing Units | 242 | 100.0% |
Occupancy by Household Size in York Springs borough
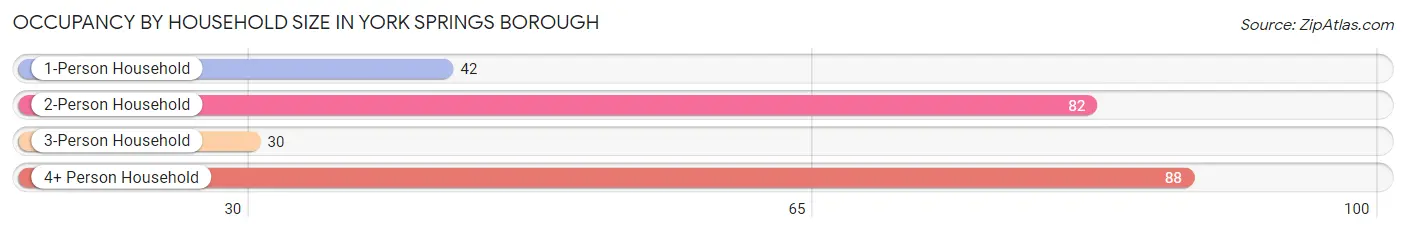
| Household Size | # Housing Units | % Housing Units |
| 1-Person Household | 42 | 17.4% |
| 2-Person Household | 82 | 33.9% |
| 3-Person Household | 30 | 12.4% |
| 4+ Person Household | 88 | 36.4% |
| Total Housing Units | 242 | 100.0% |
Occupancy by Ownership by Household Size in York Springs borough
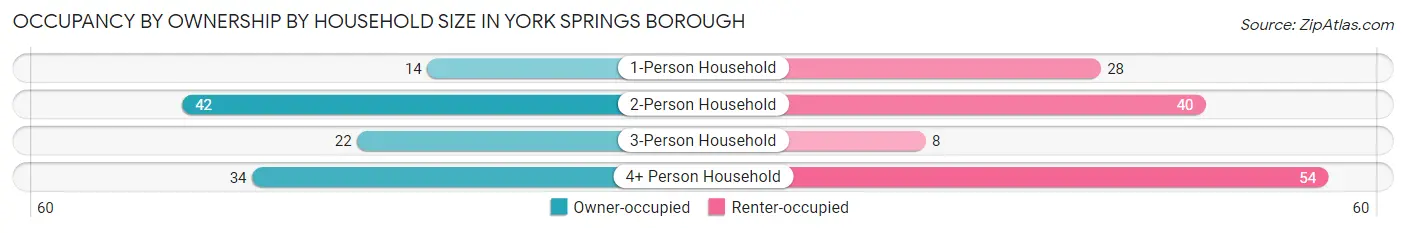
| Household Size | Owner-occupied | Renter-occupied |
| 1-Person Household | 14 (33.3%) | 28 (66.7%) |
| 2-Person Household | 42 (51.2%) | 40 (48.8%) |
| 3-Person Household | 22 (73.3%) | 8 (26.7%) |
| 4+ Person Household | 34 (38.6%) | 54 (61.4%) |
| Total Housing Units | 112 (46.3%) | 130 (53.7%) |
Occupancy by Educational Attainment in York Springs borough
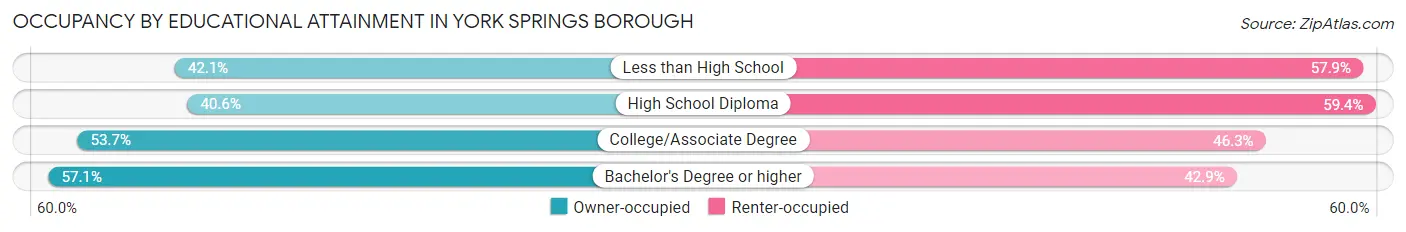
| Household Size | Owner-occupied | Renter-occupied |
| Less than High School | 24 (42.1%) | 33 (57.9%) |
| High School Diploma | 39 (40.6%) | 57 (59.4%) |
| College/Associate Degree | 29 (53.7%) | 25 (46.3%) |
| Bachelor's Degree or higher | 20 (57.1%) | 15 (42.9%) |
Occupancy by Age of Householder in York Springs borough
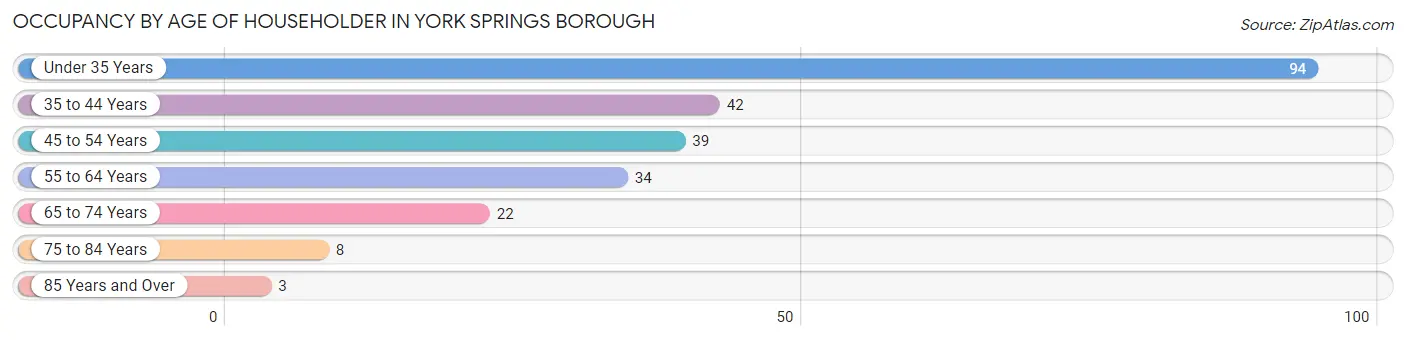
| Age Bracket | # Households | % Households |
| Under 35 Years | 94 | 38.8% |
| 35 to 44 Years | 42 | 17.4% |
| 45 to 54 Years | 39 | 16.1% |
| 55 to 64 Years | 34 | 14.1% |
| 65 to 74 Years | 22 | 9.1% |
| 75 to 84 Years | 8 | 3.3% |
| 85 Years and Over | 3 | 1.2% |
| Total | 242 | 100.0% |
Housing Finances in York Springs borough
Median Income by Occupancy in York Springs borough
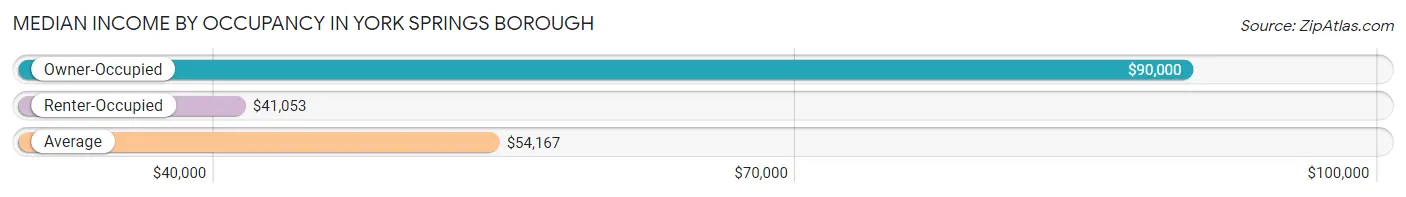
| Occupancy Type | # Households | Median Income |
| Owner-Occupied | 112 (46.3%) | $90,000 |
| Renter-Occupied | 130 (53.7%) | $41,053 |
| Average | 242 (100.0%) | $54,167 |
Occupancy by Householder Income Bracket in York Springs borough
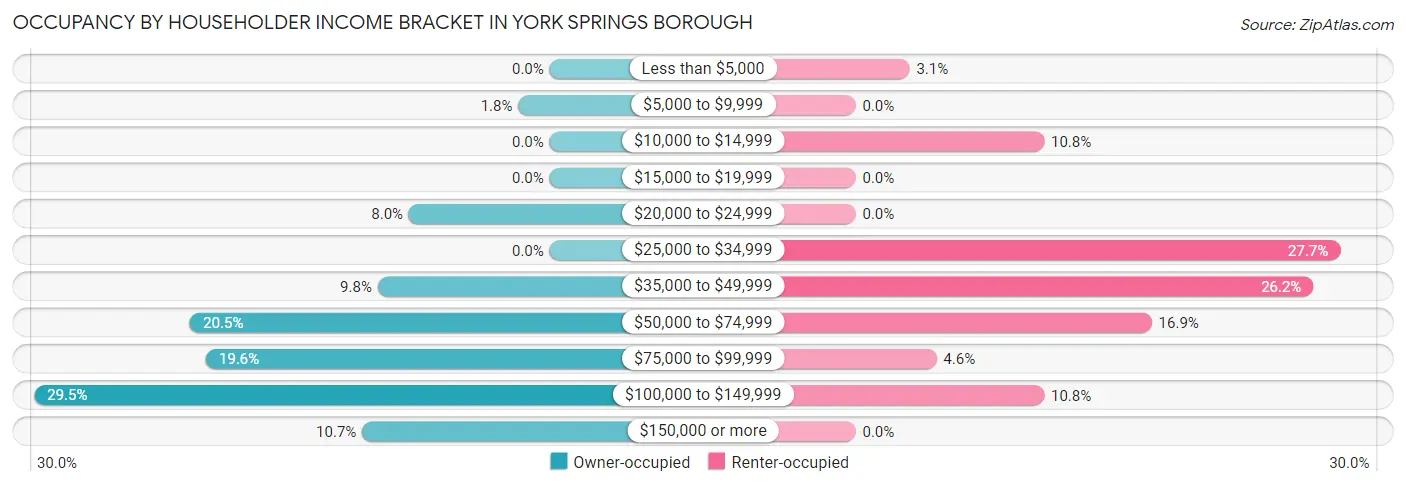
| Income Bracket | Owner-occupied | Renter-occupied |
| Less than $5,000 | 0 (0.0%) | 4 (3.1%) |
| $5,000 to $9,999 | 2 (1.8%) | 0 (0.0%) |
| $10,000 to $14,999 | 0 (0.0%) | 14 (10.8%) |
| $15,000 to $19,999 | 0 (0.0%) | 0 (0.0%) |
| $20,000 to $24,999 | 9 (8.0%) | 0 (0.0%) |
| $25,000 to $34,999 | 0 (0.0%) | 36 (27.7%) |
| $35,000 to $49,999 | 11 (9.8%) | 34 (26.2%) |
| $50,000 to $74,999 | 23 (20.5%) | 22 (16.9%) |
| $75,000 to $99,999 | 22 (19.6%) | 6 (4.6%) |
| $100,000 to $149,999 | 33 (29.5%) | 14 (10.8%) |
| $150,000 or more | 12 (10.7%) | 0 (0.0%) |
| Total | 112 (100.0%) | 130 (100.0%) |
Monthly Housing Cost Tiers in York Springs borough
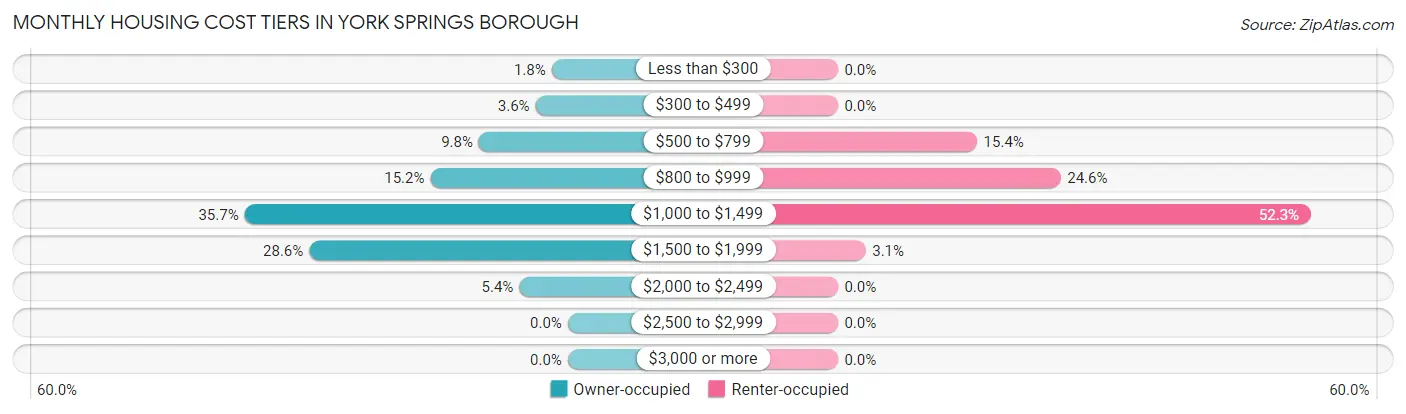
| Monthly Cost | Owner-occupied | Renter-occupied |
| Less than $300 | 2 (1.8%) | 0 (0.0%) |
| $300 to $499 | 4 (3.6%) | 0 (0.0%) |
| $500 to $799 | 11 (9.8%) | 20 (15.4%) |
| $800 to $999 | 17 (15.2%) | 32 (24.6%) |
| $1,000 to $1,499 | 40 (35.7%) | 68 (52.3%) |
| $1,500 to $1,999 | 32 (28.6%) | 4 (3.1%) |
| $2,000 to $2,499 | 6 (5.4%) | 0 (0.0%) |
| $2,500 to $2,999 | 0 (0.0%) | 0 (0.0%) |
| $3,000 or more | 0 (0.0%) | 0 (0.0%) |
| Total | 112 (100.0%) | 130 (100.0%) |
Physical Housing Characteristics in York Springs borough
Housing Structures in York Springs borough
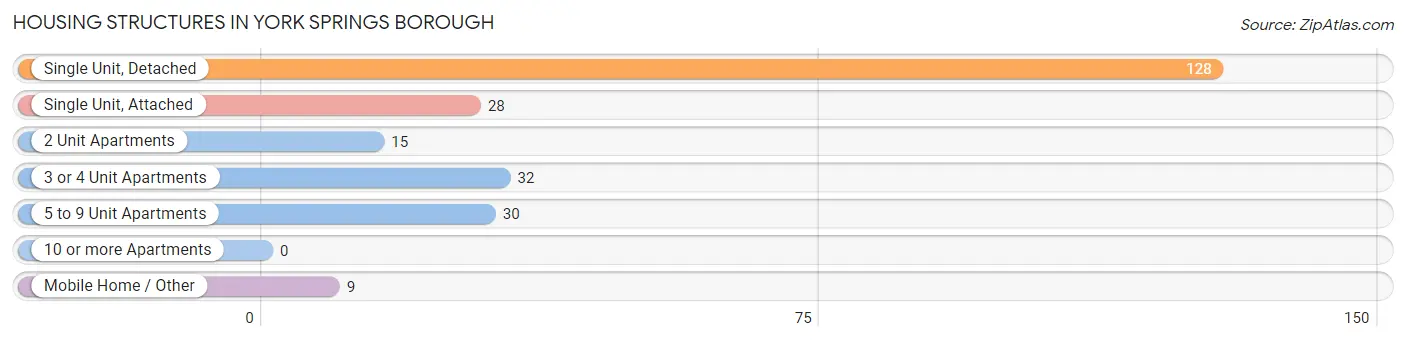
| Structure Type | # Housing Units | % Housing Units |
| Single Unit, Detached | 128 | 52.9% |
| Single Unit, Attached | 28 | 11.6% |
| 2 Unit Apartments | 15 | 6.2% |
| 3 or 4 Unit Apartments | 32 | 13.2% |
| 5 to 9 Unit Apartments | 30 | 12.4% |
| 10 or more Apartments | 0 | 0.0% |
| Mobile Home / Other | 9 | 3.7% |
| Total | 242 | 100.0% |
Housing Structures by Occupancy in York Springs borough
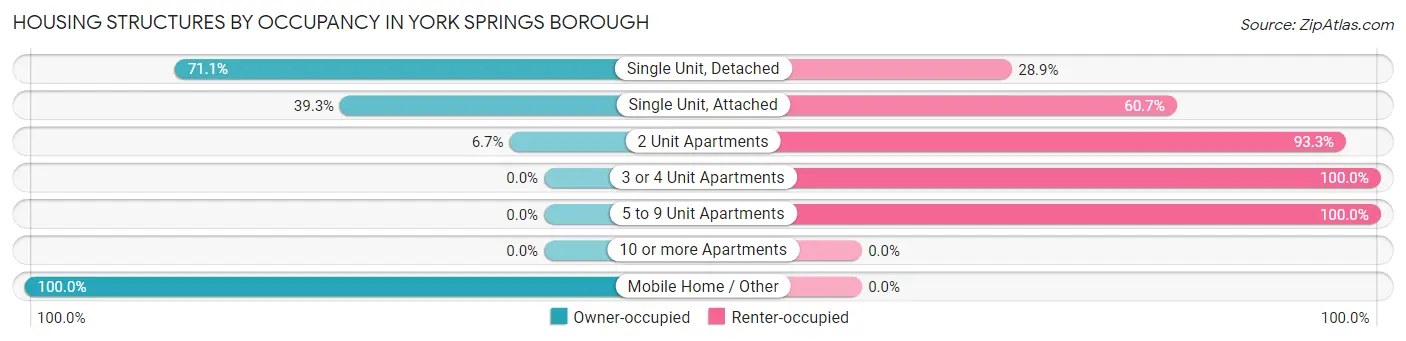
| Structure Type | Owner-occupied | Renter-occupied |
| Single Unit, Detached | 91 (71.1%) | 37 (28.9%) |
| Single Unit, Attached | 11 (39.3%) | 17 (60.7%) |
| 2 Unit Apartments | 1 (6.7%) | 14 (93.3%) |
| 3 or 4 Unit Apartments | 0 (0.0%) | 32 (100.0%) |
| 5 to 9 Unit Apartments | 0 (0.0%) | 30 (100.0%) |
| 10 or more Apartments | 0 (0.0%) | 0 (0.0%) |
| Mobile Home / Other | 9 (100.0%) | 0 (0.0%) |
| Total | 112 (46.3%) | 130 (53.7%) |
Housing Structures by Number of Rooms in York Springs borough
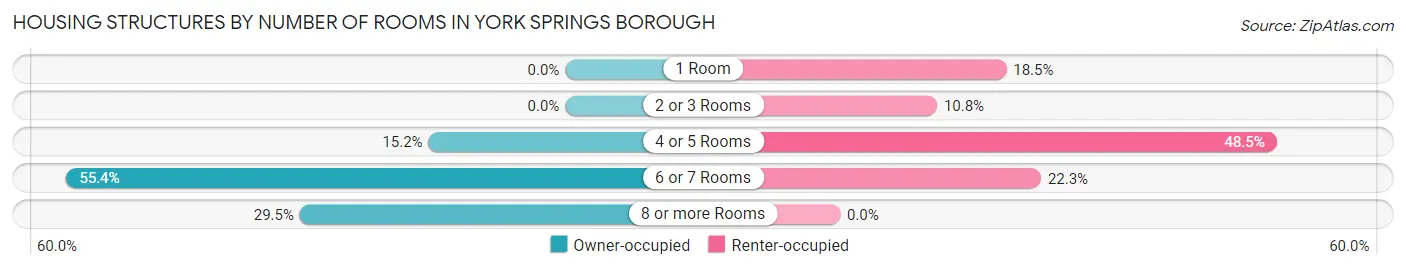
| Number of Rooms | Owner-occupied | Renter-occupied |
| 1 Room | 0 (0.0%) | 24 (18.5%) |
| 2 or 3 Rooms | 0 (0.0%) | 14 (10.8%) |
| 4 or 5 Rooms | 17 (15.2%) | 63 (48.5%) |
| 6 or 7 Rooms | 62 (55.4%) | 29 (22.3%) |
| 8 or more Rooms | 33 (29.5%) | 0 (0.0%) |
| Total | 112 (100.0%) | 130 (100.0%) |
Housing Structure by Heating Type in York Springs borough
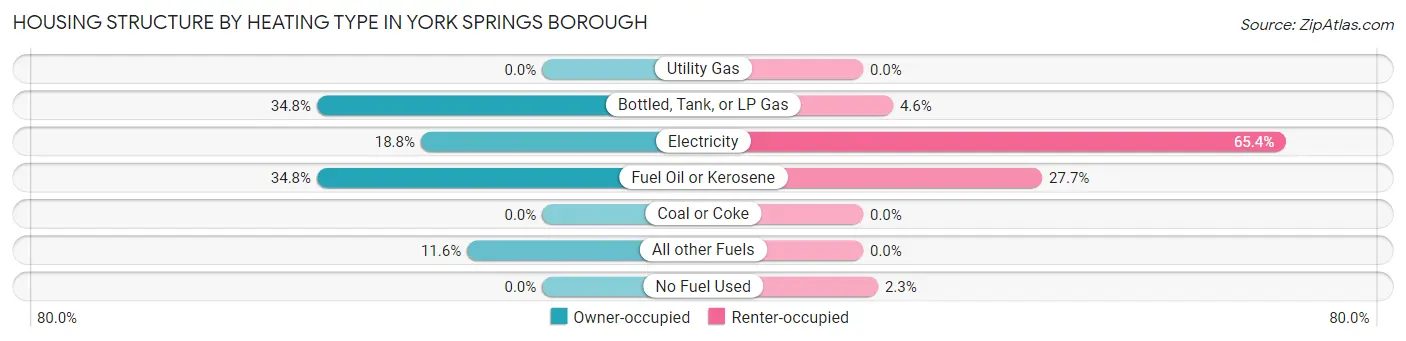
| Heating Type | Owner-occupied | Renter-occupied |
| Utility Gas | 0 (0.0%) | 0 (0.0%) |
| Bottled, Tank, or LP Gas | 39 (34.8%) | 6 (4.6%) |
| Electricity | 21 (18.8%) | 85 (65.4%) |
| Fuel Oil or Kerosene | 39 (34.8%) | 36 (27.7%) |
| Coal or Coke | 0 (0.0%) | 0 (0.0%) |
| All other Fuels | 13 (11.6%) | 0 (0.0%) |
| No Fuel Used | 0 (0.0%) | 3 (2.3%) |
| Total | 112 (100.0%) | 130 (100.0%) |
Household Vehicle Usage in York Springs borough
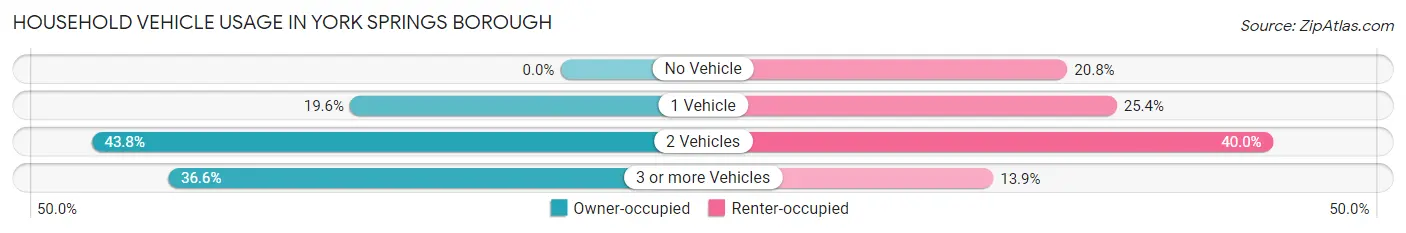
| Vehicles per Household | Owner-occupied | Renter-occupied |
| No Vehicle | 0 (0.0%) | 27 (20.8%) |
| 1 Vehicle | 22 (19.6%) | 33 (25.4%) |
| 2 Vehicles | 49 (43.8%) | 52 (40.0%) |
| 3 or more Vehicles | 41 (36.6%) | 18 (13.9%) |
| Total | 112 (100.0%) | 130 (100.0%) |
Real Estate & Mortgages in York Springs borough
Real Estate and Mortgage Overview in York Springs borough
| Characteristic | Without Mortgage | With Mortgage |
| Housing Units | 33 | 79 |
| Median Property Value | $173,400 | $181,800 |
| Median Household Income | - | - |
| Monthly Housing Costs | $750 | $0 |
| Real Estate Taxes | $2,206 | $0 |
Property Value by Mortgage Status in York Springs borough
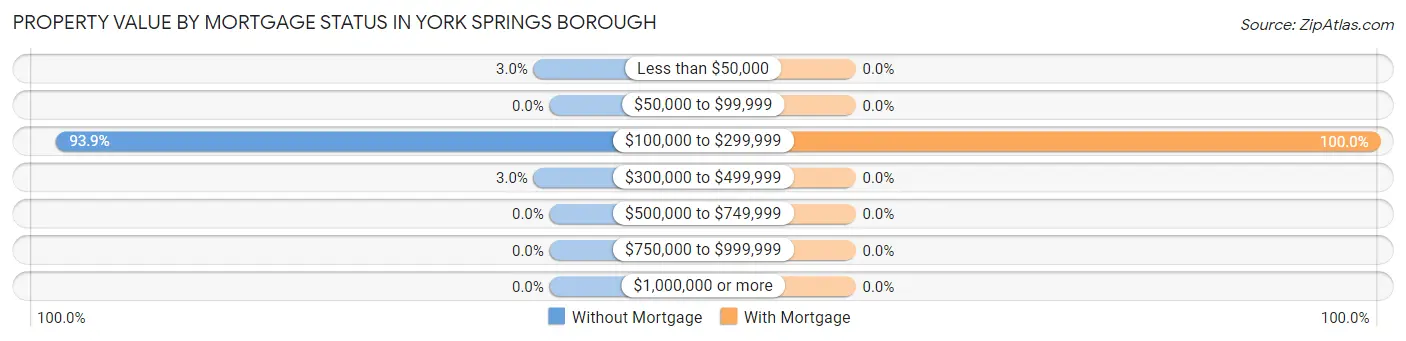
| Property Value | Without Mortgage | With Mortgage |
| Less than $50,000 | 1 (3.0%) | 0 (0.0%) |
| $50,000 to $99,999 | 0 (0.0%) | 0 (0.0%) |
| $100,000 to $299,999 | 31 (93.9%) | 79 (100.0%) |
| $300,000 to $499,999 | 1 (3.0%) | 0 (0.0%) |
| $500,000 to $749,999 | 0 (0.0%) | 0 (0.0%) |
| $750,000 to $999,999 | 0 (0.0%) | 0 (0.0%) |
| $1,000,000 or more | 0 (0.0%) | 0 (0.0%) |
| Total | 33 (100.0%) | 79 (100.0%) |
Household Income by Mortgage Status in York Springs borough
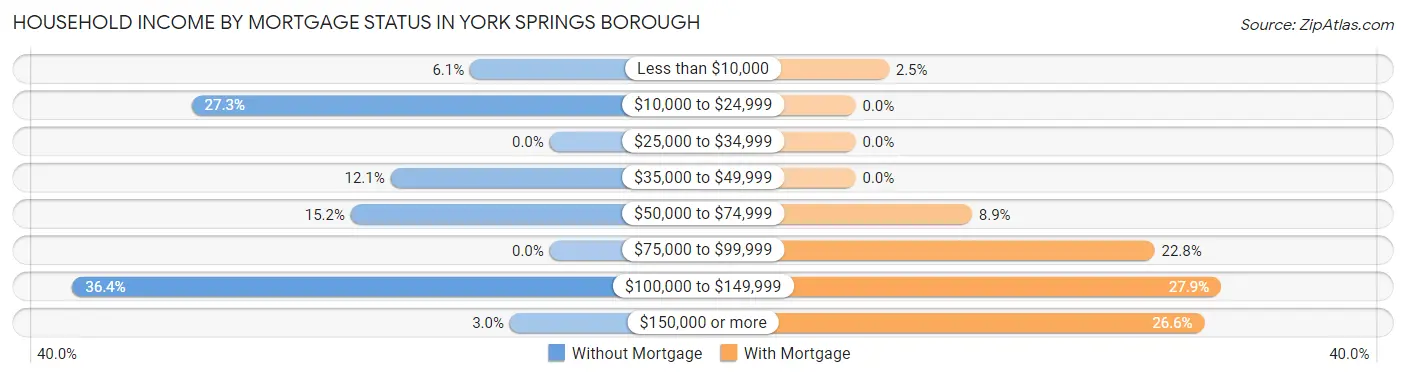
| Household Income | Without Mortgage | With Mortgage |
| Less than $10,000 | 2 (6.1%) | 2 (2.5%) |
| $10,000 to $24,999 | 9 (27.3%) | 0 (0.0%) |
| $25,000 to $34,999 | 0 (0.0%) | 0 (0.0%) |
| $35,000 to $49,999 | 4 (12.1%) | 0 (0.0%) |
| $50,000 to $74,999 | 5 (15.1%) | 7 (8.9%) |
| $75,000 to $99,999 | 0 (0.0%) | 18 (22.8%) |
| $100,000 to $149,999 | 12 (36.4%) | 22 (27.9%) |
| $150,000 or more | 1 (3.0%) | 21 (26.6%) |
| Total | 33 (100.0%) | 79 (100.0%) |
Property Value to Household Income Ratio in York Springs borough
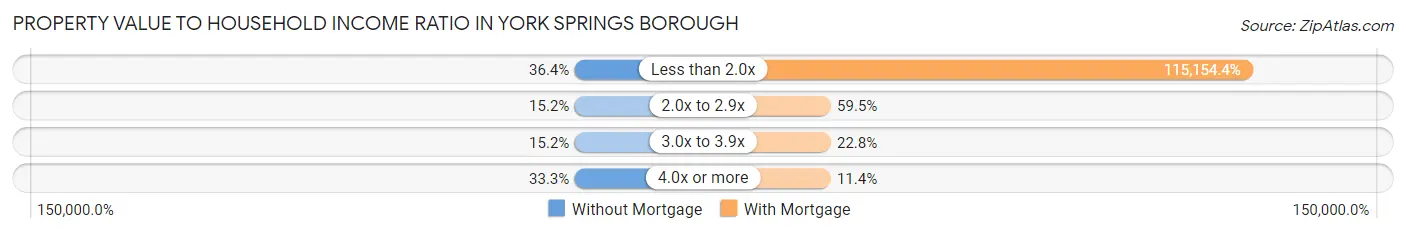
| Value-to-Income Ratio | Without Mortgage | With Mortgage |
| Less than 2.0x | 12 (36.4%) | 90,972 (115,154.4%) |
| 2.0x to 2.9x | 5 (15.1%) | 47 (59.5%) |
| 3.0x to 3.9x | 5 (15.1%) | 18 (22.8%) |
| 4.0x or more | 11 (33.3%) | 9 (11.4%) |
| Total | 33 (100.0%) | 79 (100.0%) |
Real Estate Taxes by Mortgage Status in York Springs borough
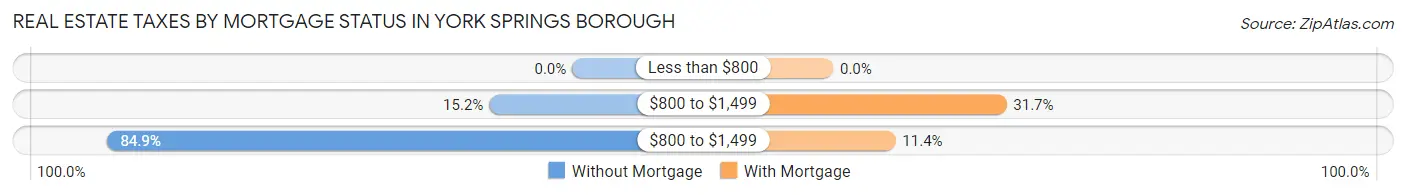
| Property Taxes | Without Mortgage | With Mortgage |
| Less than $800 | 0 (0.0%) | 0 (0.0%) |
| $800 to $1,499 | 5 (15.1%) | 25 (31.7%) |
| $800 to $1,499 | 28 (84.9%) | 9 (11.4%) |
| Total | 33 (100.0%) | 79 (100.0%) |
Health & Disability in York Springs borough
Health Insurance Coverage by Age in York Springs borough
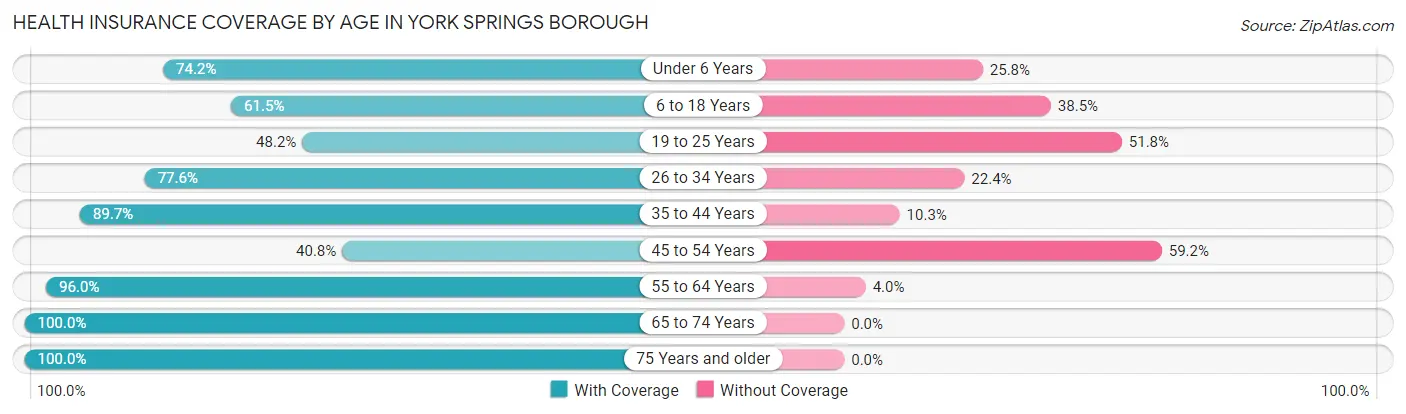
| Age Bracket | With Coverage | Without Coverage |
| Under 6 Years | 66 (74.2%) | 23 (25.8%) |
| 6 to 18 Years | 142 (61.5%) | 89 (38.5%) |
| 19 to 25 Years | 41 (48.2%) | 44 (51.8%) |
| 26 to 34 Years | 97 (77.6%) | 28 (22.4%) |
| 35 to 44 Years | 113 (89.7%) | 13 (10.3%) |
| 45 to 54 Years | 31 (40.8%) | 45 (59.2%) |
| 55 to 64 Years | 48 (96.0%) | 2 (4.0%) |
| 65 to 74 Years | 109 (100.0%) | 0 (0.0%) |
| 75 Years and older | 31 (100.0%) | 0 (0.0%) |
| Total | 678 (73.5%) | 244 (26.5%) |
Health Insurance Coverage by Citizenship Status in York Springs borough
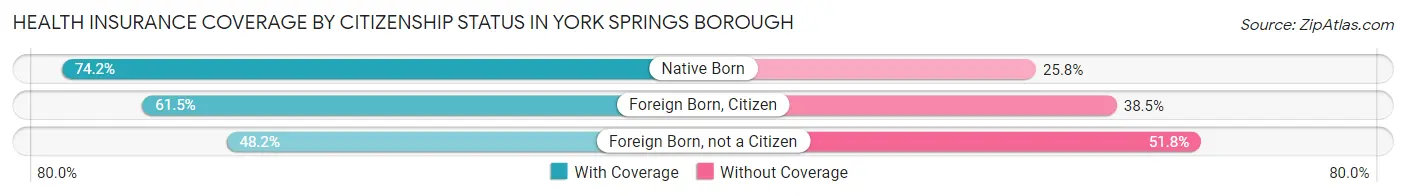
| Citizenship Status | With Coverage | Without Coverage |
| Native Born | 66 (74.2%) | 23 (25.8%) |
| Foreign Born, Citizen | 142 (61.5%) | 89 (38.5%) |
| Foreign Born, not a Citizen | 41 (48.2%) | 44 (51.8%) |
Health Insurance Coverage by Household Income in York Springs borough
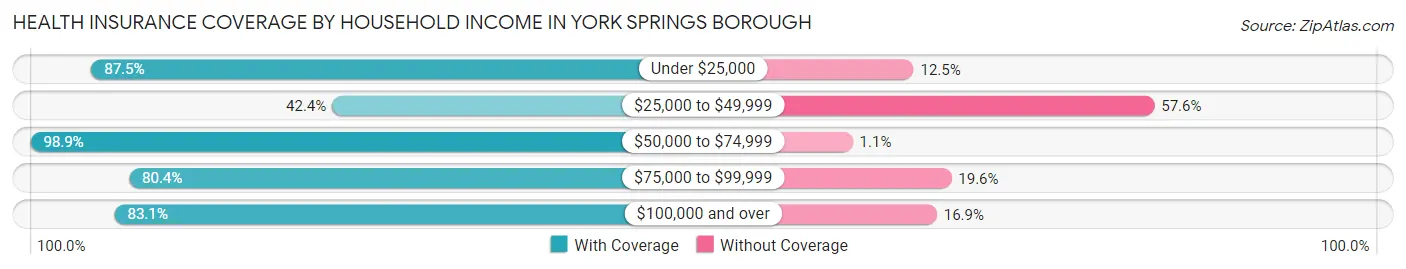
| Household Income | With Coverage | Without Coverage |
| Under $25,000 | 77 (87.5%) | 11 (12.5%) |
| $25,000 to $49,999 | 117 (42.4%) | 159 (57.6%) |
| $50,000 to $74,999 | 180 (98.9%) | 2 (1.1%) |
| $75,000 to $99,999 | 78 (80.4%) | 19 (19.6%) |
| $100,000 and over | 217 (83.1%) | 44 (16.9%) |
Public vs Private Health Insurance Coverage by Age in York Springs borough
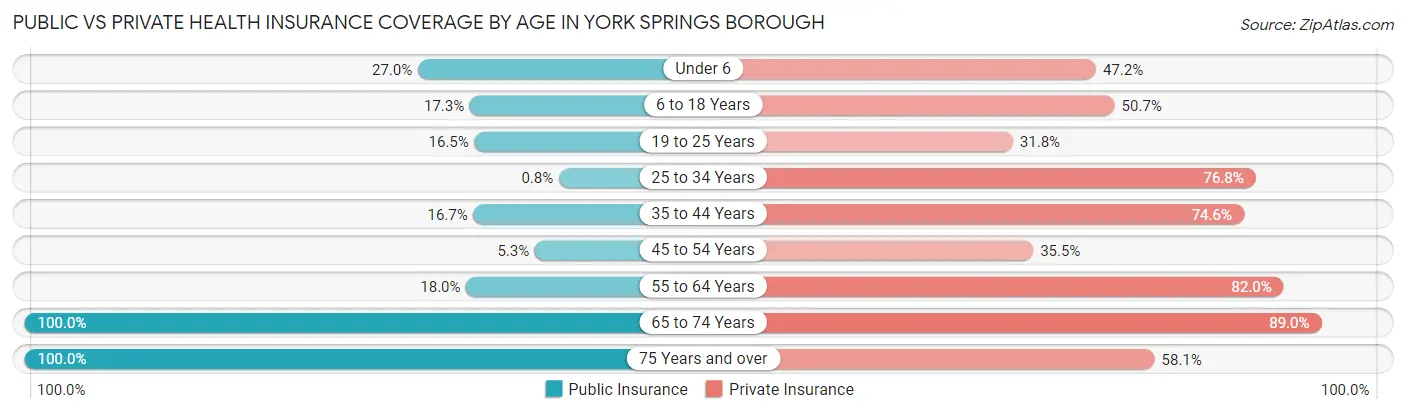
| Age Bracket | Public Insurance | Private Insurance |
| Under 6 | 24 (27.0%) | 42 (47.2%) |
| 6 to 18 Years | 40 (17.3%) | 117 (50.6%) |
| 19 to 25 Years | 14 (16.5%) | 27 (31.8%) |
| 25 to 34 Years | 1 (0.8%) | 96 (76.8%) |
| 35 to 44 Years | 21 (16.7%) | 94 (74.6%) |
| 45 to 54 Years | 4 (5.3%) | 27 (35.5%) |
| 55 to 64 Years | 9 (18.0%) | 41 (82.0%) |
| 65 to 74 Years | 109 (100.0%) | 97 (89.0%) |
| 75 Years and over | 31 (100.0%) | 18 (58.1%) |
| Total | 253 (27.4%) | 559 (60.6%) |
Disability Status by Sex by Age in York Springs borough
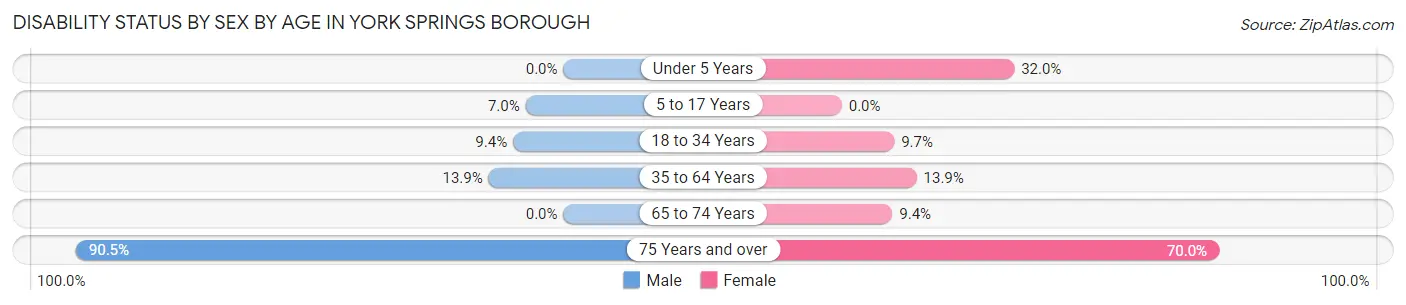
| Age Bracket | Male | Female |
| Under 5 Years | 0 (0.0%) | 8 (32.0%) |
| 5 to 17 Years | 12 (7.0%) | 0 (0.0%) |
| 18 to 34 Years | 10 (9.3%) | 11 (9.7%) |
| 35 to 64 Years | 20 (13.9%) | 15 (13.9%) |
| 65 to 74 Years | 0 (0.0%) | 9 (9.4%) |
| 75 Years and over | 19 (90.5%) | 7 (70.0%) |
Disability Class by Sex by Age in York Springs borough
Disability Class: Hearing Difficulty
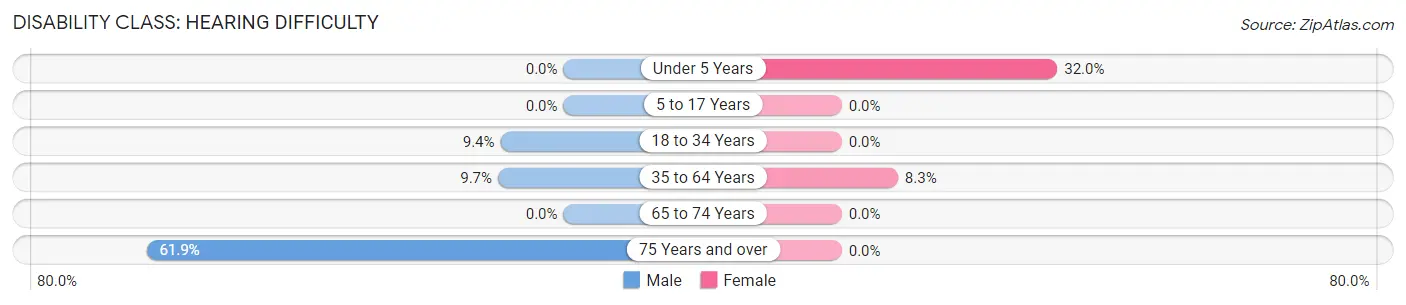
| Age Bracket | Male | Female |
| Under 5 Years | 0 (0.0%) | 8 (32.0%) |
| 5 to 17 Years | 0 (0.0%) | 0 (0.0%) |
| 18 to 34 Years | 10 (9.3%) | 0 (0.0%) |
| 35 to 64 Years | 14 (9.7%) | 9 (8.3%) |
| 65 to 74 Years | 0 (0.0%) | 0 (0.0%) |
| 75 Years and over | 13 (61.9%) | 0 (0.0%) |
Disability Class: Vision Difficulty
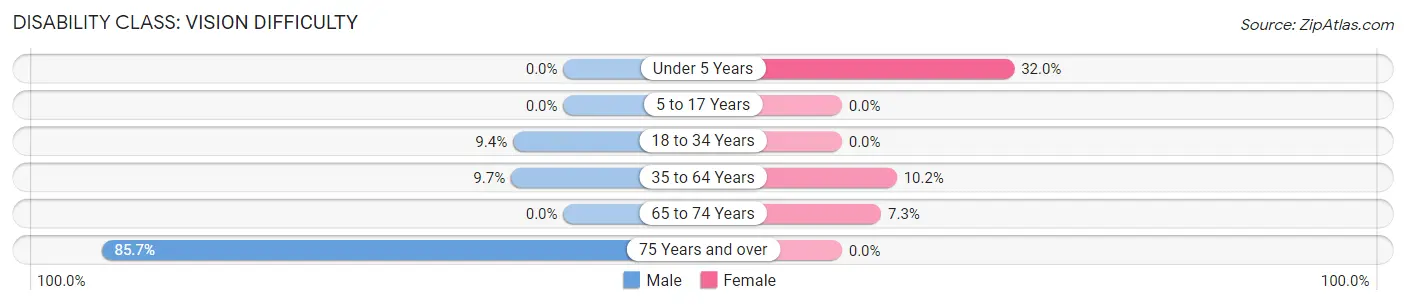
| Age Bracket | Male | Female |
| Under 5 Years | 0 (0.0%) | 8 (32.0%) |
| 5 to 17 Years | 0 (0.0%) | 0 (0.0%) |
| 18 to 34 Years | 10 (9.3%) | 0 (0.0%) |
| 35 to 64 Years | 14 (9.7%) | 11 (10.2%) |
| 65 to 74 Years | 0 (0.0%) | 7 (7.3%) |
| 75 Years and over | 18 (85.7%) | 0 (0.0%) |
Disability Class: Cognitive Difficulty
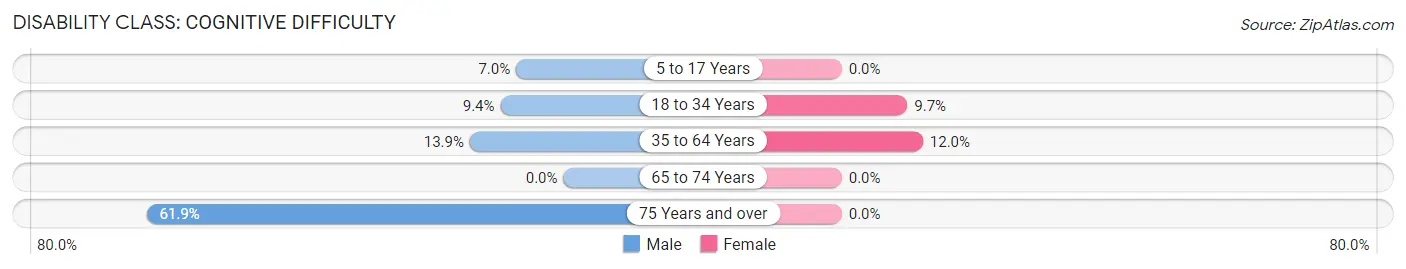
| Age Bracket | Male | Female |
| 5 to 17 Years | 12 (7.0%) | 0 (0.0%) |
| 18 to 34 Years | 10 (9.3%) | 11 (9.7%) |
| 35 to 64 Years | 20 (13.9%) | 13 (12.0%) |
| 65 to 74 Years | 0 (0.0%) | 0 (0.0%) |
| 75 Years and over | 13 (61.9%) | 0 (0.0%) |
Disability Class: Ambulatory Difficulty
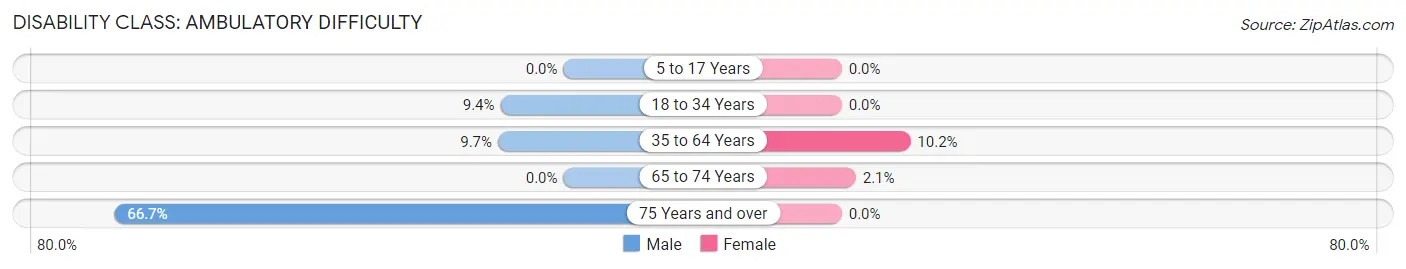
| Age Bracket | Male | Female |
| 5 to 17 Years | 0 (0.0%) | 0 (0.0%) |
| 18 to 34 Years | 10 (9.3%) | 0 (0.0%) |
| 35 to 64 Years | 14 (9.7%) | 11 (10.2%) |
| 65 to 74 Years | 0 (0.0%) | 2 (2.1%) |
| 75 Years and over | 14 (66.7%) | 0 (0.0%) |
Disability Class: Self-Care Difficulty
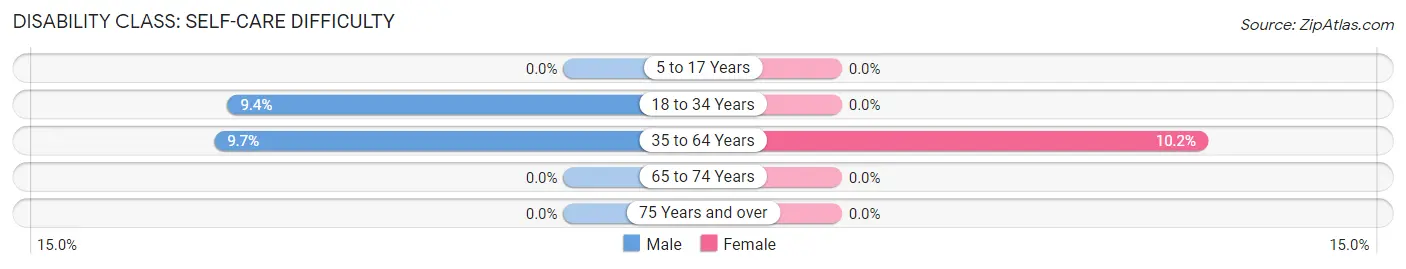
| Age Bracket | Male | Female |
| 5 to 17 Years | 0 (0.0%) | 0 (0.0%) |
| 18 to 34 Years | 10 (9.3%) | 0 (0.0%) |
| 35 to 64 Years | 14 (9.7%) | 11 (10.2%) |
| 65 to 74 Years | 0 (0.0%) | 0 (0.0%) |
| 75 Years and over | 0 (0.0%) | 0 (0.0%) |
Technology Access in York Springs borough
Computing Device Access in York Springs borough
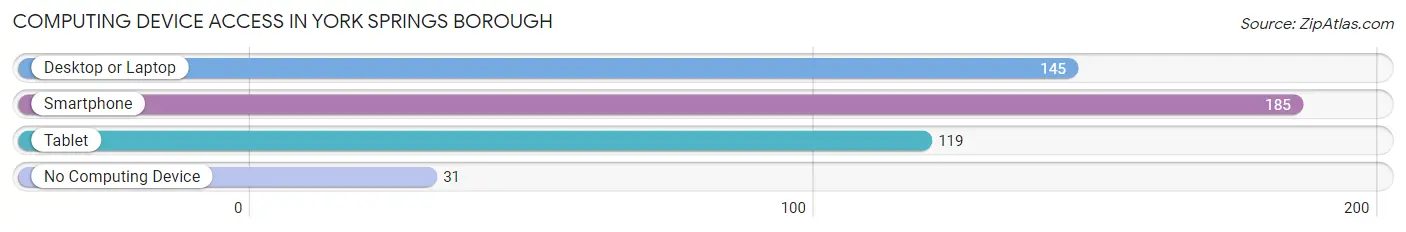
| Device Type | # Households | % Households |
| Desktop or Laptop | 145 | 59.9% |
| Smartphone | 185 | 76.4% |
| Tablet | 119 | 49.2% |
| No Computing Device | 31 | 12.8% |
| Total | 242 | 100.0% |
Internet Access in York Springs borough
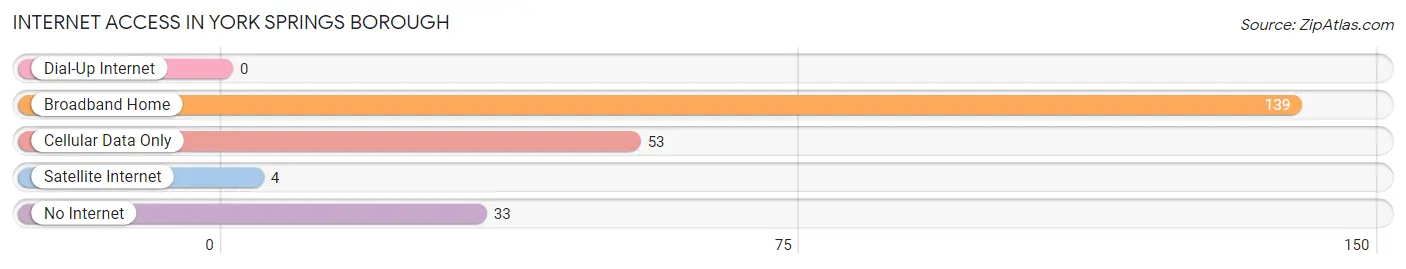
| Internet Type | # Households | % Households |
| Dial-Up Internet | 0 | 0.0% |
| Broadband Home | 139 | 57.4% |
| Cellular Data Only | 53 | 21.9% |
| Satellite Internet | 4 | 1.7% |
| No Internet | 33 | 13.6% |
| Total | 242 | 100.0% |
York Springs borough Summary
History
York Springs Borough is a small borough located in Adams County, Pennsylvania. It is situated in the south-central part of the state, about 20 miles east of Gettysburg. The borough was founded in 1851 and was originally known as York Springs Station. The name was changed to York Springs Borough in 1872.
The area was first settled in the late 1700s by German immigrants who were attracted to the area by its fertile soil and abundant natural resources. The first settlers were mostly farmers, but the area soon became a center for industry and commerce. The first industry in the area was a grist mill, which was built in 1810. This was followed by a sawmill, a tannery, and a woolen mill.
The borough was incorporated in 1851 and was named after the nearby springs, which were believed to have healing properties. The springs were a popular destination for visitors from all over the region. In the late 1800s, the borough became a popular summer resort destination, with many visitors coming to take advantage of the natural beauty and recreational opportunities.
The borough was also home to a number of prominent businesses, including a cigar factory, a brewery, and a canning factory. The canning factory was the largest employer in the area for many years.
Geography
York Springs Borough is located in south-central Pennsylvania, about 20 miles east of Gettysburg. The borough is situated in the Appalachian Mountains, and is surrounded by rolling hills and valleys. The borough is located in the Conewago Creek watershed, and is home to several small streams and creeks.
The borough covers an area of 1.2 square miles, and has a population of approximately 1,000 people. The borough is mostly rural, with a few small businesses and residential areas. The borough is served by two major highways, US Route 15 and Pennsylvania Route 94.
Economy
The economy of York Springs Borough is largely based on agriculture and tourism. The borough is home to several small farms, which produce a variety of crops, including corn, soybeans, and hay. The borough is also home to several small businesses, including a grocery store, a hardware store, and a few restaurants.
The borough is also a popular tourist destination, with many visitors coming to take advantage of the natural beauty and recreational opportunities. The borough is home to several parks, including the York Springs Nature Preserve, which offers hiking, fishing, and camping. The borough is also home to several historic sites, including the York Springs Historic District, which is listed on the National Register of Historic Places.
Demographics
As of the 2010 census, the population of York Springs Borough was 1,000 people. The racial makeup of the borough was 97.2% White, 0.7% African American, 0.2% Native American, 0.2% Asian, 0.2% from other races, and 1.7% from two or more races. Hispanic or Latino of any race were 0.7% of the population.
The median household income in the borough was $45,000, and the median family income was $50,000. The per capita income in the borough was $20,000. About 8.3% of families and 10.3% of the population were below the poverty line, including 14.3% of those under age 18 and 6.7% of those age 65 or over.
Common Questions
What is Per Capita Income in York Springs borough?
Per Capita income in York Springs borough is $20,548.
What is the Median Family Income in York Springs borough?
Median Family Income in York Springs borough is $55,250.
What is the Median Household income in York Springs borough?
Median Household Income in York Springs borough is $54,167.
What is Income or Wage Gap in York Springs borough?
Income or Wage Gap in York Springs borough is 23.5%.
Women in York Springs borough earn 76.5 cents for every dollar earned by a man.
What is Family Income Deficit in York Springs borough?
Family Income Deficit in York Springs borough is $17,648.
Families that are below poverty line in York Springs borough earn $17,648 less on average than the poverty threshold level.
What is Inequality or Gini Index in York Springs borough?
Inequality or Gini Index in York Springs borough is 0.37.
What is the Total Population of York Springs borough?
Total Population of York Springs borough is 922.
What is the Total Male Population of York Springs borough?
Total Male Population of York Springs borough is 512.
What is the Total Female Population of York Springs borough?
Total Female Population of York Springs borough is 410.
What is the Ratio of Males per 100 Females in York Springs borough?
There are 124.88 Males per 100 Females in York Springs borough.
What is the Ratio of Females per 100 Males in York Springs borough?
There are 80.08 Females per 100 Males in York Springs borough.
What is the Median Population Age in York Springs borough?
Median Population Age in York Springs borough is 31.4 Years.
What is the Average Family Size in York Springs borough
Average Family Size in York Springs borough is 4.2 People.
What is the Average Household Size in York Springs borough
Average Household Size in York Springs borough is 3.7 People.
How Large is the Labor Force in York Springs borough?
There are 423 People in the Labor Forcein in York Springs borough.
What is the Percentage of People in the Labor Force in York Springs borough?
67.9% of People are in the Labor Force in York Springs borough.
What is the Unemployment Rate in York Springs borough?
Unemployment Rate in York Springs borough is 5.2%.