South Temple, PA Map & Demographics
South Temple Map
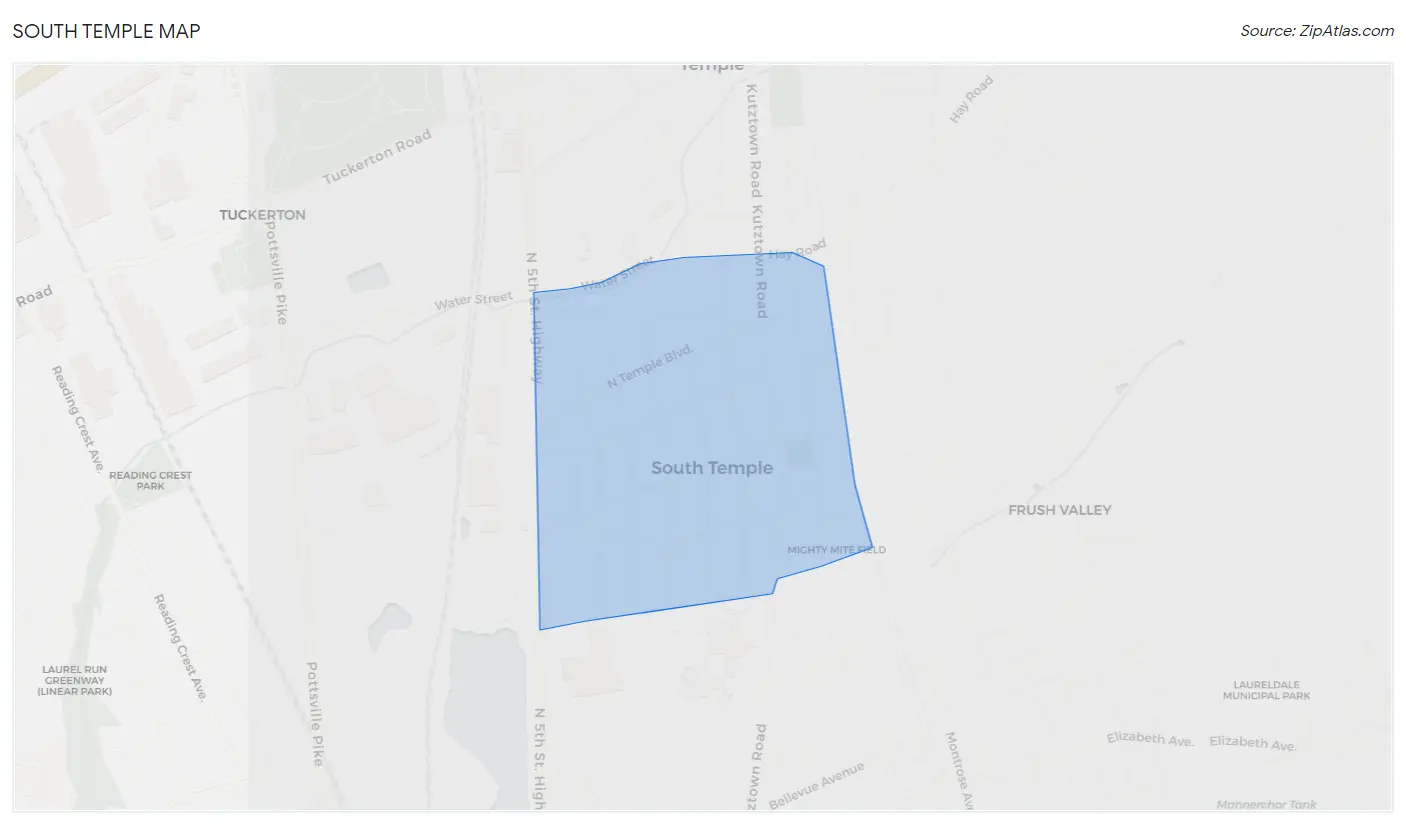
South Temple Overview
$31,132
PER CAPITA INCOME
$87,823
AVG FAMILY INCOME
$74,167
AVG HOUSEHOLD INCOME
46.5%
WAGE / INCOME GAP [ % ]
53.5¢/ $1
WAGE / INCOME GAP [ $ ]
0.32
INEQUALITY / GINI INDEX
1,874
TOTAL POPULATION
769
MALE POPULATION
1,105
FEMALE POPULATION
69.59
MALES / 100 FEMALES
143.69
FEMALES / 100 MALES
45.5
MEDIAN AGE
2.8
AVG FAMILY SIZE
2.5
AVG HOUSEHOLD SIZE
777
LABOR FORCE [ PEOPLE ]
50.0%
PERCENT IN LABOR FORCE
1.2%
UNEMPLOYMENT RATE
Income in South Temple
Income Overview in South Temple
Per Capita Income in South Temple is $31,132, while median incomes of families and households are $87,823 and $74,167 respectively.
| Characteristic | Number | Measure |
| Per Capita Income | 1,874 | $31,132 |
| Median Family Income | 579 | $87,823 |
| Mean Family Income | 579 | $90,721 |
| Median Household Income | 752 | $74,167 |
| Mean Household Income | 752 | $81,290 |
| Income Deficit | 579 | $0 |
| Wage / Income Gap (%) | 1,874 | 46.45% |
| Wage / Income Gap ($) | 1,874 | 53.55¢ per $1 |
| Gini / Inequality Index | 1,874 | 0.32 |
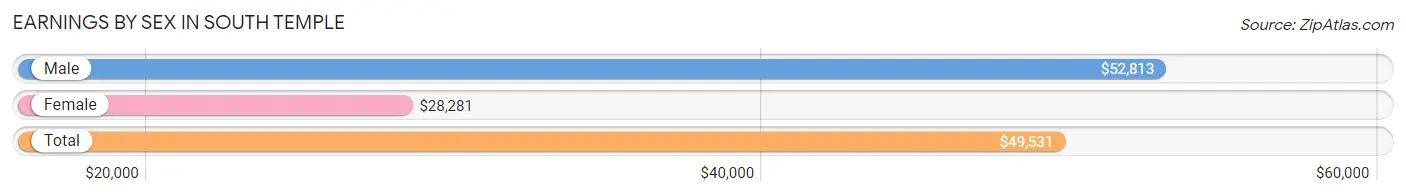
Earnings by Sex in South Temple
Average Earnings in South Temple are $49,531, $52,813 for men and $28,281 for women, a difference of 46.5%.
| Sex | Number | Average Earnings |
| Male | 443 (54.4%) | $52,813 |
| Female | 371 (45.6%) | $28,281 |
| Total | 814 (100.0%) | $49,531 |
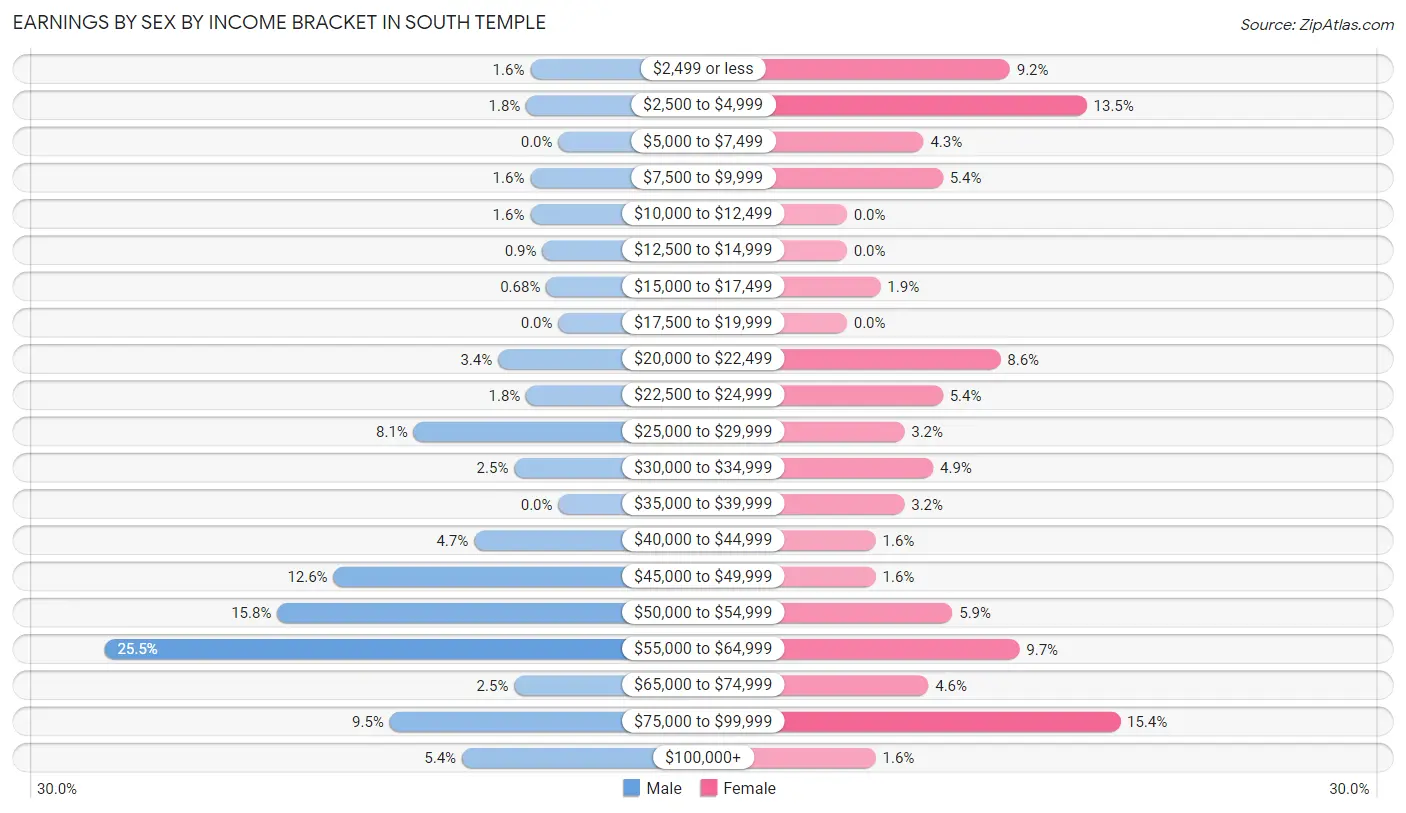
Earnings by Sex by Income Bracket in South Temple
The most common earnings brackets in South Temple are $55,000 to $64,999 for men (113 | 25.5%) and $75,000 to $99,999 for women (57 | 15.4%).
| Income | Male | Female |
| $2,499 or less | 7 (1.6%) | 34 (9.2%) |
| $2,500 to $4,999 | 8 (1.8%) | 50 (13.5%) |
| $5,000 to $7,499 | 0 (0.0%) | 16 (4.3%) |
| $7,500 to $9,999 | 7 (1.6%) | 20 (5.4%) |
| $10,000 to $12,499 | 7 (1.6%) | 0 (0.0%) |
| $12,500 to $14,999 | 4 (0.9%) | 0 (0.0%) |
| $15,000 to $17,499 | 3 (0.7%) | 7 (1.9%) |
| $17,500 to $19,999 | 0 (0.0%) | 0 (0.0%) |
| $20,000 to $22,499 | 15 (3.4%) | 32 (8.6%) |
| $22,500 to $24,999 | 8 (1.8%) | 20 (5.4%) |
| $25,000 to $29,999 | 36 (8.1%) | 12 (3.2%) |
| $30,000 to $34,999 | 11 (2.5%) | 18 (4.9%) |
| $35,000 to $39,999 | 0 (0.0%) | 12 (3.2%) |
| $40,000 to $44,999 | 21 (4.7%) | 6 (1.6%) |
| $45,000 to $49,999 | 56 (12.6%) | 6 (1.6%) |
| $50,000 to $54,999 | 70 (15.8%) | 22 (5.9%) |
| $55,000 to $64,999 | 113 (25.5%) | 36 (9.7%) |
| $65,000 to $74,999 | 11 (2.5%) | 17 (4.6%) |
| $75,000 to $99,999 | 42 (9.5%) | 57 (15.4%) |
| $100,000+ | 24 (5.4%) | 6 (1.6%) |
| Total | 443 (100.0%) | 371 (100.0%) |
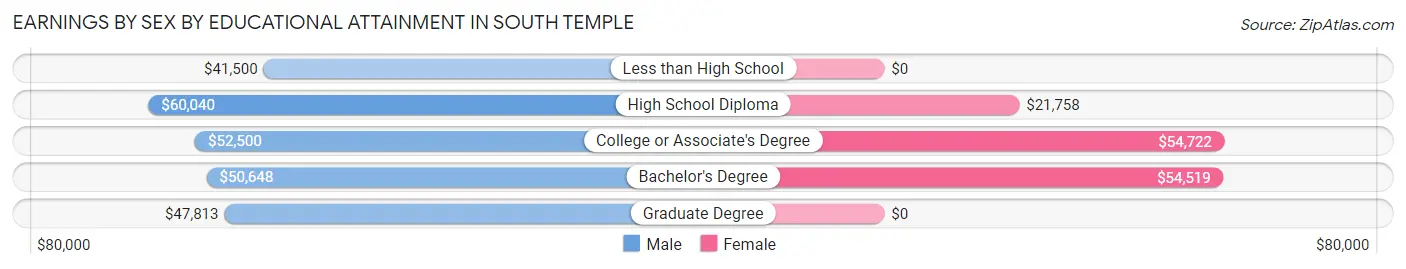
Earnings by Sex by Educational Attainment in South Temple
Average earnings in South Temple are $51,912 for men and $34,722 for women, a difference of 33.1%. Men with an educational attainment of high school diploma enjoy the highest average annual earnings of $60,040, while those with less than high school education earn the least with $41,500. Women with an educational attainment of college or associate's degree earn the most with the average annual earnings of $54,722, while those with high school diploma education have the smallest earnings of $21,758.
| Educational Attainment | Male Income | Female Income |
| Less than High School | $41,500 | $0 |
| High School Diploma | $60,040 | $21,758 |
| College or Associate's Degree | $52,500 | $54,722 |
| Bachelor's Degree | $50,648 | $54,519 |
| Graduate Degree | $47,813 | $0 |
| Total | $51,912 | $34,722 |
Family Income in South Temple
Family Income Brackets in South Temple
According to the South Temple family income data, there are 203 families falling into the $75,000 to $99,999 income range, which is the most common income bracket and makes up 35.1% of all families.
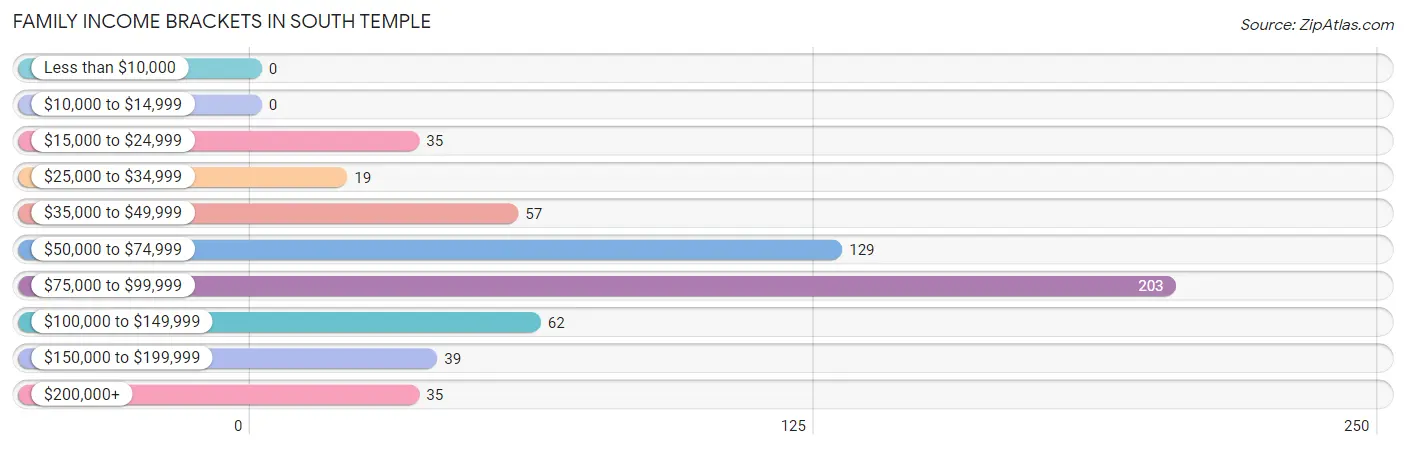
| Income Bracket | # Families | % Families |
| Less than $10,000 | 0 | 0.0% |
| $10,000 to $14,999 | 0 | 0.0% |
| $15,000 to $24,999 | 35 | 6.0% |
| $25,000 to $34,999 | 19 | 3.3% |
| $35,000 to $49,999 | 57 | 9.8% |
| $50,000 to $74,999 | 129 | 22.3% |
| $75,000 to $99,999 | 203 | 35.1% |
| $100,000 to $149,999 | 62 | 10.7% |
| $150,000 to $199,999 | 39 | 6.7% |
| $200,000+ | 35 | 6.0% |
Family Income by Famaliy Size in South Temple
5-person families (62 | 10.7%) account for the highest median family income in South Temple with $187,593 per family, while 2-person families (350 | 60.5%) have the highest median income of $43,828 per family member.
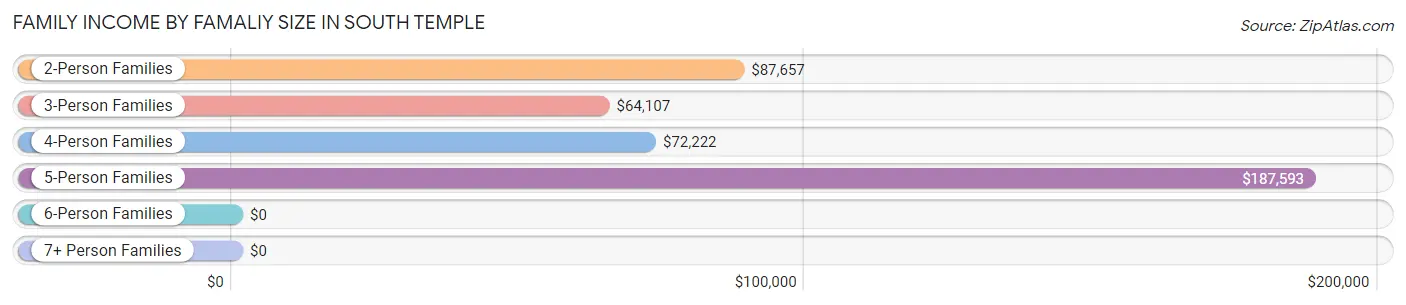
| Income Bracket | # Families | Median Income |
| 2-Person Families | 350 (60.5%) | $87,657 |
| 3-Person Families | 86 (14.8%) | $64,107 |
| 4-Person Families | 46 (7.9%) | $72,222 |
| 5-Person Families | 62 (10.7%) | $187,593 |
| 6-Person Families | 30 (5.2%) | $0 |
| 7+ Person Families | 5 (0.9%) | $0 |
| Total | 579 (100.0%) | $87,823 |
Family Income by Number of Earners in South Temple
The median family income in South Temple is $87,823, with families comprising 3+ earners (73) having the highest median family income of $189,306, while families with no earners (103) have the lowest median family income of $39,952, accounting for 12.6% and 17.8% of families, respectively.
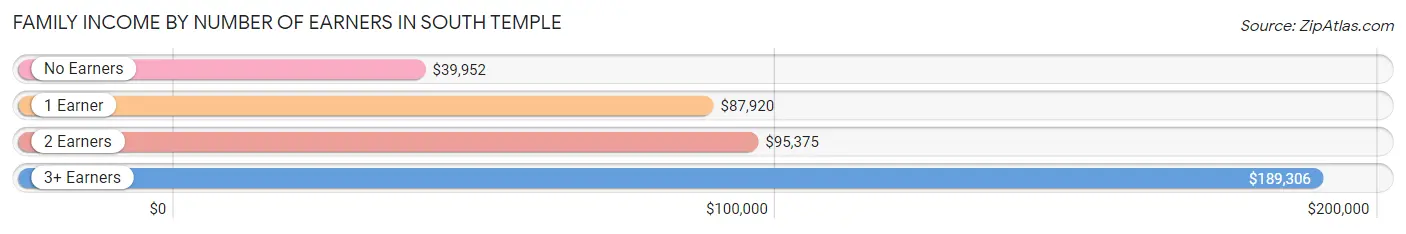
| Number of Earners | # Families | Median Income |
| No Earners | 103 (17.8%) | $39,952 |
| 1 Earner | 246 (42.5%) | $87,920 |
| 2 Earners | 157 (27.1%) | $95,375 |
| 3+ Earners | 73 (12.6%) | $189,306 |
| Total | 579 (100.0%) | $87,823 |
Household Income in South Temple
Household Income Brackets in South Temple
With 214 households falling in the category, the $75,000 to $99,999 income range is the most frequent in South Temple, accounting for 28.5% of all households. In contrast, only 5 households (0.7%) fall into the less than $10,000 income bracket, making it the least populous group.
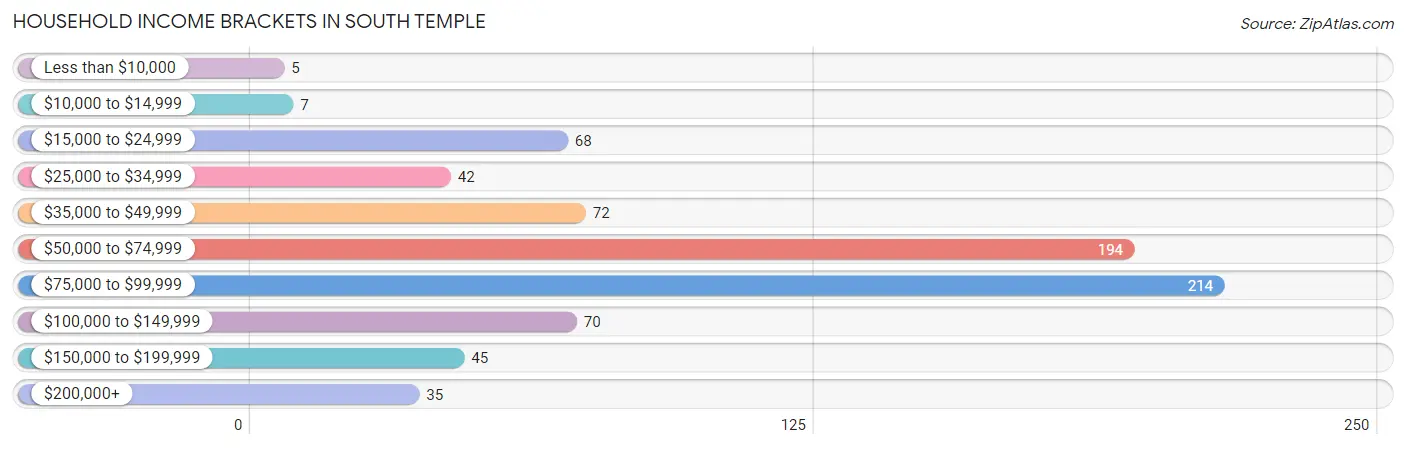
| Income Bracket | # Households | % Households |
| Less than $10,000 | 5 | 0.7% |
| $10,000 to $14,999 | 7 | 0.9% |
| $15,000 to $24,999 | 68 | 9.0% |
| $25,000 to $34,999 | 42 | 5.6% |
| $35,000 to $49,999 | 72 | 9.6% |
| $50,000 to $74,999 | 194 | 25.8% |
| $75,000 to $99,999 | 214 | 28.5% |
| $100,000 to $149,999 | 70 | 9.3% |
| $150,000 to $199,999 | 45 | 6.0% |
| $200,000+ | 35 | 4.7% |
Household Income by Householder Age in South Temple
The median household income in South Temple is $74,167, with the highest median household income of $79,722 found in the 25 to 44 years age bracket for the primary householder. A total of 162 households (21.5%) fall into this category. Meanwhile, the 15 to 24 years age bracket for the primary householder has the lowest median household income of $0, with 5 households (0.7%) in this group.
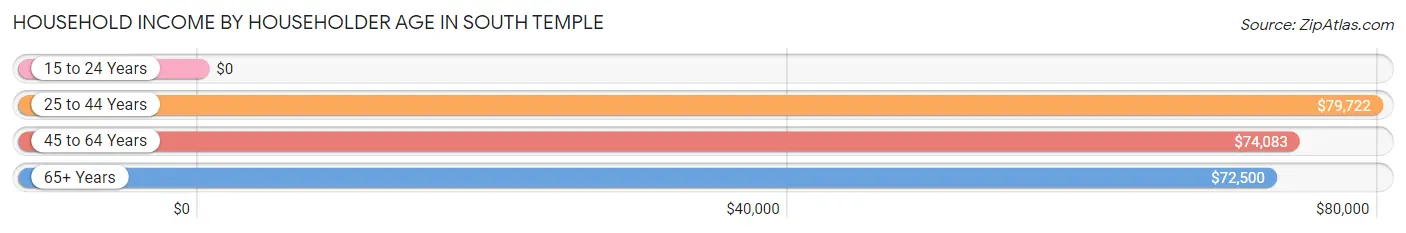
| Income Bracket | # Households | Median Income |
| 15 to 24 Years | 5 (0.7%) | $0 |
| 25 to 44 Years | 162 (21.5%) | $79,722 |
| 45 to 64 Years | 223 (29.6%) | $74,083 |
| 65+ Years | 362 (48.1%) | $72,500 |
| Total | 752 (100.0%) | $74,167 |
Poverty in South Temple
Income Below Poverty by Sex and Age in South Temple
With 4.2% poverty level for males and 2.5% for females among the residents of South Temple, 12 to 14 year old males and 6 to 11 year old females are the most vulnerable to poverty, with 17 males (100.0%) and 9 females (69.2%) in their respective age groups living below the poverty level.
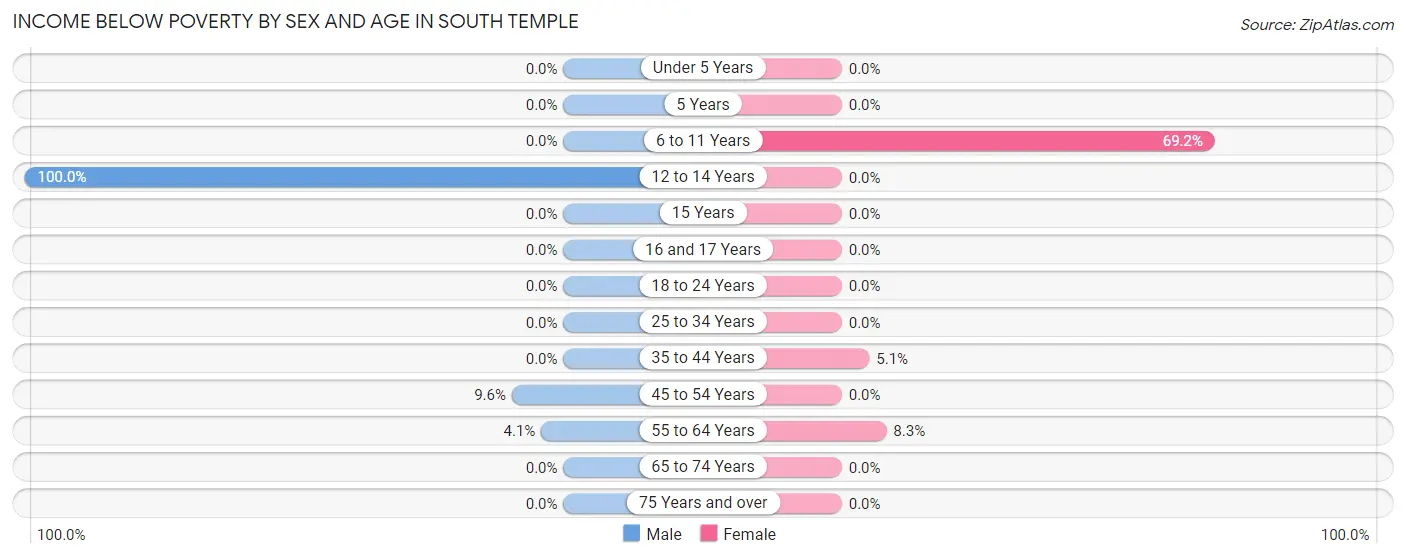
| Age Bracket | Male | Female |
| Under 5 Years | 0 (0.0%) | 0 (0.0%) |
| 5 Years | 0 (0.0%) | 0 (0.0%) |
| 6 to 11 Years | 0 (0.0%) | 9 (69.2%) |
| 12 to 14 Years | 17 (100.0%) | 0 (0.0%) |
| 15 Years | 0 (0.0%) | 0 (0.0%) |
| 16 and 17 Years | 0 (0.0%) | 0 (0.0%) |
| 18 to 24 Years | 0 (0.0%) | 0 (0.0%) |
| 25 to 34 Years | 0 (0.0%) | 0 (0.0%) |
| 35 to 44 Years | 0 (0.0%) | 7 (5.1%) |
| 45 to 54 Years | 11 (9.6%) | 0 (0.0%) |
| 55 to 64 Years | 4 (4.1%) | 12 (8.3%) |
| 65 to 74 Years | 0 (0.0%) | 0 (0.0%) |
| 75 Years and over | 0 (0.0%) | 0 (0.0%) |
| Total | 32 (4.2%) | 28 (2.5%) |
Income Above Poverty by Sex and Age in South Temple
According to the poverty statistics in South Temple, males aged under 5 years and females aged under 5 years are the age groups that are most secure financially, with 100.0% of males and 100.0% of females in these age groups living above the poverty line.
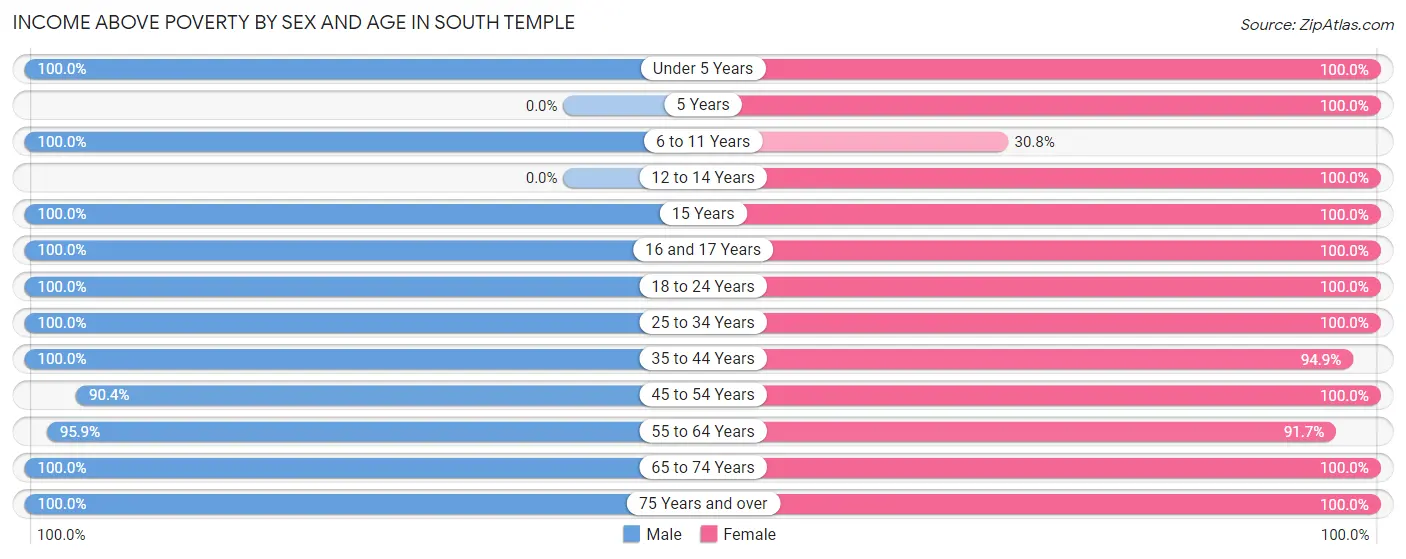
| Age Bracket | Male | Female |
| Under 5 Years | 18 (100.0%) | 53 (100.0%) |
| 5 Years | 0 (0.0%) | 27 (100.0%) |
| 6 to 11 Years | 82 (100.0%) | 4 (30.8%) |
| 12 to 14 Years | 0 (0.0%) | 78 (100.0%) |
| 15 Years | 8 (100.0%) | 24 (100.0%) |
| 16 and 17 Years | 39 (100.0%) | 32 (100.0%) |
| 18 to 24 Years | 56 (100.0%) | 86 (100.0%) |
| 25 to 34 Years | 101 (100.0%) | 37 (100.0%) |
| 35 to 44 Years | 96 (100.0%) | 130 (94.9%) |
| 45 to 54 Years | 104 (90.4%) | 55 (100.0%) |
| 55 to 64 Years | 93 (95.9%) | 133 (91.7%) |
| 65 to 74 Years | 102 (100.0%) | 125 (100.0%) |
| 75 Years and over | 38 (100.0%) | 293 (100.0%) |
| Total | 737 (95.8%) | 1,077 (97.5%) |
Income Below Poverty Among Married-Couple Families in South Temple
The poverty statistics for married-couple families in South Temple show that 3.2% or 11 of the total 347 families live below the poverty line. Families with 3 or 4 children have the highest poverty rate of 20.4%, comprising of 11 families. On the other hand, families with no children have the lowest poverty rate of 0.0%, which includes 0 families.
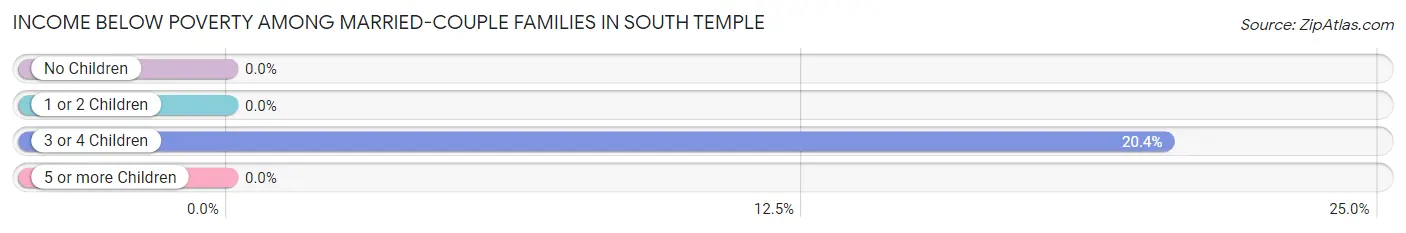
| Children | Above Poverty | Below Poverty |
| No Children | 207 (100.0%) | 0 (0.0%) |
| 1 or 2 Children | 86 (100.0%) | 0 (0.0%) |
| 3 or 4 Children | 43 (79.6%) | 11 (20.4%) |
| 5 or more Children | 0 (0.0%) | 0 (0.0%) |
| Total | 336 (96.8%) | 11 (3.2%) |
Income Below Poverty Among Single-Parent Households in South Temple
| Children | Single Father | Single Mother |
| No Children | 0 (0.0%) | 0 (0.0%) |
| 1 or 2 Children | 0 (0.0%) | 0 (0.0%) |
| 3 or 4 Children | 0 (0.0%) | 0 (0.0%) |
| 5 or more Children | 0 (0.0%) | 0 (0.0%) |
| Total | 0 (0.0%) | 0 (0.0%) |
Income Below Poverty Among Married-Couple vs Single-Parent Households in South Temple
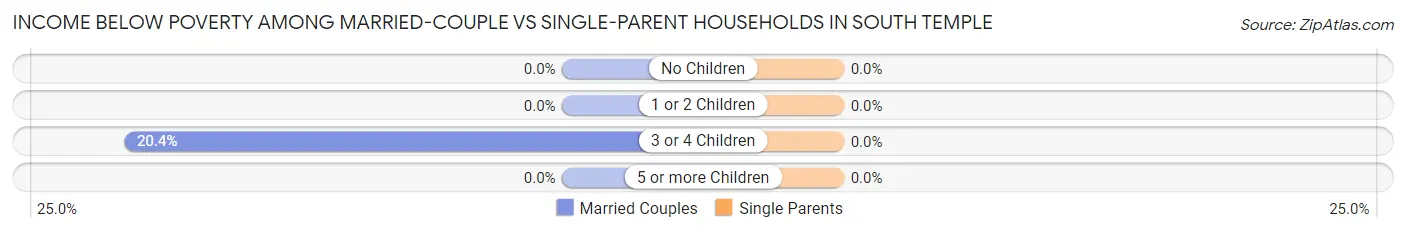
| Children | Married-Couple Families | Single-Parent Households |
| No Children | 0 (0.0%) | 0 (0.0%) |
| 1 or 2 Children | 0 (0.0%) | 0 (0.0%) |
| 3 or 4 Children | 11 (20.4%) | 0 (0.0%) |
| 5 or more Children | 0 (0.0%) | 0 (0.0%) |
| Total | 11 (3.2%) | 0 (0.0%) |
Race in South Temple
The most populous races in South Temple are White / Caucasian (1,327 | 70.8%), Hispanic or Latino (504 | 26.9%), and Some other Race (377 | 20.1%).
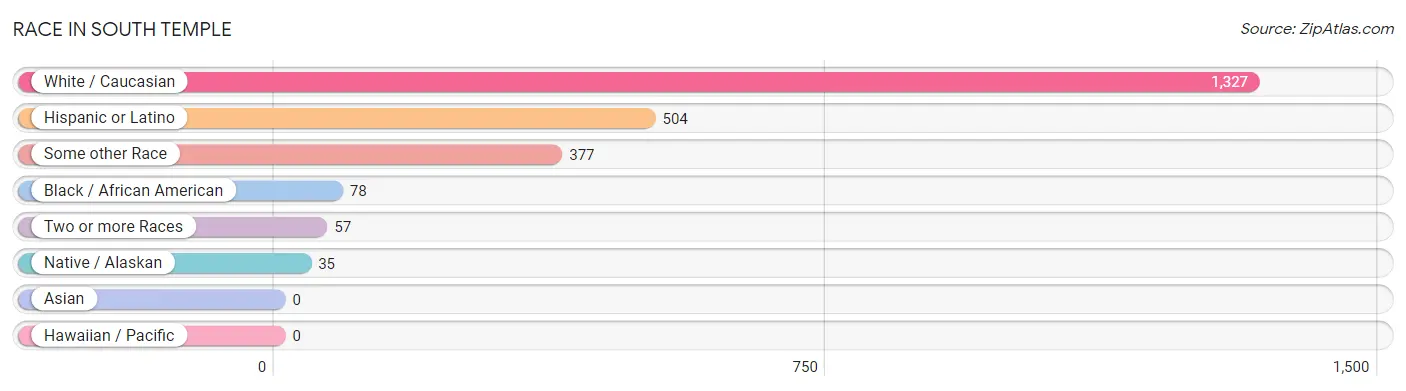
| Race | # Population | % Population |
| Asian | 0 | 0.0% |
| Black / African American | 78 | 4.2% |
| Hawaiian / Pacific | 0 | 0.0% |
| Hispanic or Latino | 504 | 26.9% |
| Native / Alaskan | 35 | 1.9% |
| White / Caucasian | 1,327 | 70.8% |
| Two or more Races | 57 | 3.0% |
| Some other Race | 377 | 20.1% |
| Total | 1,874 | 100.0% |
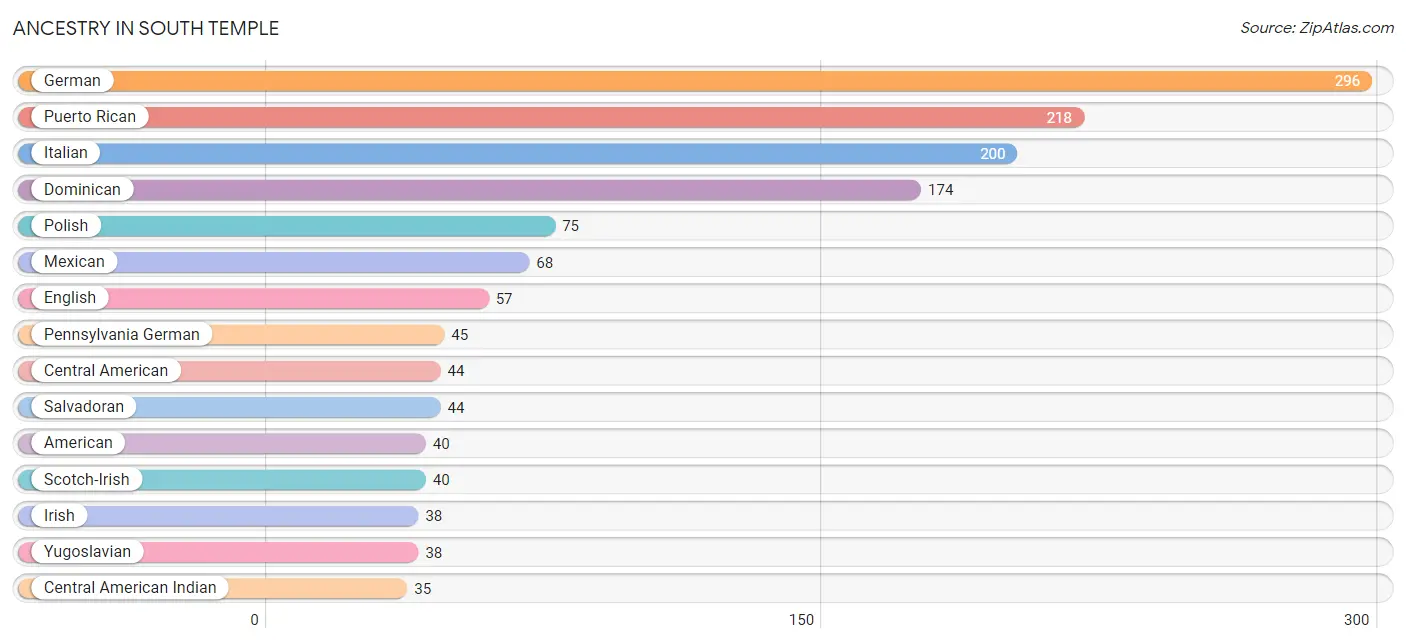
Ancestry in South Temple
The most populous ancestries reported in South Temple are German (296 | 15.8%), Puerto Rican (218 | 11.6%), Italian (200 | 10.7%), Dominican (174 | 9.3%), and Polish (75 | 4.0%), together accounting for 51.4% of all South Temple residents.
| Ancestry | # Population | % Population |
| American | 40 | 2.1% |
| British | 23 | 1.2% |
| Central American | 44 | 2.4% |
| Central American Indian | 35 | 1.9% |
| Cherokee | 19 | 1.0% |
| Dominican | 174 | 9.3% |
| Dutch | 21 | 1.1% |
| Eastern European | 6 | 0.3% |
| English | 57 | 3.0% |
| French | 12 | 0.6% |
| German | 296 | 15.8% |
| Haitian | 15 | 0.8% |
| Hungarian | 5 | 0.3% |
| Irish | 38 | 2.0% |
| Italian | 200 | 10.7% |
| Jamaican | 5 | 0.3% |
| Lithuanian | 4 | 0.2% |
| Mexican | 68 | 3.6% |
| Northern European | 5 | 0.3% |
| Pennsylvania German | 45 | 2.4% |
| Polish | 75 | 4.0% |
| Puerto Rican | 218 | 11.6% |
| Romanian | 3 | 0.2% |
| Salvadoran | 44 | 2.4% |
| Scotch-Irish | 40 | 2.1% |
| Swedish | 3 | 0.2% |
| Swiss | 4 | 0.2% |
| Ukrainian | 6 | 0.3% |
| Yugoslavian | 38 | 2.0% | View All 29 Rows |
Immigrants in South Temple
The most numerous immigrant groups reported in South Temple came from Latin America (145 | 7.7%), Caribbean (110 | 5.9%), Dominican Republic (102 | 5.4%), Central America (35 | 1.9%), and Europe (32 | 1.7%), together accounting for 22.6% of all South Temple residents.
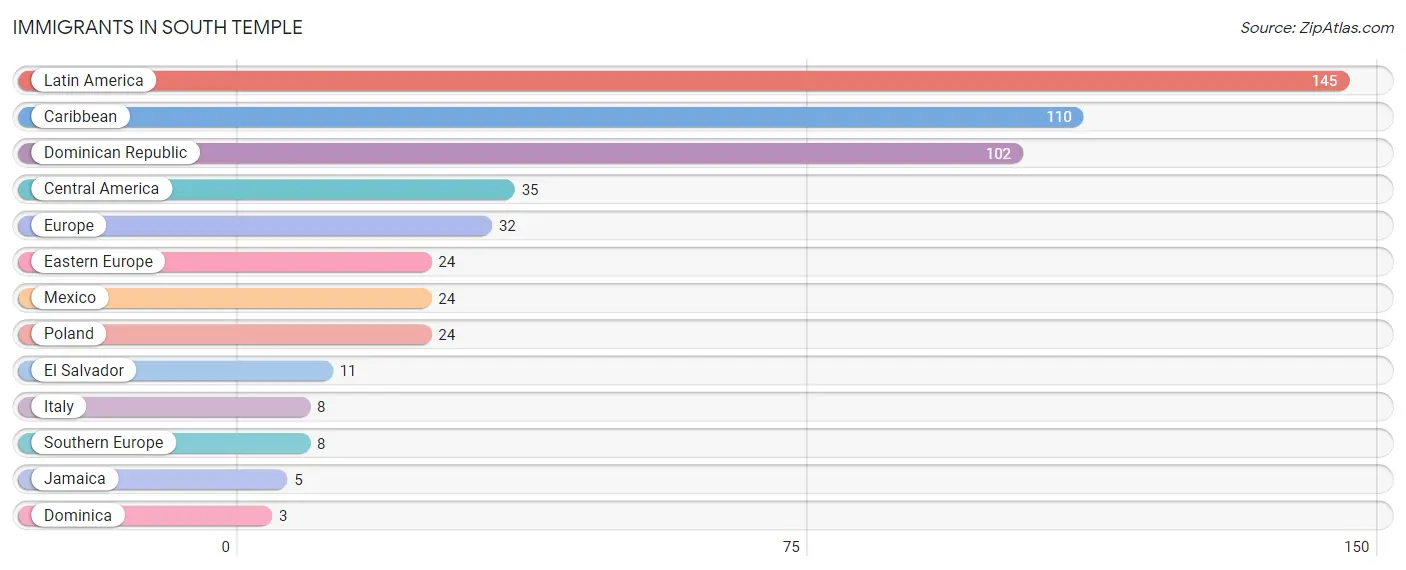
| Immigration Origin | # Population | % Population |
| Caribbean | 110 | 5.9% |
| Central America | 35 | 1.9% |
| Dominica | 3 | 0.2% |
| Dominican Republic | 102 | 5.4% |
| Eastern Europe | 24 | 1.3% |
| El Salvador | 11 | 0.6% |
| Europe | 32 | 1.7% |
| Italy | 8 | 0.4% |
| Jamaica | 5 | 0.3% |
| Latin America | 145 | 7.7% |
| Mexico | 24 | 1.3% |
| Poland | 24 | 1.3% |
| Southern Europe | 8 | 0.4% | View All 13 Rows |
Sex and Age in South Temple
Sex and Age in South Temple
The most populous age groups in South Temple are 10 to 14 Years (93 | 12.1%) for men and 85 Years and over (199 | 18.0%) for women.
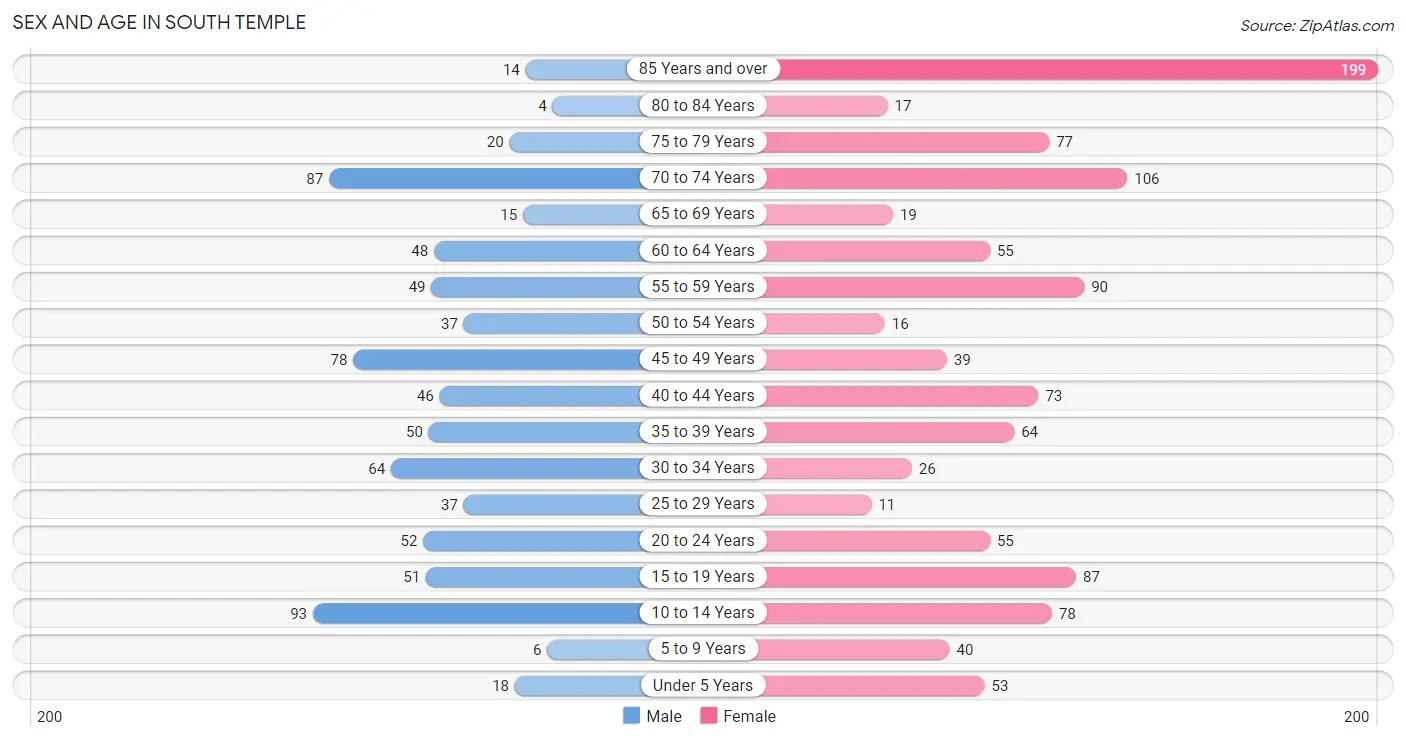
| Age Bracket | Male | Female |
| Under 5 Years | 18 (2.3%) | 53 (4.8%) |
| 5 to 9 Years | 6 (0.8%) | 40 (3.6%) |
| 10 to 14 Years | 93 (12.1%) | 78 (7.1%) |
| 15 to 19 Years | 51 (6.6%) | 87 (7.9%) |
| 20 to 24 Years | 52 (6.8%) | 55 (5.0%) |
| 25 to 29 Years | 37 (4.8%) | 11 (1.0%) |
| 30 to 34 Years | 64 (8.3%) | 26 (2.4%) |
| 35 to 39 Years | 50 (6.5%) | 64 (5.8%) |
| 40 to 44 Years | 46 (6.0%) | 73 (6.6%) |
| 45 to 49 Years | 78 (10.1%) | 39 (3.5%) |
| 50 to 54 Years | 37 (4.8%) | 16 (1.5%) |
| 55 to 59 Years | 49 (6.4%) | 90 (8.1%) |
| 60 to 64 Years | 48 (6.2%) | 55 (5.0%) |
| 65 to 69 Years | 15 (1.9%) | 19 (1.7%) |
| 70 to 74 Years | 87 (11.3%) | 106 (9.6%) |
| 75 to 79 Years | 20 (2.6%) | 77 (7.0%) |
| 80 to 84 Years | 4 (0.5%) | 17 (1.5%) |
| 85 Years and over | 14 (1.8%) | 199 (18.0%) |
| Total | 769 (100.0%) | 1,105 (100.0%) |
Families and Households in South Temple
Median Family Size in South Temple
The median family size in South Temple is 2.83 persons per family, with married-couple families (347 | 59.9%) accounting for the largest median family size of 3.57 persons per family. On the other hand, single female/mother families (205 | 35.4%) represent the smallest median family size with 1.62 persons per family.
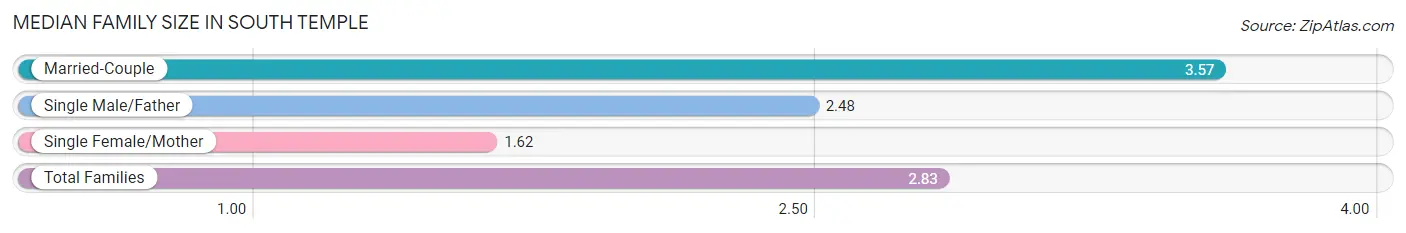
| Family Type | # Families | Family Size |
| Married-Couple | 347 (59.9%) | 3.57 |
| Single Male/Father | 27 (4.7%) | 2.48 |
| Single Female/Mother | 205 (35.4%) | 1.62 |
| Total Families | 579 (100.0%) | 2.83 |
Median Household Size in South Temple
The median household size in South Temple is 2.49 persons per household, with married-couple households (347 | 46.1%) accounting for the largest median household size of 3.59 persons per household. non-family households (173 | 23.0%) represent the smallest median household size with 1.16 persons per household.
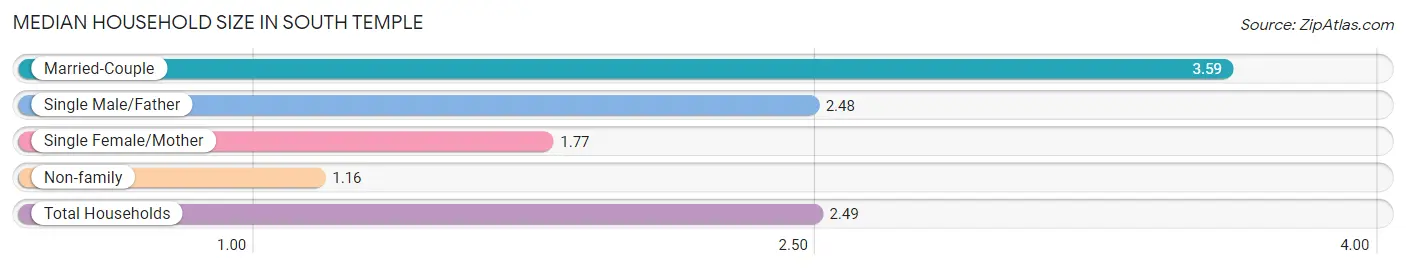
| Household Type | # Households | Household Size |
| Married-Couple | 347 (46.1%) | 3.59 |
| Single Male/Father | 27 (3.6%) | 2.48 |
| Single Female/Mother | 205 (27.3%) | 1.77 |
| Non-family | 173 (23.0%) | 1.16 |
| Total Households | 752 (100.0%) | 2.49 |
Household Size by Marriage Status in South Temple
Out of a total of 752 households in South Temple, 579 (77.0%) are family households, while 173 (23.0%) are nonfamily households. The most numerous type of family households are 2-person households, comprising 325, and the most common type of nonfamily households are 1-person households, comprising 149.
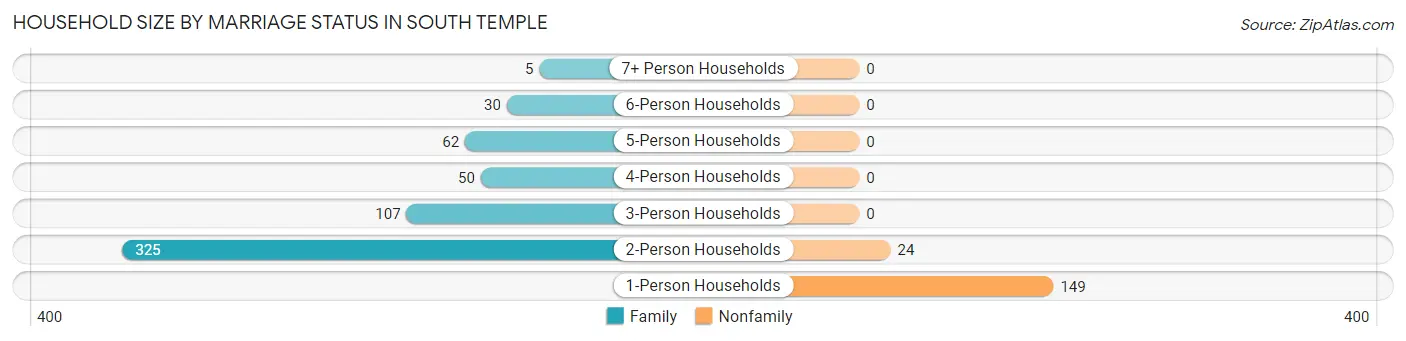
| Household Size | Family Households | Nonfamily Households |
| 1-Person Households | - | 149 (19.8%) |
| 2-Person Households | 325 (43.2%) | 24 (3.2%) |
| 3-Person Households | 107 (14.2%) | 0 (0.0%) |
| 4-Person Households | 50 (6.7%) | 0 (0.0%) |
| 5-Person Households | 62 (8.2%) | 0 (0.0%) |
| 6-Person Households | 30 (4.0%) | 0 (0.0%) |
| 7+ Person Households | 5 (0.7%) | 0 (0.0%) |
| Total | 579 (77.0%) | 173 (23.0%) |
Female Fertility in South Temple
Fertility by Age in South Temple
Average fertility rate in South Temple is 113.0 births per 1,000 women. Women in the age bracket of 15 to 19 years have the highest fertility rate with 425.0 births per 1,000 women. Women in the age bracket of 15 to 19 years acount for 92.5% of all women with births.
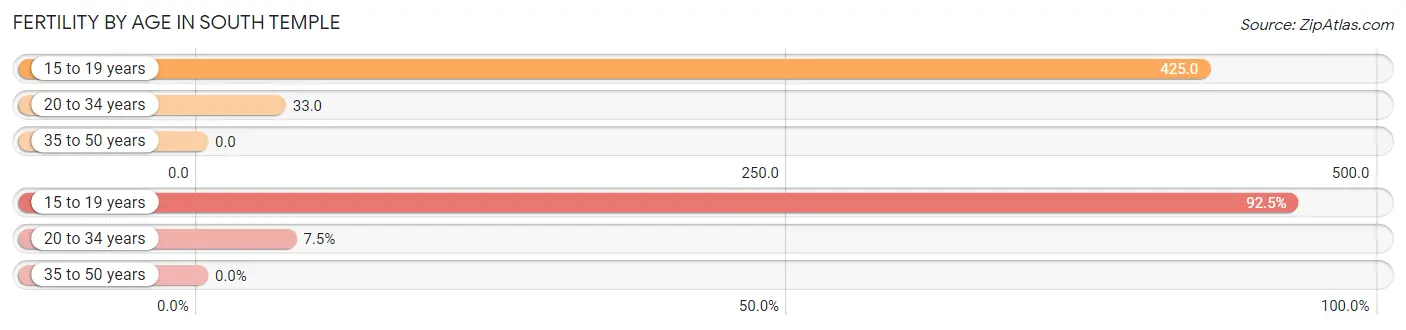
| Age Bracket | Women with Births | Births / 1,000 Women |
| 15 to 19 years | 37 (92.5%) | 425.0 |
| 20 to 34 years | 3 (7.5%) | 33.0 |
| 35 to 50 years | 0 (0.0%) | 0.0 |
| Total | 40 (100.0%) | 113.0 |
Fertility by Age by Marriage Status in South Temple
7.5% of women with births (40) in South Temple are married. The highest percentage of unmarried women with births falls into 15 to 19 years age bracket with 100.0% of them unmarried at the time of birth, while the lowest percentage of unmarried women with births belong to 20 to 34 years age bracket with 0.0% of them unmarried.
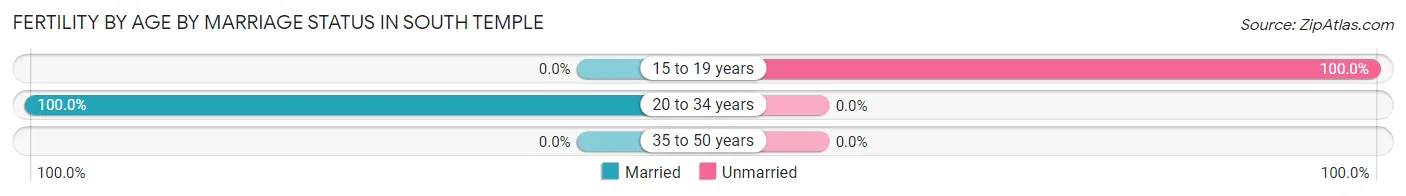
| Age Bracket | Married | Unmarried |
| 15 to 19 years | 0 (0.0%) | 37 (100.0%) |
| 20 to 34 years | 3 (100.0%) | 0 (0.0%) |
| 35 to 50 years | 0 (0.0%) | 0 (0.0%) |
| Total | 3 (7.5%) | 37 (92.5%) |
Fertility by Education in South Temple
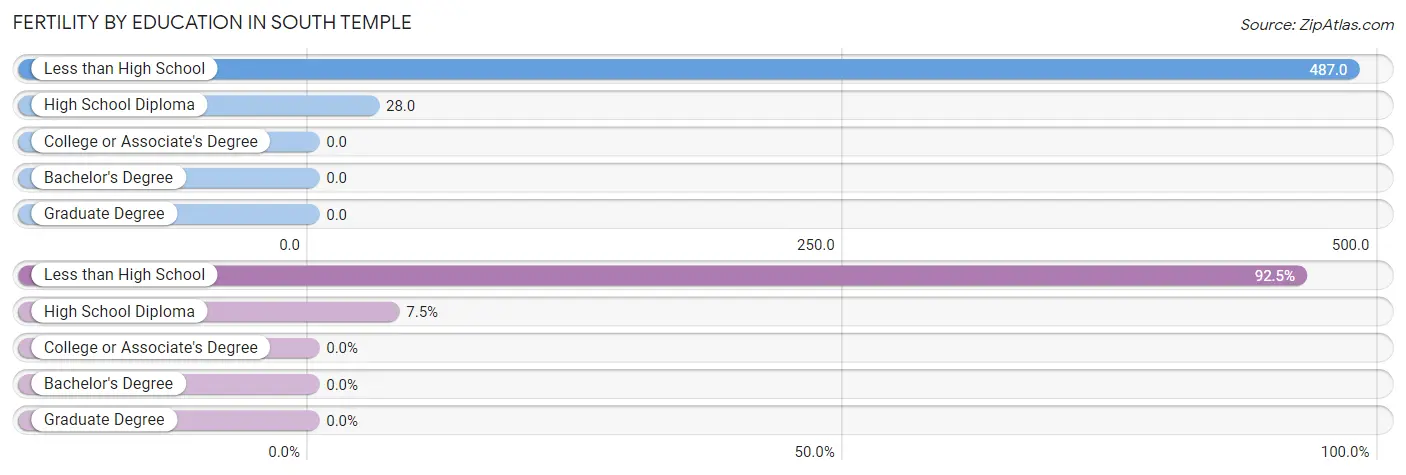
| Educational Attainment | Women with Births | Births / 1,000 Women |
| Less than High School | 37 (92.5%) | 487.0 |
| High School Diploma | 3 (7.5%) | 28.0 |
| College or Associate's Degree | 0 (0.0%) | 0.0 |
| Bachelor's Degree | 0 (0.0%) | 0.0 |
| Graduate Degree | 0 (0.0%) | 0.0 |
| Total | 40 (100.0%) | 113.0 |
Fertility by Education by Marriage Status in South Temple
92.5% of women with births in South Temple are unmarried. Women with the educational attainment of high school diploma are most likely to be married with 100.0% of them married at childbirth, while women with the educational attainment of less than high school are least likely to be married with 100.0% of them unmarried at childbirth.
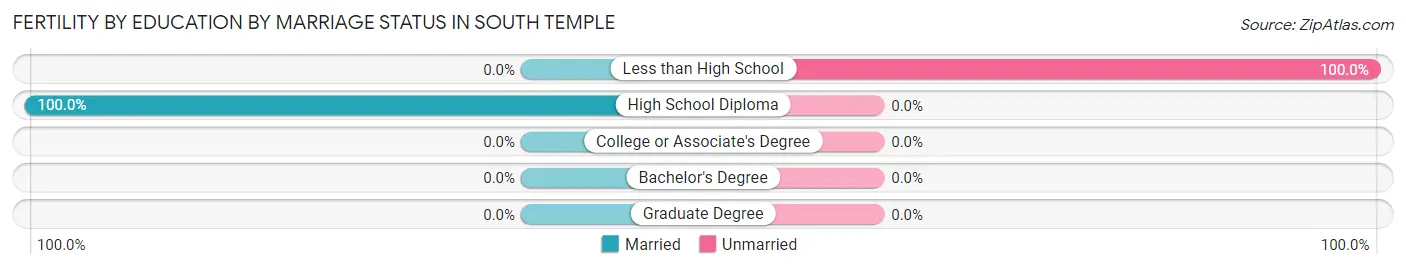
| Educational Attainment | Married | Unmarried |
| Less than High School | 0 (0.0%) | 37 (100.0%) |
| High School Diploma | 3 (100.0%) | 0 (0.0%) |
| College or Associate's Degree | 0 (0.0%) | 0 (0.0%) |
| Bachelor's Degree | 0 (0.0%) | 0 (0.0%) |
| Graduate Degree | 0 (0.0%) | 0 (0.0%) |
| Total | 3 (7.5%) | 37 (92.5%) |
Employment Characteristics in South Temple
Employment by Class of Employer in South Temple
Among the 768 employed individuals in South Temple, private company employees (564 | 73.4%), not-for-profit organizations (86 | 11.2%), and local government employees (50 | 6.5%) make up the most common classes of employment.
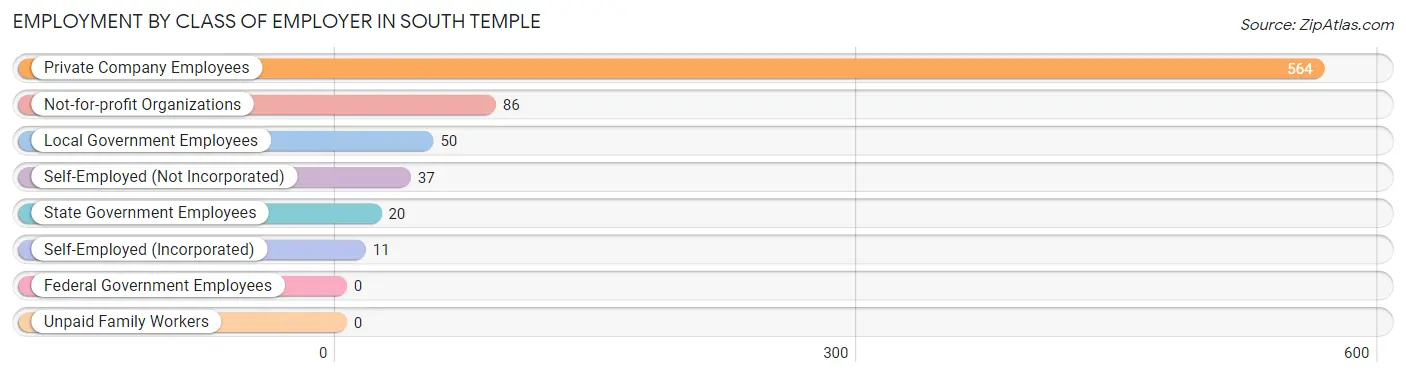
| Employer Class | # Employees | % Employees |
| Private Company Employees | 564 | 73.4% |
| Self-Employed (Incorporated) | 11 | 1.4% |
| Self-Employed (Not Incorporated) | 37 | 4.8% |
| Not-for-profit Organizations | 86 | 11.2% |
| Local Government Employees | 50 | 6.5% |
| State Government Employees | 20 | 2.6% |
| Federal Government Employees | 0 | 0.0% |
| Unpaid Family Workers | 0 | 0.0% |
| Total | 768 | 100.0% |
Employment Status by Age in South Temple
According to the labor force statistics for South Temple, out of the total population over 16 years of age (1,554), 50.0% or 777 individuals are in the labor force, with 1.2% or 9 of them unemployed. The age group with the highest labor force participation rate is 25 to 29 years, with 100.0% or 48 individuals in the labor force. Within the labor force, the 20 to 24 years age range has the highest percentage of unemployed individuals, with 8.7% or 9 of them being unemployed.
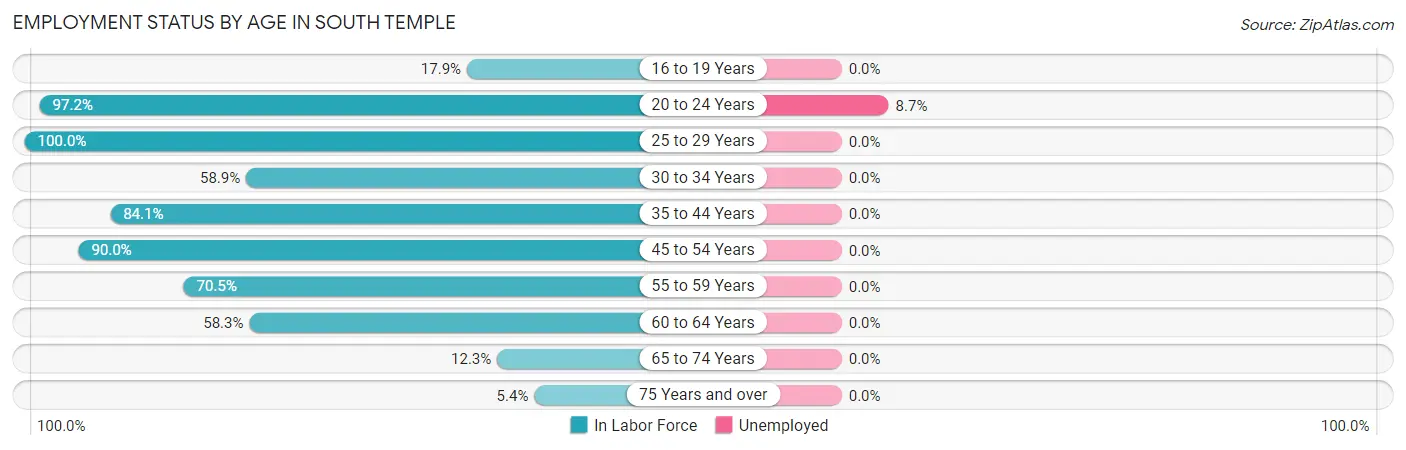
| Age Bracket | In Labor Force | Unemployed |
| 16 to 19 Years | 19 (17.9%) | 0 (0.0%) |
| 20 to 24 Years | 104 (97.2%) | 9 (8.7%) |
| 25 to 29 Years | 48 (100.0%) | 0 (0.0%) |
| 30 to 34 Years | 53 (58.9%) | 0 (0.0%) |
| 35 to 44 Years | 196 (84.1%) | 0 (0.0%) |
| 45 to 54 Years | 153 (90.0%) | 0 (0.0%) |
| 55 to 59 Years | 98 (70.5%) | 0 (0.0%) |
| 60 to 64 Years | 60 (58.3%) | 0 (0.0%) |
| 65 to 74 Years | 28 (12.3%) | 0 (0.0%) |
| 75 Years and over | 18 (5.4%) | 0 (0.0%) |
| Total | 777 (50.0%) | 9 (1.2%) |
Employment Status by Educational Attainment in South Temple
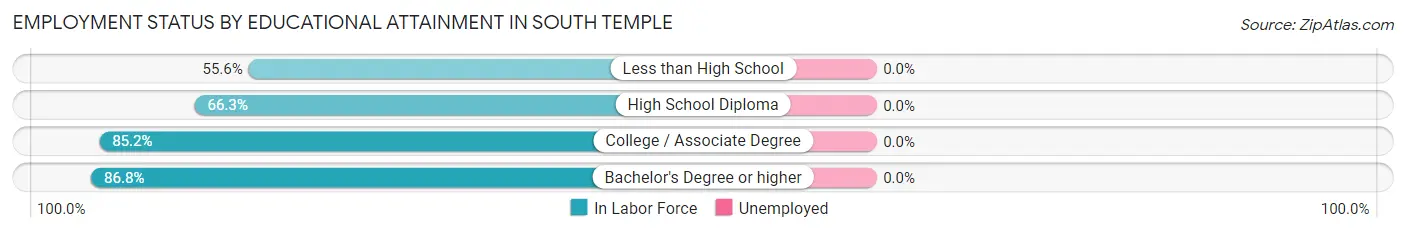
| Educational Attainment | In Labor Force | Unemployed |
| Less than High School | 25 (55.6%) | 0 (0.0%) |
| High School Diploma | 171 (66.3%) | 0 (0.0%) |
| College / Associate Degree | 248 (85.2%) | 0 (0.0%) |
| Bachelor's Degree or higher | 164 (86.8%) | 0 (0.0%) |
| Total | 608 (77.7%) | 0 (0.0%) |
Employment Occupations by Sex in South Temple
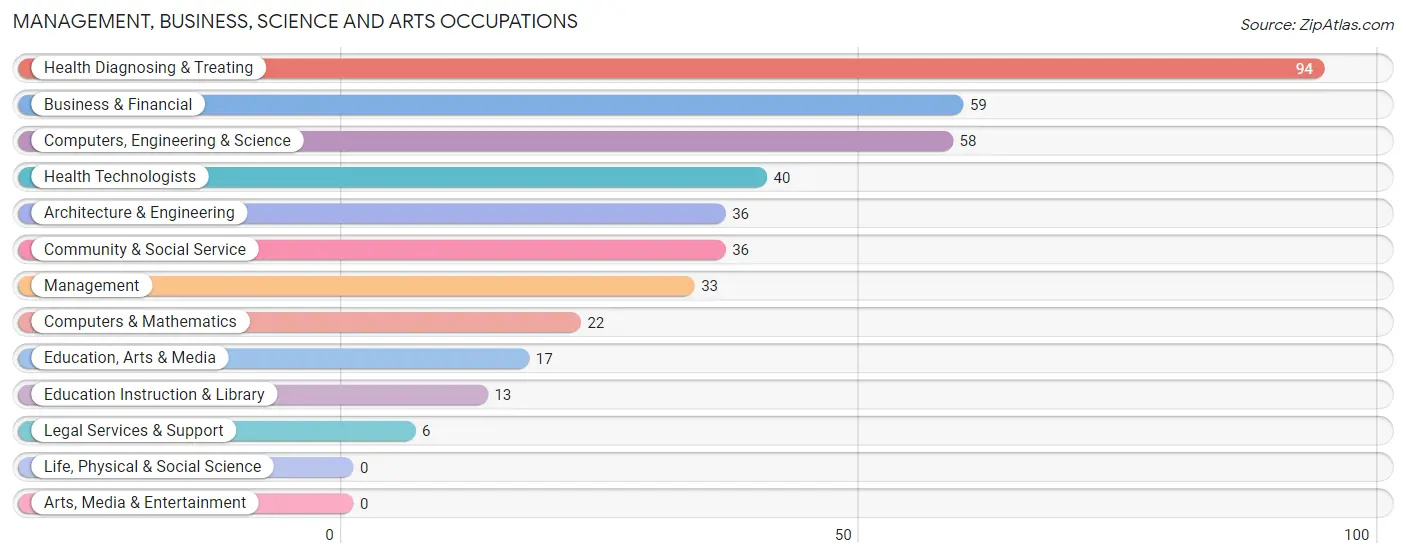
Management, Business, Science and Arts Occupations
The most common Management, Business, Science and Arts occupations in South Temple are Health Diagnosing & Treating (94 | 12.2%), Business & Financial (59 | 7.7%), Computers, Engineering & Science (58 | 7.5%), Health Technologists (40 | 5.2%), and Architecture & Engineering (36 | 4.7%).
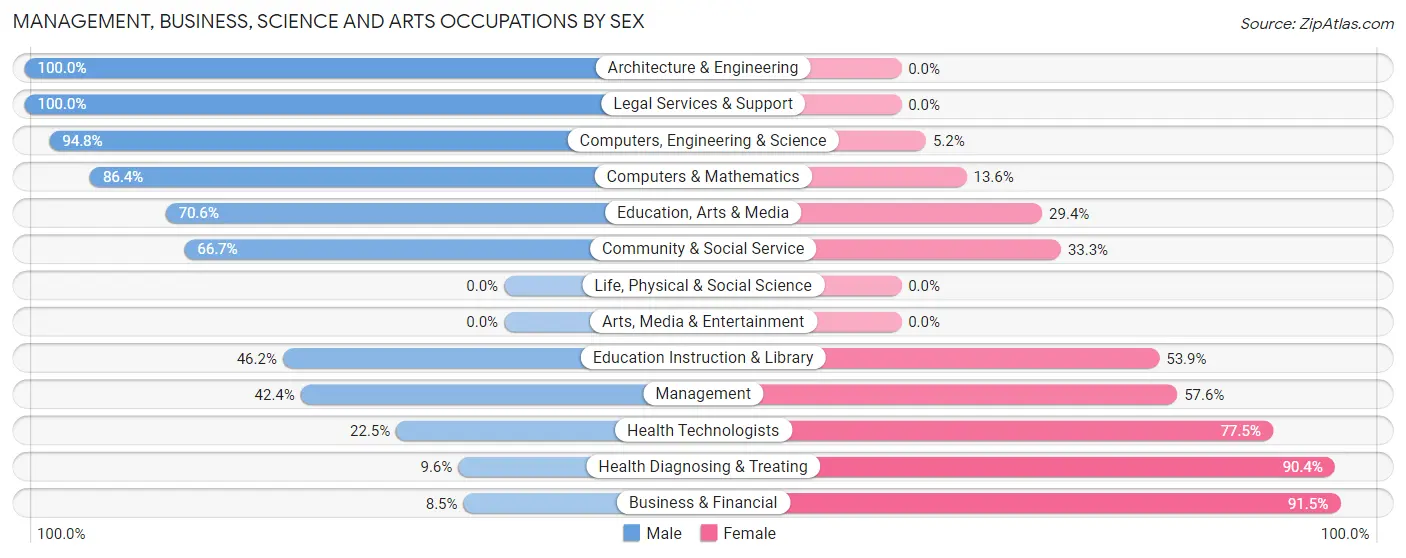
Management, Business, Science and Arts Occupations by Sex
Within the Management, Business, Science and Arts occupations in South Temple, the most male-oriented occupations are Architecture & Engineering (100.0%), Legal Services & Support (100.0%), and Computers, Engineering & Science (94.8%), while the most female-oriented occupations are Business & Financial (91.5%), Health Diagnosing & Treating (90.4%), and Health Technologists (77.5%).
| Occupation | Male | Female |
| Management | 14 (42.4%) | 19 (57.6%) |
| Business & Financial | 5 (8.5%) | 54 (91.5%) |
| Computers, Engineering & Science | 55 (94.8%) | 3 (5.2%) |
| Computers & Mathematics | 19 (86.4%) | 3 (13.6%) |
| Architecture & Engineering | 36 (100.0%) | 0 (0.0%) |
| Life, Physical & Social Science | 0 (0.0%) | 0 (0.0%) |
| Community & Social Service | 24 (66.7%) | 12 (33.3%) |
| Education, Arts & Media | 12 (70.6%) | 5 (29.4%) |
| Legal Services & Support | 6 (100.0%) | 0 (0.0%) |
| Education Instruction & Library | 6 (46.2%) | 7 (53.8%) |
| Arts, Media & Entertainment | 0 (0.0%) | 0 (0.0%) |
| Health Diagnosing & Treating | 9 (9.6%) | 85 (90.4%) |
| Health Technologists | 9 (22.5%) | 31 (77.5%) |
| Total (Category) | 107 (38.2%) | 173 (61.8%) |
| Total (Overall) | 429 (55.9%) | 339 (44.1%) |
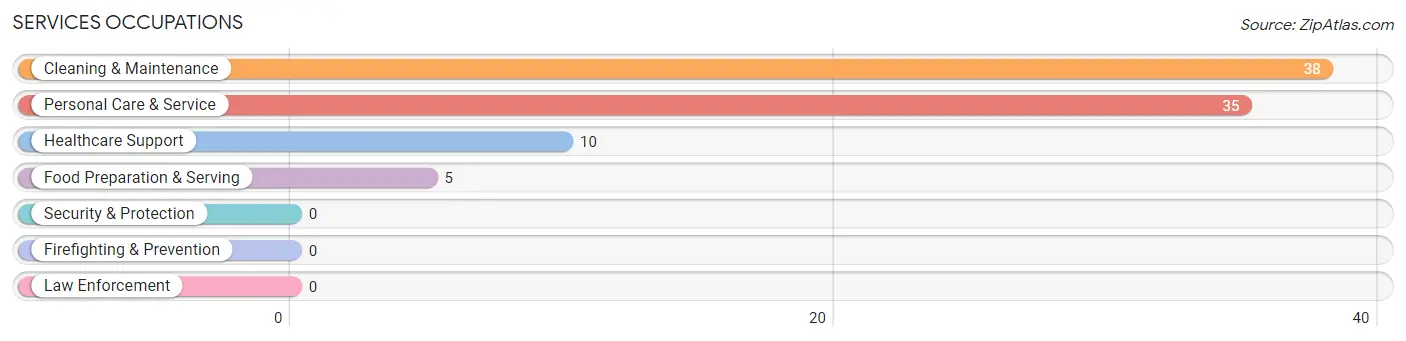
Services Occupations
The most common Services occupations in South Temple are Cleaning & Maintenance (38 | 5.0%), Personal Care & Service (35 | 4.6%), Healthcare Support (10 | 1.3%), and Food Preparation & Serving (5 | 0.6%).
Services Occupations by Sex
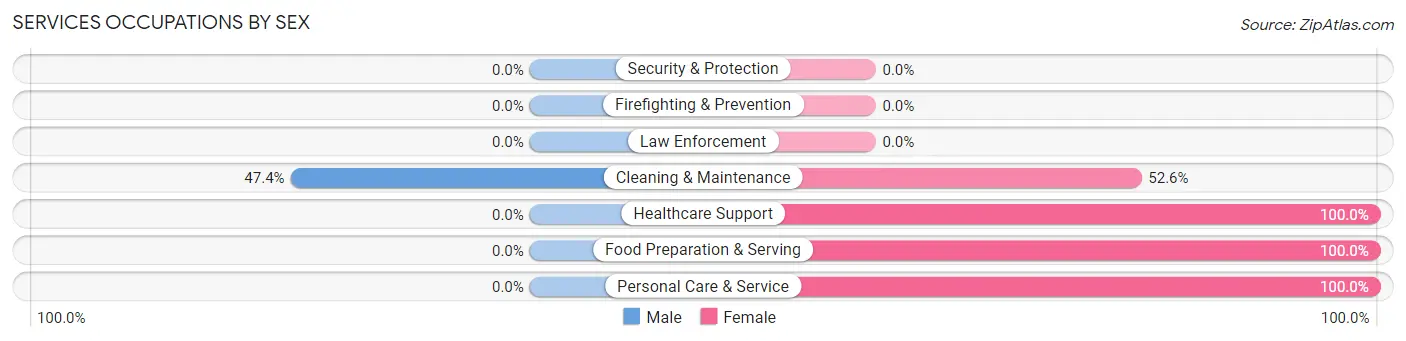
| Occupation | Male | Female |
| Healthcare Support | 0 (0.0%) | 10 (100.0%) |
| Security & Protection | 0 (0.0%) | 0 (0.0%) |
| Firefighting & Prevention | 0 (0.0%) | 0 (0.0%) |
| Law Enforcement | 0 (0.0%) | 0 (0.0%) |
| Food Preparation & Serving | 0 (0.0%) | 5 (100.0%) |
| Cleaning & Maintenance | 18 (47.4%) | 20 (52.6%) |
| Personal Care & Service | 0 (0.0%) | 35 (100.0%) |
| Total (Category) | 18 (20.4%) | 70 (79.5%) |
| Total (Overall) | 429 (55.9%) | 339 (44.1%) |
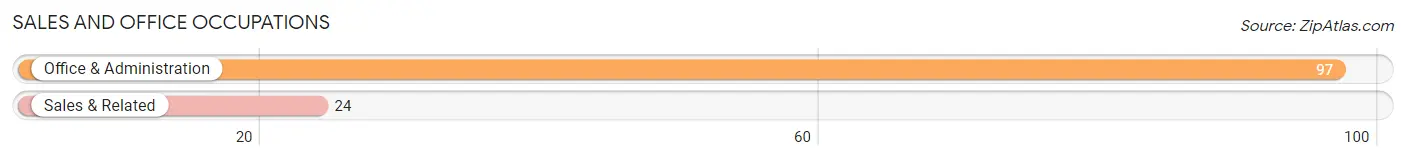
Sales and Office Occupations
The most common Sales and Office occupations in South Temple are Office & Administration (97 | 12.6%), and Sales & Related (24 | 3.1%).
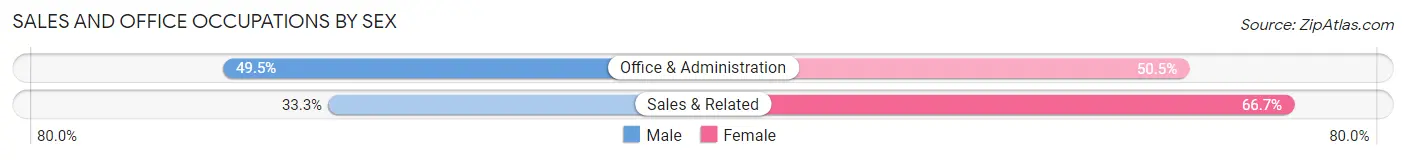
Sales and Office Occupations by Sex
| Occupation | Male | Female |
| Sales & Related | 8 (33.3%) | 16 (66.7%) |
| Office & Administration | 48 (49.5%) | 49 (50.5%) |
| Total (Category) | 56 (46.3%) | 65 (53.7%) |
| Total (Overall) | 429 (55.9%) | 339 (44.1%) |
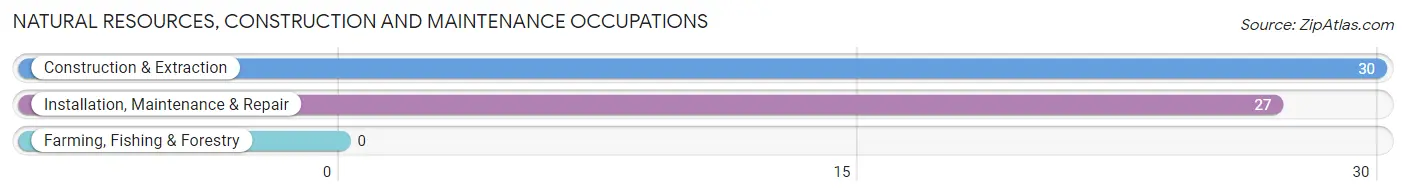
Natural Resources, Construction and Maintenance Occupations
The most common Natural Resources, Construction and Maintenance occupations in South Temple are Construction & Extraction (30 | 3.9%), and Installation, Maintenance & Repair (27 | 3.5%).
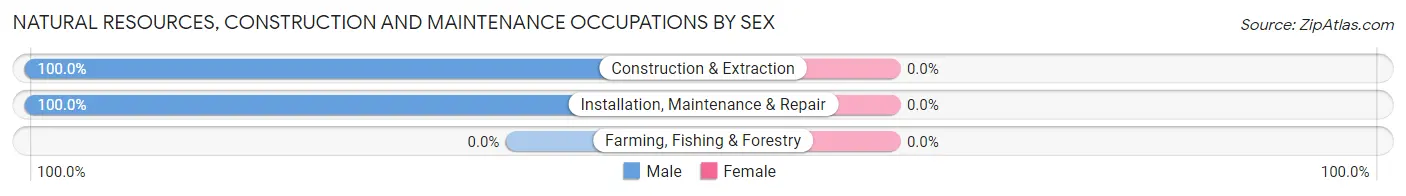
Natural Resources, Construction and Maintenance Occupations by Sex
| Occupation | Male | Female |
| Farming, Fishing & Forestry | 0 (0.0%) | 0 (0.0%) |
| Construction & Extraction | 30 (100.0%) | 0 (0.0%) |
| Installation, Maintenance & Repair | 27 (100.0%) | 0 (0.0%) |
| Total (Category) | 57 (100.0%) | 0 (0.0%) |
| Total (Overall) | 429 (55.9%) | 339 (44.1%) |
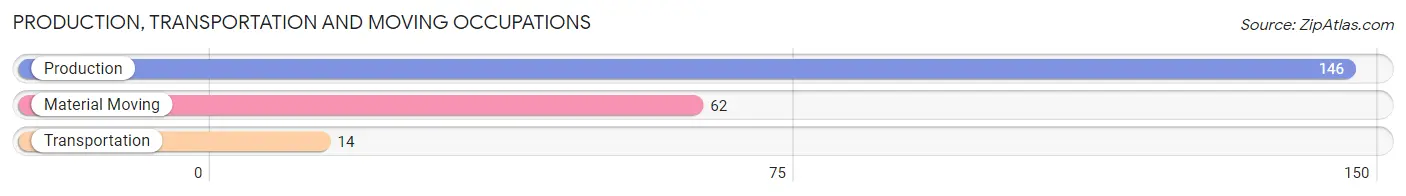
Production, Transportation and Moving Occupations
The most common Production, Transportation and Moving occupations in South Temple are Production (146 | 19.0%), Material Moving (62 | 8.1%), and Transportation (14 | 1.8%).
Production, Transportation and Moving Occupations by Sex
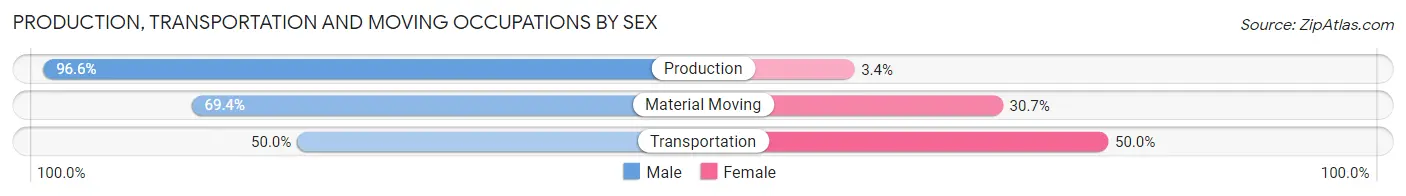
| Occupation | Male | Female |
| Production | 141 (96.6%) | 5 (3.4%) |
| Transportation | 7 (50.0%) | 7 (50.0%) |
| Material Moving | 43 (69.4%) | 19 (30.6%) |
| Total (Category) | 191 (86.0%) | 31 (14.0%) |
| Total (Overall) | 429 (55.9%) | 339 (44.1%) |
Employment Industries by Sex in South Temple
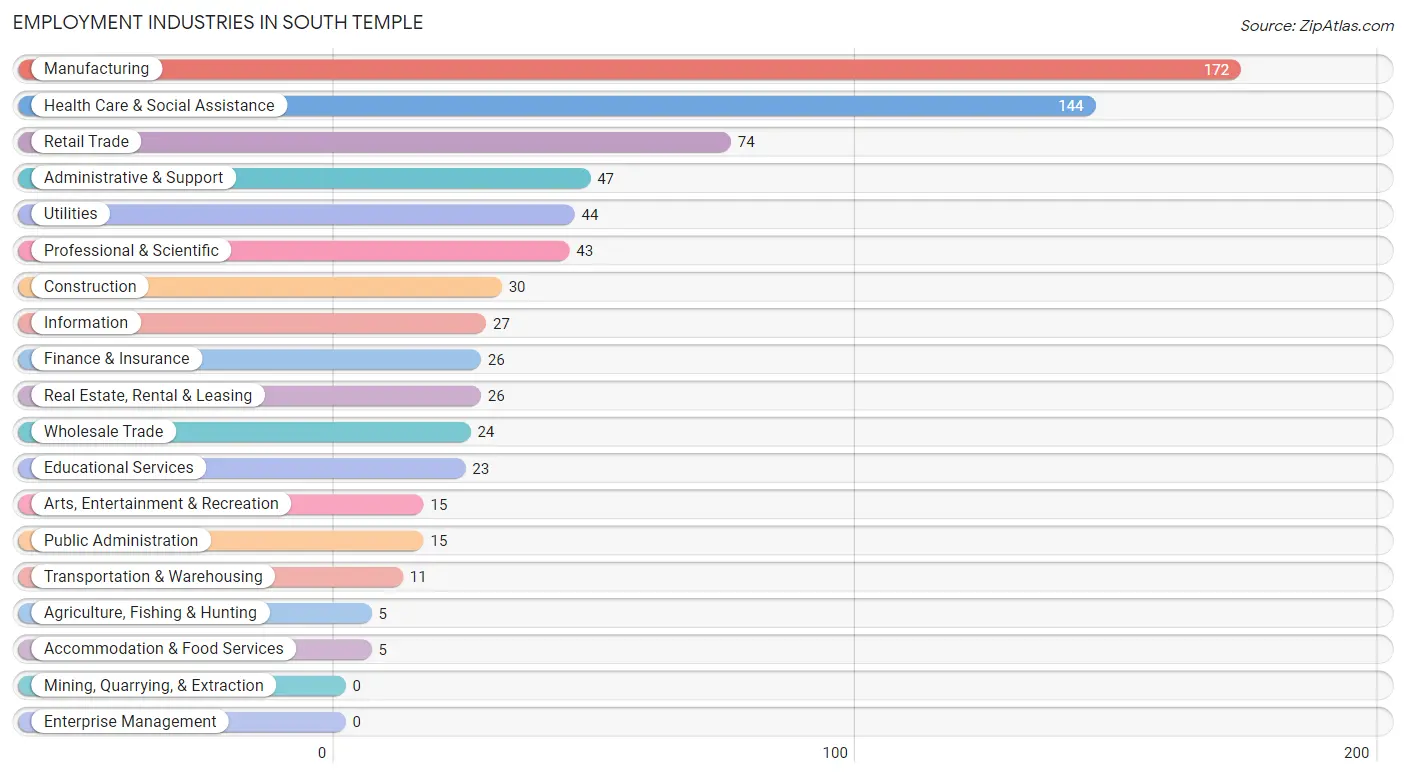
Employment Industries in South Temple
The major employment industries in South Temple include Manufacturing (172 | 22.4%), Health Care & Social Assistance (144 | 18.8%), Retail Trade (74 | 9.6%), Administrative & Support (47 | 6.1%), and Utilities (44 | 5.7%).
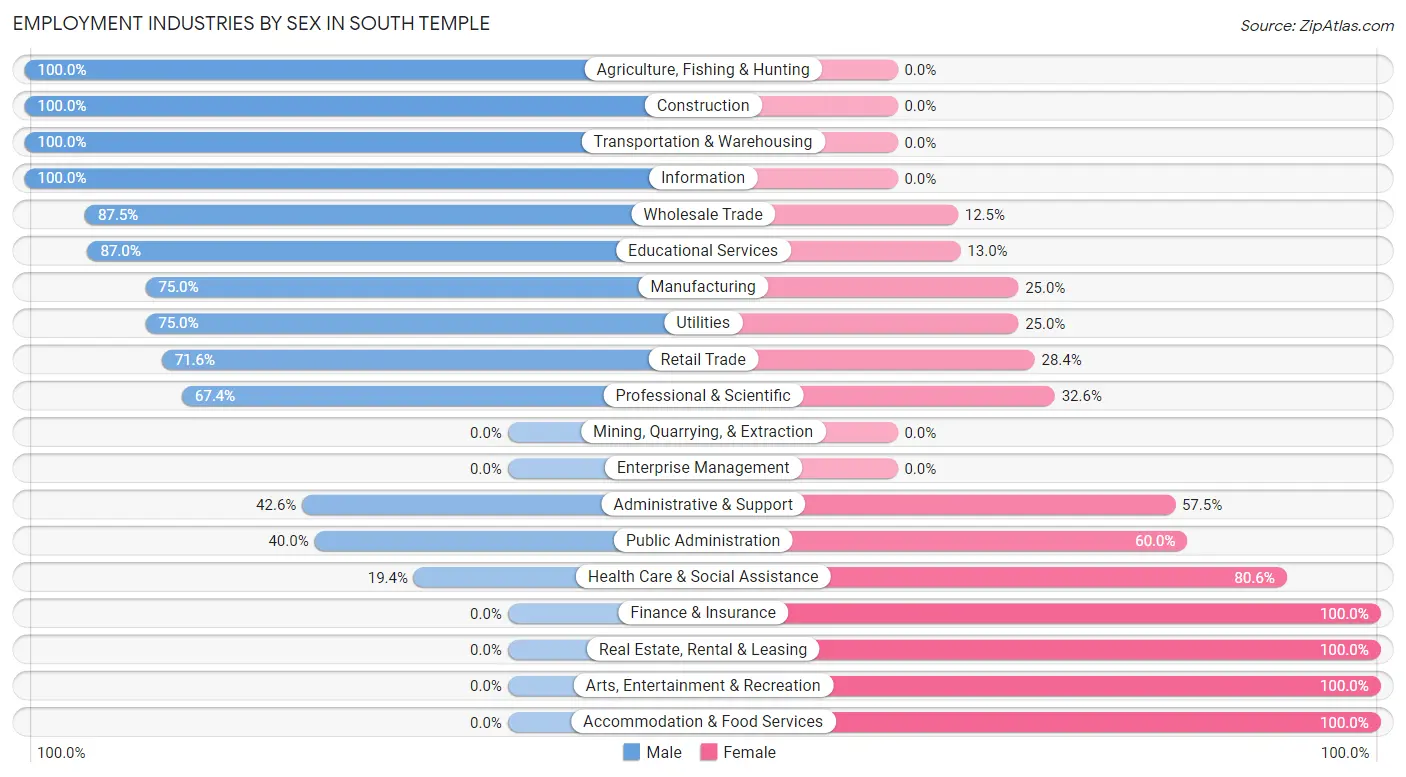
Employment Industries by Sex in South Temple
The South Temple industries that see more men than women are Agriculture, Fishing & Hunting (100.0%), Construction (100.0%), and Transportation & Warehousing (100.0%), whereas the industries that tend to have a higher number of women are Finance & Insurance (100.0%), Real Estate, Rental & Leasing (100.0%), and Arts, Entertainment & Recreation (100.0%).
| Industry | Male | Female |
| Agriculture, Fishing & Hunting | 5 (100.0%) | 0 (0.0%) |
| Mining, Quarrying, & Extraction | 0 (0.0%) | 0 (0.0%) |
| Construction | 30 (100.0%) | 0 (0.0%) |
| Manufacturing | 129 (75.0%) | 43 (25.0%) |
| Wholesale Trade | 21 (87.5%) | 3 (12.5%) |
| Retail Trade | 53 (71.6%) | 21 (28.4%) |
| Transportation & Warehousing | 11 (100.0%) | 0 (0.0%) |
| Utilities | 33 (75.0%) | 11 (25.0%) |
| Information | 27 (100.0%) | 0 (0.0%) |
| Finance & Insurance | 0 (0.0%) | 26 (100.0%) |
| Real Estate, Rental & Leasing | 0 (0.0%) | 26 (100.0%) |
| Professional & Scientific | 29 (67.4%) | 14 (32.6%) |
| Enterprise Management | 0 (0.0%) | 0 (0.0%) |
| Administrative & Support | 20 (42.5%) | 27 (57.5%) |
| Educational Services | 20 (87.0%) | 3 (13.0%) |
| Health Care & Social Assistance | 28 (19.4%) | 116 (80.6%) |
| Arts, Entertainment & Recreation | 0 (0.0%) | 15 (100.0%) |
| Accommodation & Food Services | 0 (0.0%) | 5 (100.0%) |
| Public Administration | 6 (40.0%) | 9 (60.0%) |
| Total | 429 (55.9%) | 339 (44.1%) |
Education in South Temple
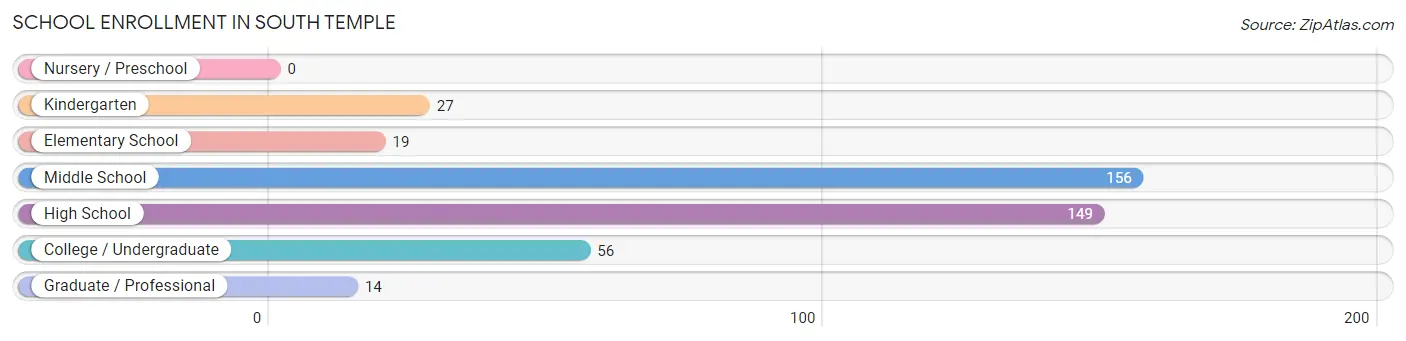
School Enrollment in South Temple
The most common levels of schooling among the 421 students in South Temple are middle school (156 | 37.0%), high school (149 | 35.4%), and college / undergraduate (56 | 13.3%).
| School Level | # Students | % Students |
| Nursery / Preschool | 0 | 0.0% |
| Kindergarten | 27 | 6.4% |
| Elementary School | 19 | 4.5% |
| Middle School | 156 | 37.0% |
| High School | 149 | 35.4% |
| College / Undergraduate | 56 | 13.3% |
| Graduate / Professional | 14 | 3.3% |
| Total | 421 | 100.0% |
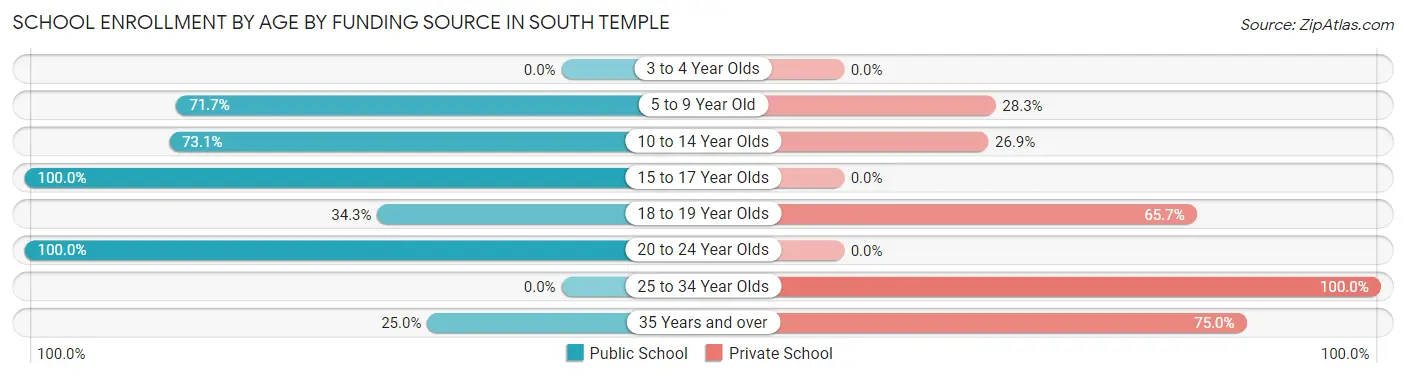
School Enrollment by Age by Funding Source in South Temple
Out of a total of 421 students who are enrolled in schools in South Temple, 105 (24.9%) attend a private institution, while the remaining 316 (75.1%) are enrolled in public schools. The age group of 25 to 34 year olds has the highest likelihood of being enrolled in private schools, with 11 (100.0% in the age bracket) enrolled. Conversely, the age group of 15 to 17 year olds has the lowest likelihood of being enrolled in a private school, with 103 (100.0% in the age bracket) attending a public institution.
| Age Bracket | Public School | Private School |
| 3 to 4 Year Olds | 0 (0.0%) | 0 (0.0%) |
| 5 to 9 Year Old | 33 (71.7%) | 13 (28.3%) |
| 10 to 14 Year Olds | 125 (73.1%) | 46 (26.9%) |
| 15 to 17 Year Olds | 103 (100.0%) | 0 (0.0%) |
| 18 to 19 Year Olds | 12 (34.3%) | 23 (65.7%) |
| 20 to 24 Year Olds | 39 (100.0%) | 0 (0.0%) |
| 25 to 34 Year Olds | 0 (0.0%) | 11 (100.0%) |
| 35 Years and over | 4 (25.0%) | 12 (75.0%) |
| Total | 316 (75.1%) | 105 (24.9%) |
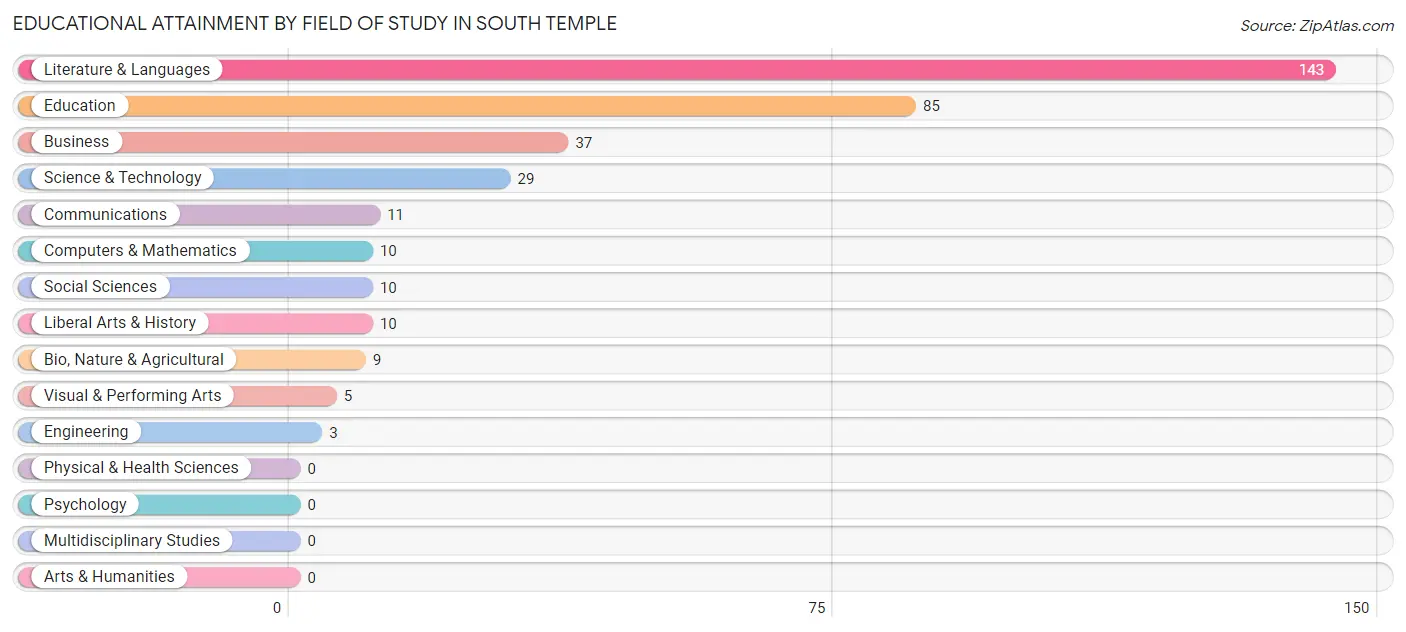
Educational Attainment by Field of Study in South Temple
Literature & languages (143 | 40.6%), education (85 | 24.1%), business (37 | 10.5%), science & technology (29 | 8.2%), and communications (11 | 3.1%) are the most common fields of study among 352 individuals in South Temple who have obtained a bachelor's degree or higher.
| Field of Study | # Graduates | % Graduates |
| Computers & Mathematics | 10 | 2.8% |
| Bio, Nature & Agricultural | 9 | 2.6% |
| Physical & Health Sciences | 0 | 0.0% |
| Psychology | 0 | 0.0% |
| Social Sciences | 10 | 2.8% |
| Engineering | 3 | 0.9% |
| Multidisciplinary Studies | 0 | 0.0% |
| Science & Technology | 29 | 8.2% |
| Business | 37 | 10.5% |
| Education | 85 | 24.1% |
| Literature & Languages | 143 | 40.6% |
| Liberal Arts & History | 10 | 2.8% |
| Visual & Performing Arts | 5 | 1.4% |
| Communications | 11 | 3.1% |
| Arts & Humanities | 0 | 0.0% |
| Total | 352 | 100.0% |
Transportation & Commute in South Temple
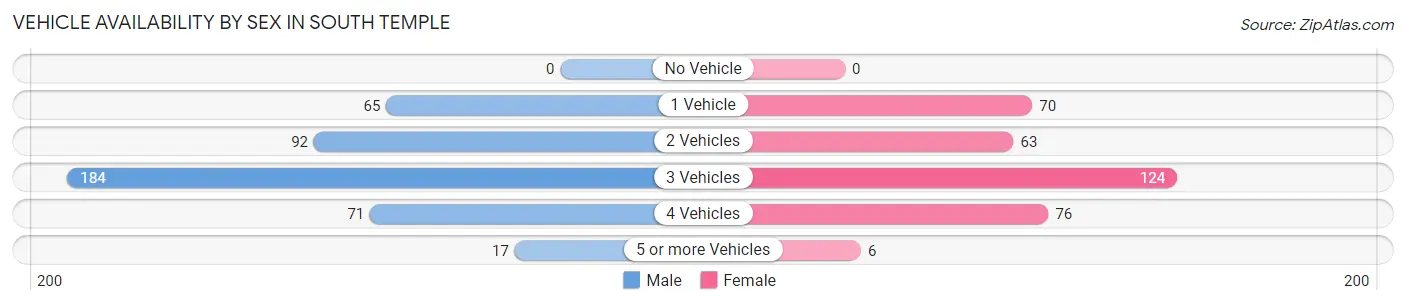
Vehicle Availability by Sex in South Temple
The most prevalent vehicle ownership categories in South Temple are males with 3 vehicles (184, accounting for 42.9%) and females with 3 vehicles (124, making up 54.3%).
| Vehicles Available | Male | Female |
| No Vehicle | 0 (0.0%) | 0 (0.0%) |
| 1 Vehicle | 65 (15.1%) | 70 (20.6%) |
| 2 Vehicles | 92 (21.4%) | 63 (18.6%) |
| 3 Vehicles | 184 (42.9%) | 124 (36.6%) |
| 4 Vehicles | 71 (16.6%) | 76 (22.4%) |
| 5 or more Vehicles | 17 (4.0%) | 6 (1.8%) |
| Total | 429 (100.0%) | 339 (100.0%) |
Commute Time in South Temple
The most frequently occuring commute durations in South Temple are 5 to 9 minutes (148 commuters, 19.6%), 20 to 24 minutes (133 commuters, 17.6%), and 15 to 19 minutes (114 commuters, 15.1%).
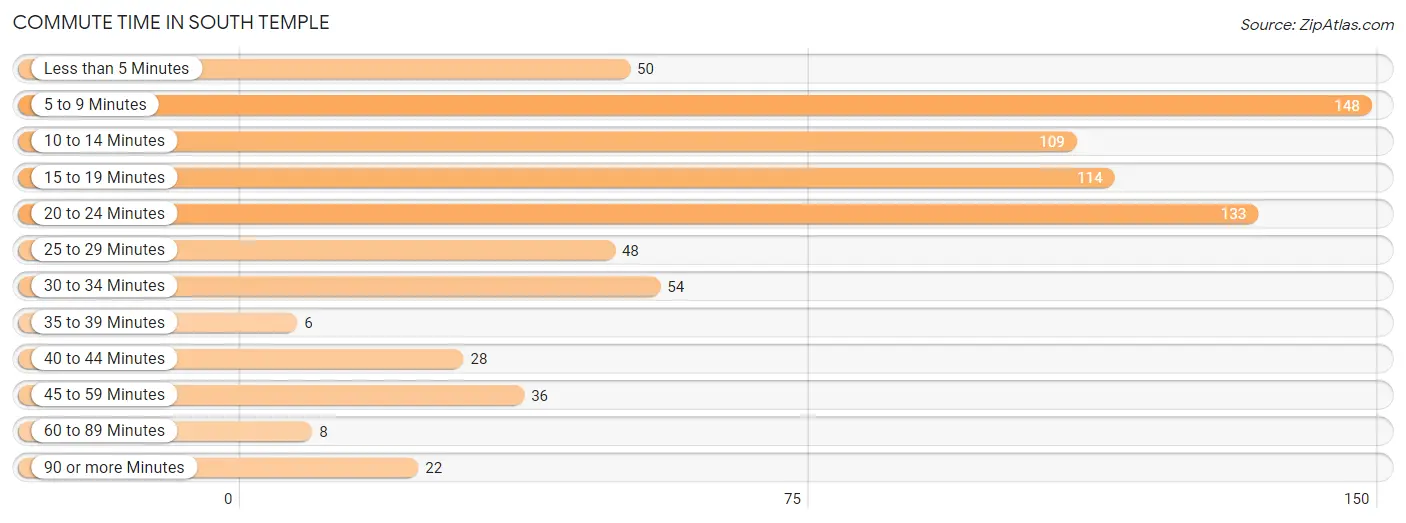
| Commute Time | # Commuters | % Commuters |
| Less than 5 Minutes | 50 | 6.6% |
| 5 to 9 Minutes | 148 | 19.6% |
| 10 to 14 Minutes | 109 | 14.4% |
| 15 to 19 Minutes | 114 | 15.1% |
| 20 to 24 Minutes | 133 | 17.6% |
| 25 to 29 Minutes | 48 | 6.4% |
| 30 to 34 Minutes | 54 | 7.1% |
| 35 to 39 Minutes | 6 | 0.8% |
| 40 to 44 Minutes | 28 | 3.7% |
| 45 to 59 Minutes | 36 | 4.8% |
| 60 to 89 Minutes | 8 | 1.1% |
| 90 or more Minutes | 22 | 2.9% |
Commute Time by Sex in South Temple
The most common commute times in South Temple are 20 to 24 minutes (111 commuters, 25.9%) for males and 5 to 9 minutes (92 commuters, 28.1%) for females.
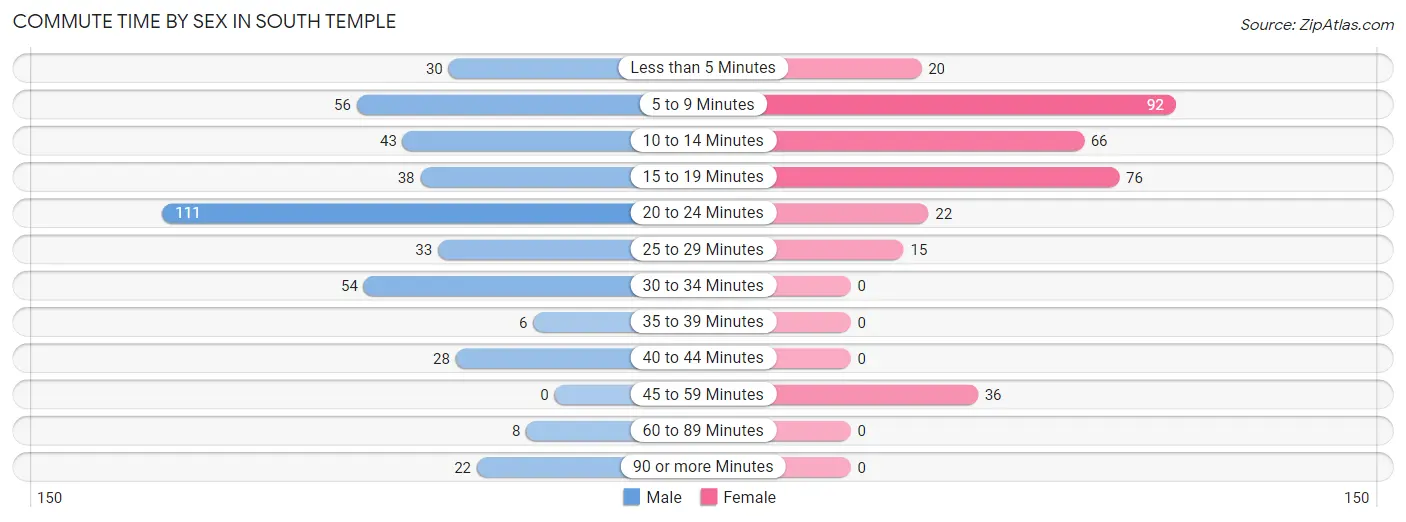
| Commute Time | Male | Female |
| Less than 5 Minutes | 30 (7.0%) | 20 (6.1%) |
| 5 to 9 Minutes | 56 (13.1%) | 92 (28.1%) |
| 10 to 14 Minutes | 43 (10.0%) | 66 (20.2%) |
| 15 to 19 Minutes | 38 (8.9%) | 76 (23.2%) |
| 20 to 24 Minutes | 111 (25.9%) | 22 (6.7%) |
| 25 to 29 Minutes | 33 (7.7%) | 15 (4.6%) |
| 30 to 34 Minutes | 54 (12.6%) | 0 (0.0%) |
| 35 to 39 Minutes | 6 (1.4%) | 0 (0.0%) |
| 40 to 44 Minutes | 28 (6.5%) | 0 (0.0%) |
| 45 to 59 Minutes | 0 (0.0%) | 36 (11.0%) |
| 60 to 89 Minutes | 8 (1.9%) | 0 (0.0%) |
| 90 or more Minutes | 22 (5.1%) | 0 (0.0%) |
Time of Departure to Work by Sex in South Temple
The most frequent times of departure to work in South Temple are 4:00 PM to 11:59 PM (108, 25.2%) for males and 7:30 AM to 7:59 AM (47, 14.4%) for females.
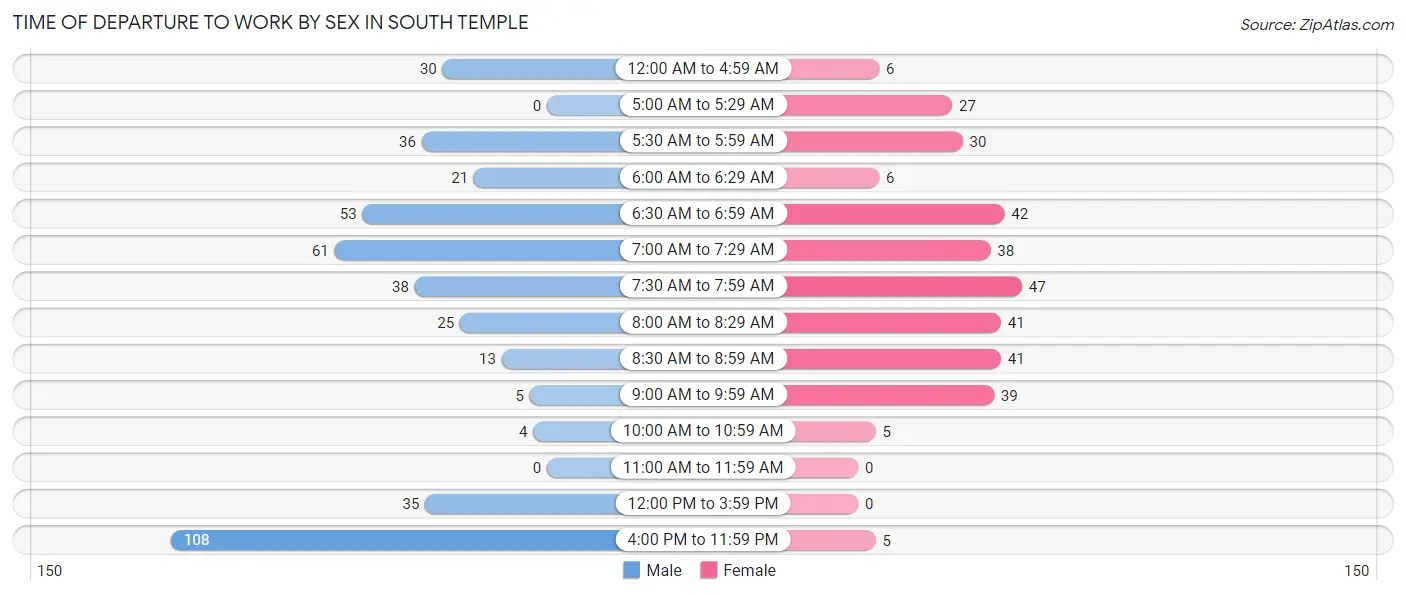
| Time of Departure | Male | Female |
| 12:00 AM to 4:59 AM | 30 (7.0%) | 6 (1.8%) |
| 5:00 AM to 5:29 AM | 0 (0.0%) | 27 (8.3%) |
| 5:30 AM to 5:59 AM | 36 (8.4%) | 30 (9.2%) |
| 6:00 AM to 6:29 AM | 21 (4.9%) | 6 (1.8%) |
| 6:30 AM to 6:59 AM | 53 (12.3%) | 42 (12.8%) |
| 7:00 AM to 7:29 AM | 61 (14.2%) | 38 (11.6%) |
| 7:30 AM to 7:59 AM | 38 (8.9%) | 47 (14.4%) |
| 8:00 AM to 8:29 AM | 25 (5.8%) | 41 (12.5%) |
| 8:30 AM to 8:59 AM | 13 (3.0%) | 41 (12.5%) |
| 9:00 AM to 9:59 AM | 5 (1.2%) | 39 (11.9%) |
| 10:00 AM to 10:59 AM | 4 (0.9%) | 5 (1.5%) |
| 11:00 AM to 11:59 AM | 0 (0.0%) | 0 (0.0%) |
| 12:00 PM to 3:59 PM | 35 (8.2%) | 0 (0.0%) |
| 4:00 PM to 11:59 PM | 108 (25.2%) | 5 (1.5%) |
| Total | 429 (100.0%) | 327 (100.0%) |
Housing Occupancy in South Temple
Occupancy by Ownership in South Temple
Of the total 752 dwellings in South Temple, owner-occupied units account for 719 (95.6%), while renter-occupied units make up 33 (4.4%).
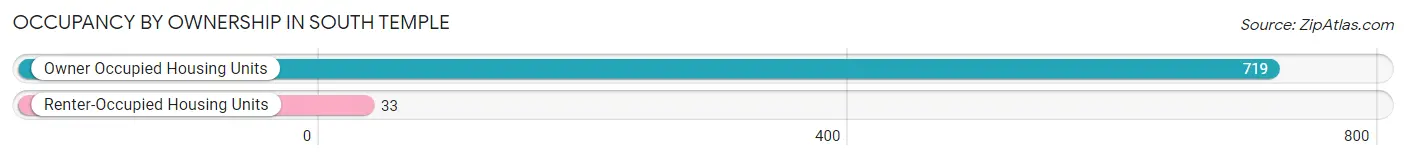
| Occupancy | # Housing Units | % Housing Units |
| Owner Occupied Housing Units | 719 | 95.6% |
| Renter-Occupied Housing Units | 33 | 4.4% |
| Total Occupied Housing Units | 752 | 100.0% |
Occupancy by Household Size in South Temple
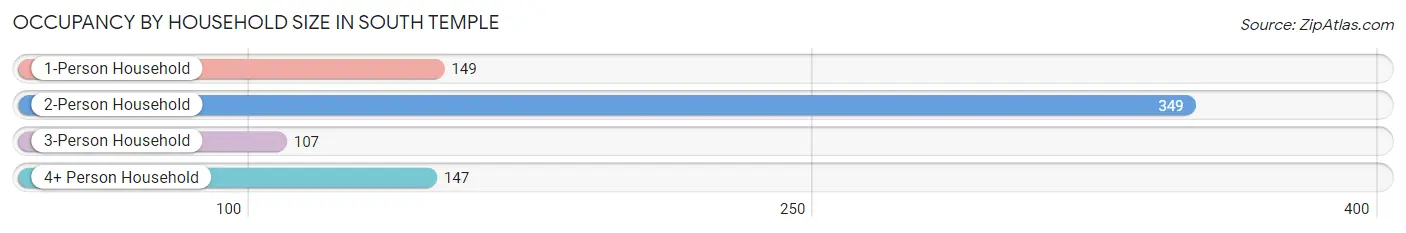
| Household Size | # Housing Units | % Housing Units |
| 1-Person Household | 149 | 19.8% |
| 2-Person Household | 349 | 46.4% |
| 3-Person Household | 107 | 14.2% |
| 4+ Person Household | 147 | 19.6% |
| Total Housing Units | 752 | 100.0% |
Occupancy by Ownership by Household Size in South Temple
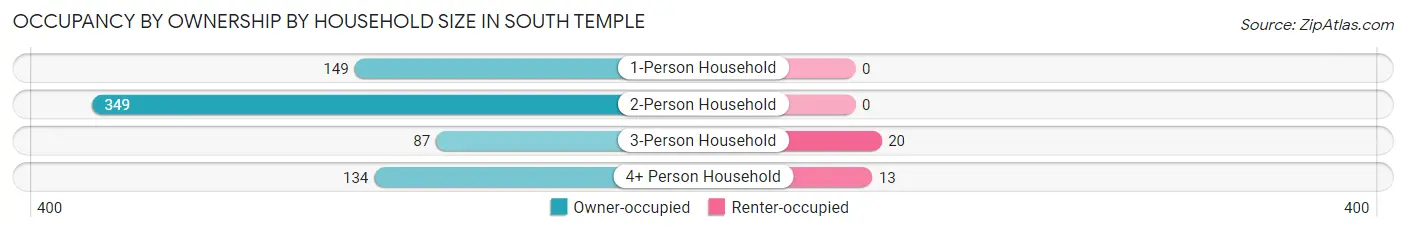
| Household Size | Owner-occupied | Renter-occupied |
| 1-Person Household | 149 (100.0%) | 0 (0.0%) |
| 2-Person Household | 349 (100.0%) | 0 (0.0%) |
| 3-Person Household | 87 (81.3%) | 20 (18.7%) |
| 4+ Person Household | 134 (91.2%) | 13 (8.8%) |
| Total Housing Units | 719 (95.6%) | 33 (4.4%) |
Occupancy by Educational Attainment in South Temple
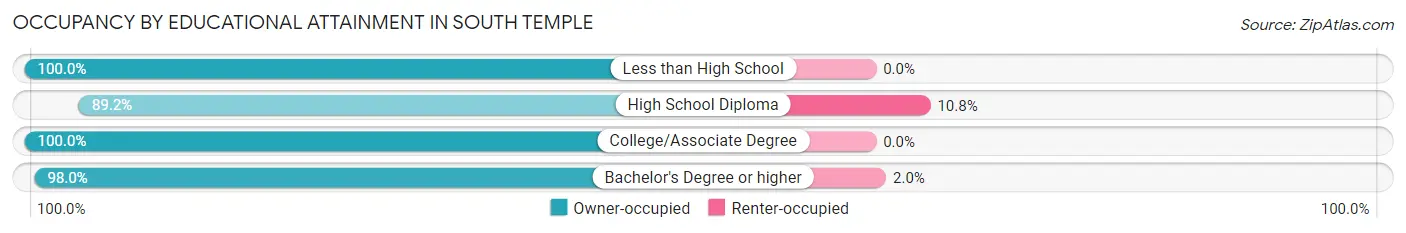
| Household Size | Owner-occupied | Renter-occupied |
| Less than High School | 41 (100.0%) | 0 (0.0%) |
| High School Diploma | 232 (89.2%) | 28 (10.8%) |
| College/Associate Degree | 196 (100.0%) | 0 (0.0%) |
| Bachelor's Degree or higher | 250 (98.0%) | 5 (2.0%) |
Occupancy by Age of Householder in South Temple
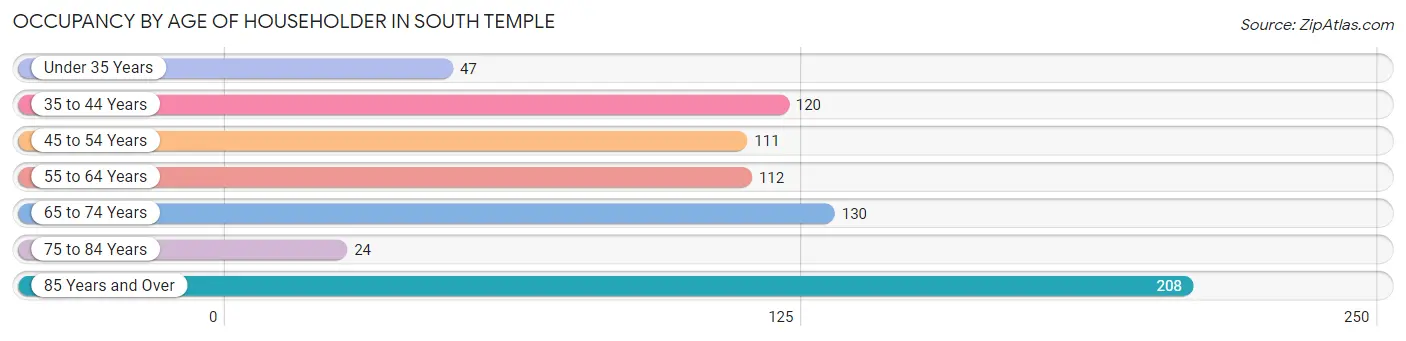
| Age Bracket | # Households | % Households |
| Under 35 Years | 47 | 6.2% |
| 35 to 44 Years | 120 | 16.0% |
| 45 to 54 Years | 111 | 14.8% |
| 55 to 64 Years | 112 | 14.9% |
| 65 to 74 Years | 130 | 17.3% |
| 75 to 84 Years | 24 | 3.2% |
| 85 Years and Over | 208 | 27.7% |
| Total | 752 | 100.0% |
Housing Finances in South Temple
Median Income by Occupancy in South Temple
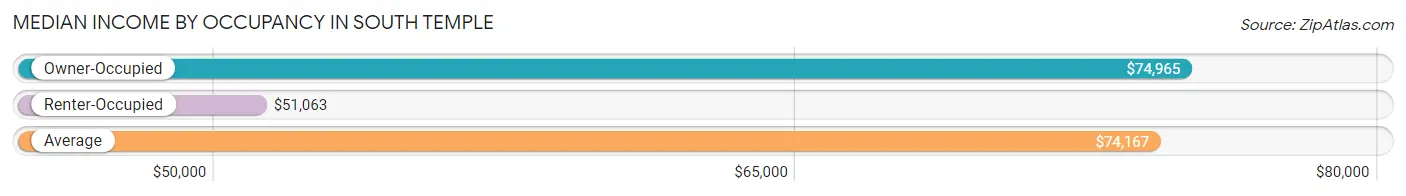
| Occupancy Type | # Households | Median Income |
| Owner-Occupied | 719 (95.6%) | $74,965 |
| Renter-Occupied | 33 (4.4%) | $51,063 |
| Average | 752 (100.0%) | $74,167 |
Occupancy by Householder Income Bracket in South Temple
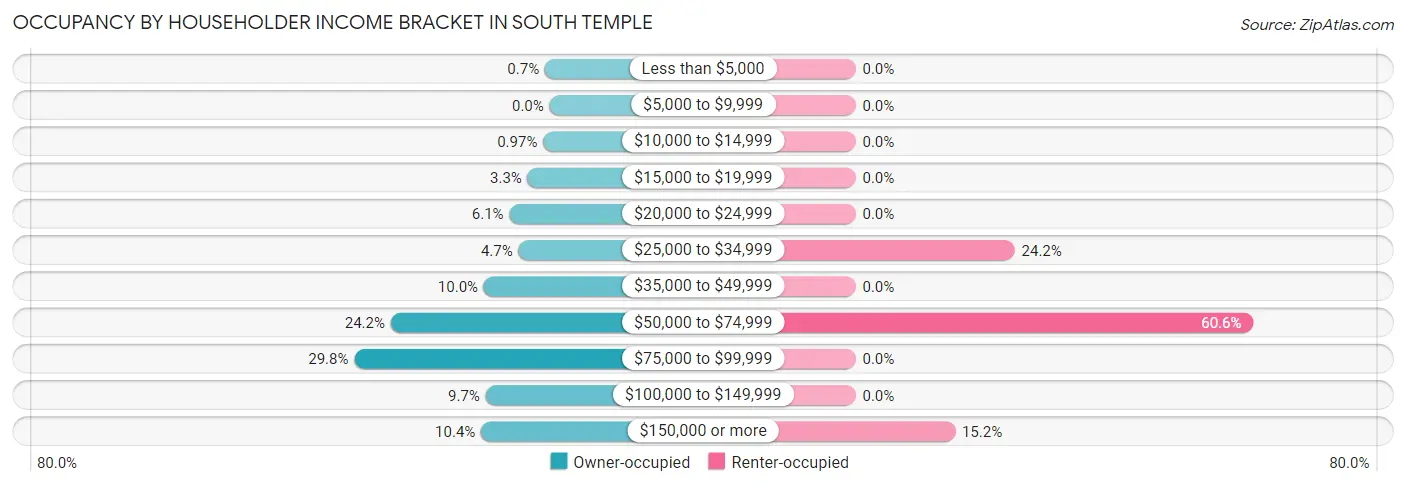
| Income Bracket | Owner-occupied | Renter-occupied |
| Less than $5,000 | 5 (0.7%) | 0 (0.0%) |
| $5,000 to $9,999 | 0 (0.0%) | 0 (0.0%) |
| $10,000 to $14,999 | 7 (1.0%) | 0 (0.0%) |
| $15,000 to $19,999 | 24 (3.3%) | 0 (0.0%) |
| $20,000 to $24,999 | 44 (6.1%) | 0 (0.0%) |
| $25,000 to $34,999 | 34 (4.7%) | 8 (24.2%) |
| $35,000 to $49,999 | 72 (10.0%) | 0 (0.0%) |
| $50,000 to $74,999 | 174 (24.2%) | 20 (60.6%) |
| $75,000 to $99,999 | 214 (29.8%) | 0 (0.0%) |
| $100,000 to $149,999 | 70 (9.7%) | 0 (0.0%) |
| $150,000 or more | 75 (10.4%) | 5 (15.1%) |
| Total | 719 (100.0%) | 33 (100.0%) |
Monthly Housing Cost Tiers in South Temple
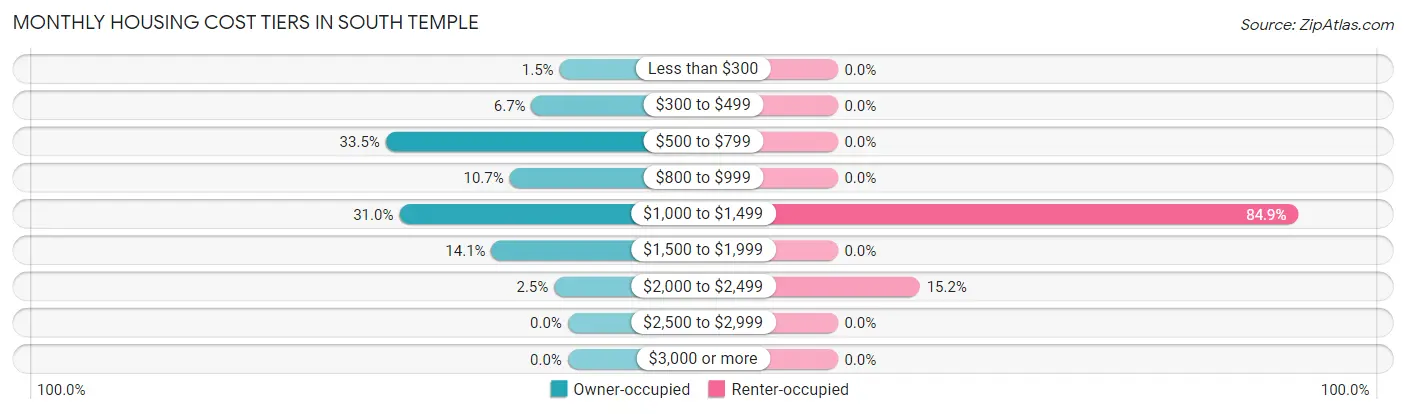
| Monthly Cost | Owner-occupied | Renter-occupied |
| Less than $300 | 11 (1.5%) | 0 (0.0%) |
| $300 to $499 | 48 (6.7%) | 0 (0.0%) |
| $500 to $799 | 241 (33.5%) | 0 (0.0%) |
| $800 to $999 | 77 (10.7%) | 0 (0.0%) |
| $1,000 to $1,499 | 223 (31.0%) | 28 (84.9%) |
| $1,500 to $1,999 | 101 (14.1%) | 0 (0.0%) |
| $2,000 to $2,499 | 18 (2.5%) | 5 (15.1%) |
| $2,500 to $2,999 | 0 (0.0%) | 0 (0.0%) |
| $3,000 or more | 0 (0.0%) | 0 (0.0%) |
| Total | 719 (100.0%) | 33 (100.0%) |
Physical Housing Characteristics in South Temple
Housing Structures in South Temple
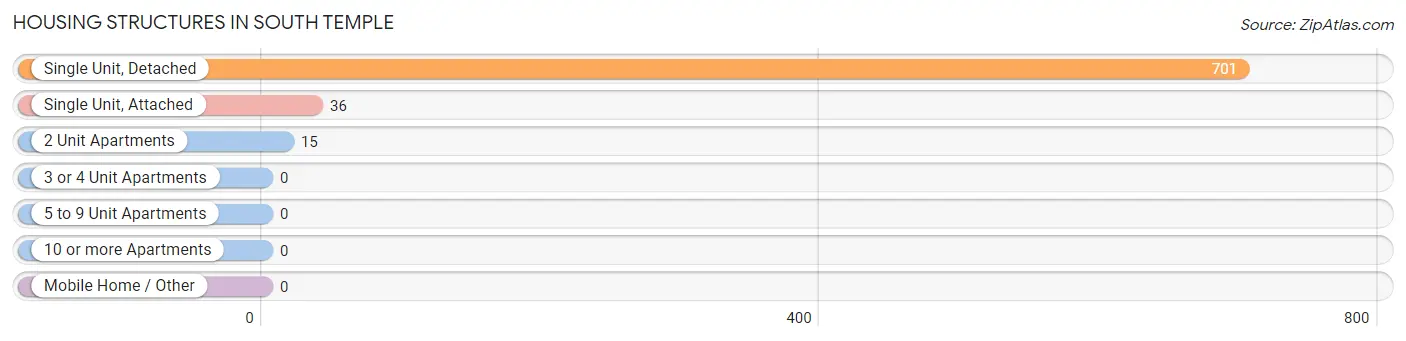
| Structure Type | # Housing Units | % Housing Units |
| Single Unit, Detached | 701 | 93.2% |
| Single Unit, Attached | 36 | 4.8% |
| 2 Unit Apartments | 15 | 2.0% |
| 3 or 4 Unit Apartments | 0 | 0.0% |
| 5 to 9 Unit Apartments | 0 | 0.0% |
| 10 or more Apartments | 0 | 0.0% |
| Mobile Home / Other | 0 | 0.0% |
| Total | 752 | 100.0% |
Housing Structures by Occupancy in South Temple
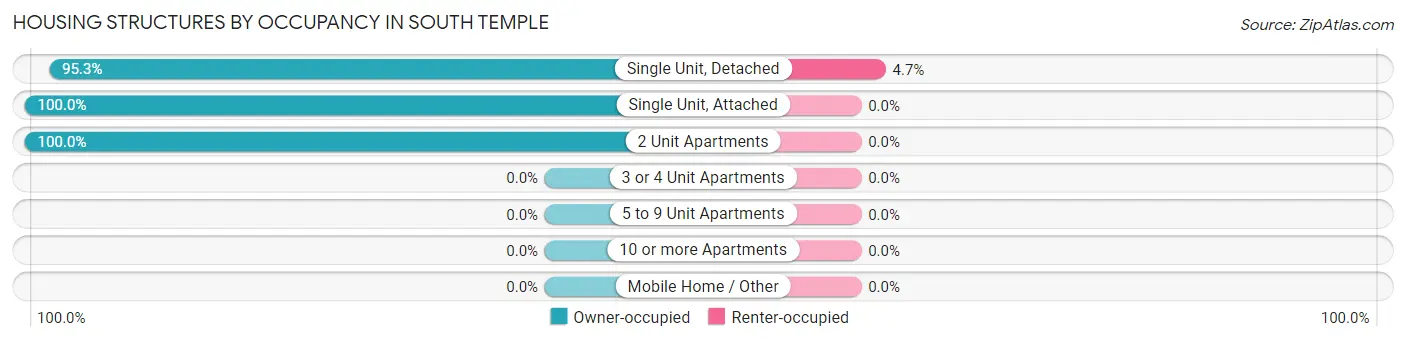
| Structure Type | Owner-occupied | Renter-occupied |
| Single Unit, Detached | 668 (95.3%) | 33 (4.7%) |
| Single Unit, Attached | 36 (100.0%) | 0 (0.0%) |
| 2 Unit Apartments | 15 (100.0%) | 0 (0.0%) |
| 3 or 4 Unit Apartments | 0 (0.0%) | 0 (0.0%) |
| 5 to 9 Unit Apartments | 0 (0.0%) | 0 (0.0%) |
| 10 or more Apartments | 0 (0.0%) | 0 (0.0%) |
| Mobile Home / Other | 0 (0.0%) | 0 (0.0%) |
| Total | 719 (95.6%) | 33 (4.4%) |
Housing Structures by Number of Rooms in South Temple
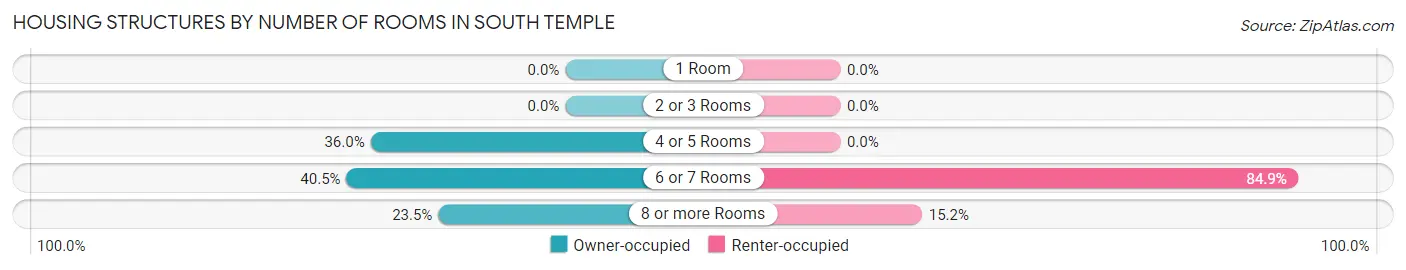
| Number of Rooms | Owner-occupied | Renter-occupied |
| 1 Room | 0 (0.0%) | 0 (0.0%) |
| 2 or 3 Rooms | 0 (0.0%) | 0 (0.0%) |
| 4 or 5 Rooms | 259 (36.0%) | 0 (0.0%) |
| 6 or 7 Rooms | 291 (40.5%) | 28 (84.9%) |
| 8 or more Rooms | 169 (23.5%) | 5 (15.1%) |
| Total | 719 (100.0%) | 33 (100.0%) |
Housing Structure by Heating Type in South Temple
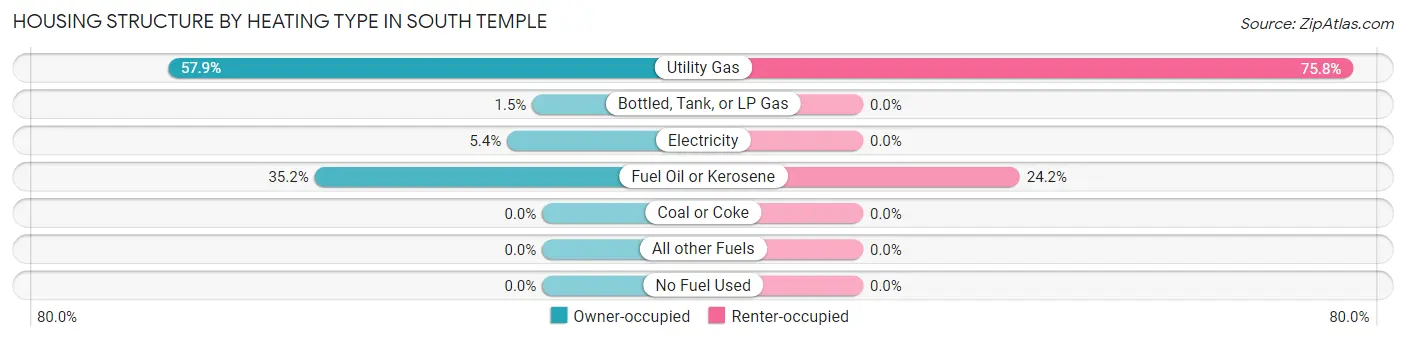
| Heating Type | Owner-occupied | Renter-occupied |
| Utility Gas | 416 (57.9%) | 25 (75.8%) |
| Bottled, Tank, or LP Gas | 11 (1.5%) | 0 (0.0%) |
| Electricity | 39 (5.4%) | 0 (0.0%) |
| Fuel Oil or Kerosene | 253 (35.2%) | 8 (24.2%) |
| Coal or Coke | 0 (0.0%) | 0 (0.0%) |
| All other Fuels | 0 (0.0%) | 0 (0.0%) |
| No Fuel Used | 0 (0.0%) | 0 (0.0%) |
| Total | 719 (100.0%) | 33 (100.0%) |
Household Vehicle Usage in South Temple
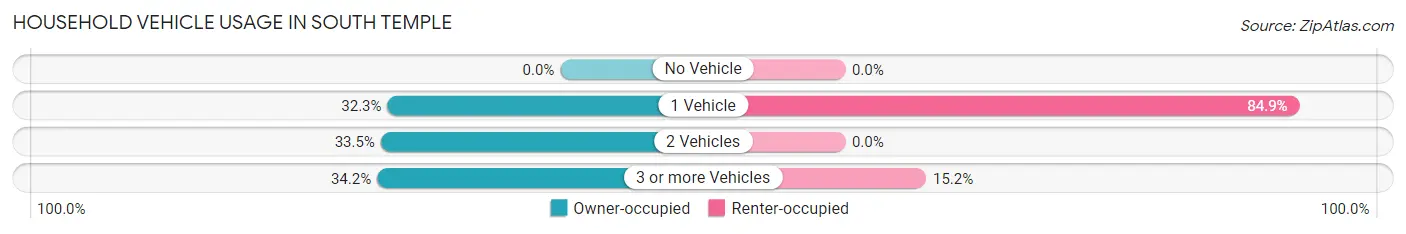
| Vehicles per Household | Owner-occupied | Renter-occupied |
| No Vehicle | 0 (0.0%) | 0 (0.0%) |
| 1 Vehicle | 232 (32.3%) | 28 (84.9%) |
| 2 Vehicles | 241 (33.5%) | 0 (0.0%) |
| 3 or more Vehicles | 246 (34.2%) | 5 (15.1%) |
| Total | 719 (100.0%) | 33 (100.0%) |
Real Estate & Mortgages in South Temple
Real Estate and Mortgage Overview in South Temple
| Characteristic | Without Mortgage | With Mortgage |
| Housing Units | 227 | 492 |
| Median Property Value | $186,100 | $165,700 |
| Median Household Income | $60,625 | $11 |
| Monthly Housing Costs | $592 | $0 |
| Real Estate Taxes | $3,638 | $0 |
Property Value by Mortgage Status in South Temple
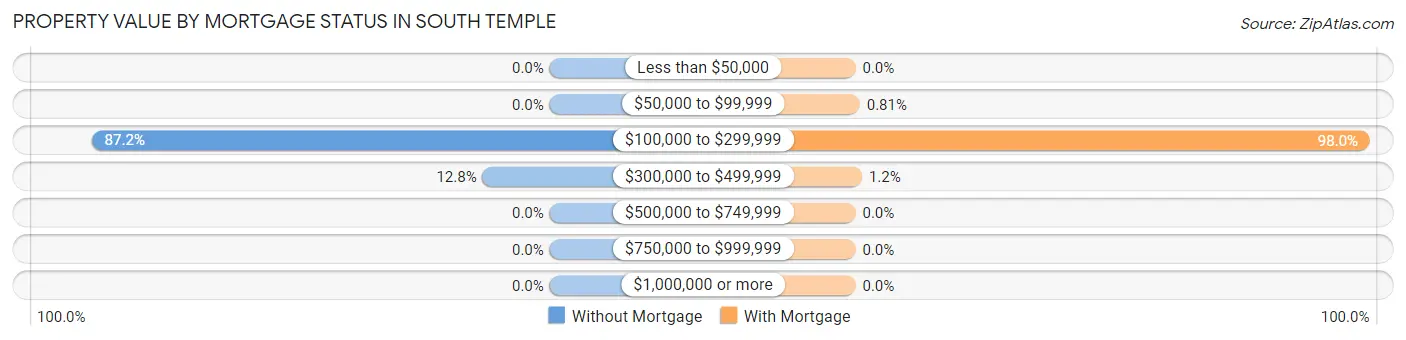
| Property Value | Without Mortgage | With Mortgage |
| Less than $50,000 | 0 (0.0%) | 0 (0.0%) |
| $50,000 to $99,999 | 0 (0.0%) | 4 (0.8%) |
| $100,000 to $299,999 | 198 (87.2%) | 482 (98.0%) |
| $300,000 to $499,999 | 29 (12.8%) | 6 (1.2%) |
| $500,000 to $749,999 | 0 (0.0%) | 0 (0.0%) |
| $750,000 to $999,999 | 0 (0.0%) | 0 (0.0%) |
| $1,000,000 or more | 0 (0.0%) | 0 (0.0%) |
| Total | 227 (100.0%) | 492 (100.0%) |
Household Income by Mortgage Status in South Temple
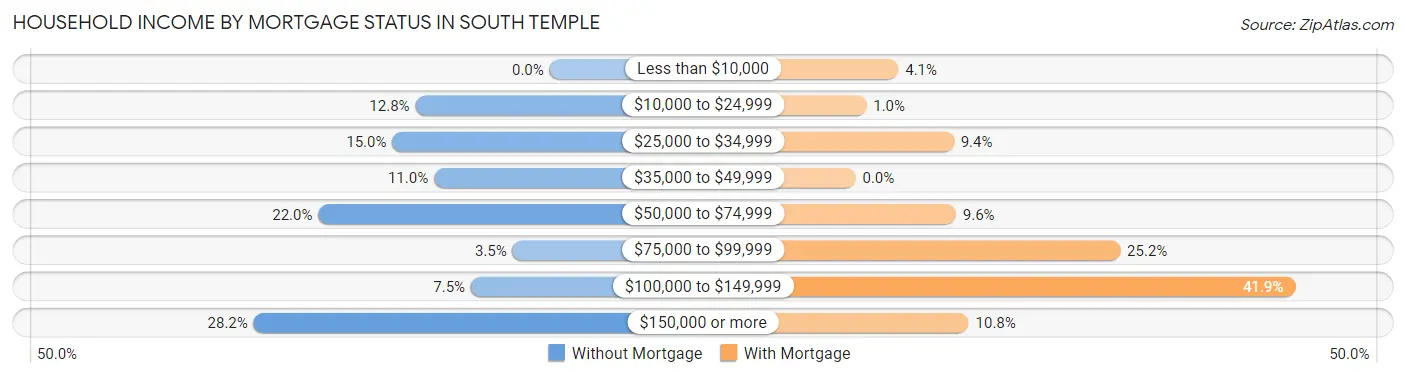
| Household Income | Without Mortgage | With Mortgage |
| Less than $10,000 | 0 (0.0%) | 20 (4.1%) |
| $10,000 to $24,999 | 29 (12.8%) | 5 (1.0%) |
| $25,000 to $34,999 | 34 (15.0%) | 46 (9.3%) |
| $35,000 to $49,999 | 25 (11.0%) | 0 (0.0%) |
| $50,000 to $74,999 | 50 (22.0%) | 47 (9.6%) |
| $75,000 to $99,999 | 8 (3.5%) | 124 (25.2%) |
| $100,000 to $149,999 | 17 (7.5%) | 206 (41.9%) |
| $150,000 or more | 64 (28.2%) | 53 (10.8%) |
| Total | 227 (100.0%) | 492 (100.0%) |
Property Value to Household Income Ratio in South Temple
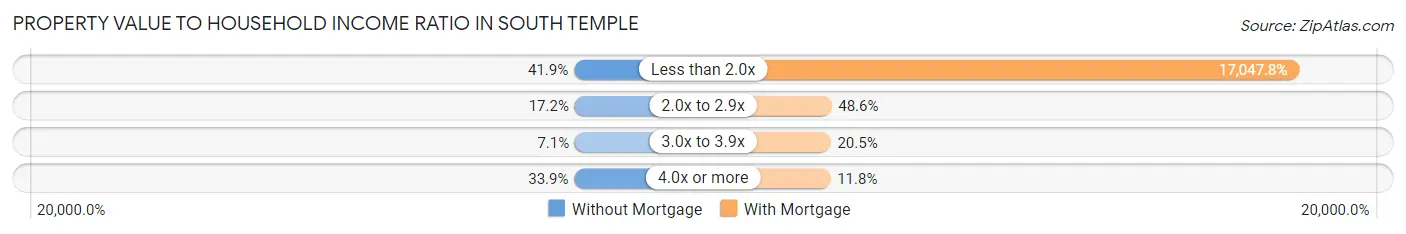
| Value-to-Income Ratio | Without Mortgage | With Mortgage |
| Less than 2.0x | 95 (41.8%) | 83,875 (17,047.8%) |
| 2.0x to 2.9x | 39 (17.2%) | 239 (48.6%) |
| 3.0x to 3.9x | 16 (7.0%) | 101 (20.5%) |
| 4.0x or more | 77 (33.9%) | 58 (11.8%) |
| Total | 227 (100.0%) | 492 (100.0%) |
Real Estate Taxes by Mortgage Status in South Temple
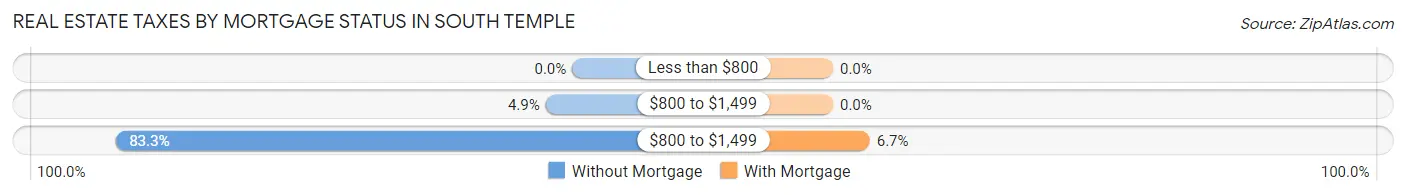
| Property Taxes | Without Mortgage | With Mortgage |
| Less than $800 | 0 (0.0%) | 0 (0.0%) |
| $800 to $1,499 | 11 (4.9%) | 0 (0.0%) |
| $800 to $1,499 | 189 (83.3%) | 33 (6.7%) |
| Total | 227 (100.0%) | 492 (100.0%) |
Health & Disability in South Temple
Health Insurance Coverage by Age in South Temple
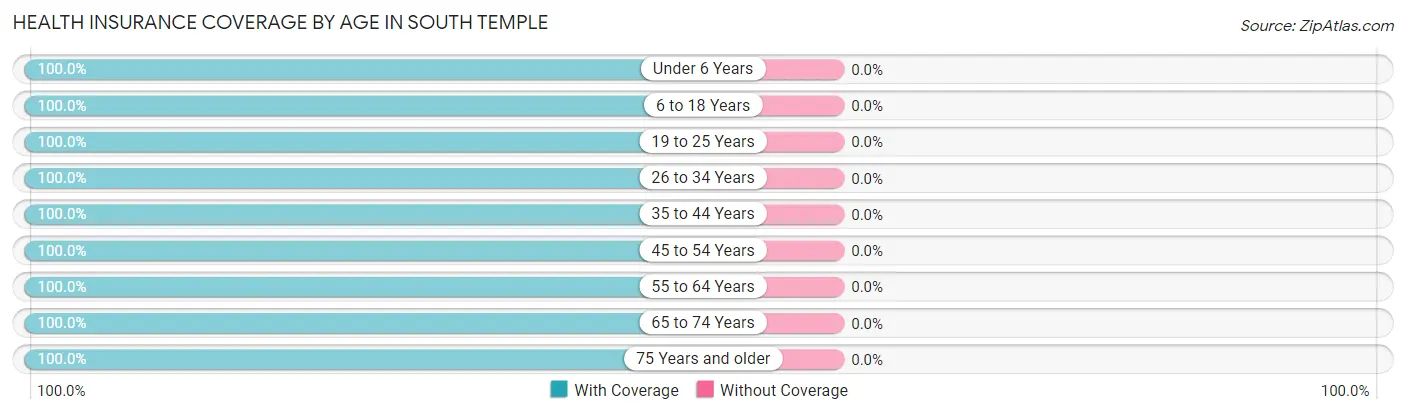
| Age Bracket | With Coverage | Without Coverage |
| Under 6 Years | 98 (100.0%) | 0 (0.0%) |
| 6 to 18 Years | 321 (100.0%) | 0 (0.0%) |
| 19 to 25 Years | 151 (100.0%) | 0 (0.0%) |
| 26 to 34 Years | 101 (100.0%) | 0 (0.0%) |
| 35 to 44 Years | 233 (100.0%) | 0 (0.0%) |
| 45 to 54 Years | 170 (100.0%) | 0 (0.0%) |
| 55 to 64 Years | 242 (100.0%) | 0 (0.0%) |
| 65 to 74 Years | 227 (100.0%) | 0 (0.0%) |
| 75 Years and older | 331 (100.0%) | 0 (0.0%) |
| Total | 1,874 (100.0%) | 0 (0.0%) |
Health Insurance Coverage by Citizenship Status in South Temple
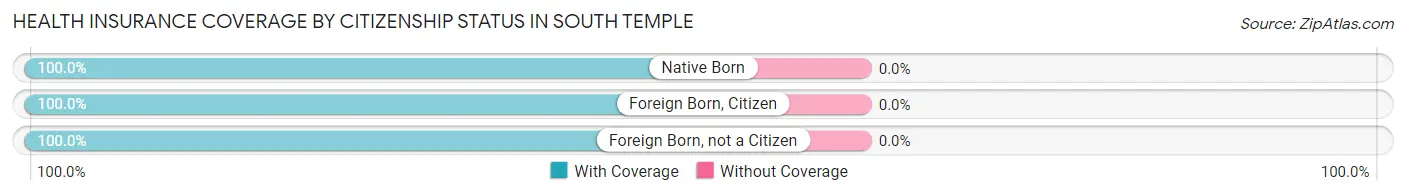
| Citizenship Status | With Coverage | Without Coverage |
| Native Born | 98 (100.0%) | 0 (0.0%) |
| Foreign Born, Citizen | 321 (100.0%) | 0 (0.0%) |
| Foreign Born, not a Citizen | 151 (100.0%) | 0 (0.0%) |
Health Insurance Coverage by Household Income in South Temple
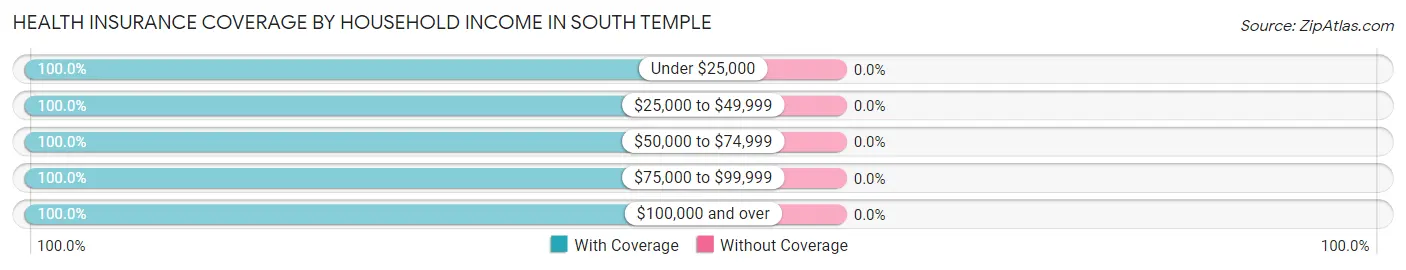
| Household Income | With Coverage | Without Coverage |
| Under $25,000 | 99 (100.0%) | 0 (0.0%) |
| $25,000 to $49,999 | 267 (100.0%) | 0 (0.0%) |
| $50,000 to $74,999 | 468 (100.0%) | 0 (0.0%) |
| $75,000 to $99,999 | 357 (100.0%) | 0 (0.0%) |
| $100,000 and over | 683 (100.0%) | 0 (0.0%) |
Public vs Private Health Insurance Coverage by Age in South Temple
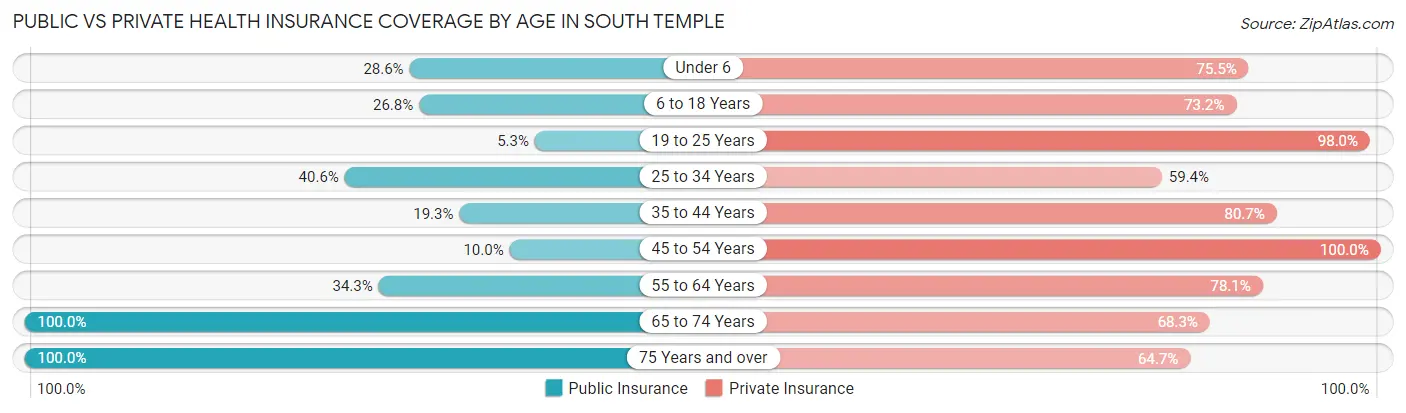
| Age Bracket | Public Insurance | Private Insurance |
| Under 6 | 28 (28.6%) | 74 (75.5%) |
| 6 to 18 Years | 86 (26.8%) | 235 (73.2%) |
| 19 to 25 Years | 8 (5.3%) | 148 (98.0%) |
| 25 to 34 Years | 41 (40.6%) | 60 (59.4%) |
| 35 to 44 Years | 45 (19.3%) | 188 (80.7%) |
| 45 to 54 Years | 17 (10.0%) | 170 (100.0%) |
| 55 to 64 Years | 83 (34.3%) | 189 (78.1%) |
| 65 to 74 Years | 227 (100.0%) | 155 (68.3%) |
| 75 Years and over | 331 (100.0%) | 214 (64.6%) |
| Total | 866 (46.2%) | 1,433 (76.5%) |
Disability Status by Sex by Age in South Temple
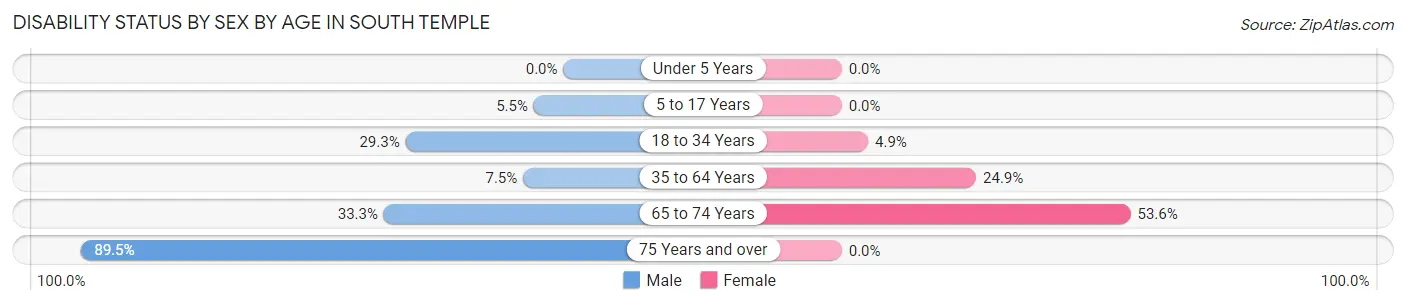
| Age Bracket | Male | Female |
| Under 5 Years | 0 (0.0%) | 0 (0.0%) |
| 5 to 17 Years | 8 (5.5%) | 0 (0.0%) |
| 18 to 34 Years | 46 (29.3%) | 6 (4.9%) |
| 35 to 64 Years | 23 (7.5%) | 84 (24.9%) |
| 65 to 74 Years | 34 (33.3%) | 67 (53.6%) |
| 75 Years and over | 34 (89.5%) | 0 (0.0%) |
Disability Class by Sex by Age in South Temple
Disability Class: Hearing Difficulty
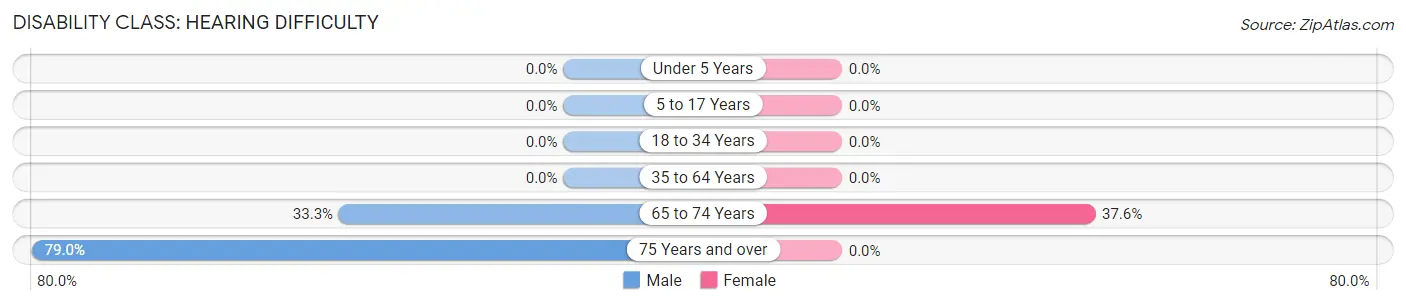
| Age Bracket | Male | Female |
| Under 5 Years | 0 (0.0%) | 0 (0.0%) |
| 5 to 17 Years | 0 (0.0%) | 0 (0.0%) |
| 18 to 34 Years | 0 (0.0%) | 0 (0.0%) |
| 35 to 64 Years | 0 (0.0%) | 0 (0.0%) |
| 65 to 74 Years | 34 (33.3%) | 47 (37.6%) |
| 75 Years and over | 30 (78.9%) | 0 (0.0%) |
Disability Class: Vision Difficulty
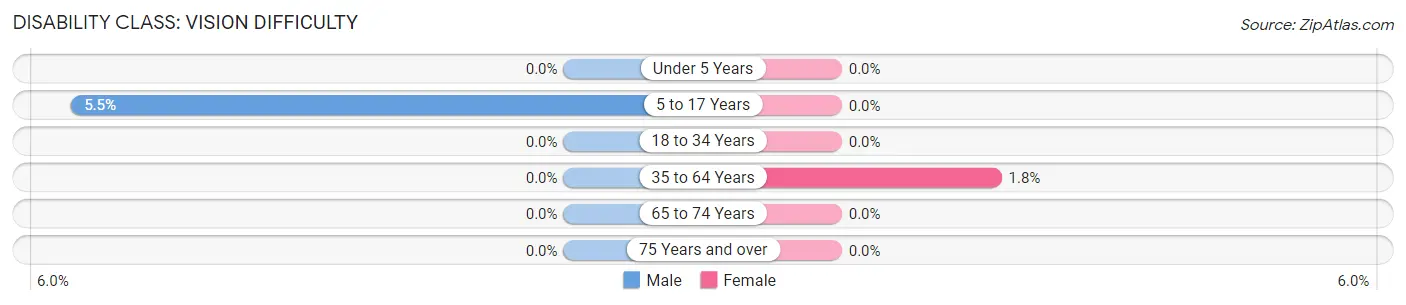
| Age Bracket | Male | Female |
| Under 5 Years | 0 (0.0%) | 0 (0.0%) |
| 5 to 17 Years | 8 (5.5%) | 0 (0.0%) |
| 18 to 34 Years | 0 (0.0%) | 0 (0.0%) |
| 35 to 64 Years | 0 (0.0%) | 6 (1.8%) |
| 65 to 74 Years | 0 (0.0%) | 0 (0.0%) |
| 75 Years and over | 0 (0.0%) | 0 (0.0%) |
Disability Class: Cognitive Difficulty
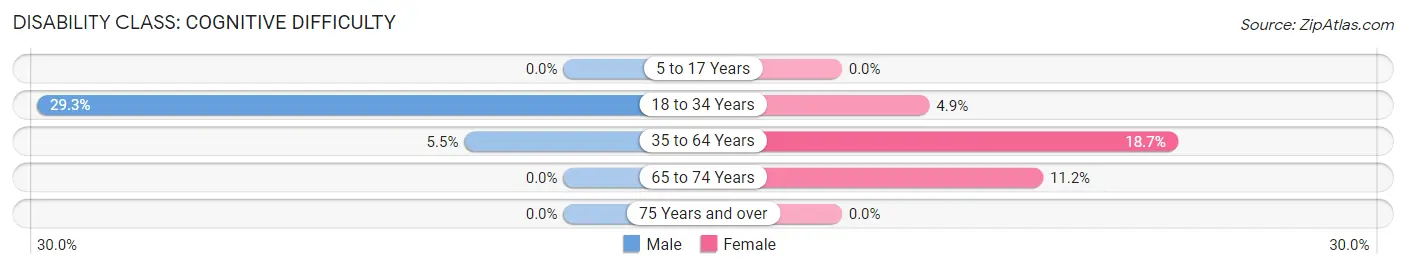
| Age Bracket | Male | Female |
| 5 to 17 Years | 0 (0.0%) | 0 (0.0%) |
| 18 to 34 Years | 46 (29.3%) | 6 (4.9%) |
| 35 to 64 Years | 17 (5.5%) | 63 (18.7%) |
| 65 to 74 Years | 0 (0.0%) | 14 (11.2%) |
| 75 Years and over | 0 (0.0%) | 0 (0.0%) |
Disability Class: Ambulatory Difficulty
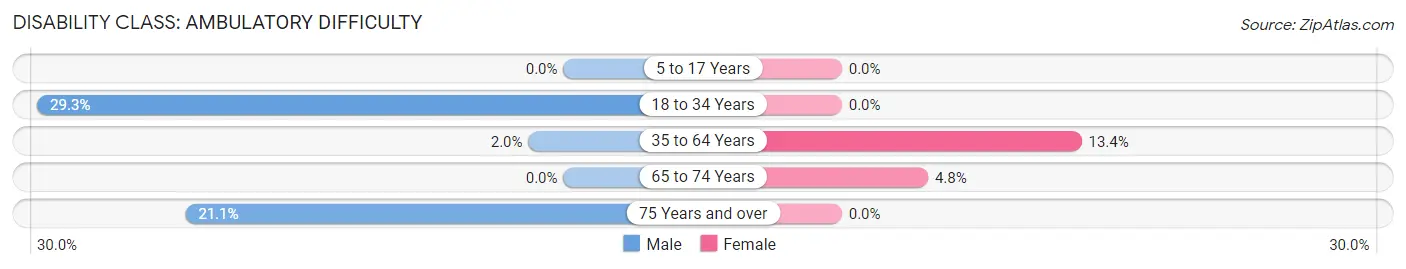
| Age Bracket | Male | Female |
| 5 to 17 Years | 0 (0.0%) | 0 (0.0%) |
| 18 to 34 Years | 46 (29.3%) | 0 (0.0%) |
| 35 to 64 Years | 6 (1.9%) | 45 (13.4%) |
| 65 to 74 Years | 0 (0.0%) | 6 (4.8%) |
| 75 Years and over | 8 (21.0%) | 0 (0.0%) |
Disability Class: Self-Care Difficulty
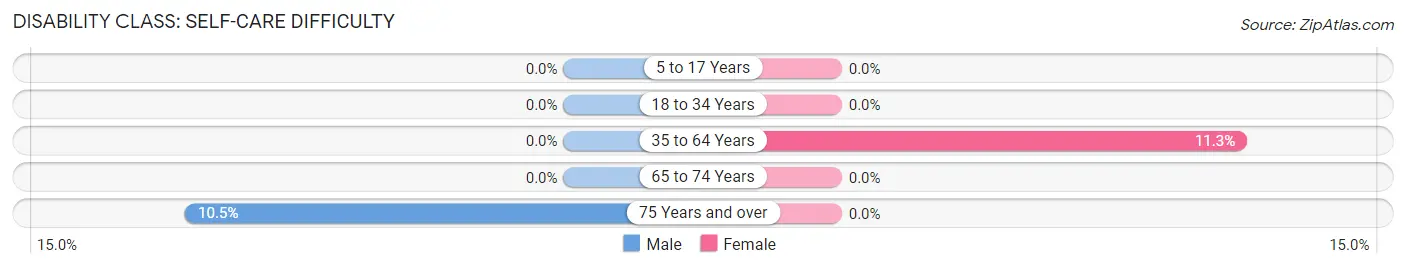
| Age Bracket | Male | Female |
| 5 to 17 Years | 0 (0.0%) | 0 (0.0%) |
| 18 to 34 Years | 0 (0.0%) | 0 (0.0%) |
| 35 to 64 Years | 0 (0.0%) | 38 (11.3%) |
| 65 to 74 Years | 0 (0.0%) | 0 (0.0%) |
| 75 Years and over | 4 (10.5%) | 0 (0.0%) |
Technology Access in South Temple
Computing Device Access in South Temple
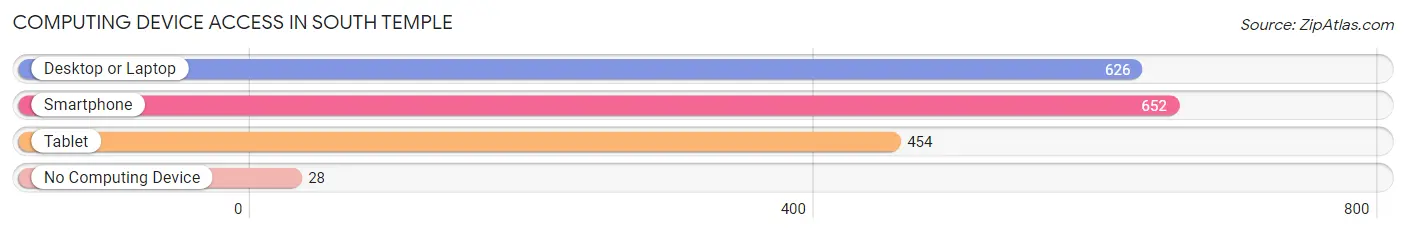
| Device Type | # Households | % Households |
| Desktop or Laptop | 626 | 83.2% |
| Smartphone | 652 | 86.7% |
| Tablet | 454 | 60.4% |
| No Computing Device | 28 | 3.7% |
| Total | 752 | 100.0% |
Internet Access in South Temple
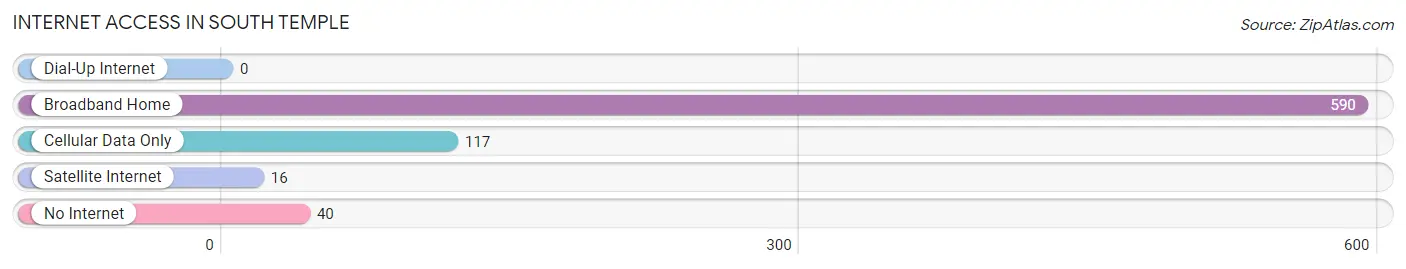
| Internet Type | # Households | % Households |
| Dial-Up Internet | 0 | 0.0% |
| Broadband Home | 590 | 78.5% |
| Cellular Data Only | 117 | 15.6% |
| Satellite Internet | 16 | 2.1% |
| No Internet | 40 | 5.3% |
| Total | 752 | 100.0% |
South Temple Summary
Temple, Pennsylvania is a borough located in Northampton County in the Lehigh Valley region of the state. It is situated in the Lehigh Valley region of Pennsylvania, approximately 10 miles north of Allentown and about 20 miles west of Easton. The borough is part of the Lehigh Valley metropolitan area, which is the third-largest metropolitan area in Pennsylvania.
History
The area that is now Temple was originally inhabited by the Lenape Native Americans. The first European settlers arrived in the area in the late 1700s, and the town was officially founded in 1845. The town was named after the Temple family, who were among the first settlers in the area.
The town was originally a farming community, but it began to grow in the late 1800s when the Lehigh Valley Railroad was built through the area. This allowed for the transportation of goods and people, and it helped to spur the growth of the town.
In the early 1900s, the town began to industrialize, and several factories were built in the area. This included a silk mill, a paper mill, and a brickyard. The town also became a popular tourist destination, as it was located near the Lehigh River and the Appalachian Trail.
Geography
Temple is located in Northampton County in the Lehigh Valley region of Pennsylvania. It is situated in the Lehigh Valley region of Pennsylvania, approximately 10 miles north of Allentown and about 20 miles west of Easton. The borough is part of the Lehigh Valley metropolitan area, which is the third-largest metropolitan area in Pennsylvania.
The borough is located in the Lehigh Valley region of Pennsylvania, which is known for its rolling hills and lush forests. The Lehigh River runs through the borough, and the Appalachian Trail passes through the area. The borough is also home to several parks, including the Lehigh Valley Zoo and the Lehigh Valley Heritage Museum.
Economy
The economy of Temple is largely based on manufacturing and tourism. The town is home to several factories, including a silk mill, a paper mill, and a brickyard. The town is also a popular tourist destination, as it is located near the Lehigh River and the Appalachian Trail.
The town is also home to several small businesses, including restaurants, shops, and other services. The town is also home to several educational institutions, including Northampton Community College and Lehigh Carbon Community College.
Demographics
As of the 2010 census, the population of Temple was 2,845. The racial makeup of the borough was 94.3% White, 1.3% African American, 0.2% Native American, 0.7% Asian, 0.1% Pacific Islander, 1.2% from other races, and 2.2% from two or more races. Hispanic or Latino of any race were 3.3% of the population.
The median household income in Temple was $45,938, and the median family income was $54,844. The per capita income for the borough was $21,945. About 8.3% of families and 10.2% of the population were below the poverty line, including 14.2% of those under age 18 and 6.2% of those age 65 or over.
Common Questions
What is Per Capita Income in South Temple?
Per Capita income in South Temple is $31,132.
What is the Median Family Income in South Temple?
Median Family Income in South Temple is $87,823.
What is the Median Household income in South Temple?
Median Household Income in South Temple is $74,167.
What is Income or Wage Gap in South Temple?
Income or Wage Gap in South Temple is 46.5%.
Women in South Temple earn 53.5 cents for every dollar earned by a man.
What is Inequality or Gini Index in South Temple?
Inequality or Gini Index in South Temple is 0.32.
What is the Total Population of South Temple?
Total Population of South Temple is 1,874.
What is the Total Male Population of South Temple?
Total Male Population of South Temple is 769.
What is the Total Female Population of South Temple?
Total Female Population of South Temple is 1,105.
What is the Ratio of Males per 100 Females in South Temple?
There are 69.59 Males per 100 Females in South Temple.
What is the Ratio of Females per 100 Males in South Temple?
There are 143.69 Females per 100 Males in South Temple.
What is the Median Population Age in South Temple?
Median Population Age in South Temple is 45.5 Years.
What is the Average Family Size in South Temple
Average Family Size in South Temple is 2.8 People.
What is the Average Household Size in South Temple
Average Household Size in South Temple is 2.5 People.
How Large is the Labor Force in South Temple?
There are 777 People in the Labor Forcein in South Temple.
What is the Percentage of People in the Labor Force in South Temple?
50.0% of People are in the Labor Force in South Temple.
What is the Unemployment Rate in South Temple?
Unemployment Rate in South Temple is 1.2%.