Enhaut, PA Map & Demographics
Enhaut Map
Enhaut Overview
$23,979
PER CAPITA INCOME
$60,337
AVG HOUSEHOLD INCOME
0.29
INEQUALITY / GINI INDEX
1,252
TOTAL POPULATION
690
MALE POPULATION
562
FEMALE POPULATION
122.78
MALES / 100 FEMALES
81.45
FEMALES / 100 MALES
37.2
MEDIAN AGE
2.9
AVG FAMILY SIZE
2.4
AVG HOUSEHOLD SIZE
902
LABOR FORCE [ PEOPLE ]
80.2%
PERCENT IN LABOR FORCE
1.7%
UNEMPLOYMENT RATE
Income in Enhaut
Income Overview in Enhaut
| Characteristic | Number | Measure |
| Per Capita Income | 1,252 | $23,979 |
| Median Family Income | 359 | $0 |
| Mean Family Income | 359 | $60,998 |
| Median Household Income | 523 | $60,337 |
| Mean Household Income | 523 | $56,839 |
| Income Deficit | 359 | $0 |
| Wage / Income Gap (%) | 1,252 | 0.00% |
| Wage / Income Gap ($) | 1,252 | 100.00¢ per $1 |
| Gini / Inequality Index | 1,252 | 0.29 |
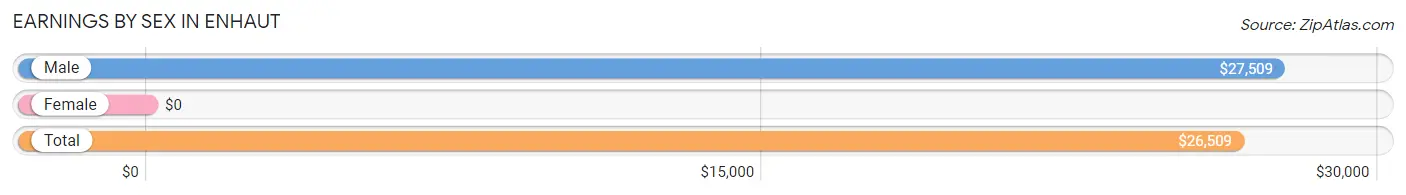
Earnings by Sex in Enhaut
| Sex | Number | Average Earnings |
| Male | 599 (61.2%) | $27,509 |
| Female | 380 (38.8%) | $0 |
| Total | 979 (100.0%) | $26,509 |
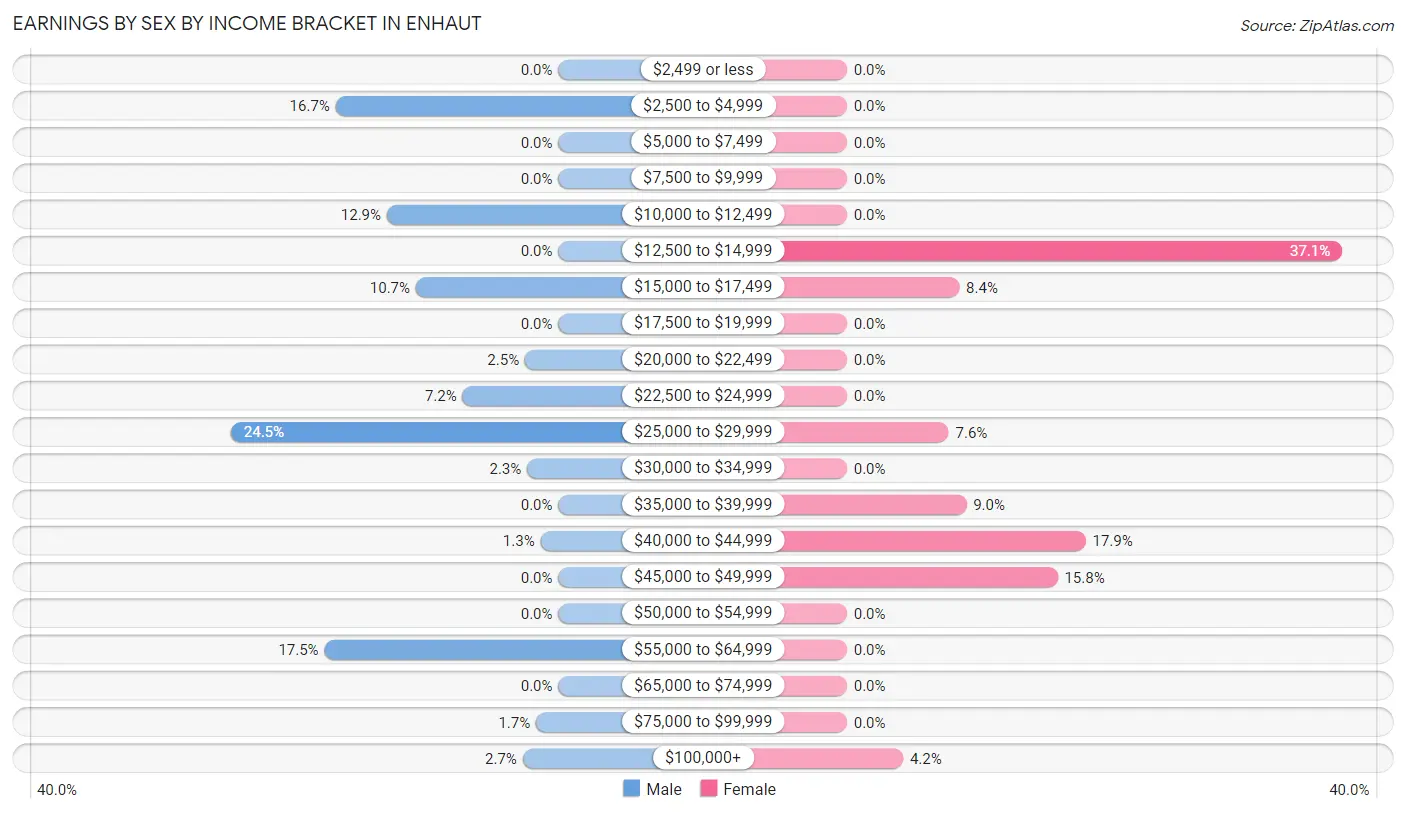
Earnings by Sex by Income Bracket in Enhaut
The most common earnings brackets in Enhaut are $25,000 to $29,999 for men (147 | 24.5%) and $12,500 to $14,999 for women (141 | 37.1%).
| Income | Male | Female |
| $2,499 or less | 0 (0.0%) | 0 (0.0%) |
| $2,500 to $4,999 | 100 (16.7%) | 0 (0.0%) |
| $5,000 to $7,499 | 0 (0.0%) | 0 (0.0%) |
| $7,500 to $9,999 | 0 (0.0%) | 0 (0.0%) |
| $10,000 to $12,499 | 77 (12.9%) | 0 (0.0%) |
| $12,500 to $14,999 | 0 (0.0%) | 141 (37.1%) |
| $15,000 to $17,499 | 64 (10.7%) | 32 (8.4%) |
| $17,500 to $19,999 | 0 (0.0%) | 0 (0.0%) |
| $20,000 to $22,499 | 15 (2.5%) | 0 (0.0%) |
| $22,500 to $24,999 | 43 (7.2%) | 0 (0.0%) |
| $25,000 to $29,999 | 147 (24.5%) | 29 (7.6%) |
| $30,000 to $34,999 | 14 (2.3%) | 0 (0.0%) |
| $35,000 to $39,999 | 0 (0.0%) | 34 (8.9%) |
| $40,000 to $44,999 | 8 (1.3%) | 68 (17.9%) |
| $45,000 to $49,999 | 0 (0.0%) | 60 (15.8%) |
| $50,000 to $54,999 | 0 (0.0%) | 0 (0.0%) |
| $55,000 to $64,999 | 105 (17.5%) | 0 (0.0%) |
| $65,000 to $74,999 | 0 (0.0%) | 0 (0.0%) |
| $75,000 to $99,999 | 10 (1.7%) | 0 (0.0%) |
| $100,000+ | 16 (2.7%) | 16 (4.2%) |
| Total | 599 (100.0%) | 380 (100.0%) |
Earnings by Sex by Educational Attainment in Enhaut
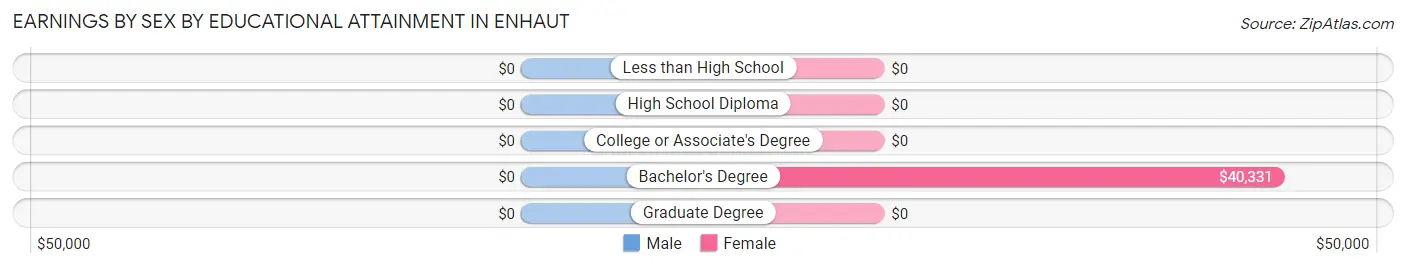
| Educational Attainment | Male Income | Female Income |
| Less than High School | - | - |
| High School Diploma | - | - |
| College or Associate's Degree | - | - |
| Bachelor's Degree | - | - |
| Graduate Degree | - | - |
| Total | $28,875 | $0 |
Family Income in Enhaut
Family Income Brackets in Enhaut
According to the Enhaut family income data, there are 145 families falling into the $35,000 to $49,999 income range, which is the most common income bracket and makes up 40.4% of all families.
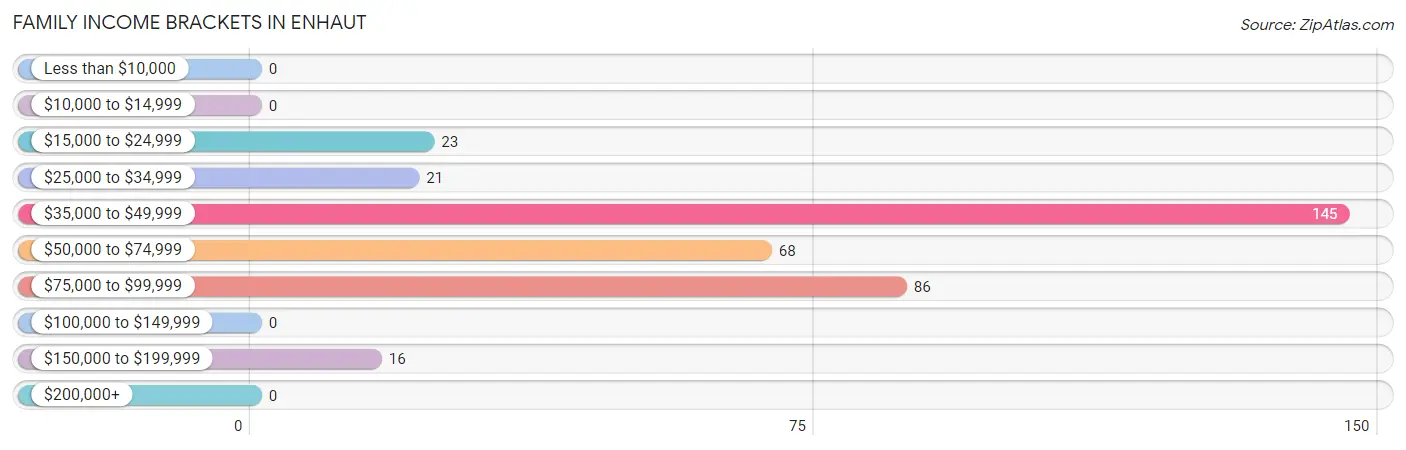
| Income Bracket | # Families | % Families |
| Less than $10,000 | 0 | 0.0% |
| $10,000 to $14,999 | 0 | 0.0% |
| $15,000 to $24,999 | 23 | 6.4% |
| $25,000 to $34,999 | 21 | 5.8% |
| $35,000 to $49,999 | 145 | 40.4% |
| $50,000 to $74,999 | 68 | 18.9% |
| $75,000 to $99,999 | 86 | 24.0% |
| $100,000 to $149,999 | 0 | 0.0% |
| $150,000 to $199,999 | 16 | 4.5% |
| $200,000+ | 0 | 0.0% |
Family Income by Famaliy Size in Enhaut
3-person families (155 | 43.2%) account for the highest median family income in Enhaut with $70,239 per family, while 3-person families (155 | 43.2%) have the highest median income of $23,413 per family member.
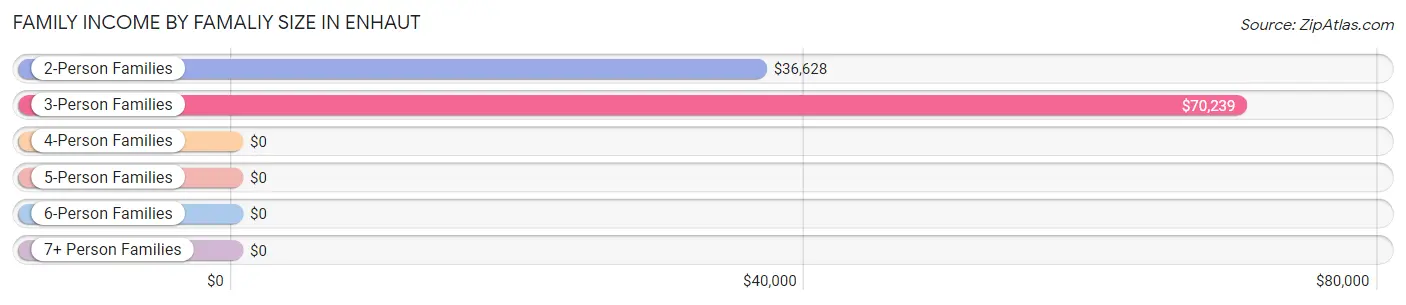
| Income Bracket | # Families | Median Income |
| 2-Person Families | 144 (40.1%) | $36,628 |
| 3-Person Families | 155 (43.2%) | $70,239 |
| 4-Person Families | 60 (16.7%) | $0 |
| 5-Person Families | 0 (0.0%) | $0 |
| 6-Person Families | 0 (0.0%) | $0 |
| 7+ Person Families | 0 (0.0%) | $0 |
| Total | 359 (100.0%) | $0 |
Family Income by Number of Earners in Enhaut
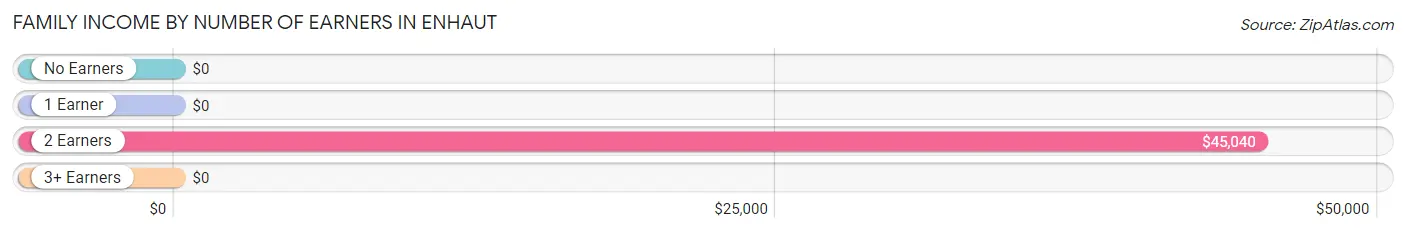
| Number of Earners | # Families | Median Income |
| No Earners | 0 (0.0%) | $0 |
| 1 Earner | 38 (10.6%) | $0 |
| 2 Earners | 261 (72.7%) | $45,040 |
| 3+ Earners | 60 (16.7%) | $0 |
| Total | 359 (100.0%) | $0 |
Household Income in Enhaut
Household Income Brackets in Enhaut
With 163 households falling in the category, the $35,000 to $49,999 income range is the most frequent in Enhaut, accounting for 31.2% of all households.
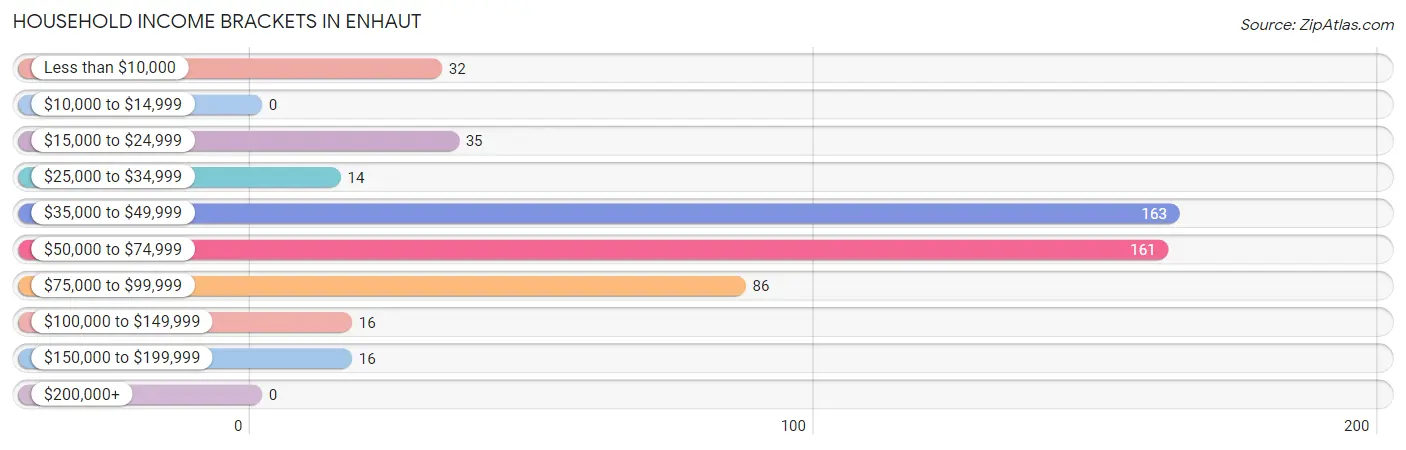
| Income Bracket | # Households | % Households |
| Less than $10,000 | 32 | 6.1% |
| $10,000 to $14,999 | 0 | 0.0% |
| $15,000 to $24,999 | 35 | 6.7% |
| $25,000 to $34,999 | 14 | 2.7% |
| $35,000 to $49,999 | 163 | 31.2% |
| $50,000 to $74,999 | 161 | 30.8% |
| $75,000 to $99,999 | 86 | 16.4% |
| $100,000 to $149,999 | 16 | 3.1% |
| $150,000 to $199,999 | 16 | 3.1% |
| $200,000+ | 0 | 0.0% |
Household Income by Householder Age in Enhaut
The median household income in Enhaut is $60,337, with the highest median household income of $71,176 found in the 45 to 64 years age bracket for the primary householder. A total of 256 households (48.9%) fall into this category.
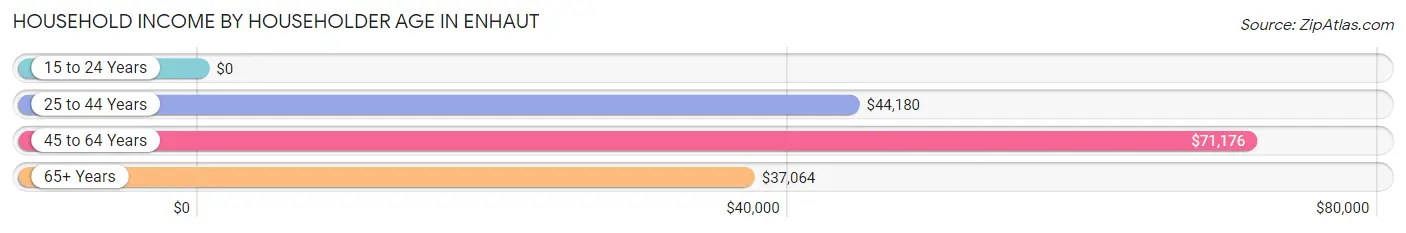
| Income Bracket | # Households | Median Income |
| 15 to 24 Years | 0 (0.0%) | $0 |
| 25 to 44 Years | 196 (37.5%) | $44,180 |
| 45 to 64 Years | 256 (48.9%) | $71,176 |
| 65+ Years | 71 (13.6%) | $37,064 |
| Total | 523 (100.0%) | $60,337 |
Poverty in Enhaut
Income Below Poverty by Sex and Age in Enhaut
With 3.3% poverty level for males and 13.5% for females among the residents of Enhaut, 35 to 44 year old males and 25 to 34 year old females are the most vulnerable to poverty, with 23 males (19.2%) and 32 females (39.5%) in their respective age groups living below the poverty level.
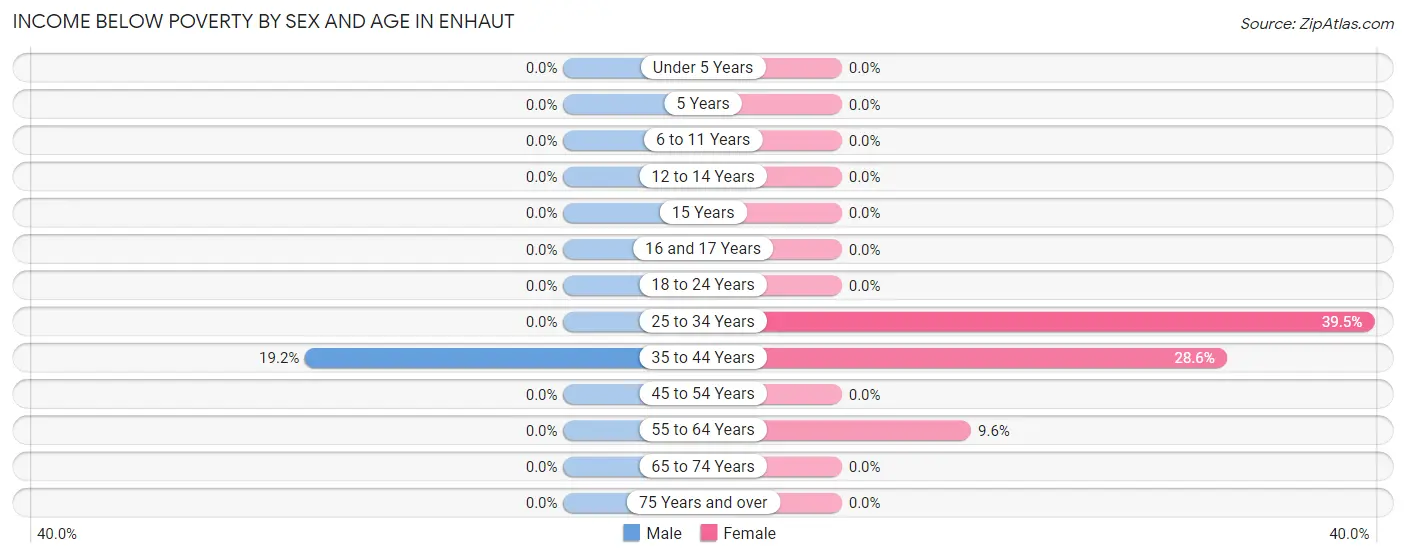
| Age Bracket | Male | Female |
| Under 5 Years | 0 (0.0%) | 0 (0.0%) |
| 5 Years | 0 (0.0%) | 0 (0.0%) |
| 6 to 11 Years | 0 (0.0%) | 0 (0.0%) |
| 12 to 14 Years | 0 (0.0%) | 0 (0.0%) |
| 15 Years | 0 (0.0%) | 0 (0.0%) |
| 16 and 17 Years | 0 (0.0%) | 0 (0.0%) |
| 18 to 24 Years | 0 (0.0%) | 0 (0.0%) |
| 25 to 34 Years | 0 (0.0%) | 32 (39.5%) |
| 35 to 44 Years | 23 (19.2%) | 32 (28.6%) |
| 45 to 54 Years | 0 (0.0%) | 0 (0.0%) |
| 55 to 64 Years | 0 (0.0%) | 12 (9.6%) |
| 65 to 74 Years | 0 (0.0%) | 0 (0.0%) |
| 75 Years and over | 0 (0.0%) | 0 (0.0%) |
| Total | 23 (3.3%) | 76 (13.5%) |
Income Above Poverty by Sex and Age in Enhaut
According to the poverty statistics in Enhaut, males aged under 5 years and females aged under 5 years are the age groups that are most secure financially, with 100.0% of males and 100.0% of females in these age groups living above the poverty line.
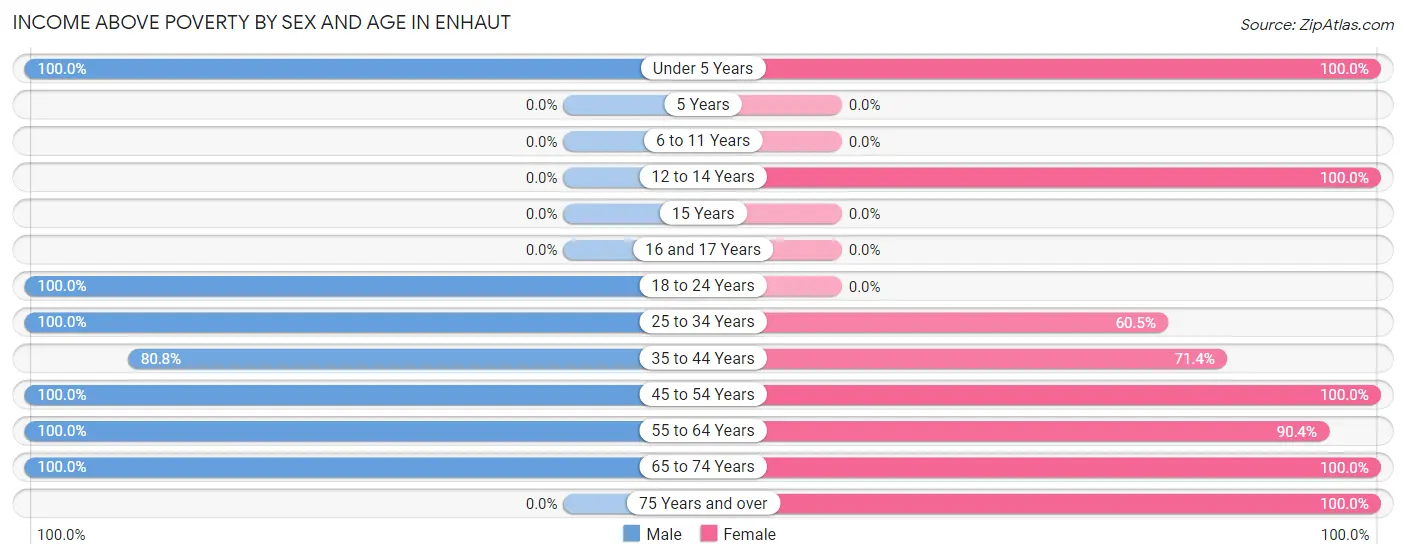
| Age Bracket | Male | Female |
| Under 5 Years | 25 (100.0%) | 21 (100.0%) |
| 5 Years | 0 (0.0%) | 0 (0.0%) |
| 6 to 11 Years | 0 (0.0%) | 0 (0.0%) |
| 12 to 14 Years | 0 (0.0%) | 81 (100.0%) |
| 15 Years | 0 (0.0%) | 0 (0.0%) |
| 16 and 17 Years | 0 (0.0%) | 0 (0.0%) |
| 18 to 24 Years | 221 (100.0%) | 0 (0.0%) |
| 25 to 34 Years | 83 (100.0%) | 49 (60.5%) |
| 35 to 44 Years | 97 (80.8%) | 80 (71.4%) |
| 45 to 54 Years | 102 (100.0%) | 84 (100.0%) |
| 55 to 64 Years | 86 (100.0%) | 113 (90.4%) |
| 65 to 74 Years | 53 (100.0%) | 40 (100.0%) |
| 75 Years and over | 0 (0.0%) | 18 (100.0%) |
| Total | 667 (96.7%) | 486 (86.5%) |
Income Below Poverty Among Married-Couple Families in Enhaut
The poverty statistics for married-couple families in Enhaut show that 9.3% or 23 of the total 247 families live below the poverty line. Families with no children have the highest poverty rate of 13.8%, comprising of 23 families. On the other hand, families with 1 or 2 children have the lowest poverty rate of 0.0%, which includes 0 families.
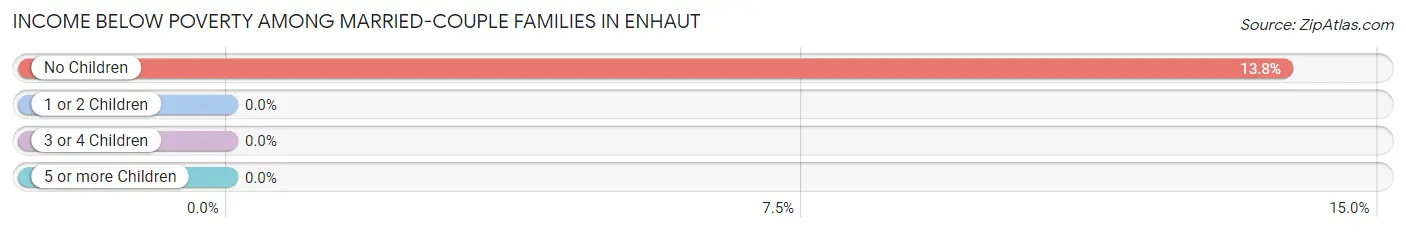
| Children | Above Poverty | Below Poverty |
| No Children | 144 (86.2%) | 23 (13.8%) |
| 1 or 2 Children | 80 (100.0%) | 0 (0.0%) |
| 3 or 4 Children | 0 (0.0%) | 0 (0.0%) |
| 5 or more Children | 0 (0.0%) | 0 (0.0%) |
| Total | 224 (90.7%) | 23 (9.3%) |
Income Below Poverty Among Single-Parent Households in Enhaut
| Children | Single Father | Single Mother |
| No Children | 0 (0.0%) | 0 (0.0%) |
| 1 or 2 Children | 0 (0.0%) | 0 (0.0%) |
| 3 or 4 Children | 0 (0.0%) | 0 (0.0%) |
| 5 or more Children | 0 (0.0%) | 0 (0.0%) |
| Total | 0 (0.0%) | 0 (0.0%) |
Income Below Poverty Among Married-Couple vs Single-Parent Households in Enhaut
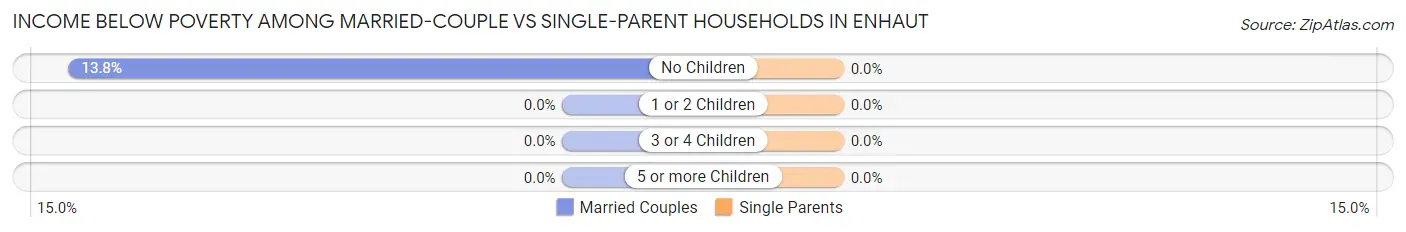
| Children | Married-Couple Families | Single-Parent Households |
| No Children | 23 (13.8%) | 0 (0.0%) |
| 1 or 2 Children | 0 (0.0%) | 0 (0.0%) |
| 3 or 4 Children | 0 (0.0%) | 0 (0.0%) |
| 5 or more Children | 0 (0.0%) | 0 (0.0%) |
| Total | 23 (9.3%) | 0 (0.0%) |
Race in Enhaut
The most populous races in Enhaut are White / Caucasian (983 | 78.5%), Hispanic or Latino (329 | 26.3%), and Two or more Races (218 | 17.4%).
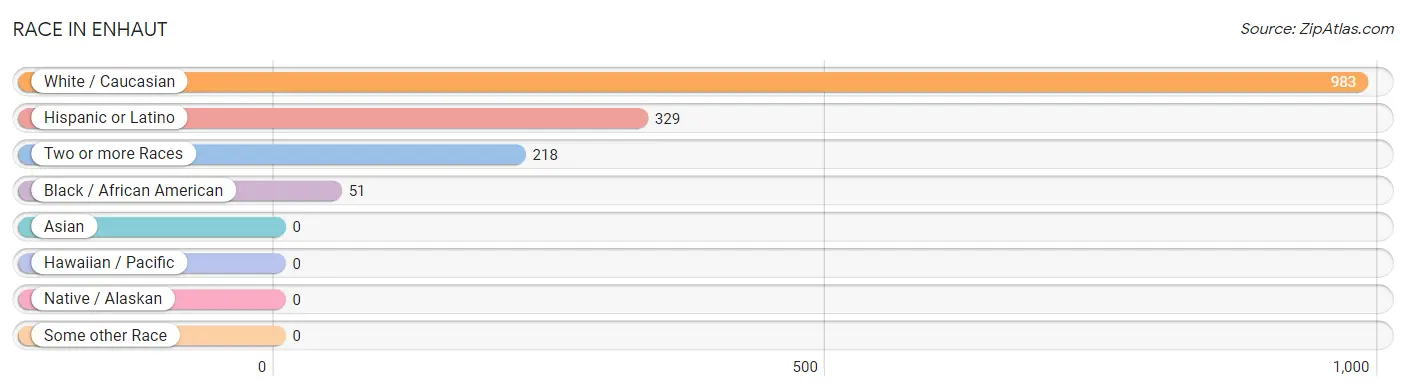
| Race | # Population | % Population |
| Asian | 0 | 0.0% |
| Black / African American | 51 | 4.1% |
| Hawaiian / Pacific | 0 | 0.0% |
| Hispanic or Latino | 329 | 26.3% |
| Native / Alaskan | 0 | 0.0% |
| White / Caucasian | 983 | 78.5% |
| Two or more Races | 218 | 17.4% |
| Some other Race | 0 | 0.0% |
| Total | 1,252 | 100.0% |
Ancestry in Enhaut
The most populous ancestries reported in Enhaut are Irish (261 | 20.8%), German (221 | 17.6%), Croatian (218 | 17.4%), Nigerian (135 | 10.8%), and Subsaharan African (135 | 10.8%), together accounting for 77.5% of all Enhaut residents.
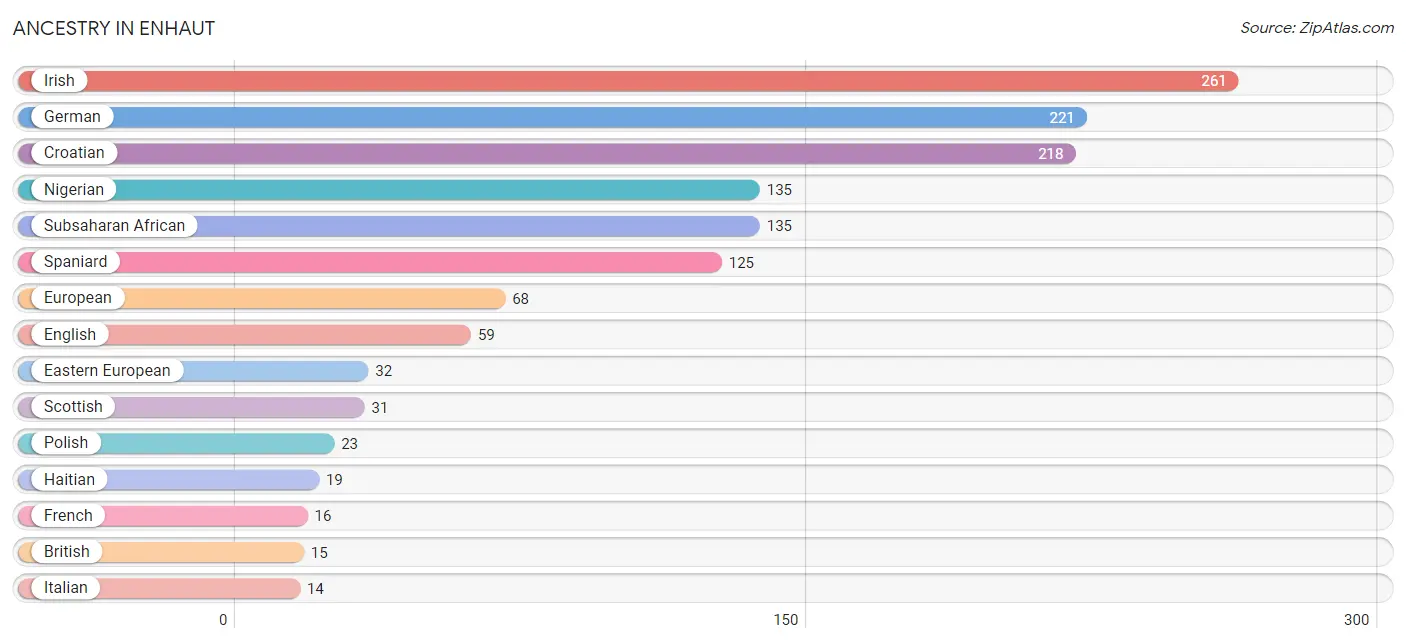
| Ancestry | # Population | % Population |
| British | 15 | 1.2% |
| Croatian | 218 | 17.4% |
| Eastern European | 32 | 2.6% |
| English | 59 | 4.7% |
| European | 68 | 5.4% |
| French | 16 | 1.3% |
| German | 221 | 17.6% |
| Haitian | 19 | 1.5% |
| Irish | 261 | 20.8% |
| Italian | 14 | 1.1% |
| Nigerian | 135 | 10.8% |
| Polish | 23 | 1.8% |
| Scottish | 31 | 2.5% |
| Spaniard | 125 | 10.0% |
| Subsaharan African | 135 | 10.8% | View All 15 Rows |
Immigrants in Enhaut
The most numerous immigrant groups reported in Enhaut came from Central America (64 | 5.1%), Latin America (64 | 5.1%), and Mexico (64 | 5.1%), together accounting for 15.3% of all Enhaut residents.
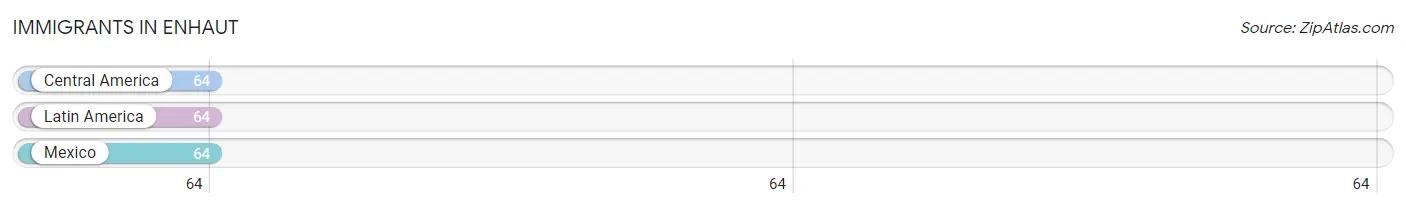
| Immigration Origin | # Population | % Population |
| Central America | 64 | 5.1% |
| Latin America | 64 | 5.1% |
| Mexico | 64 | 5.1% | View All 3 Rows |
Sex and Age in Enhaut
Sex and Age in Enhaut
The most populous age groups in Enhaut are 20 to 24 Years (221 | 32.0%) for men and 35 to 39 Years (112 | 19.9%) for women.
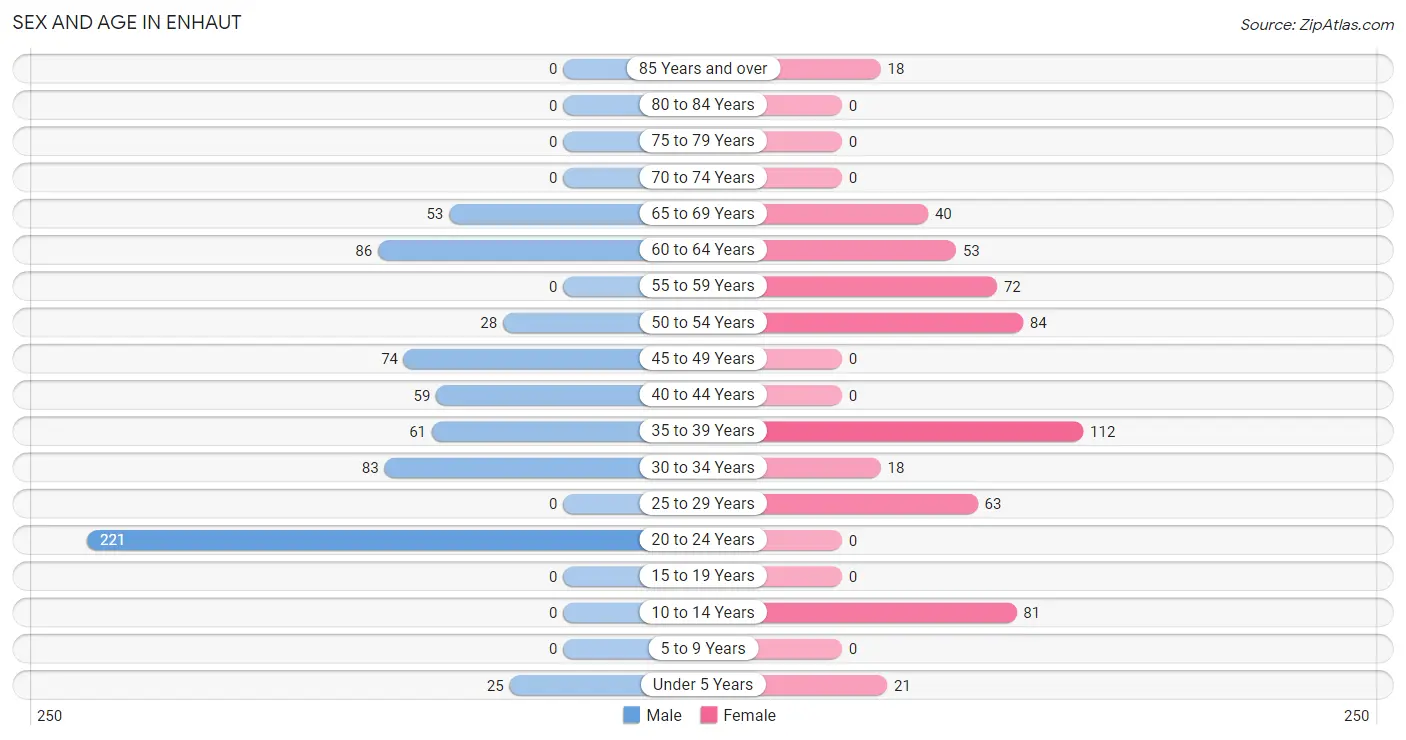
| Age Bracket | Male | Female |
| Under 5 Years | 25 (3.6%) | 21 (3.7%) |
| 5 to 9 Years | 0 (0.0%) | 0 (0.0%) |
| 10 to 14 Years | 0 (0.0%) | 81 (14.4%) |
| 15 to 19 Years | 0 (0.0%) | 0 (0.0%) |
| 20 to 24 Years | 221 (32.0%) | 0 (0.0%) |
| 25 to 29 Years | 0 (0.0%) | 63 (11.2%) |
| 30 to 34 Years | 83 (12.0%) | 18 (3.2%) |
| 35 to 39 Years | 61 (8.8%) | 112 (19.9%) |
| 40 to 44 Years | 59 (8.6%) | 0 (0.0%) |
| 45 to 49 Years | 74 (10.7%) | 0 (0.0%) |
| 50 to 54 Years | 28 (4.1%) | 84 (14.9%) |
| 55 to 59 Years | 0 (0.0%) | 72 (12.8%) |
| 60 to 64 Years | 86 (12.5%) | 53 (9.4%) |
| 65 to 69 Years | 53 (7.7%) | 40 (7.1%) |
| 70 to 74 Years | 0 (0.0%) | 0 (0.0%) |
| 75 to 79 Years | 0 (0.0%) | 0 (0.0%) |
| 80 to 84 Years | 0 (0.0%) | 0 (0.0%) |
| 85 Years and over | 0 (0.0%) | 18 (3.2%) |
| Total | 690 (100.0%) | 562 (100.0%) |
Families and Households in Enhaut
Median Family Size in Enhaut
The median family size in Enhaut is 2.94 persons per family, with single female/mother families (91 | 25.4%) accounting for the largest median family size of 3.71 persons per family. On the other hand, single male/father families (21 | 5.9%) represent the smallest median family size with 2.19 persons per family.
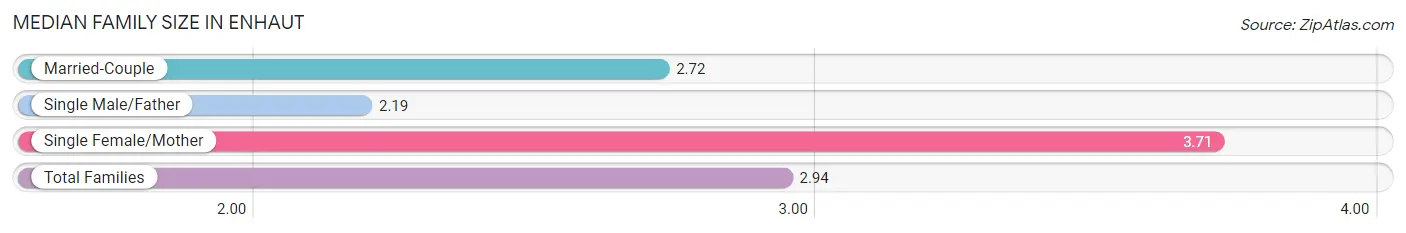
| Family Type | # Families | Family Size |
| Married-Couple | 247 (68.8%) | 2.72 |
| Single Male/Father | 21 (5.9%) | 2.19 |
| Single Female/Mother | 91 (25.4%) | 3.71 |
| Total Families | 359 (100.0%) | 2.94 |
Median Household Size in Enhaut
The median household size in Enhaut is 2.39 persons per household, with single female/mother households (91 | 17.4%) accounting for the largest median household size of 3.71 persons per household. non-family households (164 | 31.4%) represent the smallest median household size with 1.09 persons per household.
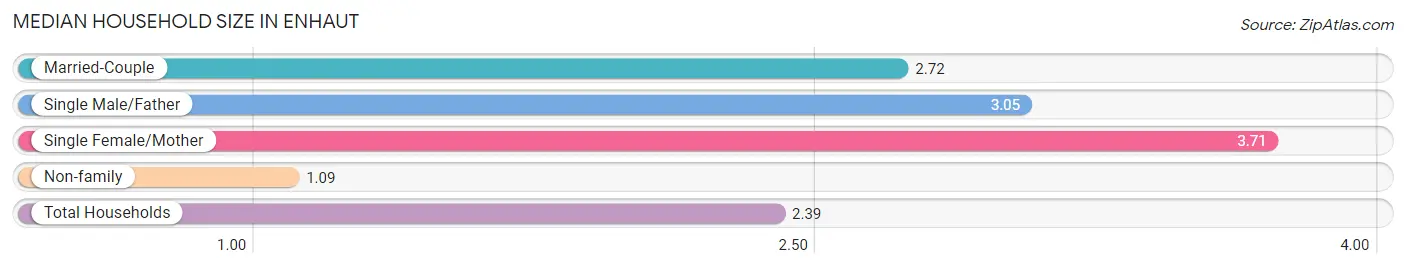
| Household Type | # Households | Household Size |
| Married-Couple | 247 (47.2%) | 2.72 |
| Single Male/Father | 21 (4.0%) | 3.05 |
| Single Female/Mother | 91 (17.4%) | 3.71 |
| Non-family | 164 (31.4%) | 1.09 |
| Total Households | 523 (100.0%) | 2.39 |
Household Size by Marriage Status in Enhaut
Out of a total of 523 households in Enhaut, 359 (68.6%) are family households, while 164 (31.4%) are nonfamily households. The most numerous type of family households are 3-person households, comprising 176, and the most common type of nonfamily households are 1-person households, comprising 152.
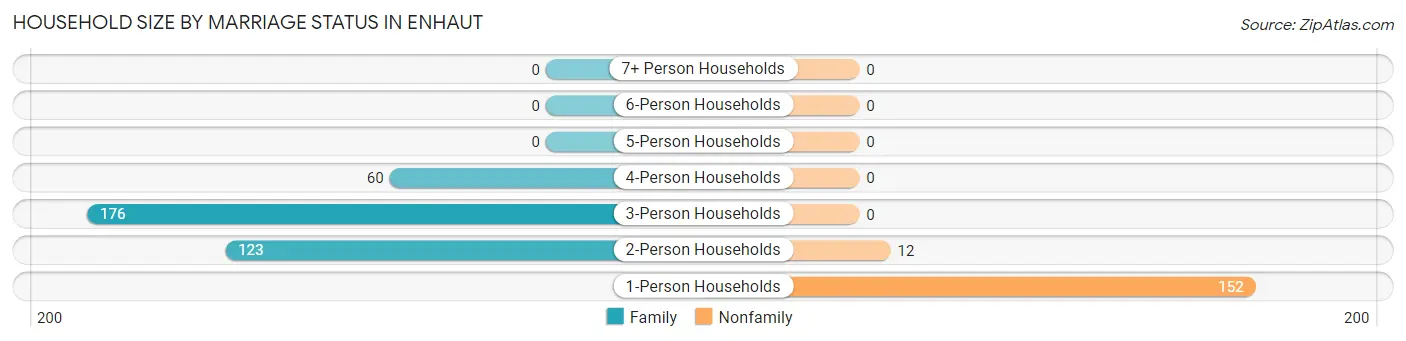
| Household Size | Family Households | Nonfamily Households |
| 1-Person Households | - | 152 (29.1%) |
| 2-Person Households | 123 (23.5%) | 12 (2.3%) |
| 3-Person Households | 176 (33.7%) | 0 (0.0%) |
| 4-Person Households | 60 (11.5%) | 0 (0.0%) |
| 5-Person Households | 0 (0.0%) | 0 (0.0%) |
| 6-Person Households | 0 (0.0%) | 0 (0.0%) |
| 7+ Person Households | 0 (0.0%) | 0 (0.0%) |
| Total | 359 (68.6%) | 164 (31.4%) |
Female Fertility in Enhaut
Fertility by Age in Enhaut
Average fertility rate in Enhaut is 163.0 births per 1,000 women. Women in the age bracket of 20 to 34 years have the highest fertility rate with 222.0 births per 1,000 women. Women in the age bracket of 20 to 34 years acount for 52.9% of all women with births.
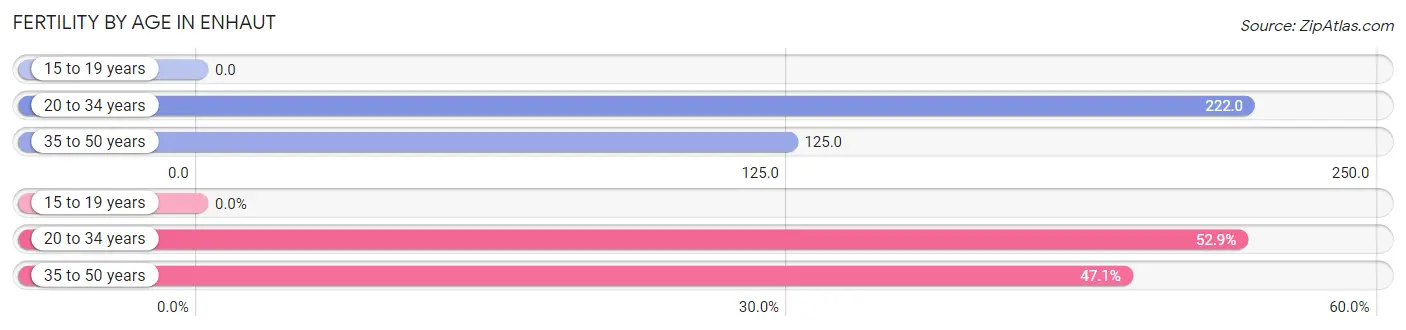
| Age Bracket | Women with Births | Births / 1,000 Women |
| 15 to 19 years | 0 (0.0%) | 0.0 |
| 20 to 34 years | 18 (52.9%) | 222.0 |
| 35 to 50 years | 16 (47.1%) | 125.0 |
| Total | 34 (100.0%) | 163.0 |
Fertility by Age by Marriage Status in Enhaut
47.1% of women with births (34) in Enhaut are married. The highest percentage of unmarried women with births falls into 20 to 34 years age bracket with 100.0% of them unmarried at the time of birth, while the lowest percentage of unmarried women with births belong to 35 to 50 years age bracket with 0.0% of them unmarried.
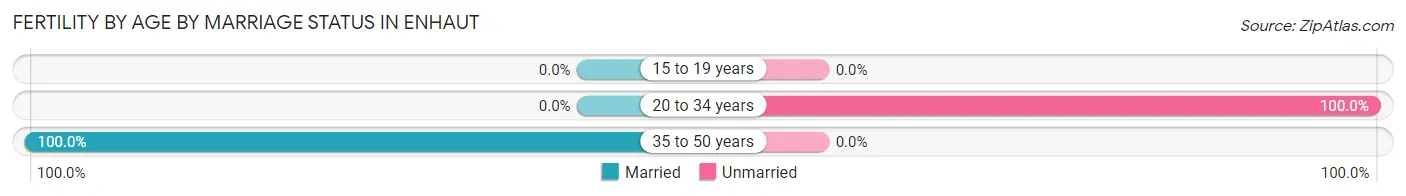
| Age Bracket | Married | Unmarried |
| 15 to 19 years | 0 (0.0%) | 0 (0.0%) |
| 20 to 34 years | 0 (0.0%) | 18 (100.0%) |
| 35 to 50 years | 16 (100.0%) | 0 (0.0%) |
| Total | 16 (47.1%) | 18 (52.9%) |
Fertility by Education in Enhaut
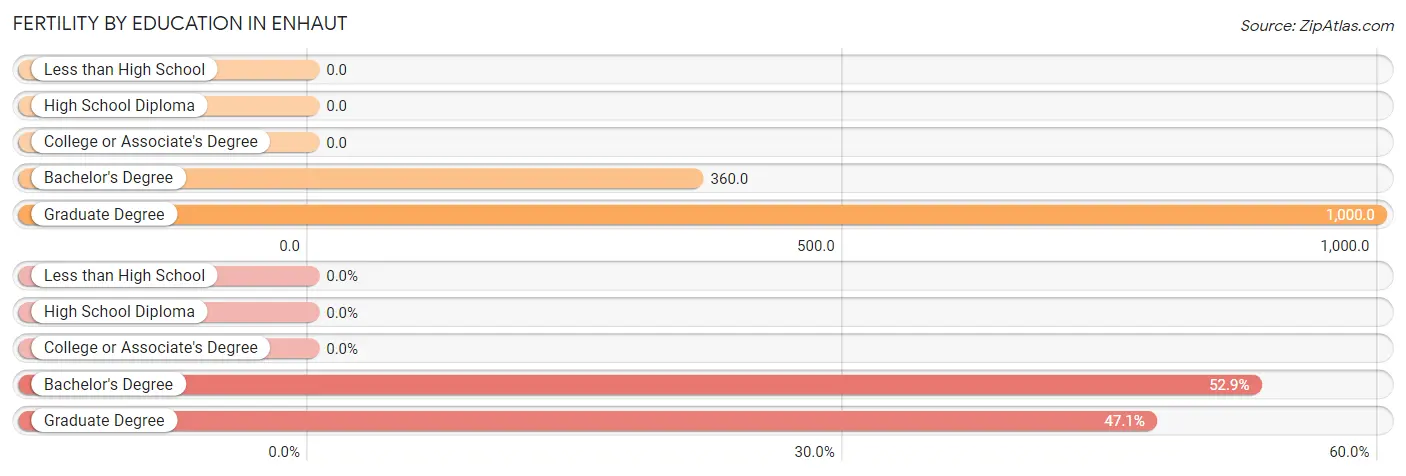
| Educational Attainment | Women with Births | Births / 1,000 Women |
| Less than High School | 0 (0.0%) | 0.0 |
| High School Diploma | 0 (0.0%) | 0.0 |
| College or Associate's Degree | 0 (0.0%) | 0.0 |
| Bachelor's Degree | 18 (52.9%) | 360.0 |
| Graduate Degree | 16 (47.1%) | 1,000.0 |
| Total | 34 (100.0%) | 163.0 |
Fertility by Education by Marriage Status in Enhaut
52.9% of women with births in Enhaut are unmarried. Women with the educational attainment of graduate degree are most likely to be married with 100.0% of them married at childbirth, while women with the educational attainment of bachelor's degree are least likely to be married with 100.0% of them unmarried at childbirth.
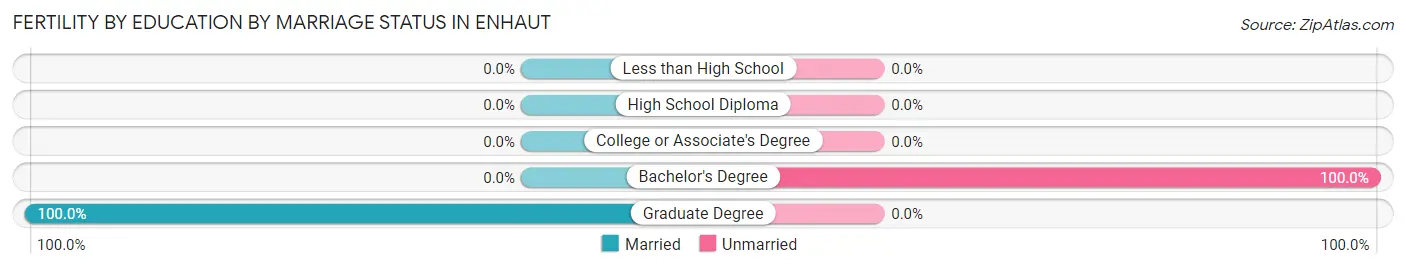
| Educational Attainment | Married | Unmarried |
| Less than High School | 0 (0.0%) | 0 (0.0%) |
| High School Diploma | 0 (0.0%) | 0 (0.0%) |
| College or Associate's Degree | 0 (0.0%) | 0 (0.0%) |
| Bachelor's Degree | 0 (0.0%) | 18 (100.0%) |
| Graduate Degree | 16 (100.0%) | 0 (0.0%) |
| Total | 16 (47.1%) | 18 (52.9%) |
Employment Characteristics in Enhaut
Employment by Class of Employer in Enhaut
Among the 887 employed individuals in Enhaut, private company employees (685 | 77.2%), not-for-profit organizations (94 | 10.6%), and state government employees (92 | 10.4%) make up the most common classes of employment.
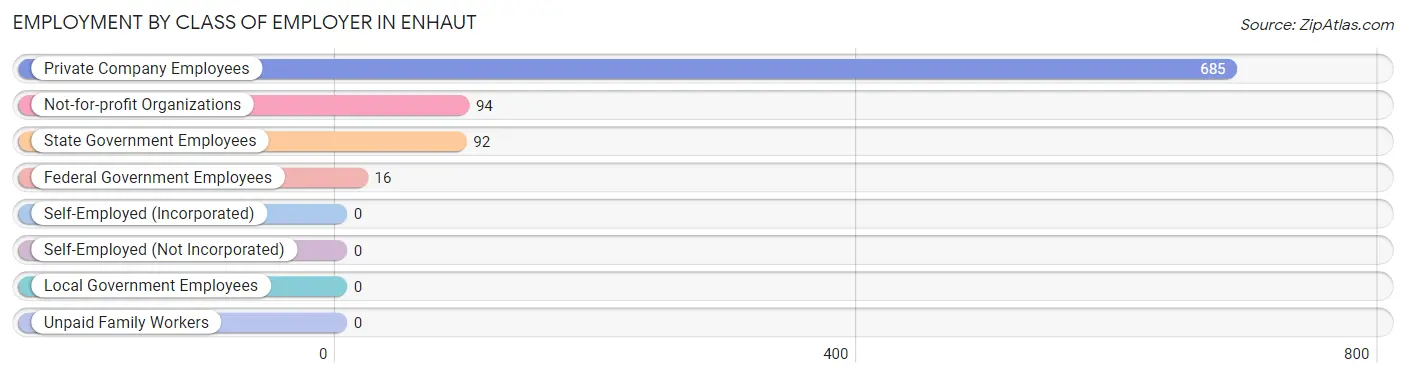
| Employer Class | # Employees | % Employees |
| Private Company Employees | 685 | 77.2% |
| Self-Employed (Incorporated) | 0 | 0.0% |
| Self-Employed (Not Incorporated) | 0 | 0.0% |
| Not-for-profit Organizations | 94 | 10.6% |
| Local Government Employees | 0 | 0.0% |
| State Government Employees | 92 | 10.4% |
| Federal Government Employees | 16 | 1.8% |
| Unpaid Family Workers | 0 | 0.0% |
| Total | 887 | 100.0% |
Employment Status by Age in Enhaut
According to the labor force statistics for Enhaut, out of the total population over 16 years of age (1,125), 80.2% or 902 individuals are in the labor force, with 1.7% or 15 of them unemployed. The age group with the highest labor force participation rate is 25 to 29 years, with 100.0% or 63 individuals in the labor force. Within the labor force, the 60 to 64 years age range has the highest percentage of unemployed individuals, with 11.4% or 15 of them being unemployed.
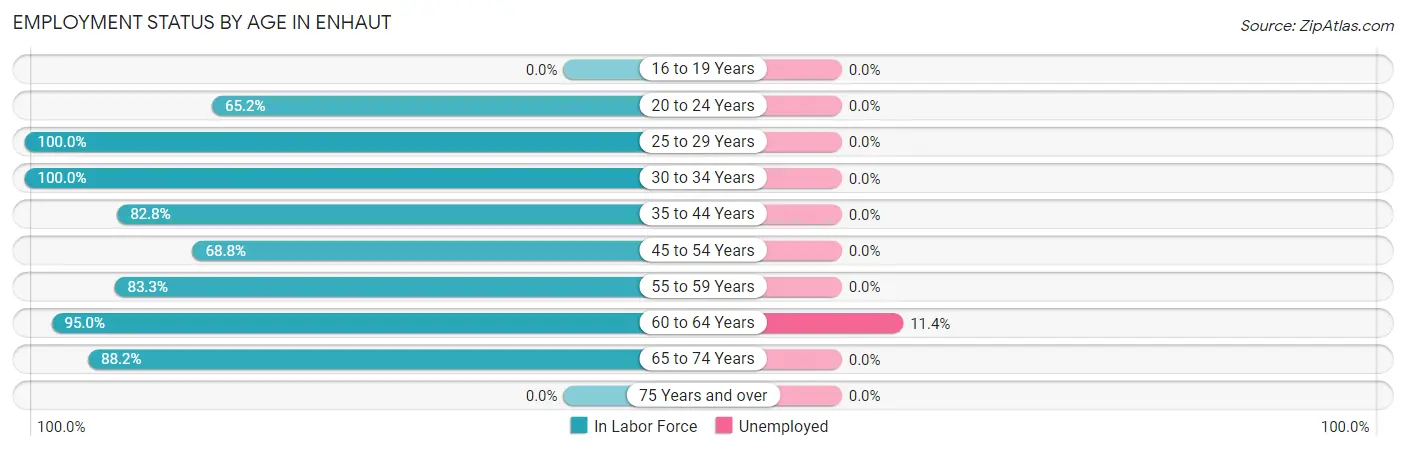
| Age Bracket | In Labor Force | Unemployed |
| 16 to 19 Years | 0 (0.0%) | 0 (0.0%) |
| 20 to 24 Years | 144 (65.2%) | 0 (0.0%) |
| 25 to 29 Years | 63 (100.0%) | 0 (0.0%) |
| 30 to 34 Years | 101 (100.0%) | 0 (0.0%) |
| 35 to 44 Years | 192 (82.8%) | 0 (0.0%) |
| 45 to 54 Years | 128 (68.8%) | 0 (0.0%) |
| 55 to 59 Years | 60 (83.3%) | 0 (0.0%) |
| 60 to 64 Years | 132 (95.0%) | 15 (11.4%) |
| 65 to 74 Years | 82 (88.2%) | 0 (0.0%) |
| 75 Years and over | 0 (0.0%) | 0 (0.0%) |
| Total | 902 (80.2%) | 15 (1.7%) |
Employment Status by Educational Attainment in Enhaut
According to labor force statistics for Enhaut, 85.2% of individuals (676) out of the total population between 25 and 64 years of age (793) are in the labor force, with 2.2% or 15 of them being unemployed. The group with the highest labor force participation rate are those with the educational attainment of less than high school, with 100.0% or 80 individuals in the labor force. Within the labor force, individuals with college / associate degree education have the highest percentage of unemployment, with 4.5% or 15 of them being unemployed.
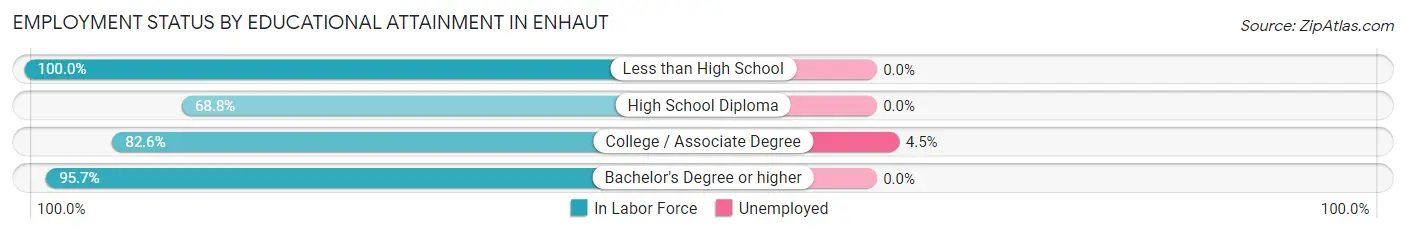
| Educational Attainment | In Labor Force | Unemployed |
| Less than High School | 80 (100.0%) | 0 (0.0%) |
| High School Diploma | 86 (68.8%) | 0 (0.0%) |
| College / Associate Degree | 332 (82.6%) | 18 (4.5%) |
| Bachelor's Degree or higher | 178 (95.7%) | 0 (0.0%) |
| Total | 676 (85.2%) | 17 (2.2%) |
Employment Occupations by Sex in Enhaut
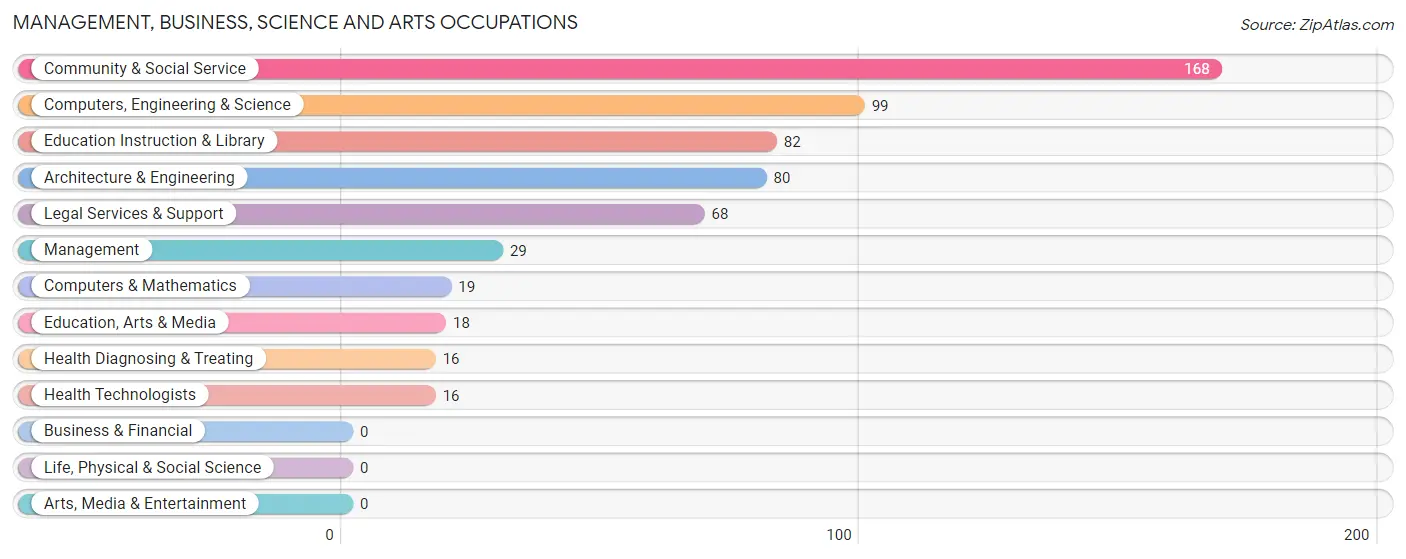
Management, Business, Science and Arts Occupations
The most common Management, Business, Science and Arts occupations in Enhaut are Community & Social Service (168 | 18.9%), Computers, Engineering & Science (99 | 11.2%), Education Instruction & Library (82 | 9.2%), Architecture & Engineering (80 | 9.0%), and Legal Services & Support (68 | 7.7%).
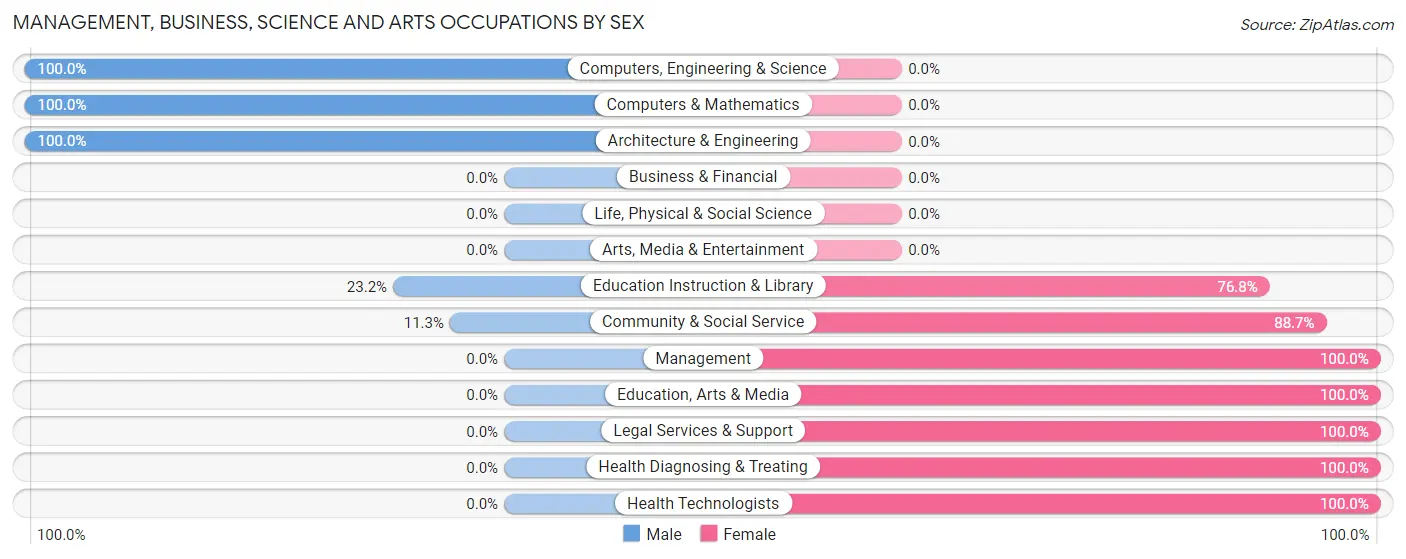
Management, Business, Science and Arts Occupations by Sex
Within the Management, Business, Science and Arts occupations in Enhaut, the most male-oriented occupations are Computers, Engineering & Science (100.0%), Computers & Mathematics (100.0%), and Architecture & Engineering (100.0%), while the most female-oriented occupations are Management (100.0%), Education, Arts & Media (100.0%), and Legal Services & Support (100.0%).
| Occupation | Male | Female |
| Management | 0 (0.0%) | 29 (100.0%) |
| Business & Financial | 0 (0.0%) | 0 (0.0%) |
| Computers, Engineering & Science | 99 (100.0%) | 0 (0.0%) |
| Computers & Mathematics | 19 (100.0%) | 0 (0.0%) |
| Architecture & Engineering | 80 (100.0%) | 0 (0.0%) |
| Life, Physical & Social Science | 0 (0.0%) | 0 (0.0%) |
| Community & Social Service | 19 (11.3%) | 149 (88.7%) |
| Education, Arts & Media | 0 (0.0%) | 18 (100.0%) |
| Legal Services & Support | 0 (0.0%) | 68 (100.0%) |
| Education Instruction & Library | 19 (23.2%) | 63 (76.8%) |
| Arts, Media & Entertainment | 0 (0.0%) | 0 (0.0%) |
| Health Diagnosing & Treating | 0 (0.0%) | 16 (100.0%) |
| Health Technologists | 0 (0.0%) | 16 (100.0%) |
| Total (Category) | 118 (37.8%) | 194 (62.2%) |
| Total (Overall) | 507 (57.2%) | 380 (42.8%) |
Services Occupations
Services Occupations by Sex
| Occupation | Male | Female |
| Healthcare Support | 0 (0.0%) | 0 (0.0%) |
| Security & Protection | 0 (0.0%) | 0 (0.0%) |
| Firefighting & Prevention | 0 (0.0%) | 0 (0.0%) |
| Law Enforcement | 0 (0.0%) | 0 (0.0%) |
| Food Preparation & Serving | 0 (0.0%) | 0 (0.0%) |
| Cleaning & Maintenance | 0 (0.0%) | 0 (0.0%) |
| Personal Care & Service | 0 (0.0%) | 0 (0.0%) |
| Total (Category) | 0 (0.0%) | 0 (0.0%) |
| Total (Overall) | 507 (57.2%) | 380 (42.8%) |
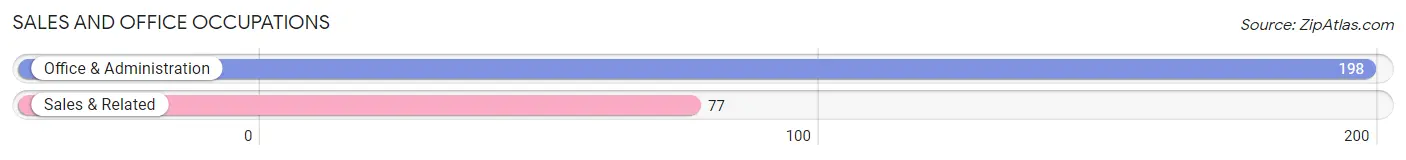
Sales and Office Occupations
The most common Sales and Office occupations in Enhaut are Office & Administration (198 | 22.3%), and Sales & Related (77 | 8.7%).
Sales and Office Occupations by Sex
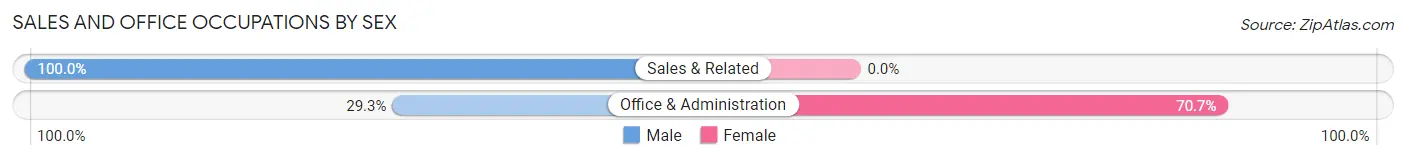
| Occupation | Male | Female |
| Sales & Related | 77 (100.0%) | 0 (0.0%) |
| Office & Administration | 58 (29.3%) | 140 (70.7%) |
| Total (Category) | 135 (49.1%) | 140 (50.9%) |
| Total (Overall) | 507 (57.2%) | 380 (42.8%) |
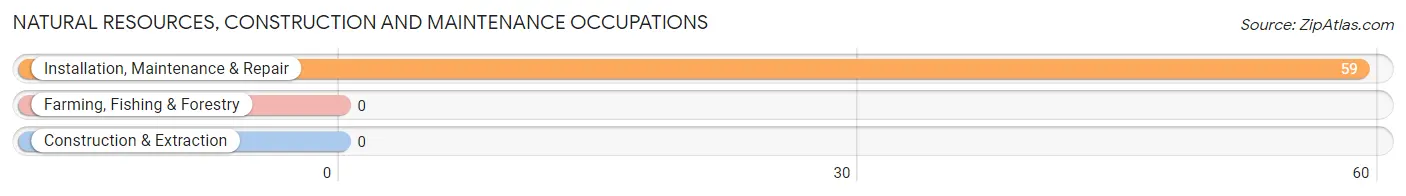
Natural Resources, Construction and Maintenance Occupations
The most common Natural Resources, Construction and Maintenance occupations in Enhaut are , and Installation, Maintenance & Repair (59 | 6.7%).
Natural Resources, Construction and Maintenance Occupations by Sex
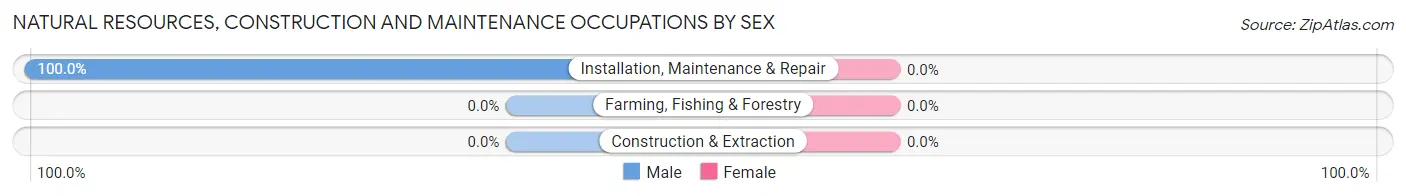
| Occupation | Male | Female |
| Farming, Fishing & Forestry | 0 (0.0%) | 0 (0.0%) |
| Construction & Extraction | 0 (0.0%) | 0 (0.0%) |
| Installation, Maintenance & Repair | 59 (100.0%) | 0 (0.0%) |
| Total (Category) | 59 (100.0%) | 0 (0.0%) |
| Total (Overall) | 507 (57.2%) | 380 (42.8%) |
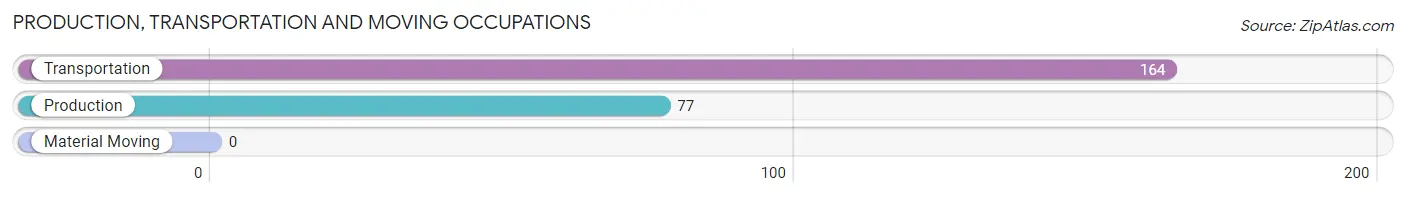
Production, Transportation and Moving Occupations
The most common Production, Transportation and Moving occupations in Enhaut are Transportation (164 | 18.5%), and Production (77 | 8.7%).
Production, Transportation and Moving Occupations by Sex
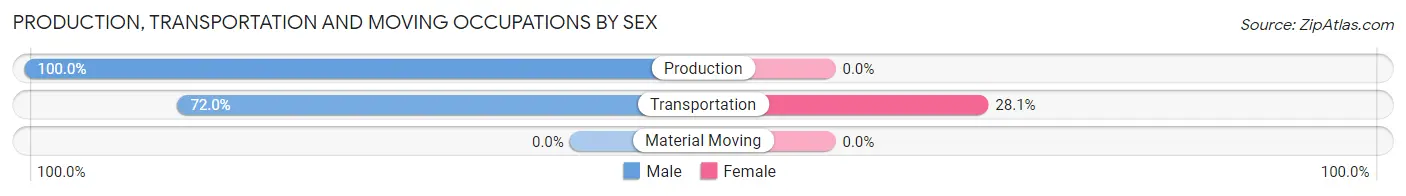
| Occupation | Male | Female |
| Production | 77 (100.0%) | 0 (0.0%) |
| Transportation | 118 (72.0%) | 46 (28.1%) |
| Material Moving | 0 (0.0%) | 0 (0.0%) |
| Total (Category) | 195 (80.9%) | 46 (19.1%) |
| Total (Overall) | 507 (57.2%) | 380 (42.8%) |
Employment Industries by Sex in Enhaut
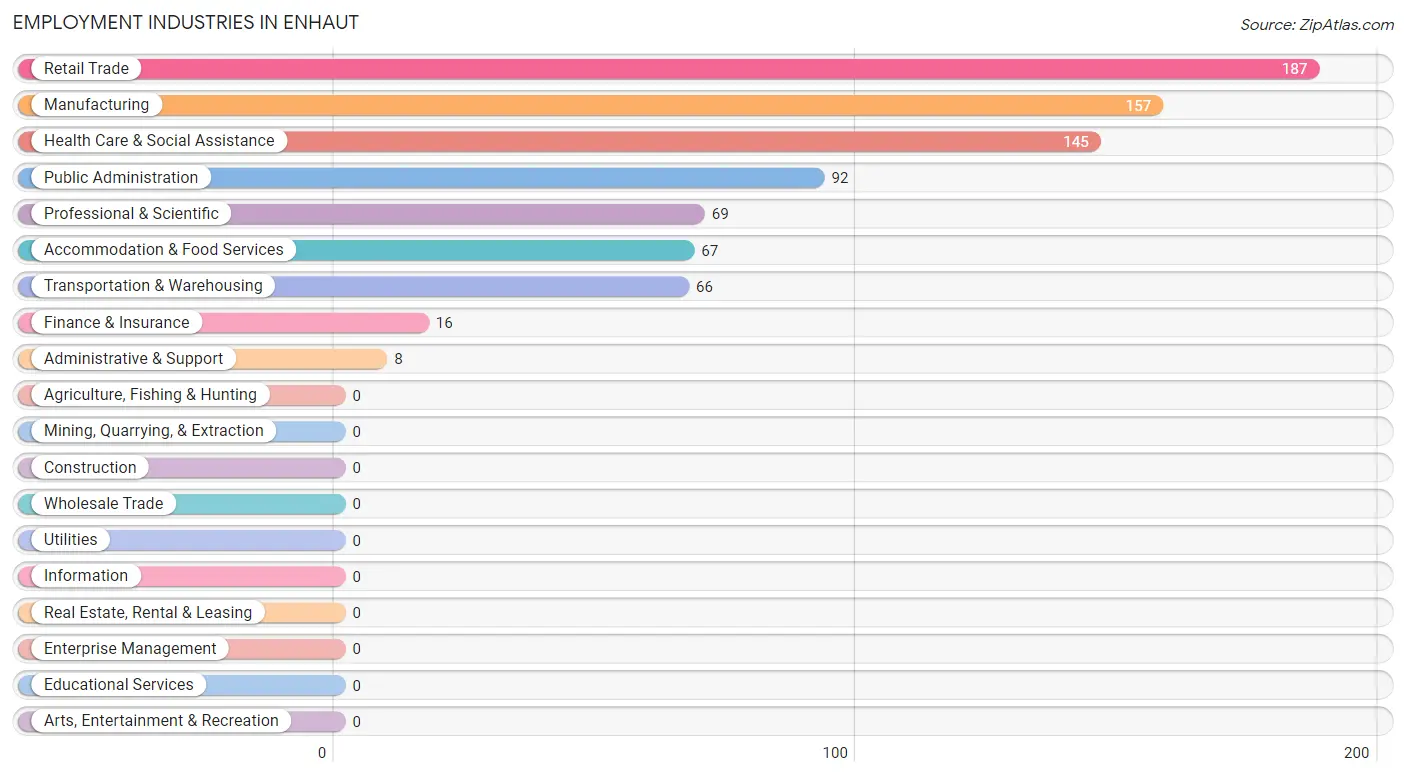
Employment Industries in Enhaut
The major employment industries in Enhaut include Retail Trade (187 | 21.1%), Manufacturing (157 | 17.7%), Health Care & Social Assistance (145 | 16.4%), Public Administration (92 | 10.4%), and Professional & Scientific (69 | 7.8%).
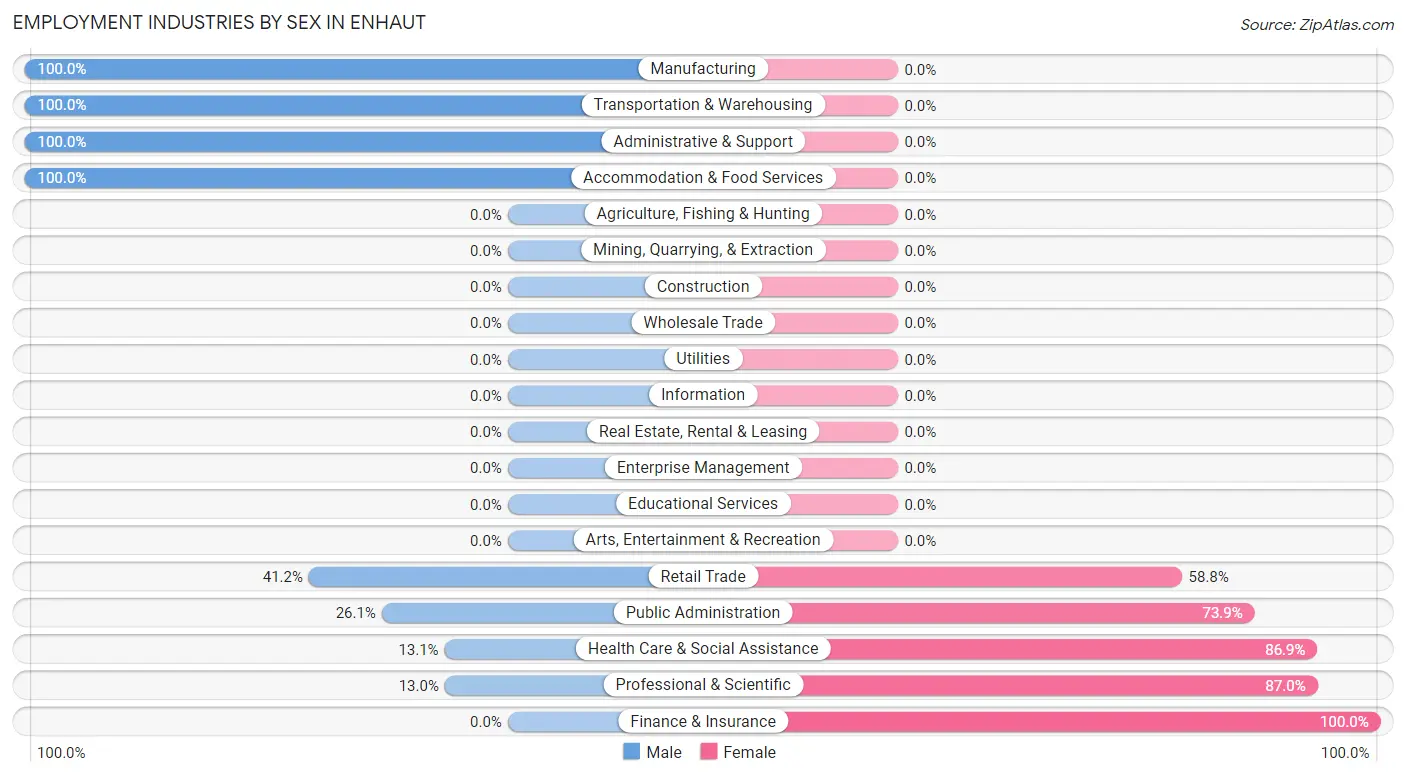
Employment Industries by Sex in Enhaut
The Enhaut industries that see more men than women are Manufacturing (100.0%), Transportation & Warehousing (100.0%), and Administrative & Support (100.0%), whereas the industries that tend to have a higher number of women are Finance & Insurance (100.0%), Professional & Scientific (87.0%), and Health Care & Social Assistance (86.9%).
| Industry | Male | Female |
| Agriculture, Fishing & Hunting | 0 (0.0%) | 0 (0.0%) |
| Mining, Quarrying, & Extraction | 0 (0.0%) | 0 (0.0%) |
| Construction | 0 (0.0%) | 0 (0.0%) |
| Manufacturing | 157 (100.0%) | 0 (0.0%) |
| Wholesale Trade | 0 (0.0%) | 0 (0.0%) |
| Retail Trade | 77 (41.2%) | 110 (58.8%) |
| Transportation & Warehousing | 66 (100.0%) | 0 (0.0%) |
| Utilities | 0 (0.0%) | 0 (0.0%) |
| Information | 0 (0.0%) | 0 (0.0%) |
| Finance & Insurance | 0 (0.0%) | 16 (100.0%) |
| Real Estate, Rental & Leasing | 0 (0.0%) | 0 (0.0%) |
| Professional & Scientific | 9 (13.0%) | 60 (87.0%) |
| Enterprise Management | 0 (0.0%) | 0 (0.0%) |
| Administrative & Support | 8 (100.0%) | 0 (0.0%) |
| Educational Services | 0 (0.0%) | 0 (0.0%) |
| Health Care & Social Assistance | 19 (13.1%) | 126 (86.9%) |
| Arts, Entertainment & Recreation | 0 (0.0%) | 0 (0.0%) |
| Accommodation & Food Services | 67 (100.0%) | 0 (0.0%) |
| Public Administration | 24 (26.1%) | 68 (73.9%) |
| Total | 507 (57.2%) | 380 (42.8%) |
Education in Enhaut
School Enrollment in Enhaut
The most common levels of schooling among the 113 students in Enhaut are middle school (81 | 71.7%), and graduate / professional (32 | 28.3%).
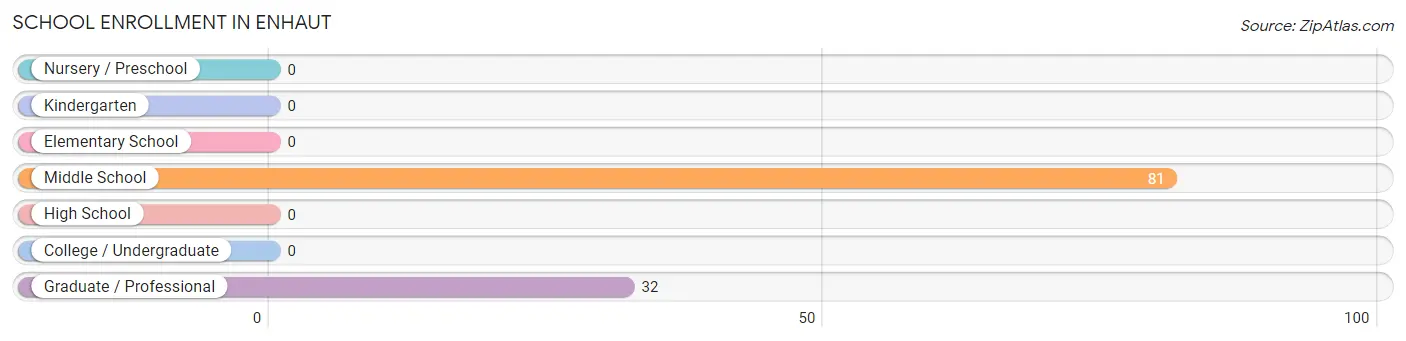
| School Level | # Students | % Students |
| Nursery / Preschool | 0 | 0.0% |
| Kindergarten | 0 | 0.0% |
| Elementary School | 0 | 0.0% |
| Middle School | 81 | 71.7% |
| High School | 0 | 0.0% |
| College / Undergraduate | 0 | 0.0% |
| Graduate / Professional | 32 | 28.3% |
| Total | 113 | 100.0% |
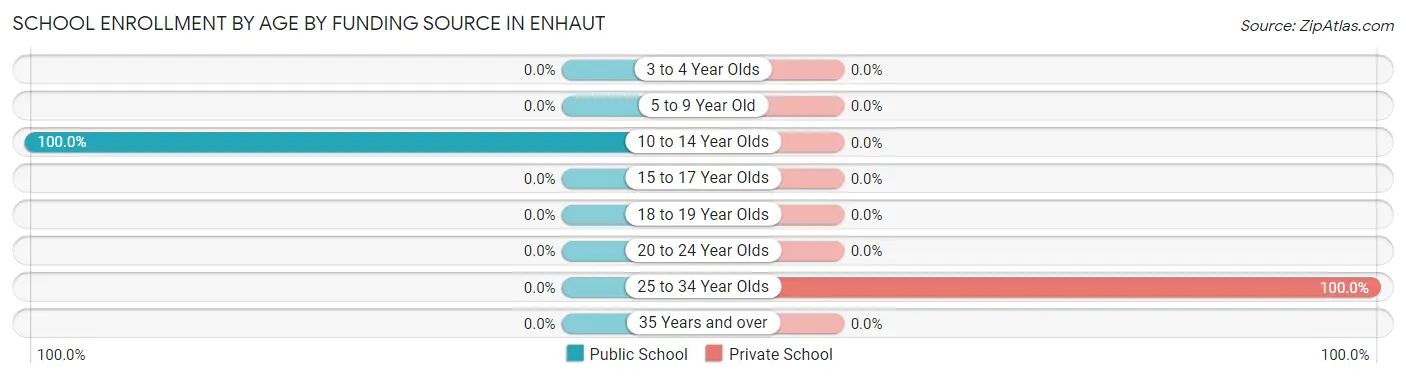
School Enrollment by Age by Funding Source in Enhaut
Out of a total of 113 students who are enrolled in schools in Enhaut, 32 (28.3%) attend a private institution, while the remaining 81 (71.7%) are enrolled in public schools. The age group of 25 to 34 year olds has the highest likelihood of being enrolled in private schools, with 32 (100.0% in the age bracket) enrolled. Conversely, the age group of 10 to 14 year olds has the lowest likelihood of being enrolled in a private school, with 81 (100.0% in the age bracket) attending a public institution.
| Age Bracket | Public School | Private School |
| 3 to 4 Year Olds | 0 (0.0%) | 0 (0.0%) |
| 5 to 9 Year Old | 0 (0.0%) | 0 (0.0%) |
| 10 to 14 Year Olds | 81 (100.0%) | 0 (0.0%) |
| 15 to 17 Year Olds | 0 (0.0%) | 0 (0.0%) |
| 18 to 19 Year Olds | 0 (0.0%) | 0 (0.0%) |
| 20 to 24 Year Olds | 0 (0.0%) | 0 (0.0%) |
| 25 to 34 Year Olds | 0 (0.0%) | 32 (100.0%) |
| 35 Years and over | 0 (0.0%) | 0 (0.0%) |
| Total | 81 (71.7%) | 32 (28.3%) |
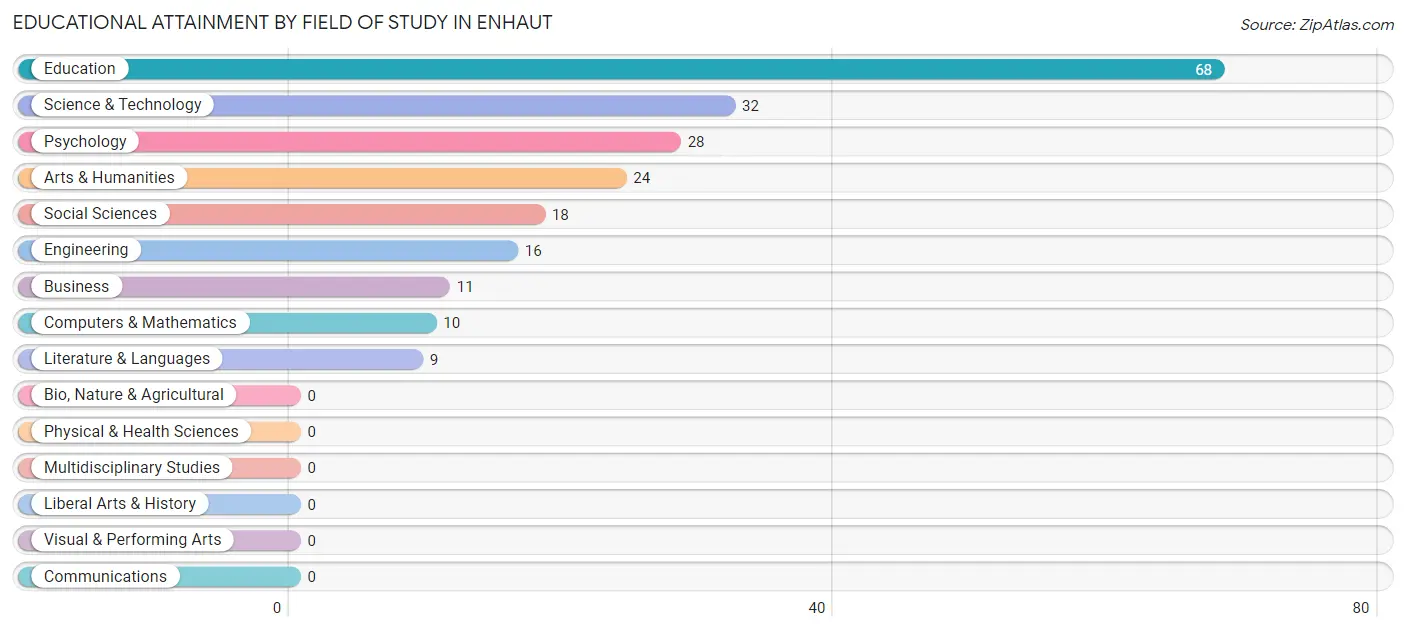
Educational Attainment by Field of Study in Enhaut
Education (68 | 31.5%), science & technology (32 | 14.8%), psychology (28 | 13.0%), arts & humanities (24 | 11.1%), and social sciences (18 | 8.3%) are the most common fields of study among 216 individuals in Enhaut who have obtained a bachelor's degree or higher.
| Field of Study | # Graduates | % Graduates |
| Computers & Mathematics | 10 | 4.6% |
| Bio, Nature & Agricultural | 0 | 0.0% |
| Physical & Health Sciences | 0 | 0.0% |
| Psychology | 28 | 13.0% |
| Social Sciences | 18 | 8.3% |
| Engineering | 16 | 7.4% |
| Multidisciplinary Studies | 0 | 0.0% |
| Science & Technology | 32 | 14.8% |
| Business | 11 | 5.1% |
| Education | 68 | 31.5% |
| Literature & Languages | 9 | 4.2% |
| Liberal Arts & History | 0 | 0.0% |
| Visual & Performing Arts | 0 | 0.0% |
| Communications | 0 | 0.0% |
| Arts & Humanities | 24 | 11.1% |
| Total | 216 | 100.0% |
Transportation & Commute in Enhaut
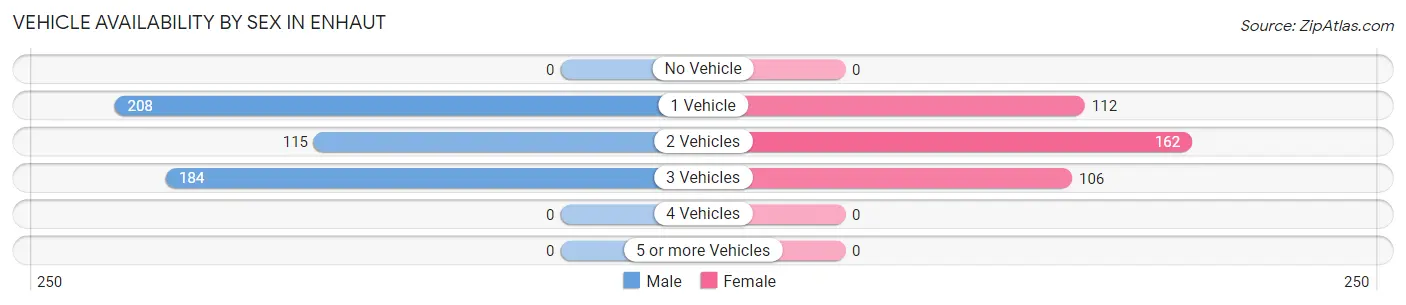
Vehicle Availability by Sex in Enhaut
The most prevalent vehicle ownership categories in Enhaut are males with 1 vehicle (208, accounting for 41.0%) and females with 1 vehicle (112, making up 54.7%).
| Vehicles Available | Male | Female |
| No Vehicle | 0 (0.0%) | 0 (0.0%) |
| 1 Vehicle | 208 (41.0%) | 112 (29.5%) |
| 2 Vehicles | 115 (22.7%) | 162 (42.6%) |
| 3 Vehicles | 184 (36.3%) | 106 (27.9%) |
| 4 Vehicles | 0 (0.0%) | 0 (0.0%) |
| 5 or more Vehicles | 0 (0.0%) | 0 (0.0%) |
| Total | 507 (100.0%) | 380 (100.0%) |
Commute Time in Enhaut
The most frequently occuring commute durations in Enhaut are 10 to 14 minutes (248 commuters, 28.8%), 15 to 19 minutes (176 commuters, 20.4%), and less than 5 minutes (141 commuters, 16.4%).
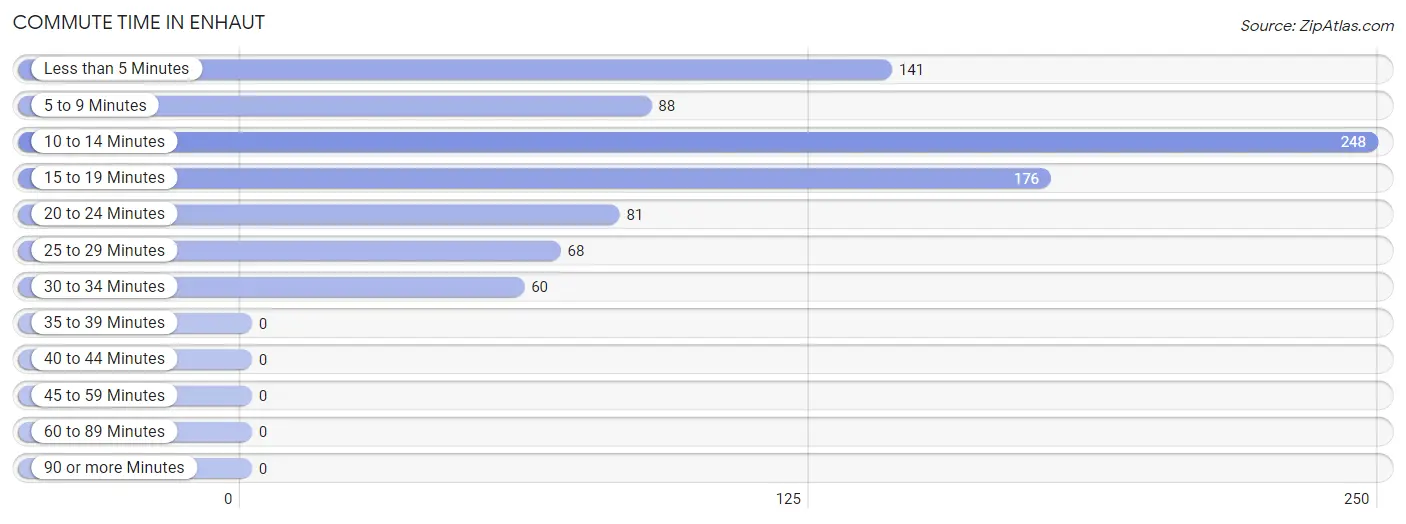
| Commute Time | # Commuters | % Commuters |
| Less than 5 Minutes | 141 | 16.4% |
| 5 to 9 Minutes | 88 | 10.2% |
| 10 to 14 Minutes | 248 | 28.8% |
| 15 to 19 Minutes | 176 | 20.4% |
| 20 to 24 Minutes | 81 | 9.4% |
| 25 to 29 Minutes | 68 | 7.9% |
| 30 to 34 Minutes | 60 | 7.0% |
| 35 to 39 Minutes | 0 | 0.0% |
| 40 to 44 Minutes | 0 | 0.0% |
| 45 to 59 Minutes | 0 | 0.0% |
| 60 to 89 Minutes | 0 | 0.0% |
| 90 or more Minutes | 0 | 0.0% |
Commute Time by Sex in Enhaut
The most common commute times in Enhaut are less than 5 minutes (141 commuters, 29.2%) for males and 10 to 14 minutes (158 commuters, 41.6%) for females.
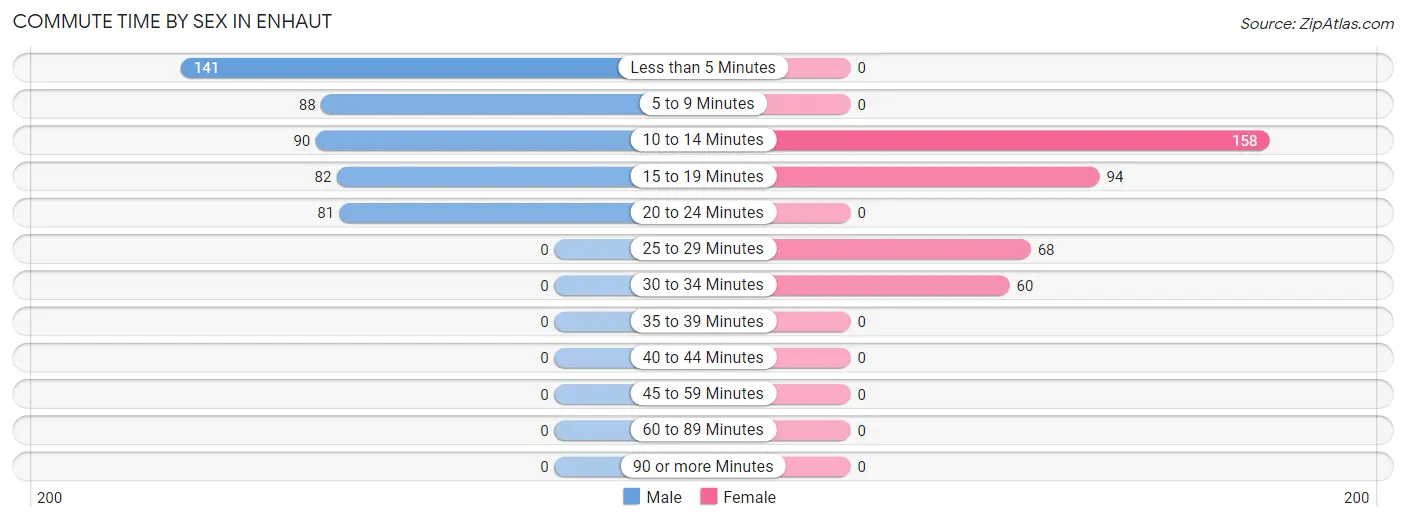
| Commute Time | Male | Female |
| Less than 5 Minutes | 141 (29.2%) | 0 (0.0%) |
| 5 to 9 Minutes | 88 (18.3%) | 0 (0.0%) |
| 10 to 14 Minutes | 90 (18.7%) | 158 (41.6%) |
| 15 to 19 Minutes | 82 (17.0%) | 94 (24.7%) |
| 20 to 24 Minutes | 81 (16.8%) | 0 (0.0%) |
| 25 to 29 Minutes | 0 (0.0%) | 68 (17.9%) |
| 30 to 34 Minutes | 0 (0.0%) | 60 (15.8%) |
| 35 to 39 Minutes | 0 (0.0%) | 0 (0.0%) |
| 40 to 44 Minutes | 0 (0.0%) | 0 (0.0%) |
| 45 to 59 Minutes | 0 (0.0%) | 0 (0.0%) |
| 60 to 89 Minutes | 0 (0.0%) | 0 (0.0%) |
| 90 or more Minutes | 0 (0.0%) | 0 (0.0%) |
Time of Departure to Work by Sex in Enhaut
The most frequent times of departure to work in Enhaut are 10:00 AM to 10:59 AM (208, 43.1%) for males and 7:30 AM to 7:59 AM (160, 42.1%) for females.
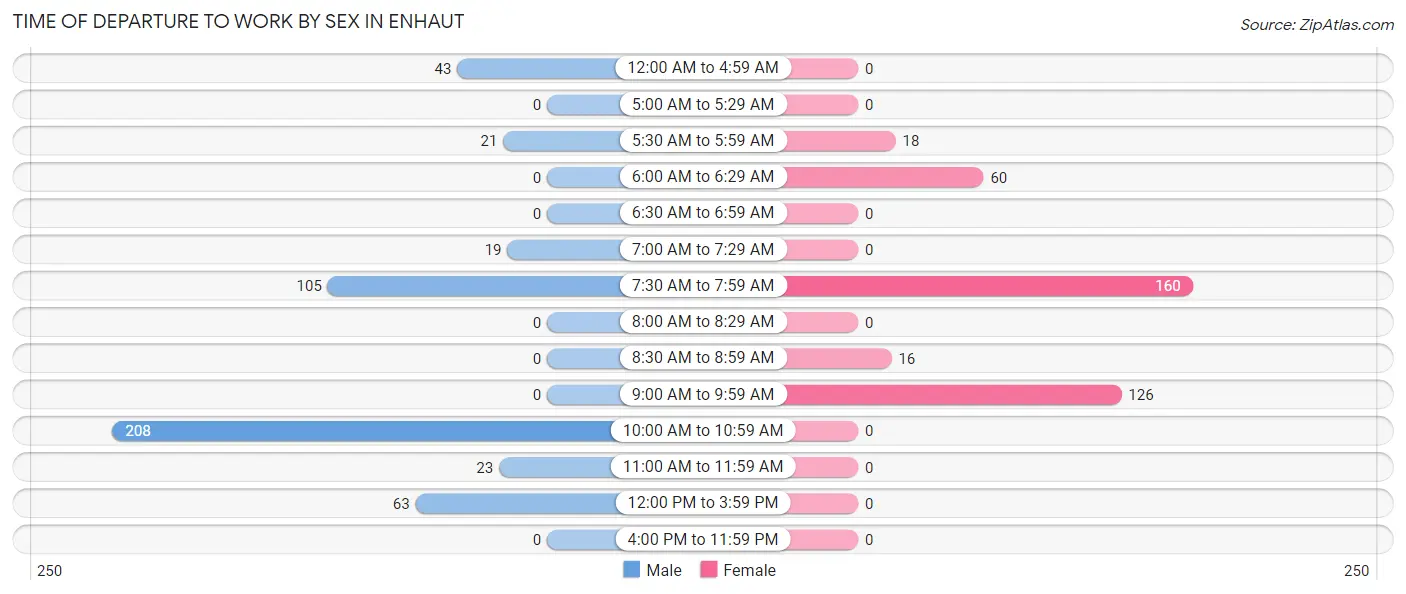
| Time of Departure | Male | Female |
| 12:00 AM to 4:59 AM | 43 (8.9%) | 0 (0.0%) |
| 5:00 AM to 5:29 AM | 0 (0.0%) | 0 (0.0%) |
| 5:30 AM to 5:59 AM | 21 (4.4%) | 18 (4.7%) |
| 6:00 AM to 6:29 AM | 0 (0.0%) | 60 (15.8%) |
| 6:30 AM to 6:59 AM | 0 (0.0%) | 0 (0.0%) |
| 7:00 AM to 7:29 AM | 19 (3.9%) | 0 (0.0%) |
| 7:30 AM to 7:59 AM | 105 (21.8%) | 160 (42.1%) |
| 8:00 AM to 8:29 AM | 0 (0.0%) | 0 (0.0%) |
| 8:30 AM to 8:59 AM | 0 (0.0%) | 16 (4.2%) |
| 9:00 AM to 9:59 AM | 0 (0.0%) | 126 (33.2%) |
| 10:00 AM to 10:59 AM | 208 (43.1%) | 0 (0.0%) |
| 11:00 AM to 11:59 AM | 23 (4.8%) | 0 (0.0%) |
| 12:00 PM to 3:59 PM | 63 (13.1%) | 0 (0.0%) |
| 4:00 PM to 11:59 PM | 0 (0.0%) | 0 (0.0%) |
| Total | 482 (100.0%) | 380 (100.0%) |
Housing Occupancy in Enhaut
Occupancy by Ownership in Enhaut
Of the total 523 dwellings in Enhaut, owner-occupied units account for 440 (84.1%), while renter-occupied units make up 83 (15.9%).
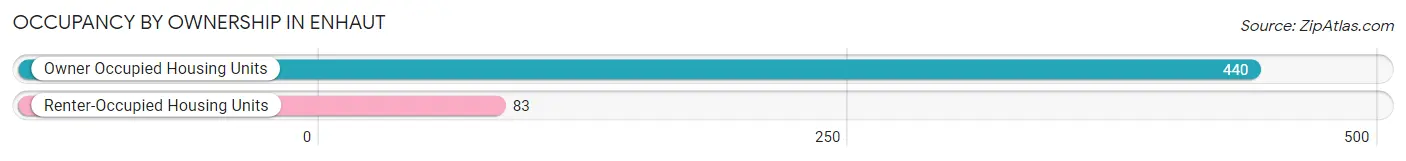
| Occupancy | # Housing Units | % Housing Units |
| Owner Occupied Housing Units | 440 | 84.1% |
| Renter-Occupied Housing Units | 83 | 15.9% |
| Total Occupied Housing Units | 523 | 100.0% |
Occupancy by Household Size in Enhaut
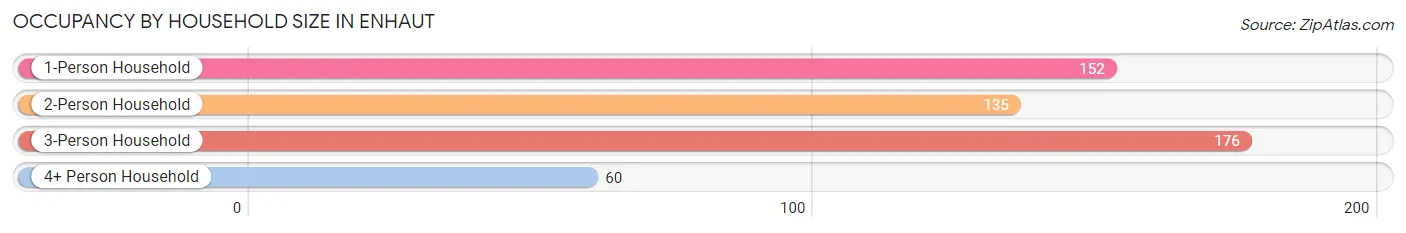
| Household Size | # Housing Units | % Housing Units |
| 1-Person Household | 152 | 29.1% |
| 2-Person Household | 135 | 25.8% |
| 3-Person Household | 176 | 33.7% |
| 4+ Person Household | 60 | 11.5% |
| Total Housing Units | 523 | 100.0% |
Occupancy by Ownership by Household Size in Enhaut
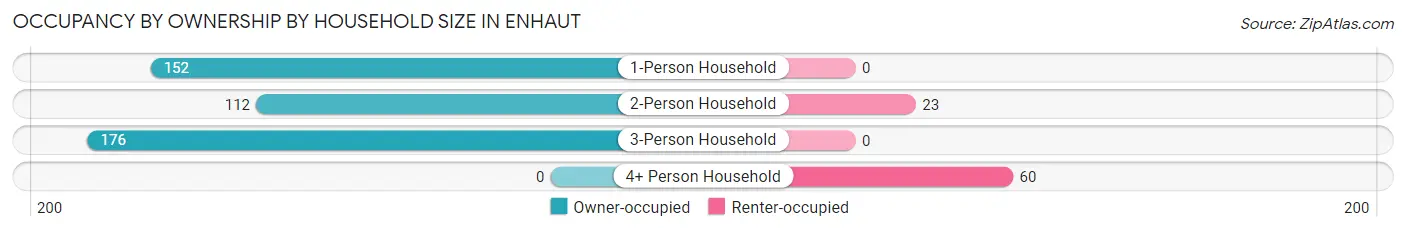
| Household Size | Owner-occupied | Renter-occupied |
| 1-Person Household | 152 (100.0%) | 0 (0.0%) |
| 2-Person Household | 112 (83.0%) | 23 (17.0%) |
| 3-Person Household | 176 (100.0%) | 0 (0.0%) |
| 4+ Person Household | 0 (0.0%) | 60 (100.0%) |
| Total Housing Units | 440 (84.1%) | 83 (15.9%) |
Occupancy by Educational Attainment in Enhaut
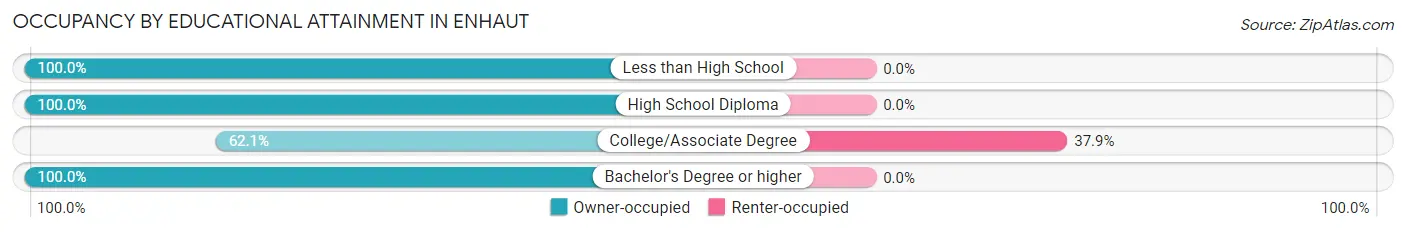
| Household Size | Owner-occupied | Renter-occupied |
| Less than High School | 21 (100.0%) | 0 (0.0%) |
| High School Diploma | 164 (100.0%) | 0 (0.0%) |
| College/Associate Degree | 136 (62.1%) | 83 (37.9%) |
| Bachelor's Degree or higher | 119 (100.0%) | 0 (0.0%) |
Occupancy by Age of Householder in Enhaut
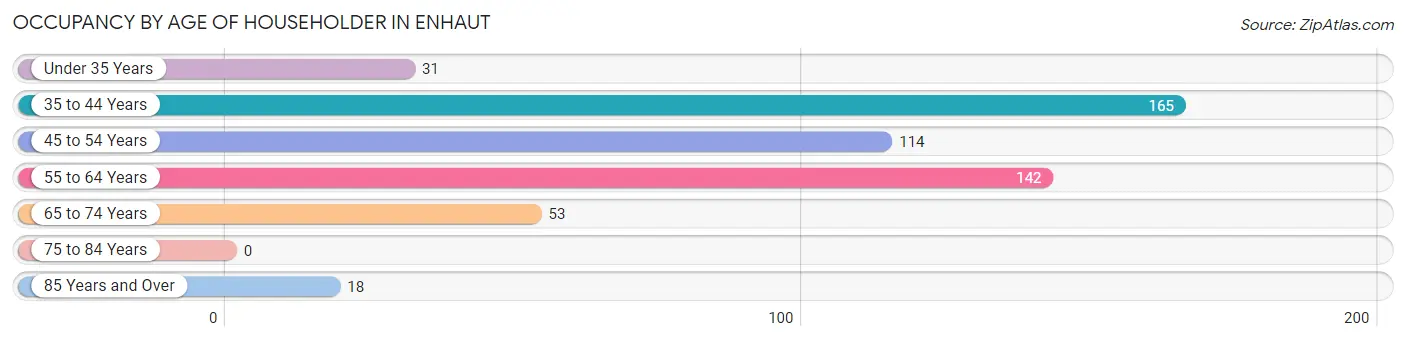
| Age Bracket | # Households | % Households |
| Under 35 Years | 31 | 5.9% |
| 35 to 44 Years | 165 | 31.6% |
| 45 to 54 Years | 114 | 21.8% |
| 55 to 64 Years | 142 | 27.2% |
| 65 to 74 Years | 53 | 10.1% |
| 75 to 84 Years | 0 | 0.0% |
| 85 Years and Over | 18 | 3.4% |
| Total | 523 | 100.0% |
Housing Finances in Enhaut
Median Income by Occupancy in Enhaut
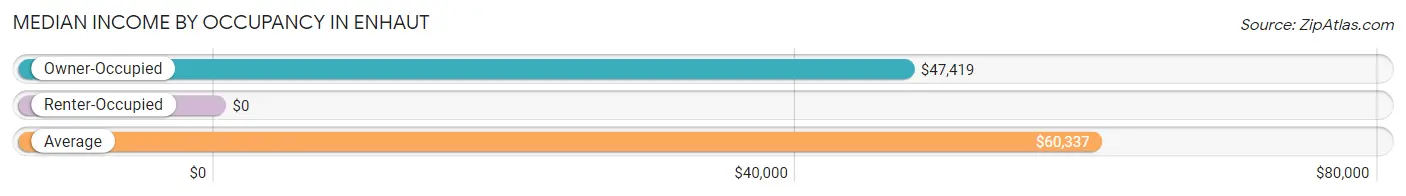
| Occupancy Type | # Households | Median Income |
| Owner-Occupied | 440 (84.1%) | $47,419 |
| Renter-Occupied | 83 (15.9%) | $0 |
| Average | 523 (100.0%) | $60,337 |
Occupancy by Householder Income Bracket in Enhaut
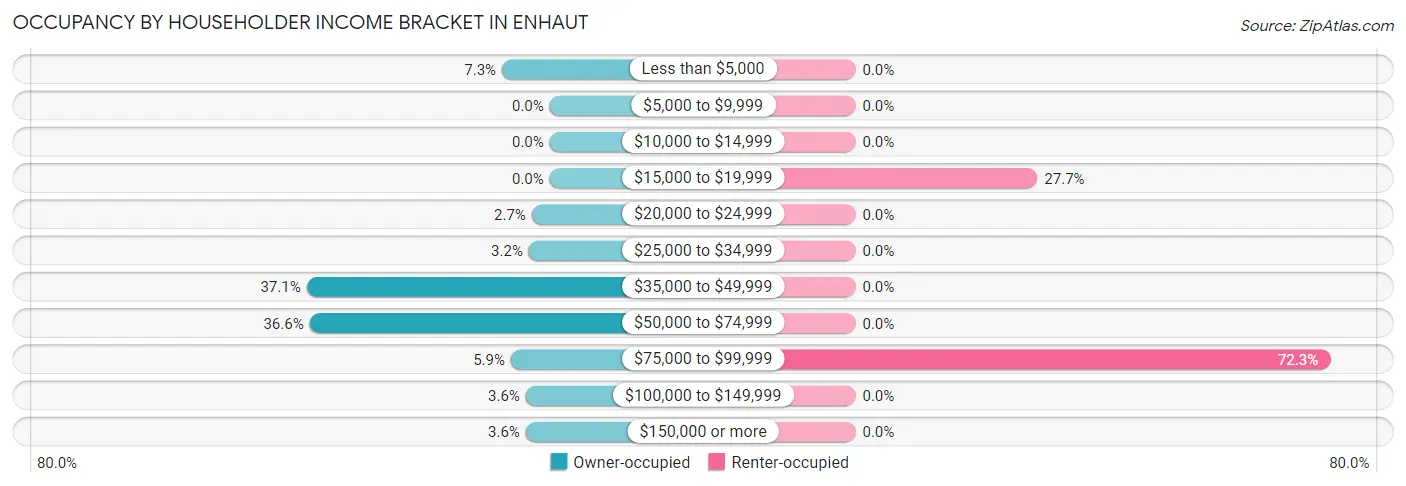
| Income Bracket | Owner-occupied | Renter-occupied |
| Less than $5,000 | 32 (7.3%) | 0 (0.0%) |
| $5,000 to $9,999 | 0 (0.0%) | 0 (0.0%) |
| $10,000 to $14,999 | 0 (0.0%) | 0 (0.0%) |
| $15,000 to $19,999 | 0 (0.0%) | 23 (27.7%) |
| $20,000 to $24,999 | 12 (2.7%) | 0 (0.0%) |
| $25,000 to $34,999 | 14 (3.2%) | 0 (0.0%) |
| $35,000 to $49,999 | 163 (37.0%) | 0 (0.0%) |
| $50,000 to $74,999 | 161 (36.6%) | 0 (0.0%) |
| $75,000 to $99,999 | 26 (5.9%) | 60 (72.3%) |
| $100,000 to $149,999 | 16 (3.6%) | 0 (0.0%) |
| $150,000 or more | 16 (3.6%) | 0 (0.0%) |
| Total | 440 (100.0%) | 83 (100.0%) |
Monthly Housing Cost Tiers in Enhaut
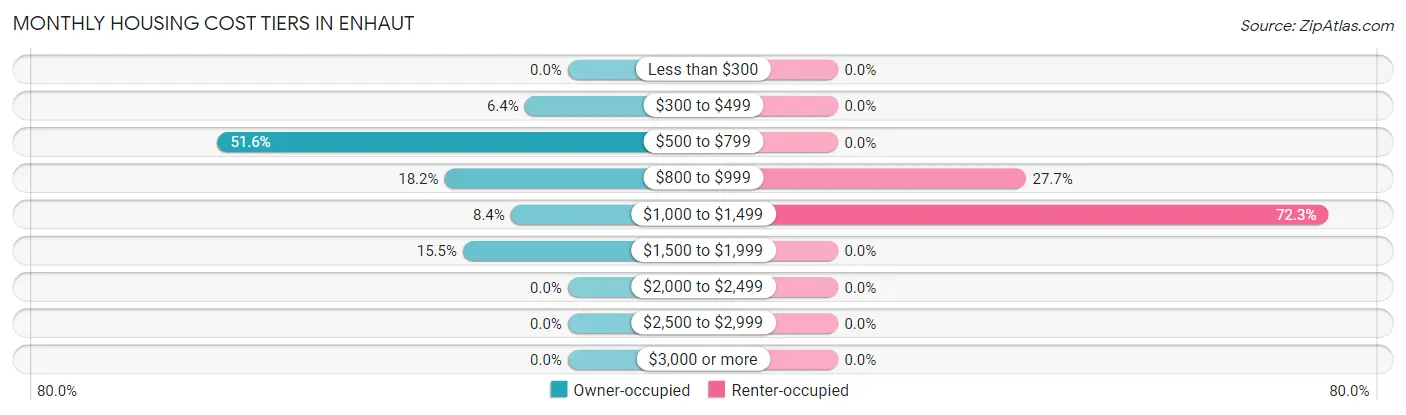
| Monthly Cost | Owner-occupied | Renter-occupied |
| Less than $300 | 0 (0.0%) | 0 (0.0%) |
| $300 to $499 | 28 (6.4%) | 0 (0.0%) |
| $500 to $799 | 227 (51.6%) | 0 (0.0%) |
| $800 to $999 | 80 (18.2%) | 23 (27.7%) |
| $1,000 to $1,499 | 37 (8.4%) | 60 (72.3%) |
| $1,500 to $1,999 | 68 (15.4%) | 0 (0.0%) |
| $2,000 to $2,499 | 0 (0.0%) | 0 (0.0%) |
| $2,500 to $2,999 | 0 (0.0%) | 0 (0.0%) |
| $3,000 or more | 0 (0.0%) | 0 (0.0%) |
| Total | 440 (100.0%) | 83 (100.0%) |
Physical Housing Characteristics in Enhaut
Housing Structures in Enhaut
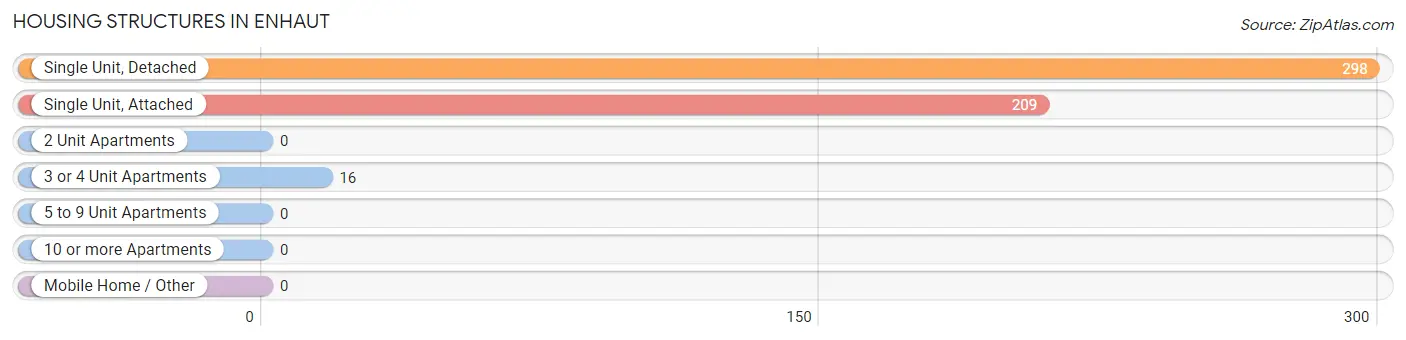
| Structure Type | # Housing Units | % Housing Units |
| Single Unit, Detached | 298 | 57.0% |
| Single Unit, Attached | 209 | 40.0% |
| 2 Unit Apartments | 0 | 0.0% |
| 3 or 4 Unit Apartments | 16 | 3.1% |
| 5 to 9 Unit Apartments | 0 | 0.0% |
| 10 or more Apartments | 0 | 0.0% |
| Mobile Home / Other | 0 | 0.0% |
| Total | 523 | 100.0% |
Housing Structures by Occupancy in Enhaut
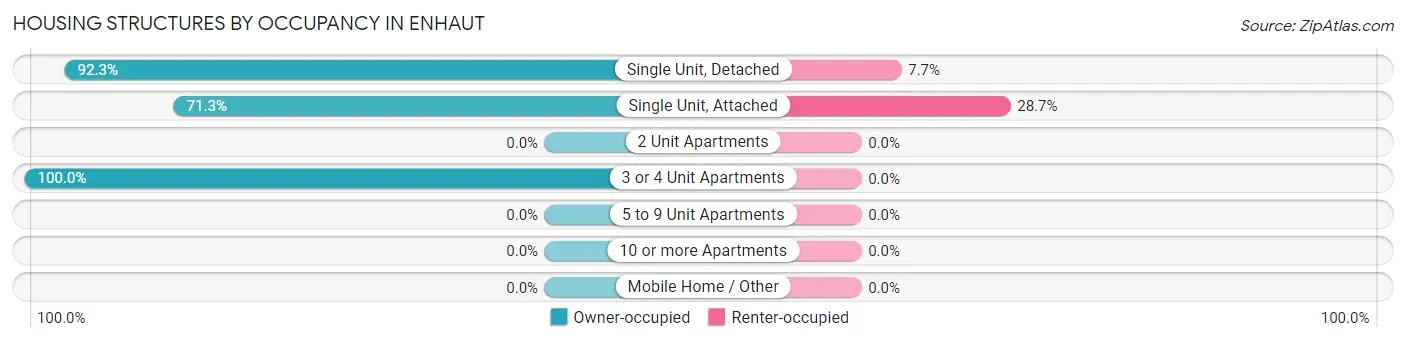
| Structure Type | Owner-occupied | Renter-occupied |
| Single Unit, Detached | 275 (92.3%) | 23 (7.7%) |
| Single Unit, Attached | 149 (71.3%) | 60 (28.7%) |
| 2 Unit Apartments | 0 (0.0%) | 0 (0.0%) |
| 3 or 4 Unit Apartments | 16 (100.0%) | 0 (0.0%) |
| 5 to 9 Unit Apartments | 0 (0.0%) | 0 (0.0%) |
| 10 or more Apartments | 0 (0.0%) | 0 (0.0%) |
| Mobile Home / Other | 0 (0.0%) | 0 (0.0%) |
| Total | 440 (84.1%) | 83 (15.9%) |
Housing Structures by Number of Rooms in Enhaut
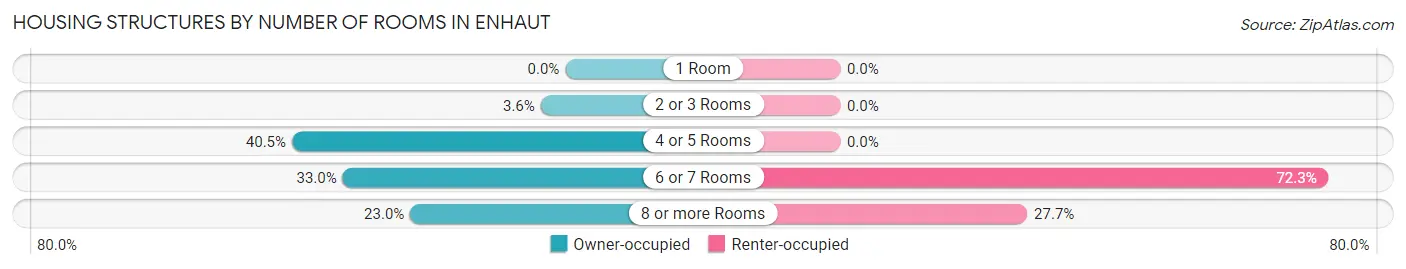
| Number of Rooms | Owner-occupied | Renter-occupied |
| 1 Room | 0 (0.0%) | 0 (0.0%) |
| 2 or 3 Rooms | 16 (3.6%) | 0 (0.0%) |
| 4 or 5 Rooms | 178 (40.5%) | 0 (0.0%) |
| 6 or 7 Rooms | 145 (33.0%) | 60 (72.3%) |
| 8 or more Rooms | 101 (23.0%) | 23 (27.7%) |
| Total | 440 (100.0%) | 83 (100.0%) |
Housing Structure by Heating Type in Enhaut
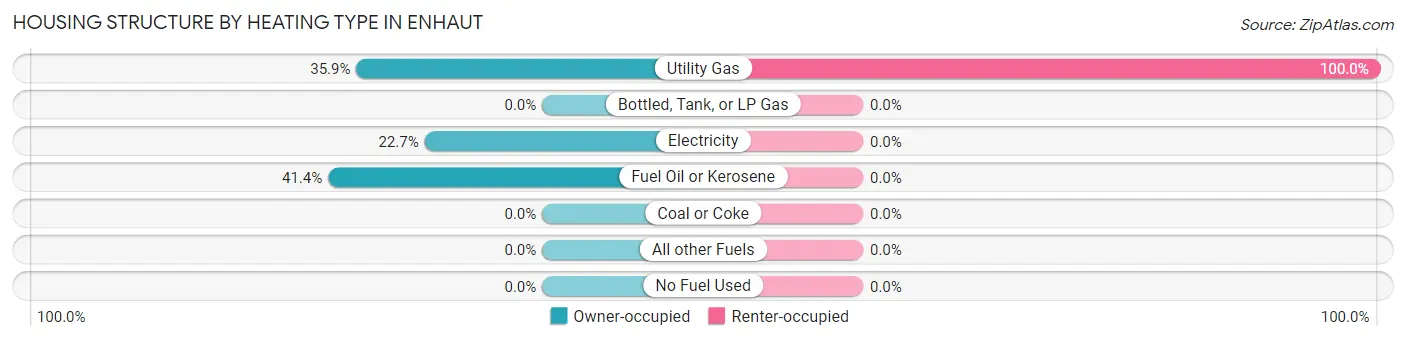
| Heating Type | Owner-occupied | Renter-occupied |
| Utility Gas | 158 (35.9%) | 83 (100.0%) |
| Bottled, Tank, or LP Gas | 0 (0.0%) | 0 (0.0%) |
| Electricity | 100 (22.7%) | 0 (0.0%) |
| Fuel Oil or Kerosene | 182 (41.4%) | 0 (0.0%) |
| Coal or Coke | 0 (0.0%) | 0 (0.0%) |
| All other Fuels | 0 (0.0%) | 0 (0.0%) |
| No Fuel Used | 0 (0.0%) | 0 (0.0%) |
| Total | 440 (100.0%) | 83 (100.0%) |
Household Vehicle Usage in Enhaut
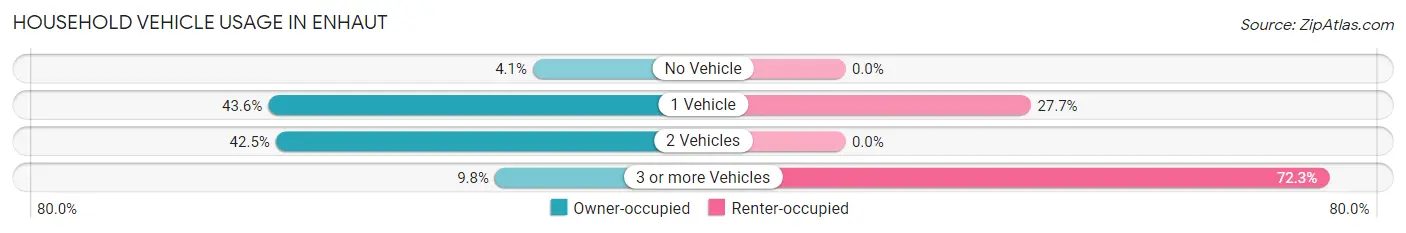
| Vehicles per Household | Owner-occupied | Renter-occupied |
| No Vehicle | 18 (4.1%) | 0 (0.0%) |
| 1 Vehicle | 192 (43.6%) | 23 (27.7%) |
| 2 Vehicles | 187 (42.5%) | 0 (0.0%) |
| 3 or more Vehicles | 43 (9.8%) | 60 (72.3%) |
| Total | 440 (100.0%) | 83 (100.0%) |
Real Estate & Mortgages in Enhaut
Real Estate and Mortgage Overview in Enhaut
| Characteristic | Without Mortgage | With Mortgage |
| Housing Units | 97 | 343 |
| Median Property Value | $118,200 | $89,500 |
| Median Household Income | - | - |
| Monthly Housing Costs | $539 | $0 |
| Real Estate Taxes | $2,365 | $9 |
Property Value by Mortgage Status in Enhaut
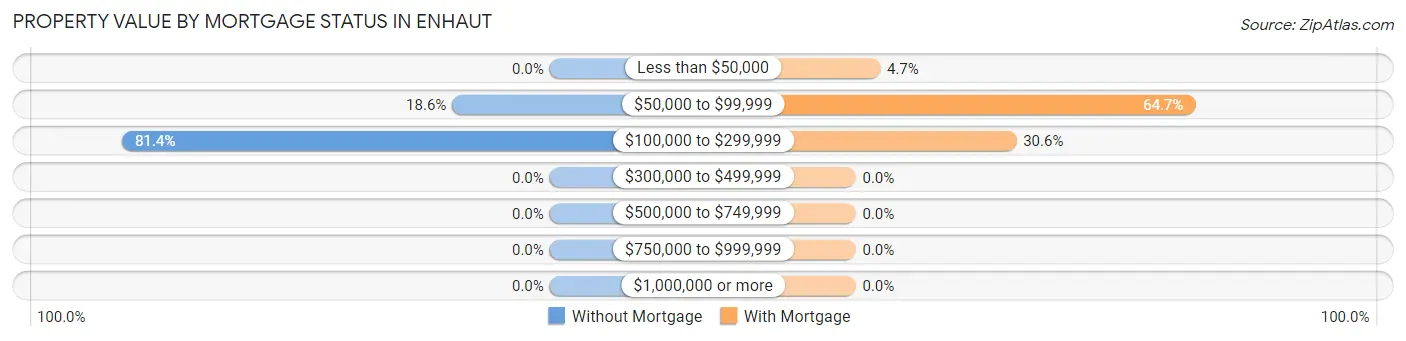
| Property Value | Without Mortgage | With Mortgage |
| Less than $50,000 | 0 (0.0%) | 16 (4.7%) |
| $50,000 to $99,999 | 18 (18.6%) | 222 (64.7%) |
| $100,000 to $299,999 | 79 (81.4%) | 105 (30.6%) |
| $300,000 to $499,999 | 0 (0.0%) | 0 (0.0%) |
| $500,000 to $749,999 | 0 (0.0%) | 0 (0.0%) |
| $750,000 to $999,999 | 0 (0.0%) | 0 (0.0%) |
| $1,000,000 or more | 0 (0.0%) | 0 (0.0%) |
| Total | 97 (100.0%) | 343 (100.0%) |
Household Income by Mortgage Status in Enhaut
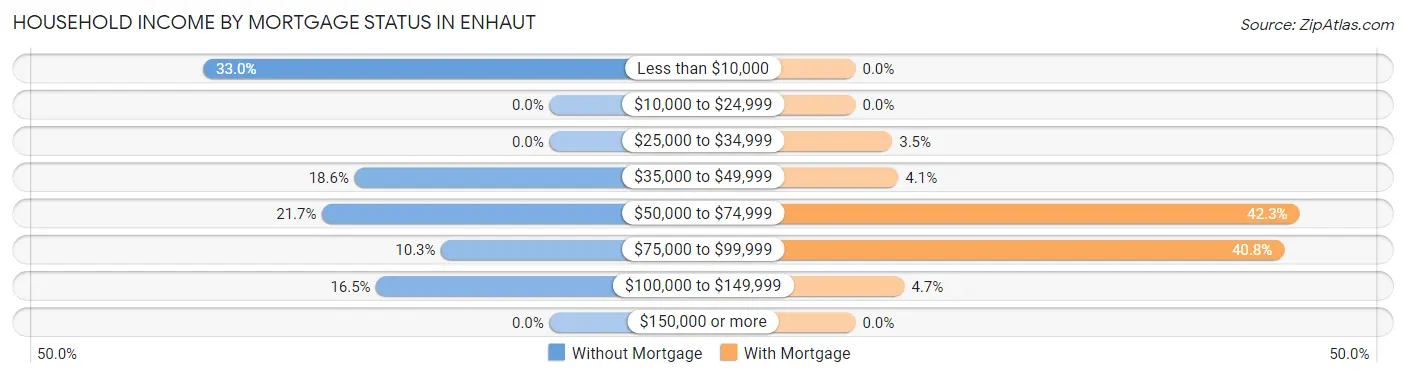
| Household Income | Without Mortgage | With Mortgage |
| Less than $10,000 | 32 (33.0%) | 0 (0.0%) |
| $10,000 to $24,999 | 0 (0.0%) | 0 (0.0%) |
| $25,000 to $34,999 | 0 (0.0%) | 12 (3.5%) |
| $35,000 to $49,999 | 18 (18.6%) | 14 (4.1%) |
| $50,000 to $74,999 | 21 (21.6%) | 145 (42.3%) |
| $75,000 to $99,999 | 10 (10.3%) | 140 (40.8%) |
| $100,000 to $149,999 | 16 (16.5%) | 16 (4.7%) |
| $150,000 or more | 0 (0.0%) | 0 (0.0%) |
| Total | 97 (100.0%) | 343 (100.0%) |
Property Value to Household Income Ratio in Enhaut
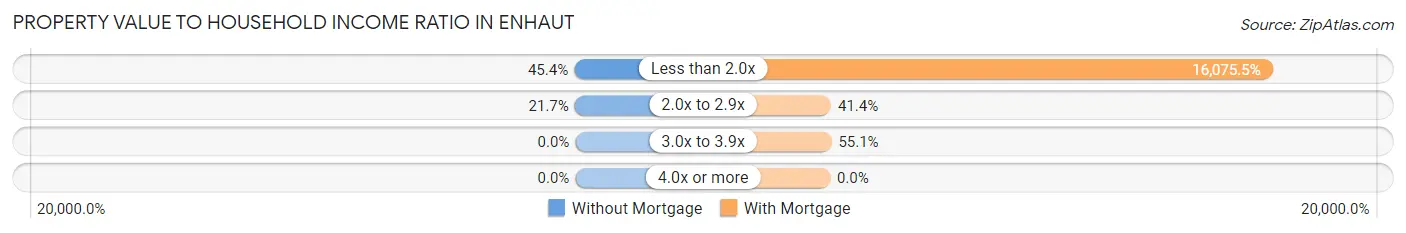
| Value-to-Income Ratio | Without Mortgage | With Mortgage |
| Less than 2.0x | 44 (45.4%) | 55,139 (16,075.5%) |
| 2.0x to 2.9x | 21 (21.6%) | 142 (41.4%) |
| 3.0x to 3.9x | 0 (0.0%) | 189 (55.1%) |
| 4.0x or more | 0 (0.0%) | 0 (0.0%) |
| Total | 97 (100.0%) | 343 (100.0%) |
Real Estate Taxes by Mortgage Status in Enhaut
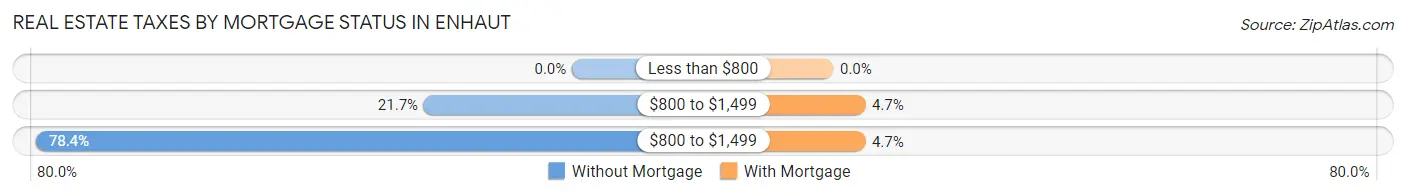
| Property Taxes | Without Mortgage | With Mortgage |
| Less than $800 | 0 (0.0%) | 0 (0.0%) |
| $800 to $1,499 | 21 (21.6%) | 16 (4.7%) |
| $800 to $1,499 | 76 (78.3%) | 16 (4.7%) |
| Total | 97 (100.0%) | 343 (100.0%) |
Health & Disability in Enhaut
Health Insurance Coverage by Age in Enhaut
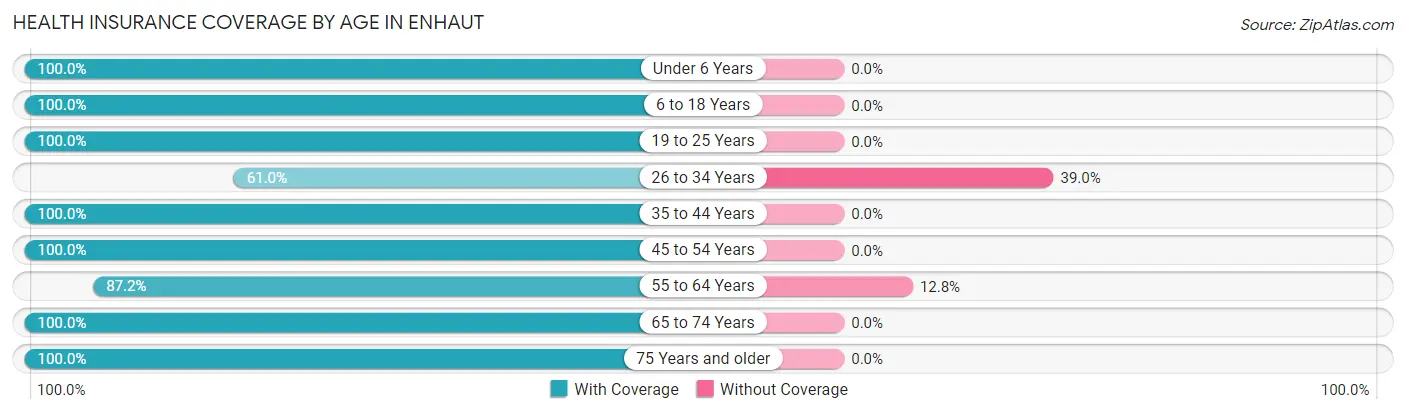
| Age Bracket | With Coverage | Without Coverage |
| Under 6 Years | 46 (100.0%) | 0 (0.0%) |
| 6 to 18 Years | 81 (100.0%) | 0 (0.0%) |
| 19 to 25 Years | 221 (100.0%) | 0 (0.0%) |
| 26 to 34 Years | 100 (61.0%) | 64 (39.0%) |
| 35 to 44 Years | 232 (100.0%) | 0 (0.0%) |
| 45 to 54 Years | 186 (100.0%) | 0 (0.0%) |
| 55 to 64 Years | 184 (87.2%) | 27 (12.8%) |
| 65 to 74 Years | 93 (100.0%) | 0 (0.0%) |
| 75 Years and older | 18 (100.0%) | 0 (0.0%) |
| Total | 1,161 (92.7%) | 91 (7.3%) |
Health Insurance Coverage by Citizenship Status in Enhaut
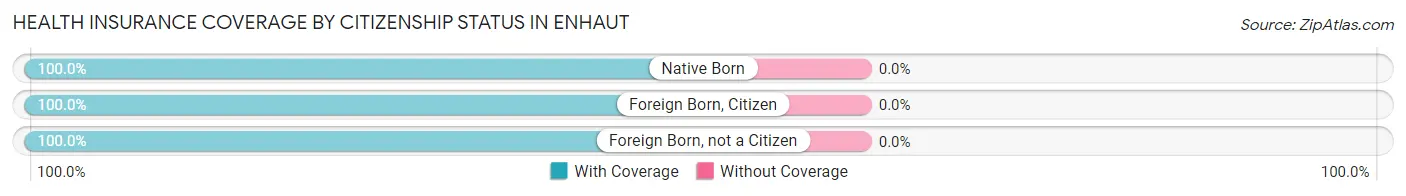
| Citizenship Status | With Coverage | Without Coverage |
| Native Born | 46 (100.0%) | 0 (0.0%) |
| Foreign Born, Citizen | 81 (100.0%) | 0 (0.0%) |
| Foreign Born, not a Citizen | 221 (100.0%) | 0 (0.0%) |
Health Insurance Coverage by Household Income in Enhaut
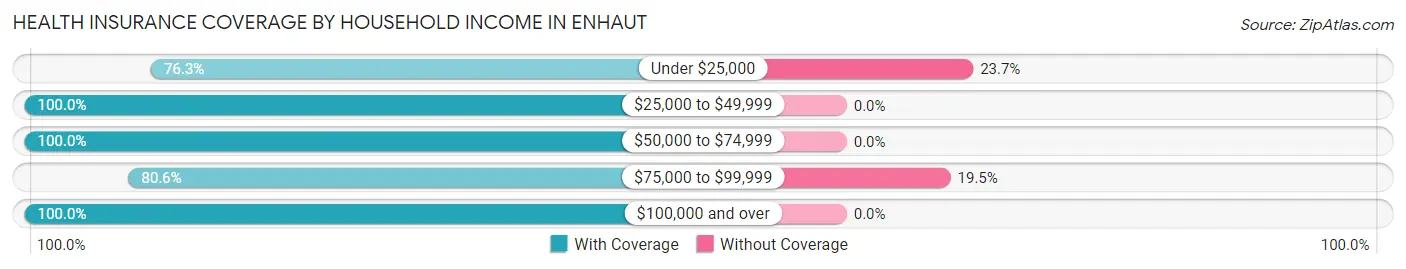
| Household Income | With Coverage | Without Coverage |
| Under $25,000 | 87 (76.3%) | 27 (23.7%) |
| $25,000 to $49,999 | 408 (100.0%) | 0 (0.0%) |
| $50,000 to $74,999 | 329 (100.0%) | 0 (0.0%) |
| $75,000 to $99,999 | 265 (80.5%) | 64 (19.5%) |
| $100,000 and over | 72 (100.0%) | 0 (0.0%) |
Public vs Private Health Insurance Coverage by Age in Enhaut
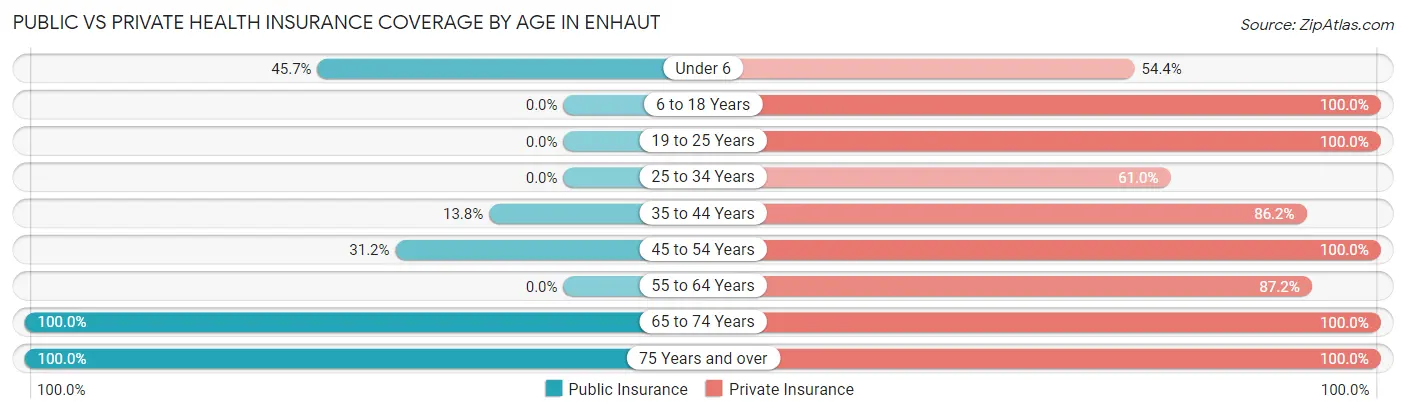
| Age Bracket | Public Insurance | Private Insurance |
| Under 6 | 21 (45.7%) | 25 (54.3%) |
| 6 to 18 Years | 0 (0.0%) | 81 (100.0%) |
| 19 to 25 Years | 0 (0.0%) | 221 (100.0%) |
| 25 to 34 Years | 0 (0.0%) | 100 (61.0%) |
| 35 to 44 Years | 32 (13.8%) | 200 (86.2%) |
| 45 to 54 Years | 58 (31.2%) | 186 (100.0%) |
| 55 to 64 Years | 0 (0.0%) | 184 (87.2%) |
| 65 to 74 Years | 93 (100.0%) | 93 (100.0%) |
| 75 Years and over | 18 (100.0%) | 18 (100.0%) |
| Total | 222 (17.7%) | 1,108 (88.5%) |
Disability Status by Sex by Age in Enhaut
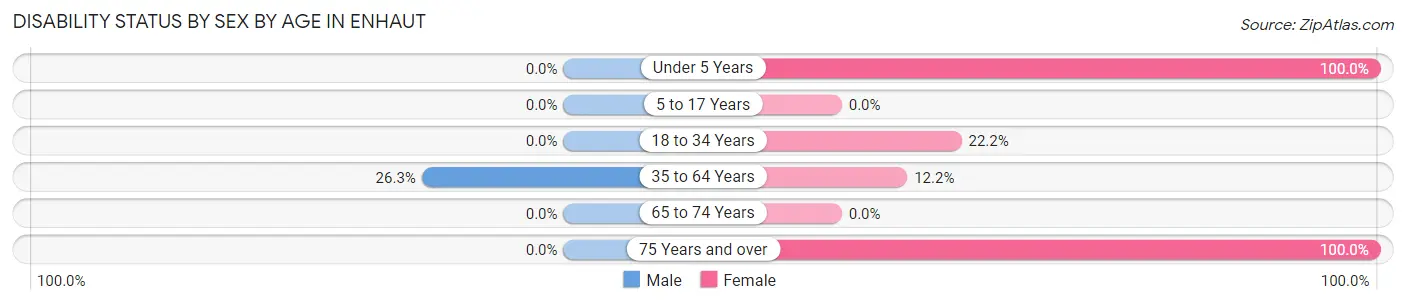
| Age Bracket | Male | Female |
| Under 5 Years | 0 (0.0%) | 21 (100.0%) |
| 5 to 17 Years | 0 (0.0%) | 0 (0.0%) |
| 18 to 34 Years | 0 (0.0%) | 18 (22.2%) |
| 35 to 64 Years | 81 (26.3%) | 39 (12.1%) |
| 65 to 74 Years | 0 (0.0%) | 0 (0.0%) |
| 75 Years and over | 0 (0.0%) | 18 (100.0%) |
Disability Class by Sex by Age in Enhaut
Disability Class: Hearing Difficulty
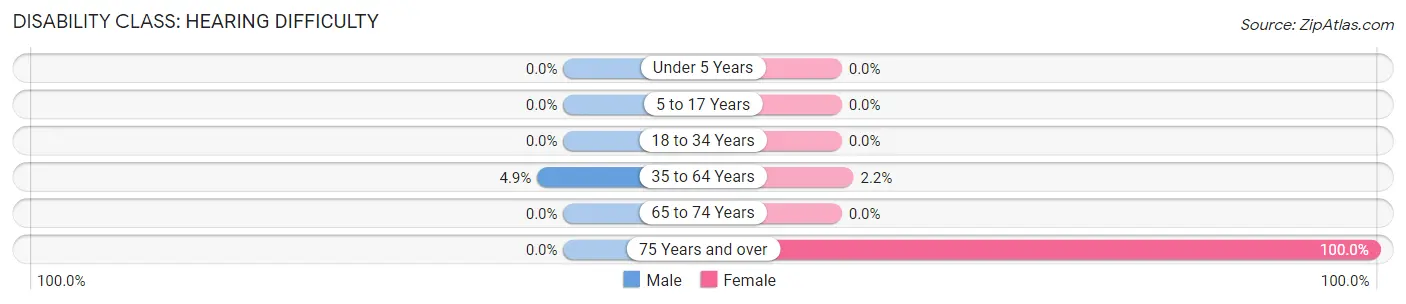
| Age Bracket | Male | Female |
| Under 5 Years | 0 (0.0%) | 0 (0.0%) |
| 5 to 17 Years | 0 (0.0%) | 0 (0.0%) |
| 18 to 34 Years | 0 (0.0%) | 0 (0.0%) |
| 35 to 64 Years | 15 (4.9%) | 7 (2.2%) |
| 65 to 74 Years | 0 (0.0%) | 0 (0.0%) |
| 75 Years and over | 0 (0.0%) | 18 (100.0%) |
Disability Class: Vision Difficulty
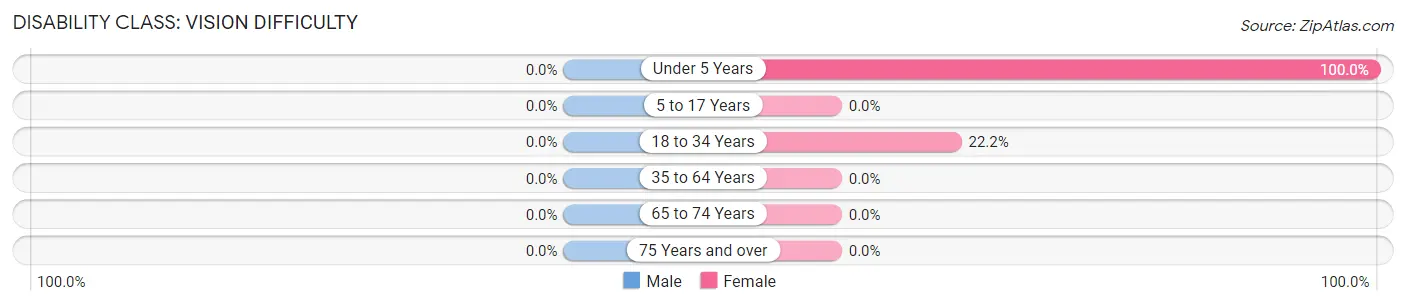
| Age Bracket | Male | Female |
| Under 5 Years | 0 (0.0%) | 21 (100.0%) |
| 5 to 17 Years | 0 (0.0%) | 0 (0.0%) |
| 18 to 34 Years | 0 (0.0%) | 18 (22.2%) |
| 35 to 64 Years | 0 (0.0%) | 0 (0.0%) |
| 65 to 74 Years | 0 (0.0%) | 0 (0.0%) |
| 75 Years and over | 0 (0.0%) | 0 (0.0%) |
Disability Class: Cognitive Difficulty
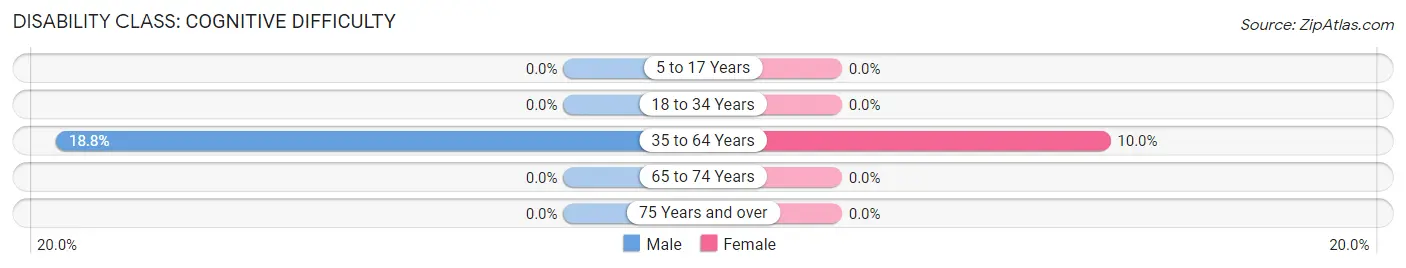
| Age Bracket | Male | Female |
| 5 to 17 Years | 0 (0.0%) | 0 (0.0%) |
| 18 to 34 Years | 0 (0.0%) | 0 (0.0%) |
| 35 to 64 Years | 58 (18.8%) | 32 (10.0%) |
| 65 to 74 Years | 0 (0.0%) | 0 (0.0%) |
| 75 Years and over | 0 (0.0%) | 0 (0.0%) |
Disability Class: Ambulatory Difficulty
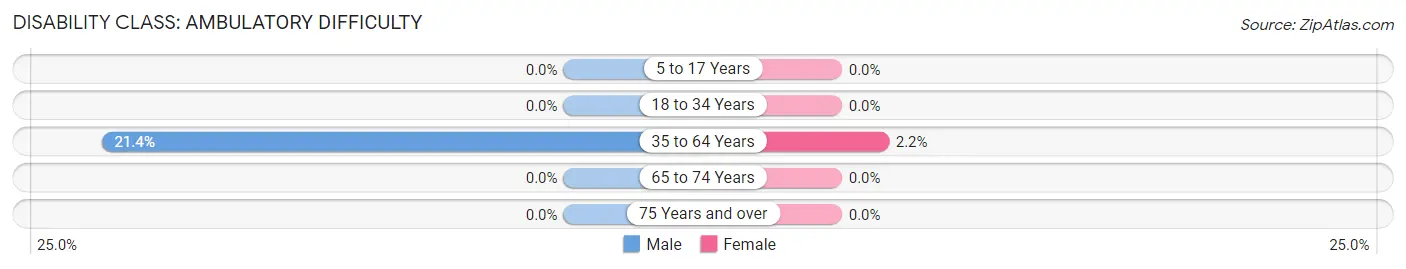
| Age Bracket | Male | Female |
| 5 to 17 Years | 0 (0.0%) | 0 (0.0%) |
| 18 to 34 Years | 0 (0.0%) | 0 (0.0%) |
| 35 to 64 Years | 66 (21.4%) | 7 (2.2%) |
| 65 to 74 Years | 0 (0.0%) | 0 (0.0%) |
| 75 Years and over | 0 (0.0%) | 0 (0.0%) |
Disability Class: Self-Care Difficulty
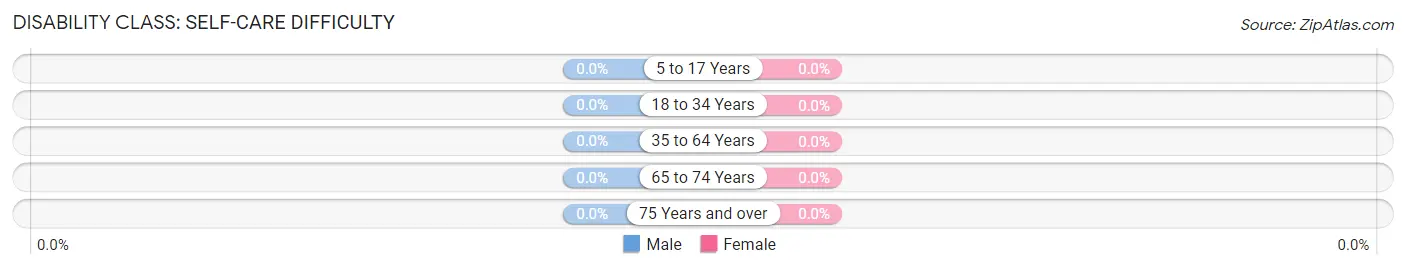
| Age Bracket | Male | Female |
| 5 to 17 Years | 0 (0.0%) | 0 (0.0%) |
| 18 to 34 Years | 0 (0.0%) | 0 (0.0%) |
| 35 to 64 Years | 0 (0.0%) | 0 (0.0%) |
| 65 to 74 Years | 0 (0.0%) | 0 (0.0%) |
| 75 Years and over | 0 (0.0%) | 0 (0.0%) |
Technology Access in Enhaut
Computing Device Access in Enhaut
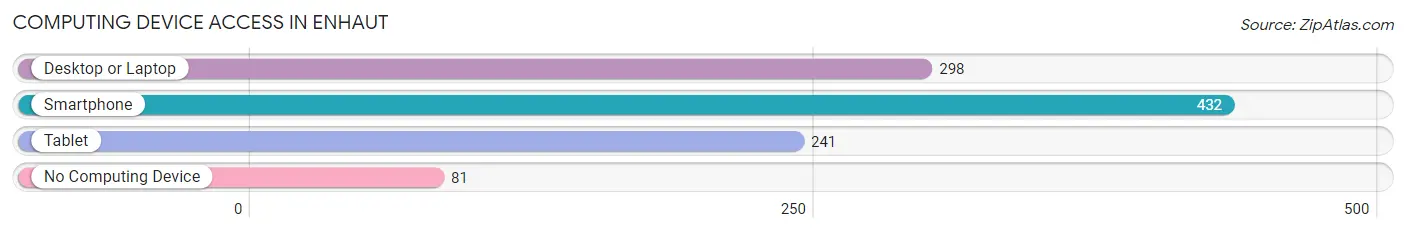
| Device Type | # Households | % Households |
| Desktop or Laptop | 298 | 57.0% |
| Smartphone | 432 | 82.6% |
| Tablet | 241 | 46.1% |
| No Computing Device | 81 | 15.5% |
| Total | 523 | 100.0% |
Internet Access in Enhaut
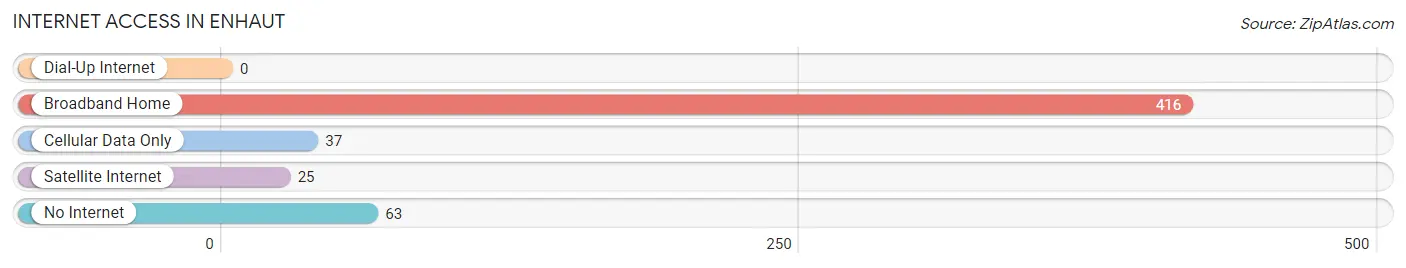
| Internet Type | # Households | % Households |
| Dial-Up Internet | 0 | 0.0% |
| Broadband Home | 416 | 79.5% |
| Cellular Data Only | 37 | 7.1% |
| Satellite Internet | 25 | 4.8% |
| No Internet | 63 | 12.0% |
| Total | 523 | 100.0% |
Enhaut Summary
Hautes-Pyrénées is a department in the Occitanie region of southwestern France. It is bordered by the departments of Aude, Ariège, Haute-Garonne, Tarn, and Aveyron. The department is named after the Pyrénées mountain range, which forms its northern border. The capital of the department is Tarbes.
Geography
Hautes-Pyrénées is located in the southwestern corner of France, and is bordered by the departments of Aude, Ariège, Haute-Garonne, Tarn, and Aveyron. The department is named after the Pyrénées mountain range, which forms its northern border. The highest point in the department is the Pic du Midi de Bigorre, which stands at 2,877 meters (9,436 feet). The department is divided into two distinct regions: the High Pyrenees and the Low Pyrenees. The High Pyrenees is characterized by its rugged terrain and is home to the Pic du Midi de Bigorre. The Low Pyrenees is characterized by its rolling hills and is home to the city of Tarbes.
History
Hautes-Pyrénées has a long and rich history. The area was first inhabited by the Gauls, who were later conquered by the Romans. During the Middle Ages, the area was divided into several small fiefdoms, which were eventually unified under the rule of the Counts of Foix. In the 16th century, the area was annexed by France and became part of the province of Languedoc. During the French Revolution, the area was divided into two departments: Hautes-Pyrénées and Basses-Pyrénées. The two departments were reunited in 1814.
Economy
Hautes-Pyrénées has a diverse economy, with a mix of agriculture, industry, and tourism. Agriculture is the main economic activity in the department, with the main crops being wheat, barley, oats, and potatoes. Livestock farming is also important, with sheep, cattle, and pigs being the main animals raised. Industry is also important, with the main industries being textiles, food processing, and electronics. Tourism is also an important part of the economy, with the department being home to several ski resorts and other attractions.
Demographics
Hautes-Pyrénées has a population of approximately 300,000 people. The majority of the population is French, with a small minority of Spanish and Basque speakers. The department is predominantly Roman Catholic, with a small minority of Protestants. The official language of the department is French.
Hautes-Pyrénées is a beautiful and diverse department with a rich history and culture. It is home to a variety of landscapes, from the rugged High Pyrenees to the rolling hills of the Low Pyrenees. The economy is diverse, with agriculture, industry, and tourism all playing an important role. The population is predominantly French, with a small minority of Spanish and Basque speakers. Hautes-Pyrénées is a great place to visit and explore, and is sure to provide an unforgettable experience.
Common Questions
What is Per Capita Income in Enhaut?
Per Capita income in Enhaut is $23,979.
What is the Median Household income in Enhaut?
Median Household Income in Enhaut is $60,337.
What is Inequality or Gini Index in Enhaut?
Inequality or Gini Index in Enhaut is 0.29.
What is the Total Population of Enhaut?
Total Population of Enhaut is 1,252.
What is the Total Male Population of Enhaut?
Total Male Population of Enhaut is 690.
What is the Total Female Population of Enhaut?
Total Female Population of Enhaut is 562.
What is the Ratio of Males per 100 Females in Enhaut?
There are 122.78 Males per 100 Females in Enhaut.
What is the Ratio of Females per 100 Males in Enhaut?
There are 81.45 Females per 100 Males in Enhaut.
What is the Median Population Age in Enhaut?
Median Population Age in Enhaut is 37.2 Years.
What is the Average Family Size in Enhaut
Average Family Size in Enhaut is 2.9 People.
What is the Average Household Size in Enhaut
Average Household Size in Enhaut is 2.4 People.
How Large is the Labor Force in Enhaut?
There are 902 People in the Labor Forcein in Enhaut.
What is the Percentage of People in the Labor Force in Enhaut?
80.2% of People are in the Labor Force in Enhaut.
What is the Unemployment Rate in Enhaut?
Unemployment Rate in Enhaut is 1.7%.