Alburtis borough, PA Map & Demographics
Alburtis borough Overview
$36,933
PER CAPITA INCOME
$103,750
AVG FAMILY INCOME
$101,167
AVG HOUSEHOLD INCOME
30.4%
WAGE / INCOME GAP [ % ]
69.6¢/ $1
WAGE / INCOME GAP [ $ ]
0.31
INEQUALITY / GINI INDEX
2,569
TOTAL POPULATION
1,402
MALE POPULATION
1,167
FEMALE POPULATION
120.14
MALES / 100 FEMALES
83.24
FEMALES / 100 MALES
32.7
MEDIAN AGE
3.2
AVG FAMILY SIZE
3.0
AVG HOUSEHOLD SIZE
1,494
LABOR FORCE [ PEOPLE ]
78.9%
PERCENT IN LABOR FORCE
7.1%
UNEMPLOYMENT RATE
Income in Alburtis borough
Income Overview in Alburtis borough
Per Capita Income in Alburtis borough is $36,933, while median incomes of families and households are $103,750 and $101,167 respectively.
| Characteristic | Number | Measure |
| Per Capita Income | 2,569 | $36,933 |
| Median Family Income | 688 | $103,750 |
| Mean Family Income | 688 | $113,594 |
| Median Household Income | 870 | $101,167 |
| Mean Household Income | 870 | $108,431 |
| Income Deficit | 688 | $0 |
| Wage / Income Gap (%) | 2,569 | 30.37% |
| Wage / Income Gap ($) | 2,569 | 69.63¢ per $1 |
| Gini / Inequality Index | 2,569 | 0.31 |
Earnings by Sex in Alburtis borough
Average Earnings in Alburtis borough are $47,307, $59,857 for men and $41,677 for women, a difference of 30.4%.
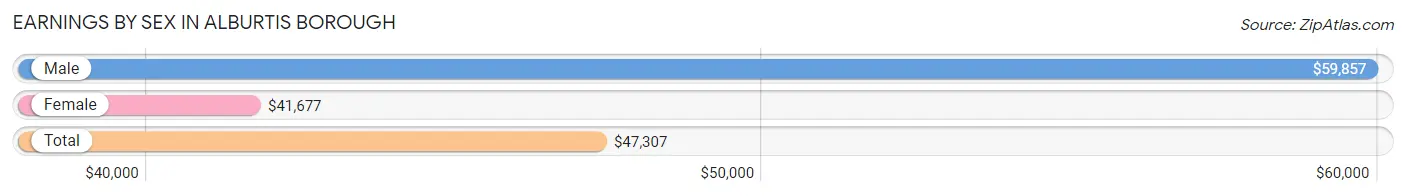
| Sex | Number | Average Earnings |
| Male | 838 (54.3%) | $59,857 |
| Female | 705 (45.7%) | $41,677 |
| Total | 1,543 (100.0%) | $47,307 |
Earnings by Sex by Income Bracket in Alburtis borough
The most common earnings brackets in Alburtis borough are $75,000 to $99,999 for men (152 | 18.1%) and $100,000+ for women (86 | 12.2%).
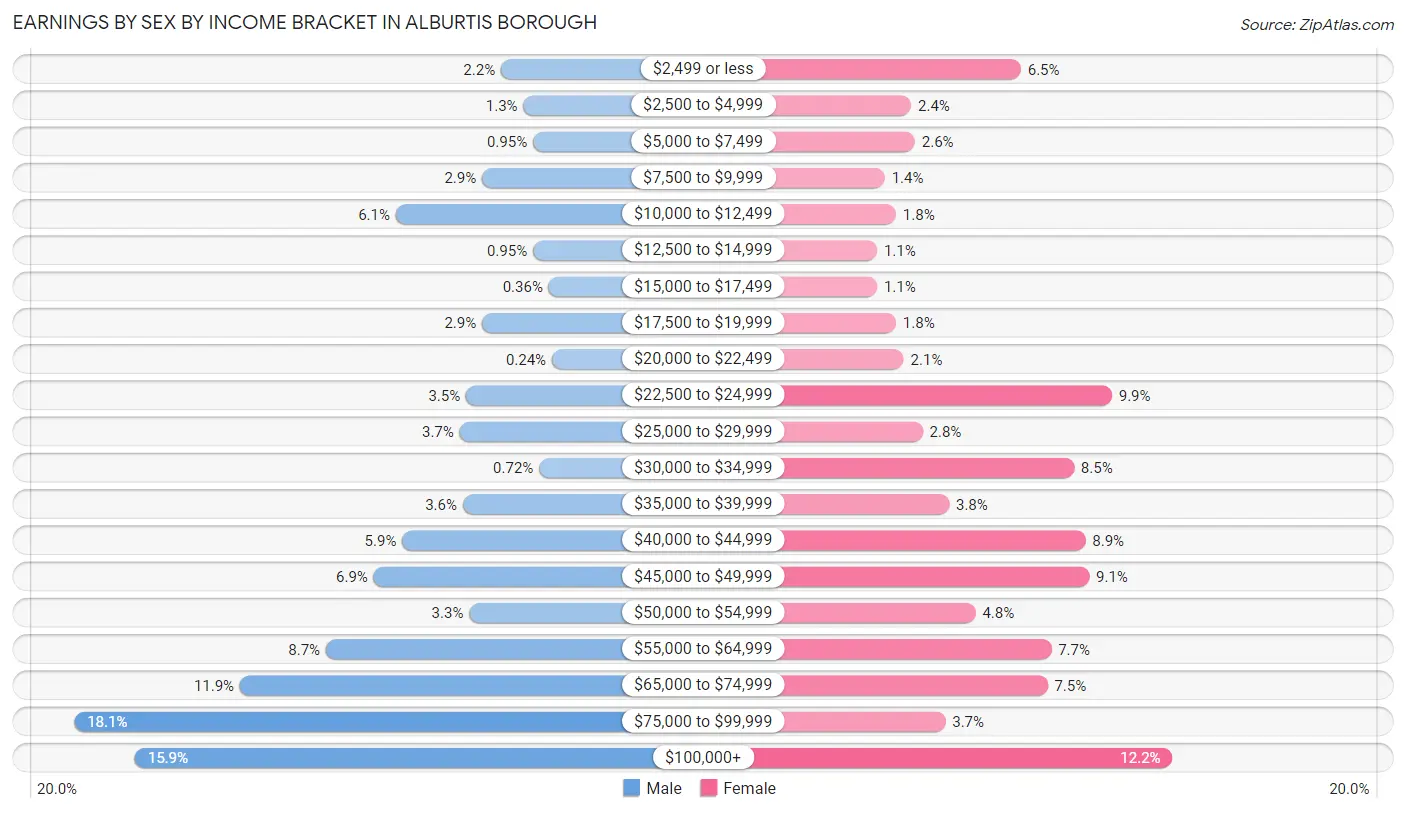
| Income | Male | Female |
| $2,499 or less | 18 (2.1%) | 46 (6.5%) |
| $2,500 to $4,999 | 11 (1.3%) | 17 (2.4%) |
| $5,000 to $7,499 | 8 (0.9%) | 18 (2.5%) |
| $7,500 to $9,999 | 24 (2.9%) | 10 (1.4%) |
| $10,000 to $12,499 | 51 (6.1%) | 13 (1.8%) |
| $12,500 to $14,999 | 8 (0.9%) | 8 (1.1%) |
| $15,000 to $17,499 | 3 (0.4%) | 8 (1.1%) |
| $17,500 to $19,999 | 24 (2.9%) | 13 (1.8%) |
| $20,000 to $22,499 | 2 (0.2%) | 15 (2.1%) |
| $22,500 to $24,999 | 29 (3.5%) | 70 (9.9%) |
| $25,000 to $29,999 | 31 (3.7%) | 20 (2.8%) |
| $30,000 to $34,999 | 6 (0.7%) | 60 (8.5%) |
| $35,000 to $39,999 | 30 (3.6%) | 27 (3.8%) |
| $40,000 to $44,999 | 49 (5.9%) | 63 (8.9%) |
| $45,000 to $49,999 | 58 (6.9%) | 64 (9.1%) |
| $50,000 to $54,999 | 28 (3.3%) | 34 (4.8%) |
| $55,000 to $64,999 | 73 (8.7%) | 54 (7.7%) |
| $65,000 to $74,999 | 100 (11.9%) | 53 (7.5%) |
| $75,000 to $99,999 | 152 (18.1%) | 26 (3.7%) |
| $100,000+ | 133 (15.9%) | 86 (12.2%) |
| Total | 838 (100.0%) | 705 (100.0%) |
Earnings by Sex by Educational Attainment in Alburtis borough
Average earnings in Alburtis borough are $69,531 for men and $42,955 for women, a difference of 38.2%. Men with an educational attainment of graduate degree enjoy the highest average annual earnings of $113,551, while those with less than high school education earn the least with $46,920. Women with an educational attainment of graduate degree earn the most with the average annual earnings of $65,871, while those with high school diploma education have the smallest earnings of $27,969.
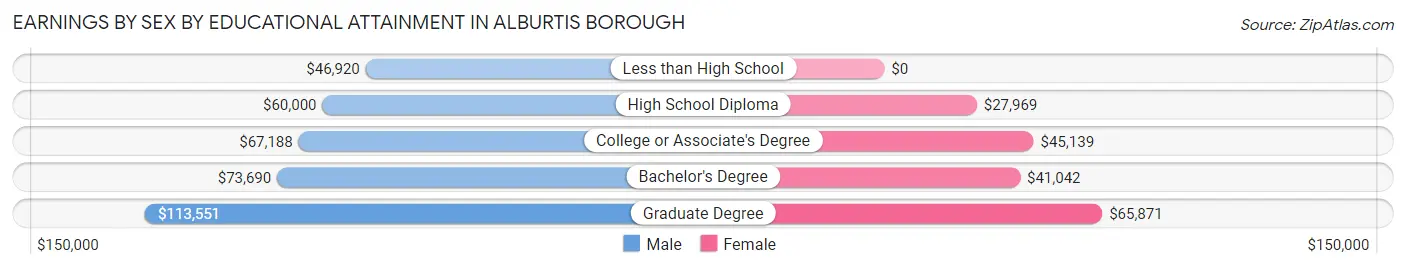
| Educational Attainment | Male Income | Female Income |
| Less than High School | $46,920 | $0 |
| High School Diploma | $60,000 | $27,969 |
| College or Associate's Degree | $67,188 | $45,139 |
| Bachelor's Degree | $73,690 | $41,042 |
| Graduate Degree | $113,551 | $65,871 |
| Total | $69,531 | $42,955 |
Family Income in Alburtis borough
Family Income Brackets in Alburtis borough
According to the Alburtis borough family income data, there are 194 families falling into the $100,000 to $149,999 income range, which is the most common income bracket and makes up 28.2% of all families. Conversely, the less than $10,000 income bracket is the least frequent group with only 5 families (0.7%) belonging to this category.
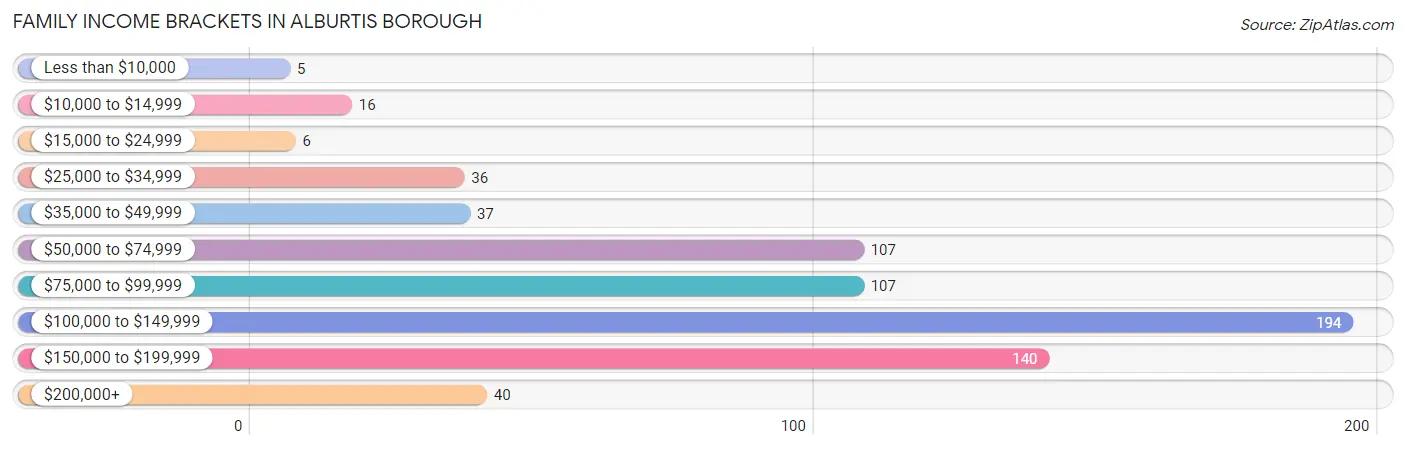
| Income Bracket | # Families | % Families |
| Less than $10,000 | 5 | 0.7% |
| $10,000 to $14,999 | 16 | 2.3% |
| $15,000 to $24,999 | 6 | 0.9% |
| $25,000 to $34,999 | 36 | 5.2% |
| $35,000 to $49,999 | 37 | 5.4% |
| $50,000 to $74,999 | 107 | 15.6% |
| $75,000 to $99,999 | 107 | 15.6% |
| $100,000 to $149,999 | 194 | 28.2% |
| $150,000 to $199,999 | 140 | 20.3% |
| $200,000+ | 40 | 5.8% |
Family Income by Famaliy Size in Alburtis borough
3-person families (247 | 35.9%) account for the highest median family income in Alburtis borough with $114,554 per family, while 2-person families (224 | 32.6%) have the highest median income of $52,500 per family member.
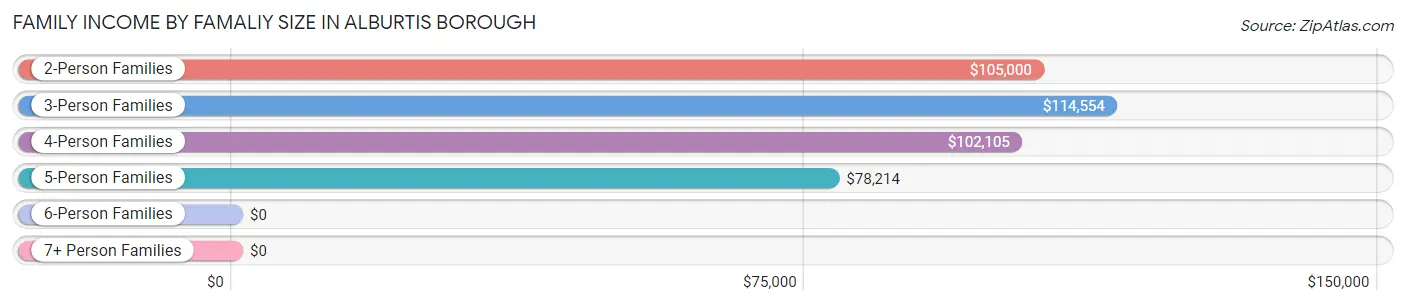
| Income Bracket | # Families | Median Income |
| 2-Person Families | 224 (32.6%) | $105,000 |
| 3-Person Families | 247 (35.9%) | $114,554 |
| 4-Person Families | 120 (17.4%) | $102,105 |
| 5-Person Families | 80 (11.6%) | $78,214 |
| 6-Person Families | 11 (1.6%) | $0 |
| 7+ Person Families | 6 (0.9%) | $0 |
| Total | 688 (100.0%) | $103,750 |
Family Income by Number of Earners in Alburtis borough
The median family income in Alburtis borough is $103,750, with families comprising 3+ earners (91) having the highest median family income of $154,511, while families with 1 earner (183) have the lowest median family income of $69,063, accounting for 13.2% and 26.6% of families, respectively.
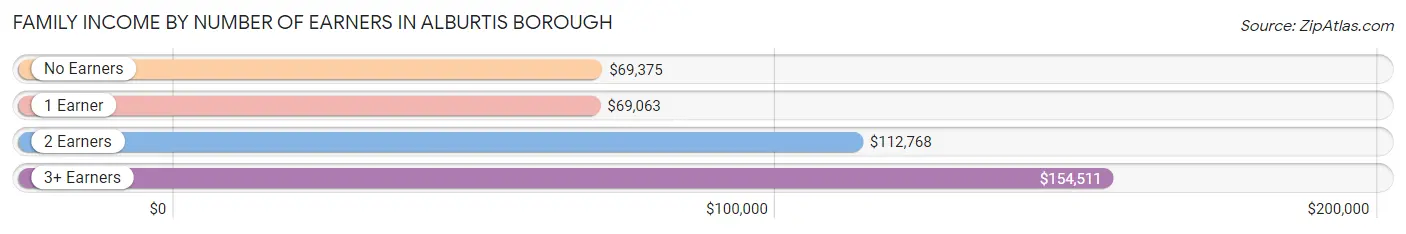
| Number of Earners | # Families | Median Income |
| No Earners | 29 (4.2%) | $69,375 |
| 1 Earner | 183 (26.6%) | $69,063 |
| 2 Earners | 385 (56.0%) | $112,768 |
| 3+ Earners | 91 (13.2%) | $154,511 |
| Total | 688 (100.0%) | $103,750 |
Household Income in Alburtis borough
Household Income Brackets in Alburtis borough
With 256 households falling in the category, the $100,000 to $149,999 income range is the most frequent in Alburtis borough, accounting for 29.4% of all households. In contrast, only 4 households (0.5%) fall into the less than $10,000 income bracket, making it the least populous group.
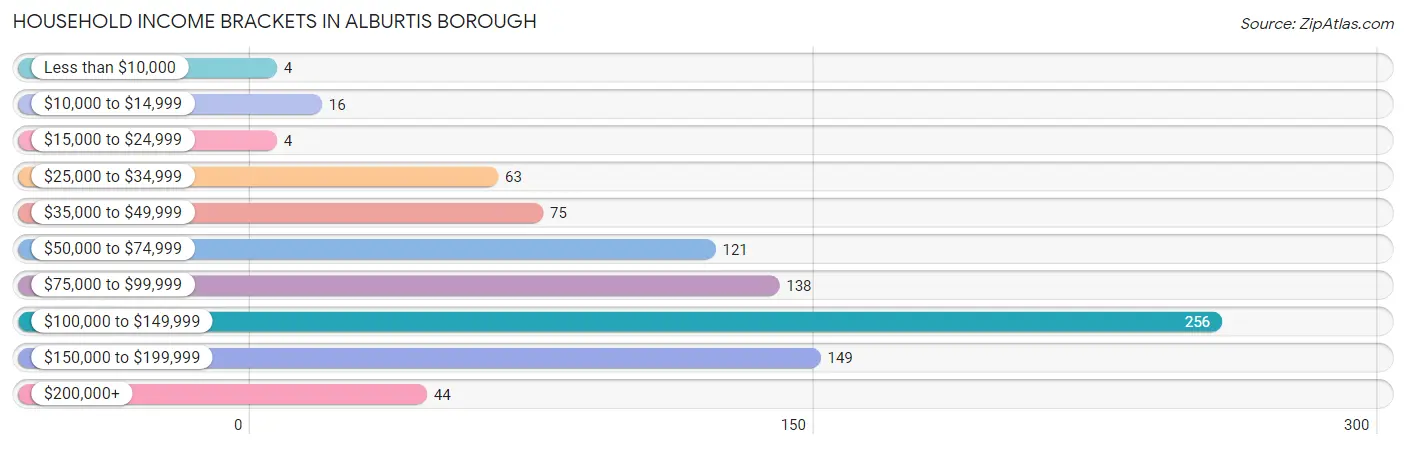
| Income Bracket | # Households | % Households |
| Less than $10,000 | 4 | 0.5% |
| $10,000 to $14,999 | 16 | 1.8% |
| $15,000 to $24,999 | 4 | 0.5% |
| $25,000 to $34,999 | 63 | 7.2% |
| $35,000 to $49,999 | 75 | 8.6% |
| $50,000 to $74,999 | 121 | 13.9% |
| $75,000 to $99,999 | 138 | 15.9% |
| $100,000 to $149,999 | 256 | 29.4% |
| $150,000 to $199,999 | 149 | 17.1% |
| $200,000+ | 44 | 5.1% |
Household Income by Householder Age in Alburtis borough
The median household income in Alburtis borough is $101,167, with the highest median household income of $116,563 found in the 45 to 64 years age bracket for the primary householder. A total of 345 households (39.7%) fall into this category. Meanwhile, the 15 to 24 years age bracket for the primary householder has the lowest median household income of $0, with 12 households (1.4%) in this group.
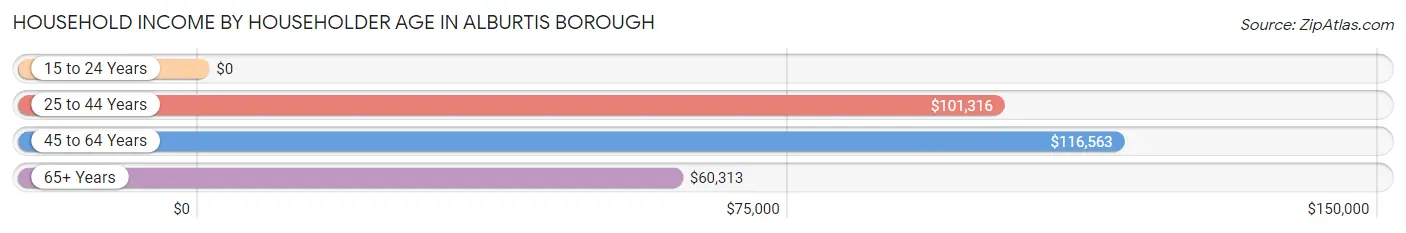
| Income Bracket | # Households | Median Income |
| 15 to 24 Years | 12 (1.4%) | $0 |
| 25 to 44 Years | 380 (43.7%) | $101,316 |
| 45 to 64 Years | 345 (39.7%) | $116,563 |
| 65+ Years | 133 (15.3%) | $60,313 |
| Total | 870 (100.0%) | $101,167 |
Poverty in Alburtis borough
Income Below Poverty by Sex and Age in Alburtis borough
With 2.6% poverty level for males and 5.4% for females among the residents of Alburtis borough, 25 to 34 year old males and 15 year old females are the most vulnerable to poverty, with 13 males (7.6%) and 5 females (100.0%) in their respective age groups living below the poverty level.
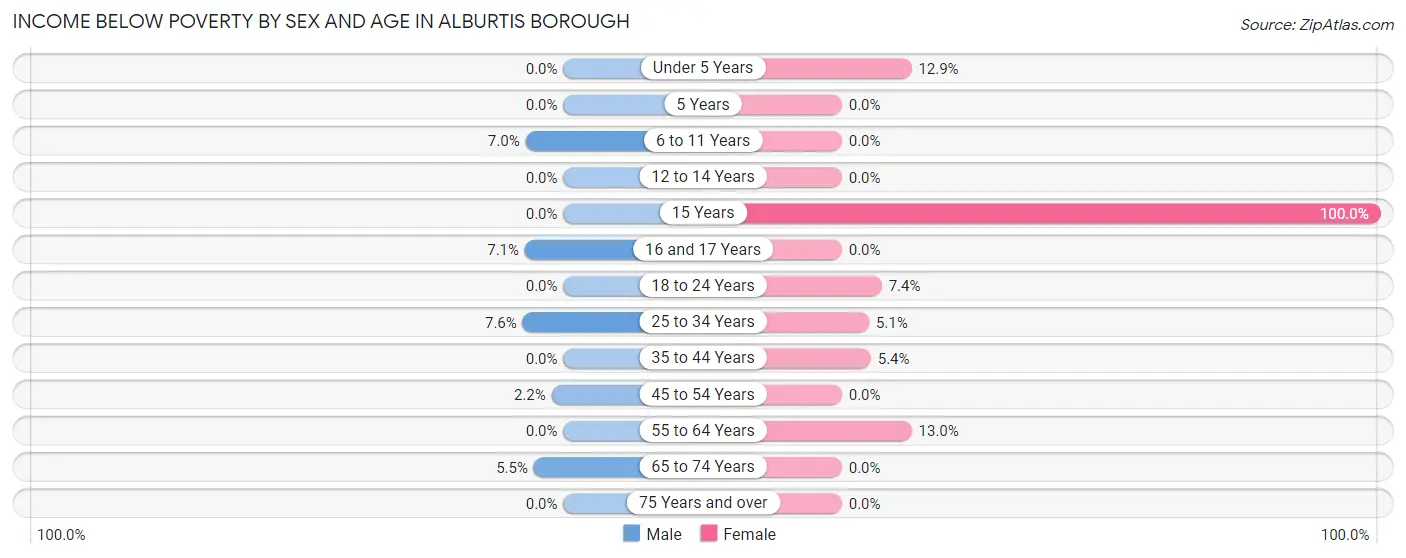
| Age Bracket | Male | Female |
| Under 5 Years | 0 (0.0%) | 15 (12.9%) |
| 5 Years | 0 (0.0%) | 0 (0.0%) |
| 6 to 11 Years | 9 (7.0%) | 0 (0.0%) |
| 12 to 14 Years | 0 (0.0%) | 0 (0.0%) |
| 15 Years | 0 (0.0%) | 5 (100.0%) |
| 16 and 17 Years | 5 (7.1%) | 0 (0.0%) |
| 18 to 24 Years | 0 (0.0%) | 4 (7.4%) |
| 25 to 34 Years | 13 (7.6%) | 11 (5.1%) |
| 35 to 44 Years | 0 (0.0%) | 14 (5.4%) |
| 45 to 54 Years | 5 (2.2%) | 0 (0.0%) |
| 55 to 64 Years | 0 (0.0%) | 14 (13.0%) |
| 65 to 74 Years | 4 (5.5%) | 0 (0.0%) |
| 75 Years and over | 0 (0.0%) | 0 (0.0%) |
| Total | 36 (2.6%) | 63 (5.4%) |
Income Above Poverty by Sex and Age in Alburtis borough
According to the poverty statistics in Alburtis borough, males aged under 5 years and females aged 5 years are the age groups that are most secure financially, with 100.0% of males and 100.0% of females in these age groups living above the poverty line.
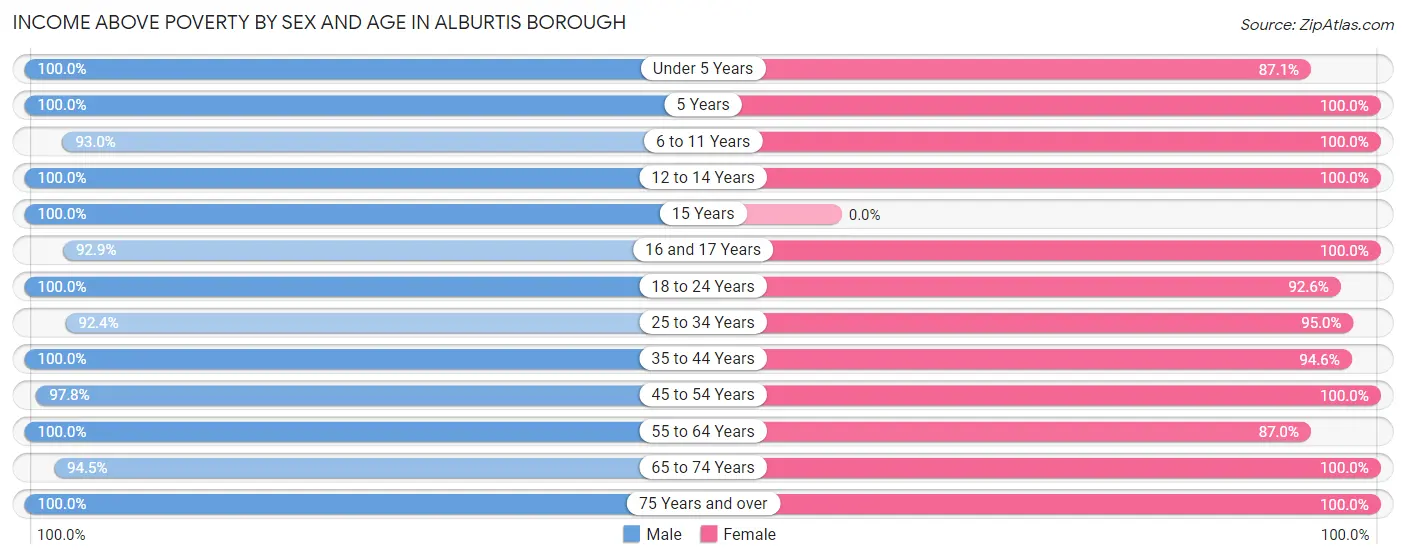
| Age Bracket | Male | Female |
| Under 5 Years | 108 (100.0%) | 101 (87.1%) |
| 5 Years | 22 (100.0%) | 14 (100.0%) |
| 6 to 11 Years | 119 (93.0%) | 110 (100.0%) |
| 12 to 14 Years | 109 (100.0%) | 45 (100.0%) |
| 15 Years | 18 (100.0%) | 0 (0.0%) |
| 16 and 17 Years | 65 (92.9%) | 13 (100.0%) |
| 18 to 24 Years | 169 (100.0%) | 50 (92.6%) |
| 25 to 34 Years | 159 (92.4%) | 207 (95.0%) |
| 35 to 44 Years | 195 (100.0%) | 246 (94.6%) |
| 45 to 54 Years | 223 (97.8%) | 115 (100.0%) |
| 55 to 64 Years | 80 (100.0%) | 94 (87.0%) |
| 65 to 74 Years | 69 (94.5%) | 70 (100.0%) |
| 75 Years and over | 30 (100.0%) | 39 (100.0%) |
| Total | 1,366 (97.4%) | 1,104 (94.6%) |
Income Below Poverty Among Married-Couple Families in Alburtis borough
The poverty statistics for married-couple families in Alburtis borough show that 1.1% or 5 of the total 476 families live below the poverty line. Families with 3 or 4 children have the highest poverty rate of 11.1%, comprising of 5 families. On the other hand, families with no children have the lowest poverty rate of 0.0%, which includes 0 families.
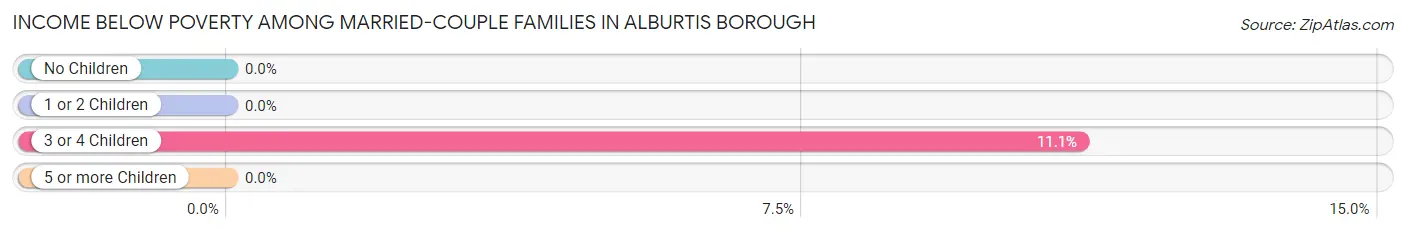
| Children | Above Poverty | Below Poverty |
| No Children | 226 (100.0%) | 0 (0.0%) |
| 1 or 2 Children | 199 (100.0%) | 0 (0.0%) |
| 3 or 4 Children | 40 (88.9%) | 5 (11.1%) |
| 5 or more Children | 6 (100.0%) | 0 (0.0%) |
| Total | 471 (99.0%) | 5 (1.1%) |
Income Below Poverty Among Single-Parent Households in Alburtis borough
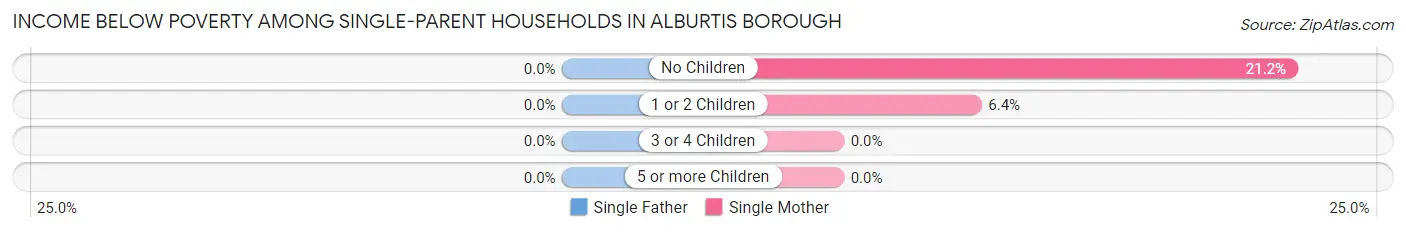
| Children | Single Father | Single Mother |
| No Children | 0 (0.0%) | 11 (21.1%) |
| 1 or 2 Children | 0 (0.0%) | 5 (6.4%) |
| 3 or 4 Children | 0 (0.0%) | 0 (0.0%) |
| 5 or more Children | 0 (0.0%) | 0 (0.0%) |
| Total | 0 (0.0%) | 16 (10.3%) |
Income Below Poverty Among Married-Couple vs Single-Parent Households in Alburtis borough
The poverty data for Alburtis borough shows that 5 of the married-couple family households (1.1%) and 16 of the single-parent households (7.5%) are living below the poverty level. Within the married-couple family households, those with 3 or 4 children have the highest poverty rate, with 5 households (11.1%) falling below the poverty line. Among the single-parent households, those with no children have the highest poverty rate, with 11 household (16.7%) living below poverty.
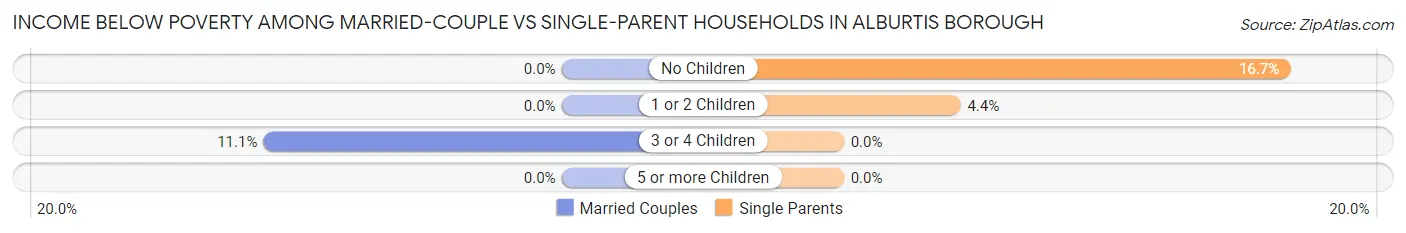
| Children | Married-Couple Families | Single-Parent Households |
| No Children | 0 (0.0%) | 11 (16.7%) |
| 1 or 2 Children | 0 (0.0%) | 5 (4.3%) |
| 3 or 4 Children | 5 (11.1%) | 0 (0.0%) |
| 5 or more Children | 0 (0.0%) | 0 (0.0%) |
| Total | 5 (1.1%) | 16 (7.5%) |
Race in Alburtis borough
The most populous races in Alburtis borough are White / Caucasian (1,801 | 70.1%), Hispanic or Latino (498 | 19.4%), and Some other Race (283 | 11.0%).
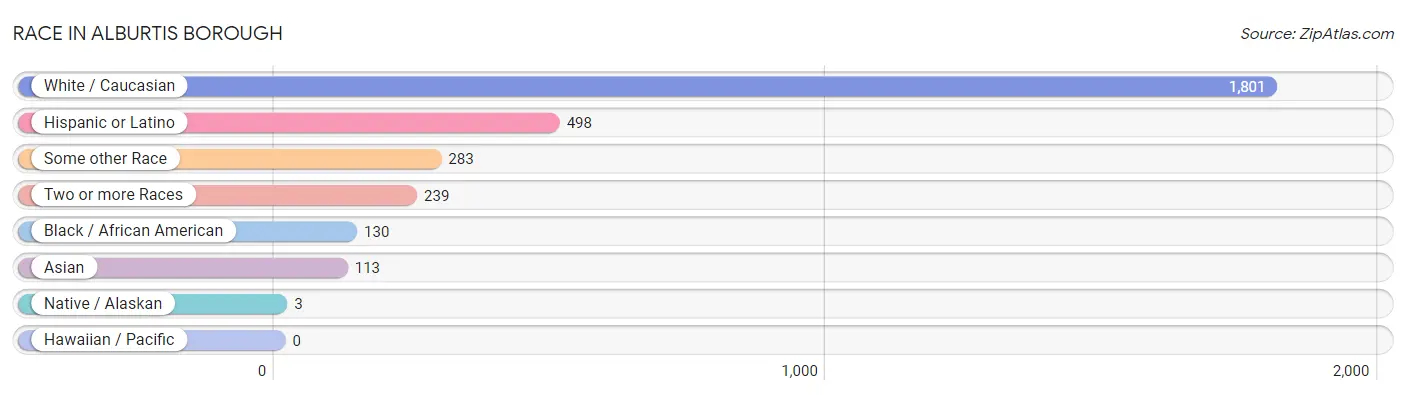
| Race | # Population | % Population |
| Asian | 113 | 4.4% |
| Black / African American | 130 | 5.1% |
| Hawaiian / Pacific | 0 | 0.0% |
| Hispanic or Latino | 498 | 19.4% |
| Native / Alaskan | 3 | 0.1% |
| White / Caucasian | 1,801 | 70.1% |
| Two or more Races | 239 | 9.3% |
| Some other Race | 283 | 11.0% |
| Total | 2,569 | 100.0% |
Ancestry in Alburtis borough
The most populous ancestries reported in Alburtis borough are German (662 | 25.8%), Italian (358 | 13.9%), Irish (277 | 10.8%), Puerto Rican (229 | 8.9%), and Dominican (178 | 6.9%), together accounting for 66.3% of all Alburtis borough residents.
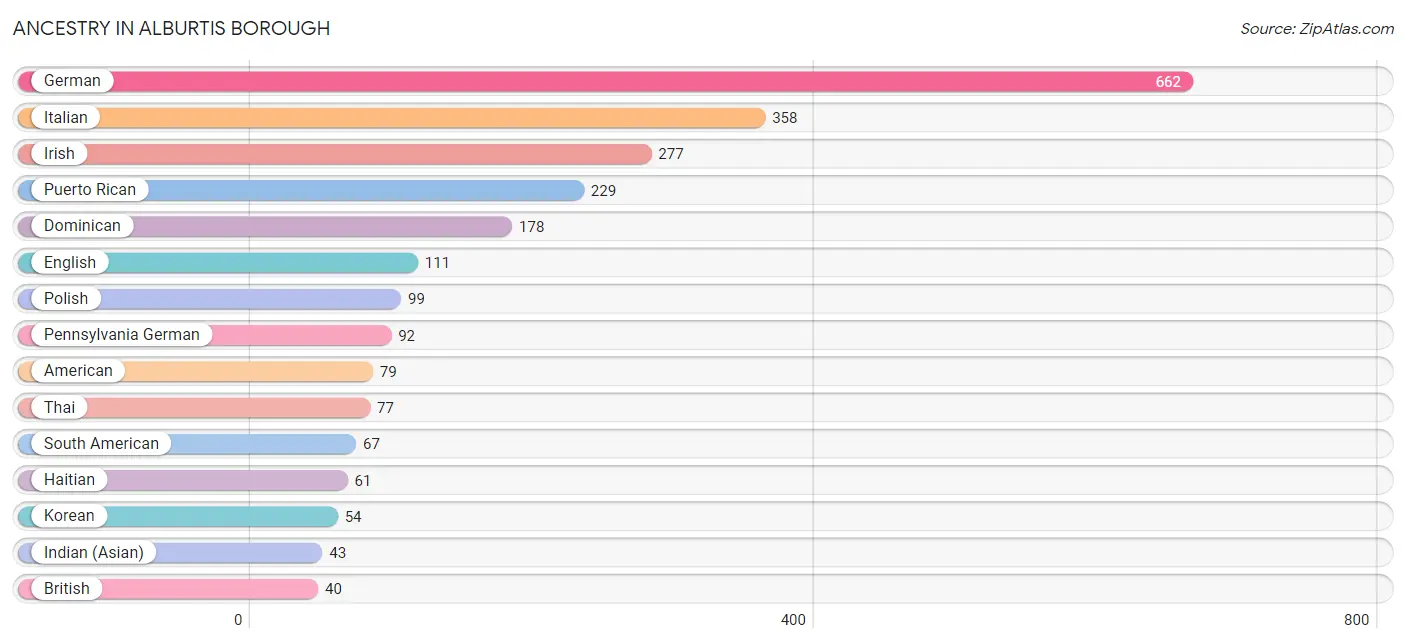
| Ancestry | # Population | % Population |
| American | 79 | 3.1% |
| Arab | 30 | 1.2% |
| Armenian | 5 | 0.2% |
| Austrian | 14 | 0.5% |
| Brazilian | 5 | 0.2% |
| British | 40 | 1.6% |
| Cherokee | 3 | 0.1% |
| Colombian | 28 | 1.1% |
| Cuban | 7 | 0.3% |
| Czech | 3 | 0.1% |
| Danish | 5 | 0.2% |
| Dominican | 178 | 6.9% |
| Dutch | 35 | 1.4% |
| Egyptian | 25 | 1.0% |
| English | 111 | 4.3% |
| European | 15 | 0.6% |
| French | 32 | 1.3% |
| German | 662 | 25.8% |
| Haitian | 61 | 2.4% |
| Hungarian | 20 | 0.8% |
| Indian (Asian) | 43 | 1.7% |
| Irish | 277 | 10.8% |
| Italian | 358 | 13.9% |
| Jamaican | 19 | 0.7% |
| Korean | 54 | 2.1% |
| Lithuanian | 14 | 0.5% |
| Mexican | 17 | 0.7% |
| Norwegian | 2 | 0.1% |
| Pennsylvania German | 92 | 3.6% |
| Peruvian | 39 | 1.5% |
| Polish | 99 | 3.8% |
| Portuguese | 3 | 0.1% |
| Puerto Rican | 229 | 8.9% |
| Scandinavian | 4 | 0.2% |
| Scottish | 22 | 0.9% |
| Slovak | 25 | 1.0% |
| Slovene | 3 | 0.1% |
| South American | 67 | 2.6% |
| Swedish | 5 | 0.2% |
| Syrian | 25 | 1.0% |
| Thai | 77 | 3.0% |
| Ukrainian | 35 | 1.4% |
| Welsh | 3 | 0.1% | View All 43 Rows |
Immigrants in Alburtis borough
The most numerous immigrant groups reported in Alburtis borough came from Asia (110 | 4.3%), Latin America (91 | 3.5%), India (77 | 3.0%), South Central Asia (77 | 3.0%), and Caribbean (46 | 1.8%), together accounting for 15.6% of all Alburtis borough residents.
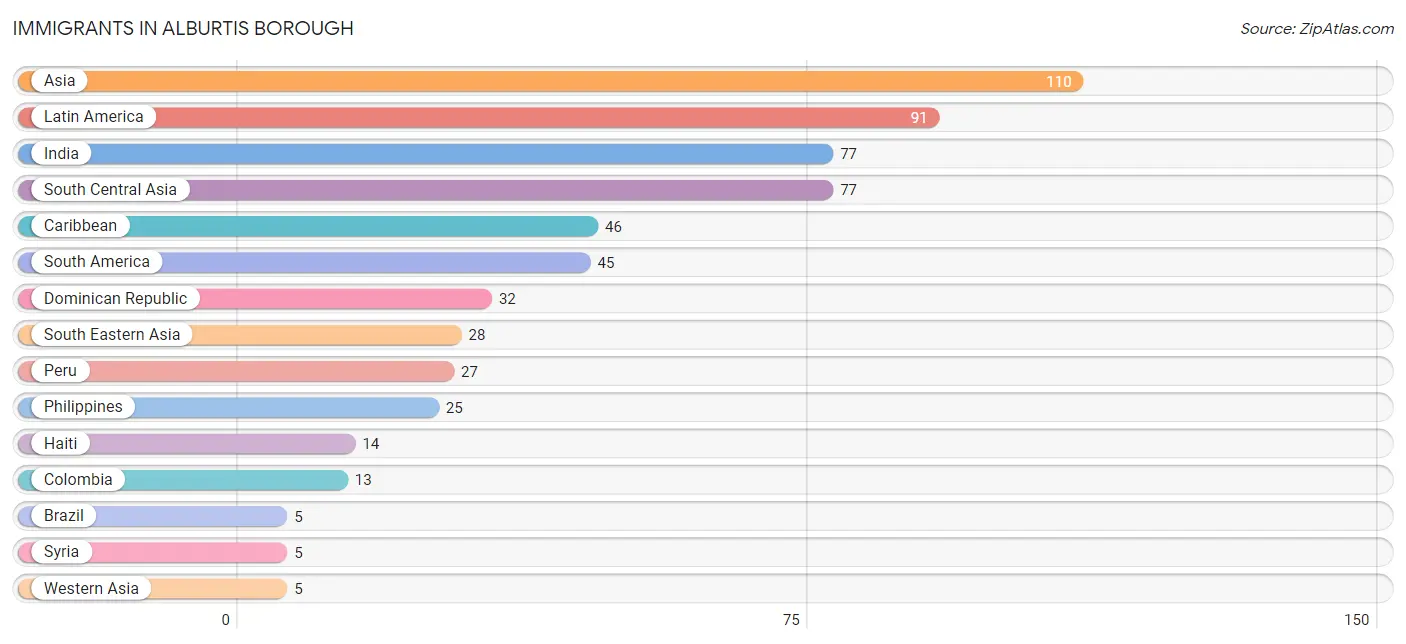
| Immigration Origin | # Population | % Population |
| Asia | 110 | 4.3% |
| Brazil | 5 | 0.2% |
| Caribbean | 46 | 1.8% |
| Colombia | 13 | 0.5% |
| Dominican Republic | 32 | 1.3% |
| Haiti | 14 | 0.5% |
| India | 77 | 3.0% |
| Indonesia | 3 | 0.1% |
| Latin America | 91 | 3.5% |
| Peru | 27 | 1.1% |
| Philippines | 25 | 1.0% |
| South America | 45 | 1.8% |
| South Central Asia | 77 | 3.0% |
| South Eastern Asia | 28 | 1.1% |
| Syria | 5 | 0.2% |
| Western Asia | 5 | 0.2% | View All 16 Rows |
Sex and Age in Alburtis borough
Sex and Age in Alburtis borough
The most populous age groups in Alburtis borough are 15 to 19 Years (156 | 11.1%) for men and 40 to 44 Years (166 | 14.2%) for women.
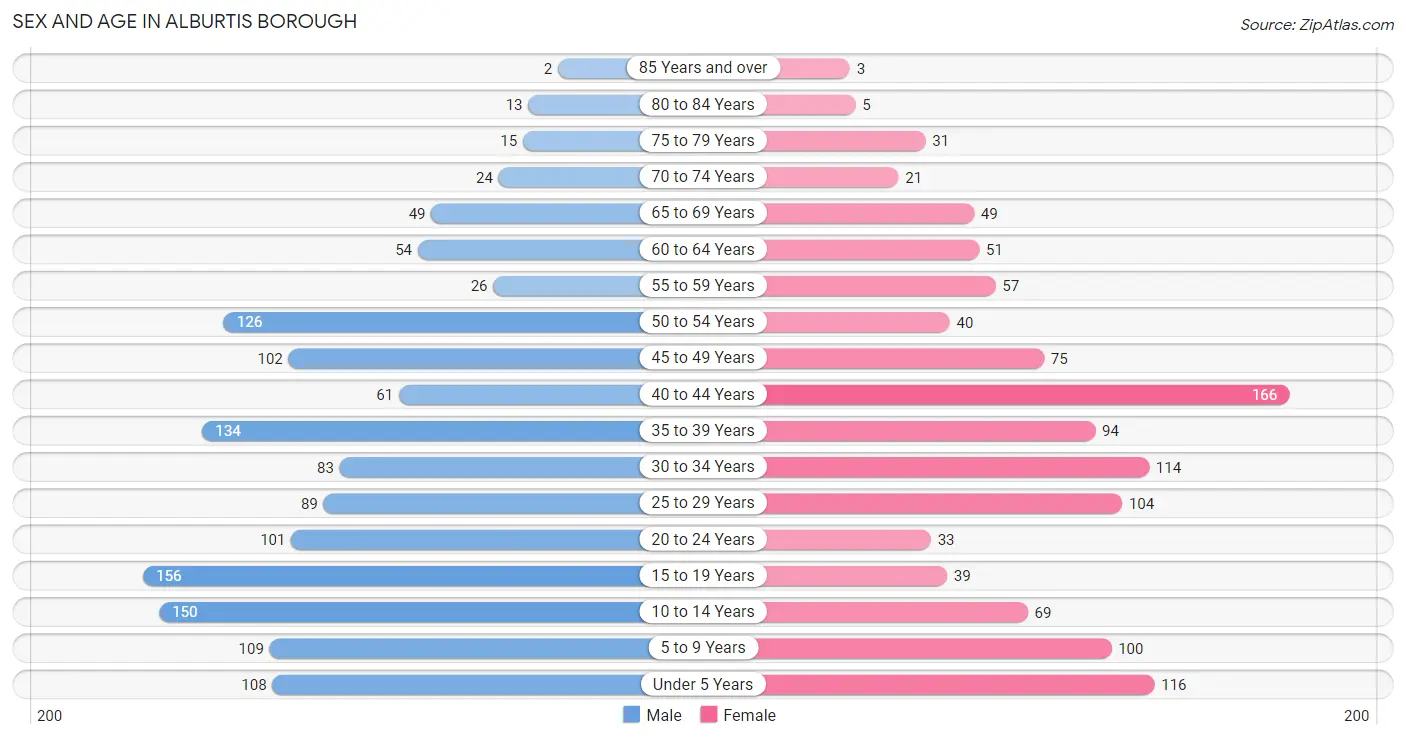
| Age Bracket | Male | Female |
| Under 5 Years | 108 (7.7%) | 116 (9.9%) |
| 5 to 9 Years | 109 (7.8%) | 100 (8.6%) |
| 10 to 14 Years | 150 (10.7%) | 69 (5.9%) |
| 15 to 19 Years | 156 (11.1%) | 39 (3.3%) |
| 20 to 24 Years | 101 (7.2%) | 33 (2.8%) |
| 25 to 29 Years | 89 (6.4%) | 104 (8.9%) |
| 30 to 34 Years | 83 (5.9%) | 114 (9.8%) |
| 35 to 39 Years | 134 (9.6%) | 94 (8.1%) |
| 40 to 44 Years | 61 (4.3%) | 166 (14.2%) |
| 45 to 49 Years | 102 (7.3%) | 75 (6.4%) |
| 50 to 54 Years | 126 (9.0%) | 40 (3.4%) |
| 55 to 59 Years | 26 (1.8%) | 57 (4.9%) |
| 60 to 64 Years | 54 (3.8%) | 51 (4.4%) |
| 65 to 69 Years | 49 (3.5%) | 49 (4.2%) |
| 70 to 74 Years | 24 (1.7%) | 21 (1.8%) |
| 75 to 79 Years | 15 (1.1%) | 31 (2.7%) |
| 80 to 84 Years | 13 (0.9%) | 5 (0.4%) |
| 85 Years and over | 2 (0.1%) | 3 (0.3%) |
| Total | 1,402 (100.0%) | 1,167 (100.0%) |
Families and Households in Alburtis borough
Median Family Size in Alburtis borough
The median family size in Alburtis borough is 3.23 persons per family, with single female/mother families (155 | 22.5%) accounting for the largest median family size of 3.37 persons per family. On the other hand, single male/father families (57 | 8.3%) represent the smallest median family size with 2.95 persons per family.
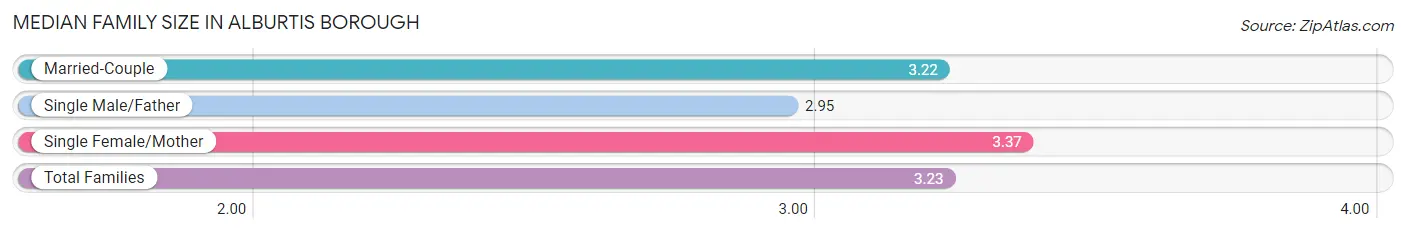
| Family Type | # Families | Family Size |
| Married-Couple | 476 (69.2%) | 3.22 |
| Single Male/Father | 57 (8.3%) | 2.95 |
| Single Female/Mother | 155 (22.5%) | 3.37 |
| Total Families | 688 (100.0%) | 3.23 |
Median Household Size in Alburtis borough
The median household size in Alburtis borough is 2.95 persons per household, with single female/mother households (155 | 17.8%) accounting for the largest median household size of 3.68 persons per household. non-family households (182 | 20.9%) represent the smallest median household size with 1.44 persons per household.
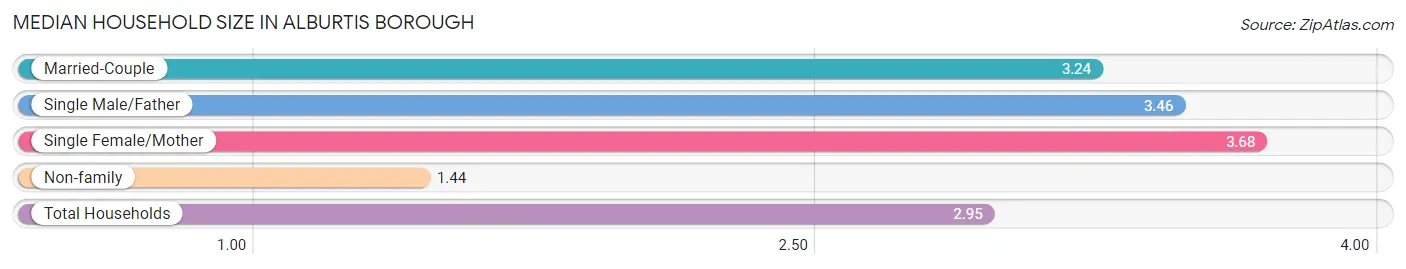
| Household Type | # Households | Household Size |
| Married-Couple | 476 (54.7%) | 3.24 |
| Single Male/Father | 57 (6.6%) | 3.46 |
| Single Female/Mother | 155 (17.8%) | 3.68 |
| Non-family | 182 (20.9%) | 1.44 |
| Total Households | 870 (100.0%) | 2.95 |
Household Size by Marriage Status in Alburtis borough
Out of a total of 870 households in Alburtis borough, 688 (79.1%) are family households, while 182 (20.9%) are nonfamily households. The most numerous type of family households are 3-person households, comprising 244, and the most common type of nonfamily households are 1-person households, comprising 113.
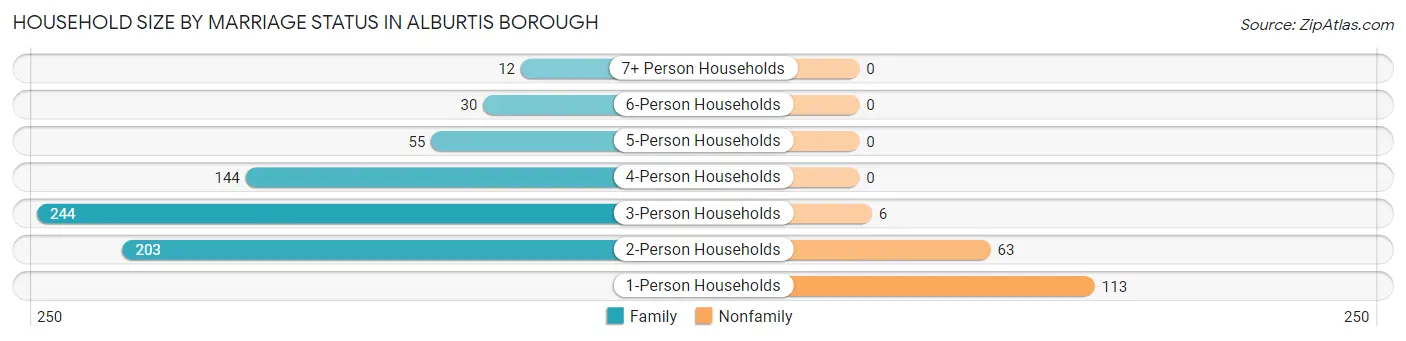
| Household Size | Family Households | Nonfamily Households |
| 1-Person Households | - | 113 (13.0%) |
| 2-Person Households | 203 (23.3%) | 63 (7.2%) |
| 3-Person Households | 244 (28.1%) | 6 (0.7%) |
| 4-Person Households | 144 (16.6%) | 0 (0.0%) |
| 5-Person Households | 55 (6.3%) | 0 (0.0%) |
| 6-Person Households | 30 (3.5%) | 0 (0.0%) |
| 7+ Person Households | 12 (1.4%) | 0 (0.0%) |
| Total | 688 (79.1%) | 182 (20.9%) |
Female Fertility in Alburtis borough
Fertility by Age in Alburtis borough
Average fertility rate in Alburtis borough is 108.0 births per 1,000 women. Women in the age bracket of 20 to 34 years have the highest fertility rate with 231.0 births per 1,000 women. Women in the age bracket of 20 to 34 years acount for 84.1% of all women with births.
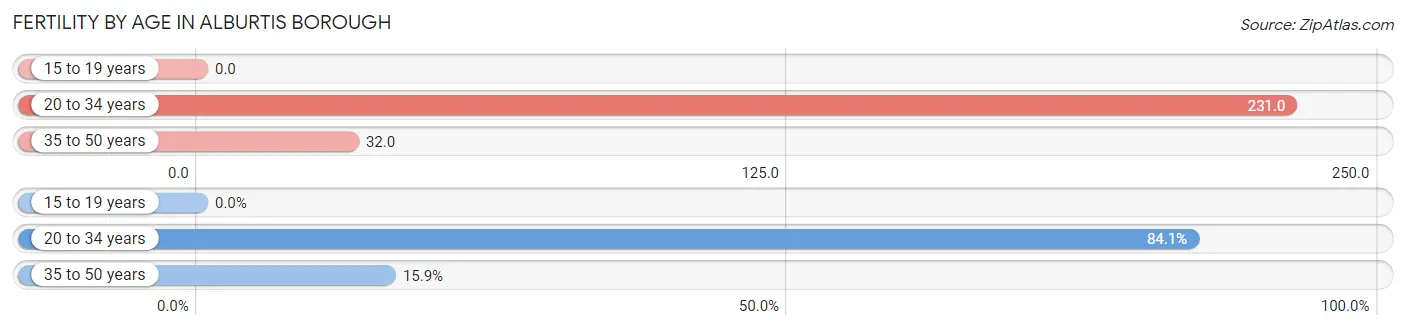
| Age Bracket | Women with Births | Births / 1,000 Women |
| 15 to 19 years | 0 (0.0%) | 0.0 |
| 20 to 34 years | 58 (84.1%) | 231.0 |
| 35 to 50 years | 11 (15.9%) | 32.0 |
| Total | 69 (100.0%) | 108.0 |
Fertility by Age by Marriage Status in Alburtis borough
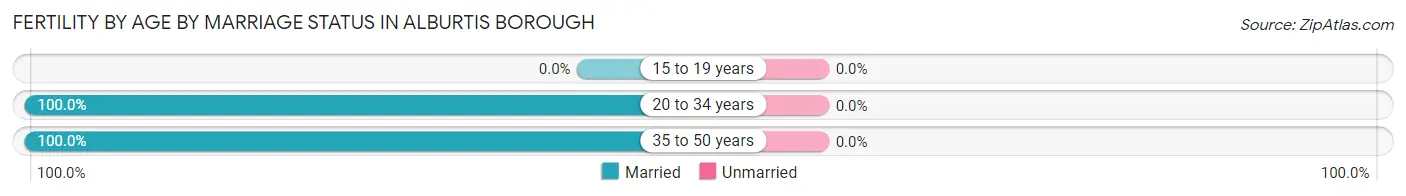
| Age Bracket | Married | Unmarried |
| 15 to 19 years | 0 (0.0%) | 0 (0.0%) |
| 20 to 34 years | 58 (100.0%) | 0 (0.0%) |
| 35 to 50 years | 11 (100.0%) | 0 (0.0%) |
| Total | 69 (100.0%) | 0 (0.0%) |
Fertility by Education in Alburtis borough
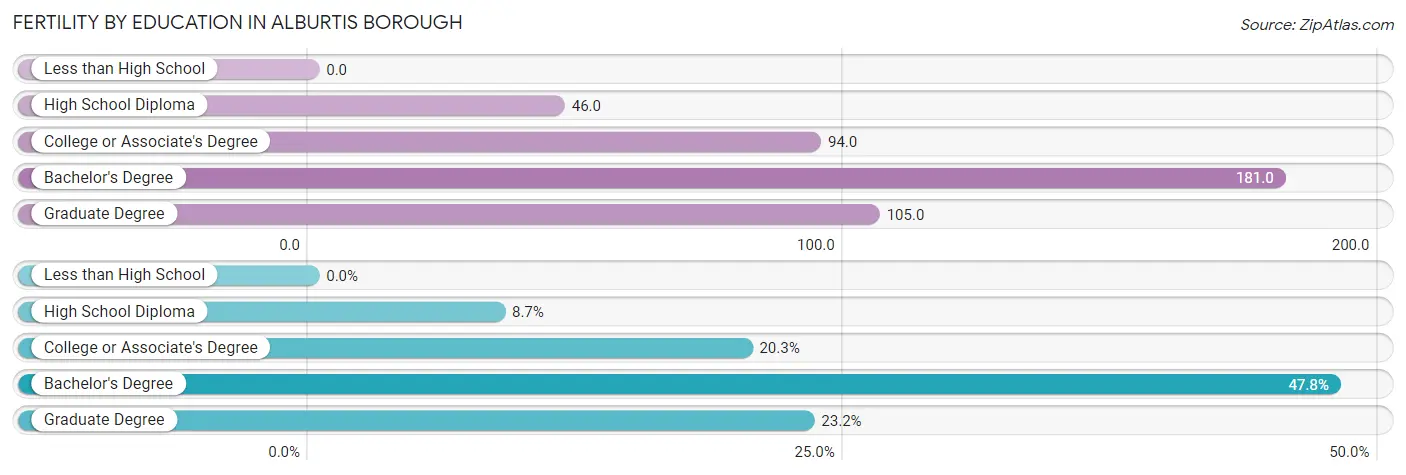
| Educational Attainment | Women with Births | Births / 1,000 Women |
| Less than High School | 0 (0.0%) | 0.0 |
| High School Diploma | 6 (8.7%) | 46.0 |
| College or Associate's Degree | 14 (20.3%) | 94.0 |
| Bachelor's Degree | 33 (47.8%) | 181.0 |
| Graduate Degree | 16 (23.2%) | 105.0 |
| Total | 69 (100.0%) | 108.0 |
Fertility by Education by Marriage Status in Alburtis borough
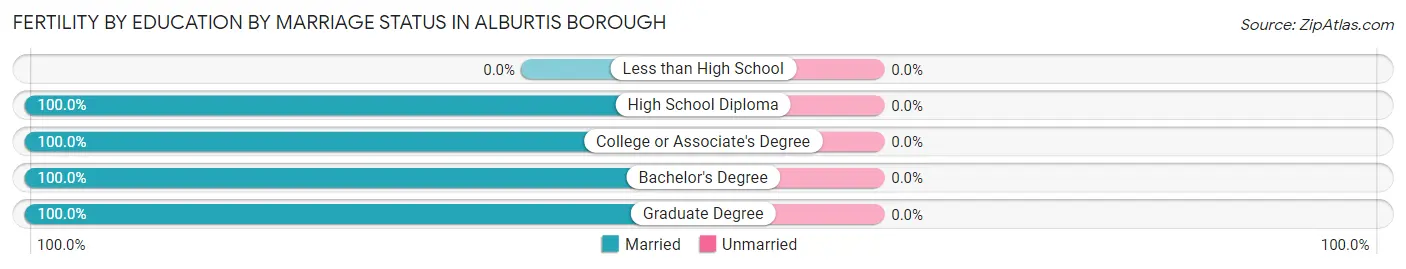
| Educational Attainment | Married | Unmarried |
| Less than High School | 0 (0.0%) | 0 (0.0%) |
| High School Diploma | 6 (100.0%) | 0 (0.0%) |
| College or Associate's Degree | 14 (100.0%) | 0 (0.0%) |
| Bachelor's Degree | 33 (100.0%) | 0 (0.0%) |
| Graduate Degree | 16 (100.0%) | 0 (0.0%) |
| Total | 69 (100.0%) | 0 (0.0%) |
Employment Characteristics in Alburtis borough
Employment by Class of Employer in Alburtis borough
Among the 1,384 employed individuals in Alburtis borough, private company employees (1,009 | 72.9%), not-for-profit organizations (178 | 12.9%), and local government employees (131 | 9.5%) make up the most common classes of employment.
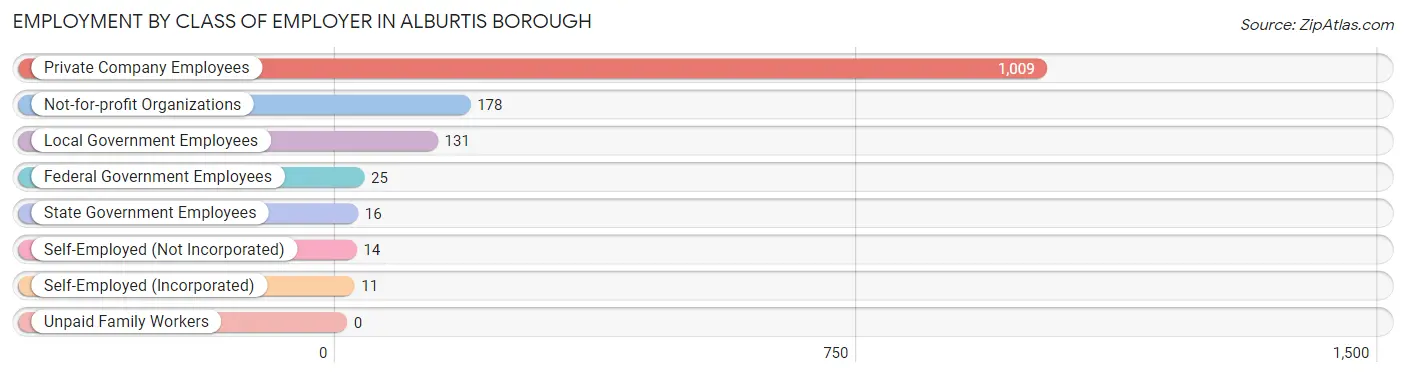
| Employer Class | # Employees | % Employees |
| Private Company Employees | 1,009 | 72.9% |
| Self-Employed (Incorporated) | 11 | 0.8% |
| Self-Employed (Not Incorporated) | 14 | 1.0% |
| Not-for-profit Organizations | 178 | 12.9% |
| Local Government Employees | 131 | 9.5% |
| State Government Employees | 16 | 1.2% |
| Federal Government Employees | 25 | 1.8% |
| Unpaid Family Workers | 0 | 0.0% |
| Total | 1,384 | 100.0% |
Employment Status by Age in Alburtis borough
According to the labor force statistics for Alburtis borough, out of the total population over 16 years of age (1,894), 78.9% or 1,494 individuals are in the labor force, with 7.1% or 106 of them unemployed. The age group with the highest labor force participation rate is 20 to 24 years, with 92.5% or 124 individuals in the labor force. Within the labor force, the 16 to 19 years age range has the highest percentage of unemployed individuals, with 56.0% or 42 of them being unemployed.
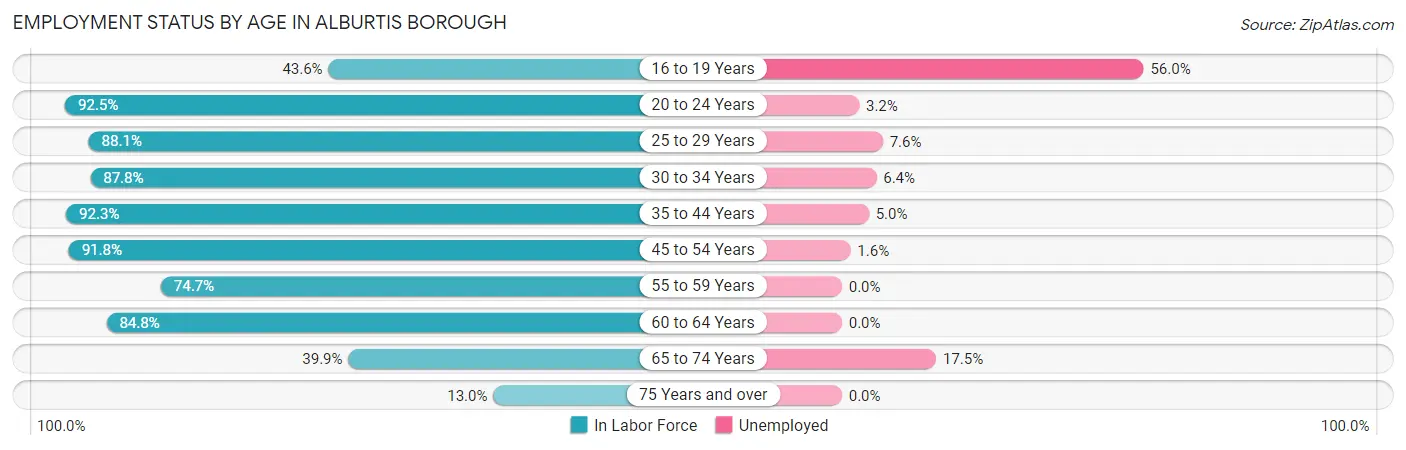
| Age Bracket | In Labor Force | Unemployed |
| 16 to 19 Years | 75 (43.6%) | 42 (56.0%) |
| 20 to 24 Years | 124 (92.5%) | 4 (3.2%) |
| 25 to 29 Years | 170 (88.1%) | 13 (7.6%) |
| 30 to 34 Years | 173 (87.8%) | 11 (6.4%) |
| 35 to 44 Years | 420 (92.3%) | 21 (5.0%) |
| 45 to 54 Years | 315 (91.8%) | 5 (1.6%) |
| 55 to 59 Years | 62 (74.7%) | 0 (0.0%) |
| 60 to 64 Years | 89 (84.8%) | 0 (0.0%) |
| 65 to 74 Years | 57 (39.9%) | 10 (17.5%) |
| 75 Years and over | 9 (13.0%) | 0 (0.0%) |
| Total | 1,494 (78.9%) | 106 (7.1%) |
Employment Status by Educational Attainment in Alburtis borough
According to labor force statistics for Alburtis borough, 89.3% of individuals (1,229) out of the total population between 25 and 64 years of age (1,376) are in the labor force, with 4.0% or 49 of them being unemployed. The group with the highest labor force participation rate are those with the educational attainment of bachelor's degree or higher, with 94.3% or 560 individuals in the labor force. Within the labor force, individuals with college / associate degree education have the highest percentage of unemployment, with 6.2% or 20 of them being unemployed.
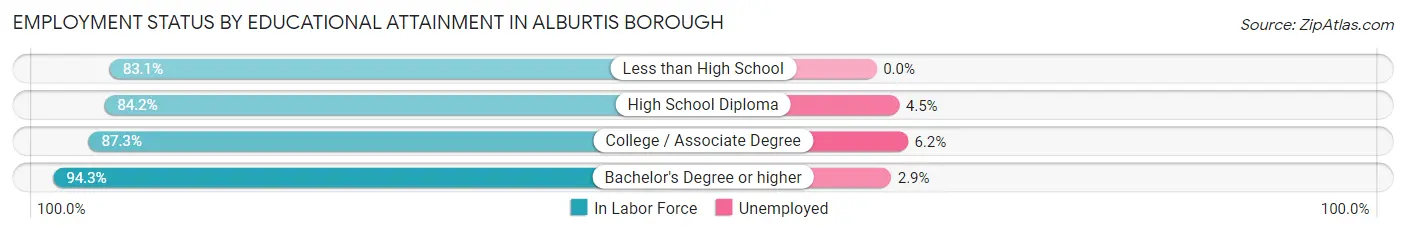
| Educational Attainment | In Labor Force | Unemployed |
| Less than High School | 59 (83.1%) | 0 (0.0%) |
| High School Diploma | 288 (84.2%) | 15 (4.5%) |
| College / Associate Degree | 322 (87.3%) | 23 (6.2%) |
| Bachelor's Degree or higher | 560 (94.3%) | 17 (2.9%) |
| Total | 1,229 (89.3%) | 55 (4.0%) |
Employment Occupations by Sex in Alburtis borough
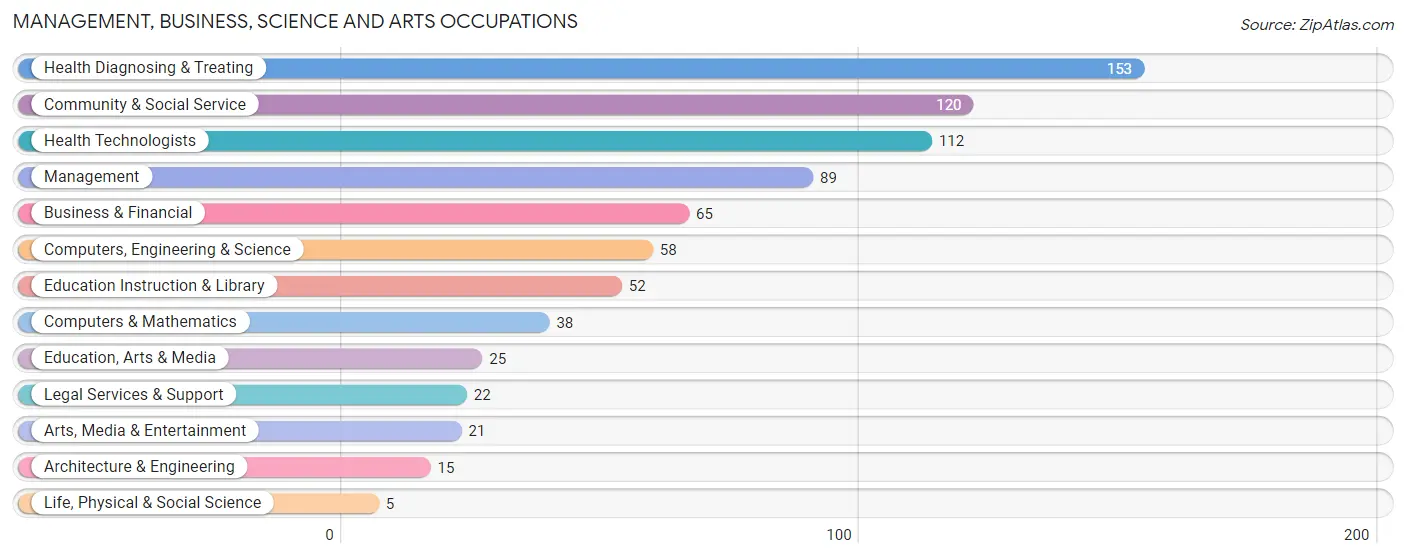
Management, Business, Science and Arts Occupations
The most common Management, Business, Science and Arts occupations in Alburtis borough are Health Diagnosing & Treating (153 | 11.2%), Community & Social Service (120 | 8.7%), Health Technologists (112 | 8.2%), Management (89 | 6.5%), and Business & Financial (65 | 4.7%).
Management, Business, Science and Arts Occupations by Sex
Within the Management, Business, Science and Arts occupations in Alburtis borough, the most male-oriented occupations are Computers & Mathematics (100.0%), Architecture & Engineering (100.0%), and Computers, Engineering & Science (91.4%), while the most female-oriented occupations are Life, Physical & Social Science (100.0%), Health Technologists (87.5%), and Health Diagnosing & Treating (86.9%).
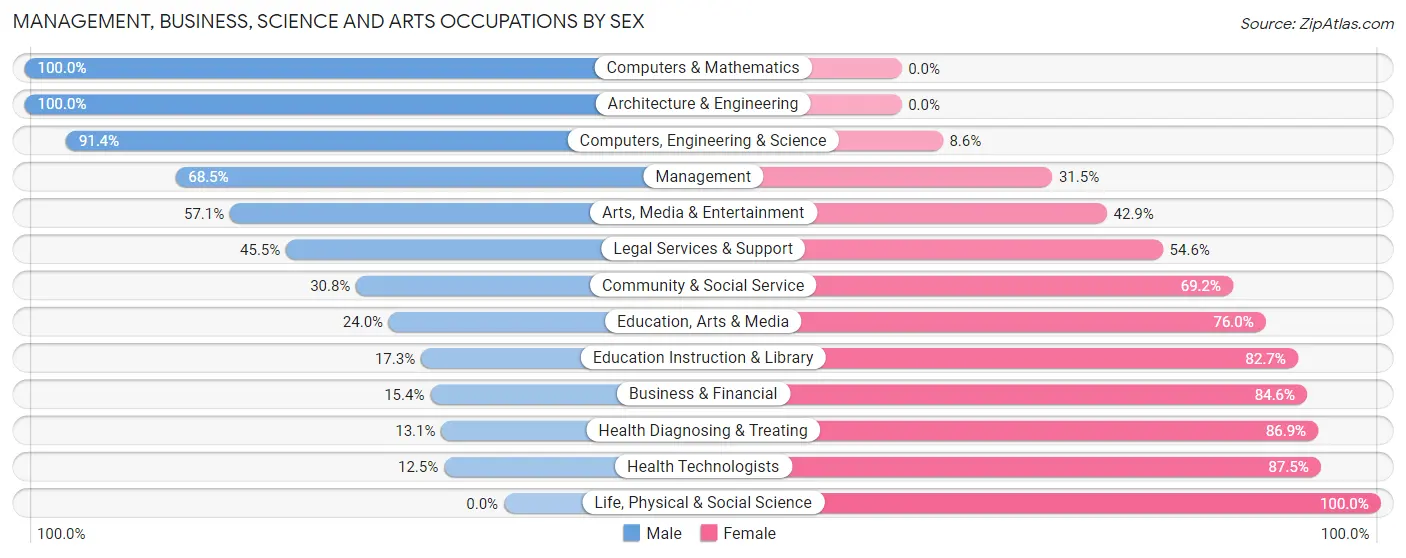
| Occupation | Male | Female |
| Management | 61 (68.5%) | 28 (31.5%) |
| Business & Financial | 10 (15.4%) | 55 (84.6%) |
| Computers, Engineering & Science | 53 (91.4%) | 5 (8.6%) |
| Computers & Mathematics | 38 (100.0%) | 0 (0.0%) |
| Architecture & Engineering | 15 (100.0%) | 0 (0.0%) |
| Life, Physical & Social Science | 0 (0.0%) | 5 (100.0%) |
| Community & Social Service | 37 (30.8%) | 83 (69.2%) |
| Education, Arts & Media | 6 (24.0%) | 19 (76.0%) |
| Legal Services & Support | 10 (45.5%) | 12 (54.5%) |
| Education Instruction & Library | 9 (17.3%) | 43 (82.7%) |
| Arts, Media & Entertainment | 12 (57.1%) | 9 (42.9%) |
| Health Diagnosing & Treating | 20 (13.1%) | 133 (86.9%) |
| Health Technologists | 14 (12.5%) | 98 (87.5%) |
| Total (Category) | 181 (37.3%) | 304 (62.7%) |
| Total (Overall) | 748 (54.5%) | 624 (45.5%) |
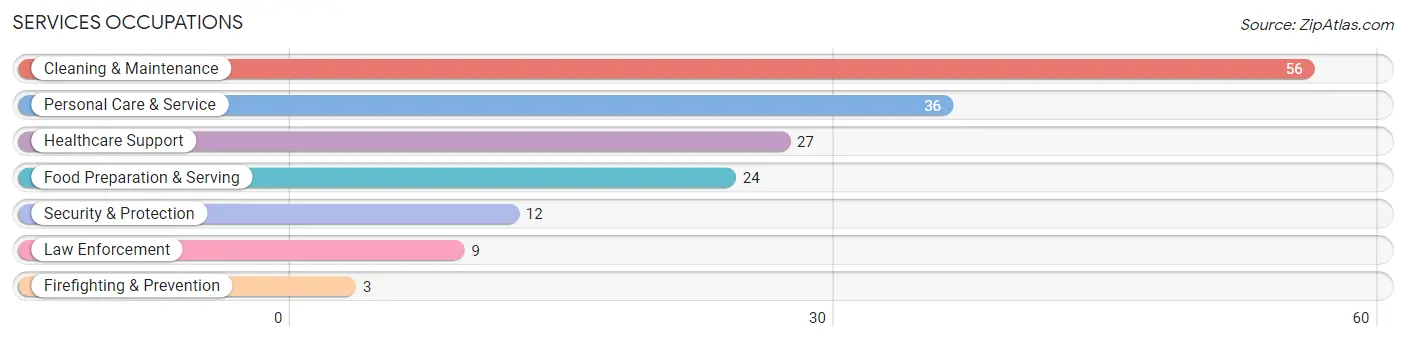
Services Occupations
The most common Services occupations in Alburtis borough are Cleaning & Maintenance (56 | 4.1%), Personal Care & Service (36 | 2.6%), Healthcare Support (27 | 2.0%), Food Preparation & Serving (24 | 1.8%), and Security & Protection (12 | 0.9%).
Services Occupations by Sex
Within the Services occupations in Alburtis borough, the most male-oriented occupations are Security & Protection (100.0%), Firefighting & Prevention (100.0%), and Law Enforcement (100.0%), while the most female-oriented occupations are Healthcare Support (100.0%), Personal Care & Service (100.0%), and Cleaning & Maintenance (32.1%).
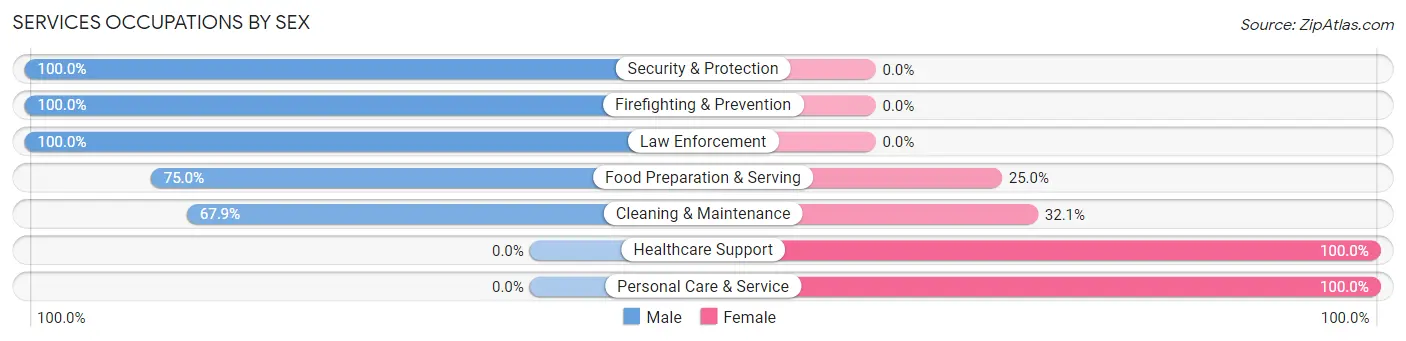
| Occupation | Male | Female |
| Healthcare Support | 0 (0.0%) | 27 (100.0%) |
| Security & Protection | 12 (100.0%) | 0 (0.0%) |
| Firefighting & Prevention | 3 (100.0%) | 0 (0.0%) |
| Law Enforcement | 9 (100.0%) | 0 (0.0%) |
| Food Preparation & Serving | 18 (75.0%) | 6 (25.0%) |
| Cleaning & Maintenance | 38 (67.9%) | 18 (32.1%) |
| Personal Care & Service | 0 (0.0%) | 36 (100.0%) |
| Total (Category) | 68 (43.9%) | 87 (56.1%) |
| Total (Overall) | 748 (54.5%) | 624 (45.5%) |
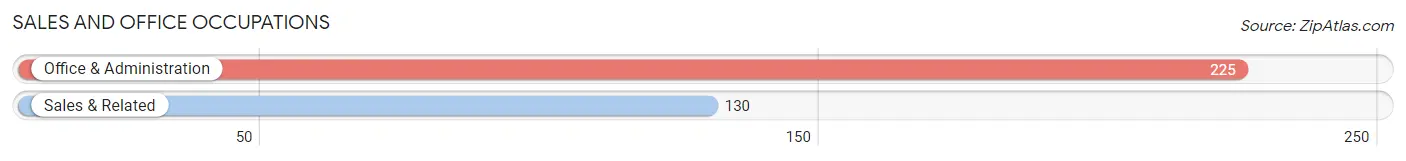
Sales and Office Occupations
The most common Sales and Office occupations in Alburtis borough are Office & Administration (225 | 16.4%), and Sales & Related (130 | 9.5%).
Sales and Office Occupations by Sex
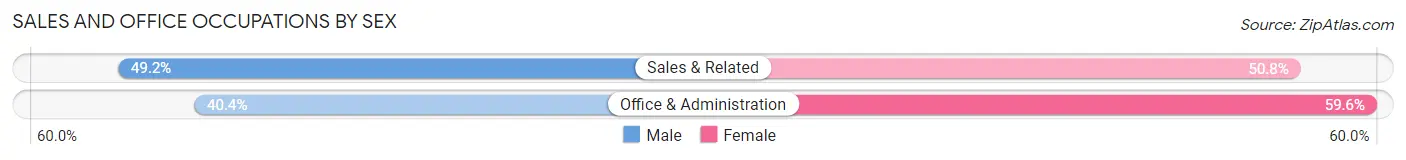
| Occupation | Male | Female |
| Sales & Related | 64 (49.2%) | 66 (50.8%) |
| Office & Administration | 91 (40.4%) | 134 (59.6%) |
| Total (Category) | 155 (43.7%) | 200 (56.3%) |
| Total (Overall) | 748 (54.5%) | 624 (45.5%) |
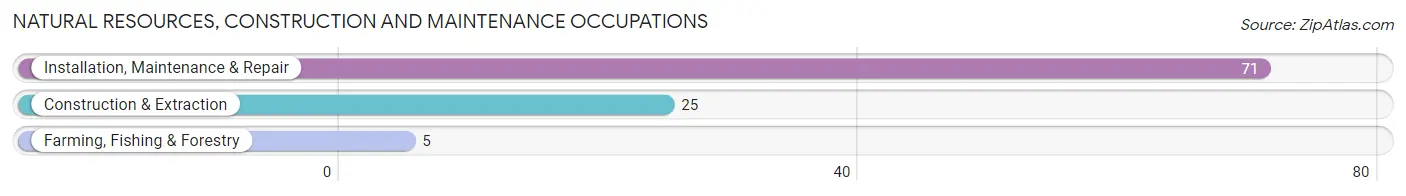
Natural Resources, Construction and Maintenance Occupations
The most common Natural Resources, Construction and Maintenance occupations in Alburtis borough are Installation, Maintenance & Repair (71 | 5.2%), Construction & Extraction (25 | 1.8%), and Farming, Fishing & Forestry (5 | 0.4%).
Natural Resources, Construction and Maintenance Occupations by Sex
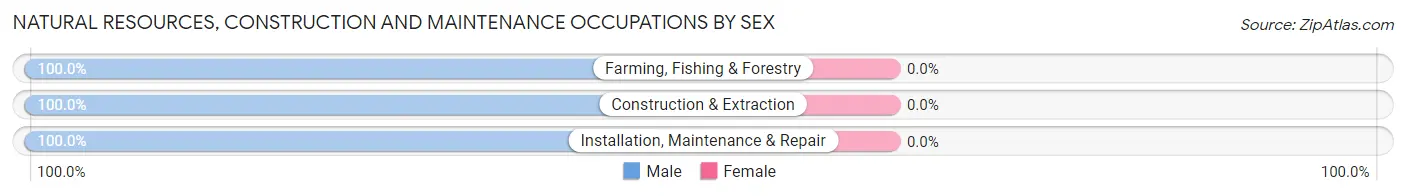
| Occupation | Male | Female |
| Farming, Fishing & Forestry | 5 (100.0%) | 0 (0.0%) |
| Construction & Extraction | 25 (100.0%) | 0 (0.0%) |
| Installation, Maintenance & Repair | 71 (100.0%) | 0 (0.0%) |
| Total (Category) | 101 (100.0%) | 0 (0.0%) |
| Total (Overall) | 748 (54.5%) | 624 (45.5%) |
Production, Transportation and Moving Occupations
The most common Production, Transportation and Moving occupations in Alburtis borough are Production (164 | 11.9%), Material Moving (79 | 5.8%), and Transportation (33 | 2.4%).
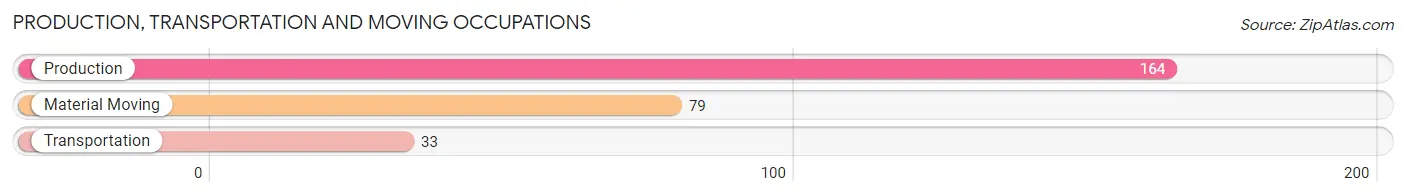
Production, Transportation and Moving Occupations by Sex
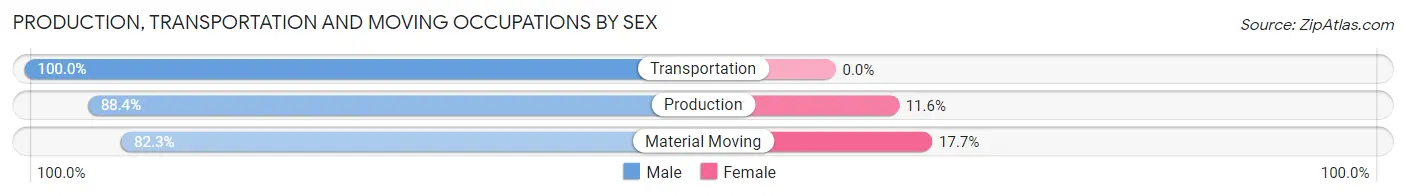
| Occupation | Male | Female |
| Production | 145 (88.4%) | 19 (11.6%) |
| Transportation | 33 (100.0%) | 0 (0.0%) |
| Material Moving | 65 (82.3%) | 14 (17.7%) |
| Total (Category) | 243 (88.0%) | 33 (12.0%) |
| Total (Overall) | 748 (54.5%) | 624 (45.5%) |
Employment Industries by Sex in Alburtis borough
Employment Industries in Alburtis borough
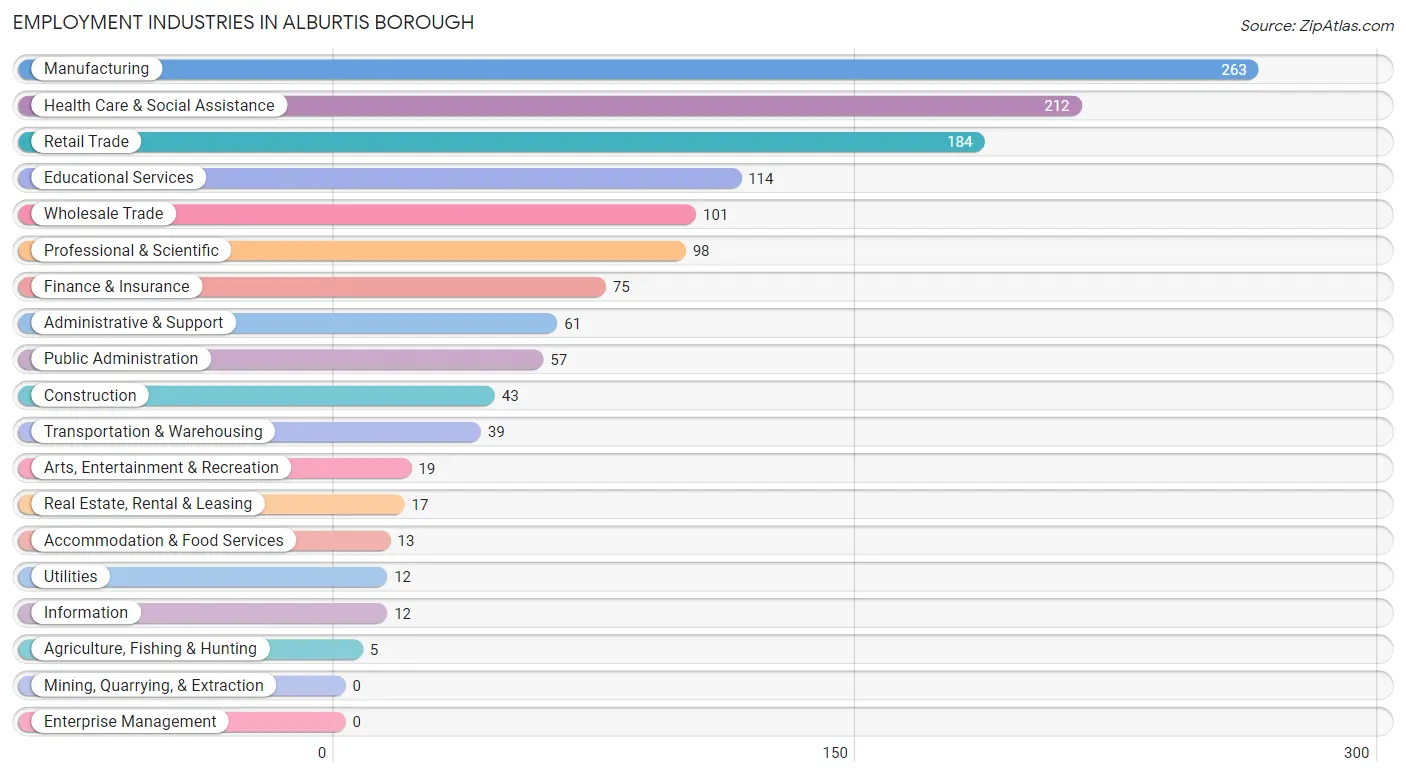
The major employment industries in Alburtis borough include Manufacturing (263 | 19.2%), Health Care & Social Assistance (212 | 15.4%), Retail Trade (184 | 13.4%), Educational Services (114 | 8.3%), and Wholesale Trade (101 | 7.4%).
Employment Industries by Sex in Alburtis borough
The Alburtis borough industries that see more men than women are Agriculture, Fishing & Hunting (100.0%), Construction (100.0%), and Information (100.0%), whereas the industries that tend to have a higher number of women are Health Care & Social Assistance (83.0%), Real Estate, Rental & Leasing (76.5%), and Finance & Insurance (74.7%).
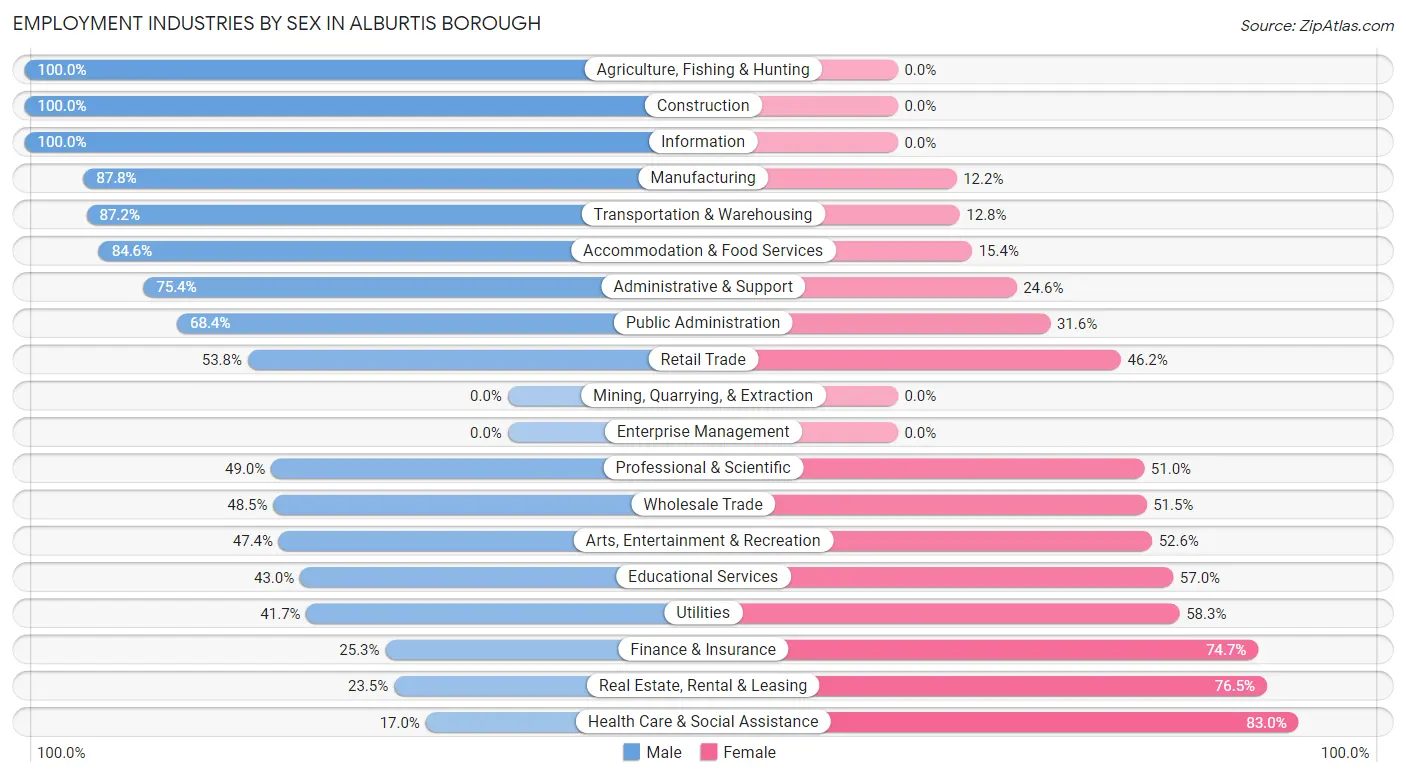
| Industry | Male | Female |
| Agriculture, Fishing & Hunting | 5 (100.0%) | 0 (0.0%) |
| Mining, Quarrying, & Extraction | 0 (0.0%) | 0 (0.0%) |
| Construction | 43 (100.0%) | 0 (0.0%) |
| Manufacturing | 231 (87.8%) | 32 (12.2%) |
| Wholesale Trade | 49 (48.5%) | 52 (51.5%) |
| Retail Trade | 99 (53.8%) | 85 (46.2%) |
| Transportation & Warehousing | 34 (87.2%) | 5 (12.8%) |
| Utilities | 5 (41.7%) | 7 (58.3%) |
| Information | 12 (100.0%) | 0 (0.0%) |
| Finance & Insurance | 19 (25.3%) | 56 (74.7%) |
| Real Estate, Rental & Leasing | 4 (23.5%) | 13 (76.5%) |
| Professional & Scientific | 48 (49.0%) | 50 (51.0%) |
| Enterprise Management | 0 (0.0%) | 0 (0.0%) |
| Administrative & Support | 46 (75.4%) | 15 (24.6%) |
| Educational Services | 49 (43.0%) | 65 (57.0%) |
| Health Care & Social Assistance | 36 (17.0%) | 176 (83.0%) |
| Arts, Entertainment & Recreation | 9 (47.4%) | 10 (52.6%) |
| Accommodation & Food Services | 11 (84.6%) | 2 (15.4%) |
| Public Administration | 39 (68.4%) | 18 (31.6%) |
| Total | 748 (54.5%) | 624 (45.5%) |
Education in Alburtis borough
School Enrollment in Alburtis borough
The most common levels of schooling among the 708 students in Alburtis borough are elementary school (182 | 25.7%), middle school (167 | 23.6%), and high school (137 | 19.4%).
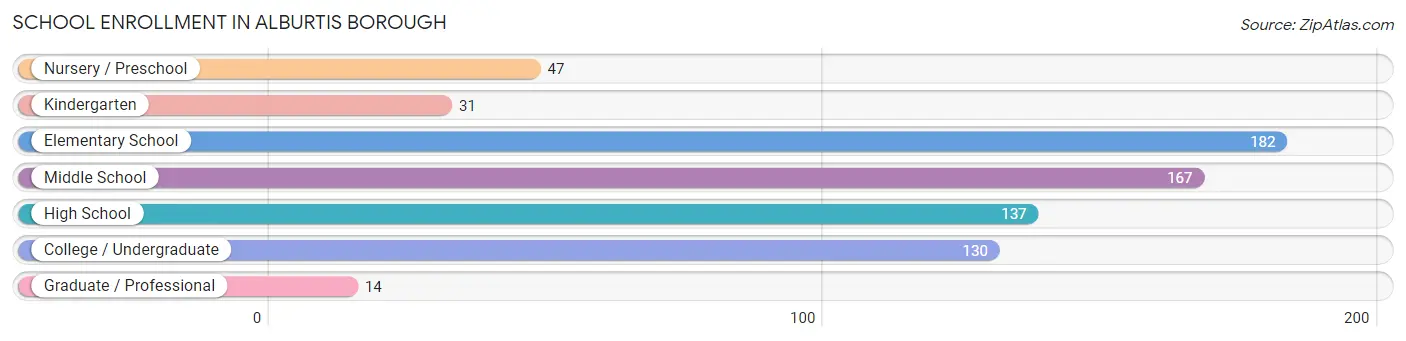
| School Level | # Students | % Students |
| Nursery / Preschool | 47 | 6.6% |
| Kindergarten | 31 | 4.4% |
| Elementary School | 182 | 25.7% |
| Middle School | 167 | 23.6% |
| High School | 137 | 19.4% |
| College / Undergraduate | 130 | 18.4% |
| Graduate / Professional | 14 | 2.0% |
| Total | 708 | 100.0% |
School Enrollment by Age by Funding Source in Alburtis borough
Out of a total of 708 students who are enrolled in schools in Alburtis borough, 115 (16.2%) attend a private institution, while the remaining 593 (83.8%) are enrolled in public schools. The age group of 3 to 4 year olds has the highest likelihood of being enrolled in private schools, with 19 (46.3% in the age bracket) enrolled. Conversely, the age group of 15 to 17 year olds has the lowest likelihood of being enrolled in a private school, with 90 (100.0% in the age bracket) attending a public institution.
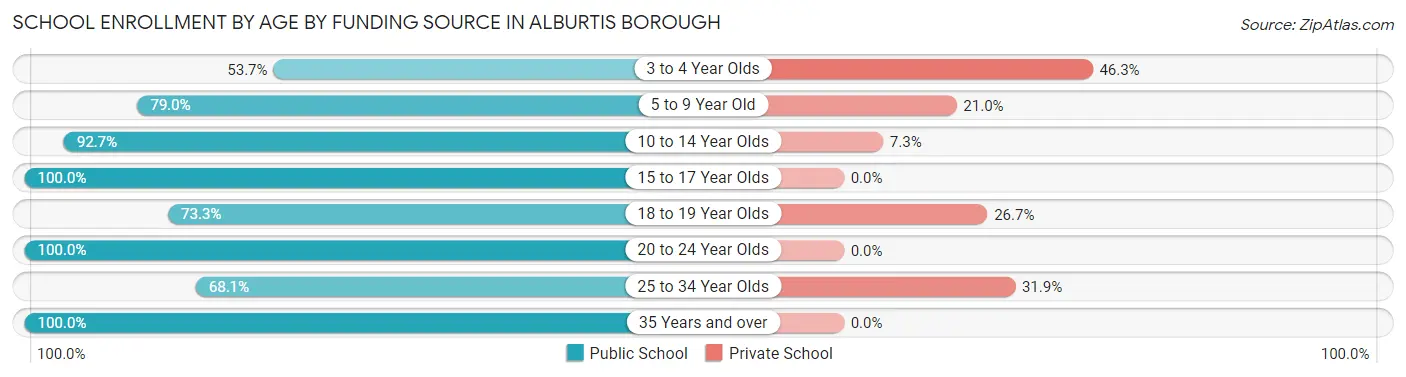
| Age Bracket | Public School | Private School |
| 3 to 4 Year Olds | 22 (53.7%) | 19 (46.3%) |
| 5 to 9 Year Old | 158 (79.0%) | 42 (21.0%) |
| 10 to 14 Year Olds | 203 (92.7%) | 16 (7.3%) |
| 15 to 17 Year Olds | 90 (100.0%) | 0 (0.0%) |
| 18 to 19 Year Olds | 63 (73.3%) | 23 (26.7%) |
| 20 to 24 Year Olds | 19 (100.0%) | 0 (0.0%) |
| 25 to 34 Year Olds | 32 (68.1%) | 15 (31.9%) |
| 35 Years and over | 6 (100.0%) | 0 (0.0%) |
| Total | 593 (83.8%) | 115 (16.2%) |
Educational Attainment by Field of Study in Alburtis borough
Education (146 | 20.9%), business (145 | 20.7%), science & technology (97 | 13.9%), engineering (58 | 8.3%), and arts & humanities (53 | 7.6%) are the most common fields of study among 699 individuals in Alburtis borough who have obtained a bachelor's degree or higher.
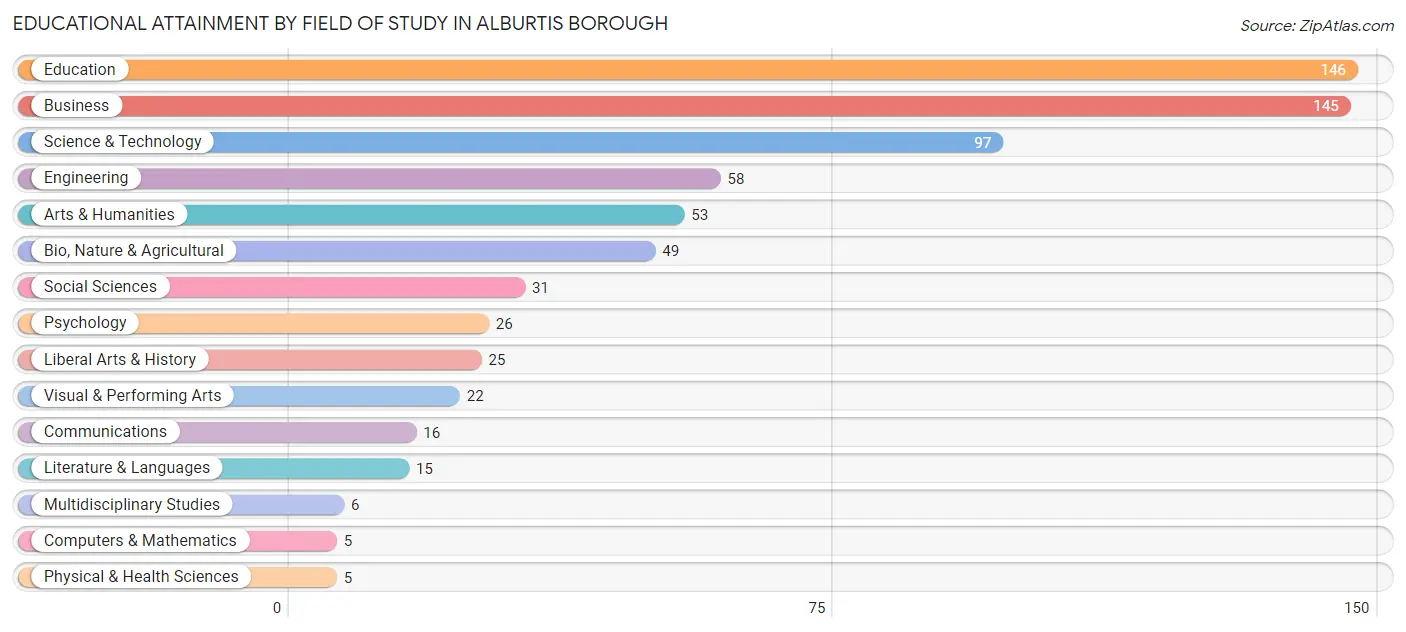
| Field of Study | # Graduates | % Graduates |
| Computers & Mathematics | 5 | 0.7% |
| Bio, Nature & Agricultural | 49 | 7.0% |
| Physical & Health Sciences | 5 | 0.7% |
| Psychology | 26 | 3.7% |
| Social Sciences | 31 | 4.4% |
| Engineering | 58 | 8.3% |
| Multidisciplinary Studies | 6 | 0.9% |
| Science & Technology | 97 | 13.9% |
| Business | 145 | 20.7% |
| Education | 146 | 20.9% |
| Literature & Languages | 15 | 2.1% |
| Liberal Arts & History | 25 | 3.6% |
| Visual & Performing Arts | 22 | 3.2% |
| Communications | 16 | 2.3% |
| Arts & Humanities | 53 | 7.6% |
| Total | 699 | 100.0% |
Transportation & Commute in Alburtis borough
Vehicle Availability by Sex in Alburtis borough
The most prevalent vehicle ownership categories in Alburtis borough are males with 2 vehicles (399, accounting for 53.3%) and females with 2 vehicles (322, making up 62.7%).
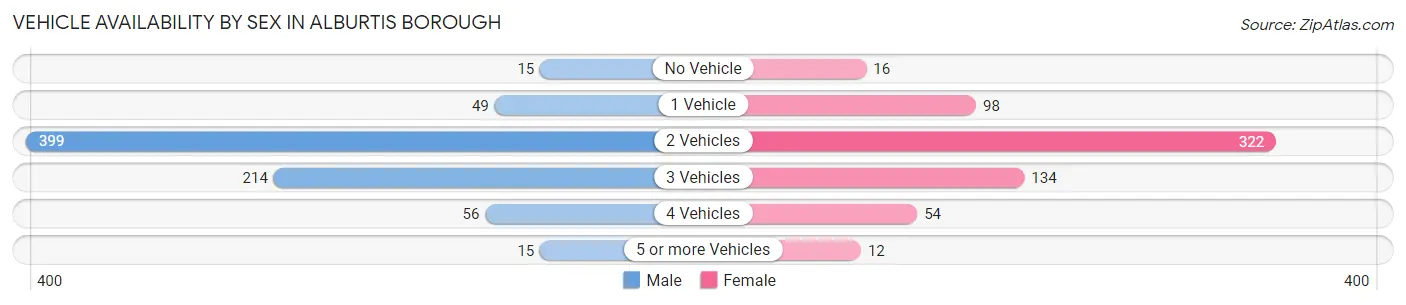
| Vehicles Available | Male | Female |
| No Vehicle | 15 (2.0%) | 16 (2.5%) |
| 1 Vehicle | 49 (6.6%) | 98 (15.4%) |
| 2 Vehicles | 399 (53.3%) | 322 (50.6%) |
| 3 Vehicles | 214 (28.6%) | 134 (21.1%) |
| 4 Vehicles | 56 (7.5%) | 54 (8.5%) |
| 5 or more Vehicles | 15 (2.0%) | 12 (1.9%) |
| Total | 748 (100.0%) | 636 (100.0%) |
Commute Time in Alburtis borough
The most frequently occuring commute durations in Alburtis borough are 10 to 14 minutes (202 commuters, 16.0%), 30 to 34 minutes (192 commuters, 15.2%), and 20 to 24 minutes (173 commuters, 13.7%).
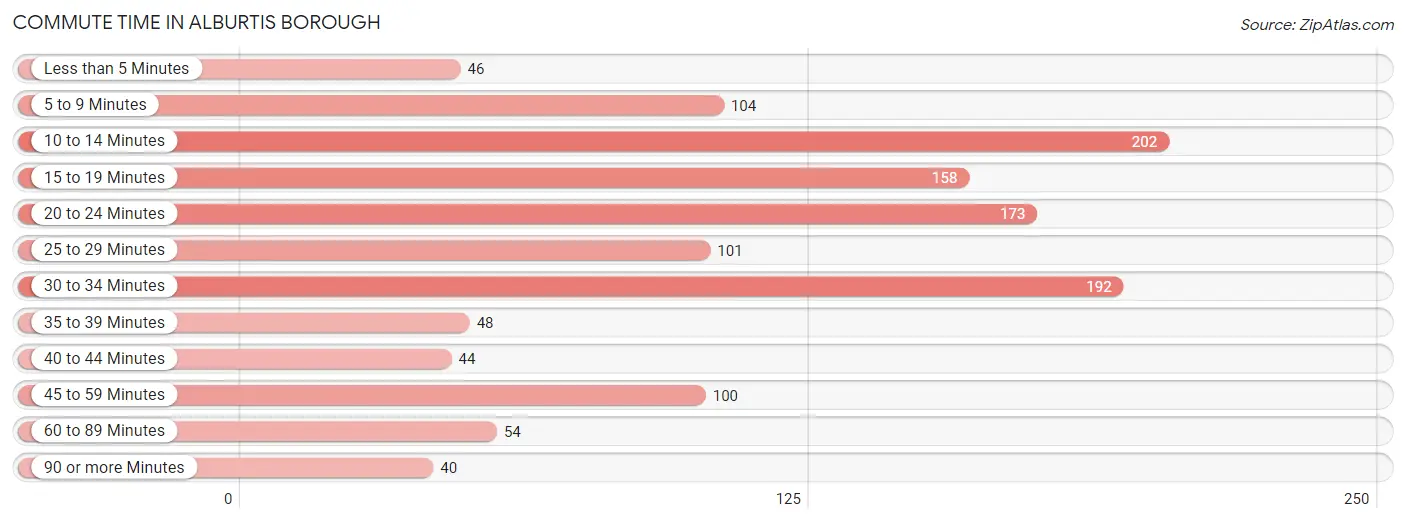
| Commute Time | # Commuters | % Commuters |
| Less than 5 Minutes | 46 | 3.6% |
| 5 to 9 Minutes | 104 | 8.2% |
| 10 to 14 Minutes | 202 | 16.0% |
| 15 to 19 Minutes | 158 | 12.5% |
| 20 to 24 Minutes | 173 | 13.7% |
| 25 to 29 Minutes | 101 | 8.0% |
| 30 to 34 Minutes | 192 | 15.2% |
| 35 to 39 Minutes | 48 | 3.8% |
| 40 to 44 Minutes | 44 | 3.5% |
| 45 to 59 Minutes | 100 | 7.9% |
| 60 to 89 Minutes | 54 | 4.3% |
| 90 or more Minutes | 40 | 3.2% |
Commute Time by Sex in Alburtis borough
The most common commute times in Alburtis borough are 10 to 14 minutes (107 commuters, 15.4%) for males and 15 to 19 minutes (107 commuters, 18.8%) for females.
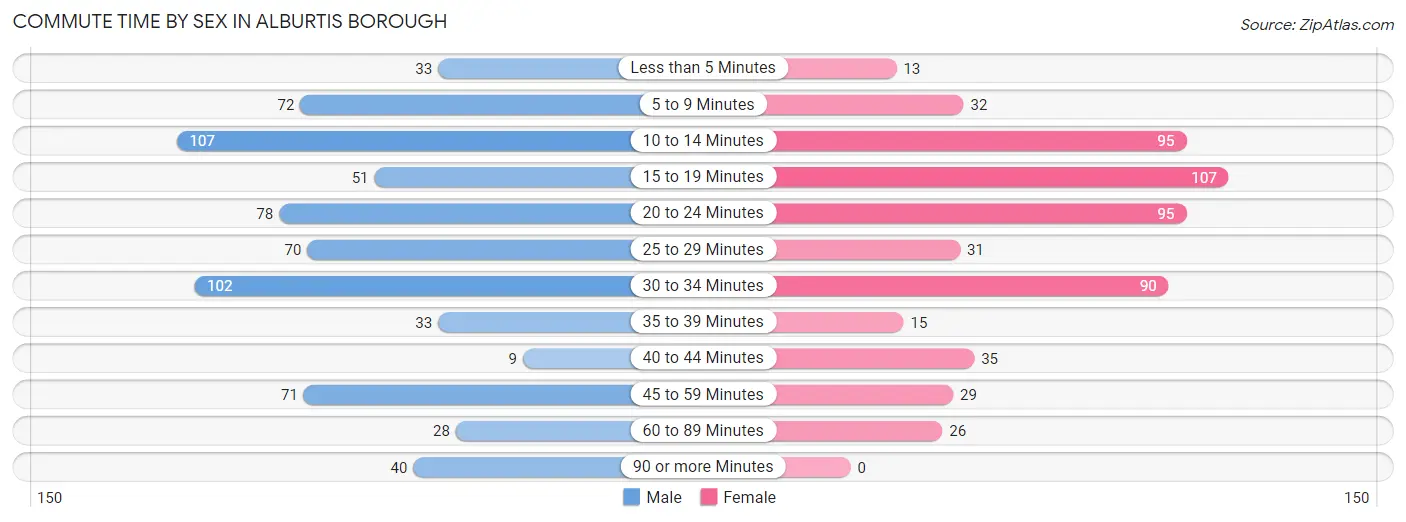
| Commute Time | Male | Female |
| Less than 5 Minutes | 33 (4.8%) | 13 (2.3%) |
| 5 to 9 Minutes | 72 (10.4%) | 32 (5.6%) |
| 10 to 14 Minutes | 107 (15.4%) | 95 (16.7%) |
| 15 to 19 Minutes | 51 (7.3%) | 107 (18.8%) |
| 20 to 24 Minutes | 78 (11.2%) | 95 (16.7%) |
| 25 to 29 Minutes | 70 (10.1%) | 31 (5.5%) |
| 30 to 34 Minutes | 102 (14.7%) | 90 (15.9%) |
| 35 to 39 Minutes | 33 (4.8%) | 15 (2.6%) |
| 40 to 44 Minutes | 9 (1.3%) | 35 (6.2%) |
| 45 to 59 Minutes | 71 (10.2%) | 29 (5.1%) |
| 60 to 89 Minutes | 28 (4.0%) | 26 (4.6%) |
| 90 or more Minutes | 40 (5.8%) | 0 (0.0%) |
Time of Departure to Work by Sex in Alburtis borough
The most frequent times of departure to work in Alburtis borough are 12:00 PM to 3:59 PM (112, 16.1%) for males and 7:00 AM to 7:29 AM (113, 19.9%) for females.
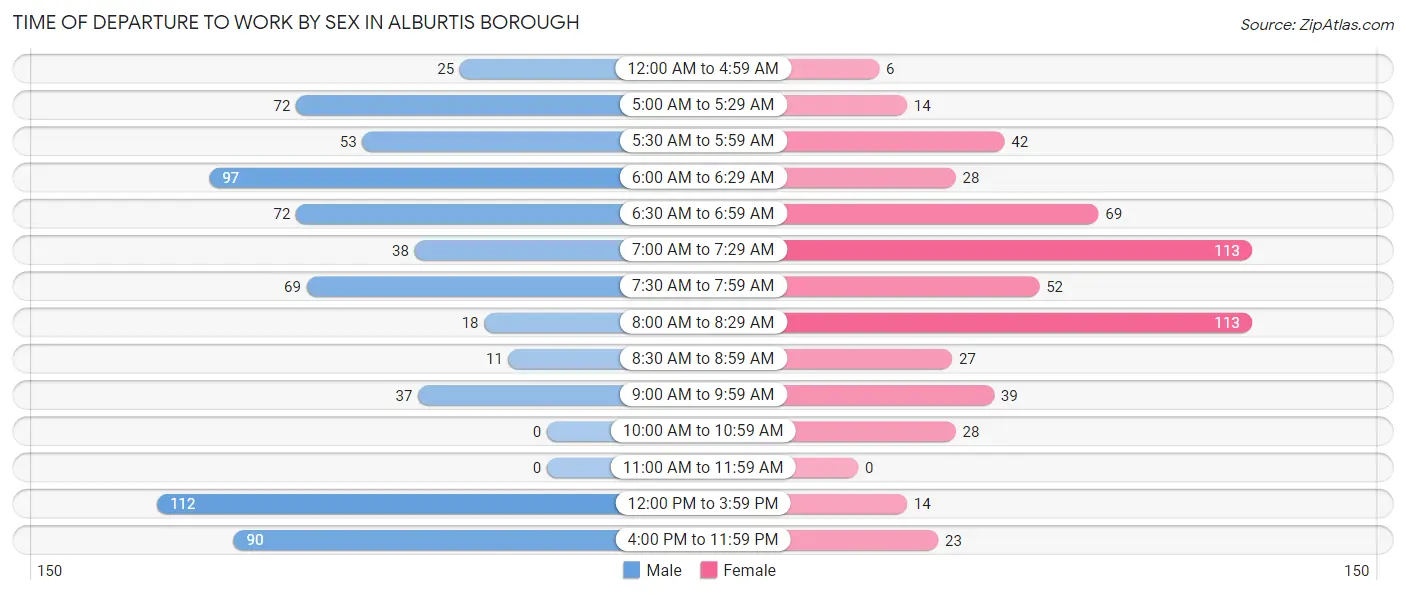
| Time of Departure | Male | Female |
| 12:00 AM to 4:59 AM | 25 (3.6%) | 6 (1.1%) |
| 5:00 AM to 5:29 AM | 72 (10.4%) | 14 (2.5%) |
| 5:30 AM to 5:59 AM | 53 (7.6%) | 42 (7.4%) |
| 6:00 AM to 6:29 AM | 97 (14.0%) | 28 (4.9%) |
| 6:30 AM to 6:59 AM | 72 (10.4%) | 69 (12.1%) |
| 7:00 AM to 7:29 AM | 38 (5.5%) | 113 (19.9%) |
| 7:30 AM to 7:59 AM | 69 (9.9%) | 52 (9.1%) |
| 8:00 AM to 8:29 AM | 18 (2.6%) | 113 (19.9%) |
| 8:30 AM to 8:59 AM | 11 (1.6%) | 27 (4.8%) |
| 9:00 AM to 9:59 AM | 37 (5.3%) | 39 (6.9%) |
| 10:00 AM to 10:59 AM | 0 (0.0%) | 28 (4.9%) |
| 11:00 AM to 11:59 AM | 0 (0.0%) | 0 (0.0%) |
| 12:00 PM to 3:59 PM | 112 (16.1%) | 14 (2.5%) |
| 4:00 PM to 11:59 PM | 90 (13.0%) | 23 (4.1%) |
| Total | 694 (100.0%) | 568 (100.0%) |
Housing Occupancy in Alburtis borough
Occupancy by Ownership in Alburtis borough
Of the total 870 dwellings in Alburtis borough, owner-occupied units account for 733 (84.3%), while renter-occupied units make up 137 (15.8%).
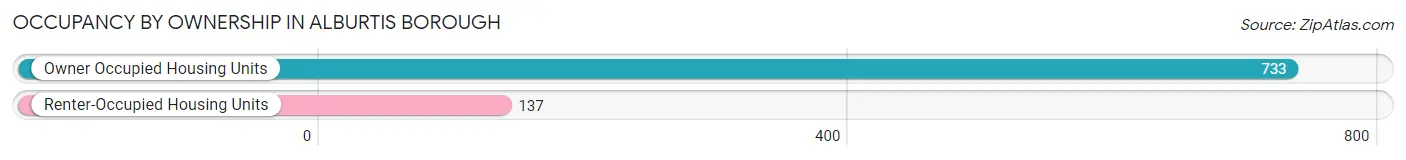
| Occupancy | # Housing Units | % Housing Units |
| Owner Occupied Housing Units | 733 | 84.3% |
| Renter-Occupied Housing Units | 137 | 15.8% |
| Total Occupied Housing Units | 870 | 100.0% |
Occupancy by Household Size in Alburtis borough
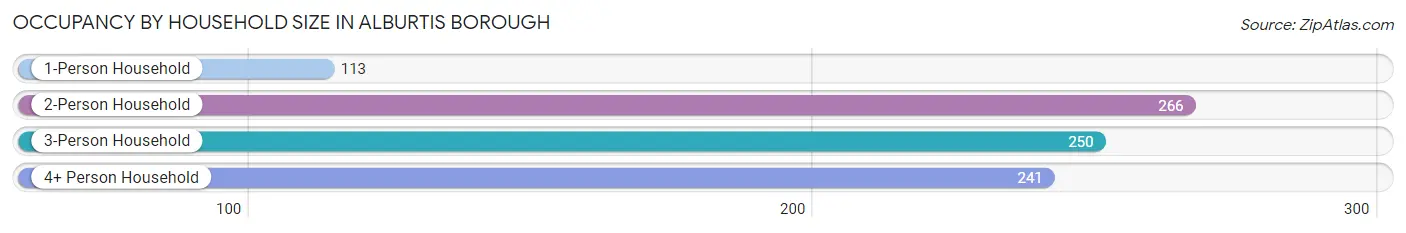
| Household Size | # Housing Units | % Housing Units |
| 1-Person Household | 113 | 13.0% |
| 2-Person Household | 266 | 30.6% |
| 3-Person Household | 250 | 28.7% |
| 4+ Person Household | 241 | 27.7% |
| Total Housing Units | 870 | 100.0% |
Occupancy by Ownership by Household Size in Alburtis borough
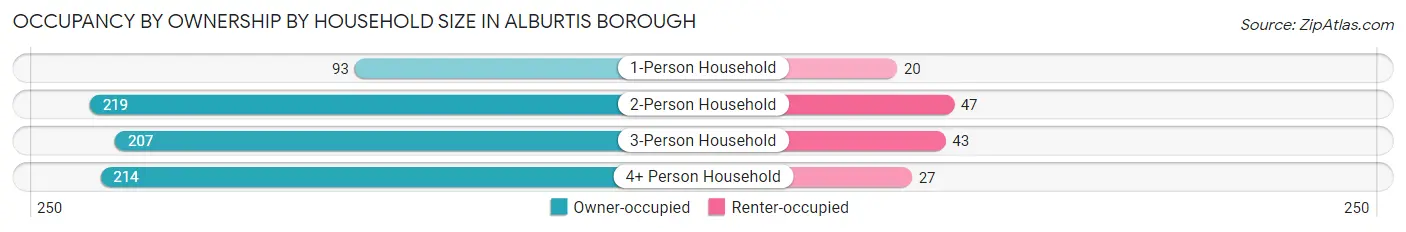
| Household Size | Owner-occupied | Renter-occupied |
| 1-Person Household | 93 (82.3%) | 20 (17.7%) |
| 2-Person Household | 219 (82.3%) | 47 (17.7%) |
| 3-Person Household | 207 (82.8%) | 43 (17.2%) |
| 4+ Person Household | 214 (88.8%) | 27 (11.2%) |
| Total Housing Units | 733 (84.3%) | 137 (15.8%) |
Occupancy by Educational Attainment in Alburtis borough
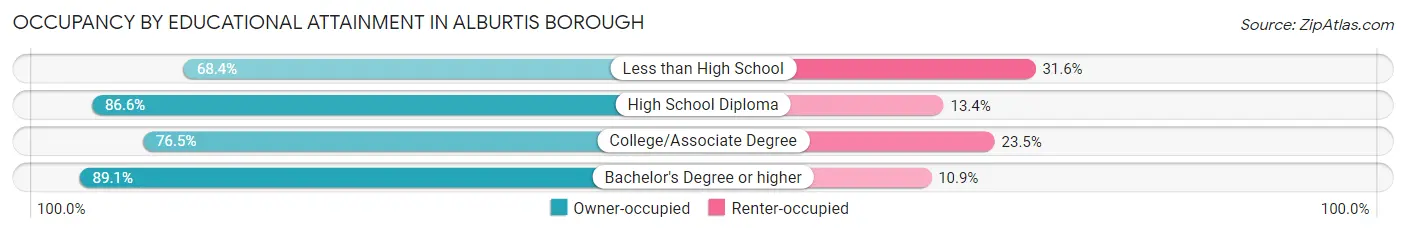
| Household Size | Owner-occupied | Renter-occupied |
| Less than High School | 26 (68.4%) | 12 (31.6%) |
| High School Diploma | 188 (86.6%) | 29 (13.4%) |
| College/Associate Degree | 176 (76.5%) | 54 (23.5%) |
| Bachelor's Degree or higher | 343 (89.1%) | 42 (10.9%) |
Occupancy by Age of Householder in Alburtis borough
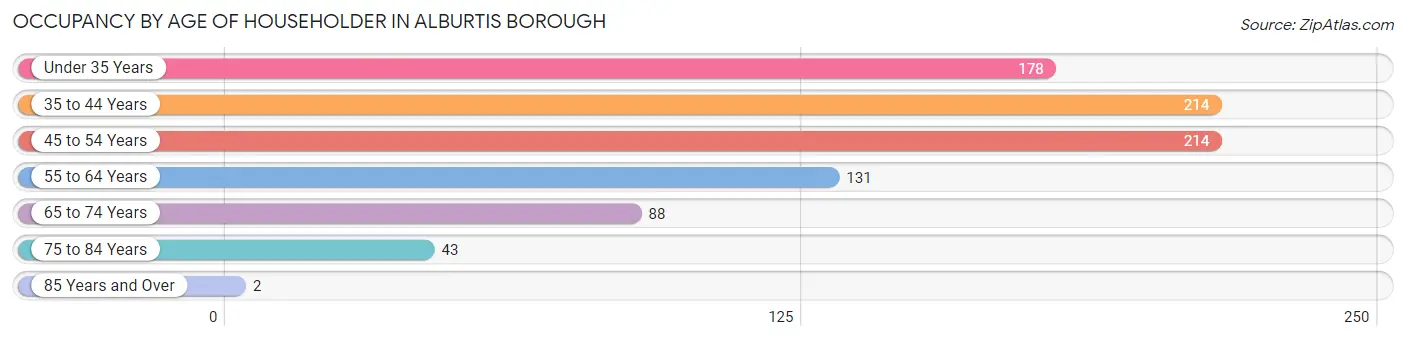
| Age Bracket | # Households | % Households |
| Under 35 Years | 178 | 20.5% |
| 35 to 44 Years | 214 | 24.6% |
| 45 to 54 Years | 214 | 24.6% |
| 55 to 64 Years | 131 | 15.1% |
| 65 to 74 Years | 88 | 10.1% |
| 75 to 84 Years | 43 | 4.9% |
| 85 Years and Over | 2 | 0.2% |
| Total | 870 | 100.0% |
Housing Finances in Alburtis borough
Median Income by Occupancy in Alburtis borough
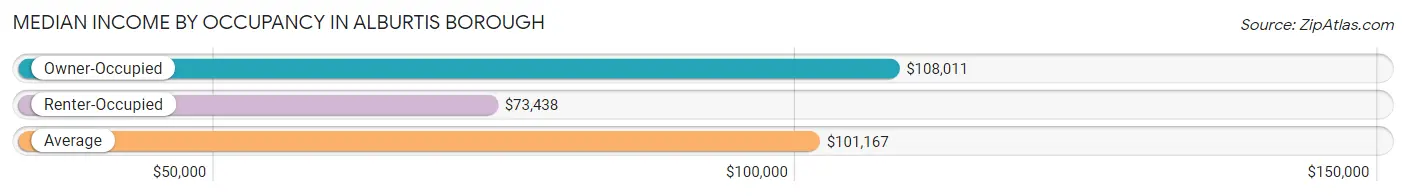
| Occupancy Type | # Households | Median Income |
| Owner-Occupied | 733 (84.3%) | $108,011 |
| Renter-Occupied | 137 (15.8%) | $73,438 |
| Average | 870 (100.0%) | $101,167 |
Occupancy by Householder Income Bracket in Alburtis borough
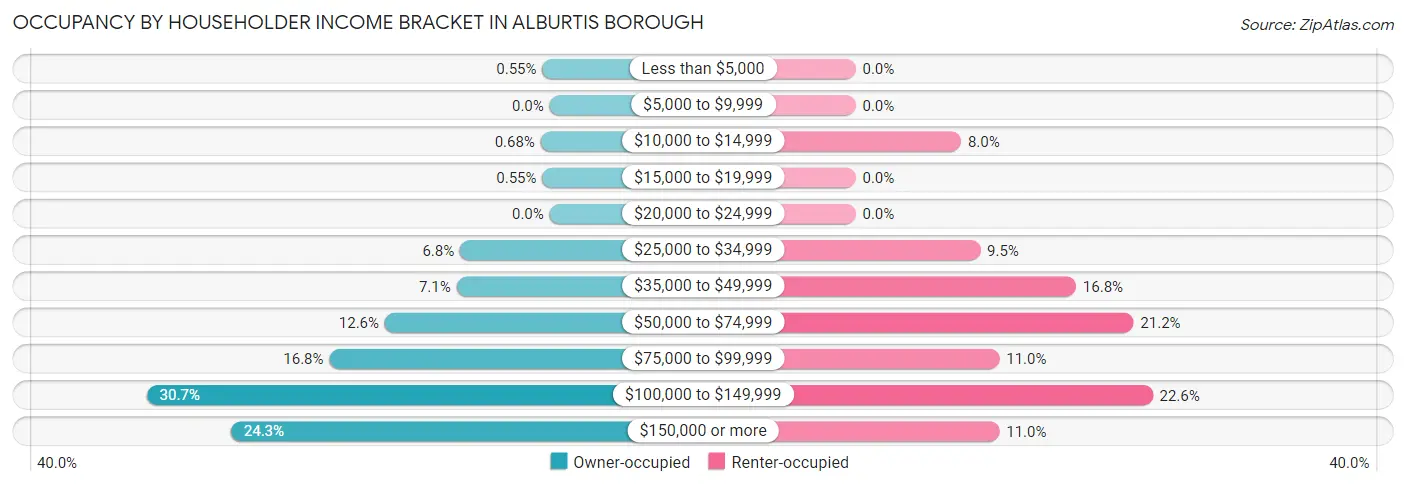
| Income Bracket | Owner-occupied | Renter-occupied |
| Less than $5,000 | 4 (0.5%) | 0 (0.0%) |
| $5,000 to $9,999 | 0 (0.0%) | 0 (0.0%) |
| $10,000 to $14,999 | 5 (0.7%) | 11 (8.0%) |
| $15,000 to $19,999 | 4 (0.5%) | 0 (0.0%) |
| $20,000 to $24,999 | 0 (0.0%) | 0 (0.0%) |
| $25,000 to $34,999 | 50 (6.8%) | 13 (9.5%) |
| $35,000 to $49,999 | 52 (7.1%) | 23 (16.8%) |
| $50,000 to $74,999 | 92 (12.6%) | 29 (21.2%) |
| $75,000 to $99,999 | 123 (16.8%) | 15 (11.0%) |
| $100,000 to $149,999 | 225 (30.7%) | 31 (22.6%) |
| $150,000 or more | 178 (24.3%) | 15 (11.0%) |
| Total | 733 (100.0%) | 137 (100.0%) |
Monthly Housing Cost Tiers in Alburtis borough
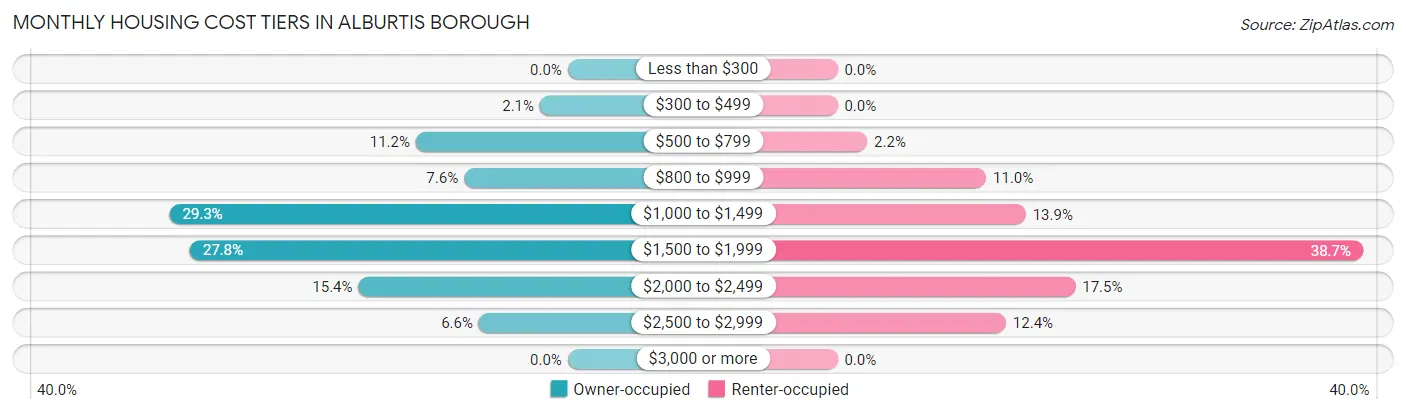
| Monthly Cost | Owner-occupied | Renter-occupied |
| Less than $300 | 0 (0.0%) | 0 (0.0%) |
| $300 to $499 | 15 (2.1%) | 0 (0.0%) |
| $500 to $799 | 82 (11.2%) | 3 (2.2%) |
| $800 to $999 | 56 (7.6%) | 15 (11.0%) |
| $1,000 to $1,499 | 215 (29.3%) | 19 (13.9%) |
| $1,500 to $1,999 | 204 (27.8%) | 53 (38.7%) |
| $2,000 to $2,499 | 113 (15.4%) | 24 (17.5%) |
| $2,500 to $2,999 | 48 (6.6%) | 17 (12.4%) |
| $3,000 or more | 0 (0.0%) | 0 (0.0%) |
| Total | 733 (100.0%) | 137 (100.0%) |
Physical Housing Characteristics in Alburtis borough
Housing Structures in Alburtis borough
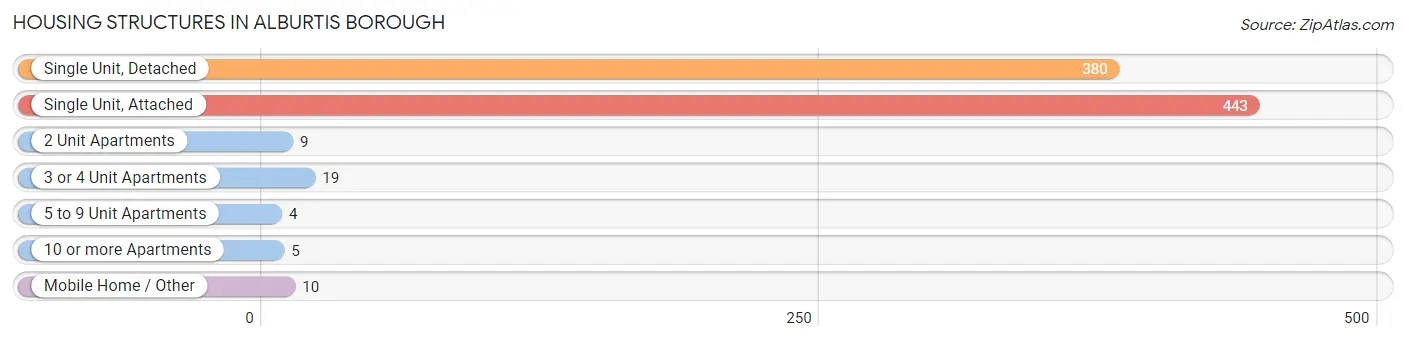
| Structure Type | # Housing Units | % Housing Units |
| Single Unit, Detached | 380 | 43.7% |
| Single Unit, Attached | 443 | 50.9% |
| 2 Unit Apartments | 9 | 1.0% |
| 3 or 4 Unit Apartments | 19 | 2.2% |
| 5 to 9 Unit Apartments | 4 | 0.5% |
| 10 or more Apartments | 5 | 0.6% |
| Mobile Home / Other | 10 | 1.1% |
| Total | 870 | 100.0% |
Housing Structures by Occupancy in Alburtis borough
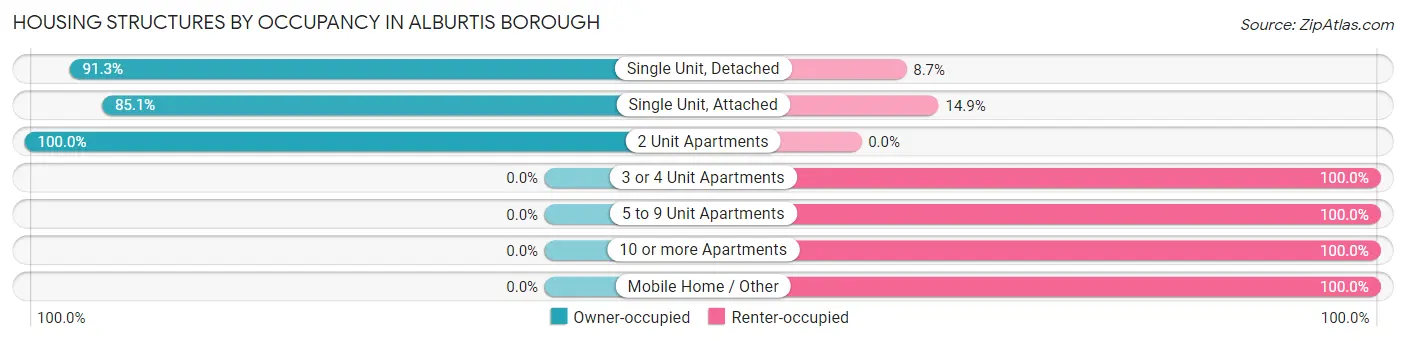
| Structure Type | Owner-occupied | Renter-occupied |
| Single Unit, Detached | 347 (91.3%) | 33 (8.7%) |
| Single Unit, Attached | 377 (85.1%) | 66 (14.9%) |
| 2 Unit Apartments | 9 (100.0%) | 0 (0.0%) |
| 3 or 4 Unit Apartments | 0 (0.0%) | 19 (100.0%) |
| 5 to 9 Unit Apartments | 0 (0.0%) | 4 (100.0%) |
| 10 or more Apartments | 0 (0.0%) | 5 (100.0%) |
| Mobile Home / Other | 0 (0.0%) | 10 (100.0%) |
| Total | 733 (84.3%) | 137 (15.8%) |
Housing Structures by Number of Rooms in Alburtis borough
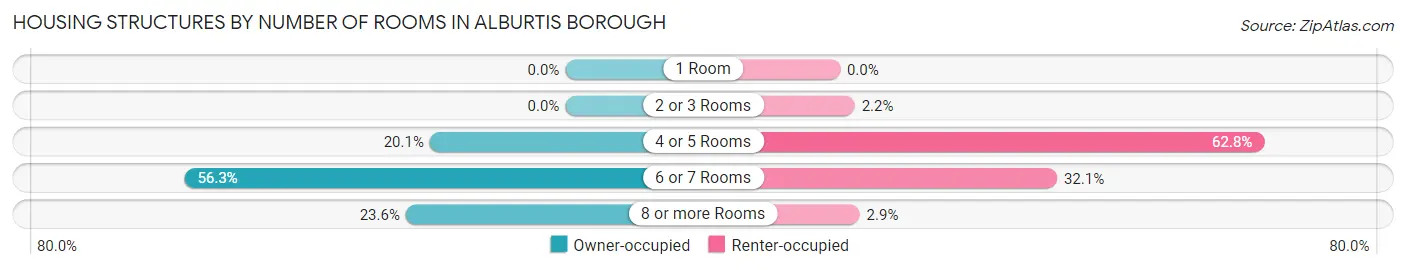
| Number of Rooms | Owner-occupied | Renter-occupied |
| 1 Room | 0 (0.0%) | 0 (0.0%) |
| 2 or 3 Rooms | 0 (0.0%) | 3 (2.2%) |
| 4 or 5 Rooms | 147 (20.1%) | 86 (62.8%) |
| 6 or 7 Rooms | 413 (56.3%) | 44 (32.1%) |
| 8 or more Rooms | 173 (23.6%) | 4 (2.9%) |
| Total | 733 (100.0%) | 137 (100.0%) |
Housing Structure by Heating Type in Alburtis borough
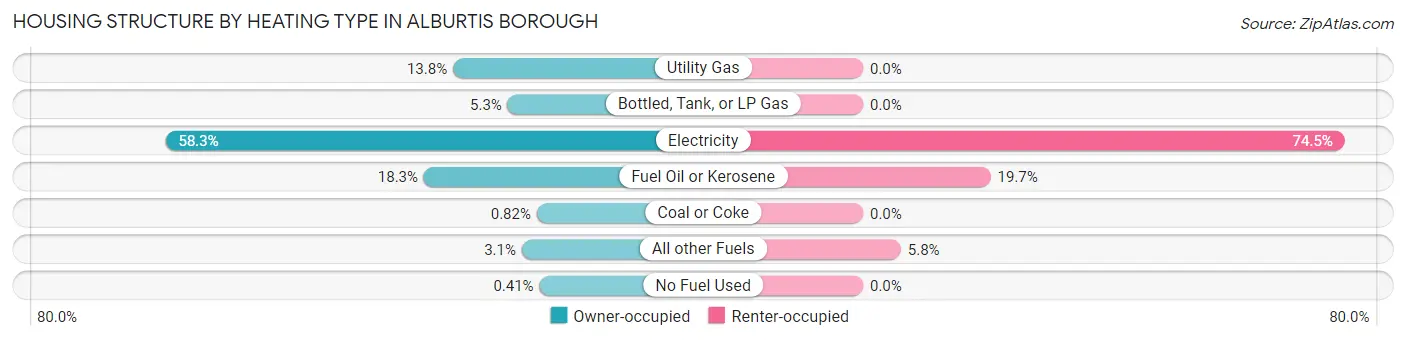
| Heating Type | Owner-occupied | Renter-occupied |
| Utility Gas | 101 (13.8%) | 0 (0.0%) |
| Bottled, Tank, or LP Gas | 39 (5.3%) | 0 (0.0%) |
| Electricity | 427 (58.3%) | 102 (74.5%) |
| Fuel Oil or Kerosene | 134 (18.3%) | 27 (19.7%) |
| Coal or Coke | 6 (0.8%) | 0 (0.0%) |
| All other Fuels | 23 (3.1%) | 8 (5.8%) |
| No Fuel Used | 3 (0.4%) | 0 (0.0%) |
| Total | 733 (100.0%) | 137 (100.0%) |
Household Vehicle Usage in Alburtis borough
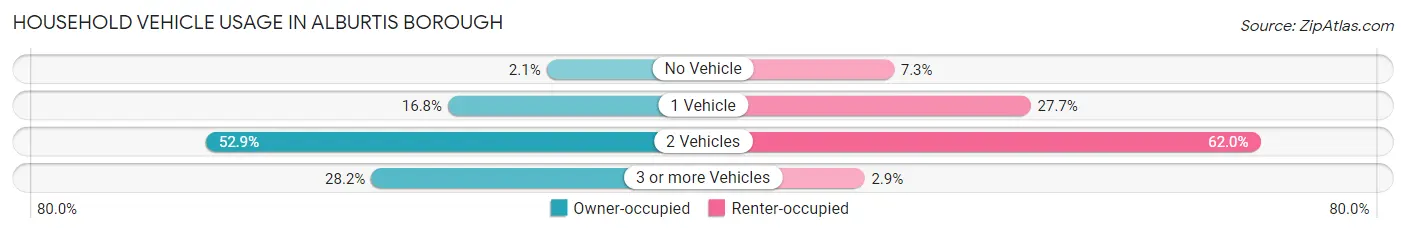
| Vehicles per Household | Owner-occupied | Renter-occupied |
| No Vehicle | 15 (2.1%) | 10 (7.3%) |
| 1 Vehicle | 123 (16.8%) | 38 (27.7%) |
| 2 Vehicles | 388 (52.9%) | 85 (62.0%) |
| 3 or more Vehicles | 207 (28.2%) | 4 (2.9%) |
| Total | 733 (100.0%) | 137 (100.0%) |
Real Estate & Mortgages in Alburtis borough
Real Estate and Mortgage Overview in Alburtis borough
| Characteristic | Without Mortgage | With Mortgage |
| Housing Units | 162 | 571 |
| Median Property Value | $236,400 | $226,400 |
| Median Household Income | $85,714 | $168 |
| Monthly Housing Costs | $782 | $0 |
| Real Estate Taxes | $3,900 | $10 |
Property Value by Mortgage Status in Alburtis borough
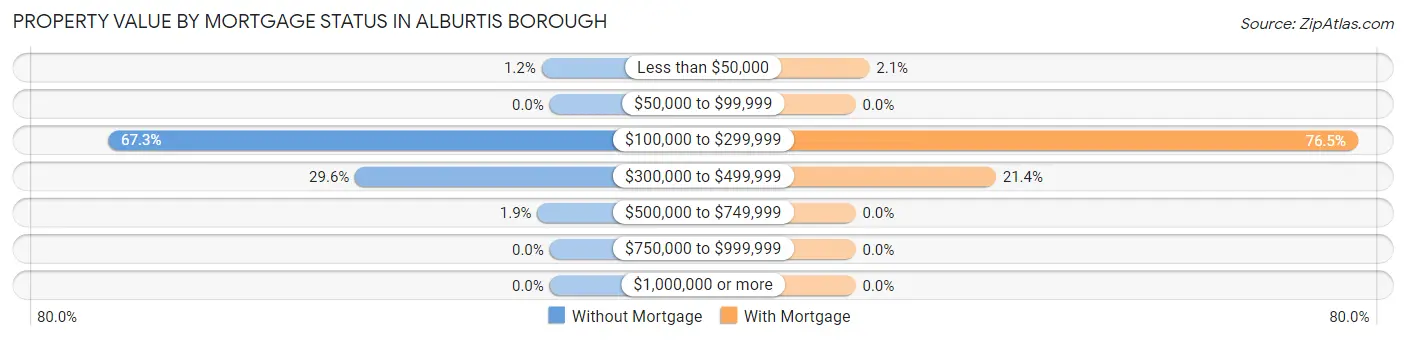
| Property Value | Without Mortgage | With Mortgage |
| Less than $50,000 | 2 (1.2%) | 12 (2.1%) |
| $50,000 to $99,999 | 0 (0.0%) | 0 (0.0%) |
| $100,000 to $299,999 | 109 (67.3%) | 437 (76.5%) |
| $300,000 to $499,999 | 48 (29.6%) | 122 (21.4%) |
| $500,000 to $749,999 | 3 (1.8%) | 0 (0.0%) |
| $750,000 to $999,999 | 0 (0.0%) | 0 (0.0%) |
| $1,000,000 or more | 0 (0.0%) | 0 (0.0%) |
| Total | 162 (100.0%) | 571 (100.0%) |
Household Income by Mortgage Status in Alburtis borough
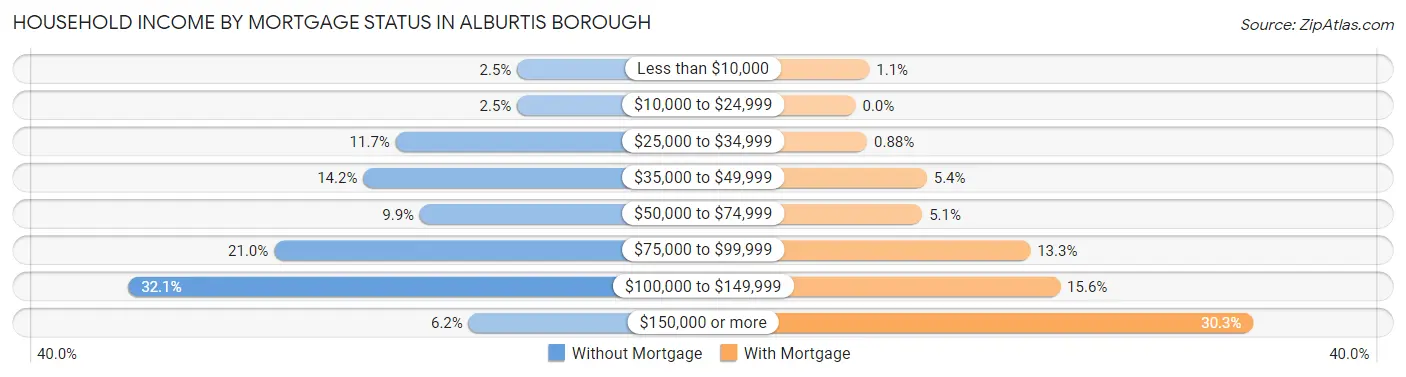
| Household Income | Without Mortgage | With Mortgage |
| Less than $10,000 | 4 (2.5%) | 6 (1.1%) |
| $10,000 to $24,999 | 4 (2.5%) | 0 (0.0%) |
| $25,000 to $34,999 | 19 (11.7%) | 5 (0.9%) |
| $35,000 to $49,999 | 23 (14.2%) | 31 (5.4%) |
| $50,000 to $74,999 | 16 (9.9%) | 29 (5.1%) |
| $75,000 to $99,999 | 34 (21.0%) | 76 (13.3%) |
| $100,000 to $149,999 | 52 (32.1%) | 89 (15.6%) |
| $150,000 or more | 10 (6.2%) | 173 (30.3%) |
| Total | 162 (100.0%) | 571 (100.0%) |
Property Value to Household Income Ratio in Alburtis borough
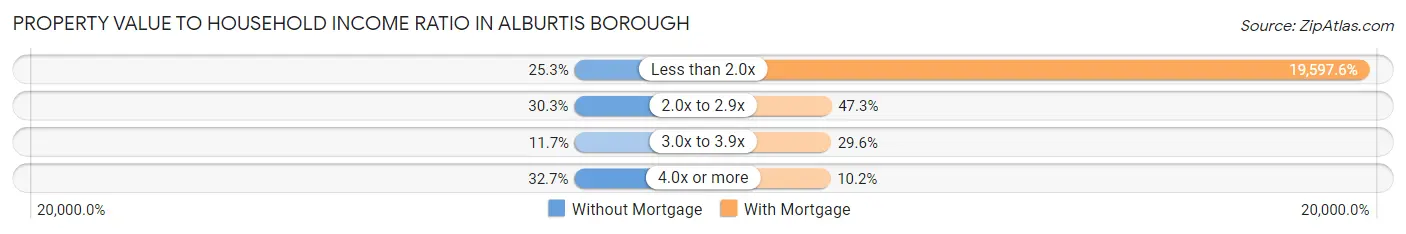
| Value-to-Income Ratio | Without Mortgage | With Mortgage |
| Less than 2.0x | 41 (25.3%) | 111,902 (19,597.6%) |
| 2.0x to 2.9x | 49 (30.2%) | 270 (47.3%) |
| 3.0x to 3.9x | 19 (11.7%) | 169 (29.6%) |
| 4.0x or more | 53 (32.7%) | 58 (10.2%) |
| Total | 162 (100.0%) | 571 (100.0%) |
Real Estate Taxes by Mortgage Status in Alburtis borough
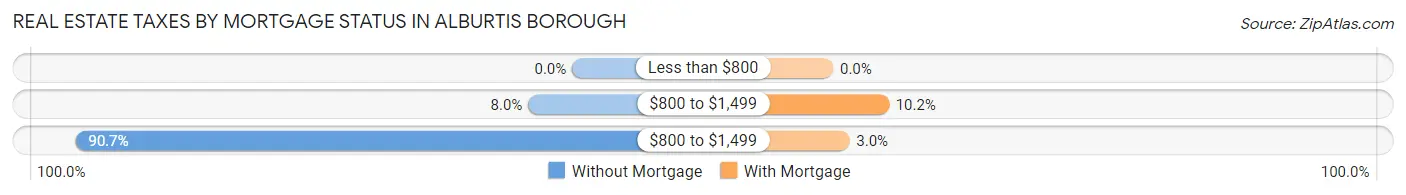
| Property Taxes | Without Mortgage | With Mortgage |
| Less than $800 | 0 (0.0%) | 0 (0.0%) |
| $800 to $1,499 | 13 (8.0%) | 58 (10.2%) |
| $800 to $1,499 | 147 (90.7%) | 17 (3.0%) |
| Total | 162 (100.0%) | 571 (100.0%) |
Health & Disability in Alburtis borough
Health Insurance Coverage by Age in Alburtis borough
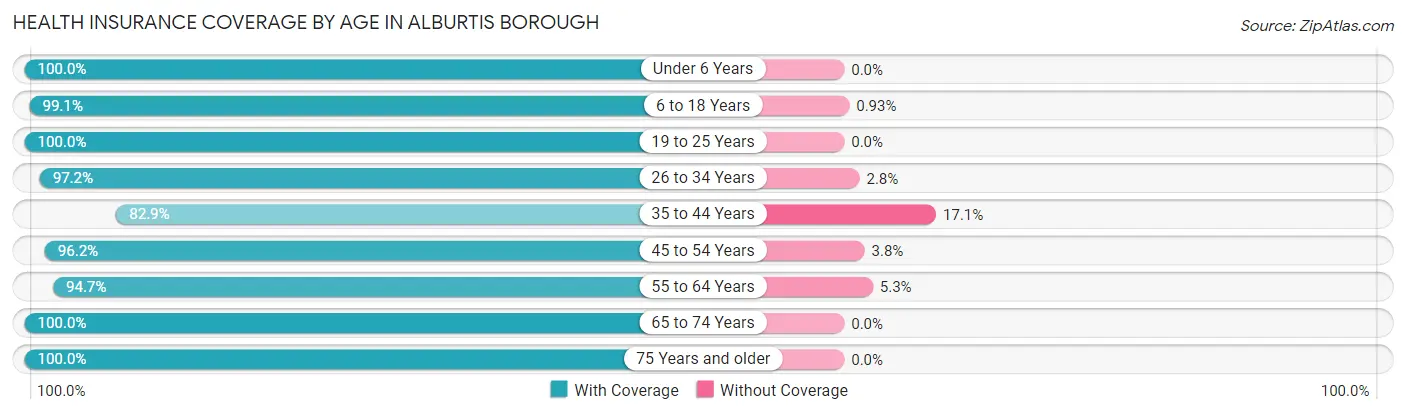
| Age Bracket | With Coverage | Without Coverage |
| Under 6 Years | 260 (100.0%) | 0 (0.0%) |
| 6 to 18 Years | 531 (99.1%) | 5 (0.9%) |
| 19 to 25 Years | 223 (100.0%) | 0 (0.0%) |
| 26 to 34 Years | 342 (97.2%) | 10 (2.8%) |
| 35 to 44 Years | 363 (82.9%) | 75 (17.1%) |
| 45 to 54 Years | 330 (96.2%) | 13 (3.8%) |
| 55 to 64 Years | 178 (94.7%) | 10 (5.3%) |
| 65 to 74 Years | 143 (100.0%) | 0 (0.0%) |
| 75 Years and older | 69 (100.0%) | 0 (0.0%) |
| Total | 2,439 (95.6%) | 113 (4.4%) |
Health Insurance Coverage by Citizenship Status in Alburtis borough
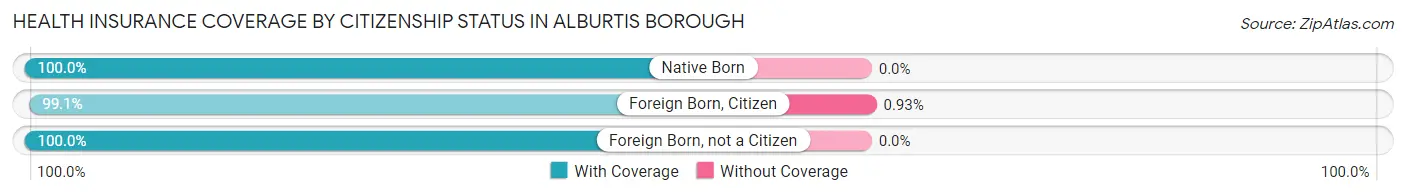
| Citizenship Status | With Coverage | Without Coverage |
| Native Born | 260 (100.0%) | 0 (0.0%) |
| Foreign Born, Citizen | 531 (99.1%) | 5 (0.9%) |
| Foreign Born, not a Citizen | 223 (100.0%) | 0 (0.0%) |
Health Insurance Coverage by Household Income in Alburtis borough
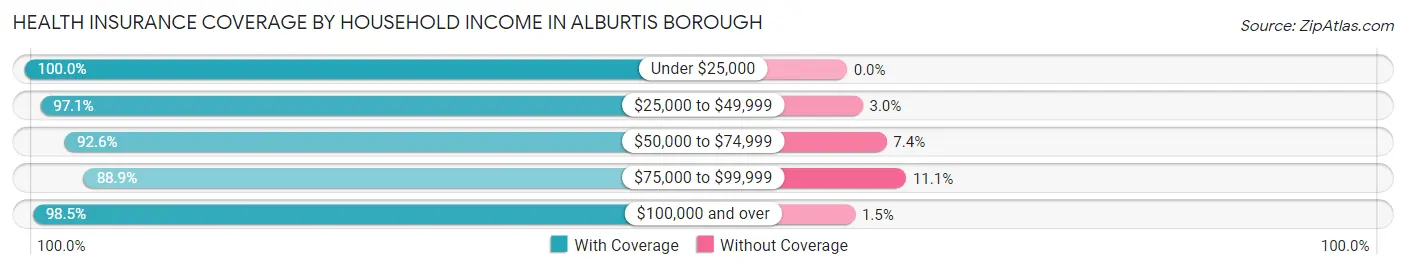
| Household Income | With Coverage | Without Coverage |
| Under $25,000 | 62 (100.0%) | 0 (0.0%) |
| $25,000 to $49,999 | 296 (97.1%) | 9 (2.9%) |
| $50,000 to $74,999 | 337 (92.6%) | 27 (7.4%) |
| $75,000 to $99,999 | 457 (88.9%) | 57 (11.1%) |
| $100,000 and over | 1,287 (98.5%) | 20 (1.5%) |
Public vs Private Health Insurance Coverage by Age in Alburtis borough
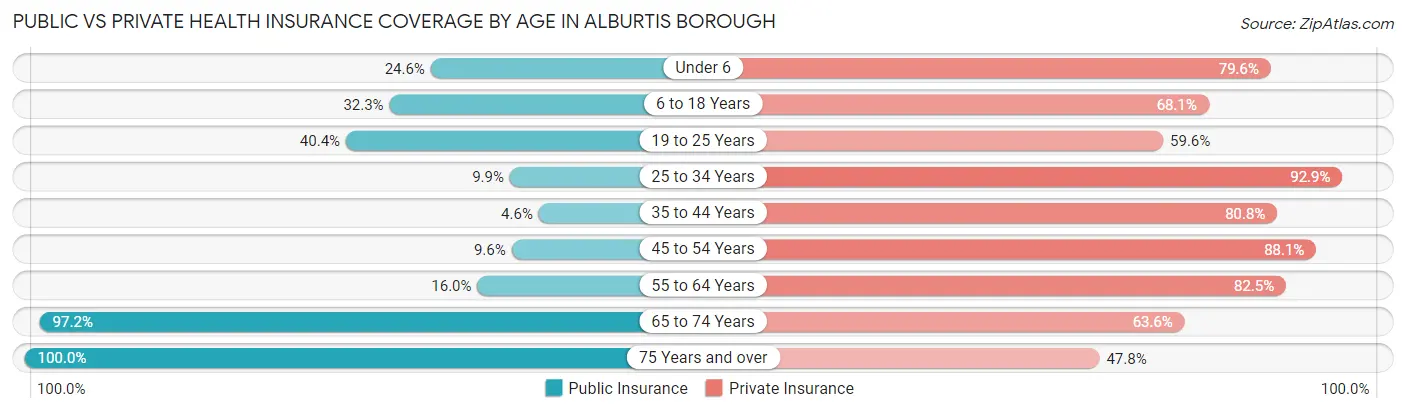
| Age Bracket | Public Insurance | Private Insurance |
| Under 6 | 64 (24.6%) | 207 (79.6%) |
| 6 to 18 Years | 173 (32.3%) | 365 (68.1%) |
| 19 to 25 Years | 90 (40.4%) | 133 (59.6%) |
| 25 to 34 Years | 35 (9.9%) | 327 (92.9%) |
| 35 to 44 Years | 20 (4.6%) | 354 (80.8%) |
| 45 to 54 Years | 33 (9.6%) | 302 (88.0%) |
| 55 to 64 Years | 30 (16.0%) | 155 (82.5%) |
| 65 to 74 Years | 139 (97.2%) | 91 (63.6%) |
| 75 Years and over | 69 (100.0%) | 33 (47.8%) |
| Total | 653 (25.6%) | 1,967 (77.1%) |
Disability Status by Sex by Age in Alburtis borough
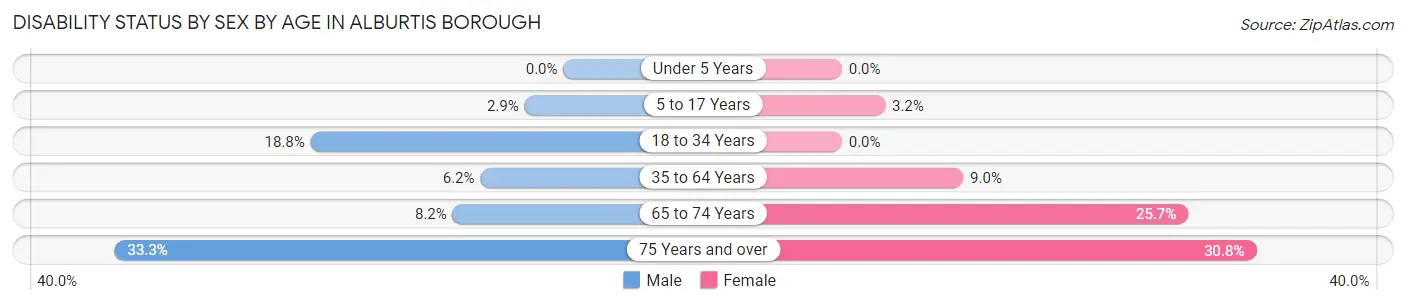
| Age Bracket | Male | Female |
| Under 5 Years | 0 (0.0%) | 0 (0.0%) |
| 5 to 17 Years | 10 (2.9%) | 6 (3.2%) |
| 18 to 34 Years | 64 (18.8%) | 0 (0.0%) |
| 35 to 64 Years | 31 (6.2%) | 42 (9.0%) |
| 65 to 74 Years | 6 (8.2%) | 18 (25.7%) |
| 75 Years and over | 10 (33.3%) | 12 (30.8%) |
Disability Class by Sex by Age in Alburtis borough
Disability Class: Hearing Difficulty
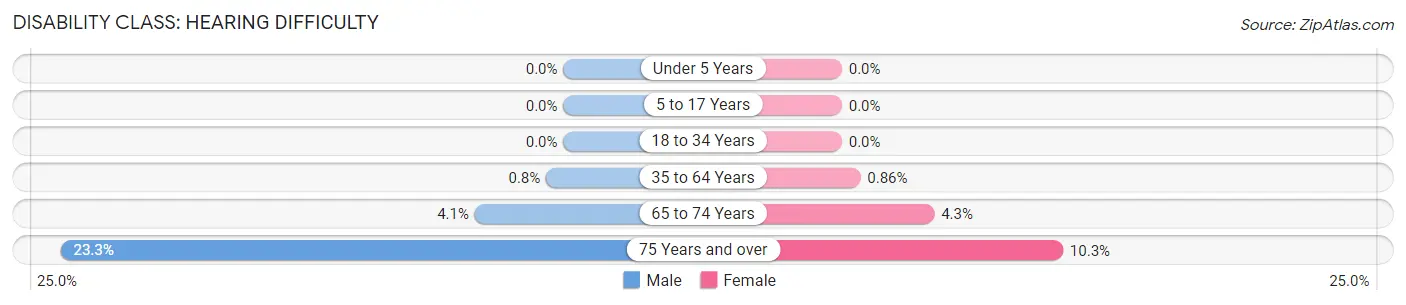
| Age Bracket | Male | Female |
| Under 5 Years | 0 (0.0%) | 0 (0.0%) |
| 5 to 17 Years | 0 (0.0%) | 0 (0.0%) |
| 18 to 34 Years | 0 (0.0%) | 0 (0.0%) |
| 35 to 64 Years | 4 (0.8%) | 4 (0.9%) |
| 65 to 74 Years | 3 (4.1%) | 3 (4.3%) |
| 75 Years and over | 7 (23.3%) | 4 (10.3%) |
Disability Class: Vision Difficulty
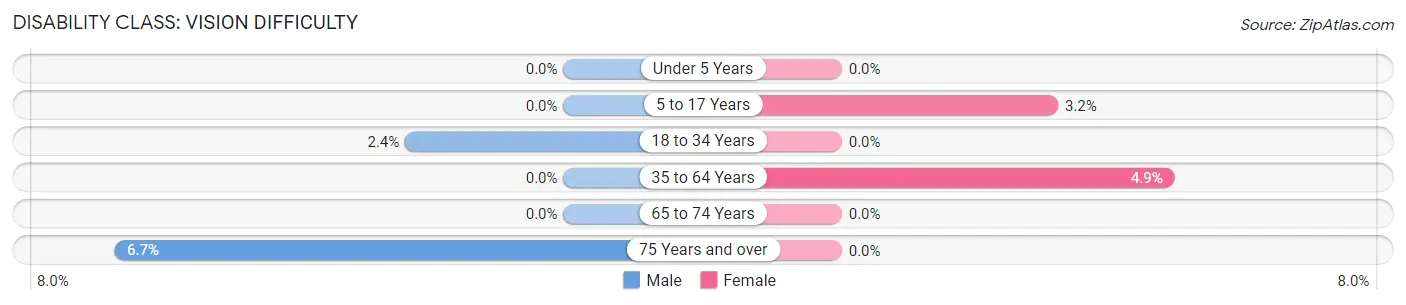
| Age Bracket | Male | Female |
| Under 5 Years | 0 (0.0%) | 0 (0.0%) |
| 5 to 17 Years | 0 (0.0%) | 6 (3.2%) |
| 18 to 34 Years | 8 (2.4%) | 0 (0.0%) |
| 35 to 64 Years | 0 (0.0%) | 23 (4.9%) |
| 65 to 74 Years | 0 (0.0%) | 0 (0.0%) |
| 75 Years and over | 2 (6.7%) | 0 (0.0%) |
Disability Class: Cognitive Difficulty
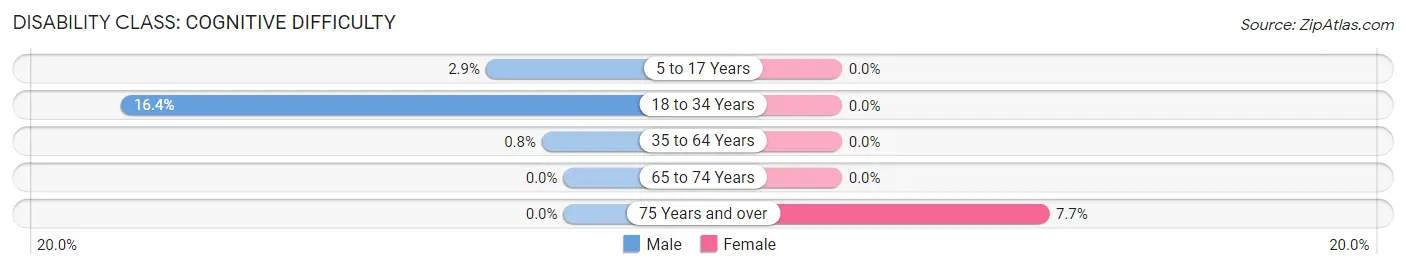
| Age Bracket | Male | Female |
| 5 to 17 Years | 10 (2.9%) | 0 (0.0%) |
| 18 to 34 Years | 56 (16.4%) | 0 (0.0%) |
| 35 to 64 Years | 4 (0.8%) | 0 (0.0%) |
| 65 to 74 Years | 0 (0.0%) | 0 (0.0%) |
| 75 Years and over | 0 (0.0%) | 3 (7.7%) |
Disability Class: Ambulatory Difficulty
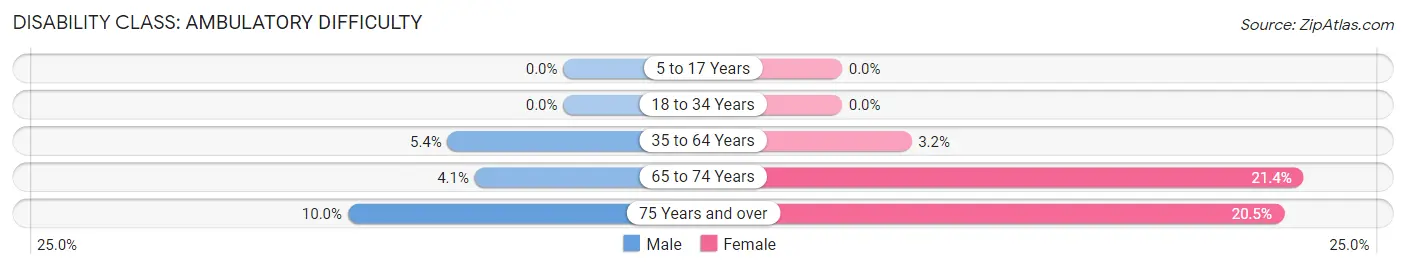
| Age Bracket | Male | Female |
| 5 to 17 Years | 0 (0.0%) | 0 (0.0%) |
| 18 to 34 Years | 0 (0.0%) | 0 (0.0%) |
| 35 to 64 Years | 27 (5.4%) | 15 (3.2%) |
| 65 to 74 Years | 3 (4.1%) | 15 (21.4%) |
| 75 Years and over | 3 (10.0%) | 8 (20.5%) |
Disability Class: Self-Care Difficulty
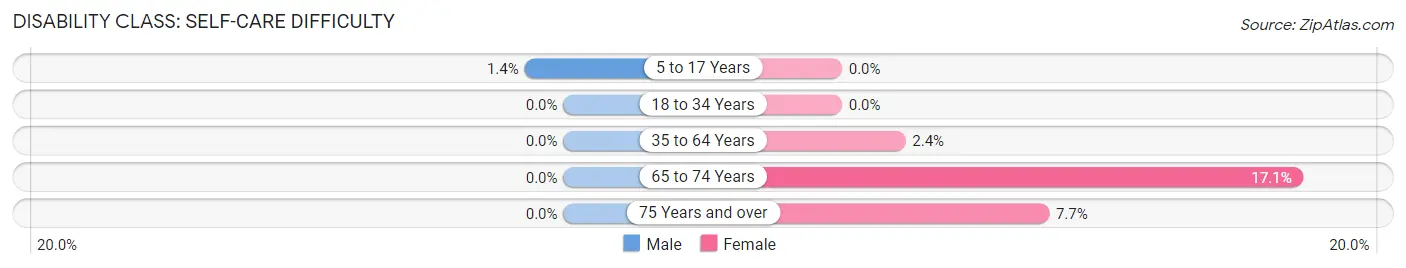
| Age Bracket | Male | Female |
| 5 to 17 Years | 5 (1.4%) | 0 (0.0%) |
| 18 to 34 Years | 0 (0.0%) | 0 (0.0%) |
| 35 to 64 Years | 0 (0.0%) | 11 (2.4%) |
| 65 to 74 Years | 0 (0.0%) | 12 (17.1%) |
| 75 Years and over | 0 (0.0%) | 3 (7.7%) |
Technology Access in Alburtis borough
Computing Device Access in Alburtis borough
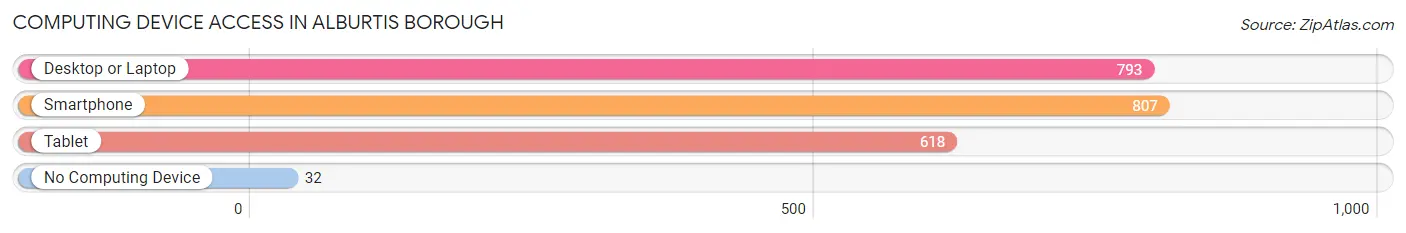
| Device Type | # Households | % Households |
| Desktop or Laptop | 793 | 91.1% |
| Smartphone | 807 | 92.8% |
| Tablet | 618 | 71.0% |
| No Computing Device | 32 | 3.7% |
| Total | 870 | 100.0% |
Internet Access in Alburtis borough
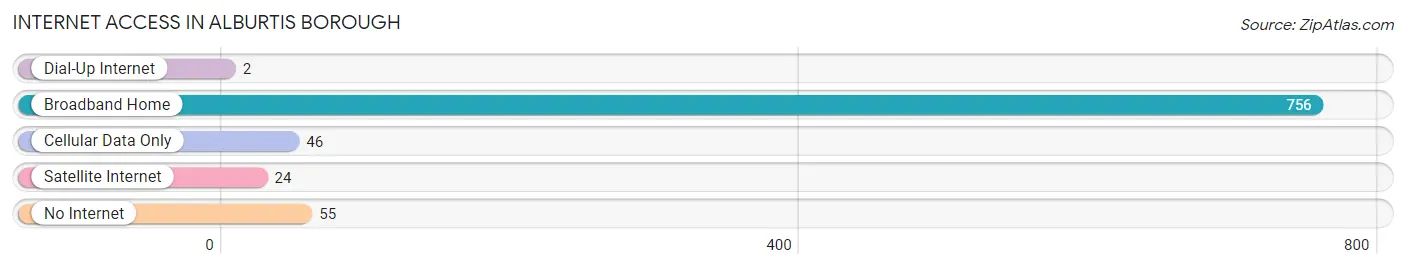
| Internet Type | # Households | % Households |
| Dial-Up Internet | 2 | 0.2% |
| Broadband Home | 756 | 86.9% |
| Cellular Data Only | 46 | 5.3% |
| Satellite Internet | 24 | 2.8% |
| No Internet | 55 | 6.3% |
| Total | 870 | 100.0% |
Alburtis borough Summary
Alburtis Borough is a small borough located in Lehigh County, Pennsylvania. It is situated in the Lehigh Valley region of the state, approximately 10 miles northwest of Allentown. The borough has a population of 2,717 as of the 2010 census, and is part of the Allentown-Bethlehem-Easton metropolitan area.
History
Alburtis was founded in 1855 by John Alburtis, a local landowner. The borough was named after him, and was incorporated in 1867. The borough was originally a farming community, but in the late 19th century, it began to develop into a small industrial center. The Lehigh Valley Railroad was built through the borough in 1855, and the railroad was instrumental in the growth of the borough. The railroad brought new businesses and industries to the area, and the population of the borough began to grow.
In the early 20th century, Alburtis was home to several factories, including a silk mill, a paper mill, and a brickyard. The borough also had a number of small businesses, including a grocery store, a hardware store, and a blacksmith shop.
Geography
Alburtis is located in Lehigh County, Pennsylvania, in the Lehigh Valley region of the state. It is situated approximately 10 miles northwest of Allentown, and is bordered by Lower Macungie Township to the north, Upper Macungie Township to the east, and Upper Milford Township to the south and west. The borough has a total area of 1.2 square miles, all of which is land.
The borough is located in the Lehigh Valley, which is a major agricultural and industrial region of Pennsylvania. The Lehigh Valley is home to several major cities, including Allentown, Bethlehem, and Easton. The Lehigh River runs through the valley, and the region is home to several parks and recreational areas.
Economy
Alburtis is a small, rural borough, and its economy is largely based on agriculture and small businesses. The borough is home to several small businesses, including a grocery store, a hardware store, and a blacksmith shop. The borough also has a number of industrial businesses, including a paper mill, a silk mill, and a brickyard.
The borough is also home to several small manufacturing companies, including a plastics manufacturer and a metal fabricator. The borough is also home to a number of small retail businesses, including a bakery, a florist, and a gift shop.
Demographics
As of the 2010 census, Alburtis had a population of 2,717. The racial makeup of the borough was 94.3% White, 1.2% African American, 0.2% Native American, 1.2% Asian, 0.1% Pacific Islander, 1.2% from other races, and 1.9% from two or more races. Hispanic or Latino of any race were 3.3% of the population.
The median household income in Alburtis was $50,938, and the median family income was $60,938. The per capita income for the borough was $25,938. About 4.3% of families and 5.3% of the population were below the poverty line, including 6.3% of those under age 18 and 4.3% of those age 65 or over.
Common Questions
What is Per Capita Income in Alburtis borough?
Per Capita income in Alburtis borough is $36,933.
What is the Median Family Income in Alburtis borough?
Median Family Income in Alburtis borough is $103,750.
What is the Median Household income in Alburtis borough?
Median Household Income in Alburtis borough is $101,167.
What is Income or Wage Gap in Alburtis borough?
Income or Wage Gap in Alburtis borough is 30.4%.
Women in Alburtis borough earn 69.6 cents for every dollar earned by a man.
What is Inequality or Gini Index in Alburtis borough?
Inequality or Gini Index in Alburtis borough is 0.31.
What is the Total Population of Alburtis borough?
Total Population of Alburtis borough is 2,569.
What is the Total Male Population of Alburtis borough?
Total Male Population of Alburtis borough is 1,402.
What is the Total Female Population of Alburtis borough?
Total Female Population of Alburtis borough is 1,167.
What is the Ratio of Males per 100 Females in Alburtis borough?
There are 120.14 Males per 100 Females in Alburtis borough.
What is the Ratio of Females per 100 Males in Alburtis borough?
There are 83.24 Females per 100 Males in Alburtis borough.
What is the Median Population Age in Alburtis borough?
Median Population Age in Alburtis borough is 32.7 Years.
What is the Average Family Size in Alburtis borough
Average Family Size in Alburtis borough is 3.2 People.
What is the Average Household Size in Alburtis borough
Average Household Size in Alburtis borough is 3.0 People.
How Large is the Labor Force in Alburtis borough?
There are 1,494 People in the Labor Forcein in Alburtis borough.
What is the Percentage of People in the Labor Force in Alburtis borough?
78.9% of People are in the Labor Force in Alburtis borough.
What is the Unemployment Rate in Alburtis borough?
Unemployment Rate in Alburtis borough is 7.1%.