Harrisburg, PA Map & Demographics
Harrisburg Map
Harrisburg Overview
$26,237
PER CAPITA INCOME
$50,874
AVG FAMILY INCOME
$46,654
AVG HOUSEHOLD INCOME
24.0%
WAGE / INCOME GAP [ % ]
76.0¢/ $1
WAGE / INCOME GAP [ $ ]
$12,571
FAMILY INCOME DEFICIT
0.47
INEQUALITY / GINI INDEX
50,055
TOTAL POPULATION
24,085
MALE POPULATION
25,970
FEMALE POPULATION
92.74
MALES / 100 FEMALES
107.83
FEMALES / 100 MALES
31.9
MEDIAN AGE
3.2
AVG FAMILY SIZE
2.3
AVG HOUSEHOLD SIZE
24,937
LABOR FORCE [ PEOPLE ]
67.7%
PERCENT IN LABOR FORCE
9.0%
UNEMPLOYMENT RATE
Harrisburg Area Codes
Income in Harrisburg
Income Overview in Harrisburg
Per Capita Income in Harrisburg is $26,237, while median incomes of families and households are $50,874 and $46,654 respectively.
| Characteristic | Number | Measure |
| Per Capita Income | 50,055 | $26,237 |
| Median Family Income | 10,769 | $50,874 |
| Mean Family Income | 10,769 | $65,019 |
| Median Household Income | 21,474 | $46,654 |
| Mean Household Income | 21,474 | $60,155 |
| Income Deficit | 10,769 | $12,571 |
| Wage / Income Gap (%) | 50,055 | 24.04% |
| Wage / Income Gap ($) | 50,055 | 75.96¢ per $1 |
| Gini / Inequality Index | 50,055 | 0.47 |
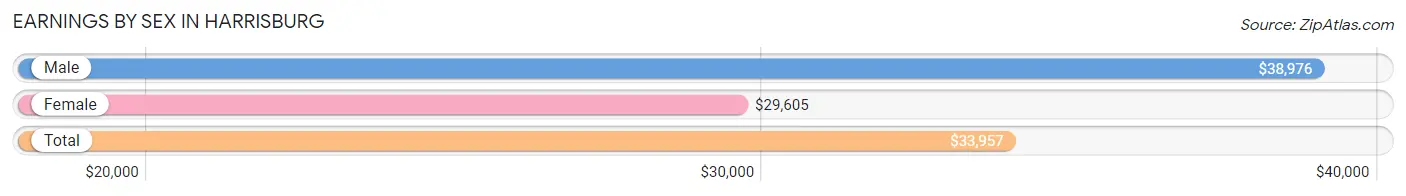
Earnings by Sex in Harrisburg
Average Earnings in Harrisburg are $33,957, $38,976 for men and $29,605 for women, a difference of 24.0%.
| Sex | Number | Average Earnings |
| Male | 12,921 (50.7%) | $38,976 |
| Female | 12,556 (49.3%) | $29,605 |
| Total | 25,477 (100.0%) | $33,957 |
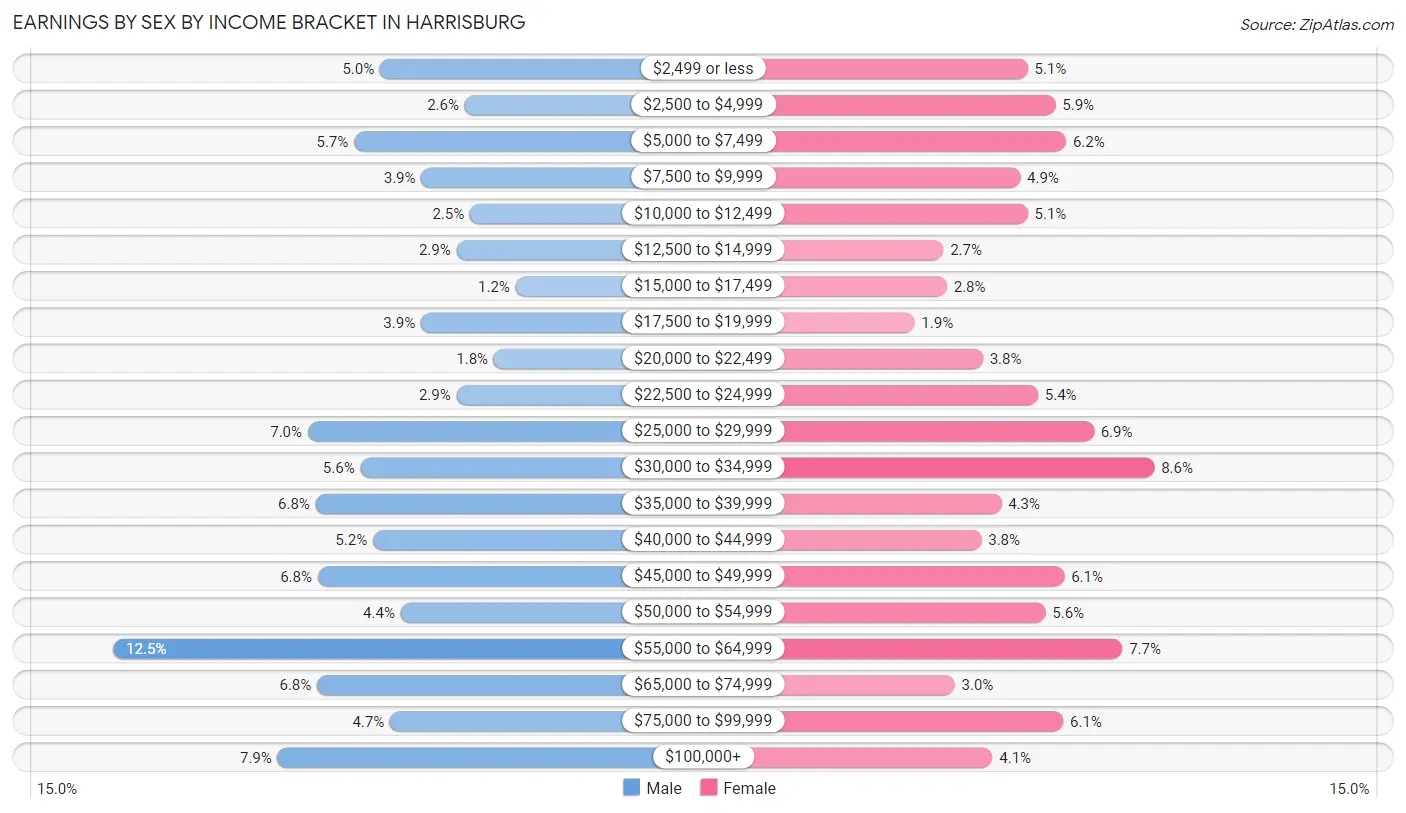
Earnings by Sex by Income Bracket in Harrisburg
The most common earnings brackets in Harrisburg are $55,000 to $64,999 for men (1,616 | 12.5%) and $30,000 to $34,999 for women (1,085 | 8.6%).
| Income | Male | Female |
| $2,499 or less | 647 (5.0%) | 638 (5.1%) |
| $2,500 to $4,999 | 340 (2.6%) | 736 (5.9%) |
| $5,000 to $7,499 | 742 (5.7%) | 773 (6.2%) |
| $7,500 to $9,999 | 497 (3.8%) | 612 (4.9%) |
| $10,000 to $12,499 | 320 (2.5%) | 638 (5.1%) |
| $12,500 to $14,999 | 369 (2.9%) | 340 (2.7%) |
| $15,000 to $17,499 | 155 (1.2%) | 353 (2.8%) |
| $17,500 to $19,999 | 499 (3.9%) | 238 (1.9%) |
| $20,000 to $22,499 | 234 (1.8%) | 480 (3.8%) |
| $22,500 to $24,999 | 369 (2.9%) | 674 (5.4%) |
| $25,000 to $29,999 | 909 (7.0%) | 872 (6.9%) |
| $30,000 to $34,999 | 718 (5.6%) | 1,085 (8.6%) |
| $35,000 to $39,999 | 881 (6.8%) | 545 (4.3%) |
| $40,000 to $44,999 | 673 (5.2%) | 475 (3.8%) |
| $45,000 to $49,999 | 873 (6.8%) | 767 (6.1%) |
| $50,000 to $54,999 | 573 (4.4%) | 700 (5.6%) |
| $55,000 to $64,999 | 1,616 (12.5%) | 972 (7.7%) |
| $65,000 to $74,999 | 876 (6.8%) | 381 (3.0%) |
| $75,000 to $99,999 | 611 (4.7%) | 764 (6.1%) |
| $100,000+ | 1,019 (7.9%) | 513 (4.1%) |
| Total | 12,921 (100.0%) | 12,556 (100.0%) |
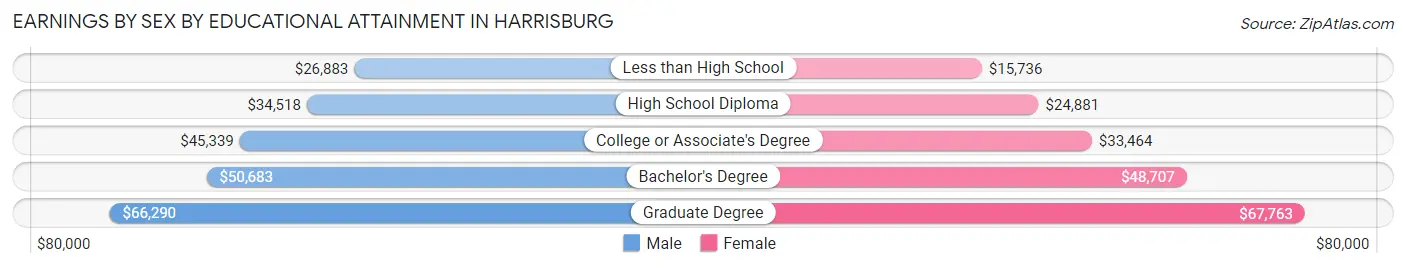
Earnings by Sex by Educational Attainment in Harrisburg
Average earnings in Harrisburg are $44,207 for men and $32,708 for women, a difference of 26.0%. Men with an educational attainment of graduate degree enjoy the highest average annual earnings of $66,290, while those with less than high school education earn the least with $26,883. Women with an educational attainment of graduate degree earn the most with the average annual earnings of $67,763, while those with less than high school education have the smallest earnings of $15,736.
| Educational Attainment | Male Income | Female Income |
| Less than High School | $26,883 | $15,736 |
| High School Diploma | $34,518 | $24,881 |
| College or Associate's Degree | $45,339 | $33,464 |
| Bachelor's Degree | $50,683 | $48,707 |
| Graduate Degree | $66,290 | $67,763 |
| Total | $44,207 | $32,708 |
Family Income in Harrisburg
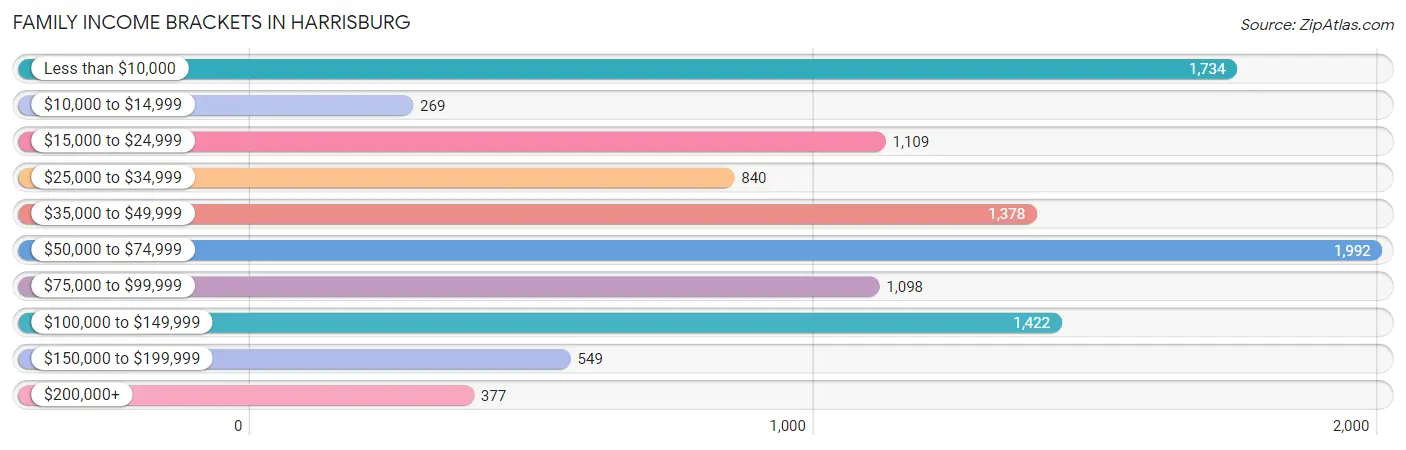
Family Income Brackets in Harrisburg
According to the Harrisburg family income data, there are 1,992 families falling into the $50,000 to $74,999 income range, which is the most common income bracket and makes up 18.5% of all families. Conversely, the $10,000 to $14,999 income bracket is the least frequent group with only 269 families (2.5%) belonging to this category.
| Income Bracket | # Families | % Families |
| Less than $10,000 | 1,734 | 16.1% |
| $10,000 to $14,999 | 269 | 2.5% |
| $15,000 to $24,999 | 1,109 | 10.3% |
| $25,000 to $34,999 | 840 | 7.8% |
| $35,000 to $49,999 | 1,378 | 12.8% |
| $50,000 to $74,999 | 1,992 | 18.5% |
| $75,000 to $99,999 | 1,098 | 10.2% |
| $100,000 to $149,999 | 1,422 | 13.2% |
| $150,000 to $199,999 | 549 | 5.1% |
| $200,000+ | 377 | 3.5% |
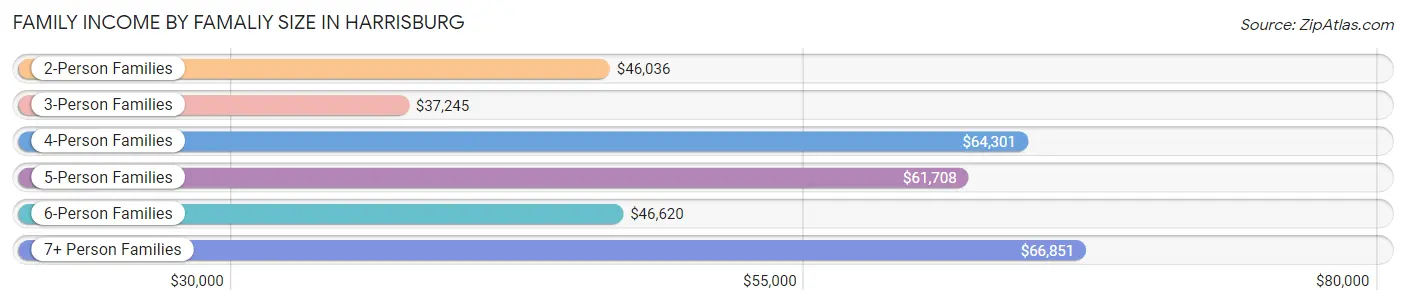
Family Income by Famaliy Size in Harrisburg
7+ person families (415 | 3.8%) account for the highest median family income in Harrisburg with $66,851 per family, while 2-person families (5,556 | 51.6%) have the highest median income of $23,018 per family member.
| Income Bracket | # Families | Median Income |
| 2-Person Families | 5,556 (51.6%) | $46,036 |
| 3-Person Families | 2,272 (21.1%) | $37,245 |
| 4-Person Families | 1,476 (13.7%) | $64,301 |
| 5-Person Families | 820 (7.6%) | $61,708 |
| 6-Person Families | 230 (2.1%) | $46,620 |
| 7+ Person Families | 415 (3.8%) | $66,851 |
| Total | 10,769 (100.0%) | $50,874 |
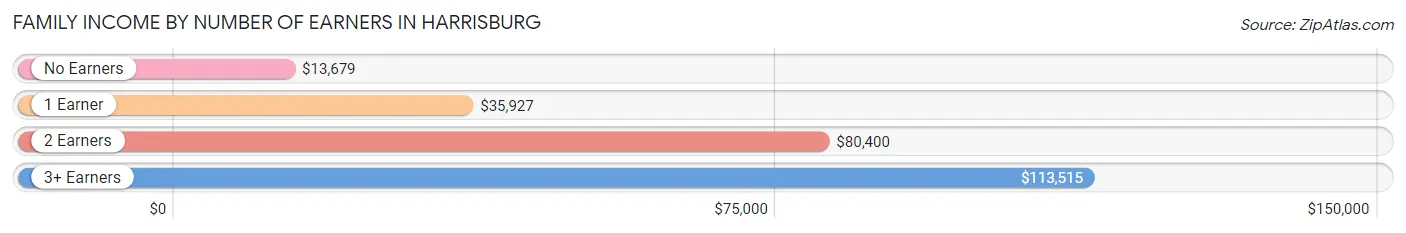
Family Income by Number of Earners in Harrisburg
The median family income in Harrisburg is $50,874, with families comprising 3+ earners (875) having the highest median family income of $113,515, while families with no earners (2,139) have the lowest median family income of $13,679, accounting for 8.1% and 19.9% of families, respectively.
| Number of Earners | # Families | Median Income |
| No Earners | 2,139 (19.9%) | $13,679 |
| 1 Earner | 4,043 (37.5%) | $35,927 |
| 2 Earners | 3,712 (34.5%) | $80,400 |
| 3+ Earners | 875 (8.1%) | $113,515 |
| Total | 10,769 (100.0%) | $50,874 |
Household Income in Harrisburg
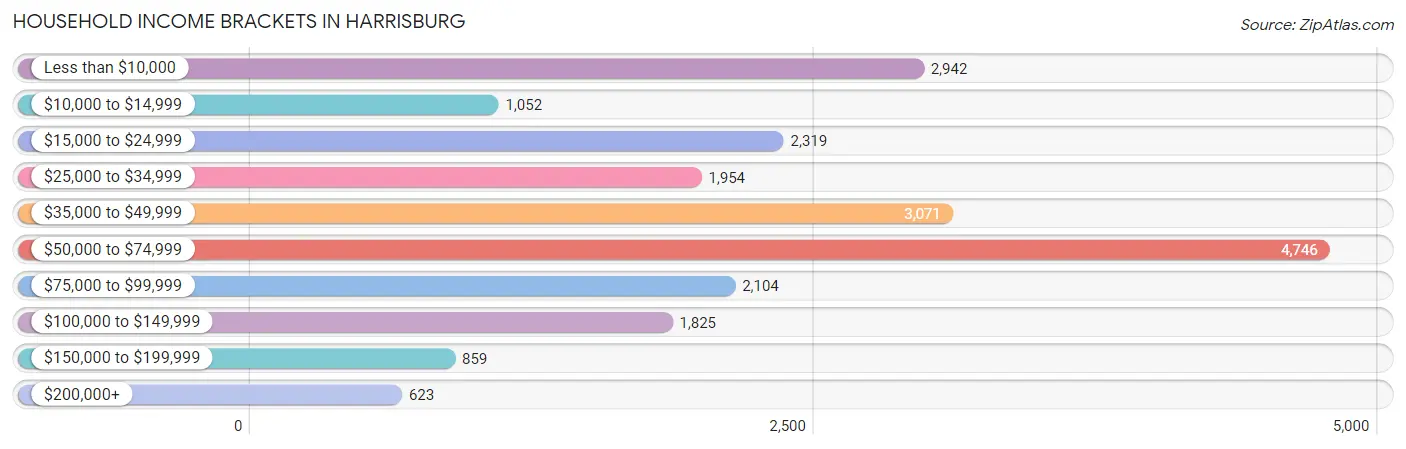
Household Income Brackets in Harrisburg
With 4,746 households falling in the category, the $50,000 to $74,999 income range is the most frequent in Harrisburg, accounting for 22.1% of all households. In contrast, only 623 households (2.9%) fall into the $200,000+ income bracket, making it the least populous group.
| Income Bracket | # Households | % Households |
| Less than $10,000 | 2,942 | 13.7% |
| $10,000 to $14,999 | 1,052 | 4.9% |
| $15,000 to $24,999 | 2,319 | 10.8% |
| $25,000 to $34,999 | 1,954 | 9.1% |
| $35,000 to $49,999 | 3,071 | 14.3% |
| $50,000 to $74,999 | 4,746 | 22.1% |
| $75,000 to $99,999 | 2,104 | 9.8% |
| $100,000 to $149,999 | 1,825 | 8.5% |
| $150,000 to $199,999 | 859 | 4.0% |
| $200,000+ | 623 | 2.9% |
Household Income by Householder Age in Harrisburg
The median household income in Harrisburg is $46,654, with the highest median household income of $55,761 found in the 45 to 64 years age bracket for the primary householder. A total of 7,161 households (33.4%) fall into this category. Meanwhile, the 15 to 24 years age bracket for the primary householder has the lowest median household income of $29,552, with 1,451 households (6.8%) in this group.
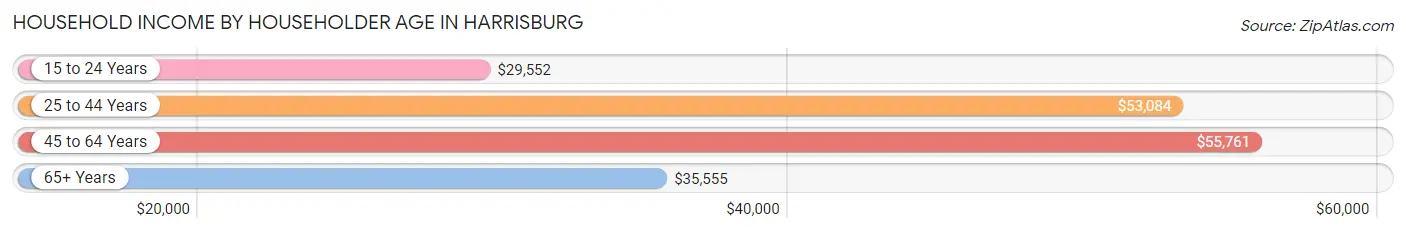
| Income Bracket | # Households | Median Income |
| 15 to 24 Years | 1,451 (6.8%) | $29,552 |
| 25 to 44 Years | 8,741 (40.7%) | $53,084 |
| 45 to 64 Years | 7,161 (33.4%) | $55,761 |
| 65+ Years | 4,121 (19.2%) | $35,555 |
| Total | 21,474 (100.0%) | $46,654 |
Poverty in Harrisburg
Income Below Poverty by Sex and Age in Harrisburg
With 26.1% poverty level for males and 30.4% for females among the residents of Harrisburg, 12 to 14 year old males and 12 to 14 year old females are the most vulnerable to poverty, with 887 males (61.7%) and 485 females (42.4%) in their respective age groups living below the poverty level.
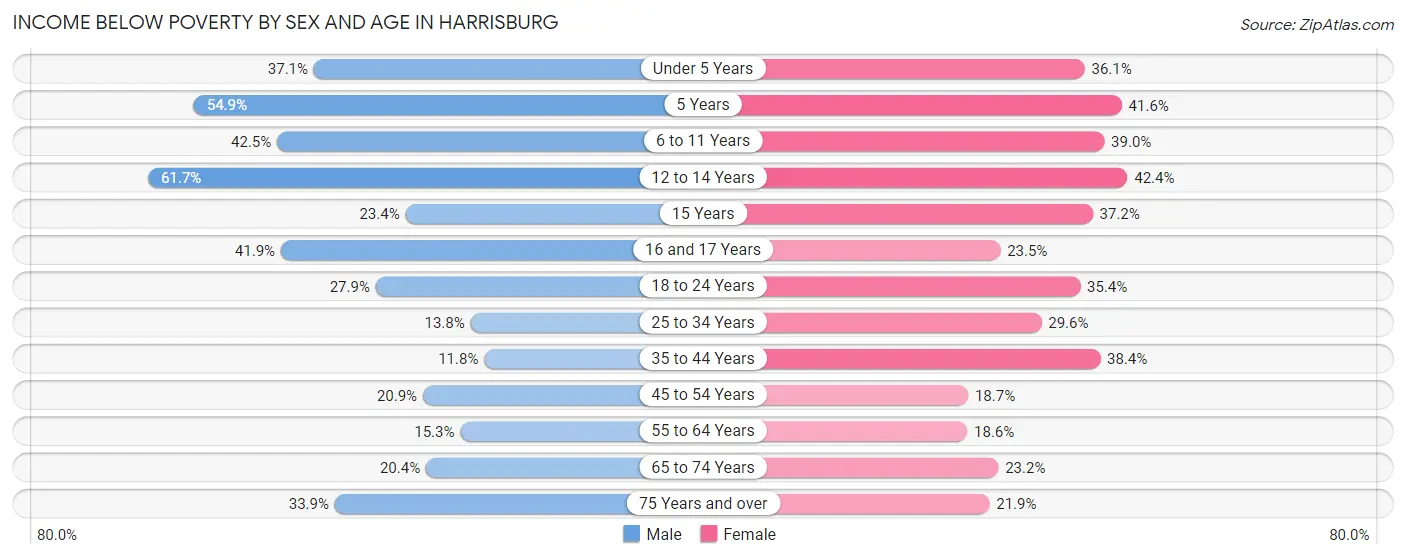
| Age Bracket | Male | Female |
| Under 5 Years | 638 (37.0%) | 863 (36.0%) |
| 5 Years | 259 (54.9%) | 96 (41.6%) |
| 6 to 11 Years | 1,004 (42.5%) | 1,018 (39.0%) |
| 12 to 14 Years | 887 (61.7%) | 485 (42.4%) |
| 15 Years | 49 (23.4%) | 146 (37.2%) |
| 16 and 17 Years | 208 (41.9%) | 123 (23.5%) |
| 18 to 24 Years | 664 (27.9%) | 664 (35.4%) |
| 25 to 34 Years | 608 (13.8%) | 1,312 (29.6%) |
| 35 to 44 Years | 273 (11.7%) | 1,386 (38.4%) |
| 45 to 54 Years | 548 (20.8%) | 502 (18.7%) |
| 55 to 64 Years | 425 (15.3%) | 499 (18.6%) |
| 65 to 74 Years | 313 (20.4%) | 429 (23.2%) |
| 75 Years and over | 278 (33.9%) | 281 (21.9%) |
| Total | 6,154 (26.1%) | 7,804 (30.4%) |
Income Above Poverty by Sex and Age in Harrisburg
According to the poverty statistics in Harrisburg, males aged 35 to 44 years and females aged 55 to 64 years are the age groups that are most secure financially, with 88.2% of males and 81.4% of females in these age groups living above the poverty line.
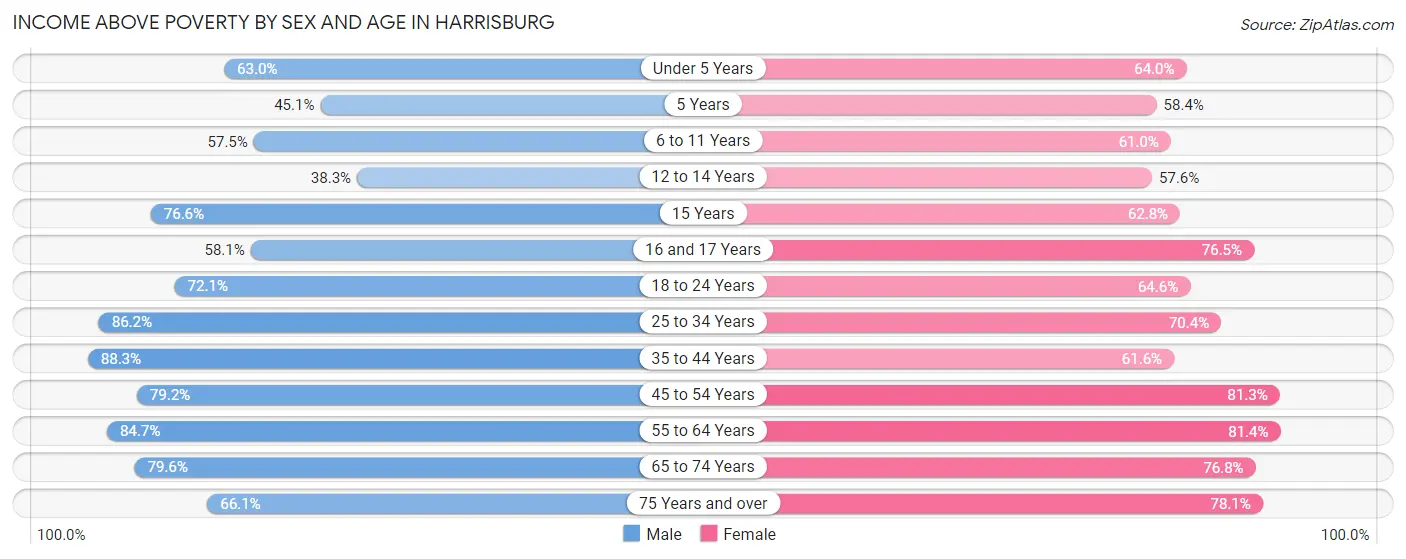
| Age Bracket | Male | Female |
| Under 5 Years | 1,084 (62.9%) | 1,531 (63.9%) |
| 5 Years | 213 (45.1%) | 135 (58.4%) |
| 6 to 11 Years | 1,358 (57.5%) | 1,595 (61.0%) |
| 12 to 14 Years | 551 (38.3%) | 659 (57.6%) |
| 15 Years | 160 (76.6%) | 246 (62.8%) |
| 16 and 17 Years | 288 (58.1%) | 400 (76.5%) |
| 18 to 24 Years | 1,719 (72.1%) | 1,213 (64.6%) |
| 25 to 34 Years | 3,805 (86.2%) | 3,117 (70.4%) |
| 35 to 44 Years | 2,051 (88.2%) | 2,227 (61.6%) |
| 45 to 54 Years | 2,080 (79.1%) | 2,177 (81.3%) |
| 55 to 64 Years | 2,353 (84.7%) | 2,182 (81.4%) |
| 65 to 74 Years | 1,221 (79.6%) | 1,418 (76.8%) |
| 75 Years and over | 541 (66.1%) | 1,002 (78.1%) |
| Total | 17,424 (73.9%) | 17,902 (69.6%) |
Income Below Poverty Among Married-Couple Families in Harrisburg
The poverty statistics for married-couple families in Harrisburg show that 5.3% or 246 of the total 4,621 families live below the poverty line. Families with 1 or 2 children have the highest poverty rate of 8.4%, comprising of 116 families. On the other hand, families with 3 or 4 children have the lowest poverty rate of 0.0%, which includes 0 families.
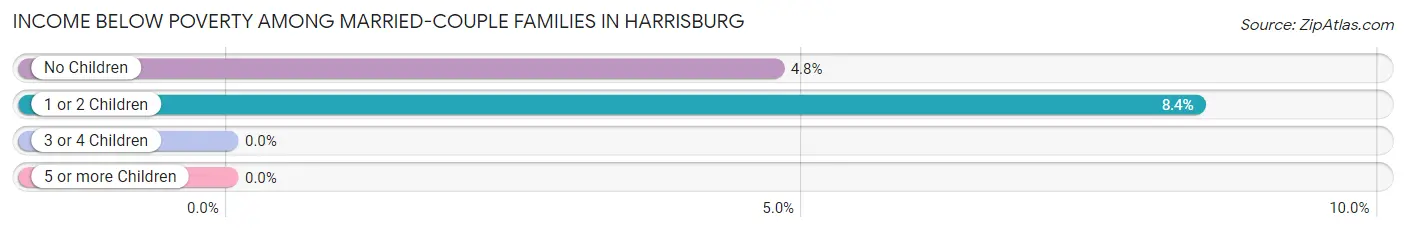
| Children | Above Poverty | Below Poverty |
| No Children | 2,605 (95.3%) | 130 (4.8%) |
| 1 or 2 Children | 1,261 (91.6%) | 116 (8.4%) |
| 3 or 4 Children | 377 (100.0%) | 0 (0.0%) |
| 5 or more Children | 132 (100.0%) | 0 (0.0%) |
| Total | 4,375 (94.7%) | 246 (5.3%) |
Income Below Poverty Among Single-Parent Households in Harrisburg
According to the poverty data in Harrisburg, 26.1% or 331 single-father households and 48.6% or 2,371 single-mother households are living below the poverty line. Among single-father households, those with 1 or 2 children have the highest poverty rate, with 284 households (47.9%) experiencing poverty. Likewise, among single-mother households, those with 3 or 4 children have the highest poverty rate, with 479 households (78.5%) falling below the poverty line.
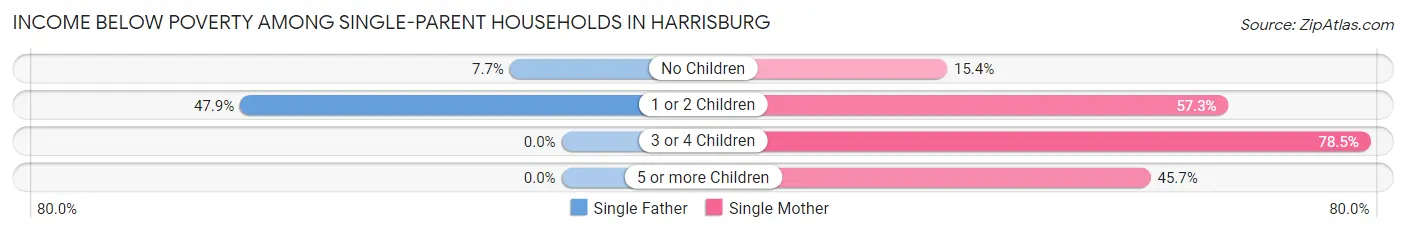
| Children | Single Father | Single Mother |
| No Children | 47 (7.7%) | 194 (15.4%) |
| 1 or 2 Children | 284 (47.9%) | 1,591 (57.3%) |
| 3 or 4 Children | 0 (0.0%) | 479 (78.5%) |
| 5 or more Children | 0 (0.0%) | 107 (45.7%) |
| Total | 331 (26.1%) | 2,371 (48.6%) |
Income Below Poverty Among Married-Couple vs Single-Parent Households in Harrisburg
The poverty data for Harrisburg shows that 246 of the married-couple family households (5.3%) and 2,702 of the single-parent households (44.0%) are living below the poverty level. Within the married-couple family households, those with 1 or 2 children have the highest poverty rate, with 116 households (8.4%) falling below the poverty line. Among the single-parent households, those with 3 or 4 children have the highest poverty rate, with 479 household (70.7%) living below poverty.
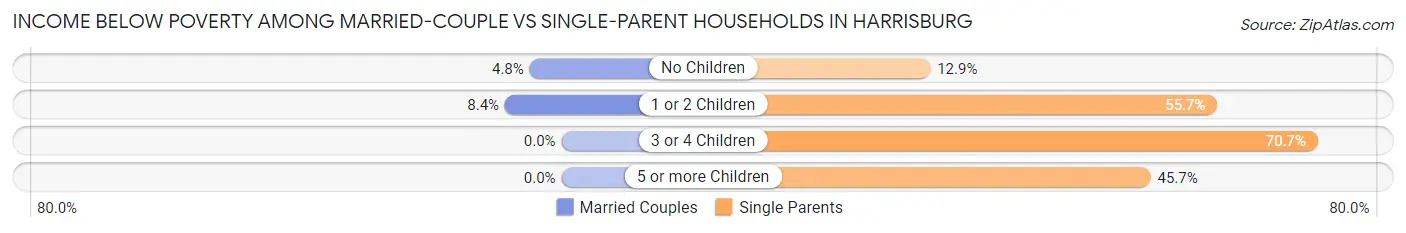
| Children | Married-Couple Families | Single-Parent Households |
| No Children | 130 (4.8%) | 241 (12.9%) |
| 1 or 2 Children | 116 (8.4%) | 1,875 (55.7%) |
| 3 or 4 Children | 0 (0.0%) | 479 (70.7%) |
| 5 or more Children | 0 (0.0%) | 107 (45.7%) |
| Total | 246 (5.3%) | 2,702 (44.0%) |
Race in Harrisburg
The most populous races in Harrisburg are Black / African American (23,245 | 46.4%), White / Caucasian (17,156 | 34.3%), and Hispanic or Latino (12,362 | 24.7%).
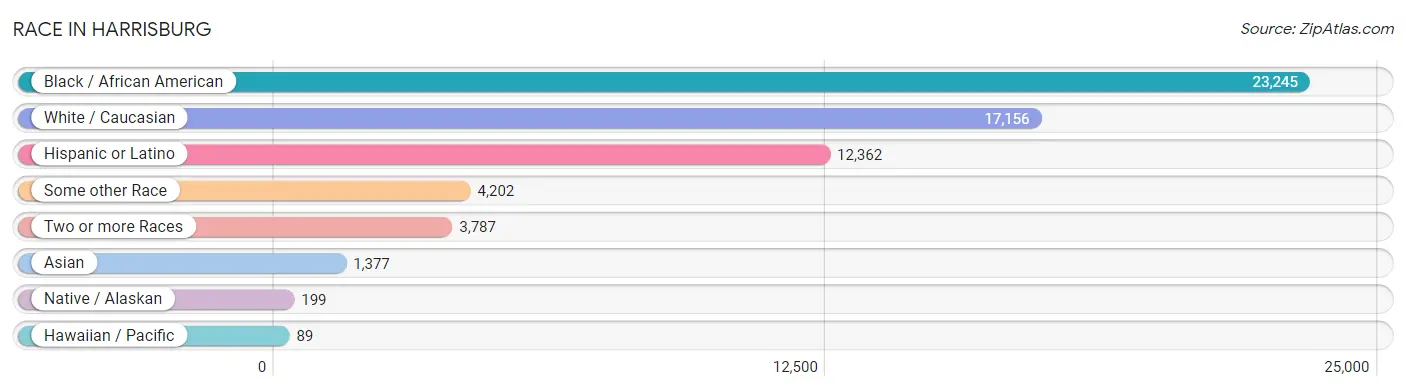
| Race | # Population | % Population |
| Asian | 1,377 | 2.8% |
| Black / African American | 23,245 | 46.4% |
| Hawaiian / Pacific | 89 | 0.2% |
| Hispanic or Latino | 12,362 | 24.7% |
| Native / Alaskan | 199 | 0.4% |
| White / Caucasian | 17,156 | 34.3% |
| Two or more Races | 3,787 | 7.6% |
| Some other Race | 4,202 | 8.4% |
| Total | 50,055 | 100.0% |
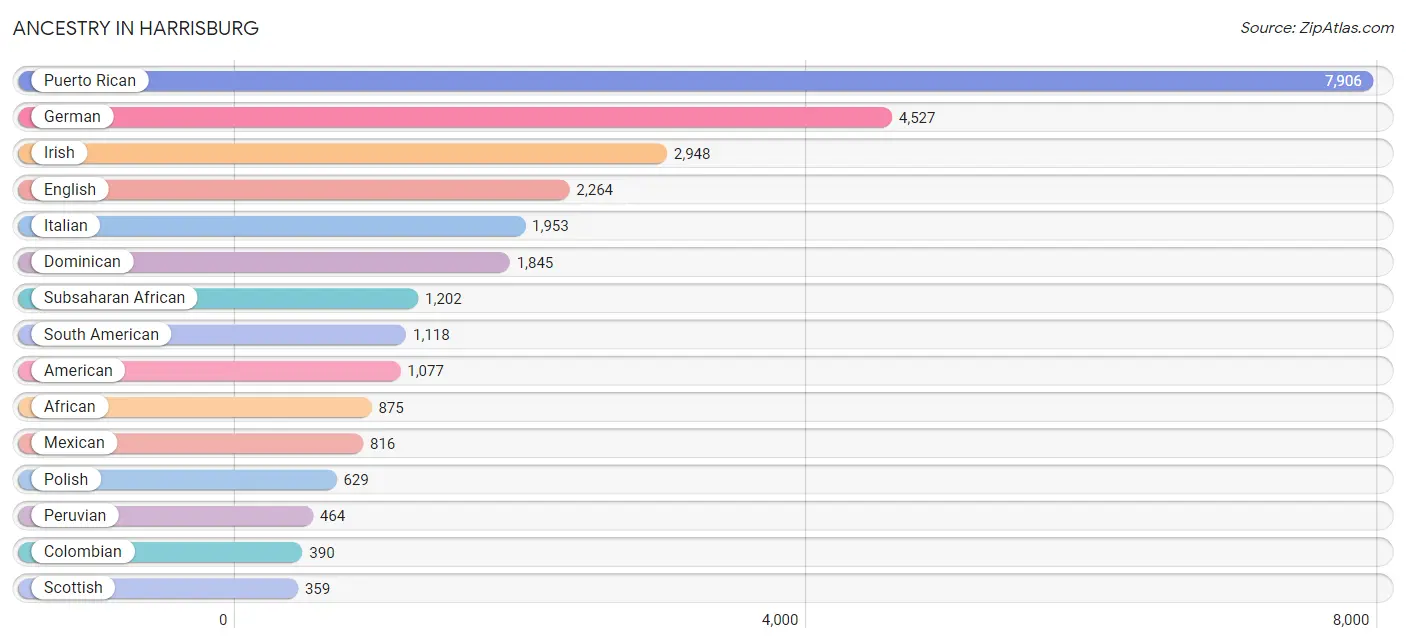
Ancestry in Harrisburg
The most populous ancestries reported in Harrisburg are Puerto Rican (7,906 | 15.8%), German (4,527 | 9.0%), Irish (2,948 | 5.9%), English (2,264 | 4.5%), and Italian (1,953 | 3.9%), together accounting for 39.1% of all Harrisburg residents.
| Ancestry | # Population | % Population |
| African | 875 | 1.8% |
| American | 1,077 | 2.1% |
| Arab | 224 | 0.4% |
| Argentinean | 28 | 0.1% |
| Austrian | 22 | 0.0% |
| Bhutanese | 155 | 0.3% |
| Blackfeet | 77 | 0.2% |
| Bolivian | 31 | 0.1% |
| British | 52 | 0.1% |
| British West Indian | 15 | 0.0% |
| Burmese | 22 | 0.0% |
| Carpatho Rusyn | 37 | 0.1% |
| Central American | 216 | 0.4% |
| Central American Indian | 11 | 0.0% |
| Cherokee | 200 | 0.4% |
| Chilean | 71 | 0.1% |
| Chippewa | 30 | 0.1% |
| Colombian | 390 | 0.8% |
| Croatian | 52 | 0.1% |
| Cuban | 216 | 0.4% |
| Czech | 28 | 0.1% |
| Danish | 69 | 0.1% |
| Dominican | 1,845 | 3.7% |
| Dutch | 39 | 0.1% |
| Eastern European | 21 | 0.0% |
| Ecuadorian | 74 | 0.2% |
| Egyptian | 68 | 0.1% |
| English | 2,264 | 4.5% |
| European | 346 | 0.7% |
| Finnish | 25 | 0.1% |
| French | 278 | 0.6% |
| French American Indian | 5 | 0.0% |
| French Canadian | 23 | 0.1% |
| German | 4,527 | 9.0% |
| German Russian | 8 | 0.0% |
| Greek | 55 | 0.1% |
| Guyanese | 24 | 0.1% |
| Haitian | 73 | 0.2% |
| Honduran | 41 | 0.1% |
| Hungarian | 19 | 0.0% |
| Indian (Asian) | 286 | 0.6% |
| Inupiat | 70 | 0.1% |
| Iranian | 11 | 0.0% |
| Irish | 2,948 | 5.9% |
| Israeli | 8 | 0.0% |
| Italian | 1,953 | 3.9% |
| Jamaican | 270 | 0.5% |
| Japanese | 267 | 0.5% |
| Korean | 268 | 0.5% |
| Lebanese | 18 | 0.0% |
| Liberian | 14 | 0.0% |
| Lithuanian | 55 | 0.1% |
| Mexican | 816 | 1.6% |
| Mexican American Indian | 34 | 0.1% |
| Native Hawaiian | 89 | 0.2% |
| Nicaraguan | 20 | 0.0% |
| Nigerian | 189 | 0.4% |
| Northern European | 7 | 0.0% |
| Norwegian | 63 | 0.1% |
| Pakistani | 56 | 0.1% |
| Palestinian | 19 | 0.0% |
| Panamanian | 64 | 0.1% |
| Pennsylvania German | 225 | 0.4% |
| Peruvian | 464 | 0.9% |
| Polish | 629 | 1.3% |
| Portuguese | 10 | 0.0% |
| Puerto Rican | 7,906 | 15.8% |
| Romanian | 35 | 0.1% |
| Russian | 42 | 0.1% |
| Salvadoran | 91 | 0.2% |
| Scandinavian | 106 | 0.2% |
| Scotch-Irish | 176 | 0.4% |
| Scottish | 359 | 0.7% |
| Serbian | 23 | 0.1% |
| Slavic | 10 | 0.0% |
| Slovak | 72 | 0.1% |
| South American | 1,118 | 2.2% |
| South American Indian | 15 | 0.0% |
| Spaniard | 35 | 0.1% |
| Spanish American Indian | 30 | 0.1% |
| Sri Lankan | 196 | 0.4% |
| Subsaharan African | 1,202 | 2.4% |
| Swedish | 49 | 0.1% |
| Swiss | 130 | 0.3% |
| Syrian | 126 | 0.3% |
| Thai | 144 | 0.3% |
| Trinidadian and Tobagonian | 85 | 0.2% |
| Ukrainian | 57 | 0.1% |
| Uruguayan | 10 | 0.0% |
| Venezuelan | 50 | 0.1% |
| Welsh | 213 | 0.4% |
| West Indian | 29 | 0.1% | View All 92 Rows |
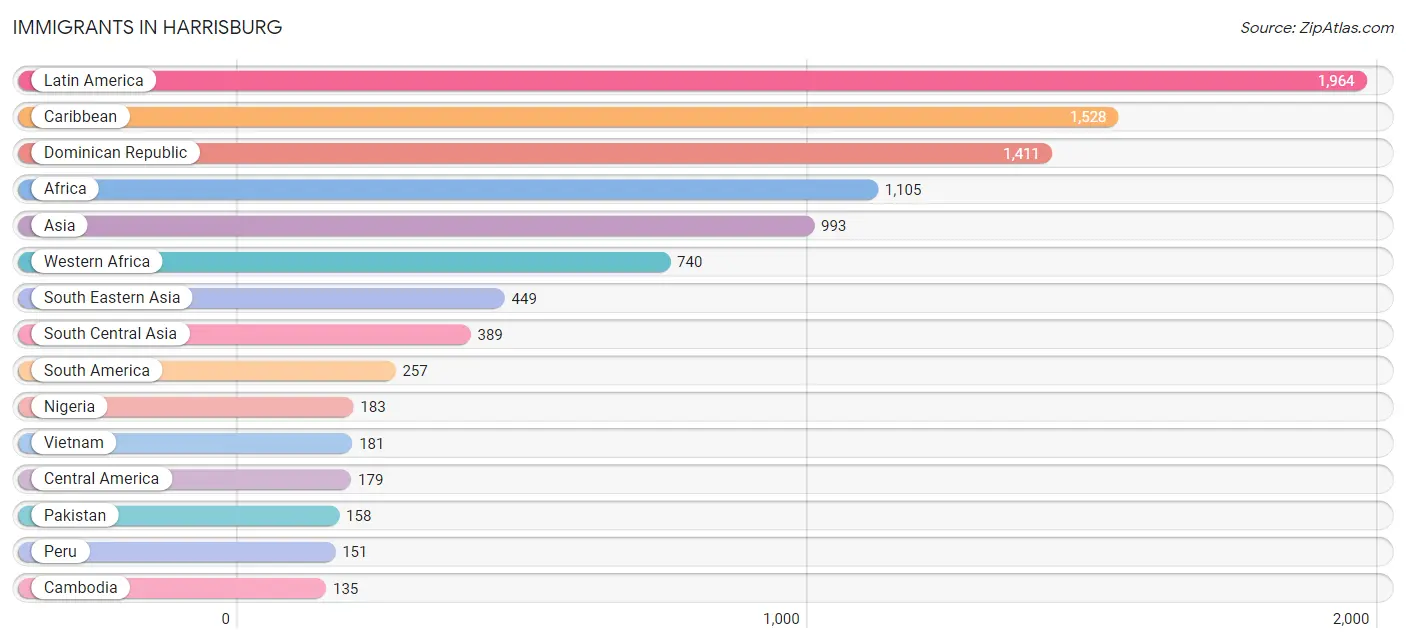
Immigrants in Harrisburg
The most numerous immigrant groups reported in Harrisburg came from Latin America (1,964 | 3.9%), Caribbean (1,528 | 3.0%), Dominican Republic (1,411 | 2.8%), Africa (1,105 | 2.2%), and Asia (993 | 2.0%), together accounting for 14.0% of all Harrisburg residents.
| Immigration Origin | # Population | % Population |
| Africa | 1,105 | 2.2% |
| Asia | 993 | 2.0% |
| Bolivia | 23 | 0.1% |
| Cambodia | 135 | 0.3% |
| Cameroon | 27 | 0.1% |
| Canada | 20 | 0.0% |
| Caribbean | 1,528 | 3.0% |
| Central America | 179 | 0.4% |
| China | 85 | 0.2% |
| Congo | 6 | 0.0% |
| Cuba | 51 | 0.1% |
| Dominica | 15 | 0.0% |
| Dominican Republic | 1,411 | 2.8% |
| Eastern Africa | 73 | 0.2% |
| Eastern Asia | 118 | 0.2% |
| Eastern Europe | 12 | 0.0% |
| Ecuador | 58 | 0.1% |
| Egypt | 68 | 0.1% |
| El Salvador | 38 | 0.1% |
| England | 11 | 0.0% |
| Europe | 121 | 0.2% |
| Germany | 65 | 0.1% |
| Haiti | 11 | 0.0% |
| Honduras | 41 | 0.1% |
| Hong Kong | 31 | 0.1% |
| India | 122 | 0.2% |
| Israel | 8 | 0.0% |
| Italy | 9 | 0.0% |
| Jamaica | 19 | 0.0% |
| Kenya | 49 | 0.1% |
| Korea | 33 | 0.1% |
| Latin America | 1,964 | 3.9% |
| Liberia | 16 | 0.0% |
| Mexico | 74 | 0.2% |
| Middle Africa | 130 | 0.3% |
| Nepal | 95 | 0.2% |
| Nigeria | 183 | 0.4% |
| Northern Africa | 68 | 0.1% |
| Northern Europe | 35 | 0.1% |
| Pakistan | 158 | 0.3% |
| Panama | 26 | 0.1% |
| Peru | 151 | 0.3% |
| Philippines | 96 | 0.2% |
| Poland | 12 | 0.0% |
| Scotland | 8 | 0.0% |
| Sierra Leone | 77 | 0.2% |
| South America | 257 | 0.5% |
| South Central Asia | 389 | 0.8% |
| South Eastern Asia | 449 | 0.9% |
| Southern Europe | 9 | 0.0% |
| Thailand | 37 | 0.1% |
| Uganda | 11 | 0.0% |
| Uruguay | 10 | 0.0% |
| Uzbekistan | 8 | 0.0% |
| Venezuela | 15 | 0.0% |
| Vietnam | 181 | 0.4% |
| Western Africa | 740 | 1.5% |
| Western Asia | 8 | 0.0% |
| Western Europe | 65 | 0.1% |
| Zaire | 29 | 0.1% | View All 60 Rows |
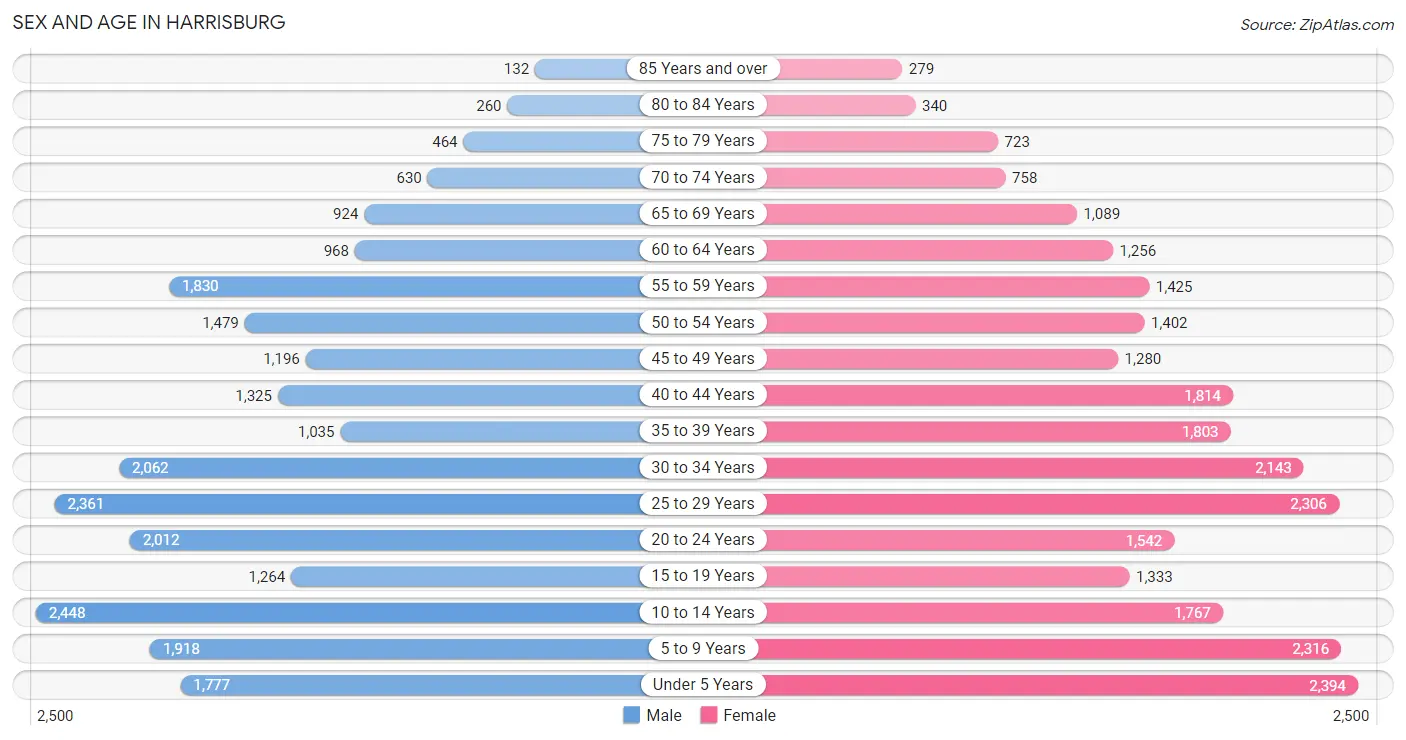
Sex and Age in Harrisburg
Sex and Age in Harrisburg
The most populous age groups in Harrisburg are 10 to 14 Years (2,448 | 10.2%) for men and Under 5 Years (2,394 | 9.2%) for women.
| Age Bracket | Male | Female |
| Under 5 Years | 1,777 (7.4%) | 2,394 (9.2%) |
| 5 to 9 Years | 1,918 (8.0%) | 2,316 (8.9%) |
| 10 to 14 Years | 2,448 (10.2%) | 1,767 (6.8%) |
| 15 to 19 Years | 1,264 (5.2%) | 1,333 (5.1%) |
| 20 to 24 Years | 2,012 (8.4%) | 1,542 (5.9%) |
| 25 to 29 Years | 2,361 (9.8%) | 2,306 (8.9%) |
| 30 to 34 Years | 2,062 (8.6%) | 2,143 (8.3%) |
| 35 to 39 Years | 1,035 (4.3%) | 1,803 (6.9%) |
| 40 to 44 Years | 1,325 (5.5%) | 1,814 (7.0%) |
| 45 to 49 Years | 1,196 (5.0%) | 1,280 (4.9%) |
| 50 to 54 Years | 1,479 (6.1%) | 1,402 (5.4%) |
| 55 to 59 Years | 1,830 (7.6%) | 1,425 (5.5%) |
| 60 to 64 Years | 968 (4.0%) | 1,256 (4.8%) |
| 65 to 69 Years | 924 (3.8%) | 1,089 (4.2%) |
| 70 to 74 Years | 630 (2.6%) | 758 (2.9%) |
| 75 to 79 Years | 464 (1.9%) | 723 (2.8%) |
| 80 to 84 Years | 260 (1.1%) | 340 (1.3%) |
| 85 Years and over | 132 (0.5%) | 279 (1.1%) |
| Total | 24,085 (100.0%) | 25,970 (100.0%) |
Families and Households in Harrisburg
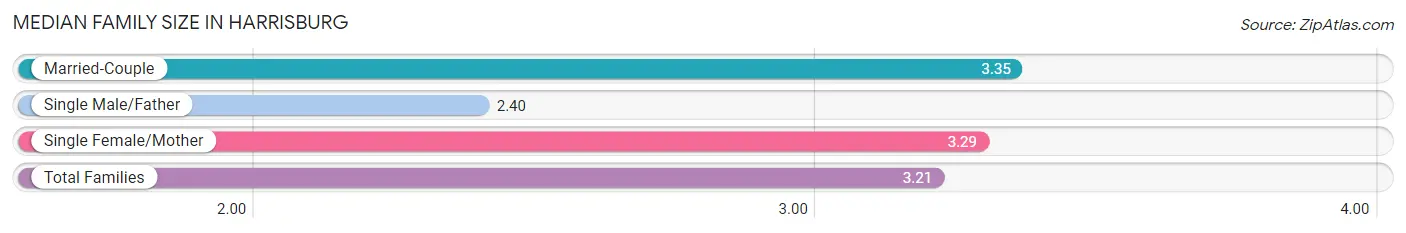
Median Family Size in Harrisburg
The median family size in Harrisburg is 3.21 persons per family, with married-couple families (4,621 | 42.9%) accounting for the largest median family size of 3.35 persons per family. On the other hand, single male/father families (1,270 | 11.8%) represent the smallest median family size with 2.40 persons per family.
| Family Type | # Families | Family Size |
| Married-Couple | 4,621 (42.9%) | 3.35 |
| Single Male/Father | 1,270 (11.8%) | 2.40 |
| Single Female/Mother | 4,878 (45.3%) | 3.29 |
| Total Families | 10,769 (100.0%) | 3.21 |
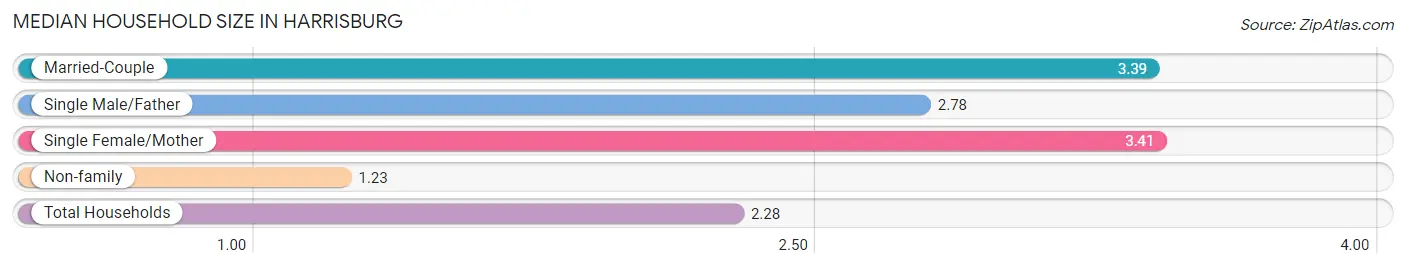
Median Household Size in Harrisburg
The median household size in Harrisburg is 2.28 persons per household, with single female/mother households (4,878 | 22.7%) accounting for the largest median household size of 3.41 persons per household. non-family households (10,705 | 49.8%) represent the smallest median household size with 1.23 persons per household.
| Household Type | # Households | Household Size |
| Married-Couple | 4,621 (21.5%) | 3.39 |
| Single Male/Father | 1,270 (5.9%) | 2.78 |
| Single Female/Mother | 4,878 (22.7%) | 3.41 |
| Non-family | 10,705 (49.8%) | 1.23 |
| Total Households | 21,474 (100.0%) | 2.28 |
Household Size by Marriage Status in Harrisburg
Out of a total of 21,474 households in Harrisburg, 10,769 (50.1%) are family households, while 10,705 (49.8%) are nonfamily households. The most numerous type of family households are 2-person households, comprising 4,907, and the most common type of nonfamily households are 1-person households, comprising 8,793.
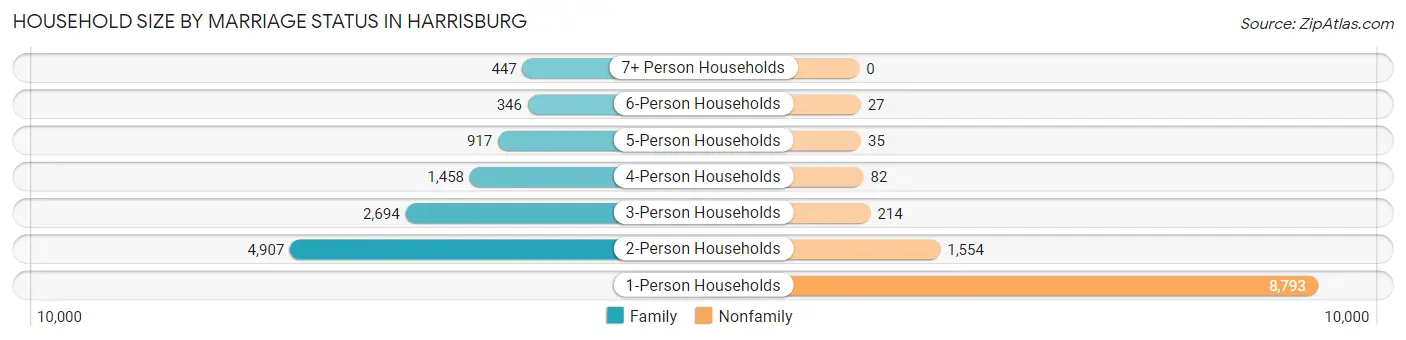
| Household Size | Family Households | Nonfamily Households |
| 1-Person Households | - | 8,793 (40.9%) |
| 2-Person Households | 4,907 (22.9%) | 1,554 (7.2%) |
| 3-Person Households | 2,694 (12.6%) | 214 (1.0%) |
| 4-Person Households | 1,458 (6.8%) | 82 (0.4%) |
| 5-Person Households | 917 (4.3%) | 35 (0.2%) |
| 6-Person Households | 346 (1.6%) | 27 (0.1%) |
| 7+ Person Households | 447 (2.1%) | 0 (0.0%) |
| Total | 10,769 (50.1%) | 10,705 (49.8%) |
Female Fertility in Harrisburg
Fertility by Age in Harrisburg
Average fertility rate in Harrisburg is 36.0 births per 1,000 women. Women in the age bracket of 20 to 34 years have the highest fertility rate with 56.0 births per 1,000 women. Women in the age bracket of 20 to 34 years acount for 73.4% of all women with births.
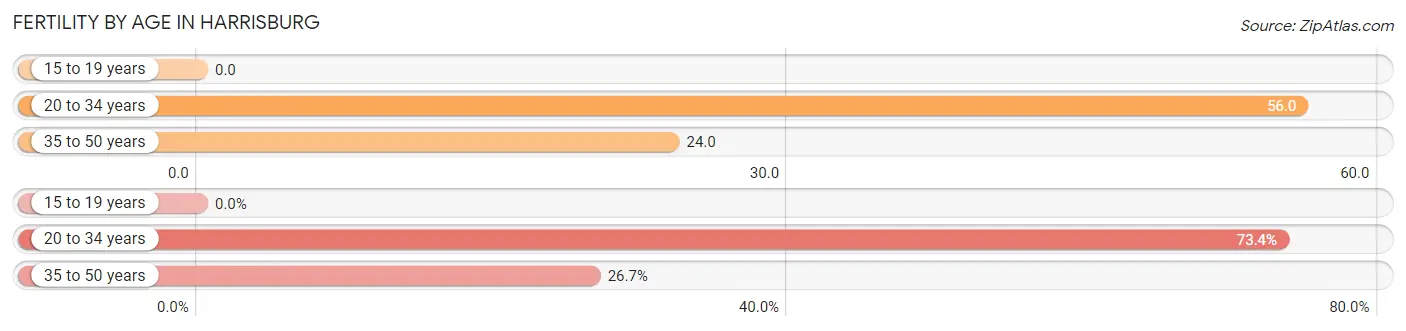
| Age Bracket | Women with Births | Births / 1,000 Women |
| 15 to 19 years | 0 (0.0%) | 0.0 |
| 20 to 34 years | 333 (73.4%) | 56.0 |
| 35 to 50 years | 121 (26.7%) | 24.0 |
| Total | 454 (100.0%) | 36.0 |
Fertility by Age by Marriage Status in Harrisburg
29.5% of women with births (454) in Harrisburg are married. The highest percentage of unmarried women with births falls into 35 to 50 years age bracket with 91.7% of them unmarried at the time of birth, while the lowest percentage of unmarried women with births belong to 20 to 34 years age bracket with 62.8% of them unmarried.
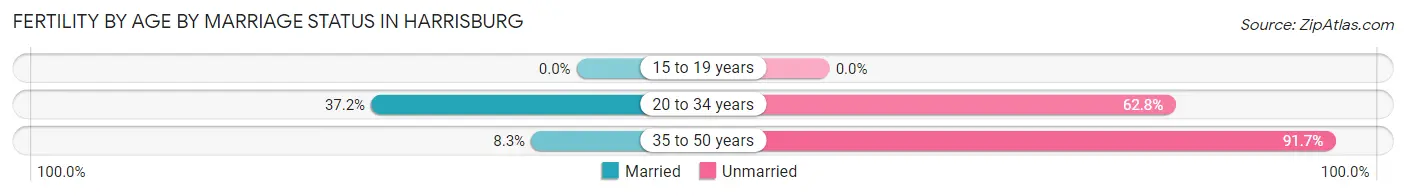
| Age Bracket | Married | Unmarried |
| 15 to 19 years | 0 (0.0%) | 0 (0.0%) |
| 20 to 34 years | 124 (37.2%) | 209 (62.8%) |
| 35 to 50 years | 10 (8.3%) | 111 (91.7%) |
| Total | 134 (29.5%) | 320 (70.5%) |
Fertility by Education in Harrisburg
Average fertility rate in Harrisburg is 36.0 births per 1,000 women. Women with the education attainment of high school diploma have the highest fertility rate of 49.0 births per 1,000 women, while women with the education attainment of bachelor's degree have the lowest fertility at 17.0 births per 1,000 women. Women with the education attainment of high school diploma represent 42.3% of all women with births.
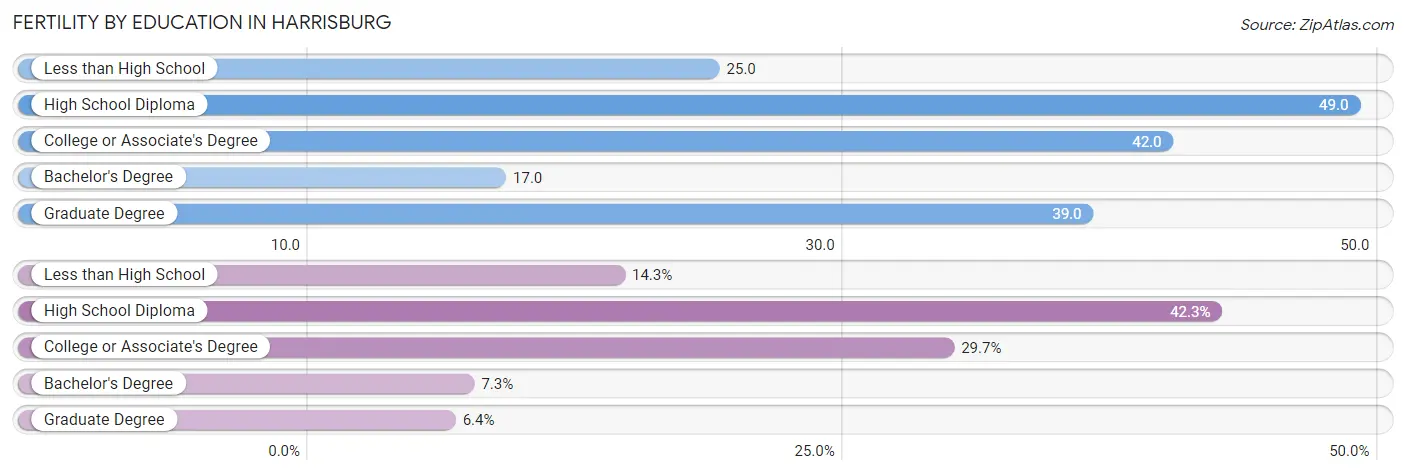
| Educational Attainment | Women with Births | Births / 1,000 Women |
| Less than High School | 65 (14.3%) | 25.0 |
| High School Diploma | 192 (42.3%) | 49.0 |
| College or Associate's Degree | 135 (29.7%) | 42.0 |
| Bachelor's Degree | 33 (7.3%) | 17.0 |
| Graduate Degree | 29 (6.4%) | 39.0 |
| Total | 454 (100.0%) | 36.0 |
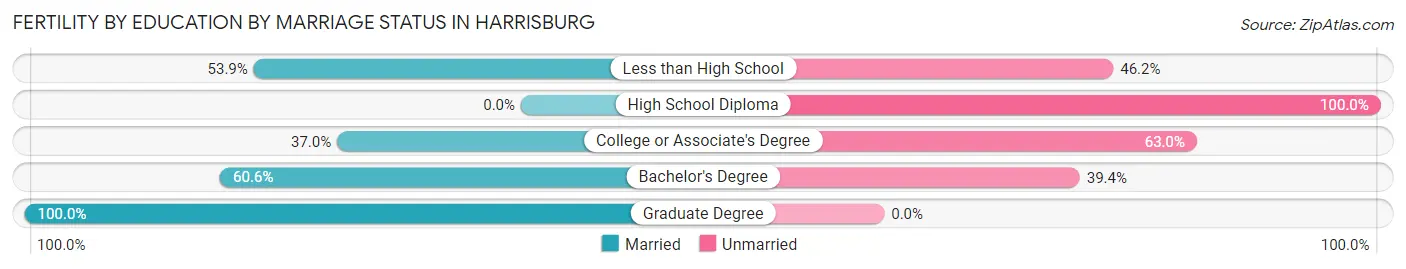
Fertility by Education by Marriage Status in Harrisburg
70.5% of women with births in Harrisburg are unmarried. Women with the educational attainment of graduate degree are most likely to be married with 100.0% of them married at childbirth, while women with the educational attainment of high school diploma are least likely to be married with 100.0% of them unmarried at childbirth.
| Educational Attainment | Married | Unmarried |
| Less than High School | 35 (53.8%) | 30 (46.2%) |
| High School Diploma | 0 (0.0%) | 192 (100.0%) |
| College or Associate's Degree | 50 (37.0%) | 85 (63.0%) |
| Bachelor's Degree | 20 (60.6%) | 13 (39.4%) |
| Graduate Degree | 29 (100.0%) | 0 (0.0%) |
| Total | 134 (29.5%) | 320 (70.5%) |
Employment Characteristics in Harrisburg
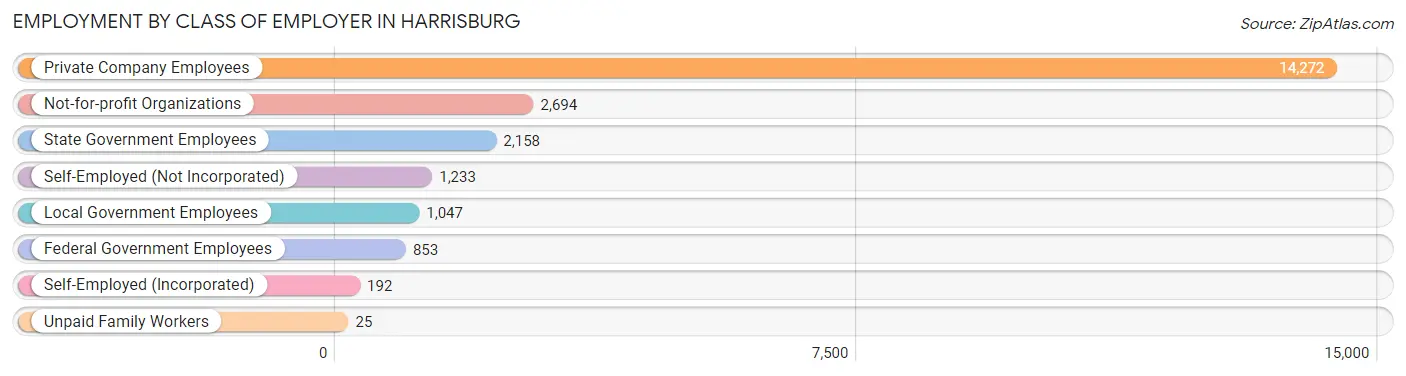
Employment by Class of Employer in Harrisburg
Among the 22,474 employed individuals in Harrisburg, private company employees (14,272 | 63.5%), not-for-profit organizations (2,694 | 12.0%), and state government employees (2,158 | 9.6%) make up the most common classes of employment.
| Employer Class | # Employees | % Employees |
| Private Company Employees | 14,272 | 63.5% |
| Self-Employed (Incorporated) | 192 | 0.9% |
| Self-Employed (Not Incorporated) | 1,233 | 5.5% |
| Not-for-profit Organizations | 2,694 | 12.0% |
| Local Government Employees | 1,047 | 4.7% |
| State Government Employees | 2,158 | 9.6% |
| Federal Government Employees | 853 | 3.8% |
| Unpaid Family Workers | 25 | 0.1% |
| Total | 22,474 | 100.0% |
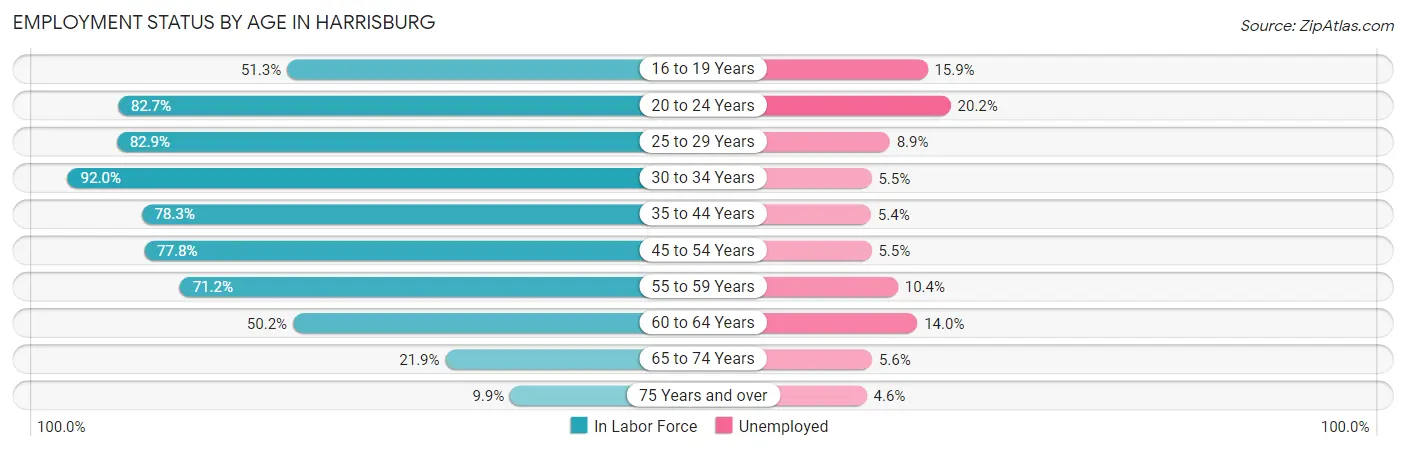
Employment Status by Age in Harrisburg
According to the labor force statistics for Harrisburg, out of the total population over 16 years of age (36,834), 67.7% or 24,937 individuals are in the labor force, with 9.0% or 2,244 of them unemployed. The age group with the highest labor force participation rate is 30 to 34 years, with 92.0% or 3,869 individuals in the labor force. Within the labor force, the 20 to 24 years age range has the highest percentage of unemployed individuals, with 20.2% or 594 of them being unemployed.
| Age Bracket | In Labor Force | Unemployed |
| 16 to 19 Years | 1,024 (51.3%) | 163 (15.9%) |
| 20 to 24 Years | 2,939 (82.7%) | 594 (20.2%) |
| 25 to 29 Years | 3,869 (82.9%) | 344 (8.9%) |
| 30 to 34 Years | 3,869 (92.0%) | 213 (5.5%) |
| 35 to 44 Years | 4,680 (78.3%) | 253 (5.4%) |
| 45 to 54 Years | 4,168 (77.8%) | 229 (5.5%) |
| 55 to 59 Years | 2,318 (71.2%) | 241 (10.4%) |
| 60 to 64 Years | 1,116 (50.2%) | 156 (14.0%) |
| 65 to 74 Years | 745 (21.9%) | 42 (5.6%) |
| 75 Years and over | 218 (9.9%) | 10 (4.6%) |
| Total | 24,937 (67.7%) | 2,244 (9.0%) |
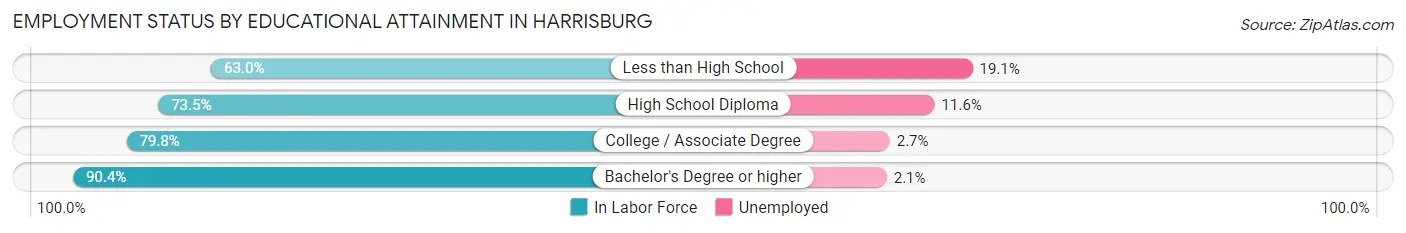
Employment Status by Educational Attainment in Harrisburg
According to labor force statistics for Harrisburg, 77.9% of individuals (20,009) out of the total population between 25 and 64 years of age (25,685) are in the labor force, with 7.2% or 1,441 of them being unemployed. The group with the highest labor force participation rate are those with the educational attainment of bachelor's degree or higher, with 90.4% or 5,718 individuals in the labor force. Within the labor force, individuals with less than high school education have the highest percentage of unemployment, with 19.1% or 459 of them being unemployed.
| Educational Attainment | In Labor Force | Unemployed |
| Less than High School | 2,403 (63.0%) | 729 (19.1%) |
| High School Diploma | 5,965 (73.5%) | 941 (11.6%) |
| College / Associate Degree | 5,929 (79.8%) | 201 (2.7%) |
| Bachelor's Degree or higher | 5,718 (90.4%) | 133 (2.1%) |
| Total | 20,009 (77.9%) | 1,849 (7.2%) |
Employment Occupations by Sex in Harrisburg
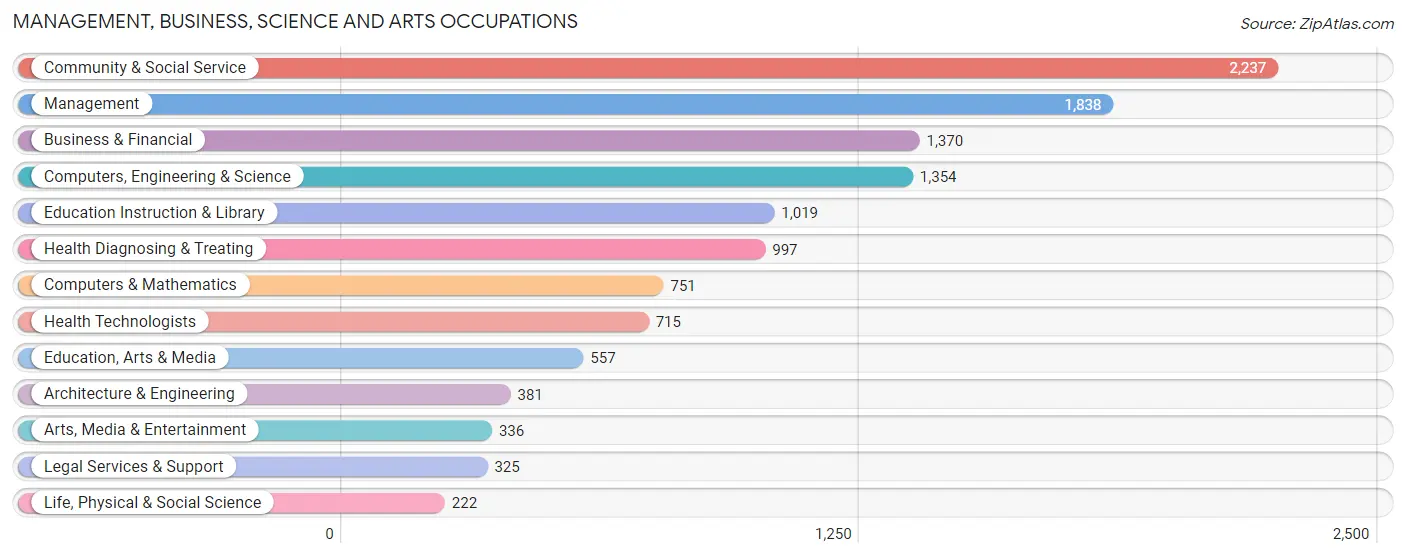
Management, Business, Science and Arts Occupations
The most common Management, Business, Science and Arts occupations in Harrisburg are Community & Social Service (2,237 | 9.9%), Management (1,838 | 8.1%), Business & Financial (1,370 | 6.0%), Computers, Engineering & Science (1,354 | 6.0%), and Education Instruction & Library (1,019 | 4.5%).
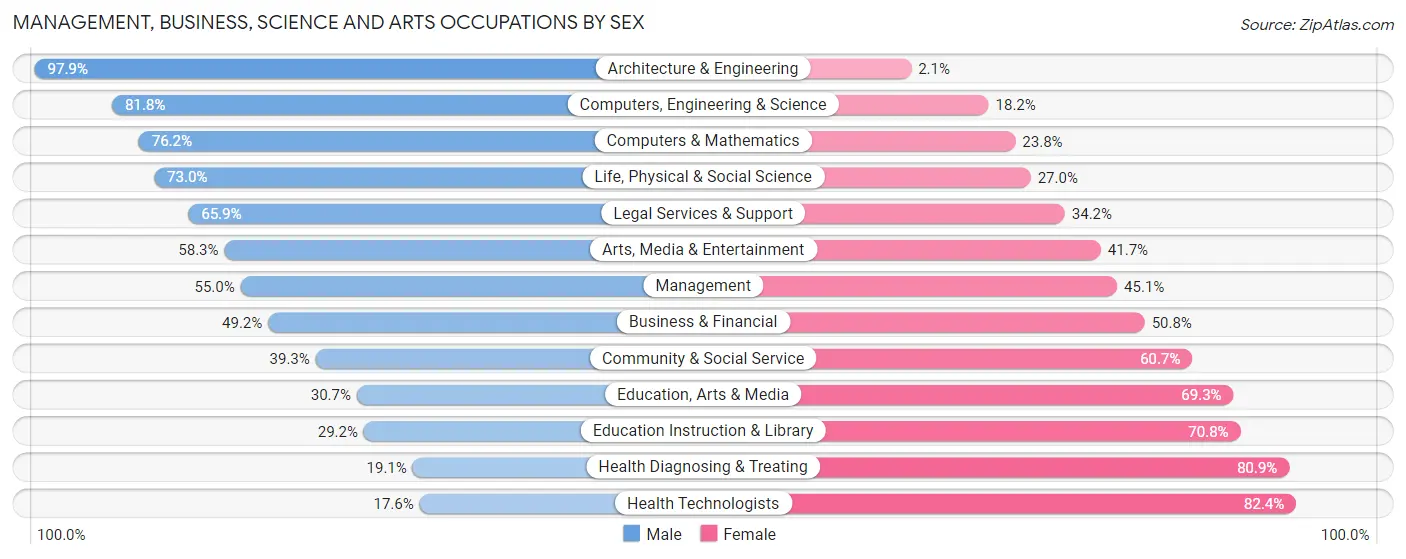
Management, Business, Science and Arts Occupations by Sex
Within the Management, Business, Science and Arts occupations in Harrisburg, the most male-oriented occupations are Architecture & Engineering (97.9%), Computers, Engineering & Science (81.8%), and Computers & Mathematics (76.2%), while the most female-oriented occupations are Health Technologists (82.4%), Health Diagnosing & Treating (80.9%), and Education Instruction & Library (70.8%).
| Occupation | Male | Female |
| Management | 1,010 (54.9%) | 828 (45.1%) |
| Business & Financial | 674 (49.2%) | 696 (50.8%) |
| Computers, Engineering & Science | 1,107 (81.8%) | 247 (18.2%) |
| Computers & Mathematics | 572 (76.2%) | 179 (23.8%) |
| Architecture & Engineering | 373 (97.9%) | 8 (2.1%) |
| Life, Physical & Social Science | 162 (73.0%) | 60 (27.0%) |
| Community & Social Service | 879 (39.3%) | 1,358 (60.7%) |
| Education, Arts & Media | 171 (30.7%) | 386 (69.3%) |
| Legal Services & Support | 214 (65.8%) | 111 (34.2%) |
| Education Instruction & Library | 298 (29.2%) | 721 (70.8%) |
| Arts, Media & Entertainment | 196 (58.3%) | 140 (41.7%) |
| Health Diagnosing & Treating | 190 (19.1%) | 807 (80.9%) |
| Health Technologists | 126 (17.6%) | 589 (82.4%) |
| Total (Category) | 3,860 (49.5%) | 3,936 (50.5%) |
| Total (Overall) | 11,512 (50.8%) | 11,142 (49.2%) |
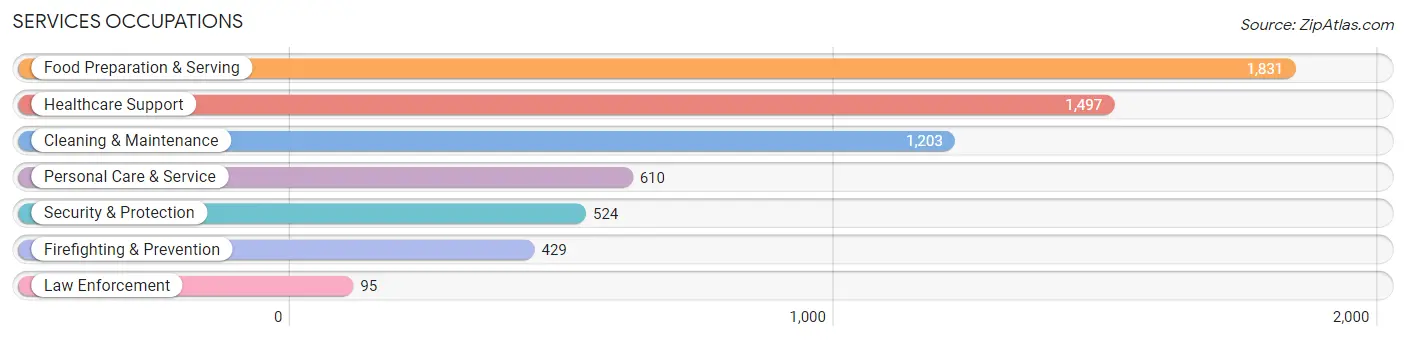
Services Occupations
The most common Services occupations in Harrisburg are Food Preparation & Serving (1,831 | 8.1%), Healthcare Support (1,497 | 6.6%), Cleaning & Maintenance (1,203 | 5.3%), Personal Care & Service (610 | 2.7%), and Security & Protection (524 | 2.3%).
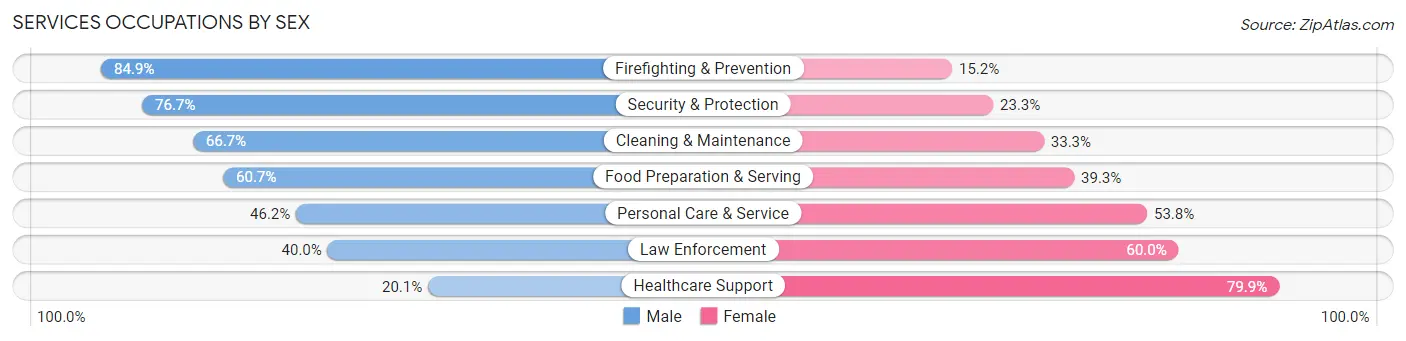
Services Occupations by Sex
Within the Services occupations in Harrisburg, the most male-oriented occupations are Firefighting & Prevention (84.9%), Security & Protection (76.7%), and Cleaning & Maintenance (66.7%), while the most female-oriented occupations are Healthcare Support (79.9%), Law Enforcement (60.0%), and Personal Care & Service (53.8%).
| Occupation | Male | Female |
| Healthcare Support | 301 (20.1%) | 1,196 (79.9%) |
| Security & Protection | 402 (76.7%) | 122 (23.3%) |
| Firefighting & Prevention | 364 (84.9%) | 65 (15.1%) |
| Law Enforcement | 38 (40.0%) | 57 (60.0%) |
| Food Preparation & Serving | 1,111 (60.7%) | 720 (39.3%) |
| Cleaning & Maintenance | 802 (66.7%) | 401 (33.3%) |
| Personal Care & Service | 282 (46.2%) | 328 (53.8%) |
| Total (Category) | 2,898 (51.2%) | 2,767 (48.8%) |
| Total (Overall) | 11,512 (50.8%) | 11,142 (49.2%) |
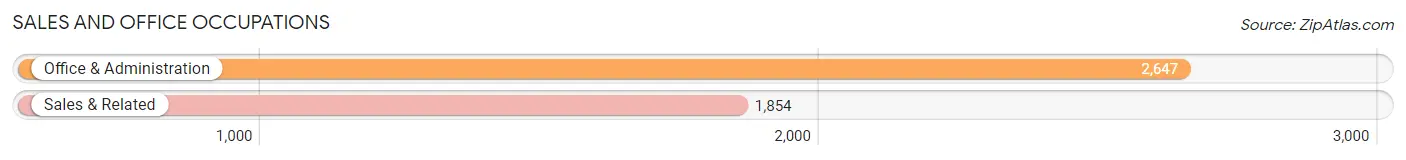
Sales and Office Occupations
The most common Sales and Office occupations in Harrisburg are Office & Administration (2,647 | 11.7%), and Sales & Related (1,854 | 8.2%).
Sales and Office Occupations by Sex
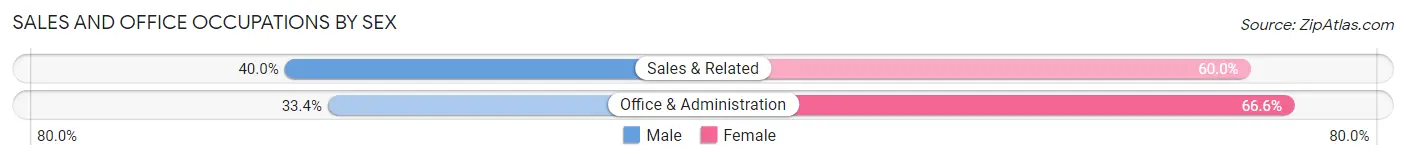
| Occupation | Male | Female |
| Sales & Related | 742 (40.0%) | 1,112 (60.0%) |
| Office & Administration | 883 (33.4%) | 1,764 (66.6%) |
| Total (Category) | 1,625 (36.1%) | 2,876 (63.9%) |
| Total (Overall) | 11,512 (50.8%) | 11,142 (49.2%) |
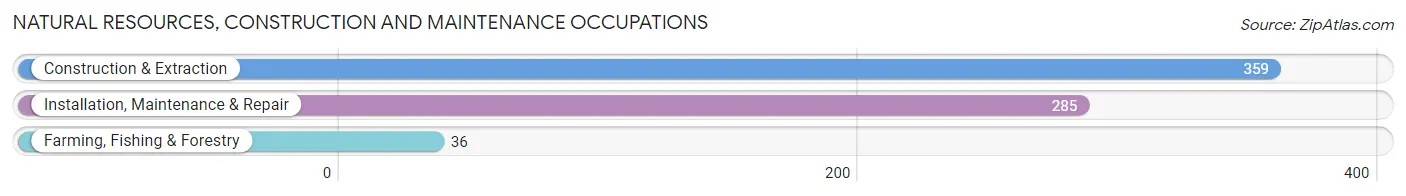
Natural Resources, Construction and Maintenance Occupations
The most common Natural Resources, Construction and Maintenance occupations in Harrisburg are Construction & Extraction (359 | 1.6%), Installation, Maintenance & Repair (285 | 1.3%), and Farming, Fishing & Forestry (36 | 0.2%).
Natural Resources, Construction and Maintenance Occupations by Sex
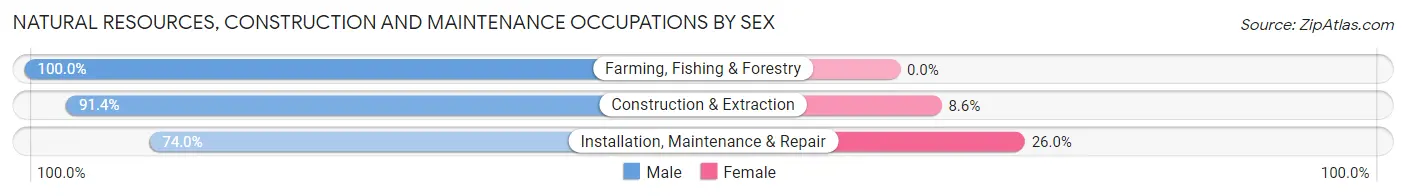
| Occupation | Male | Female |
| Farming, Fishing & Forestry | 36 (100.0%) | 0 (0.0%) |
| Construction & Extraction | 328 (91.4%) | 31 (8.6%) |
| Installation, Maintenance & Repair | 211 (74.0%) | 74 (26.0%) |
| Total (Category) | 575 (84.6%) | 105 (15.4%) |
| Total (Overall) | 11,512 (50.8%) | 11,142 (49.2%) |
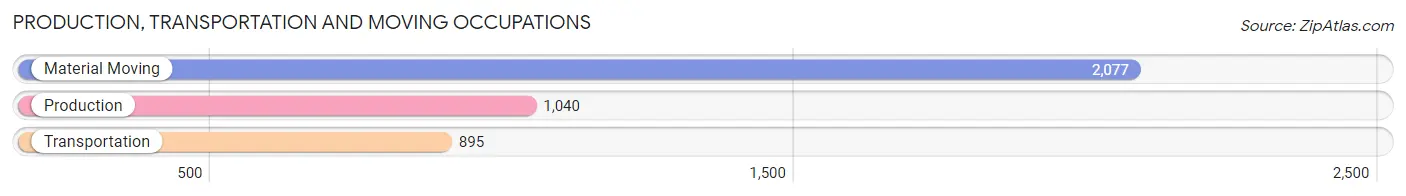
Production, Transportation and Moving Occupations
The most common Production, Transportation and Moving occupations in Harrisburg are Material Moving (2,077 | 9.2%), Production (1,040 | 4.6%), and Transportation (895 | 4.0%).
Production, Transportation and Moving Occupations by Sex
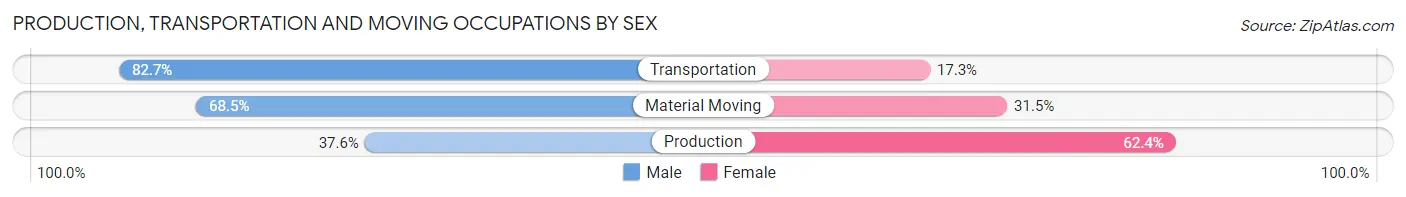
| Occupation | Male | Female |
| Production | 391 (37.6%) | 649 (62.4%) |
| Transportation | 740 (82.7%) | 155 (17.3%) |
| Material Moving | 1,423 (68.5%) | 654 (31.5%) |
| Total (Category) | 2,554 (63.7%) | 1,458 (36.3%) |
| Total (Overall) | 11,512 (50.8%) | 11,142 (49.2%) |
Employment Industries by Sex in Harrisburg
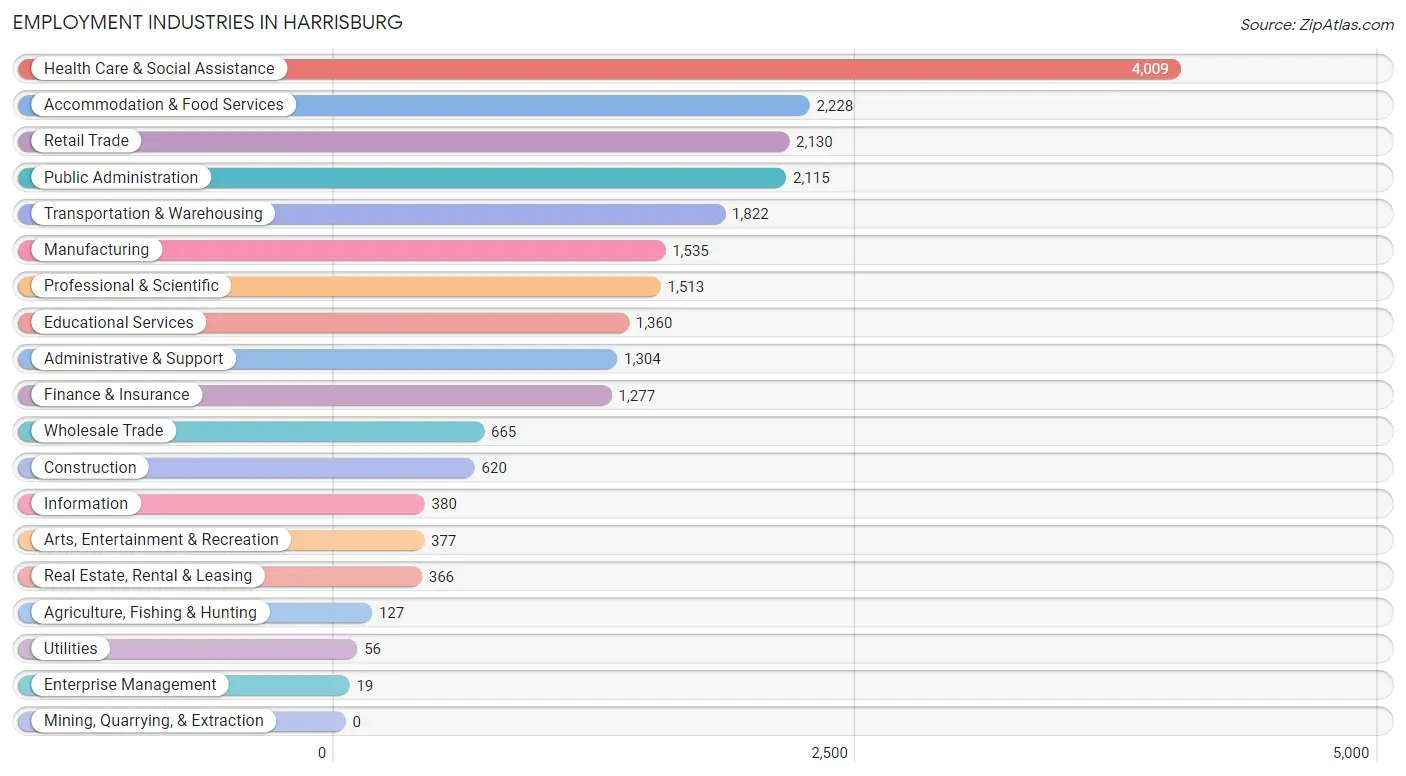
Employment Industries in Harrisburg
The major employment industries in Harrisburg include Health Care & Social Assistance (4,009 | 17.7%), Accommodation & Food Services (2,228 | 9.8%), Retail Trade (2,130 | 9.4%), Public Administration (2,115 | 9.3%), and Transportation & Warehousing (1,822 | 8.0%).
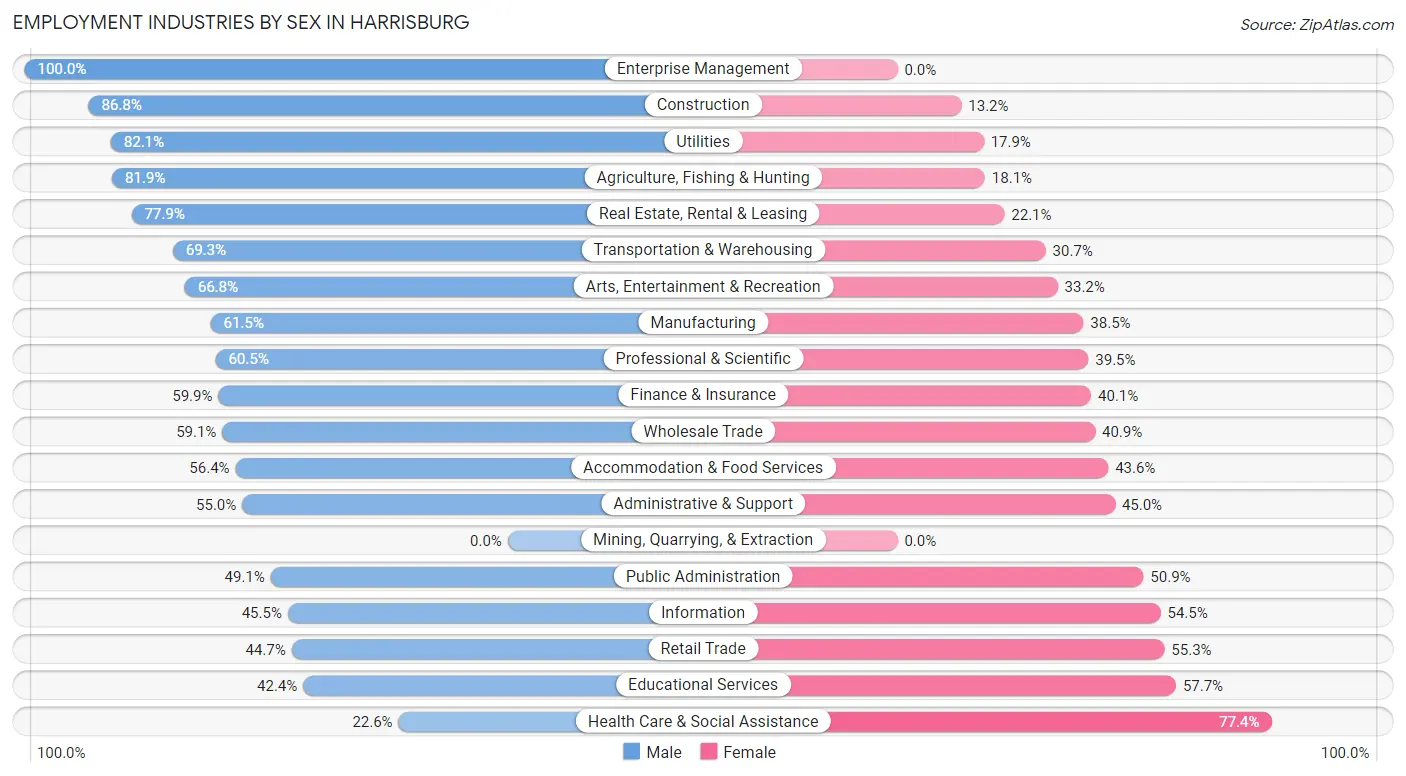
Employment Industries by Sex in Harrisburg
The Harrisburg industries that see more men than women are Enterprise Management (100.0%), Construction (86.8%), and Utilities (82.1%), whereas the industries that tend to have a higher number of women are Health Care & Social Assistance (77.4%), Educational Services (57.7%), and Retail Trade (55.3%).
| Industry | Male | Female |
| Agriculture, Fishing & Hunting | 104 (81.9%) | 23 (18.1%) |
| Mining, Quarrying, & Extraction | 0 (0.0%) | 0 (0.0%) |
| Construction | 538 (86.8%) | 82 (13.2%) |
| Manufacturing | 944 (61.5%) | 591 (38.5%) |
| Wholesale Trade | 393 (59.1%) | 272 (40.9%) |
| Retail Trade | 953 (44.7%) | 1,177 (55.3%) |
| Transportation & Warehousing | 1,263 (69.3%) | 559 (30.7%) |
| Utilities | 46 (82.1%) | 10 (17.9%) |
| Information | 173 (45.5%) | 207 (54.5%) |
| Finance & Insurance | 765 (59.9%) | 512 (40.1%) |
| Real Estate, Rental & Leasing | 285 (77.9%) | 81 (22.1%) |
| Professional & Scientific | 915 (60.5%) | 598 (39.5%) |
| Enterprise Management | 19 (100.0%) | 0 (0.0%) |
| Administrative & Support | 717 (55.0%) | 587 (45.0%) |
| Educational Services | 576 (42.3%) | 784 (57.7%) |
| Health Care & Social Assistance | 907 (22.6%) | 3,102 (77.4%) |
| Arts, Entertainment & Recreation | 252 (66.8%) | 125 (33.2%) |
| Accommodation & Food Services | 1,256 (56.4%) | 972 (43.6%) |
| Public Administration | 1,038 (49.1%) | 1,077 (50.9%) |
| Total | 11,512 (50.8%) | 11,142 (49.2%) |
Education in Harrisburg
School Enrollment in Harrisburg
The most common levels of schooling among the 14,059 students in Harrisburg are middle school (3,442 | 24.5%), elementary school (3,034 | 21.6%), and high school (2,396 | 17.0%).
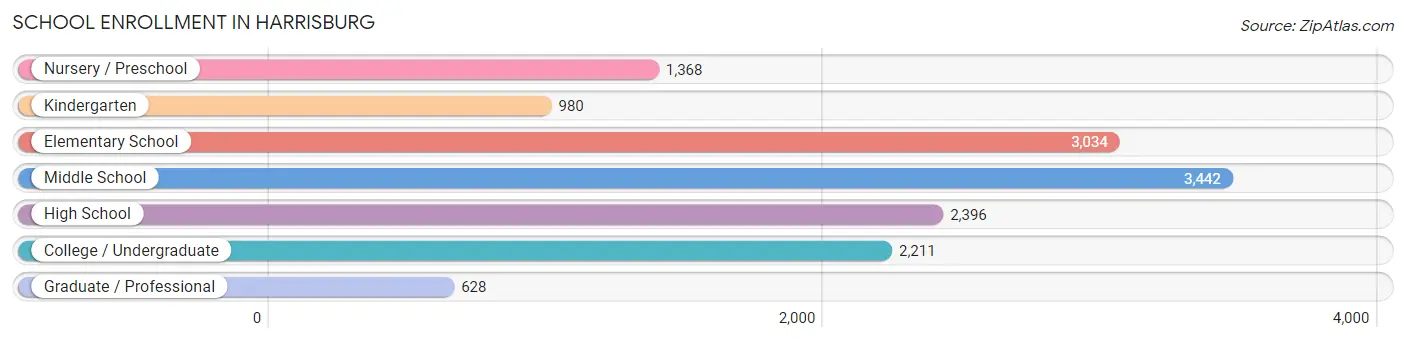
| School Level | # Students | % Students |
| Nursery / Preschool | 1,368 | 9.7% |
| Kindergarten | 980 | 7.0% |
| Elementary School | 3,034 | 21.6% |
| Middle School | 3,442 | 24.5% |
| High School | 2,396 | 17.0% |
| College / Undergraduate | 2,211 | 15.7% |
| Graduate / Professional | 628 | 4.5% |
| Total | 14,059 | 100.0% |
School Enrollment by Age by Funding Source in Harrisburg
Out of a total of 14,059 students who are enrolled in schools in Harrisburg, 3,065 (21.8%) attend a private institution, while the remaining 10,994 (78.2%) are enrolled in public schools. The age group of 35 years and over has the highest likelihood of being enrolled in private schools, with 313 (41.9% in the age bracket) enrolled. Conversely, the age group of 3 to 4 year olds has the lowest likelihood of being enrolled in a private school, with 973 (91.4% in the age bracket) attending a public institution.
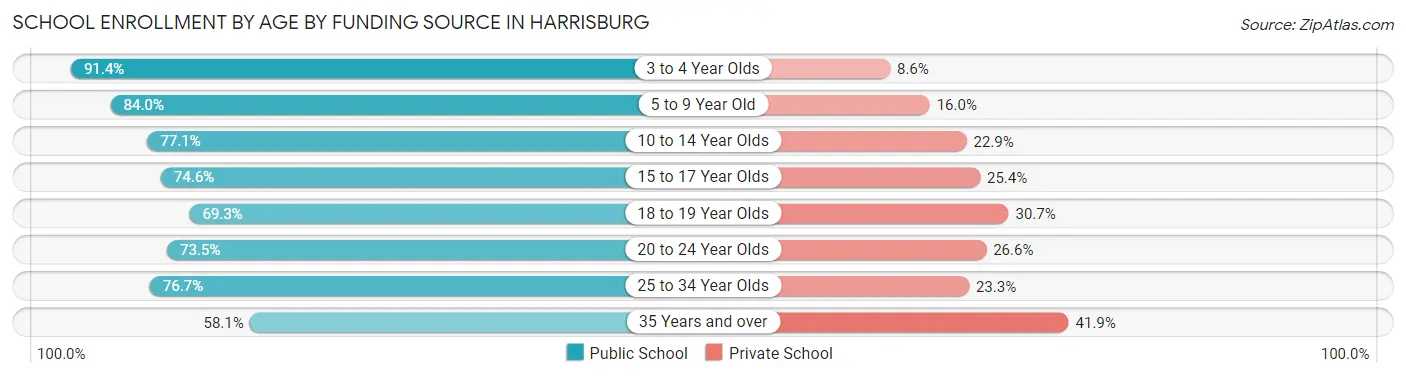
| Age Bracket | Public School | Private School |
| 3 to 4 Year Olds | 973 (91.4%) | 92 (8.6%) |
| 5 to 9 Year Old | 3,348 (84.0%) | 639 (16.0%) |
| 10 to 14 Year Olds | 3,182 (77.1%) | 944 (22.9%) |
| 15 to 17 Year Olds | 1,166 (74.6%) | 397 (25.4%) |
| 18 to 19 Year Olds | 422 (69.3%) | 187 (30.7%) |
| 20 to 24 Year Olds | 733 (73.5%) | 265 (26.6%) |
| 25 to 34 Year Olds | 739 (76.7%) | 225 (23.3%) |
| 35 Years and over | 434 (58.1%) | 313 (41.9%) |
| Total | 10,994 (78.2%) | 3,065 (21.8%) |
Educational Attainment by Field of Study in Harrisburg
Business (1,609 | 20.0%), social sciences (744 | 9.3%), arts & humanities (677 | 8.4%), education (671 | 8.4%), and science & technology (649 | 8.1%) are the most common fields of study among 8,036 individuals in Harrisburg who have obtained a bachelor's degree or higher.
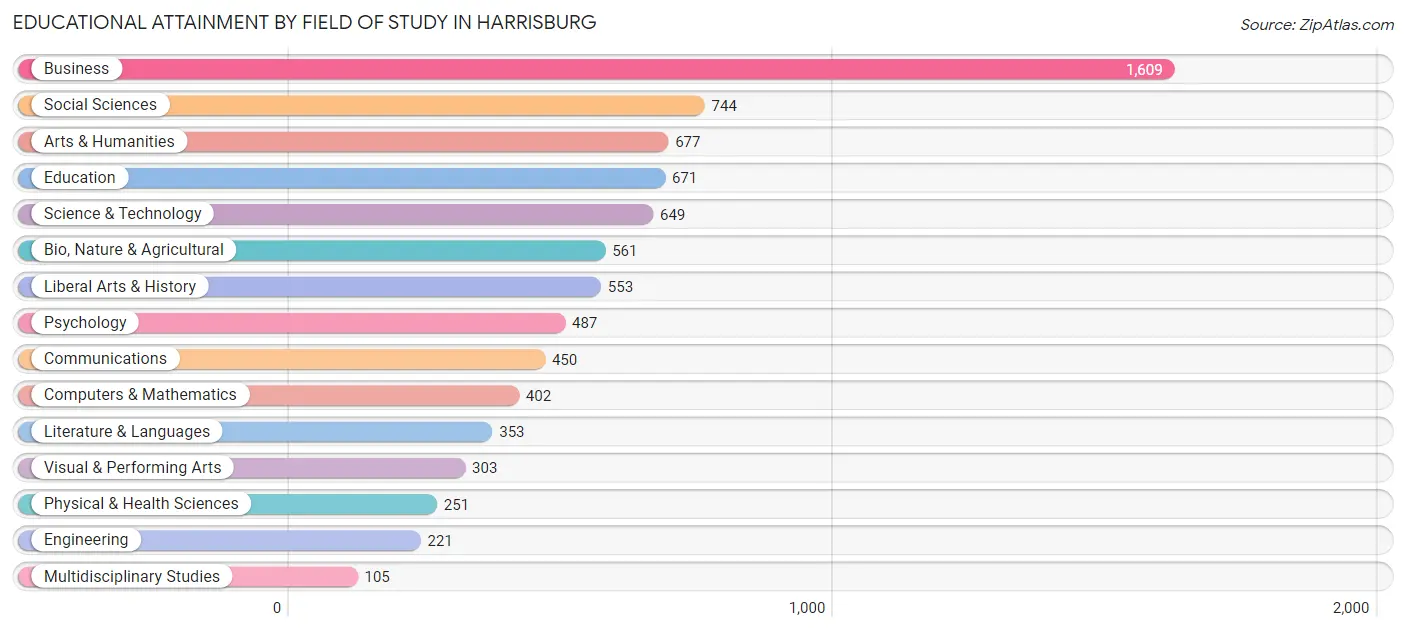
| Field of Study | # Graduates | % Graduates |
| Computers & Mathematics | 402 | 5.0% |
| Bio, Nature & Agricultural | 561 | 7.0% |
| Physical & Health Sciences | 251 | 3.1% |
| Psychology | 487 | 6.1% |
| Social Sciences | 744 | 9.3% |
| Engineering | 221 | 2.8% |
| Multidisciplinary Studies | 105 | 1.3% |
| Science & Technology | 649 | 8.1% |
| Business | 1,609 | 20.0% |
| Education | 671 | 8.4% |
| Literature & Languages | 353 | 4.4% |
| Liberal Arts & History | 553 | 6.9% |
| Visual & Performing Arts | 303 | 3.8% |
| Communications | 450 | 5.6% |
| Arts & Humanities | 677 | 8.4% |
| Total | 8,036 | 100.0% |
Transportation & Commute in Harrisburg
Vehicle Availability by Sex in Harrisburg
The most prevalent vehicle ownership categories in Harrisburg are males with 1 vehicle (4,516, accounting for 39.8%) and females with 1 vehicle (4,677, making up 41.9%).
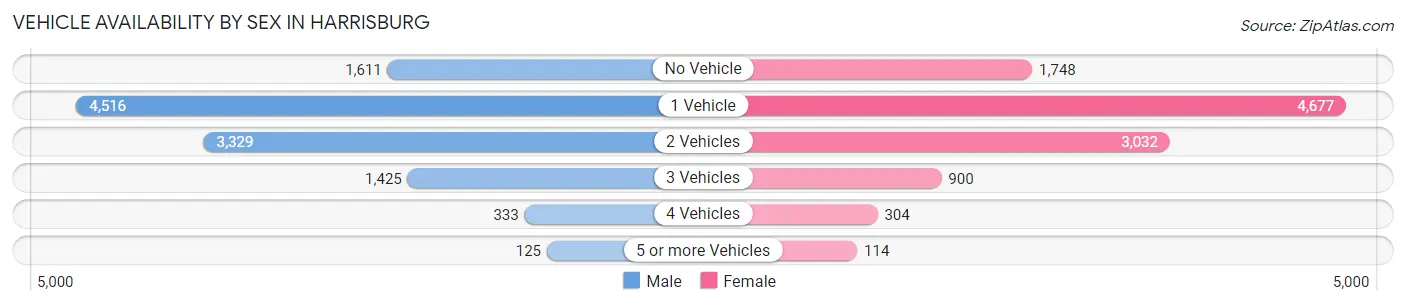
| Vehicles Available | Male | Female |
| No Vehicle | 1,611 (14.2%) | 1,748 (16.2%) |
| 1 Vehicle | 4,516 (39.8%) | 4,677 (43.4%) |
| 2 Vehicles | 3,329 (29.4%) | 3,032 (28.1%) |
| 3 Vehicles | 1,425 (12.6%) | 900 (8.4%) |
| 4 Vehicles | 333 (2.9%) | 304 (2.8%) |
| 5 or more Vehicles | 125 (1.1%) | 114 (1.1%) |
| Total | 11,339 (100.0%) | 10,775 (100.0%) |
Commute Time in Harrisburg
The most frequently occuring commute durations in Harrisburg are 15 to 19 minutes (4,627 commuters, 23.0%), 10 to 14 minutes (4,468 commuters, 22.2%), and 20 to 24 minutes (3,258 commuters, 16.2%).
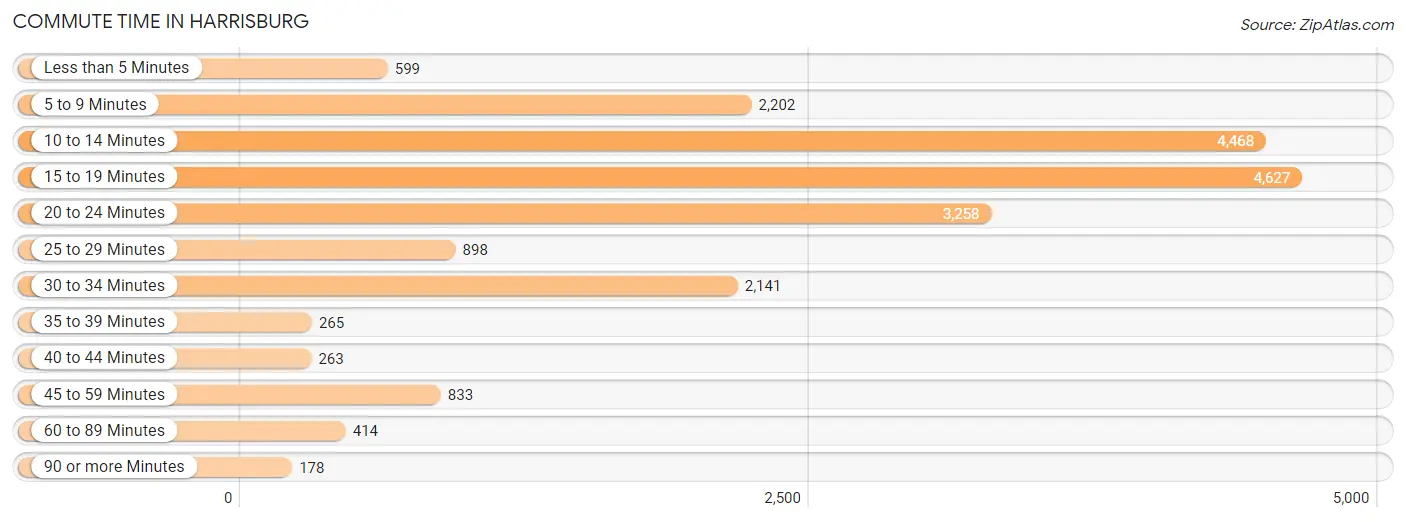
| Commute Time | # Commuters | % Commuters |
| Less than 5 Minutes | 599 | 3.0% |
| 5 to 9 Minutes | 2,202 | 10.9% |
| 10 to 14 Minutes | 4,468 | 22.2% |
| 15 to 19 Minutes | 4,627 | 23.0% |
| 20 to 24 Minutes | 3,258 | 16.2% |
| 25 to 29 Minutes | 898 | 4.5% |
| 30 to 34 Minutes | 2,141 | 10.6% |
| 35 to 39 Minutes | 265 | 1.3% |
| 40 to 44 Minutes | 263 | 1.3% |
| 45 to 59 Minutes | 833 | 4.1% |
| 60 to 89 Minutes | 414 | 2.1% |
| 90 or more Minutes | 178 | 0.9% |
Commute Time by Sex in Harrisburg
The most common commute times in Harrisburg are 10 to 14 minutes (2,395 commuters, 23.0%) for males and 15 to 19 minutes (2,540 commuters, 26.1%) for females.
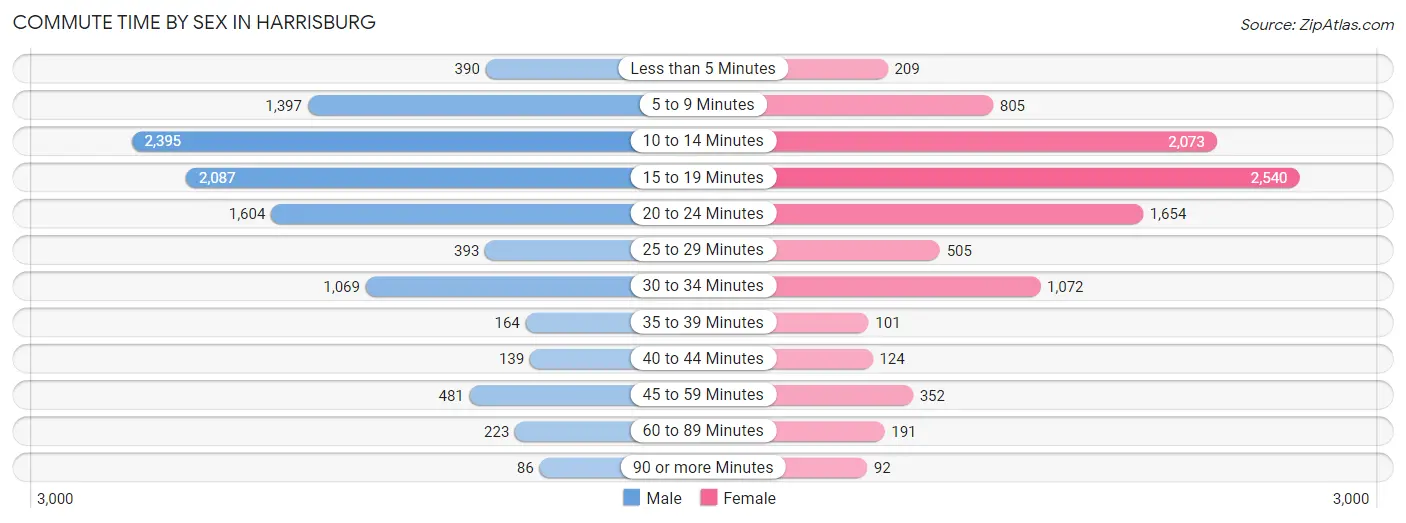
| Commute Time | Male | Female |
| Less than 5 Minutes | 390 (3.7%) | 209 (2.1%) |
| 5 to 9 Minutes | 1,397 (13.4%) | 805 (8.3%) |
| 10 to 14 Minutes | 2,395 (23.0%) | 2,073 (21.3%) |
| 15 to 19 Minutes | 2,087 (20.0%) | 2,540 (26.1%) |
| 20 to 24 Minutes | 1,604 (15.4%) | 1,654 (17.0%) |
| 25 to 29 Minutes | 393 (3.8%) | 505 (5.2%) |
| 30 to 34 Minutes | 1,069 (10.2%) | 1,072 (11.0%) |
| 35 to 39 Minutes | 164 (1.6%) | 101 (1.0%) |
| 40 to 44 Minutes | 139 (1.3%) | 124 (1.3%) |
| 45 to 59 Minutes | 481 (4.6%) | 352 (3.6%) |
| 60 to 89 Minutes | 223 (2.1%) | 191 (2.0%) |
| 90 or more Minutes | 86 (0.8%) | 92 (0.9%) |
Time of Departure to Work by Sex in Harrisburg
The most frequent times of departure to work in Harrisburg are 12:00 PM to 3:59 PM (1,502, 14.4%) for males and 8:00 AM to 8:29 AM (1,515, 15.6%) for females.
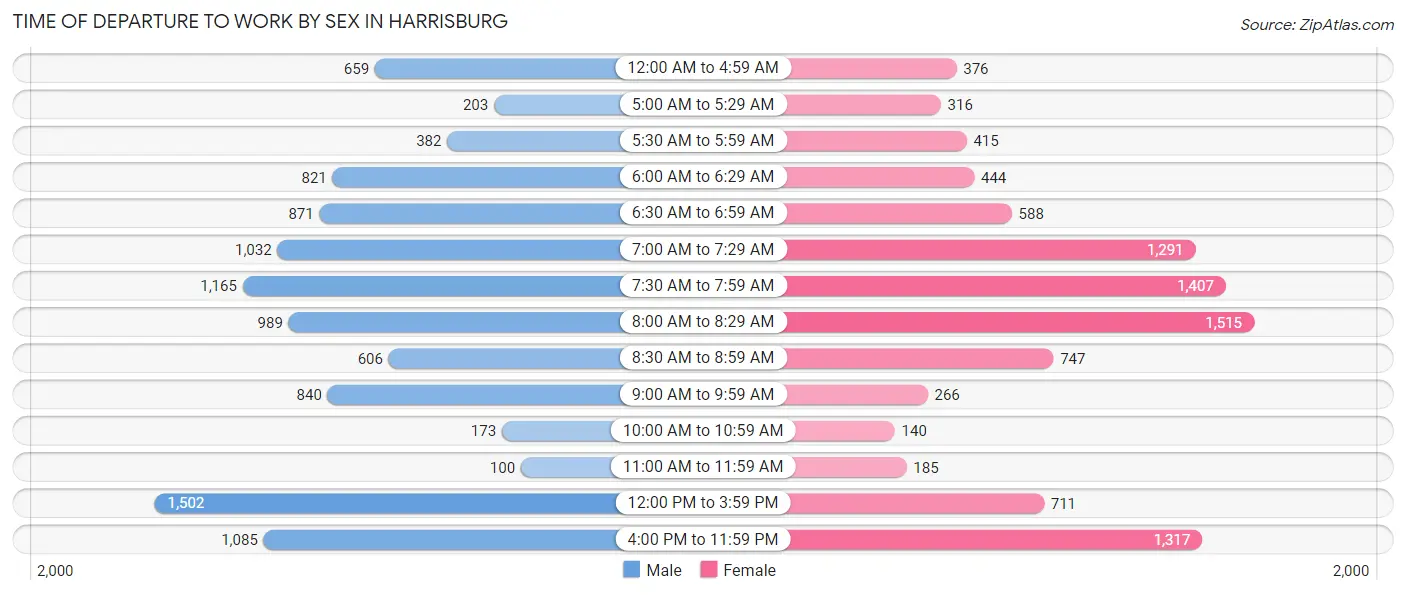
| Time of Departure | Male | Female |
| 12:00 AM to 4:59 AM | 659 (6.3%) | 376 (3.9%) |
| 5:00 AM to 5:29 AM | 203 (1.9%) | 316 (3.3%) |
| 5:30 AM to 5:59 AM | 382 (3.7%) | 415 (4.3%) |
| 6:00 AM to 6:29 AM | 821 (7.9%) | 444 (4.6%) |
| 6:30 AM to 6:59 AM | 871 (8.4%) | 588 (6.0%) |
| 7:00 AM to 7:29 AM | 1,032 (9.9%) | 1,291 (13.3%) |
| 7:30 AM to 7:59 AM | 1,165 (11.2%) | 1,407 (14.5%) |
| 8:00 AM to 8:29 AM | 989 (9.5%) | 1,515 (15.6%) |
| 8:30 AM to 8:59 AM | 606 (5.8%) | 747 (7.7%) |
| 9:00 AM to 9:59 AM | 840 (8.1%) | 266 (2.7%) |
| 10:00 AM to 10:59 AM | 173 (1.7%) | 140 (1.4%) |
| 11:00 AM to 11:59 AM | 100 (1.0%) | 185 (1.9%) |
| 12:00 PM to 3:59 PM | 1,502 (14.4%) | 711 (7.3%) |
| 4:00 PM to 11:59 PM | 1,085 (10.4%) | 1,317 (13.6%) |
| Total | 10,428 (100.0%) | 9,718 (100.0%) |
Housing Occupancy in Harrisburg
Occupancy by Ownership in Harrisburg
Of the total 21,474 dwellings in Harrisburg, owner-occupied units account for 7,624 (35.5%), while renter-occupied units make up 13,850 (64.5%).
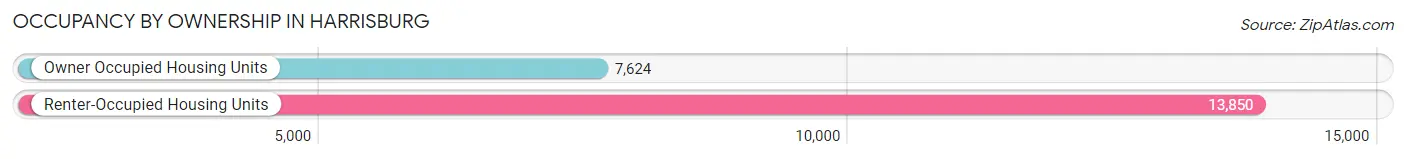
| Occupancy | # Housing Units | % Housing Units |
| Owner Occupied Housing Units | 7,624 | 35.5% |
| Renter-Occupied Housing Units | 13,850 | 64.5% |
| Total Occupied Housing Units | 21,474 | 100.0% |
Occupancy by Household Size in Harrisburg
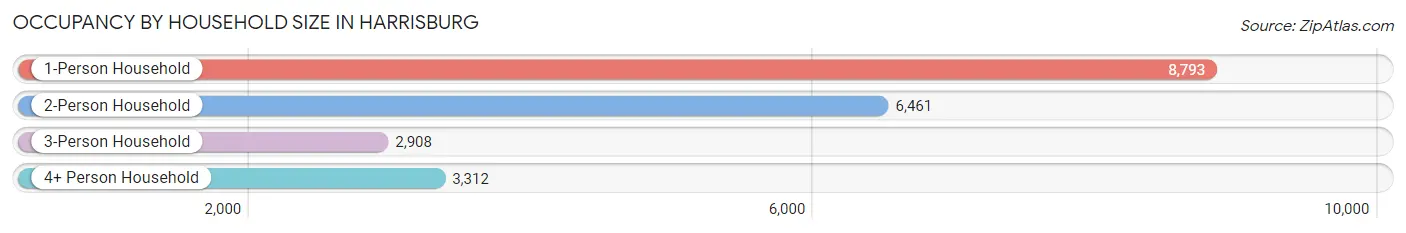
| Household Size | # Housing Units | % Housing Units |
| 1-Person Household | 8,793 | 40.9% |
| 2-Person Household | 6,461 | 30.1% |
| 3-Person Household | 2,908 | 13.5% |
| 4+ Person Household | 3,312 | 15.4% |
| Total Housing Units | 21,474 | 100.0% |
Occupancy by Ownership by Household Size in Harrisburg
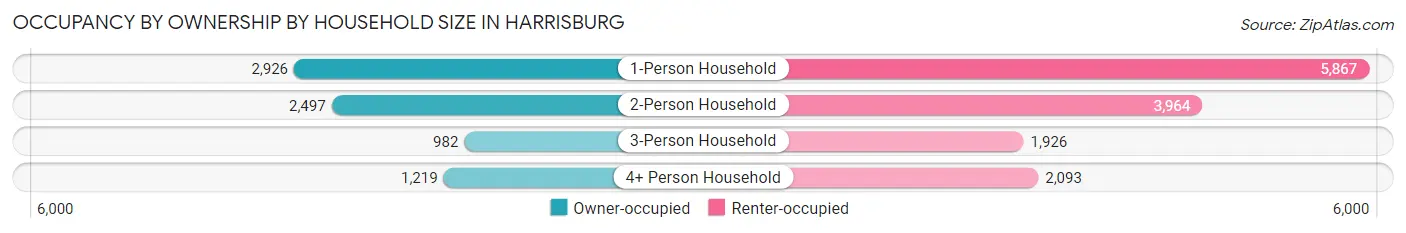
| Household Size | Owner-occupied | Renter-occupied |
| 1-Person Household | 2,926 (33.3%) | 5,867 (66.7%) |
| 2-Person Household | 2,497 (38.7%) | 3,964 (61.4%) |
| 3-Person Household | 982 (33.8%) | 1,926 (66.2%) |
| 4+ Person Household | 1,219 (36.8%) | 2,093 (63.2%) |
| Total Housing Units | 7,624 (35.5%) | 13,850 (64.5%) |
Occupancy by Educational Attainment in Harrisburg
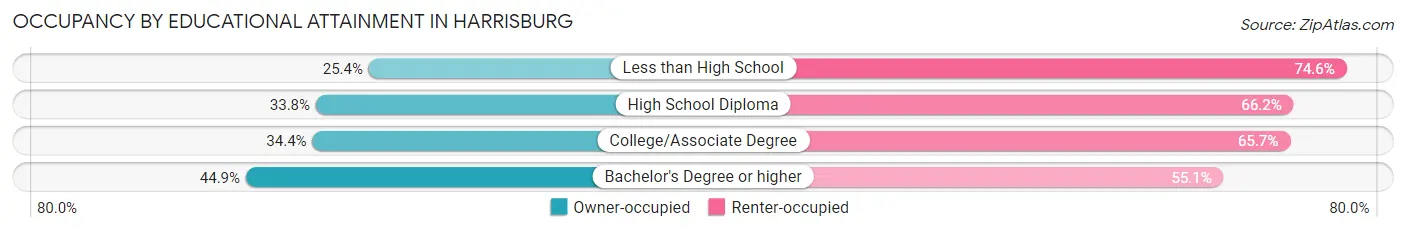
| Household Size | Owner-occupied | Renter-occupied |
| Less than High School | 807 (25.4%) | 2,370 (74.6%) |
| High School Diploma | 2,225 (33.8%) | 4,357 (66.2%) |
| College/Associate Degree | 2,177 (34.4%) | 4,160 (65.6%) |
| Bachelor's Degree or higher | 2,415 (44.9%) | 2,963 (55.1%) |
Occupancy by Age of Householder in Harrisburg
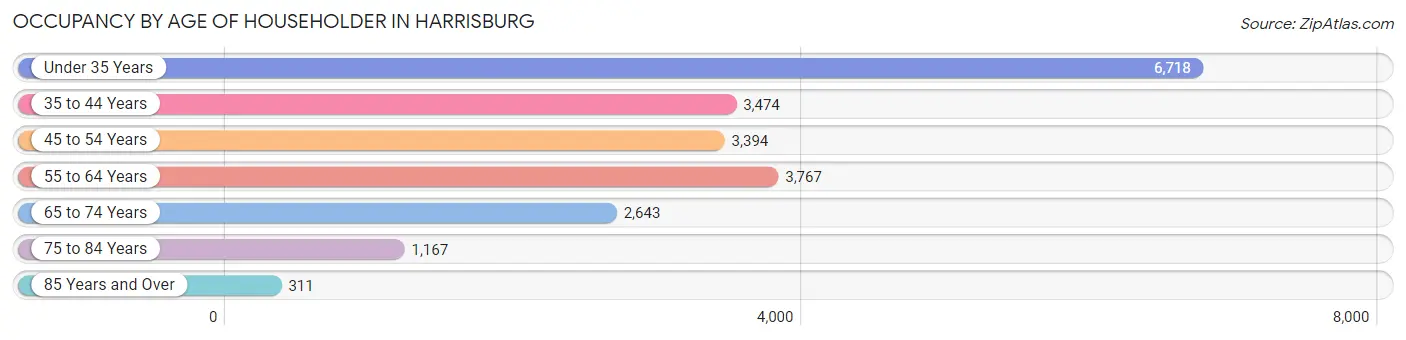
| Age Bracket | # Households | % Households |
| Under 35 Years | 6,718 | 31.3% |
| 35 to 44 Years | 3,474 | 16.2% |
| 45 to 54 Years | 3,394 | 15.8% |
| 55 to 64 Years | 3,767 | 17.5% |
| 65 to 74 Years | 2,643 | 12.3% |
| 75 to 84 Years | 1,167 | 5.4% |
| 85 Years and Over | 311 | 1.5% |
| Total | 21,474 | 100.0% |
Housing Finances in Harrisburg
Median Income by Occupancy in Harrisburg
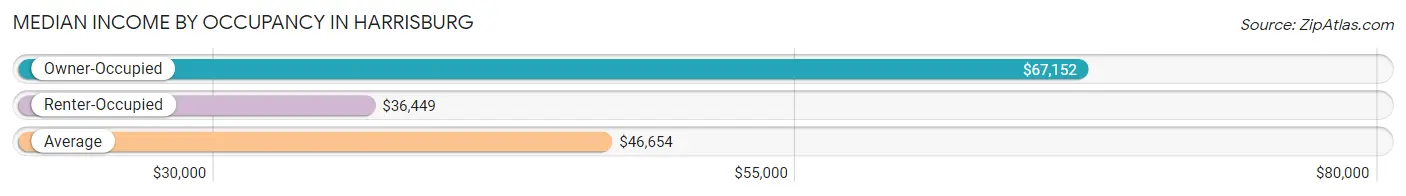
| Occupancy Type | # Households | Median Income |
| Owner-Occupied | 7,624 (35.5%) | $67,152 |
| Renter-Occupied | 13,850 (64.5%) | $36,449 |
| Average | 21,474 (100.0%) | $46,654 |
Occupancy by Householder Income Bracket in Harrisburg
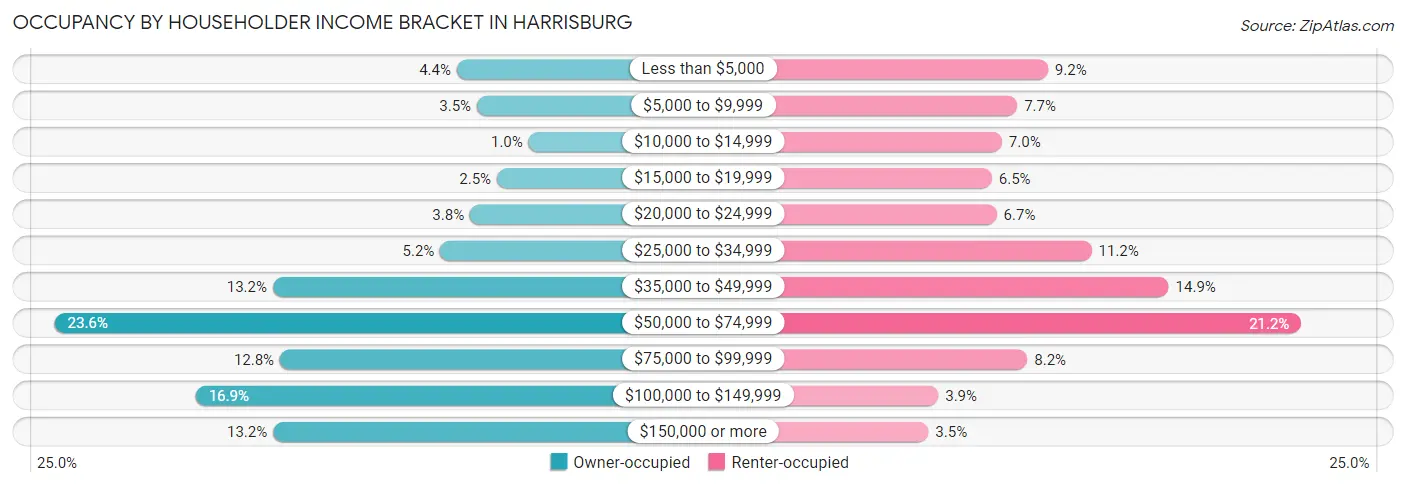
| Income Bracket | Owner-occupied | Renter-occupied |
| Less than $5,000 | 337 (4.4%) | 1,269 (9.2%) |
| $5,000 to $9,999 | 264 (3.5%) | 1,066 (7.7%) |
| $10,000 to $14,999 | 76 (1.0%) | 966 (7.0%) |
| $15,000 to $19,999 | 191 (2.5%) | 899 (6.5%) |
| $20,000 to $24,999 | 289 (3.8%) | 931 (6.7%) |
| $25,000 to $34,999 | 397 (5.2%) | 1,557 (11.2%) |
| $35,000 to $49,999 | 1,005 (13.2%) | 2,065 (14.9%) |
| $50,000 to $74,999 | 1,797 (23.6%) | 2,939 (21.2%) |
| $75,000 to $99,999 | 979 (12.8%) | 1,133 (8.2%) |
| $100,000 to $149,999 | 1,285 (16.9%) | 545 (3.9%) |
| $150,000 or more | 1,004 (13.2%) | 480 (3.5%) |
| Total | 7,624 (100.0%) | 13,850 (100.0%) |
Monthly Housing Cost Tiers in Harrisburg
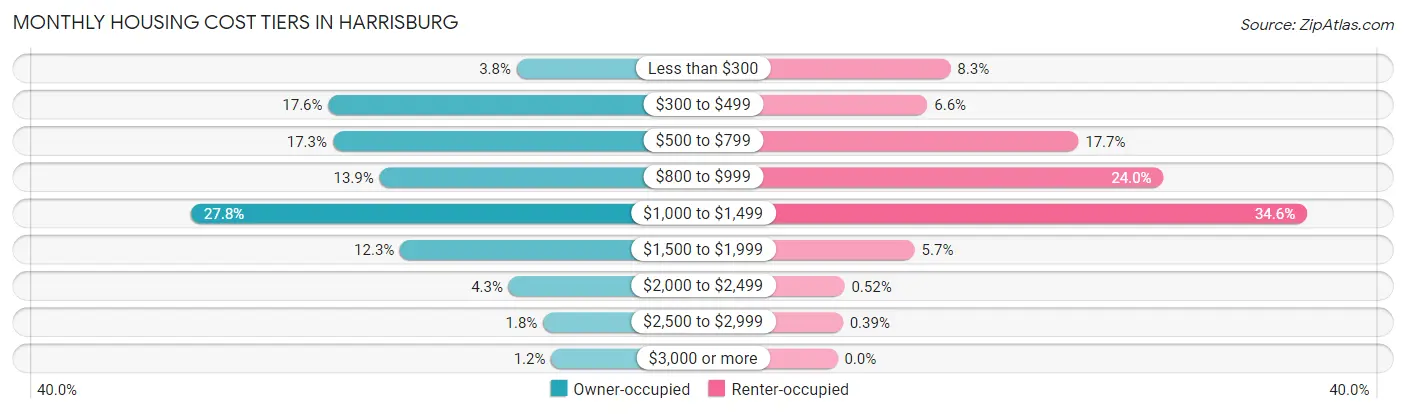
| Monthly Cost | Owner-occupied | Renter-occupied |
| Less than $300 | 286 (3.7%) | 1,152 (8.3%) |
| $300 to $499 | 1,344 (17.6%) | 917 (6.6%) |
| $500 to $799 | 1,319 (17.3%) | 2,457 (17.7%) |
| $800 to $999 | 1,057 (13.9%) | 3,326 (24.0%) |
| $1,000 to $1,499 | 2,116 (27.8%) | 4,789 (34.6%) |
| $1,500 to $1,999 | 941 (12.3%) | 788 (5.7%) |
| $2,000 to $2,499 | 331 (4.3%) | 72 (0.5%) |
| $2,500 to $2,999 | 138 (1.8%) | 54 (0.4%) |
| $3,000 or more | 92 (1.2%) | 0 (0.0%) |
| Total | 7,624 (100.0%) | 13,850 (100.0%) |
Physical Housing Characteristics in Harrisburg
Housing Structures in Harrisburg
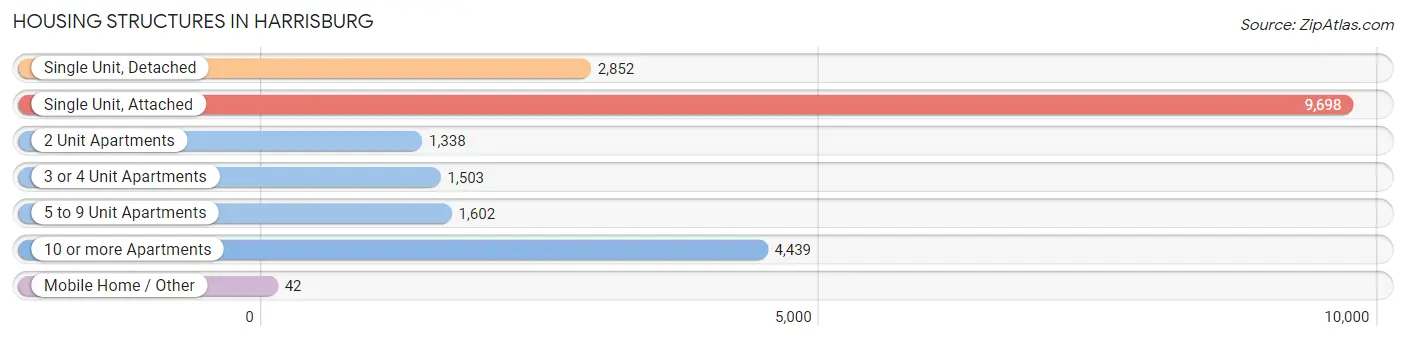
| Structure Type | # Housing Units | % Housing Units |
| Single Unit, Detached | 2,852 | 13.3% |
| Single Unit, Attached | 9,698 | 45.2% |
| 2 Unit Apartments | 1,338 | 6.2% |
| 3 or 4 Unit Apartments | 1,503 | 7.0% |
| 5 to 9 Unit Apartments | 1,602 | 7.5% |
| 10 or more Apartments | 4,439 | 20.7% |
| Mobile Home / Other | 42 | 0.2% |
| Total | 21,474 | 100.0% |
Housing Structures by Occupancy in Harrisburg
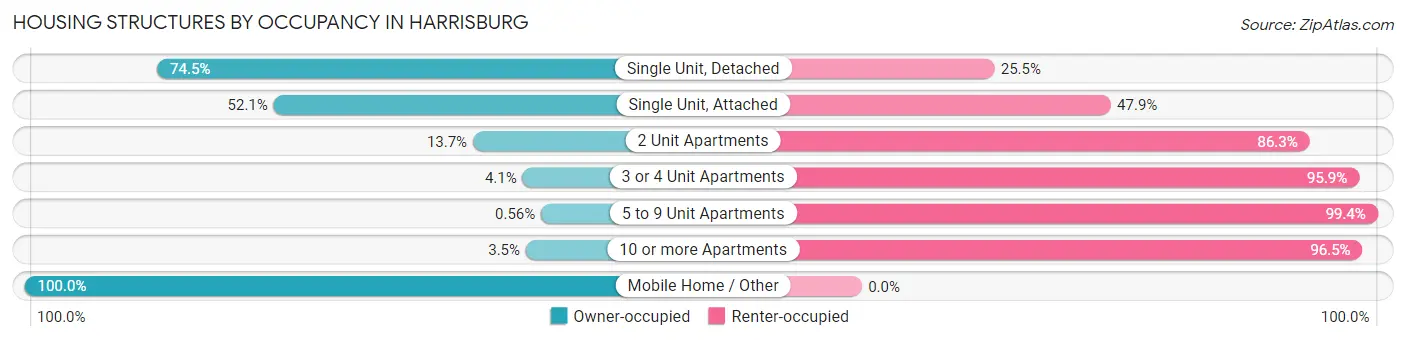
| Structure Type | Owner-occupied | Renter-occupied |
| Single Unit, Detached | 2,124 (74.5%) | 728 (25.5%) |
| Single Unit, Attached | 5,049 (52.1%) | 4,649 (47.9%) |
| 2 Unit Apartments | 183 (13.7%) | 1,155 (86.3%) |
| 3 or 4 Unit Apartments | 62 (4.1%) | 1,441 (95.9%) |
| 5 to 9 Unit Apartments | 9 (0.6%) | 1,593 (99.4%) |
| 10 or more Apartments | 155 (3.5%) | 4,284 (96.5%) |
| Mobile Home / Other | 42 (100.0%) | 0 (0.0%) |
| Total | 7,624 (35.5%) | 13,850 (64.5%) |
Housing Structures by Number of Rooms in Harrisburg
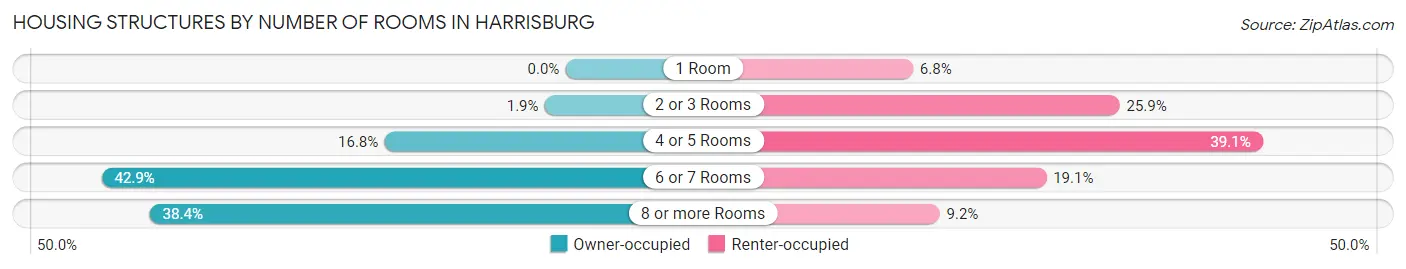
| Number of Rooms | Owner-occupied | Renter-occupied |
| 1 Room | 0 (0.0%) | 935 (6.8%) |
| 2 or 3 Rooms | 147 (1.9%) | 3,582 (25.9%) |
| 4 or 5 Rooms | 1,277 (16.8%) | 5,413 (39.1%) |
| 6 or 7 Rooms | 3,270 (42.9%) | 2,643 (19.1%) |
| 8 or more Rooms | 2,930 (38.4%) | 1,277 (9.2%) |
| Total | 7,624 (100.0%) | 13,850 (100.0%) |
Housing Structure by Heating Type in Harrisburg
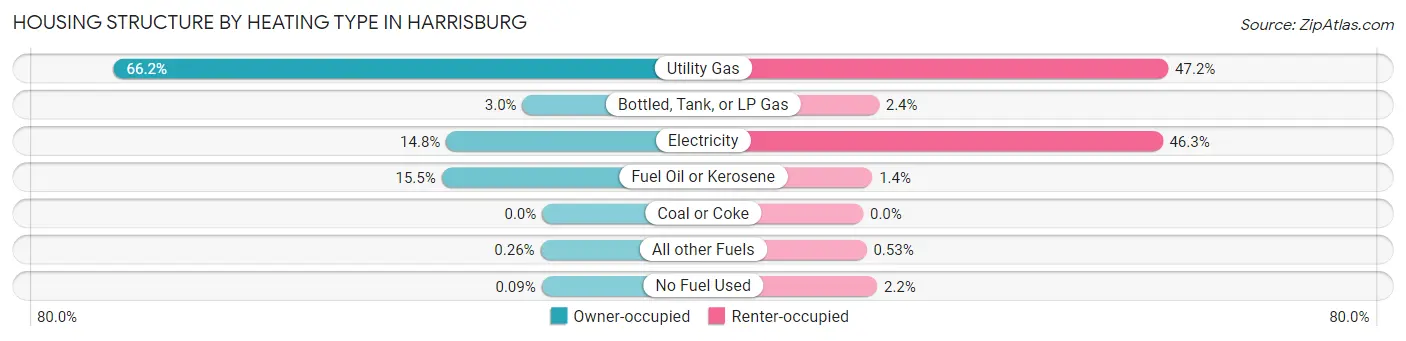
| Heating Type | Owner-occupied | Renter-occupied |
| Utility Gas | 5,049 (66.2%) | 6,533 (47.2%) |
| Bottled, Tank, or LP Gas | 232 (3.0%) | 337 (2.4%) |
| Electricity | 1,131 (14.8%) | 6,411 (46.3%) |
| Fuel Oil or Kerosene | 1,185 (15.5%) | 197 (1.4%) |
| Coal or Coke | 0 (0.0%) | 0 (0.0%) |
| All other Fuels | 20 (0.3%) | 73 (0.5%) |
| No Fuel Used | 7 (0.1%) | 299 (2.2%) |
| Total | 7,624 (100.0%) | 13,850 (100.0%) |
Household Vehicle Usage in Harrisburg
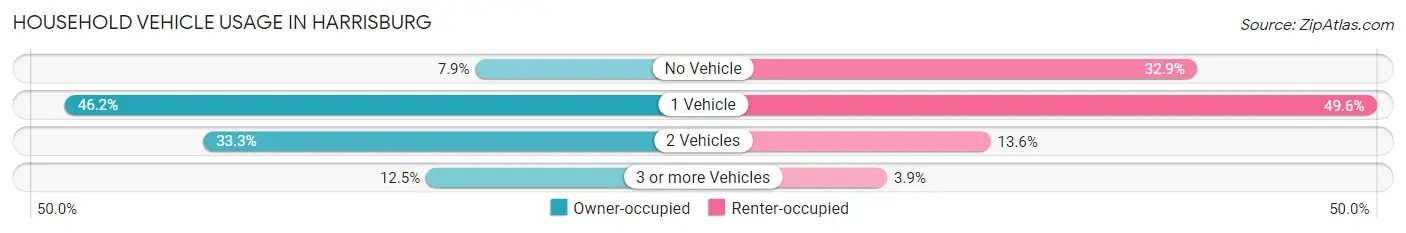
| Vehicles per Household | Owner-occupied | Renter-occupied |
| No Vehicle | 604 (7.9%) | 4,550 (32.9%) |
| 1 Vehicle | 3,525 (46.2%) | 6,870 (49.6%) |
| 2 Vehicles | 2,540 (33.3%) | 1,884 (13.6%) |
| 3 or more Vehicles | 955 (12.5%) | 546 (3.9%) |
| Total | 7,624 (100.0%) | 13,850 (100.0%) |
Real Estate & Mortgages in Harrisburg
Real Estate and Mortgage Overview in Harrisburg
| Characteristic | Without Mortgage | With Mortgage |
| Housing Units | 2,972 | 4,652 |
| Median Property Value | $93,400 | $125,400 |
| Median Household Income | $57,391 | $785 |
| Monthly Housing Costs | $483 | $92 |
| Real Estate Taxes | $2,075 | $86 |
Property Value by Mortgage Status in Harrisburg
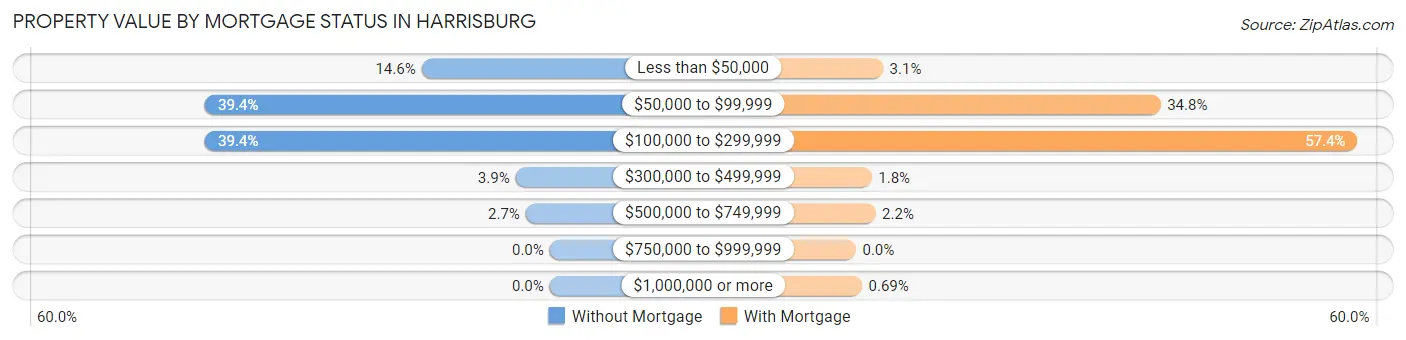
| Property Value | Without Mortgage | With Mortgage |
| Less than $50,000 | 435 (14.6%) | 144 (3.1%) |
| $50,000 to $99,999 | 1,170 (39.4%) | 1,620 (34.8%) |
| $100,000 to $299,999 | 1,170 (39.4%) | 2,668 (57.4%) |
| $300,000 to $499,999 | 116 (3.9%) | 84 (1.8%) |
| $500,000 to $749,999 | 81 (2.7%) | 104 (2.2%) |
| $750,000 to $999,999 | 0 (0.0%) | 0 (0.0%) |
| $1,000,000 or more | 0 (0.0%) | 32 (0.7%) |
| Total | 2,972 (100.0%) | 4,652 (100.0%) |
Household Income by Mortgage Status in Harrisburg
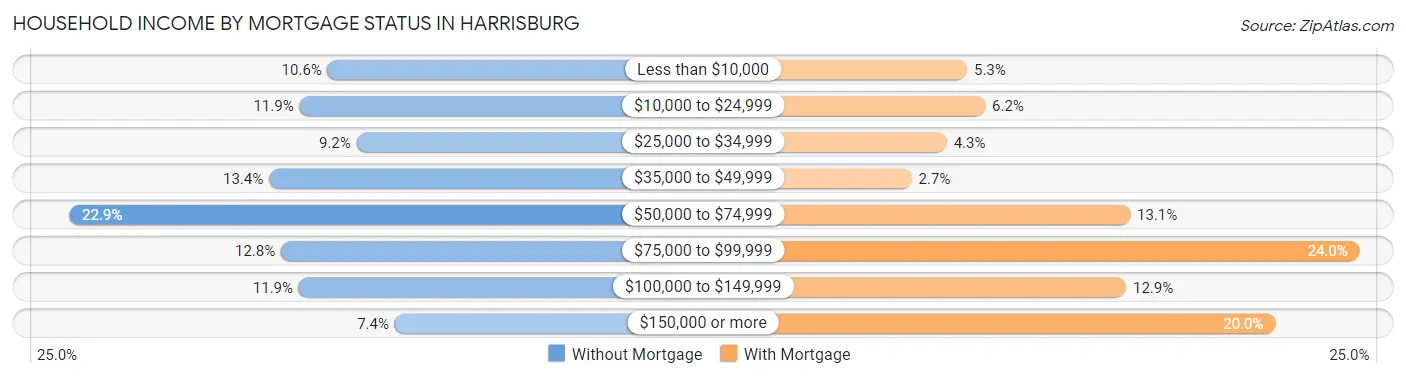
| Household Income | Without Mortgage | With Mortgage |
| Less than $10,000 | 314 (10.6%) | 247 (5.3%) |
| $10,000 to $24,999 | 354 (11.9%) | 287 (6.2%) |
| $25,000 to $34,999 | 273 (9.2%) | 202 (4.3%) |
| $35,000 to $49,999 | 397 (13.4%) | 124 (2.7%) |
| $50,000 to $74,999 | 680 (22.9%) | 608 (13.1%) |
| $75,000 to $99,999 | 380 (12.8%) | 1,117 (24.0%) |
| $100,000 to $149,999 | 355 (11.9%) | 599 (12.9%) |
| $150,000 or more | 219 (7.4%) | 930 (20.0%) |
| Total | 2,972 (100.0%) | 4,652 (100.0%) |
Property Value to Household Income Ratio in Harrisburg
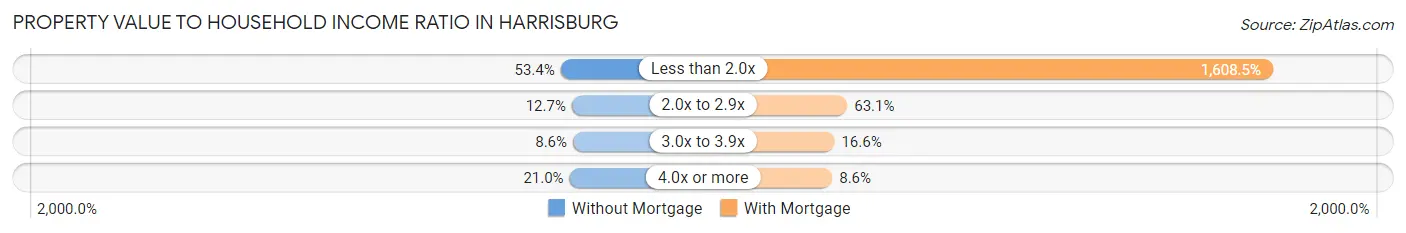
| Value-to-Income Ratio | Without Mortgage | With Mortgage |
| Less than 2.0x | 1,587 (53.4%) | 74,825 (1,608.4%) |
| 2.0x to 2.9x | 378 (12.7%) | 2,935 (63.1%) |
| 3.0x to 3.9x | 256 (8.6%) | 770 (16.6%) |
| 4.0x or more | 623 (21.0%) | 402 (8.6%) |
| Total | 2,972 (100.0%) | 4,652 (100.0%) |
Real Estate Taxes by Mortgage Status in Harrisburg
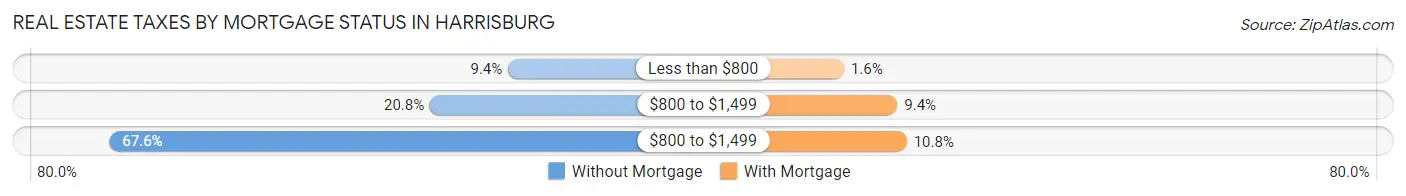
| Property Taxes | Without Mortgage | With Mortgage |
| Less than $800 | 278 (9.3%) | 74 (1.6%) |
| $800 to $1,499 | 617 (20.8%) | 437 (9.4%) |
| $800 to $1,499 | 2,009 (67.6%) | 501 (10.8%) |
| Total | 2,972 (100.0%) | 4,652 (100.0%) |
Health & Disability in Harrisburg
Health Insurance Coverage by Age in Harrisburg
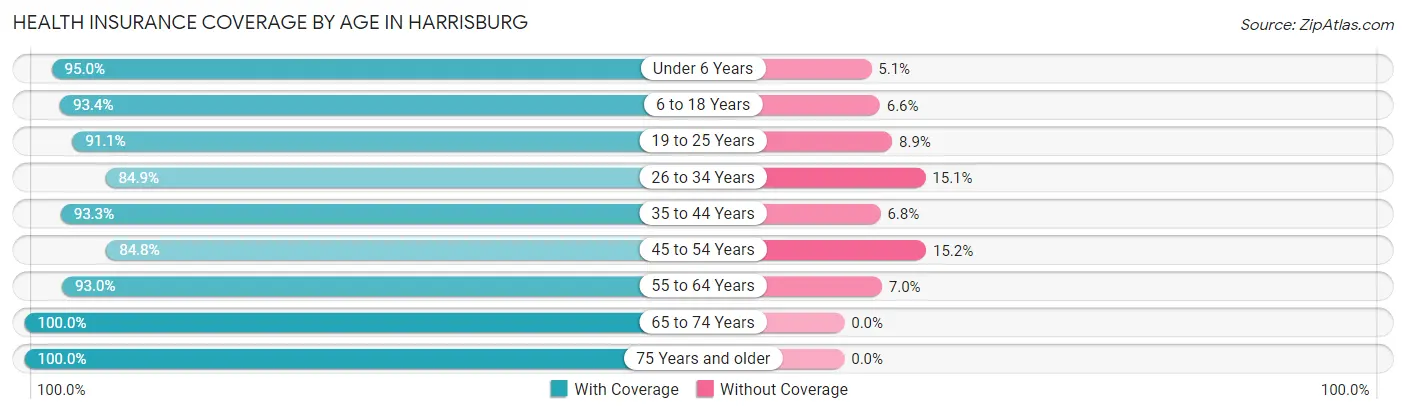
| Age Bracket | With Coverage | Without Coverage |
| Under 6 Years | 4,660 (95.0%) | 248 (5.1%) |
| 6 to 18 Years | 9,236 (93.4%) | 655 (6.6%) |
| 19 to 25 Years | 4,384 (91.1%) | 429 (8.9%) |
| 26 to 34 Years | 6,737 (84.9%) | 1,200 (15.1%) |
| 35 to 44 Years | 5,536 (93.2%) | 401 (6.8%) |
| 45 to 54 Years | 4,498 (84.8%) | 809 (15.2%) |
| 55 to 64 Years | 5,077 (93.0%) | 382 (7.0%) |
| 65 to 74 Years | 3,381 (100.0%) | 0 (0.0%) |
| 75 Years and older | 2,102 (100.0%) | 0 (0.0%) |
| Total | 45,611 (91.7%) | 4,124 (8.3%) |
Health Insurance Coverage by Citizenship Status in Harrisburg
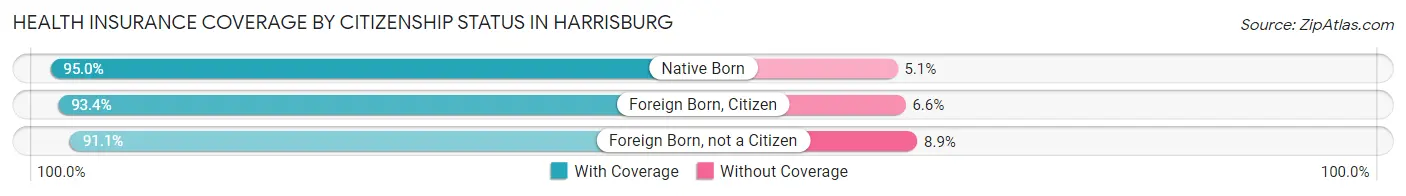
| Citizenship Status | With Coverage | Without Coverage |
| Native Born | 4,660 (95.0%) | 248 (5.1%) |
| Foreign Born, Citizen | 9,236 (93.4%) | 655 (6.6%) |
| Foreign Born, not a Citizen | 4,384 (91.1%) | 429 (8.9%) |
Health Insurance Coverage by Household Income in Harrisburg
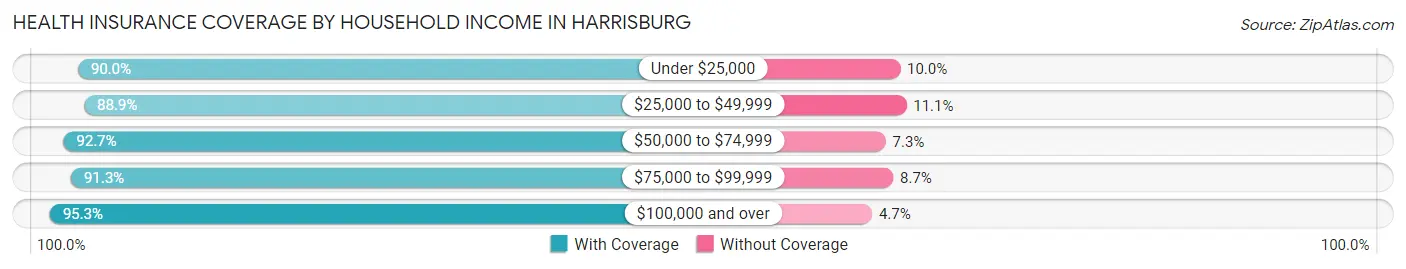
| Household Income | With Coverage | Without Coverage |
| Under $25,000 | 11,112 (90.0%) | 1,230 (10.0%) |
| $25,000 to $49,999 | 8,788 (88.9%) | 1,102 (11.1%) |
| $50,000 to $74,999 | 10,493 (92.7%) | 823 (7.3%) |
| $75,000 to $99,999 | 4,904 (91.3%) | 466 (8.7%) |
| $100,000 and over | 9,567 (95.3%) | 473 (4.7%) |
Public vs Private Health Insurance Coverage by Age in Harrisburg
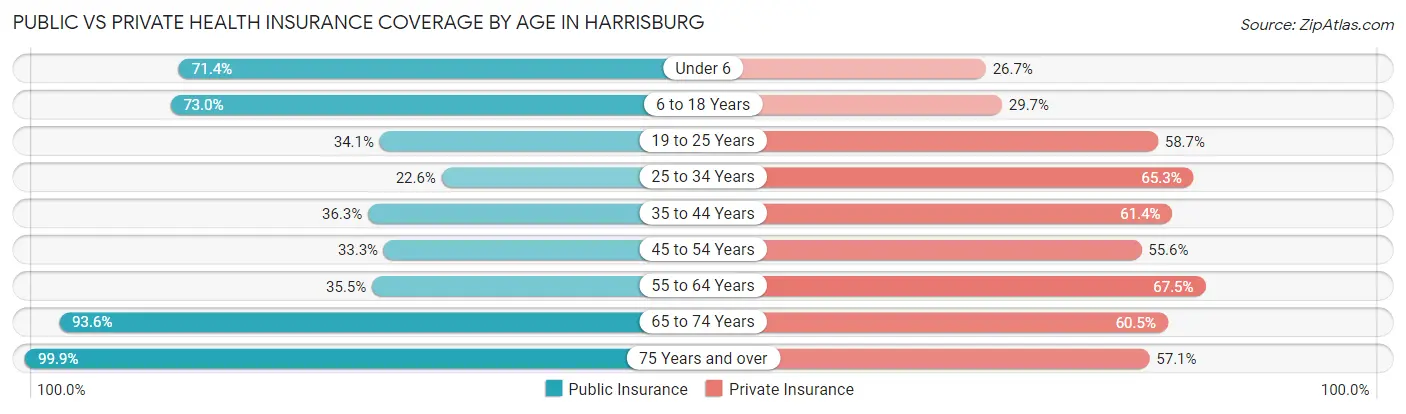
| Age Bracket | Public Insurance | Private Insurance |
| Under 6 | 3,502 (71.4%) | 1,311 (26.7%) |
| 6 to 18 Years | 7,216 (73.0%) | 2,939 (29.7%) |
| 19 to 25 Years | 1,640 (34.1%) | 2,823 (58.7%) |
| 25 to 34 Years | 1,792 (22.6%) | 5,182 (65.3%) |
| 35 to 44 Years | 2,152 (36.2%) | 3,643 (61.4%) |
| 45 to 54 Years | 1,767 (33.3%) | 2,950 (55.6%) |
| 55 to 64 Years | 1,938 (35.5%) | 3,684 (67.5%) |
| 65 to 74 Years | 3,165 (93.6%) | 2,045 (60.5%) |
| 75 Years and over | 2,100 (99.9%) | 1,200 (57.1%) |
| Total | 25,272 (50.8%) | 25,777 (51.8%) |
Disability Status by Sex by Age in Harrisburg
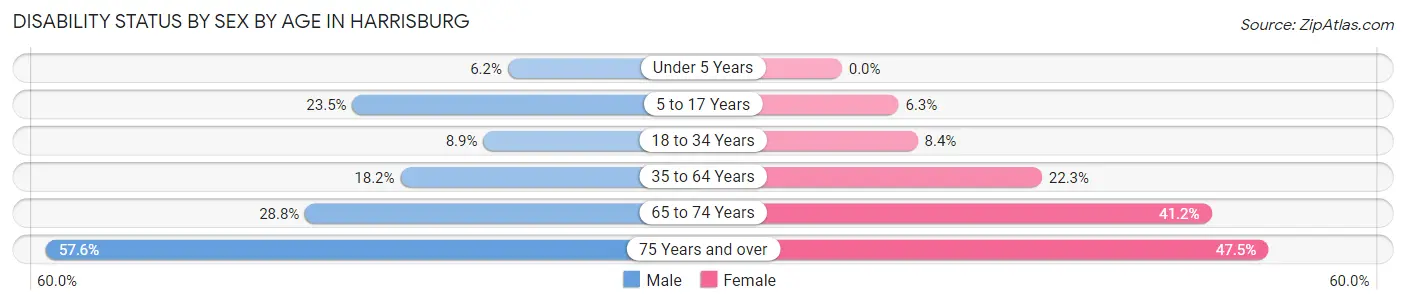
| Age Bracket | Male | Female |
| Under 5 Years | 110 (6.2%) | 0 (0.0%) |
| 5 to 17 Years | 1,191 (23.5%) | 316 (6.3%) |
| 18 to 34 Years | 620 (8.9%) | 537 (8.4%) |
| 35 to 64 Years | 1,403 (18.1%) | 1,999 (22.3%) |
| 65 to 74 Years | 441 (28.7%) | 760 (41.1%) |
| 75 Years and over | 472 (57.6%) | 609 (47.5%) |
Disability Class by Sex by Age in Harrisburg
Disability Class: Hearing Difficulty
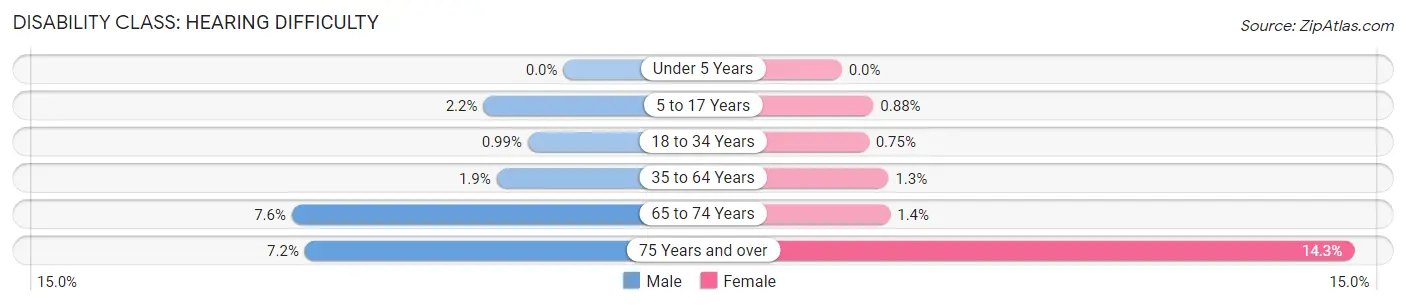
| Age Bracket | Male | Female |
| Under 5 Years | 0 (0.0%) | 0 (0.0%) |
| 5 to 17 Years | 113 (2.2%) | 44 (0.9%) |
| 18 to 34 Years | 69 (1.0%) | 48 (0.7%) |
| 35 to 64 Years | 144 (1.9%) | 117 (1.3%) |
| 65 to 74 Years | 116 (7.6%) | 25 (1.3%) |
| 75 Years and over | 59 (7.2%) | 183 (14.3%) |
Disability Class: Vision Difficulty
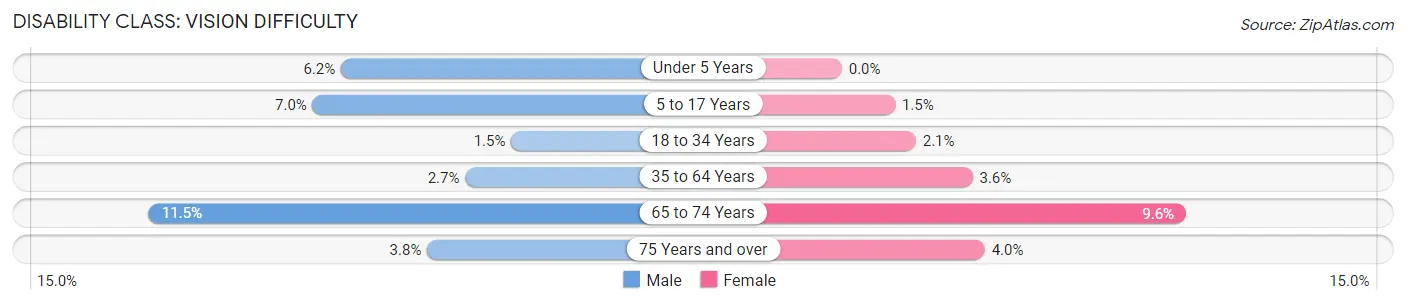
| Age Bracket | Male | Female |
| Under 5 Years | 110 (6.2%) | 0 (0.0%) |
| 5 to 17 Years | 354 (7.0%) | 74 (1.5%) |
| 18 to 34 Years | 101 (1.5%) | 131 (2.1%) |
| 35 to 64 Years | 211 (2.7%) | 327 (3.6%) |
| 65 to 74 Years | 177 (11.5%) | 177 (9.6%) |
| 75 Years and over | 31 (3.8%) | 51 (4.0%) |
Disability Class: Cognitive Difficulty
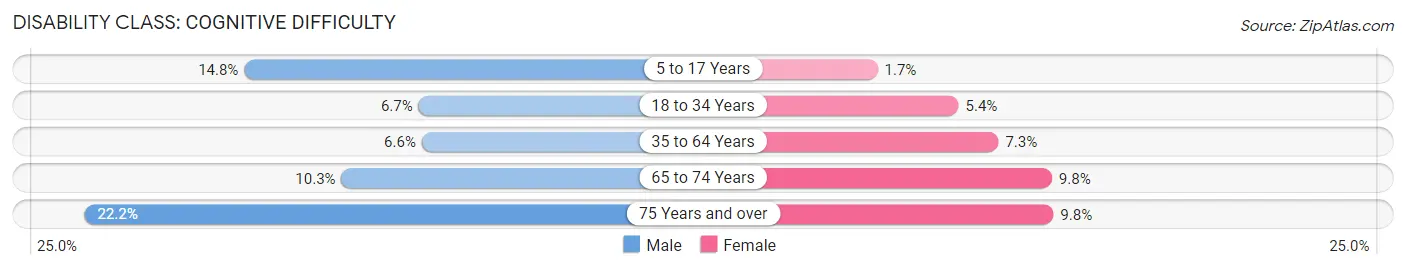
| Age Bracket | Male | Female |
| 5 to 17 Years | 751 (14.8%) | 83 (1.7%) |
| 18 to 34 Years | 467 (6.7%) | 345 (5.4%) |
| 35 to 64 Years | 508 (6.6%) | 652 (7.3%) |
| 65 to 74 Years | 158 (10.3%) | 180 (9.8%) |
| 75 Years and over | 182 (22.2%) | 126 (9.8%) |
Disability Class: Ambulatory Difficulty
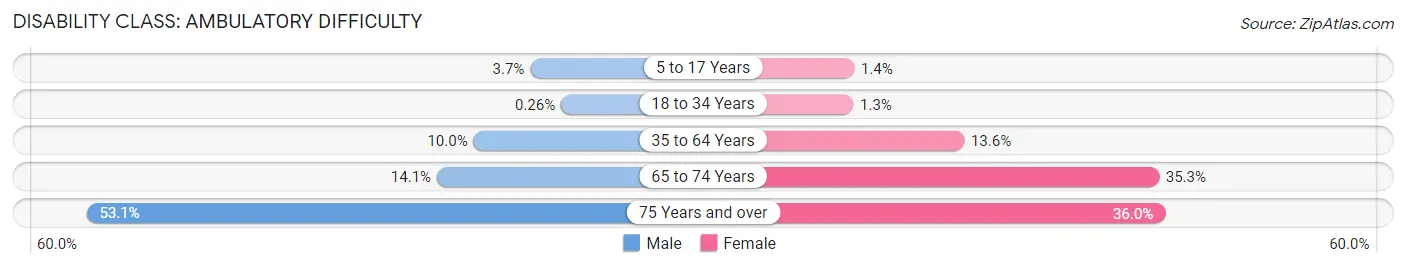
| Age Bracket | Male | Female |
| 5 to 17 Years | 187 (3.7%) | 68 (1.4%) |
| 18 to 34 Years | 18 (0.3%) | 80 (1.3%) |
| 35 to 64 Years | 774 (10.0%) | 1,221 (13.6%) |
| 65 to 74 Years | 216 (14.1%) | 652 (35.3%) |
| 75 Years and over | 435 (53.1%) | 462 (36.0%) |
Disability Class: Self-Care Difficulty
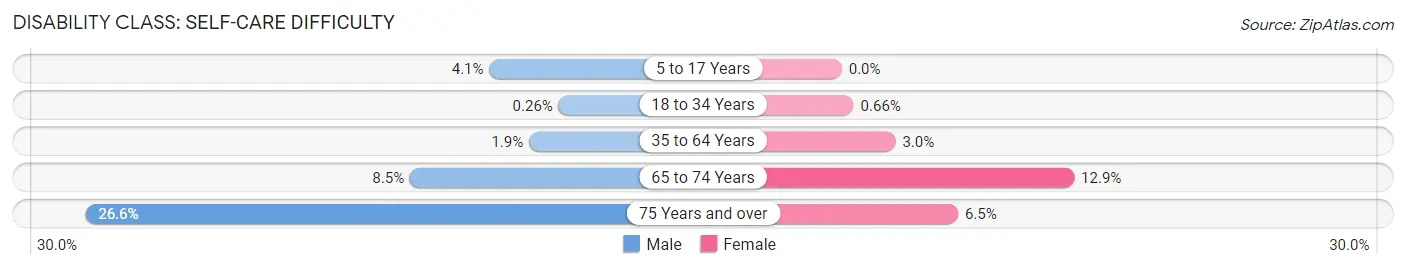
| Age Bracket | Male | Female |
| 5 to 17 Years | 209 (4.1%) | 0 (0.0%) |
| 18 to 34 Years | 18 (0.3%) | 42 (0.7%) |
| 35 to 64 Years | 148 (1.9%) | 268 (3.0%) |
| 65 to 74 Years | 131 (8.5%) | 239 (12.9%) |
| 75 Years and over | 218 (26.6%) | 83 (6.5%) |
Technology Access in Harrisburg
Computing Device Access in Harrisburg
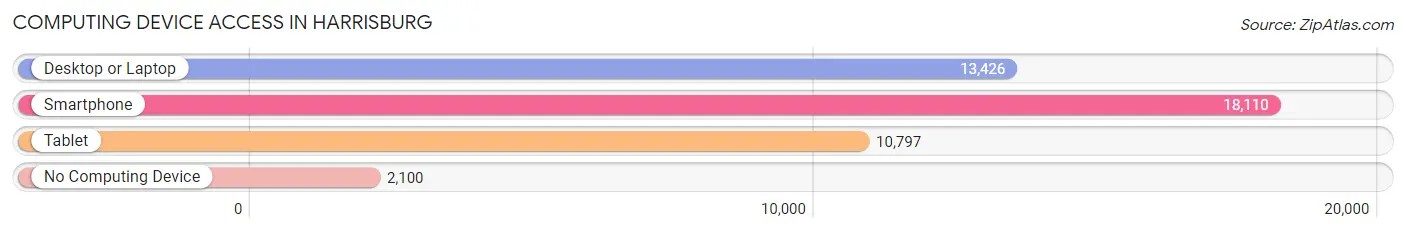
| Device Type | # Households | % Households |
| Desktop or Laptop | 13,426 | 62.5% |
| Smartphone | 18,110 | 84.3% |
| Tablet | 10,797 | 50.3% |
| No Computing Device | 2,100 | 9.8% |
| Total | 21,474 | 100.0% |
Internet Access in Harrisburg
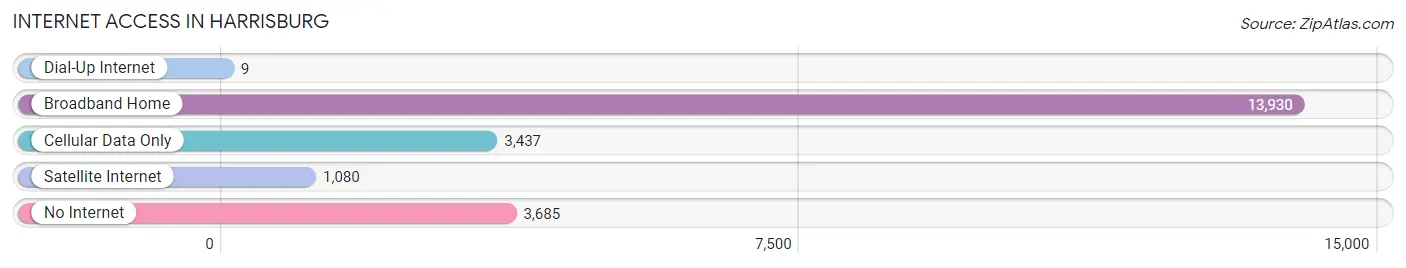
| Internet Type | # Households | % Households |
| Dial-Up Internet | 9 | 0.0% |
| Broadband Home | 13,930 | 64.9% |
| Cellular Data Only | 3,437 | 16.0% |
| Satellite Internet | 1,080 | 5.0% |
| No Internet | 3,685 | 17.2% |
| Total | 21,474 | 100.0% |
Harrisburg Summary
Harrisburg, Pennsylvania is the capital of the Commonwealth of Pennsylvania and the county seat of Dauphin County. It is located on the Susquehanna River, approximately 105 miles west of Philadelphia and 165 miles east of Pittsburgh. The city has a population of approximately 49,000 people, making it the ninth-largest city in the state.
History
The area that is now Harrisburg was first settled by Native Americans in the late 17th century. The first European settlers arrived in the area in 1719, and the town was officially founded in 1785. The city was named after John Harris, Sr., an early settler and prominent local politician.
In the 19th century, Harrisburg became an important transportation hub, with the Pennsylvania Canal and the Pennsylvania Railroad both running through the city. The city also became a major industrial center, with several steel mills and other factories located in the area.
In the 20th century, Harrisburg experienced a period of decline, as the steel industry declined and the city’s population decreased. However, in recent years, the city has seen a resurgence, with new businesses and development projects revitalizing the downtown area.
Geography
Harrisburg is located in south-central Pennsylvania, on the east bank of the Susquehanna River. The city is situated in a valley, surrounded by hills and mountains. The Appalachian Mountains are located to the west, and the Susquehanna River forms the city’s eastern border.
The city has a total area of 10.3 square miles, of which 9.9 square miles is land and 0.4 square miles is water. The climate in Harrisburg is humid continental, with hot, humid summers and cold, snowy winters.
Economy
Harrisburg’s economy is largely based on government and public services. The city is home to the Pennsylvania State Capitol, as well as several state government offices and agencies. The city is also home to several hospitals, universities, and other educational institutions.
In addition to government and public services, Harrisburg’s economy is also supported by manufacturing, healthcare, and tourism. The city is home to several large manufacturing companies, including Hershey Foods, Armstrong World Industries, and Tyco Electronics. The city is also home to several hospitals, including Penn State Milton S. Hershey Medical Center and PinnacleHealth System.
Demographics
As of the 2010 census, Harrisburg had a population of 49,528 people. The racial makeup of the city was 57.2% White, 33.3% African American, 0.3% Native American, 2.2% Asian, 0.1% Pacific Islander, 4.2% from other races, and 2.7% from two or more races. Hispanic or Latino of any race were 8.2% of the population.
The median income for a household in Harrisburg was $30,845, and the median income for a family was $37,813. The per capita income for the city was $17,837. About 22.2% of the population was below the poverty line.
Harrisburg is a diverse city, with a variety of cultures and backgrounds represented. The city is home to a large African American population, as well as a growing Hispanic population. The city also has a large population of immigrants from Asia, the Middle East, and other parts of the world.
Common Questions
What is Per Capita Income in Harrisburg?
Per Capita income in Harrisburg is $26,237.
What is the Median Family Income in Harrisburg?
Median Family Income in Harrisburg is $50,874.
What is the Median Household income in Harrisburg?
Median Household Income in Harrisburg is $46,654.
What is Income or Wage Gap in Harrisburg?
Income or Wage Gap in Harrisburg is 24.0%.
Women in Harrisburg earn 76.0 cents for every dollar earned by a man.
What is Family Income Deficit in Harrisburg?
Family Income Deficit in Harrisburg is $12,571.
Families that are below poverty line in Harrisburg earn $12,571 less on average than the poverty threshold level.
What is Inequality or Gini Index in Harrisburg?
Inequality or Gini Index in Harrisburg is 0.47.
What is the Total Population of Harrisburg?
Total Population of Harrisburg is 50,055.
What is the Total Male Population of Harrisburg?
Total Male Population of Harrisburg is 24,085.
What is the Total Female Population of Harrisburg?
Total Female Population of Harrisburg is 25,970.
What is the Ratio of Males per 100 Females in Harrisburg?
There are 92.74 Males per 100 Females in Harrisburg.
What is the Ratio of Females per 100 Males in Harrisburg?
There are 107.83 Females per 100 Males in Harrisburg.
What is the Median Population Age in Harrisburg?
Median Population Age in Harrisburg is 31.9 Years.
What is the Average Family Size in Harrisburg
Average Family Size in Harrisburg is 3.2 People.
What is the Average Household Size in Harrisburg
Average Household Size in Harrisburg is 2.3 People.
How Large is the Labor Force in Harrisburg?
There are 24,937 People in the Labor Forcein in Harrisburg.
What is the Percentage of People in the Labor Force in Harrisburg?
67.7% of People are in the Labor Force in Harrisburg.
What is the Unemployment Rate in Harrisburg?
Unemployment Rate in Harrisburg is 9.0%.