York, PA Map & Demographics
York Map
York Overview
$23,681
PER CAPITA INCOME
$48,500
AVG FAMILY INCOME
$42,351
AVG HOUSEHOLD INCOME
13.3%
WAGE / INCOME GAP [ % ]
86.7¢/ $1
WAGE / INCOME GAP [ $ ]
$12,181
FAMILY INCOME DEFICIT
0.45
INEQUALITY / GINI INDEX
44,782
TOTAL POPULATION
22,444
MALE POPULATION
22,338
FEMALE POPULATION
100.47
MALES / 100 FEMALES
99.53
FEMALES / 100 MALES
34.3
MEDIAN AGE
3.3
AVG FAMILY SIZE
2.5
AVG HOUSEHOLD SIZE
22,726
LABOR FORCE [ PEOPLE ]
64.5%
PERCENT IN LABOR FORCE
12.0%
UNEMPLOYMENT RATE
York Area Codes
Income in York
Income Overview in York
Per Capita Income in York is $23,681, while median incomes of families and households are $48,500 and $42,351 respectively.
| Characteristic | Number | Measure |
| Per Capita Income | 44,782 | $23,681 |
| Median Family Income | 9,710 | $48,500 |
| Mean Family Income | 9,710 | $61,153 |
| Median Household Income | 17,751 | $42,351 |
| Mean Household Income | 17,751 | $57,092 |
| Income Deficit | 9,710 | $12,181 |
| Wage / Income Gap (%) | 44,782 | 13.26% |
| Wage / Income Gap ($) | 44,782 | 86.74¢ per $1 |
| Gini / Inequality Index | 44,782 | 0.45 |
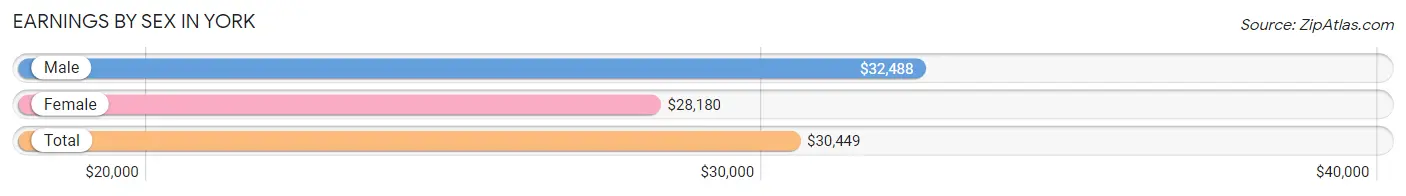
Earnings by Sex in York
Average Earnings in York are $30,449, $32,488 for men and $28,180 for women, a difference of 13.3%.
| Sex | Number | Average Earnings |
| Male | 10,889 (48.0%) | $32,488 |
| Female | 11,772 (51.9%) | $28,180 |
| Total | 22,661 (100.0%) | $30,449 |
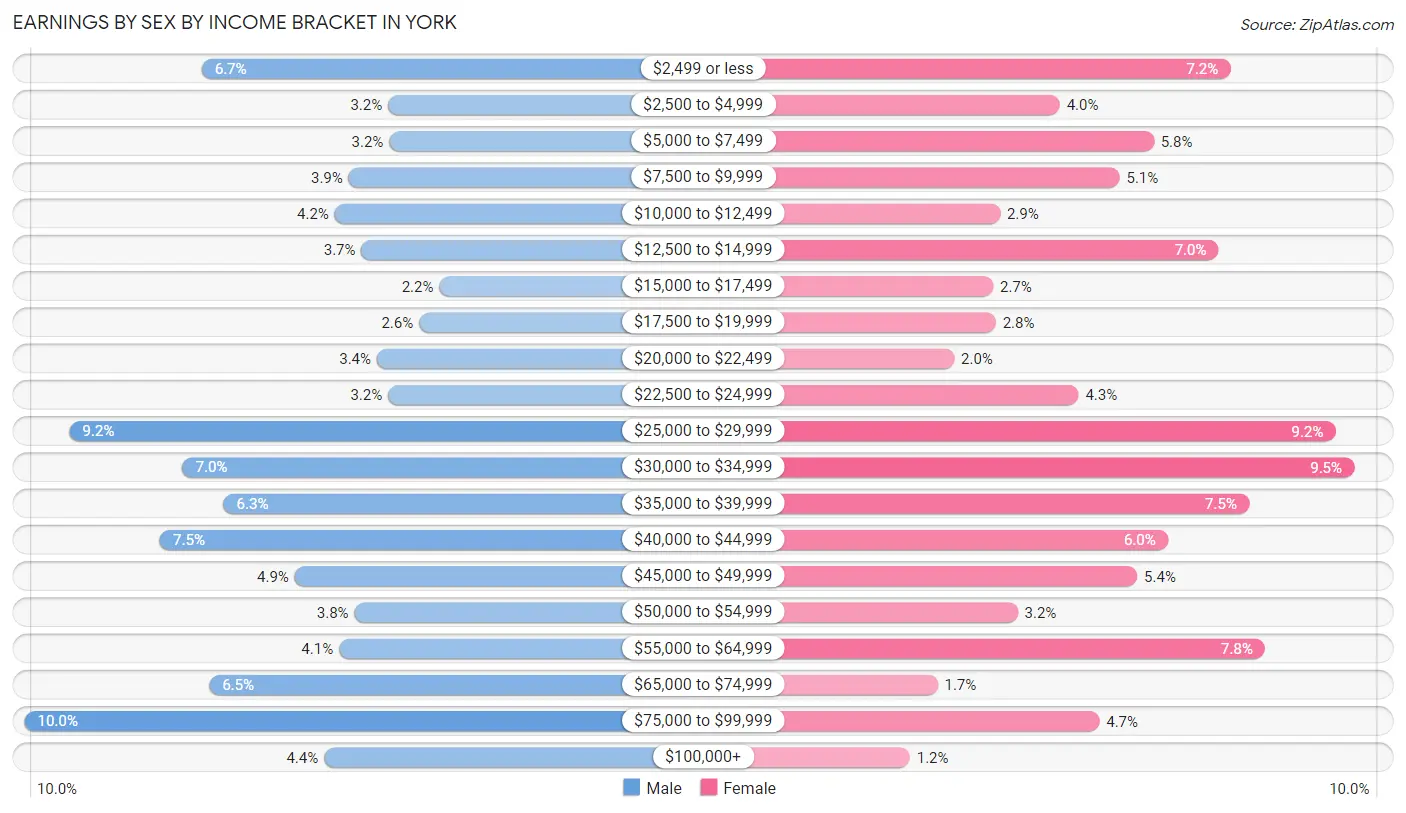
Earnings by Sex by Income Bracket in York
The most common earnings brackets in York are $75,000 to $99,999 for men (1,089 | 10.0%) and $30,000 to $34,999 for women (1,118 | 9.5%).
| Income | Male | Female |
| $2,499 or less | 727 (6.7%) | 845 (7.2%) |
| $2,500 to $4,999 | 347 (3.2%) | 470 (4.0%) |
| $5,000 to $7,499 | 345 (3.2%) | 677 (5.8%) |
| $7,500 to $9,999 | 428 (3.9%) | 601 (5.1%) |
| $10,000 to $12,499 | 456 (4.2%) | 338 (2.9%) |
| $12,500 to $14,999 | 402 (3.7%) | 819 (7.0%) |
| $15,000 to $17,499 | 243 (2.2%) | 322 (2.7%) |
| $17,500 to $19,999 | 284 (2.6%) | 329 (2.8%) |
| $20,000 to $22,499 | 370 (3.4%) | 237 (2.0%) |
| $22,500 to $24,999 | 347 (3.2%) | 511 (4.3%) |
| $25,000 to $29,999 | 997 (9.2%) | 1,077 (9.1%) |
| $30,000 to $34,999 | 767 (7.0%) | 1,118 (9.5%) |
| $35,000 to $39,999 | 683 (6.3%) | 886 (7.5%) |
| $40,000 to $44,999 | 812 (7.5%) | 707 (6.0%) |
| $45,000 to $49,999 | 538 (4.9%) | 640 (5.4%) |
| $50,000 to $54,999 | 416 (3.8%) | 377 (3.2%) |
| $55,000 to $64,999 | 448 (4.1%) | 922 (7.8%) |
| $65,000 to $74,999 | 712 (6.5%) | 200 (1.7%) |
| $75,000 to $99,999 | 1,089 (10.0%) | 557 (4.7%) |
| $100,000+ | 478 (4.4%) | 139 (1.2%) |
| Total | 10,889 (100.0%) | 11,772 (100.0%) |
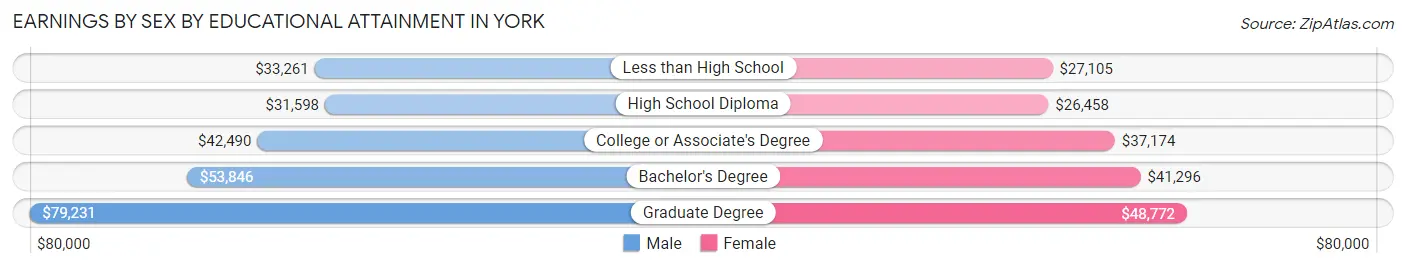
Earnings by Sex by Educational Attainment in York
Average earnings in York are $38,082 for men and $32,653 for women, a difference of 14.3%. Men with an educational attainment of graduate degree enjoy the highest average annual earnings of $79,231, while those with high school diploma education earn the least with $31,598. Women with an educational attainment of graduate degree earn the most with the average annual earnings of $48,772, while those with high school diploma education have the smallest earnings of $26,458.
| Educational Attainment | Male Income | Female Income |
| Less than High School | $33,261 | $27,105 |
| High School Diploma | $31,598 | $26,458 |
| College or Associate's Degree | $42,490 | $37,174 |
| Bachelor's Degree | $53,846 | $41,296 |
| Graduate Degree | $79,231 | $48,772 |
| Total | $38,082 | $32,653 |
Family Income in York
Family Income Brackets in York
According to the York family income data, there are 1,806 families falling into the $35,000 to $49,999 income range, which is the most common income bracket and makes up 18.6% of all families. Conversely, the $200,000+ income bracket is the least frequent group with only 175 families (1.8%) belonging to this category.
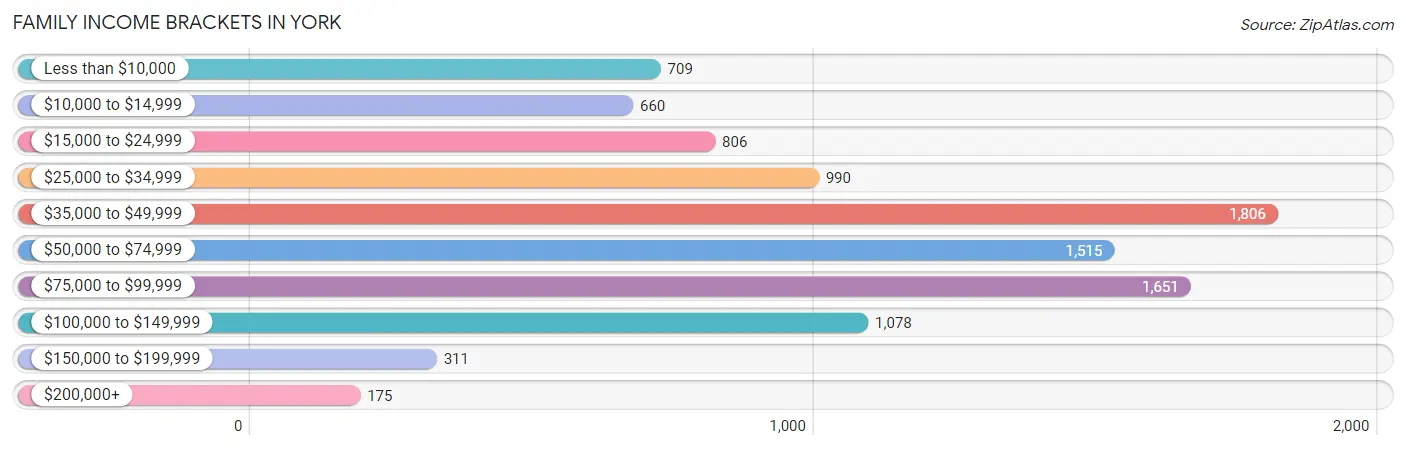
| Income Bracket | # Families | % Families |
| Less than $10,000 | 709 | 7.3% |
| $10,000 to $14,999 | 660 | 6.8% |
| $15,000 to $24,999 | 806 | 8.3% |
| $25,000 to $34,999 | 990 | 10.2% |
| $35,000 to $49,999 | 1,806 | 18.6% |
| $50,000 to $74,999 | 1,515 | 15.6% |
| $75,000 to $99,999 | 1,651 | 17.0% |
| $100,000 to $149,999 | 1,078 | 11.1% |
| $150,000 to $199,999 | 311 | 3.2% |
| $200,000+ | 175 | 1.8% |
Family Income by Famaliy Size in York
7+ person families (290 | 3.0%) account for the highest median family income in York with $100,938 per family, while 2-person families (4,298 | 44.3%) have the highest median income of $22,259 per family member.
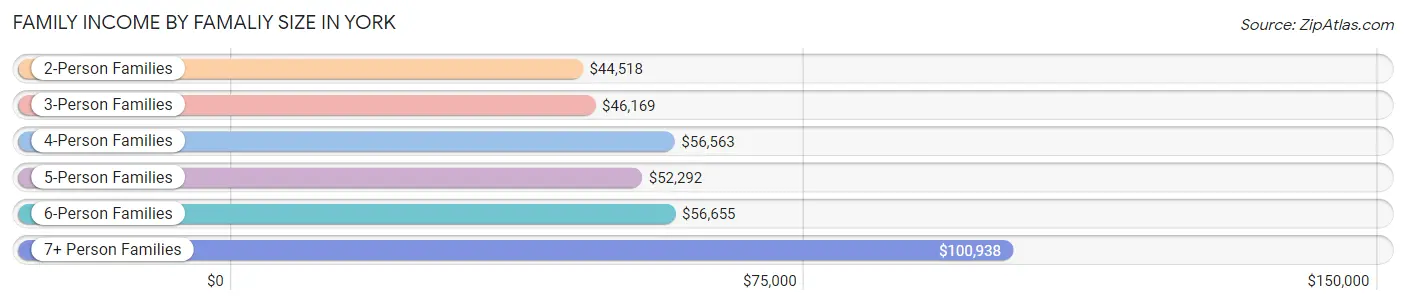
| Income Bracket | # Families | Median Income |
| 2-Person Families | 4,298 (44.3%) | $44,518 |
| 3-Person Families | 2,410 (24.8%) | $46,169 |
| 4-Person Families | 1,459 (15.0%) | $56,563 |
| 5-Person Families | 954 (9.8%) | $52,292 |
| 6-Person Families | 299 (3.1%) | $56,655 |
| 7+ Person Families | 290 (3.0%) | $100,938 |
| Total | 9,710 (100.0%) | $48,500 |
Family Income by Number of Earners in York
The median family income in York is $48,500, with families comprising 3+ earners (852) having the highest median family income of $101,304, while families with no earners (1,242) have the lowest median family income of $23,770, accounting for 8.8% and 12.8% of families, respectively.
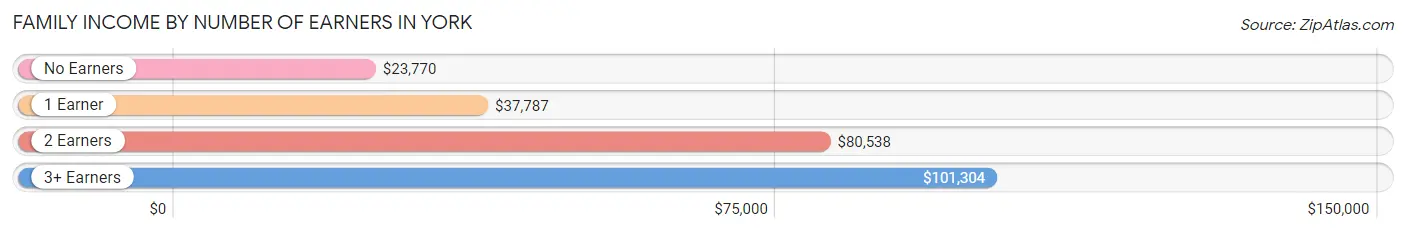
| Number of Earners | # Families | Median Income |
| No Earners | 1,242 (12.8%) | $23,770 |
| 1 Earner | 4,110 (42.3%) | $37,787 |
| 2 Earners | 3,506 (36.1%) | $80,538 |
| 3+ Earners | 852 (8.8%) | $101,304 |
| Total | 9,710 (100.0%) | $48,500 |
Household Income in York
Household Income Brackets in York
With 2,769 households falling in the category, the $35,000 to $49,999 income range is the most frequent in York, accounting for 15.6% of all households. In contrast, only 302 households (1.7%) fall into the $200,000+ income bracket, making it the least populous group.
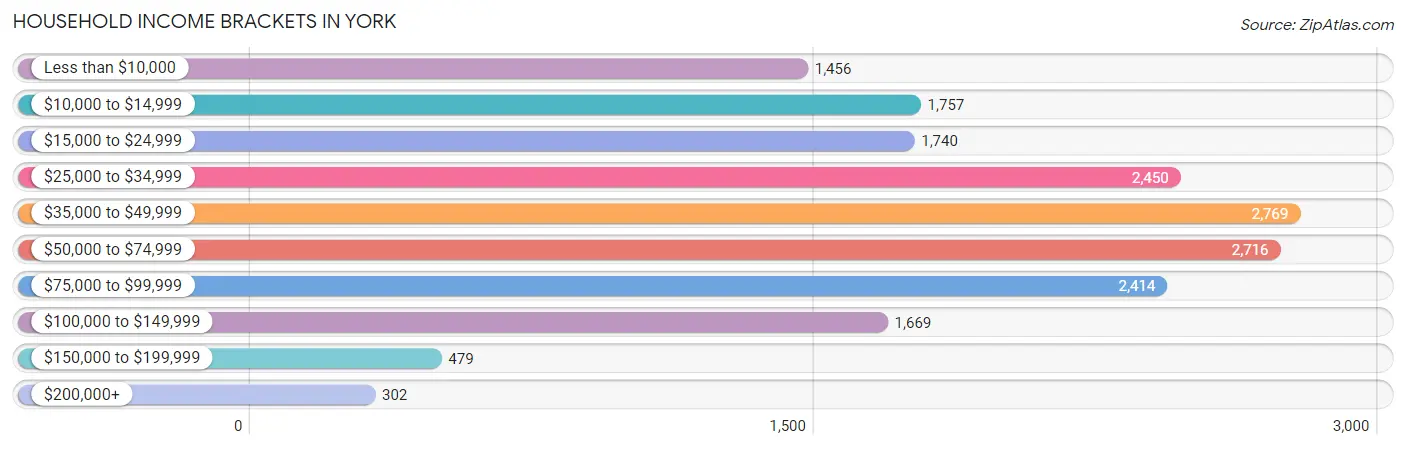
| Income Bracket | # Households | % Households |
| Less than $10,000 | 1,456 | 8.2% |
| $10,000 to $14,999 | 1,757 | 9.9% |
| $15,000 to $24,999 | 1,740 | 9.8% |
| $25,000 to $34,999 | 2,450 | 13.8% |
| $35,000 to $49,999 | 2,769 | 15.6% |
| $50,000 to $74,999 | 2,716 | 15.3% |
| $75,000 to $99,999 | 2,414 | 13.6% |
| $100,000 to $149,999 | 1,669 | 9.4% |
| $150,000 to $199,999 | 479 | 2.7% |
| $200,000+ | 302 | 1.7% |
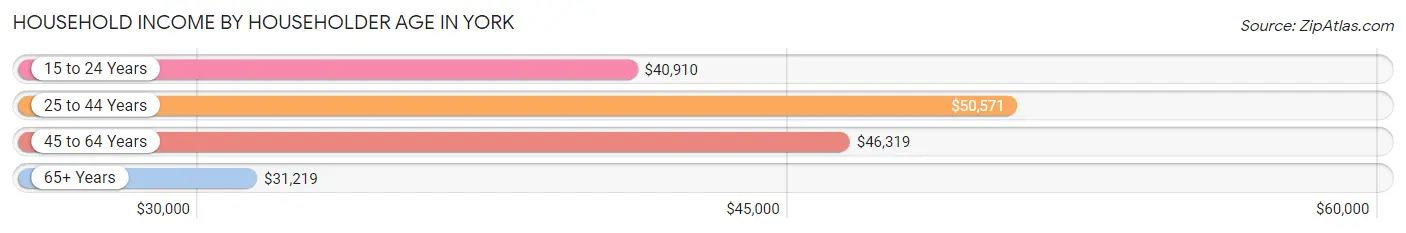
Household Income by Householder Age in York
The median household income in York is $42,351, with the highest median household income of $50,571 found in the 25 to 44 years age bracket for the primary householder. A total of 5,860 households (33.0%) fall into this category. Meanwhile, the 65+ years age bracket for the primary householder has the lowest median household income of $31,219, with 3,961 households (22.3%) in this group.
| Income Bracket | # Households | Median Income |
| 15 to 24 Years | 1,233 (7.0%) | $40,910 |
| 25 to 44 Years | 5,860 (33.0%) | $50,571 |
| 45 to 64 Years | 6,697 (37.7%) | $46,319 |
| 65+ Years | 3,961 (22.3%) | $31,219 |
| Total | 17,751 (100.0%) | $42,351 |
Poverty in York
Income Below Poverty by Sex and Age in York
With 22.6% poverty level for males and 26.5% for females among the residents of York, under 5 year old males and 5 year old females are the most vulnerable to poverty, with 735 males (45.1%) and 105 females (64.4%) in their respective age groups living below the poverty level.
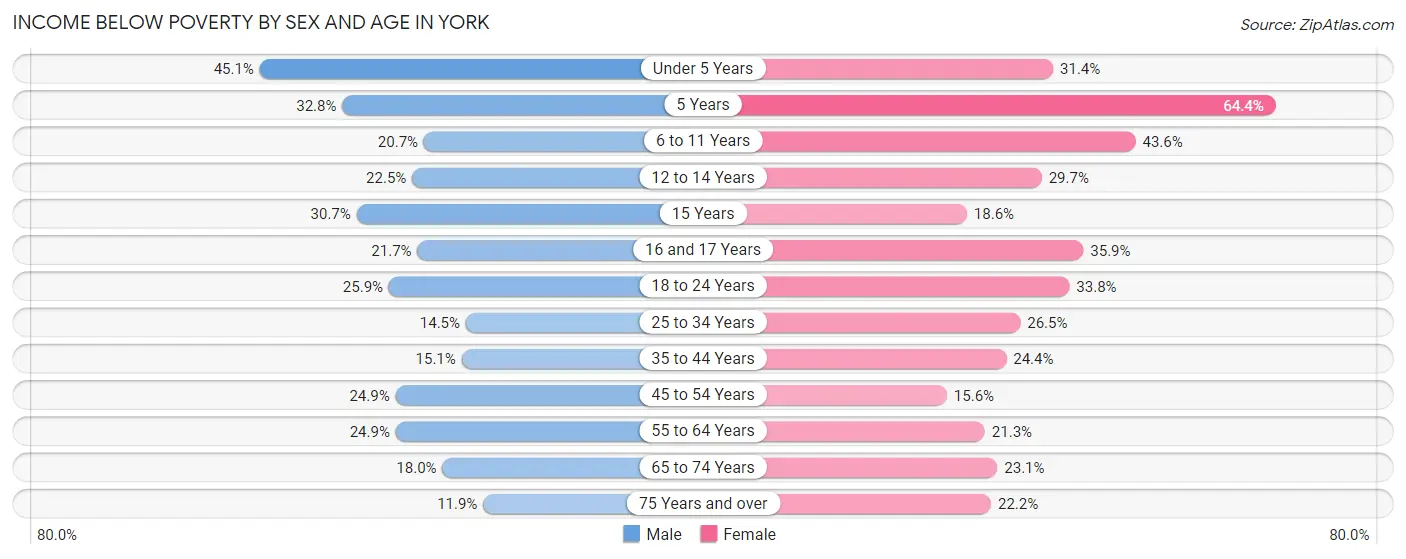
| Age Bracket | Male | Female |
| Under 5 Years | 735 (45.1%) | 321 (31.4%) |
| 5 Years | 87 (32.8%) | 105 (64.4%) |
| 6 to 11 Years | 401 (20.7%) | 793 (43.6%) |
| 12 to 14 Years | 262 (22.5%) | 231 (29.7%) |
| 15 Years | 136 (30.7%) | 47 (18.6%) |
| 16 and 17 Years | 135 (21.7%) | 118 (35.9%) |
| 18 to 24 Years | 622 (25.9%) | 863 (33.8%) |
| 25 to 34 Years | 480 (14.5%) | 874 (26.5%) |
| 35 to 44 Years | 364 (15.1%) | 696 (24.4%) |
| 45 to 54 Years | 767 (24.9%) | 451 (15.6%) |
| 55 to 64 Years | 584 (24.9%) | 598 (21.2%) |
| 65 to 74 Years | 316 (18.0%) | 429 (23.1%) |
| 75 Years and over | 72 (11.9%) | 275 (22.2%) |
| Total | 4,961 (22.6%) | 5,801 (26.5%) |
Income Above Poverty by Sex and Age in York
According to the poverty statistics in York, males aged 75 years and over and females aged 45 to 54 years are the age groups that are most secure financially, with 88.1% of males and 84.4% of females in these age groups living above the poverty line.
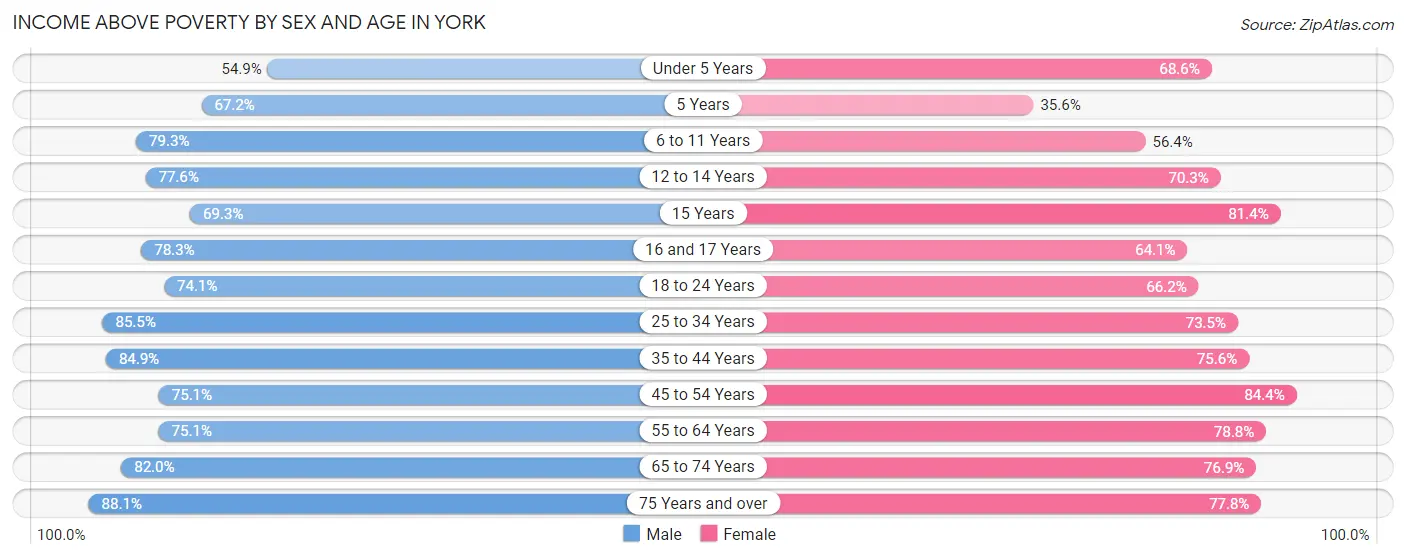
| Age Bracket | Male | Female |
| Under 5 Years | 895 (54.9%) | 702 (68.6%) |
| 5 Years | 178 (67.2%) | 58 (35.6%) |
| 6 to 11 Years | 1,535 (79.3%) | 1,025 (56.4%) |
| 12 to 14 Years | 905 (77.5%) | 547 (70.3%) |
| 15 Years | 307 (69.3%) | 206 (81.4%) |
| 16 and 17 Years | 488 (78.3%) | 211 (64.1%) |
| 18 to 24 Years | 1,780 (74.1%) | 1,690 (66.2%) |
| 25 to 34 Years | 2,835 (85.5%) | 2,423 (73.5%) |
| 35 to 44 Years | 2,045 (84.9%) | 2,153 (75.6%) |
| 45 to 54 Years | 2,310 (75.1%) | 2,439 (84.4%) |
| 55 to 64 Years | 1,762 (75.1%) | 2,216 (78.7%) |
| 65 to 74 Years | 1,443 (82.0%) | 1,428 (76.9%) |
| 75 Years and over | 533 (88.1%) | 966 (77.8%) |
| Total | 17,016 (77.4%) | 16,064 (73.5%) |
Income Below Poverty Among Married-Couple Families in York
The poverty statistics for married-couple families in York show that 10.1% or 453 of the total 4,495 families live below the poverty line. Families with 5 or more children have the highest poverty rate of 26.7%, comprising of 4 families. On the other hand, families with no children have the lowest poverty rate of 9.2%, which includes 231 families.
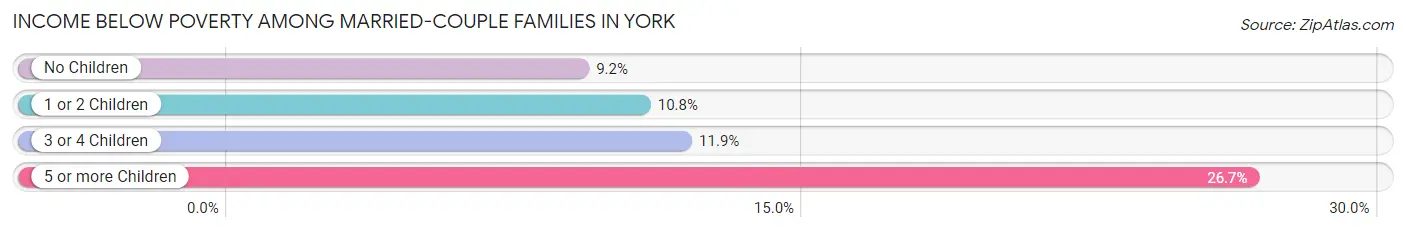
| Children | Above Poverty | Below Poverty |
| No Children | 2,288 (90.8%) | 231 (9.2%) |
| 1 or 2 Children | 1,208 (89.2%) | 146 (10.8%) |
| 3 or 4 Children | 535 (88.1%) | 72 (11.9%) |
| 5 or more Children | 11 (73.3%) | 4 (26.7%) |
| Total | 4,042 (89.9%) | 453 (10.1%) |
Income Below Poverty Among Single-Parent Households in York
According to the poverty data in York, 14.0% or 166 single-father households and 33.7% or 1,357 single-mother households are living below the poverty line. Among single-father households, those with 3 or 4 children have the highest poverty rate, with 26 households (34.2%) experiencing poverty. Likewise, among single-mother households, those with 3 or 4 children have the highest poverty rate, with 278 households (63.5%) falling below the poverty line.
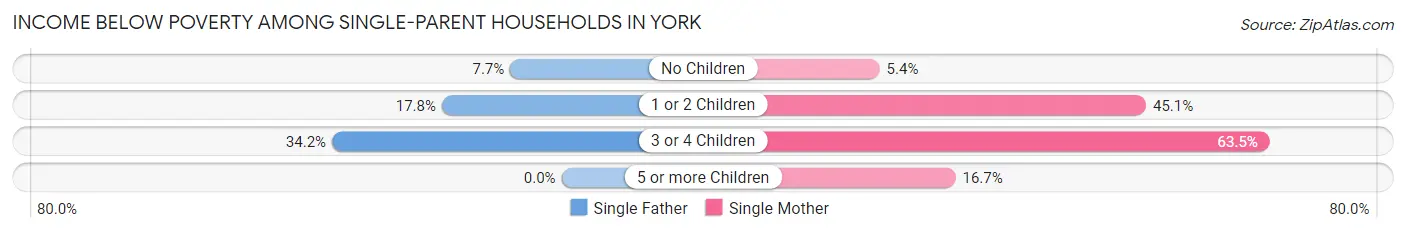
| Children | Single Father | Single Mother |
| No Children | 44 (7.6%) | 70 (5.4%) |
| 1 or 2 Children | 96 (17.8%) | 998 (45.1%) |
| 3 or 4 Children | 26 (34.2%) | 278 (63.5%) |
| 5 or more Children | 0 (0.0%) | 11 (16.7%) |
| Total | 166 (14.0%) | 1,357 (33.7%) |
Income Below Poverty Among Married-Couple vs Single-Parent Households in York
The poverty data for York shows that 453 of the married-couple family households (10.1%) and 1,523 of the single-parent households (29.2%) are living below the poverty level. Within the married-couple family households, those with 5 or more children have the highest poverty rate, with 4 households (26.7%) falling below the poverty line. Among the single-parent households, those with 3 or 4 children have the highest poverty rate, with 304 household (59.1%) living below poverty.
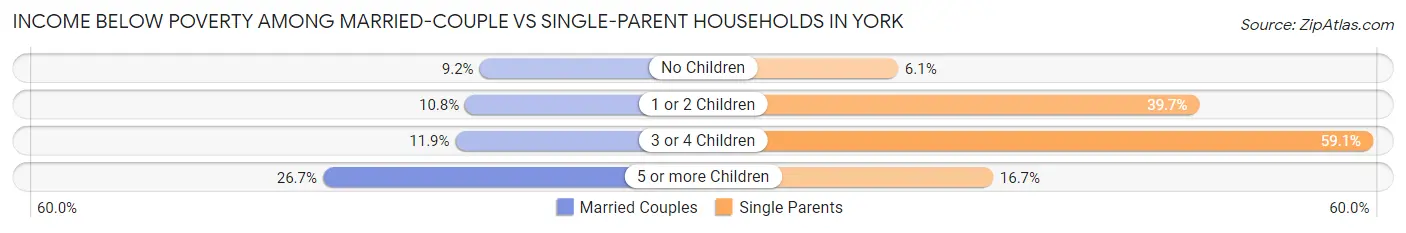
| Children | Married-Couple Families | Single-Parent Households |
| No Children | 231 (9.2%) | 114 (6.1%) |
| 1 or 2 Children | 146 (10.8%) | 1,094 (39.7%) |
| 3 or 4 Children | 72 (11.9%) | 304 (59.1%) |
| 5 or more Children | 4 (26.7%) | 11 (16.7%) |
| Total | 453 (10.1%) | 1,523 (29.2%) |
Race in York
The most populous races in York are White / Caucasian (22,787 | 50.9%), Hispanic or Latino (15,239 | 34.0%), and Black / African American (11,874 | 26.5%).
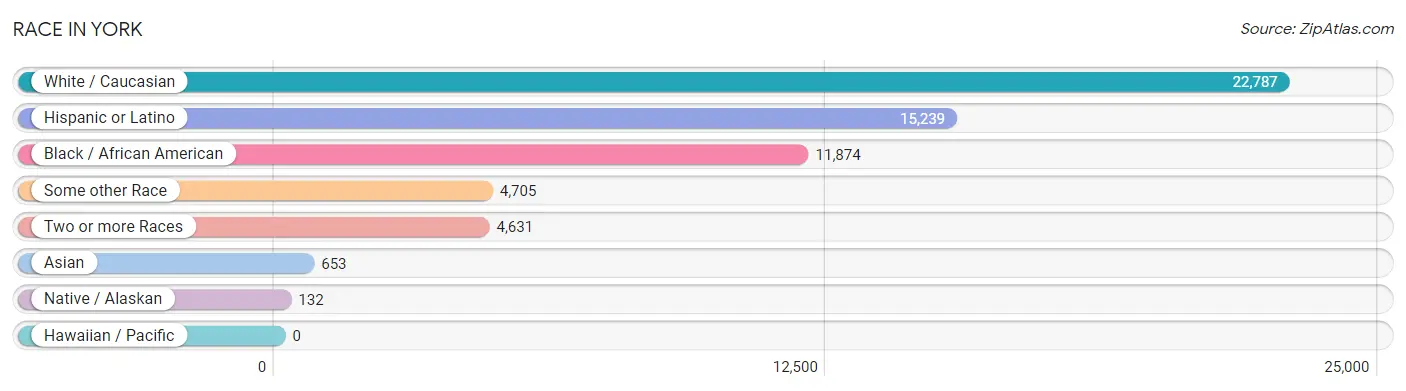
| Race | # Population | % Population |
| Asian | 653 | 1.5% |
| Black / African American | 11,874 | 26.5% |
| Hawaiian / Pacific | 0 | 0.0% |
| Hispanic or Latino | 15,239 | 34.0% |
| Native / Alaskan | 132 | 0.3% |
| White / Caucasian | 22,787 | 50.9% |
| Two or more Races | 4,631 | 10.3% |
| Some other Race | 4,705 | 10.5% |
| Total | 44,782 | 100.0% |
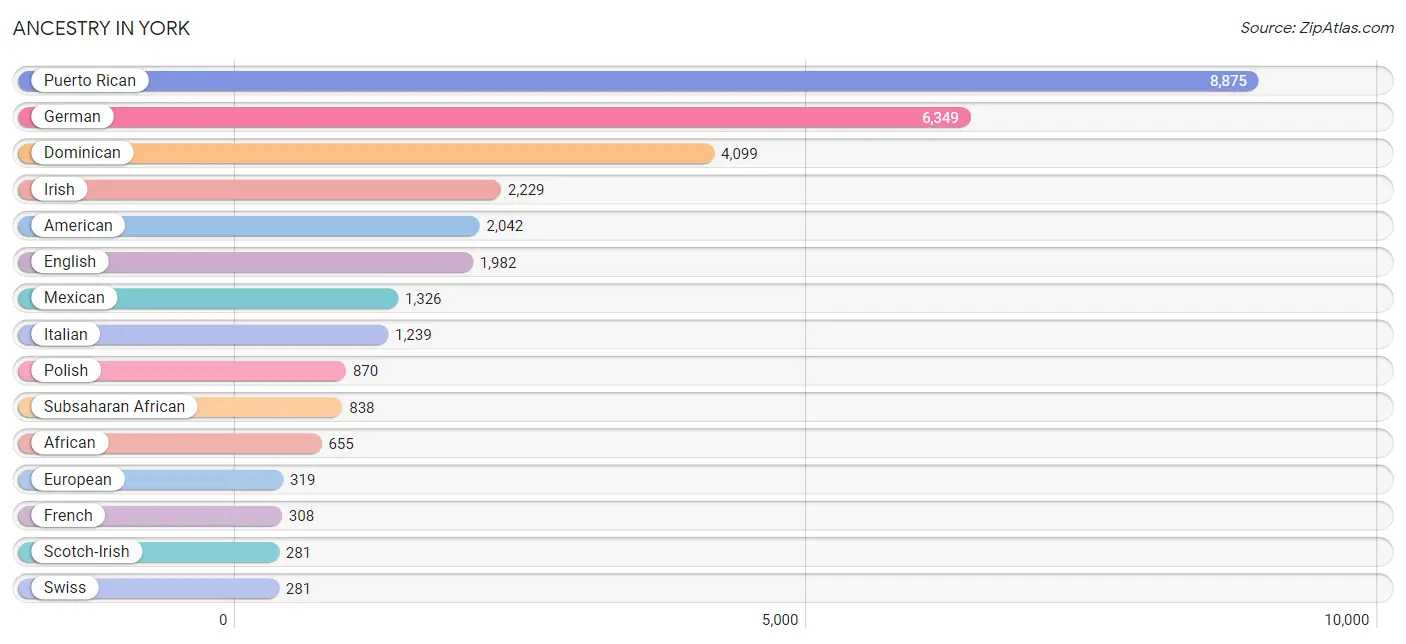
Ancestry in York
The most populous ancestries reported in York are Puerto Rican (8,875 | 19.8%), German (6,349 | 14.2%), Dominican (4,099 | 9.1%), Irish (2,229 | 5.0%), and American (2,042 | 4.6%), together accounting for 52.7% of all York residents.
| Ancestry | # Population | % Population |
| African | 655 | 1.5% |
| Alaska Native | 11 | 0.0% |
| American | 2,042 | 4.6% |
| Arab | 214 | 0.5% |
| Argentinean | 41 | 0.1% |
| Austrian | 33 | 0.1% |
| Bhutanese | 65 | 0.2% |
| Blackfeet | 17 | 0.0% |
| Brazilian | 49 | 0.1% |
| British | 179 | 0.4% |
| Bulgarian | 1 | 0.0% |
| Burmese | 10 | 0.0% |
| Canadian | 4 | 0.0% |
| Central American | 211 | 0.5% |
| Central American Indian | 145 | 0.3% |
| Cherokee | 160 | 0.4% |
| Chilean | 16 | 0.0% |
| Colombian | 137 | 0.3% |
| Croatian | 17 | 0.0% |
| Cuban | 78 | 0.2% |
| Czech | 4 | 0.0% |
| Czechoslovakian | 16 | 0.0% |
| Delaware | 6 | 0.0% |
| Dominican | 4,099 | 9.1% |
| Dutch | 135 | 0.3% |
| Eastern European | 29 | 0.1% |
| Ecuadorian | 8 | 0.0% |
| Egyptian | 34 | 0.1% |
| English | 1,982 | 4.4% |
| Estonian | 13 | 0.0% |
| European | 319 | 0.7% |
| Finnish | 9 | 0.0% |
| French | 308 | 0.7% |
| French Canadian | 117 | 0.3% |
| German | 6,349 | 14.2% |
| Ghanaian | 24 | 0.1% |
| Greek | 71 | 0.2% |
| Guatemalan | 7 | 0.0% |
| Haitian | 125 | 0.3% |
| Honduran | 3 | 0.0% |
| Hungarian | 105 | 0.2% |
| Indian (Asian) | 183 | 0.4% |
| Irish | 2,229 | 5.0% |
| Iroquois | 64 | 0.1% |
| Israeli | 17 | 0.0% |
| Italian | 1,239 | 2.8% |
| Jamaican | 255 | 0.6% |
| Japanese | 40 | 0.1% |
| Kenyan | 39 | 0.1% |
| Korean | 72 | 0.2% |
| Laotian | 13 | 0.0% |
| Lebanese | 112 | 0.3% |
| Lithuanian | 28 | 0.1% |
| Malaysian | 101 | 0.2% |
| Mexican | 1,326 | 3.0% |
| Native Hawaiian | 13 | 0.0% |
| Navajo | 164 | 0.4% |
| Nigerian | 29 | 0.1% |
| Northern European | 80 | 0.2% |
| Norwegian | 28 | 0.1% |
| Pakistani | 85 | 0.2% |
| Palestinian | 28 | 0.1% |
| Panamanian | 39 | 0.1% |
| Pennsylvania German | 172 | 0.4% |
| Peruvian | 9 | 0.0% |
| Polish | 870 | 1.9% |
| Portuguese | 17 | 0.0% |
| Puerto Rican | 8,875 | 19.8% |
| Romanian | 22 | 0.1% |
| Russian | 48 | 0.1% |
| Salvadoran | 162 | 0.4% |
| Scandinavian | 113 | 0.3% |
| Scotch-Irish | 281 | 0.6% |
| Scottish | 197 | 0.4% |
| Serbian | 87 | 0.2% |
| Slovak | 273 | 0.6% |
| South American | 211 | 0.5% |
| South American Indian | 16 | 0.0% |
| Spaniard | 89 | 0.2% |
| Spanish | 44 | 0.1% |
| Sri Lankan | 203 | 0.4% |
| Subsaharan African | 838 | 1.9% |
| Swedish | 78 | 0.2% |
| Swiss | 281 | 0.6% |
| Syrian | 40 | 0.1% |
| Thai | 93 | 0.2% |
| U.S. Virgin Islander | 102 | 0.2% |
| Ukrainian | 68 | 0.2% |
| Welsh | 141 | 0.3% |
| Yugoslavian | 5 | 0.0% | View All 90 Rows |
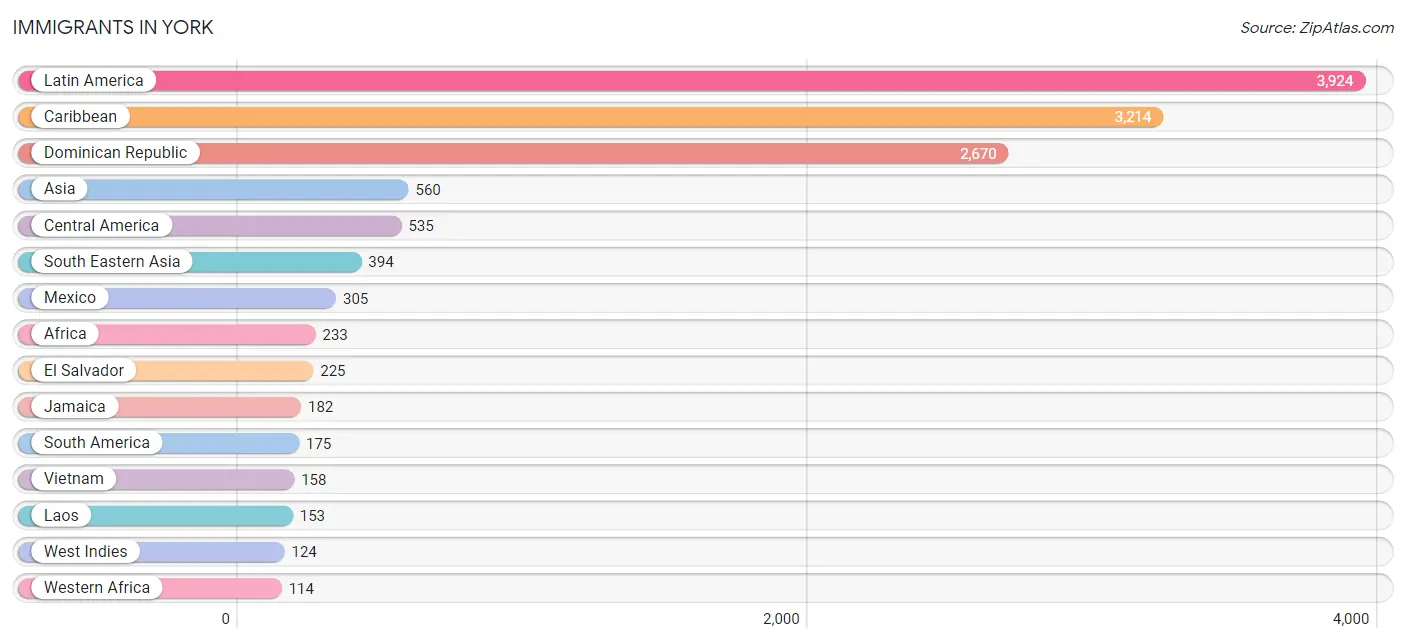
Immigrants in York
The most numerous immigrant groups reported in York came from Latin America (3,924 | 8.8%), Caribbean (3,214 | 7.2%), Dominican Republic (2,670 | 6.0%), Asia (560 | 1.3%), and Central America (535 | 1.2%), together accounting for 24.3% of all York residents.
| Immigration Origin | # Population | % Population |
| Africa | 233 | 0.5% |
| Albania | 3 | 0.0% |
| Asia | 560 | 1.3% |
| Brazil | 11 | 0.0% |
| Bulgaria | 1 | 0.0% |
| Cambodia | 45 | 0.1% |
| Caribbean | 3,214 | 7.2% |
| Central America | 535 | 1.2% |
| Chile | 16 | 0.0% |
| China | 84 | 0.2% |
| Colombia | 103 | 0.2% |
| Cuba | 63 | 0.1% |
| Czechoslovakia | 3 | 0.0% |
| Dominica | 72 | 0.2% |
| Dominican Republic | 2,670 | 6.0% |
| Eastern Africa | 39 | 0.1% |
| Eastern Asia | 88 | 0.2% |
| Eastern Europe | 7 | 0.0% |
| Egypt | 34 | 0.1% |
| El Salvador | 225 | 0.5% |
| England | 10 | 0.0% |
| Europe | 101 | 0.2% |
| France | 6 | 0.0% |
| Germany | 12 | 0.0% |
| Ghana | 17 | 0.0% |
| Greece | 18 | 0.0% |
| Guatemala | 2 | 0.0% |
| Haiti | 103 | 0.2% |
| Honduras | 3 | 0.0% |
| India | 51 | 0.1% |
| Italy | 35 | 0.1% |
| Jamaica | 182 | 0.4% |
| Kenya | 39 | 0.1% |
| Korea | 4 | 0.0% |
| Laos | 153 | 0.3% |
| Latin America | 3,924 | 8.8% |
| Lebanon | 27 | 0.1% |
| Mexico | 305 | 0.7% |
| Nigeria | 36 | 0.1% |
| Northern Africa | 34 | 0.1% |
| Northern Europe | 23 | 0.1% |
| Peru | 45 | 0.1% |
| Scotland | 13 | 0.0% |
| Sierra Leone | 3 | 0.0% |
| South America | 175 | 0.4% |
| South Central Asia | 51 | 0.1% |
| South Eastern Asia | 394 | 0.9% |
| Southern Europe | 53 | 0.1% |
| Thailand | 38 | 0.1% |
| Vietnam | 158 | 0.4% |
| West Indies | 124 | 0.3% |
| Western Africa | 114 | 0.3% |
| Western Asia | 27 | 0.1% |
| Western Europe | 18 | 0.0% | View All 54 Rows |
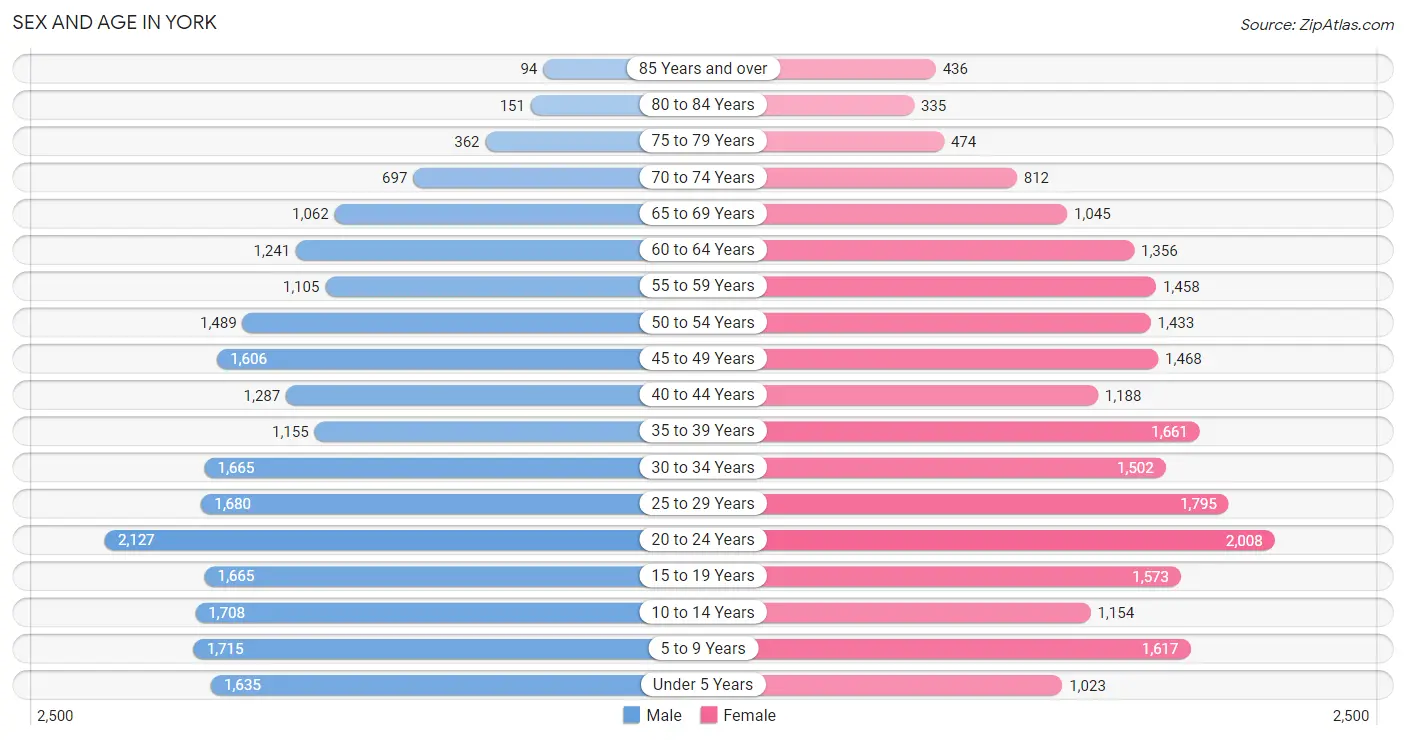
Sex and Age in York
Sex and Age in York
The most populous age groups in York are 20 to 24 Years (2,127 | 9.5%) for men and 20 to 24 Years (2,008 | 9.0%) for women.
| Age Bracket | Male | Female |
| Under 5 Years | 1,635 (7.3%) | 1,023 (4.6%) |
| 5 to 9 Years | 1,715 (7.6%) | 1,617 (7.2%) |
| 10 to 14 Years | 1,708 (7.6%) | 1,154 (5.2%) |
| 15 to 19 Years | 1,665 (7.4%) | 1,573 (7.0%) |
| 20 to 24 Years | 2,127 (9.5%) | 2,008 (9.0%) |
| 25 to 29 Years | 1,680 (7.5%) | 1,795 (8.0%) |
| 30 to 34 Years | 1,665 (7.4%) | 1,502 (6.7%) |
| 35 to 39 Years | 1,155 (5.1%) | 1,661 (7.4%) |
| 40 to 44 Years | 1,287 (5.7%) | 1,188 (5.3%) |
| 45 to 49 Years | 1,606 (7.2%) | 1,468 (6.6%) |
| 50 to 54 Years | 1,489 (6.6%) | 1,433 (6.4%) |
| 55 to 59 Years | 1,105 (4.9%) | 1,458 (6.5%) |
| 60 to 64 Years | 1,241 (5.5%) | 1,356 (6.1%) |
| 65 to 69 Years | 1,062 (4.7%) | 1,045 (4.7%) |
| 70 to 74 Years | 697 (3.1%) | 812 (3.6%) |
| 75 to 79 Years | 362 (1.6%) | 474 (2.1%) |
| 80 to 84 Years | 151 (0.7%) | 335 (1.5%) |
| 85 Years and over | 94 (0.4%) | 436 (1.9%) |
| Total | 22,444 (100.0%) | 22,338 (100.0%) |
Families and Households in York
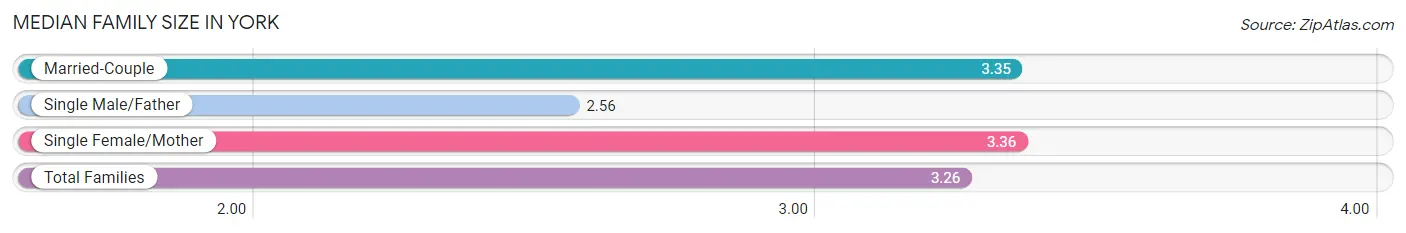
Median Family Size in York
The median family size in York is 3.26 persons per family, with single female/mother families (4,026 | 41.5%) accounting for the largest median family size of 3.36 persons per family. On the other hand, single male/father families (1,189 | 12.2%) represent the smallest median family size with 2.56 persons per family.
| Family Type | # Families | Family Size |
| Married-Couple | 4,495 (46.3%) | 3.35 |
| Single Male/Father | 1,189 (12.2%) | 2.56 |
| Single Female/Mother | 4,026 (41.5%) | 3.36 |
| Total Families | 9,710 (100.0%) | 3.26 |
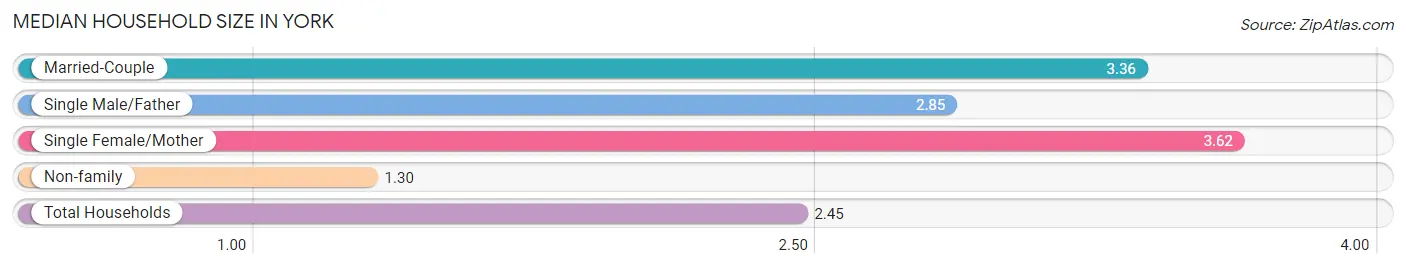
Median Household Size in York
The median household size in York is 2.45 persons per household, with single female/mother households (4,026 | 22.7%) accounting for the largest median household size of 3.62 persons per household. non-family households (8,041 | 45.3%) represent the smallest median household size with 1.30 persons per household.
| Household Type | # Households | Household Size |
| Married-Couple | 4,495 (25.3%) | 3.36 |
| Single Male/Father | 1,189 (6.7%) | 2.85 |
| Single Female/Mother | 4,026 (22.7%) | 3.62 |
| Non-family | 8,041 (45.3%) | 1.30 |
| Total Households | 17,751 (100.0%) | 2.45 |
Household Size by Marriage Status in York
Out of a total of 17,751 households in York, 9,710 (54.7%) are family households, while 8,041 (45.3%) are nonfamily households. The most numerous type of family households are 2-person households, comprising 3,531, and the most common type of nonfamily households are 1-person households, comprising 6,429.
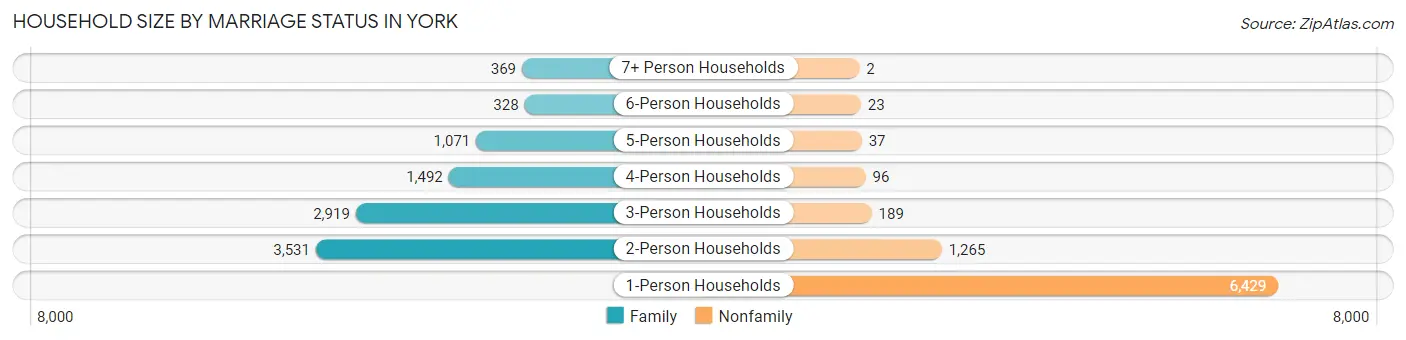
| Household Size | Family Households | Nonfamily Households |
| 1-Person Households | - | 6,429 (36.2%) |
| 2-Person Households | 3,531 (19.9%) | 1,265 (7.1%) |
| 3-Person Households | 2,919 (16.4%) | 189 (1.1%) |
| 4-Person Households | 1,492 (8.4%) | 96 (0.5%) |
| 5-Person Households | 1,071 (6.0%) | 37 (0.2%) |
| 6-Person Households | 328 (1.8%) | 23 (0.1%) |
| 7+ Person Households | 369 (2.1%) | 2 (0.0%) |
| Total | 9,710 (54.7%) | 8,041 (45.3%) |
Female Fertility in York
Fertility by Age in York
Average fertility rate in York is 64.0 births per 1,000 women. Women in the age bracket of 15 to 19 years have the highest fertility rate with 100.0 births per 1,000 women. Women in the age bracket of 20 to 34 years acount for 56.6% of all women with births.
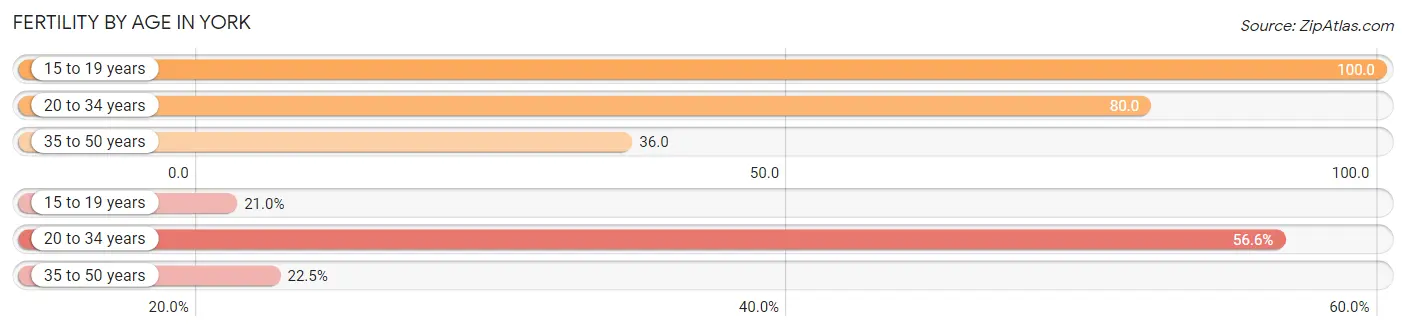
| Age Bracket | Women with Births | Births / 1,000 Women |
| 15 to 19 years | 157 (21.0%) | 100.0 |
| 20 to 34 years | 423 (56.6%) | 80.0 |
| 35 to 50 years | 168 (22.5%) | 36.0 |
| Total | 748 (100.0%) | 64.0 |
Fertility by Age by Marriage Status in York
49.9% of women with births (748) in York are married. The highest percentage of unmarried women with births falls into 15 to 19 years age bracket with 100.0% of them unmarried at the time of birth, while the lowest percentage of unmarried women with births belong to 35 to 50 years age bracket with 33.3% of them unmarried.
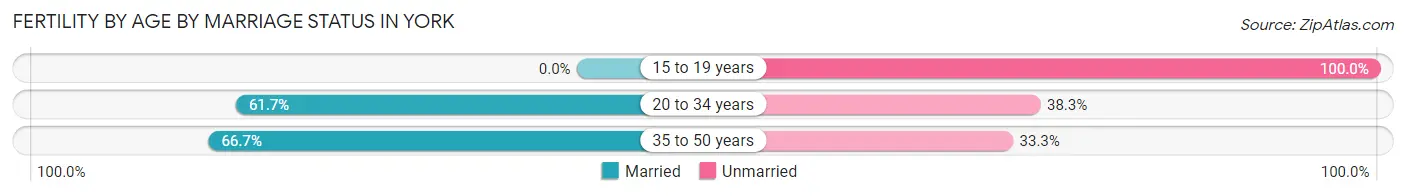
| Age Bracket | Married | Unmarried |
| 15 to 19 years | 0 (0.0%) | 157 (100.0%) |
| 20 to 34 years | 261 (61.7%) | 162 (38.3%) |
| 35 to 50 years | 112 (66.7%) | 56 (33.3%) |
| Total | 373 (49.9%) | 375 (50.1%) |
Fertility by Education in York
Average fertility rate in York is 64.0 births per 1,000 women. Women with the education attainment of high school diploma have the highest fertility rate of 107.0 births per 1,000 women, while women with the education attainment of bachelor's degree have the lowest fertility at 23.0 births per 1,000 women. Women with the education attainment of high school diploma represent 57.5% of all women with births.
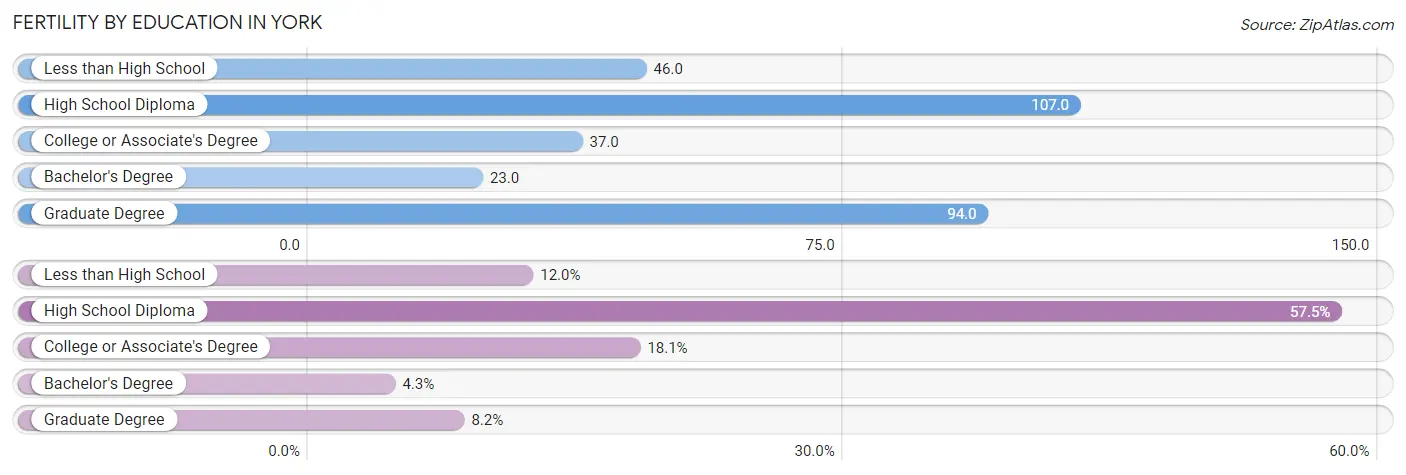
| Educational Attainment | Women with Births | Births / 1,000 Women |
| Less than High School | 90 (12.0%) | 46.0 |
| High School Diploma | 430 (57.5%) | 107.0 |
| College or Associate's Degree | 135 (18.0%) | 37.0 |
| Bachelor's Degree | 32 (4.3%) | 23.0 |
| Graduate Degree | 61 (8.2%) | 94.0 |
| Total | 748 (100.0%) | 64.0 |
Fertility by Education by Marriage Status in York
50.1% of women with births in York are unmarried. Women with the educational attainment of bachelor's degree are most likely to be married with 100.0% of them married at childbirth, while women with the educational attainment of high school diploma are least likely to be married with 63.0% of them unmarried at childbirth.
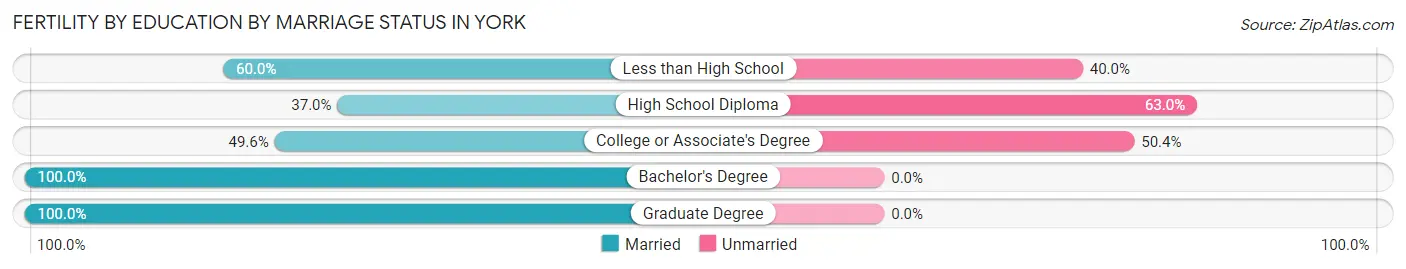
| Educational Attainment | Married | Unmarried |
| Less than High School | 54 (60.0%) | 36 (40.0%) |
| High School Diploma | 159 (37.0%) | 271 (63.0%) |
| College or Associate's Degree | 67 (49.6%) | 68 (50.4%) |
| Bachelor's Degree | 32 (100.0%) | 0 (0.0%) |
| Graduate Degree | 61 (100.0%) | 0 (0.0%) |
| Total | 373 (49.9%) | 375 (50.1%) |
Employment Characteristics in York
Employment by Class of Employer in York
Among the 19,423 employed individuals in York, private company employees (14,591 | 75.1%), not-for-profit organizations (1,998 | 10.3%), and self-employed (not incorporated) (853 | 4.4%) make up the most common classes of employment.
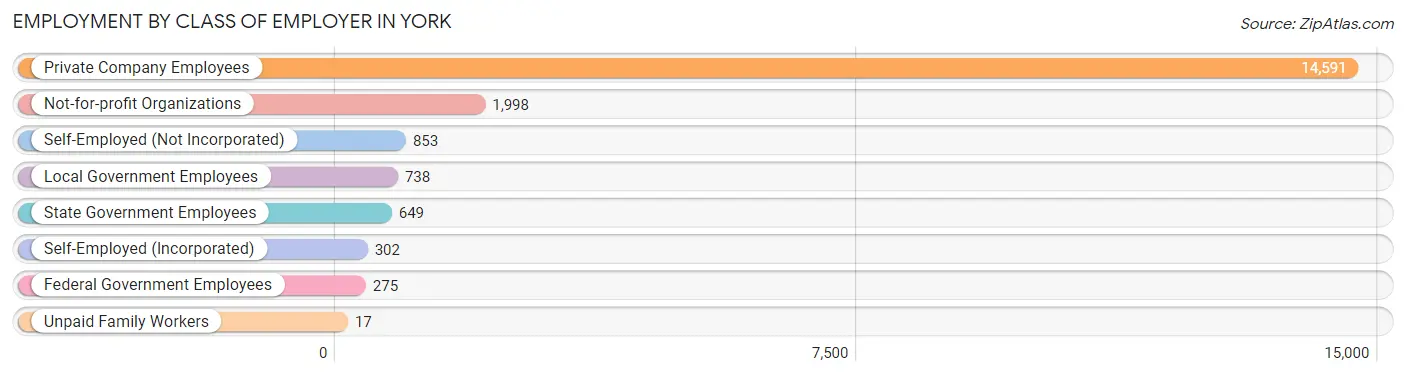
| Employer Class | # Employees | % Employees |
| Private Company Employees | 14,591 | 75.1% |
| Self-Employed (Incorporated) | 302 | 1.5% |
| Self-Employed (Not Incorporated) | 853 | 4.4% |
| Not-for-profit Organizations | 1,998 | 10.3% |
| Local Government Employees | 738 | 3.8% |
| State Government Employees | 649 | 3.3% |
| Federal Government Employees | 275 | 1.4% |
| Unpaid Family Workers | 17 | 0.1% |
| Total | 19,423 | 100.0% |
Employment Status by Age in York
According to the labor force statistics for York, out of the total population over 16 years of age (35,234), 64.5% or 22,726 individuals are in the labor force, with 12.0% or 2,727 of them unemployed. The age group with the highest labor force participation rate is 30 to 34 years, with 85.3% or 2,701 individuals in the labor force. Within the labor force, the 16 to 19 years age range has the highest percentage of unemployed individuals, with 36.4% or 464 of them being unemployed.
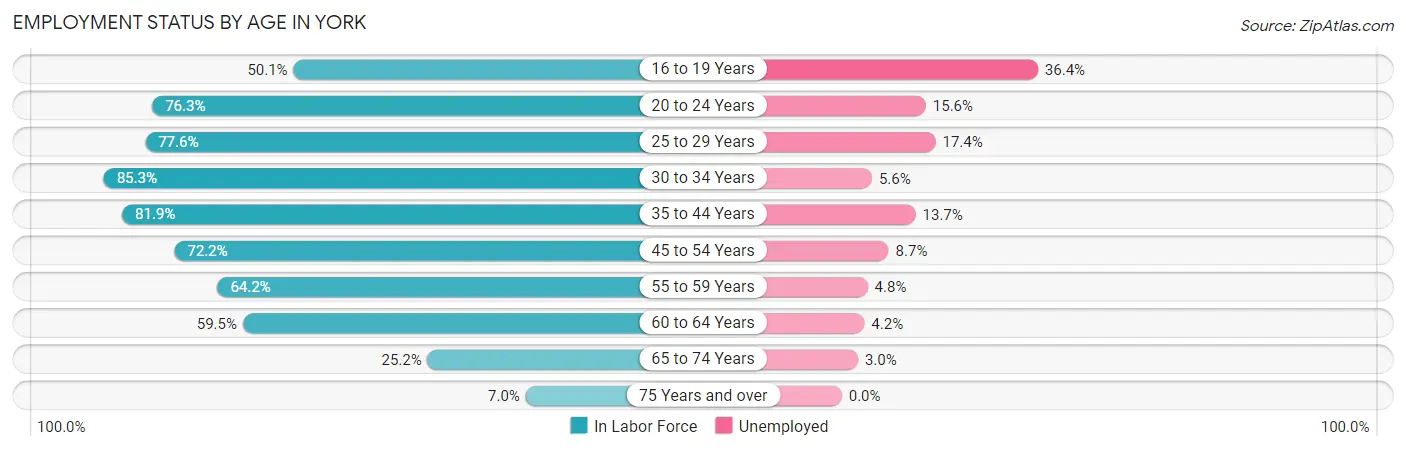
| Age Bracket | In Labor Force | Unemployed |
| 16 to 19 Years | 1,274 (50.1%) | 464 (36.4%) |
| 20 to 24 Years | 3,155 (76.3%) | 492 (15.6%) |
| 25 to 29 Years | 2,697 (77.6%) | 469 (17.4%) |
| 30 to 34 Years | 2,701 (85.3%) | 151 (5.6%) |
| 35 to 44 Years | 4,333 (81.9%) | 594 (13.7%) |
| 45 to 54 Years | 4,329 (72.2%) | 377 (8.7%) |
| 55 to 59 Years | 1,645 (64.2%) | 79 (4.8%) |
| 60 to 64 Years | 1,545 (59.5%) | 65 (4.2%) |
| 65 to 74 Years | 911 (25.2%) | 27 (3.0%) |
| 75 Years and over | 130 (7.0%) | 0 (0.0%) |
| Total | 22,726 (64.5%) | 2,727 (12.0%) |
Employment Status by Educational Attainment in York
According to labor force statistics for York, 74.7% of individuals (17,247) out of the total population between 25 and 64 years of age (23,089) are in the labor force, with 10.1% or 1,742 of them being unemployed. The group with the highest labor force participation rate are those with the educational attainment of bachelor's degree or higher, with 88.5% or 3,279 individuals in the labor force. Within the labor force, individuals with college / associate degree education have the highest percentage of unemployment, with 16.4% or 764 of them being unemployed.
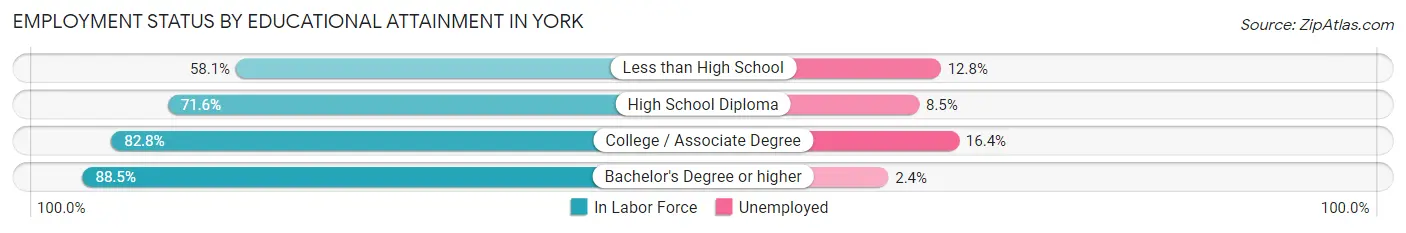
| Educational Attainment | In Labor Force | Unemployed |
| Less than High School | 2,314 (58.1%) | 510 (12.8%) |
| High School Diploma | 7,000 (71.6%) | 831 (8.5%) |
| College / Associate Degree | 4,658 (82.8%) | 923 (16.4%) |
| Bachelor's Degree or higher | 3,279 (88.5%) | 89 (2.4%) |
| Total | 17,247 (74.7%) | 2,332 (10.1%) |
Employment Occupations by Sex in York
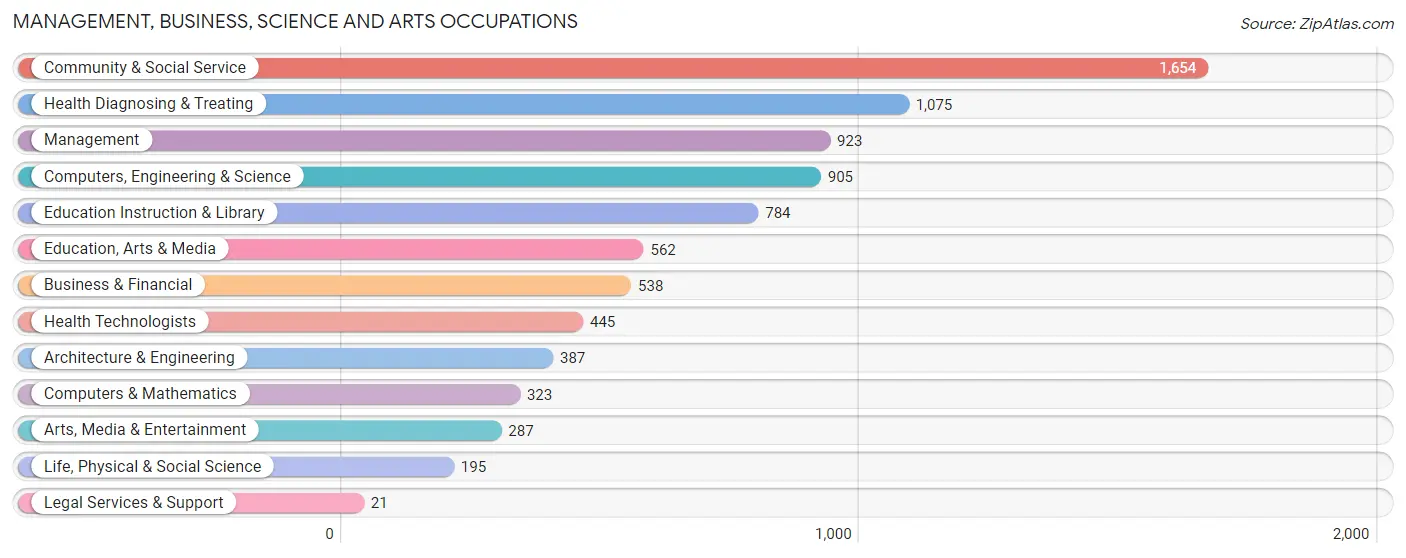
Management, Business, Science and Arts Occupations
The most common Management, Business, Science and Arts occupations in York are Community & Social Service (1,654 | 8.3%), Health Diagnosing & Treating (1,075 | 5.4%), Management (923 | 4.6%), Computers, Engineering & Science (905 | 4.5%), and Education Instruction & Library (784 | 3.9%).
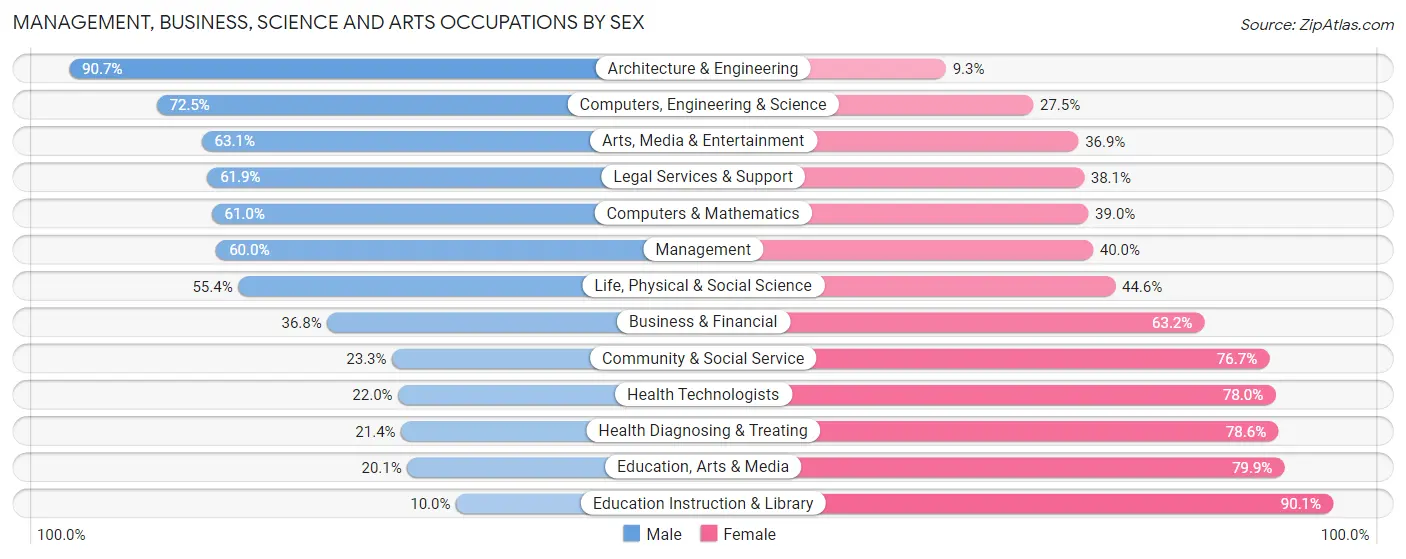
Management, Business, Science and Arts Occupations by Sex
Within the Management, Business, Science and Arts occupations in York, the most male-oriented occupations are Architecture & Engineering (90.7%), Computers, Engineering & Science (72.5%), and Arts, Media & Entertainment (63.1%), while the most female-oriented occupations are Education Instruction & Library (90.0%), Education, Arts & Media (79.9%), and Health Diagnosing & Treating (78.6%).
| Occupation | Male | Female |
| Management | 554 (60.0%) | 369 (40.0%) |
| Business & Financial | 198 (36.8%) | 340 (63.2%) |
| Computers, Engineering & Science | 656 (72.5%) | 249 (27.5%) |
| Computers & Mathematics | 197 (61.0%) | 126 (39.0%) |
| Architecture & Engineering | 351 (90.7%) | 36 (9.3%) |
| Life, Physical & Social Science | 108 (55.4%) | 87 (44.6%) |
| Community & Social Service | 385 (23.3%) | 1,269 (76.7%) |
| Education, Arts & Media | 113 (20.1%) | 449 (79.9%) |
| Legal Services & Support | 13 (61.9%) | 8 (38.1%) |
| Education Instruction & Library | 78 (10.0%) | 706 (90.0%) |
| Arts, Media & Entertainment | 181 (63.1%) | 106 (36.9%) |
| Health Diagnosing & Treating | 230 (21.4%) | 845 (78.6%) |
| Health Technologists | 98 (22.0%) | 347 (78.0%) |
| Total (Category) | 2,023 (39.7%) | 3,072 (60.3%) |
| Total (Overall) | 9,726 (48.6%) | 10,280 (51.4%) |
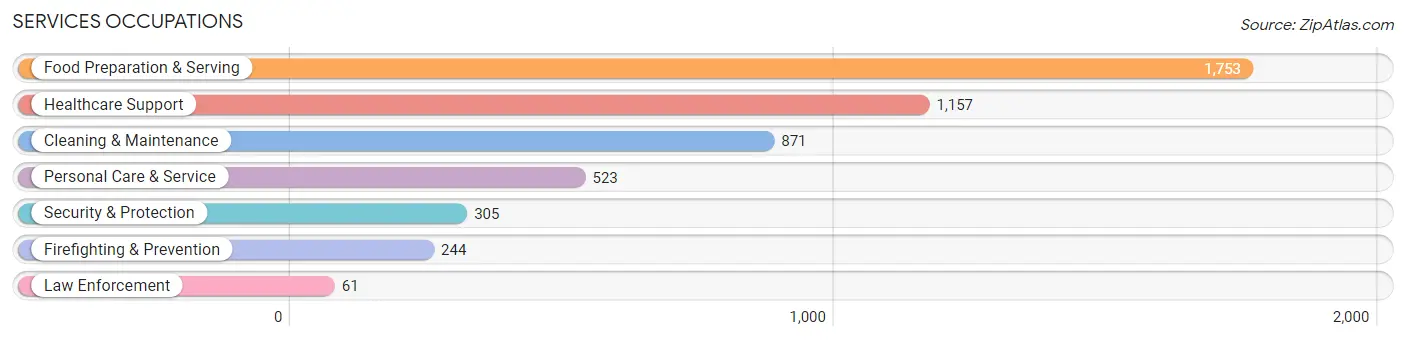
Services Occupations
The most common Services occupations in York are Food Preparation & Serving (1,753 | 8.8%), Healthcare Support (1,157 | 5.8%), Cleaning & Maintenance (871 | 4.3%), Personal Care & Service (523 | 2.6%), and Security & Protection (305 | 1.5%).
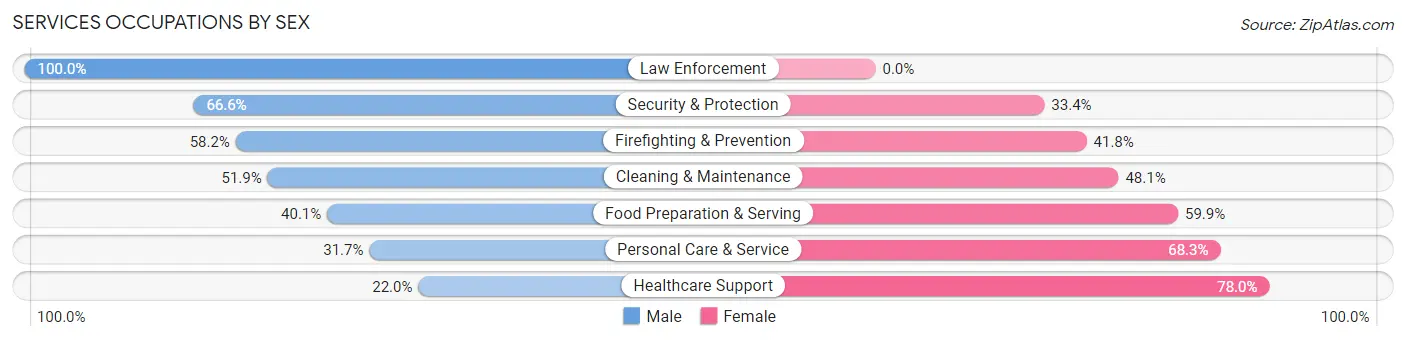
Services Occupations by Sex
Within the Services occupations in York, the most male-oriented occupations are Law Enforcement (100.0%), Security & Protection (66.6%), and Firefighting & Prevention (58.2%), while the most female-oriented occupations are Healthcare Support (78.0%), Personal Care & Service (68.3%), and Food Preparation & Serving (59.9%).
| Occupation | Male | Female |
| Healthcare Support | 255 (22.0%) | 902 (78.0%) |
| Security & Protection | 203 (66.6%) | 102 (33.4%) |
| Firefighting & Prevention | 142 (58.2%) | 102 (41.8%) |
| Law Enforcement | 61 (100.0%) | 0 (0.0%) |
| Food Preparation & Serving | 703 (40.1%) | 1,050 (59.9%) |
| Cleaning & Maintenance | 452 (51.9%) | 419 (48.1%) |
| Personal Care & Service | 166 (31.7%) | 357 (68.3%) |
| Total (Category) | 1,779 (38.6%) | 2,830 (61.4%) |
| Total (Overall) | 9,726 (48.6%) | 10,280 (51.4%) |
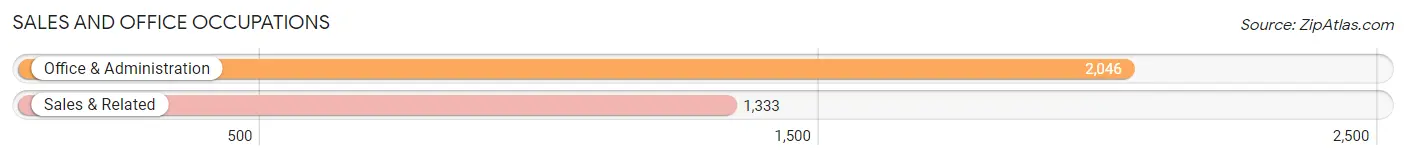
Sales and Office Occupations
The most common Sales and Office occupations in York are Office & Administration (2,046 | 10.2%), and Sales & Related (1,333 | 6.7%).
Sales and Office Occupations by Sex
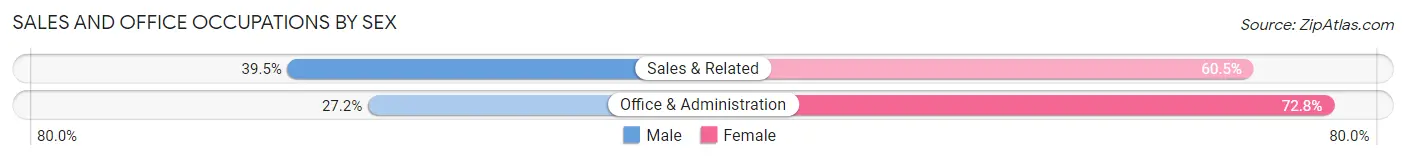
| Occupation | Male | Female |
| Sales & Related | 527 (39.5%) | 806 (60.5%) |
| Office & Administration | 556 (27.2%) | 1,490 (72.8%) |
| Total (Category) | 1,083 (32.1%) | 2,296 (67.9%) |
| Total (Overall) | 9,726 (48.6%) | 10,280 (51.4%) |
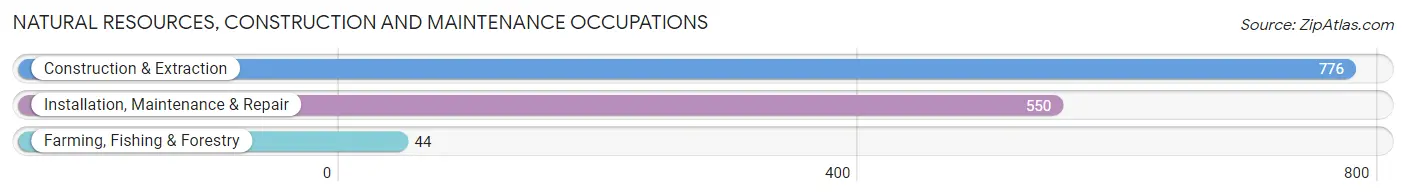
Natural Resources, Construction and Maintenance Occupations
The most common Natural Resources, Construction and Maintenance occupations in York are Construction & Extraction (776 | 3.9%), Installation, Maintenance & Repair (550 | 2.8%), and Farming, Fishing & Forestry (44 | 0.2%).
Natural Resources, Construction and Maintenance Occupations by Sex
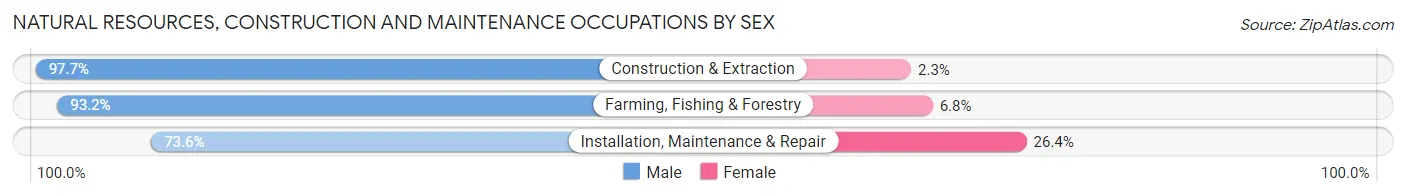
| Occupation | Male | Female |
| Farming, Fishing & Forestry | 41 (93.2%) | 3 (6.8%) |
| Construction & Extraction | 758 (97.7%) | 18 (2.3%) |
| Installation, Maintenance & Repair | 405 (73.6%) | 145 (26.4%) |
| Total (Category) | 1,204 (87.9%) | 166 (12.1%) |
| Total (Overall) | 9,726 (48.6%) | 10,280 (51.4%) |
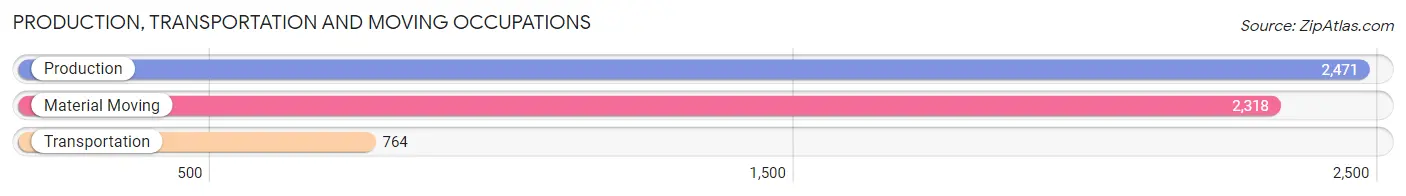
Production, Transportation and Moving Occupations
The most common Production, Transportation and Moving occupations in York are Production (2,471 | 12.3%), Material Moving (2,318 | 11.6%), and Transportation (764 | 3.8%).
Production, Transportation and Moving Occupations by Sex
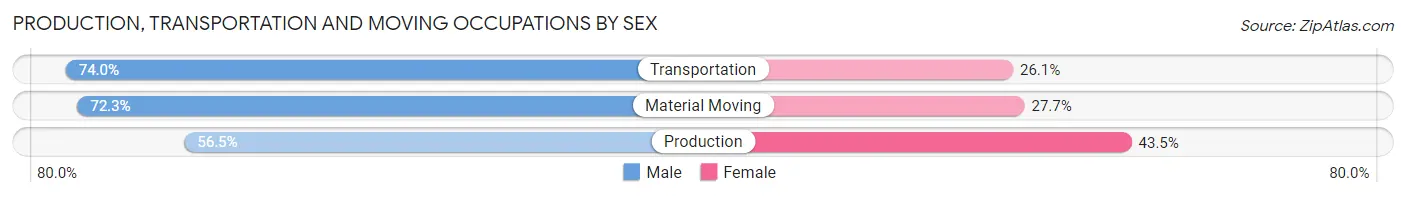
| Occupation | Male | Female |
| Production | 1,397 (56.5%) | 1,074 (43.5%) |
| Transportation | 565 (74.0%) | 199 (26.1%) |
| Material Moving | 1,675 (72.3%) | 643 (27.7%) |
| Total (Category) | 3,637 (65.5%) | 1,916 (34.5%) |
| Total (Overall) | 9,726 (48.6%) | 10,280 (51.4%) |
Employment Industries by Sex in York
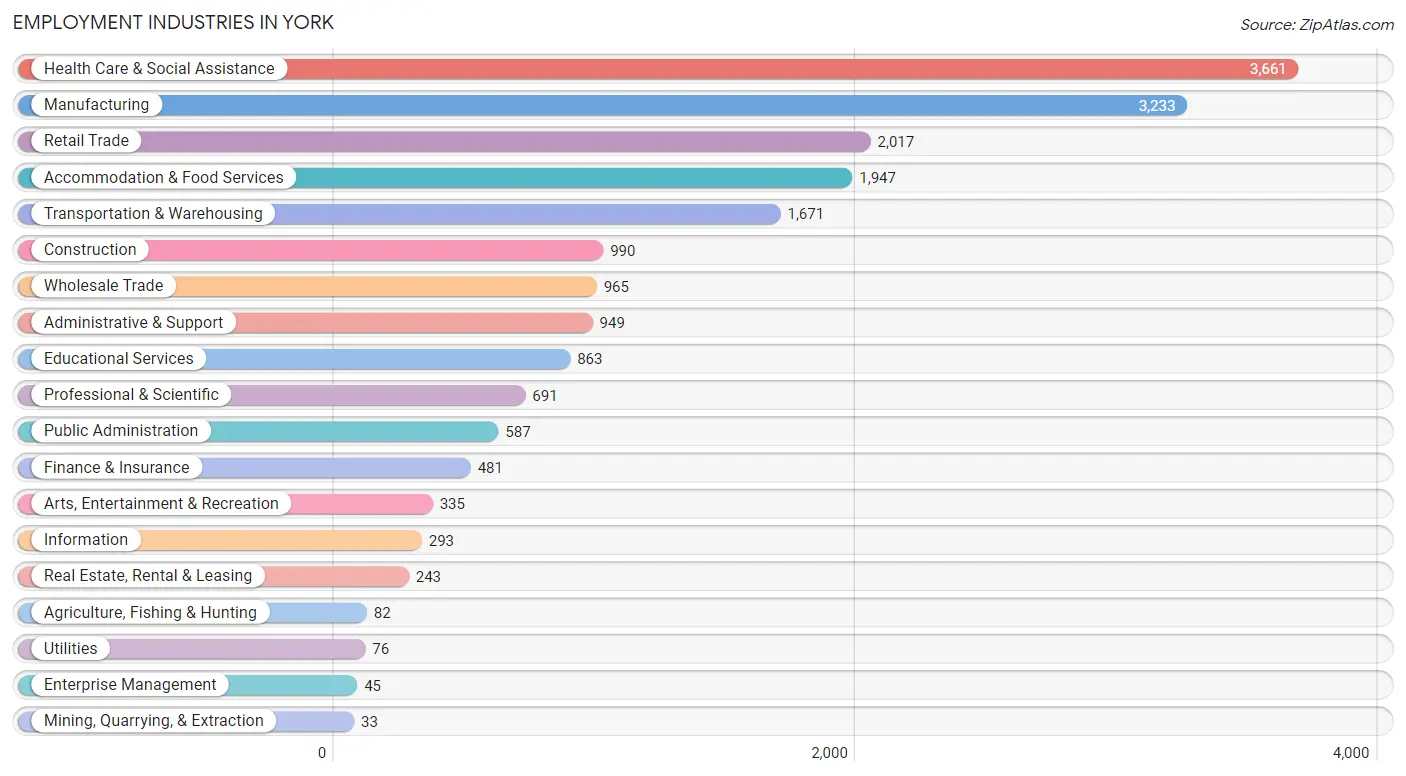
Employment Industries in York
The major employment industries in York include Health Care & Social Assistance (3,661 | 18.3%), Manufacturing (3,233 | 16.2%), Retail Trade (2,017 | 10.1%), Accommodation & Food Services (1,947 | 9.7%), and Transportation & Warehousing (1,671 | 8.4%).
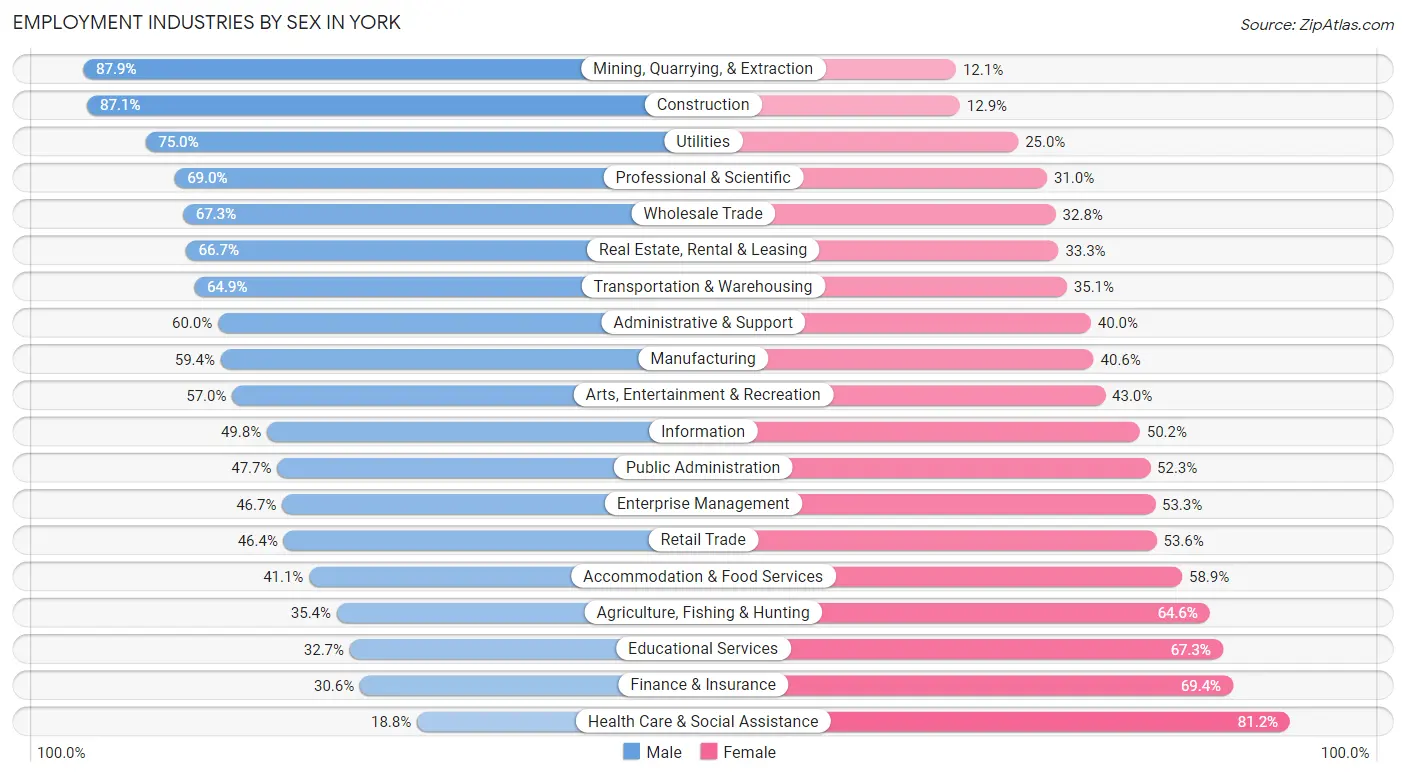
Employment Industries by Sex in York
The York industries that see more men than women are Mining, Quarrying, & Extraction (87.9%), Construction (87.1%), and Utilities (75.0%), whereas the industries that tend to have a higher number of women are Health Care & Social Assistance (81.2%), Finance & Insurance (69.4%), and Educational Services (67.3%).
| Industry | Male | Female |
| Agriculture, Fishing & Hunting | 29 (35.4%) | 53 (64.6%) |
| Mining, Quarrying, & Extraction | 29 (87.9%) | 4 (12.1%) |
| Construction | 862 (87.1%) | 128 (12.9%) |
| Manufacturing | 1,920 (59.4%) | 1,313 (40.6%) |
| Wholesale Trade | 649 (67.2%) | 316 (32.8%) |
| Retail Trade | 935 (46.4%) | 1,082 (53.6%) |
| Transportation & Warehousing | 1,085 (64.9%) | 586 (35.1%) |
| Utilities | 57 (75.0%) | 19 (25.0%) |
| Information | 146 (49.8%) | 147 (50.2%) |
| Finance & Insurance | 147 (30.6%) | 334 (69.4%) |
| Real Estate, Rental & Leasing | 162 (66.7%) | 81 (33.3%) |
| Professional & Scientific | 477 (69.0%) | 214 (31.0%) |
| Enterprise Management | 21 (46.7%) | 24 (53.3%) |
| Administrative & Support | 569 (60.0%) | 380 (40.0%) |
| Educational Services | 282 (32.7%) | 581 (67.3%) |
| Health Care & Social Assistance | 687 (18.8%) | 2,974 (81.2%) |
| Arts, Entertainment & Recreation | 191 (57.0%) | 144 (43.0%) |
| Accommodation & Food Services | 800 (41.1%) | 1,147 (58.9%) |
| Public Administration | 280 (47.7%) | 307 (52.3%) |
| Total | 9,726 (48.6%) | 10,280 (51.4%) |
Education in York
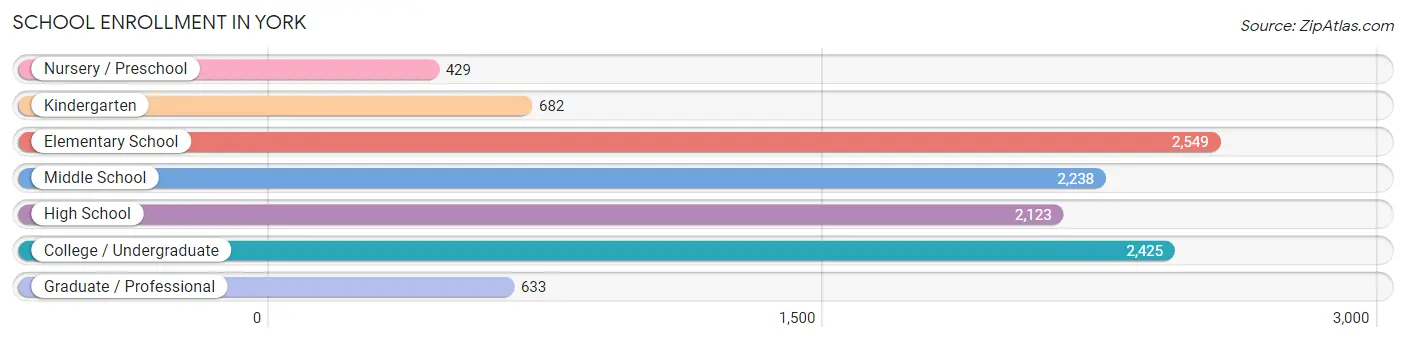
School Enrollment in York
The most common levels of schooling among the 11,079 students in York are elementary school (2,549 | 23.0%), college / undergraduate (2,425 | 21.9%), and middle school (2,238 | 20.2%).
| School Level | # Students | % Students |
| Nursery / Preschool | 429 | 3.9% |
| Kindergarten | 682 | 6.2% |
| Elementary School | 2,549 | 23.0% |
| Middle School | 2,238 | 20.2% |
| High School | 2,123 | 19.2% |
| College / Undergraduate | 2,425 | 21.9% |
| Graduate / Professional | 633 | 5.7% |
| Total | 11,079 | 100.0% |
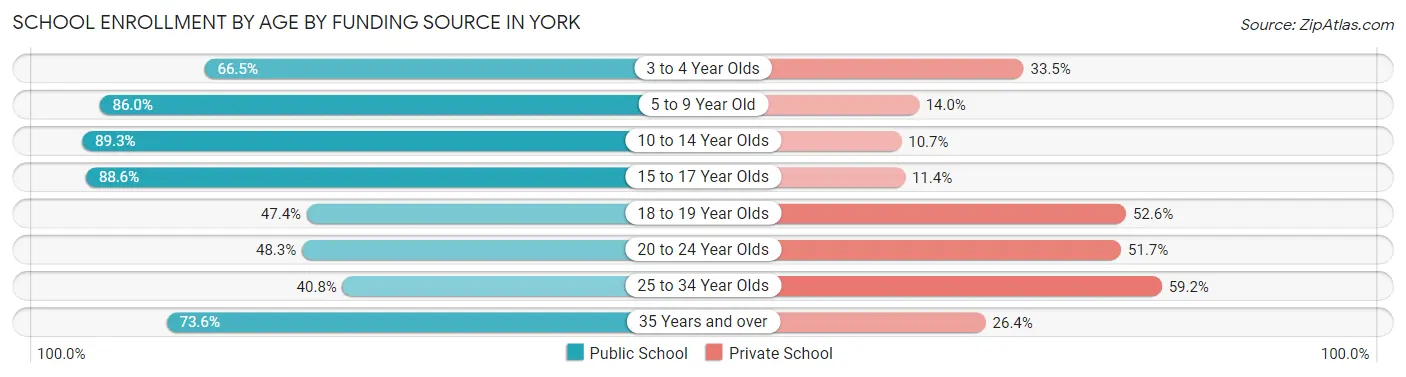
School Enrollment by Age by Funding Source in York
Out of a total of 11,079 students who are enrolled in schools in York, 2,692 (24.3%) attend a private institution, while the remaining 8,387 (75.7%) are enrolled in public schools. The age group of 25 to 34 year olds has the highest likelihood of being enrolled in private schools, with 343 (59.2% in the age bracket) enrolled. Conversely, the age group of 10 to 14 year olds has the lowest likelihood of being enrolled in a private school, with 2,437 (89.3% in the age bracket) attending a public institution.
| Age Bracket | Public School | Private School |
| 3 to 4 Year Olds | 234 (66.5%) | 118 (33.5%) |
| 5 to 9 Year Old | 2,610 (86.0%) | 424 (14.0%) |
| 10 to 14 Year Olds | 2,437 (89.3%) | 293 (10.7%) |
| 15 to 17 Year Olds | 1,435 (88.6%) | 185 (11.4%) |
| 18 to 19 Year Olds | 477 (47.4%) | 529 (52.6%) |
| 20 to 24 Year Olds | 632 (48.3%) | 676 (51.7%) |
| 25 to 34 Year Olds | 236 (40.8%) | 343 (59.2%) |
| 35 Years and over | 331 (73.6%) | 119 (26.4%) |
| Total | 8,387 (75.7%) | 2,692 (24.3%) |
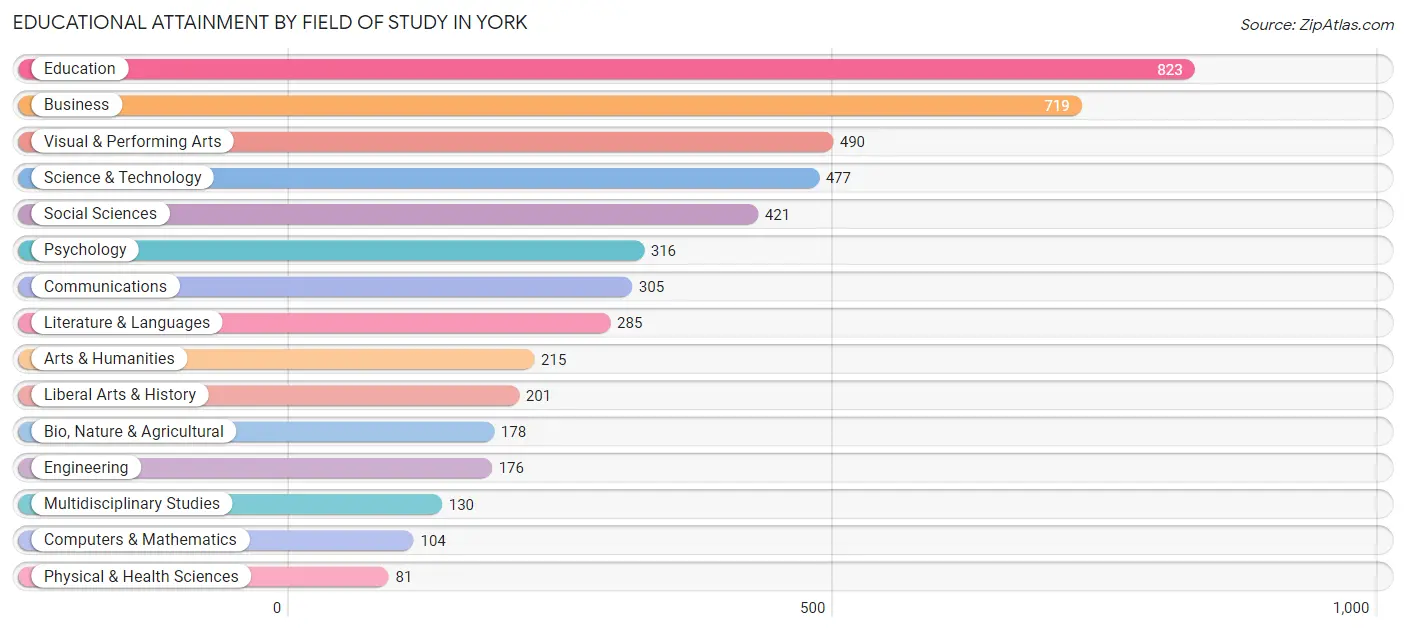
Educational Attainment by Field of Study in York
Education (823 | 16.7%), business (719 | 14.6%), visual & performing arts (490 | 10.0%), science & technology (477 | 9.7%), and social sciences (421 | 8.6%) are the most common fields of study among 4,921 individuals in York who have obtained a bachelor's degree or higher.
| Field of Study | # Graduates | % Graduates |
| Computers & Mathematics | 104 | 2.1% |
| Bio, Nature & Agricultural | 178 | 3.6% |
| Physical & Health Sciences | 81 | 1.7% |
| Psychology | 316 | 6.4% |
| Social Sciences | 421 | 8.6% |
| Engineering | 176 | 3.6% |
| Multidisciplinary Studies | 130 | 2.6% |
| Science & Technology | 477 | 9.7% |
| Business | 719 | 14.6% |
| Education | 823 | 16.7% |
| Literature & Languages | 285 | 5.8% |
| Liberal Arts & History | 201 | 4.1% |
| Visual & Performing Arts | 490 | 10.0% |
| Communications | 305 | 6.2% |
| Arts & Humanities | 215 | 4.4% |
| Total | 4,921 | 100.0% |
Transportation & Commute in York
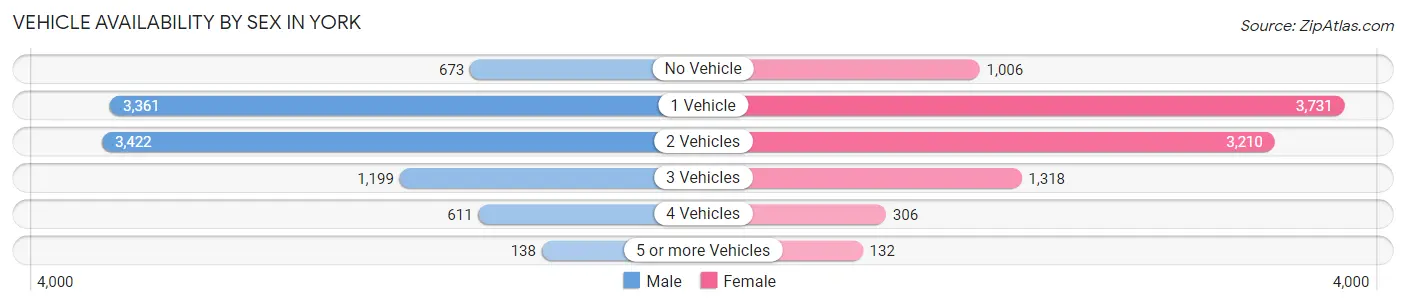
Vehicle Availability by Sex in York
The most prevalent vehicle ownership categories in York are males with 2 vehicles (3,422, accounting for 36.4%) and females with 2 vehicles (3,210, making up 35.3%).
| Vehicles Available | Male | Female |
| No Vehicle | 673 (7.2%) | 1,006 (10.4%) |
| 1 Vehicle | 3,361 (35.7%) | 3,731 (38.5%) |
| 2 Vehicles | 3,422 (36.4%) | 3,210 (33.1%) |
| 3 Vehicles | 1,199 (12.8%) | 1,318 (13.6%) |
| 4 Vehicles | 611 (6.5%) | 306 (3.2%) |
| 5 or more Vehicles | 138 (1.5%) | 132 (1.4%) |
| Total | 9,404 (100.0%) | 9,703 (100.0%) |
Commute Time in York
The most frequently occuring commute durations in York are 15 to 19 minutes (3,905 commuters, 22.0%), 10 to 14 minutes (3,551 commuters, 20.0%), and 20 to 24 minutes (2,411 commuters, 13.6%).
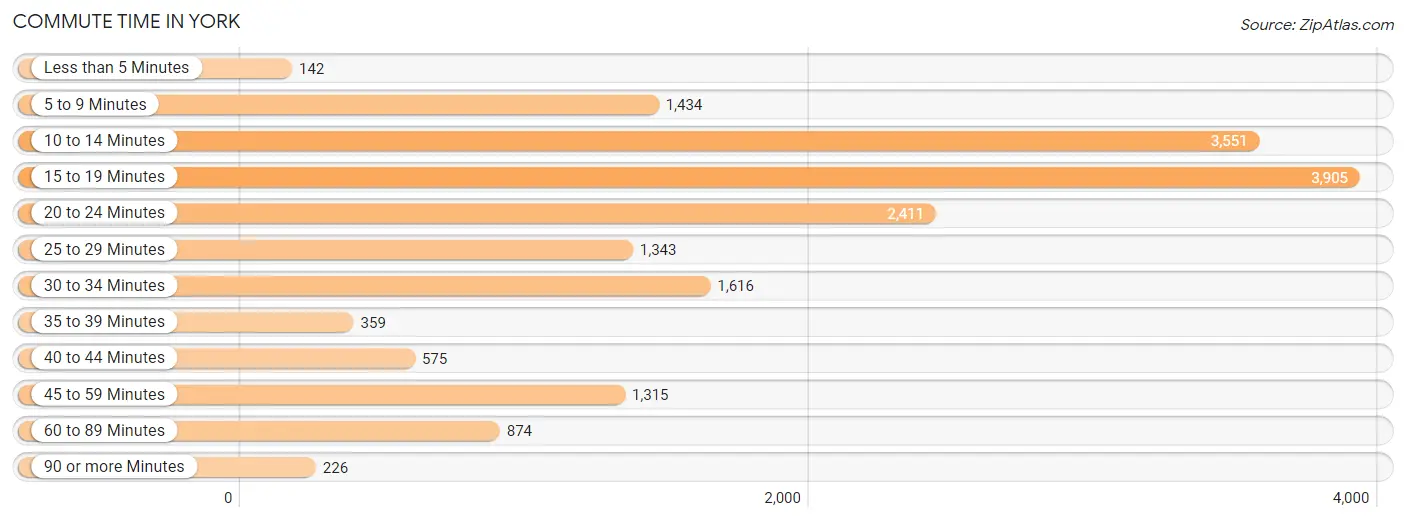
| Commute Time | # Commuters | % Commuters |
| Less than 5 Minutes | 142 | 0.8% |
| 5 to 9 Minutes | 1,434 | 8.1% |
| 10 to 14 Minutes | 3,551 | 20.0% |
| 15 to 19 Minutes | 3,905 | 22.0% |
| 20 to 24 Minutes | 2,411 | 13.6% |
| 25 to 29 Minutes | 1,343 | 7.6% |
| 30 to 34 Minutes | 1,616 | 9.1% |
| 35 to 39 Minutes | 359 | 2.0% |
| 40 to 44 Minutes | 575 | 3.2% |
| 45 to 59 Minutes | 1,315 | 7.4% |
| 60 to 89 Minutes | 874 | 4.9% |
| 90 or more Minutes | 226 | 1.3% |
Commute Time by Sex in York
The most common commute times in York are 15 to 19 minutes (1,953 commuters, 21.3%) for males and 15 to 19 minutes (1,952 commuters, 22.7%) for females.
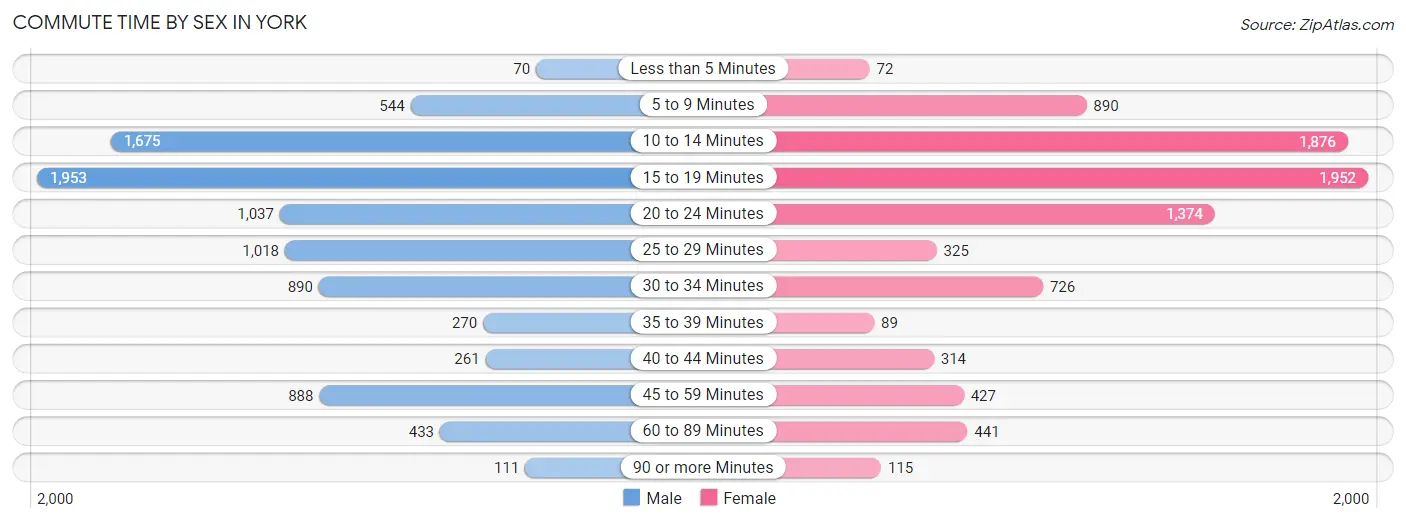
| Commute Time | Male | Female |
| Less than 5 Minutes | 70 (0.8%) | 72 (0.8%) |
| 5 to 9 Minutes | 544 (5.9%) | 890 (10.3%) |
| 10 to 14 Minutes | 1,675 (18.3%) | 1,876 (21.8%) |
| 15 to 19 Minutes | 1,953 (21.3%) | 1,952 (22.7%) |
| 20 to 24 Minutes | 1,037 (11.3%) | 1,374 (16.0%) |
| 25 to 29 Minutes | 1,018 (11.1%) | 325 (3.8%) |
| 30 to 34 Minutes | 890 (9.7%) | 726 (8.4%) |
| 35 to 39 Minutes | 270 (2.9%) | 89 (1.0%) |
| 40 to 44 Minutes | 261 (2.9%) | 314 (3.6%) |
| 45 to 59 Minutes | 888 (9.7%) | 427 (5.0%) |
| 60 to 89 Minutes | 433 (4.7%) | 441 (5.1%) |
| 90 or more Minutes | 111 (1.2%) | 115 (1.3%) |
Time of Departure to Work by Sex in York
The most frequent times of departure to work in York are 7:00 AM to 7:29 AM (1,178, 12.9%) for males and 4:00 PM to 11:59 PM (1,085, 12.6%) for females.
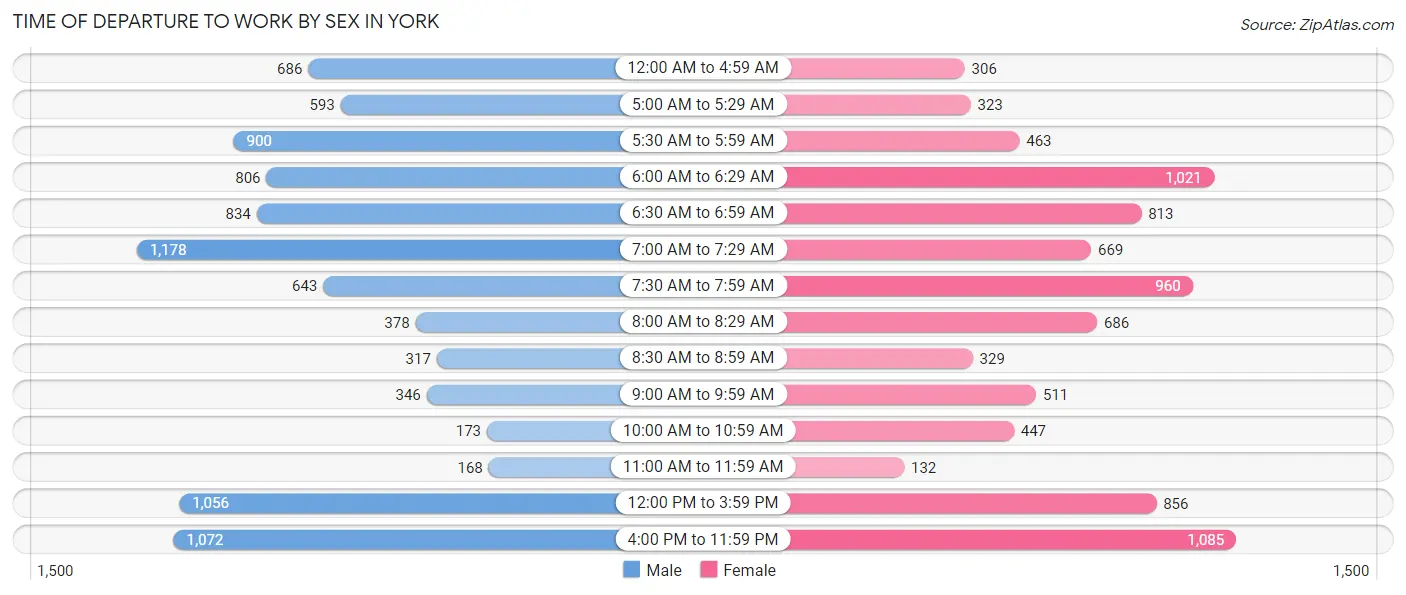
| Time of Departure | Male | Female |
| 12:00 AM to 4:59 AM | 686 (7.5%) | 306 (3.6%) |
| 5:00 AM to 5:29 AM | 593 (6.5%) | 323 (3.8%) |
| 5:30 AM to 5:59 AM | 900 (9.8%) | 463 (5.4%) |
| 6:00 AM to 6:29 AM | 806 (8.8%) | 1,021 (11.9%) |
| 6:30 AM to 6:59 AM | 834 (9.1%) | 813 (9.5%) |
| 7:00 AM to 7:29 AM | 1,178 (12.9%) | 669 (7.8%) |
| 7:30 AM to 7:59 AM | 643 (7.0%) | 960 (11.2%) |
| 8:00 AM to 8:29 AM | 378 (4.1%) | 686 (8.0%) |
| 8:30 AM to 8:59 AM | 317 (3.5%) | 329 (3.8%) |
| 9:00 AM to 9:59 AM | 346 (3.8%) | 511 (5.9%) |
| 10:00 AM to 10:59 AM | 173 (1.9%) | 447 (5.2%) |
| 11:00 AM to 11:59 AM | 168 (1.8%) | 132 (1.5%) |
| 12:00 PM to 3:59 PM | 1,056 (11.5%) | 856 (10.0%) |
| 4:00 PM to 11:59 PM | 1,072 (11.7%) | 1,085 (12.6%) |
| Total | 9,150 (100.0%) | 8,601 (100.0%) |
Housing Occupancy in York
Occupancy by Ownership in York
Of the total 17,751 dwellings in York, owner-occupied units account for 7,721 (43.5%), while renter-occupied units make up 10,030 (56.5%).
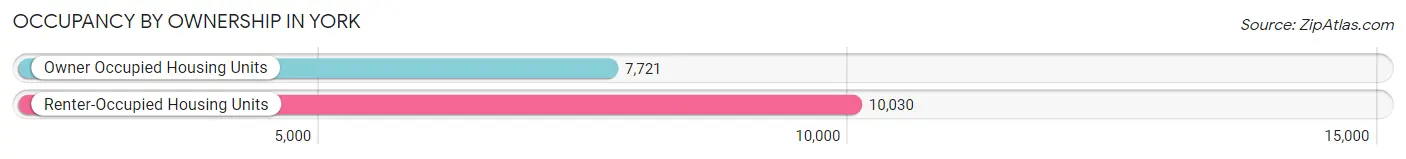
| Occupancy | # Housing Units | % Housing Units |
| Owner Occupied Housing Units | 7,721 | 43.5% |
| Renter-Occupied Housing Units | 10,030 | 56.5% |
| Total Occupied Housing Units | 17,751 | 100.0% |
Occupancy by Household Size in York
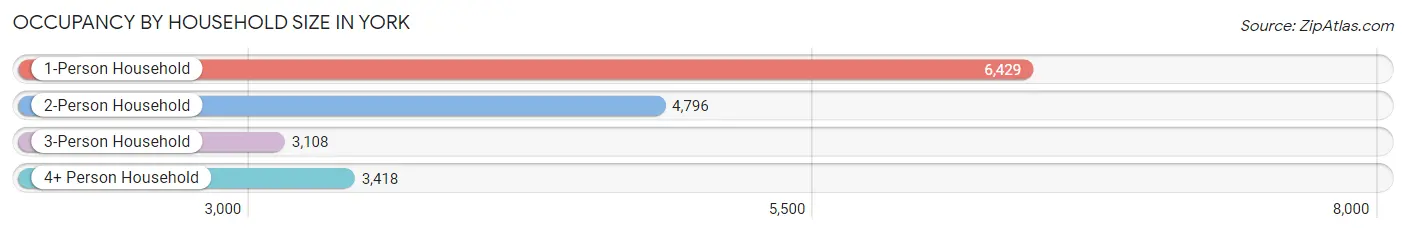
| Household Size | # Housing Units | % Housing Units |
| 1-Person Household | 6,429 | 36.2% |
| 2-Person Household | 4,796 | 27.0% |
| 3-Person Household | 3,108 | 17.5% |
| 4+ Person Household | 3,418 | 19.3% |
| Total Housing Units | 17,751 | 100.0% |
Occupancy by Ownership by Household Size in York
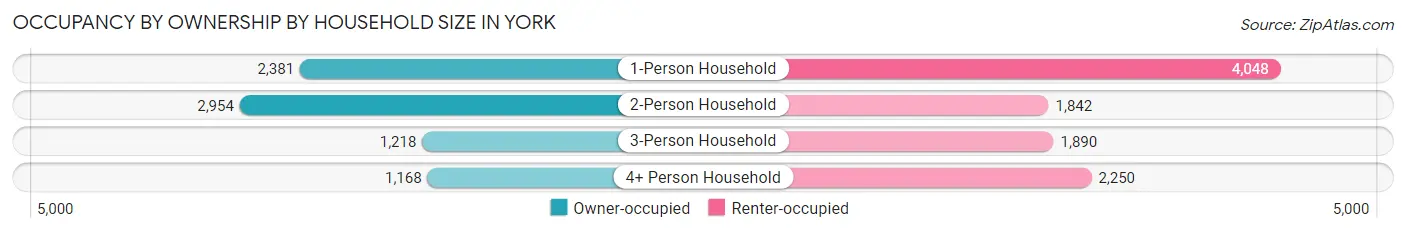
| Household Size | Owner-occupied | Renter-occupied |
| 1-Person Household | 2,381 (37.0%) | 4,048 (63.0%) |
| 2-Person Household | 2,954 (61.6%) | 1,842 (38.4%) |
| 3-Person Household | 1,218 (39.2%) | 1,890 (60.8%) |
| 4+ Person Household | 1,168 (34.2%) | 2,250 (65.8%) |
| Total Housing Units | 7,721 (43.5%) | 10,030 (56.5%) |
Occupancy by Educational Attainment in York
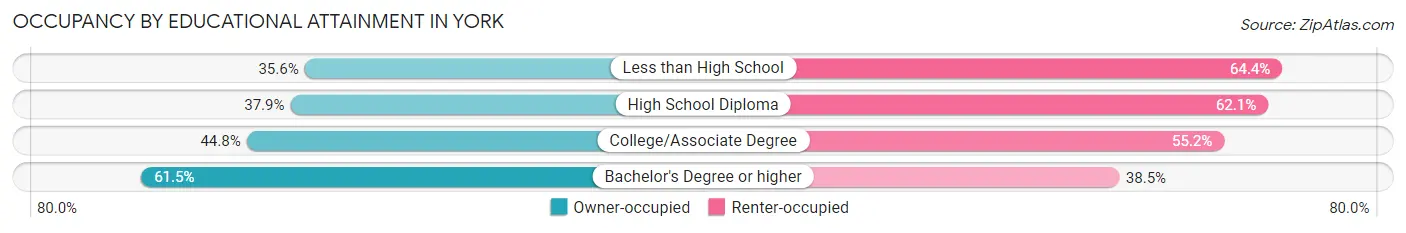
| Household Size | Owner-occupied | Renter-occupied |
| Less than High School | 980 (35.6%) | 1,772 (64.4%) |
| High School Diploma | 2,619 (37.9%) | 4,299 (62.1%) |
| College/Associate Degree | 2,277 (44.8%) | 2,804 (55.2%) |
| Bachelor's Degree or higher | 1,845 (61.5%) | 1,155 (38.5%) |
Occupancy by Age of Householder in York
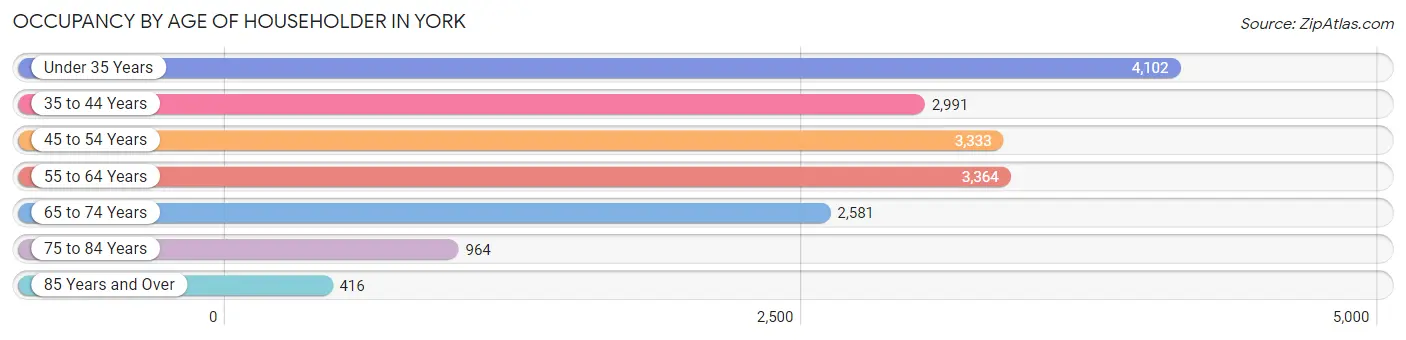
| Age Bracket | # Households | % Households |
| Under 35 Years | 4,102 | 23.1% |
| 35 to 44 Years | 2,991 | 16.9% |
| 45 to 54 Years | 3,333 | 18.8% |
| 55 to 64 Years | 3,364 | 19.0% |
| 65 to 74 Years | 2,581 | 14.5% |
| 75 to 84 Years | 964 | 5.4% |
| 85 Years and Over | 416 | 2.3% |
| Total | 17,751 | 100.0% |
Housing Finances in York
Median Income by Occupancy in York
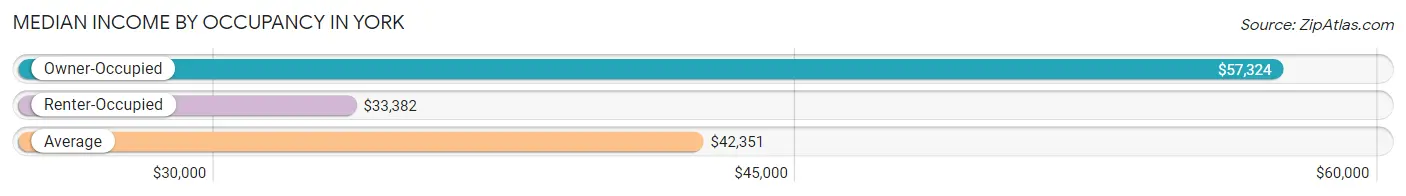
| Occupancy Type | # Households | Median Income |
| Owner-Occupied | 7,721 (43.5%) | $57,324 |
| Renter-Occupied | 10,030 (56.5%) | $33,382 |
| Average | 17,751 (100.0%) | $42,351 |
Occupancy by Householder Income Bracket in York
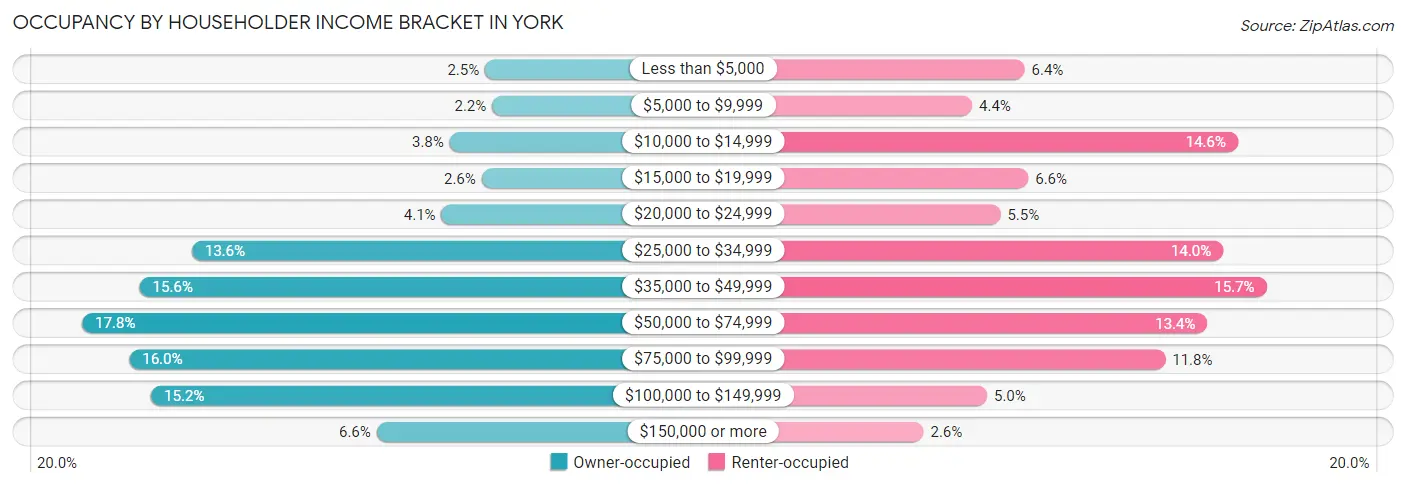
| Income Bracket | Owner-occupied | Renter-occupied |
| Less than $5,000 | 190 (2.5%) | 646 (6.4%) |
| $5,000 to $9,999 | 169 (2.2%) | 445 (4.4%) |
| $10,000 to $14,999 | 294 (3.8%) | 1,460 (14.6%) |
| $15,000 to $19,999 | 200 (2.6%) | 660 (6.6%) |
| $20,000 to $24,999 | 318 (4.1%) | 554 (5.5%) |
| $25,000 to $34,999 | 1,052 (13.6%) | 1,404 (14.0%) |
| $35,000 to $49,999 | 1,206 (15.6%) | 1,570 (15.7%) |
| $50,000 to $74,999 | 1,375 (17.8%) | 1,344 (13.4%) |
| $75,000 to $99,999 | 1,236 (16.0%) | 1,184 (11.8%) |
| $100,000 to $149,999 | 1,172 (15.2%) | 503 (5.0%) |
| $150,000 or more | 509 (6.6%) | 260 (2.6%) |
| Total | 7,721 (100.0%) | 10,030 (100.0%) |
Monthly Housing Cost Tiers in York
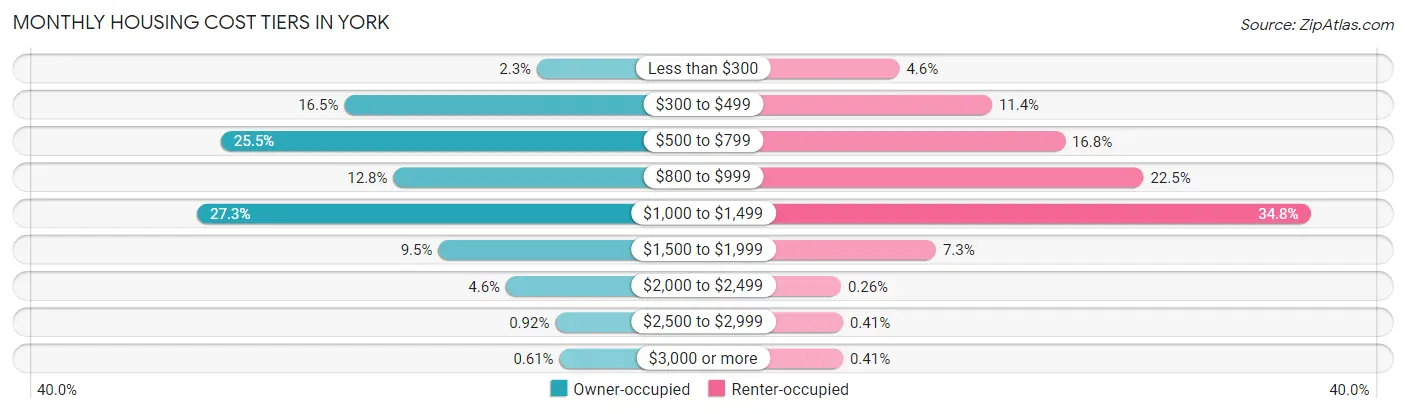
| Monthly Cost | Owner-occupied | Renter-occupied |
| Less than $300 | 175 (2.3%) | 458 (4.6%) |
| $300 to $499 | 1,271 (16.5%) | 1,141 (11.4%) |
| $500 to $799 | 1,972 (25.5%) | 1,681 (16.8%) |
| $800 to $999 | 991 (12.8%) | 2,261 (22.5%) |
| $1,000 to $1,499 | 2,107 (27.3%) | 3,493 (34.8%) |
| $1,500 to $1,999 | 736 (9.5%) | 728 (7.3%) |
| $2,000 to $2,499 | 351 (4.5%) | 26 (0.3%) |
| $2,500 to $2,999 | 71 (0.9%) | 41 (0.4%) |
| $3,000 or more | 47 (0.6%) | 41 (0.4%) |
| Total | 7,721 (100.0%) | 10,030 (100.0%) |
Physical Housing Characteristics in York
Housing Structures in York
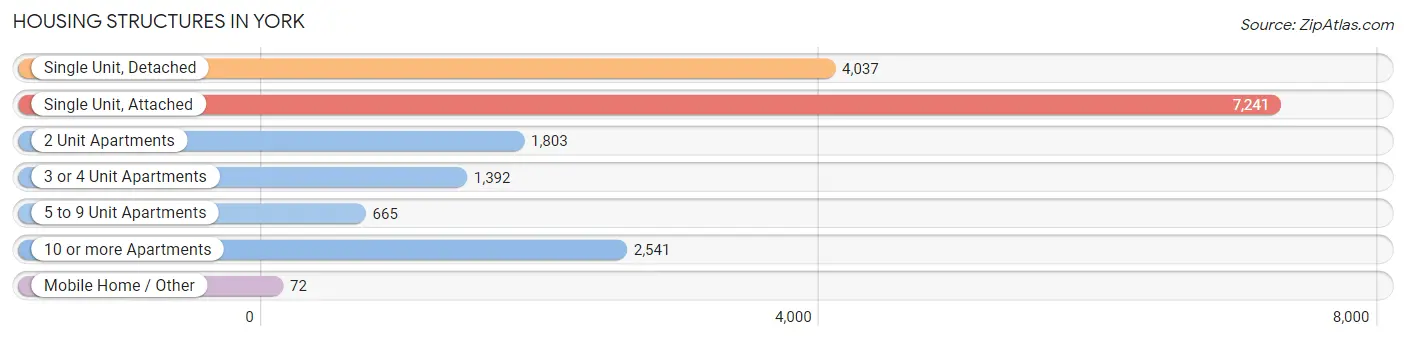
| Structure Type | # Housing Units | % Housing Units |
| Single Unit, Detached | 4,037 | 22.7% |
| Single Unit, Attached | 7,241 | 40.8% |
| 2 Unit Apartments | 1,803 | 10.2% |
| 3 or 4 Unit Apartments | 1,392 | 7.8% |
| 5 to 9 Unit Apartments | 665 | 3.7% |
| 10 or more Apartments | 2,541 | 14.3% |
| Mobile Home / Other | 72 | 0.4% |
| Total | 17,751 | 100.0% |
Housing Structures by Occupancy in York
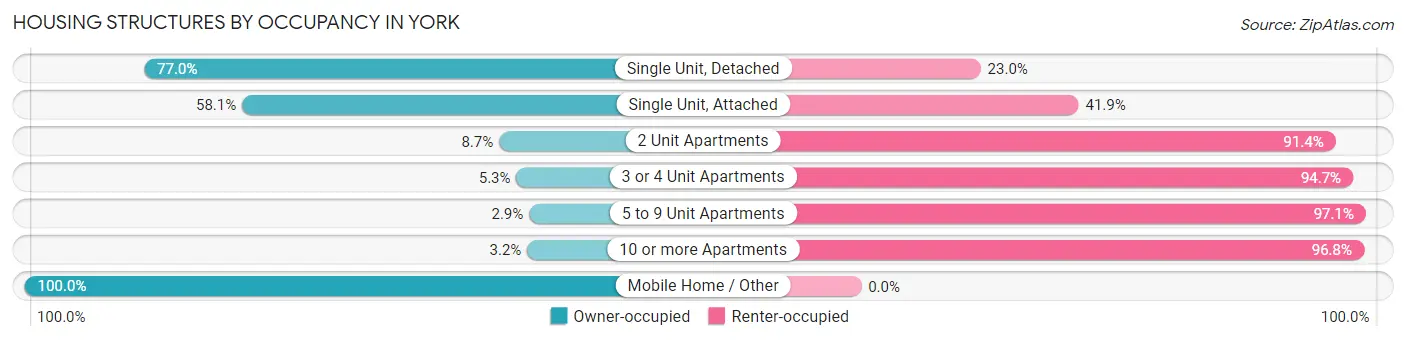
| Structure Type | Owner-occupied | Renter-occupied |
| Single Unit, Detached | 3,108 (77.0%) | 929 (23.0%) |
| Single Unit, Attached | 4,210 (58.1%) | 3,031 (41.9%) |
| 2 Unit Apartments | 156 (8.6%) | 1,647 (91.3%) |
| 3 or 4 Unit Apartments | 74 (5.3%) | 1,318 (94.7%) |
| 5 to 9 Unit Apartments | 19 (2.9%) | 646 (97.1%) |
| 10 or more Apartments | 82 (3.2%) | 2,459 (96.8%) |
| Mobile Home / Other | 72 (100.0%) | 0 (0.0%) |
| Total | 7,721 (43.5%) | 10,030 (56.5%) |
Housing Structures by Number of Rooms in York
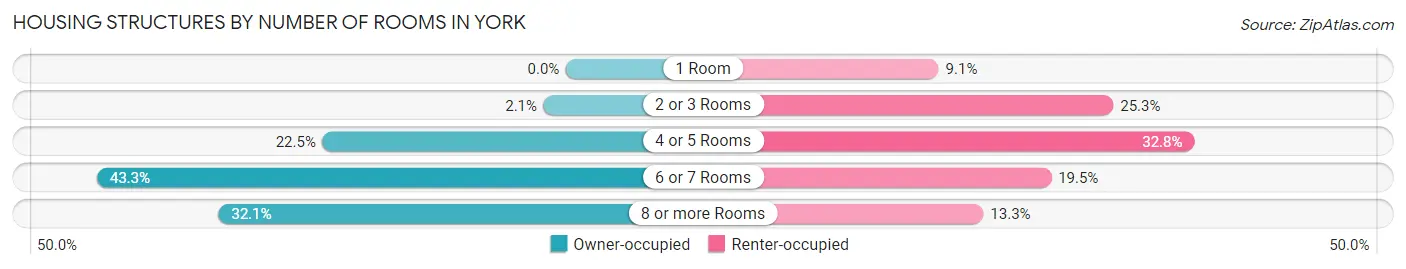
| Number of Rooms | Owner-occupied | Renter-occupied |
| 1 Room | 0 (0.0%) | 916 (9.1%) |
| 2 or 3 Rooms | 160 (2.1%) | 2,536 (25.3%) |
| 4 or 5 Rooms | 1,739 (22.5%) | 3,287 (32.8%) |
| 6 or 7 Rooms | 3,345 (43.3%) | 1,960 (19.5%) |
| 8 or more Rooms | 2,477 (32.1%) | 1,331 (13.3%) |
| Total | 7,721 (100.0%) | 10,030 (100.0%) |
Housing Structure by Heating Type in York
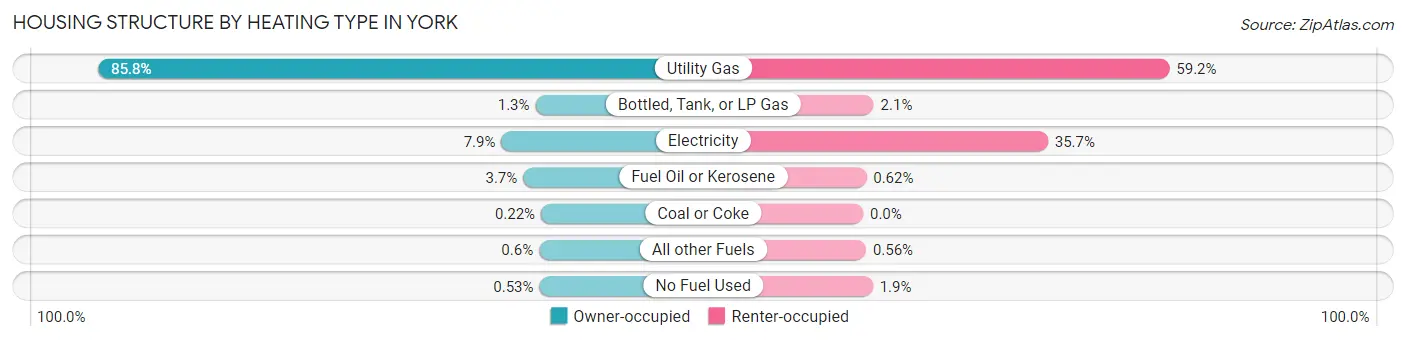
| Heating Type | Owner-occupied | Renter-occupied |
| Utility Gas | 6,625 (85.8%) | 5,937 (59.2%) |
| Bottled, Tank, or LP Gas | 100 (1.3%) | 206 (2.1%) |
| Electricity | 609 (7.9%) | 3,581 (35.7%) |
| Fuel Oil or Kerosene | 283 (3.7%) | 62 (0.6%) |
| Coal or Coke | 17 (0.2%) | 0 (0.0%) |
| All other Fuels | 46 (0.6%) | 56 (0.6%) |
| No Fuel Used | 41 (0.5%) | 188 (1.9%) |
| Total | 7,721 (100.0%) | 10,030 (100.0%) |
Household Vehicle Usage in York
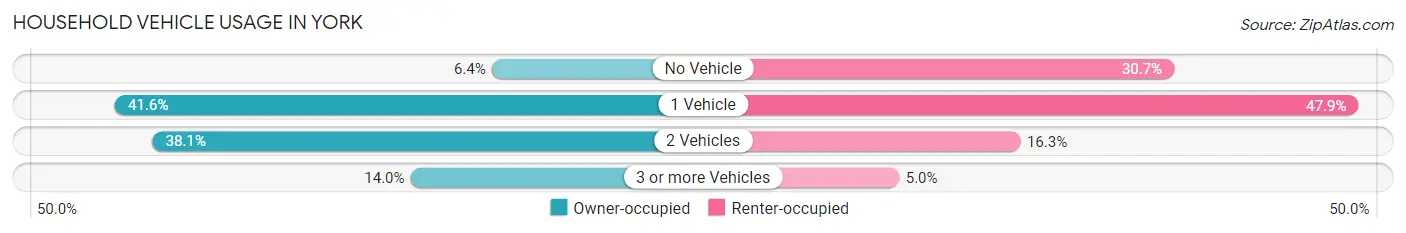
| Vehicles per Household | Owner-occupied | Renter-occupied |
| No Vehicle | 495 (6.4%) | 3,080 (30.7%) |
| 1 Vehicle | 3,208 (41.5%) | 4,806 (47.9%) |
| 2 Vehicles | 2,938 (38.1%) | 1,639 (16.3%) |
| 3 or more Vehicles | 1,080 (14.0%) | 505 (5.0%) |
| Total | 7,721 (100.0%) | 10,030 (100.0%) |
Real Estate & Mortgages in York
Real Estate and Mortgage Overview in York
| Characteristic | Without Mortgage | With Mortgage |
| Housing Units | 3,284 | 4,437 |
| Median Property Value | $84,600 | $99,000 |
| Median Household Income | $47,750 | $349 |
| Monthly Housing Costs | $544 | $47 |
| Real Estate Taxes | $2,472 | $45 |
Property Value by Mortgage Status in York
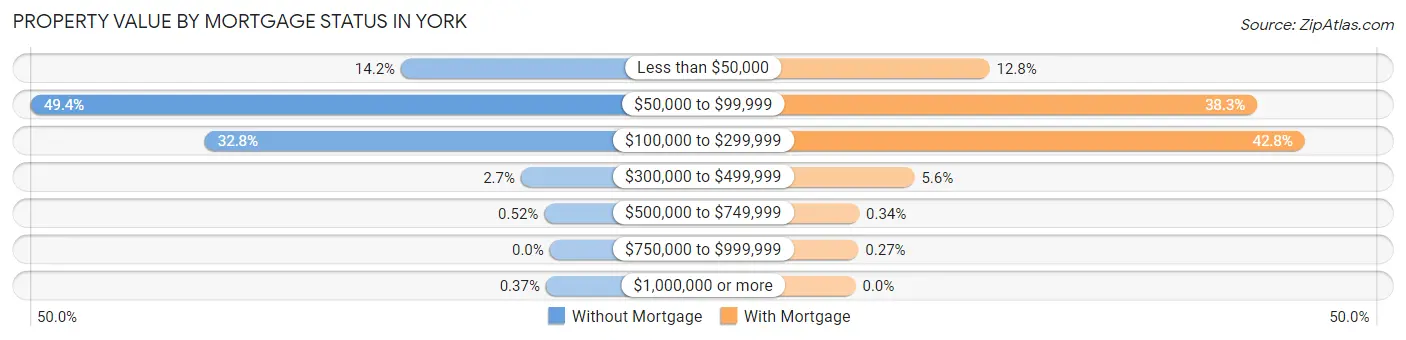
| Property Value | Without Mortgage | With Mortgage |
| Less than $50,000 | 465 (14.2%) | 566 (12.8%) |
| $50,000 to $99,999 | 1,622 (49.4%) | 1,697 (38.3%) |
| $100,000 to $299,999 | 1,078 (32.8%) | 1,898 (42.8%) |
| $300,000 to $499,999 | 90 (2.7%) | 249 (5.6%) |
| $500,000 to $749,999 | 17 (0.5%) | 15 (0.3%) |
| $750,000 to $999,999 | 0 (0.0%) | 12 (0.3%) |
| $1,000,000 or more | 12 (0.4%) | 0 (0.0%) |
| Total | 3,284 (100.0%) | 4,437 (100.0%) |
Household Income by Mortgage Status in York
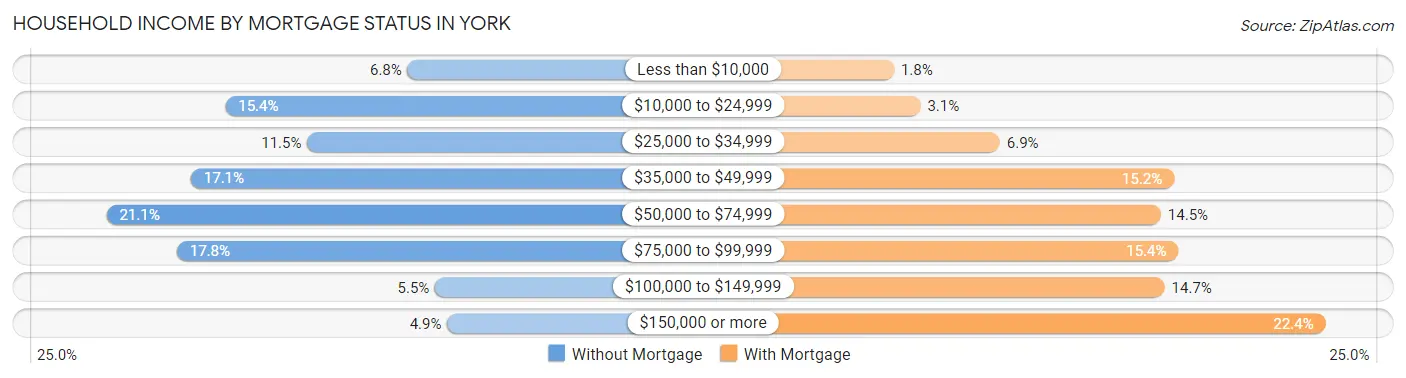
| Household Income | Without Mortgage | With Mortgage |
| Less than $10,000 | 222 (6.8%) | 81 (1.8%) |
| $10,000 to $24,999 | 507 (15.4%) | 137 (3.1%) |
| $25,000 to $34,999 | 379 (11.5%) | 305 (6.9%) |
| $35,000 to $49,999 | 561 (17.1%) | 673 (15.2%) |
| $50,000 to $74,999 | 693 (21.1%) | 645 (14.5%) |
| $75,000 to $99,999 | 583 (17.7%) | 682 (15.4%) |
| $100,000 to $149,999 | 179 (5.4%) | 653 (14.7%) |
| $150,000 or more | 160 (4.9%) | 993 (22.4%) |
| Total | 3,284 (100.0%) | 4,437 (100.0%) |
Property Value to Household Income Ratio in York
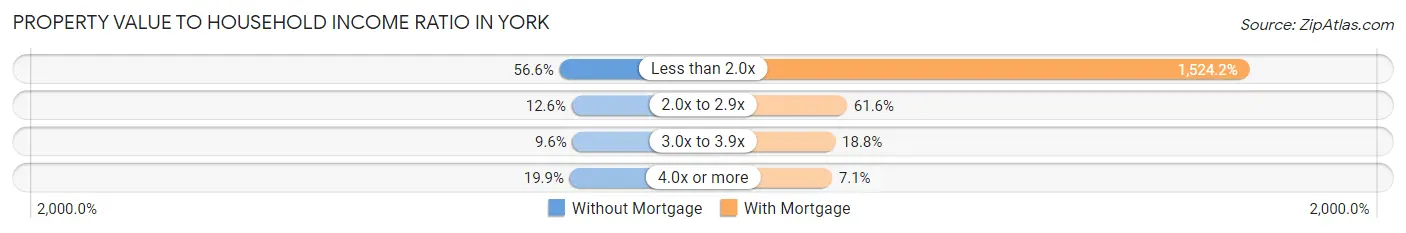
| Value-to-Income Ratio | Without Mortgage | With Mortgage |
| Less than 2.0x | 1,860 (56.6%) | 67,628 (1,524.2%) |
| 2.0x to 2.9x | 414 (12.6%) | 2,732 (61.6%) |
| 3.0x to 3.9x | 314 (9.6%) | 835 (18.8%) |
| 4.0x or more | 652 (19.9%) | 317 (7.1%) |
| Total | 3,284 (100.0%) | 4,437 (100.0%) |
Real Estate Taxes by Mortgage Status in York
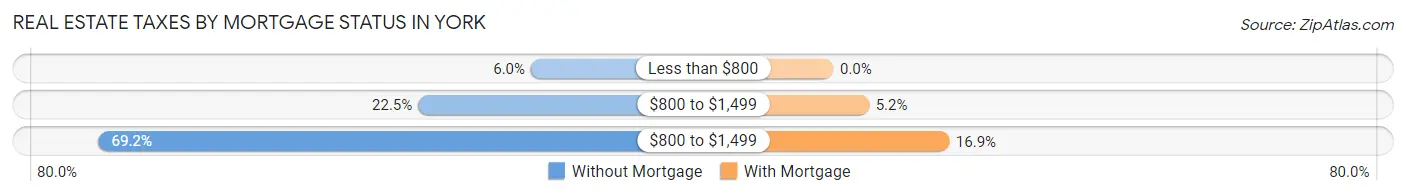
| Property Taxes | Without Mortgage | With Mortgage |
| Less than $800 | 198 (6.0%) | 0 (0.0%) |
| $800 to $1,499 | 739 (22.5%) | 231 (5.2%) |
| $800 to $1,499 | 2,272 (69.2%) | 751 (16.9%) |
| Total | 3,284 (100.0%) | 4,437 (100.0%) |
Health & Disability in York
Health Insurance Coverage by Age in York
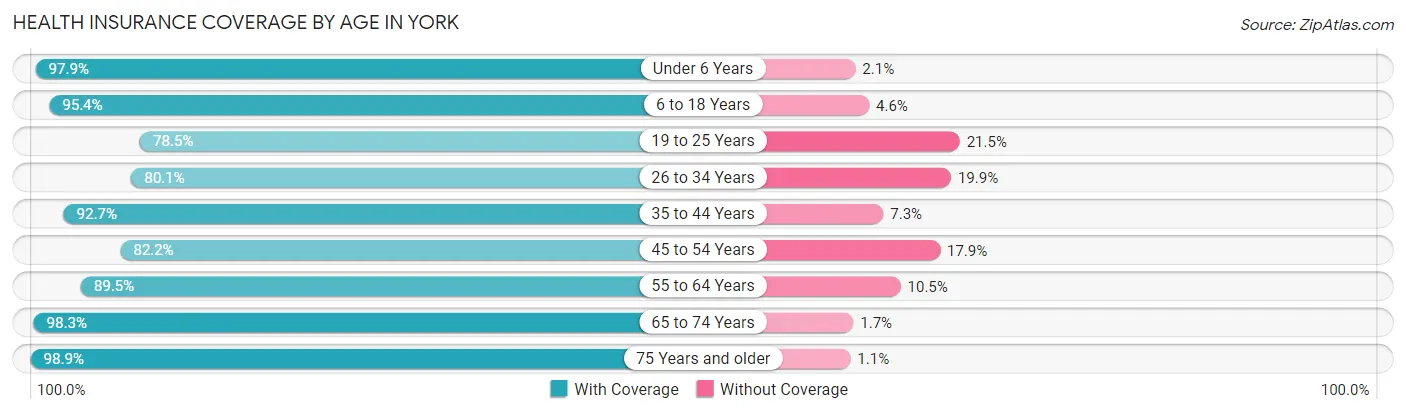
| Age Bracket | With Coverage | Without Coverage |
| Under 6 Years | 3,022 (97.9%) | 64 (2.1%) |
| 6 to 18 Years | 7,779 (95.4%) | 377 (4.6%) |
| 19 to 25 Years | 4,323 (78.5%) | 1,186 (21.5%) |
| 26 to 34 Years | 4,822 (80.1%) | 1,198 (19.9%) |
| 35 to 44 Years | 4,875 (92.7%) | 383 (7.3%) |
| 45 to 54 Years | 4,902 (82.2%) | 1,065 (17.8%) |
| 55 to 64 Years | 4,618 (89.5%) | 542 (10.5%) |
| 65 to 74 Years | 3,555 (98.3%) | 61 (1.7%) |
| 75 Years and older | 1,825 (98.9%) | 21 (1.1%) |
| Total | 39,721 (89.0%) | 4,897 (11.0%) |
Health Insurance Coverage by Citizenship Status in York
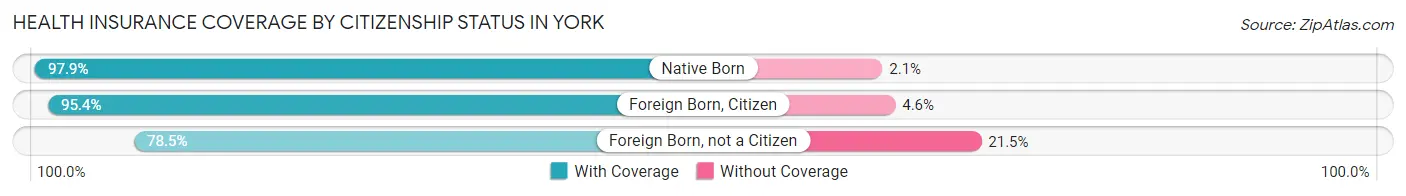
| Citizenship Status | With Coverage | Without Coverage |
| Native Born | 3,022 (97.9%) | 64 (2.1%) |
| Foreign Born, Citizen | 7,779 (95.4%) | 377 (4.6%) |
| Foreign Born, not a Citizen | 4,323 (78.5%) | 1,186 (21.5%) |
Health Insurance Coverage by Household Income in York
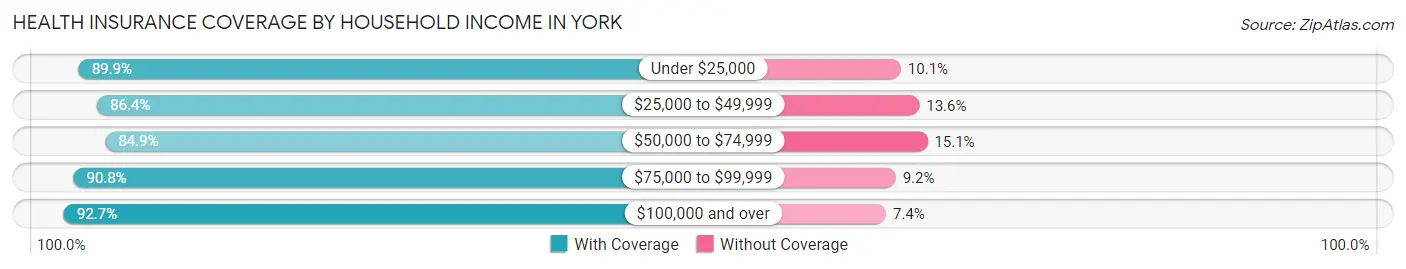
| Household Income | With Coverage | Without Coverage |
| Under $25,000 | 7,940 (89.9%) | 896 (10.1%) |
| $25,000 to $49,999 | 10,151 (86.4%) | 1,596 (13.6%) |
| $50,000 to $74,999 | 5,937 (84.9%) | 1,057 (15.1%) |
| $75,000 to $99,999 | 6,883 (90.8%) | 694 (9.2%) |
| $100,000 and over | 7,730 (92.6%) | 613 (7.3%) |
Public vs Private Health Insurance Coverage by Age in York
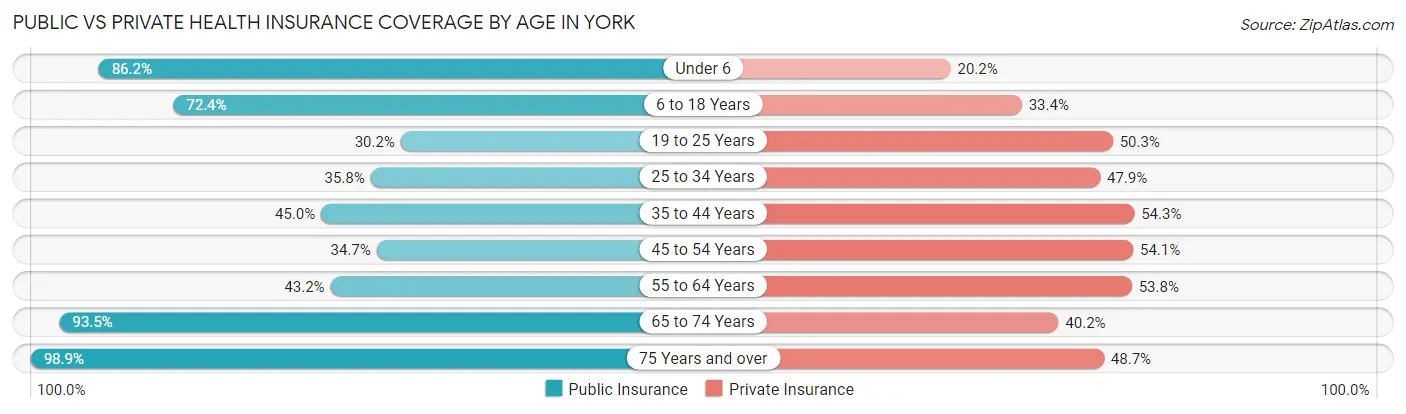
| Age Bracket | Public Insurance | Private Insurance |
| Under 6 | 2,661 (86.2%) | 623 (20.2%) |
| 6 to 18 Years | 5,903 (72.4%) | 2,724 (33.4%) |
| 19 to 25 Years | 1,663 (30.2%) | 2,770 (50.3%) |
| 25 to 34 Years | 2,154 (35.8%) | 2,886 (47.9%) |
| 35 to 44 Years | 2,364 (45.0%) | 2,854 (54.3%) |
| 45 to 54 Years | 2,069 (34.7%) | 3,226 (54.1%) |
| 55 to 64 Years | 2,231 (43.2%) | 2,777 (53.8%) |
| 65 to 74 Years | 3,382 (93.5%) | 1,454 (40.2%) |
| 75 Years and over | 1,825 (98.9%) | 898 (48.6%) |
| Total | 24,252 (54.3%) | 20,212 (45.3%) |
Disability Status by Sex by Age in York
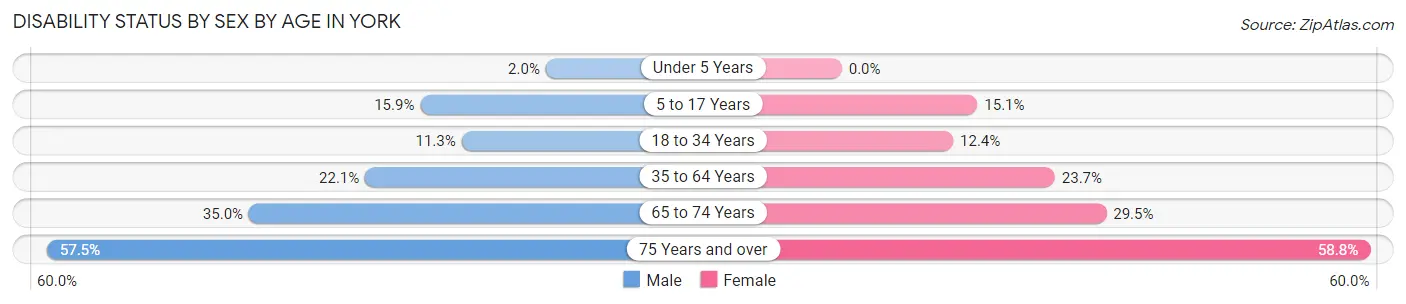
| Age Bracket | Male | Female |
| Under 5 Years | 32 (2.0%) | 0 (0.0%) |
| 5 to 17 Years | 715 (15.9%) | 507 (15.1%) |
| 18 to 34 Years | 681 (11.3%) | 777 (12.4%) |
| 35 to 64 Years | 1,729 (22.1%) | 2,030 (23.7%) |
| 65 to 74 Years | 616 (35.0%) | 547 (29.5%) |
| 75 Years and over | 348 (57.5%) | 730 (58.8%) |
Disability Class by Sex by Age in York
Disability Class: Hearing Difficulty
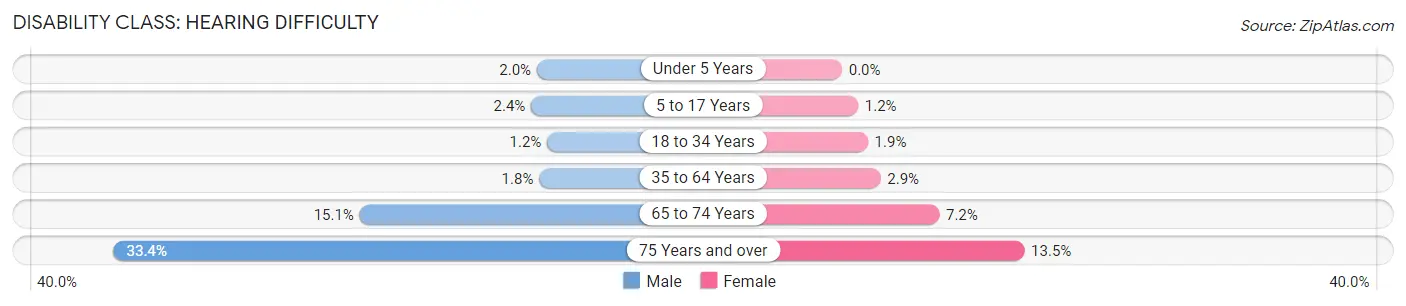
| Age Bracket | Male | Female |
| Under 5 Years | 32 (2.0%) | 0 (0.0%) |
| 5 to 17 Years | 107 (2.4%) | 40 (1.2%) |
| 18 to 34 Years | 72 (1.2%) | 120 (1.9%) |
| 35 to 64 Years | 140 (1.8%) | 245 (2.9%) |
| 65 to 74 Years | 266 (15.1%) | 134 (7.2%) |
| 75 Years and over | 202 (33.4%) | 168 (13.5%) |
Disability Class: Vision Difficulty
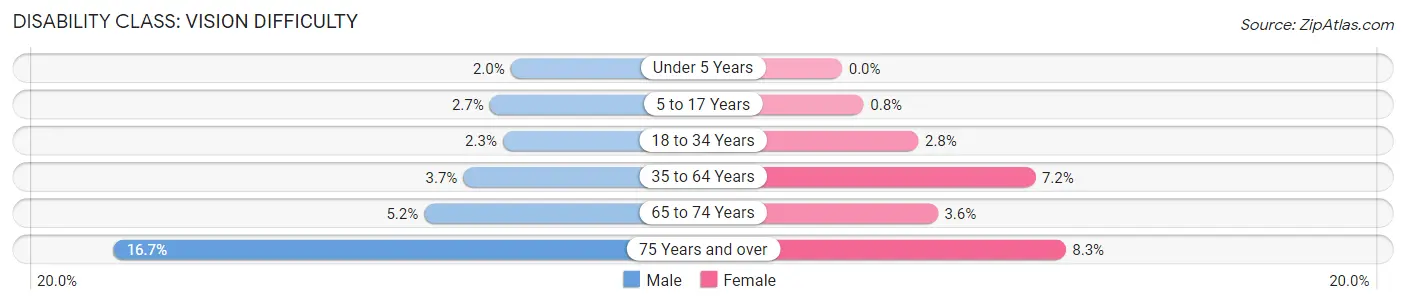
| Age Bracket | Male | Female |
| Under 5 Years | 32 (2.0%) | 0 (0.0%) |
| 5 to 17 Years | 123 (2.7%) | 27 (0.8%) |
| 18 to 34 Years | 135 (2.2%) | 177 (2.8%) |
| 35 to 64 Years | 291 (3.7%) | 613 (7.2%) |
| 65 to 74 Years | 91 (5.2%) | 66 (3.5%) |
| 75 Years and over | 101 (16.7%) | 103 (8.3%) |
Disability Class: Cognitive Difficulty
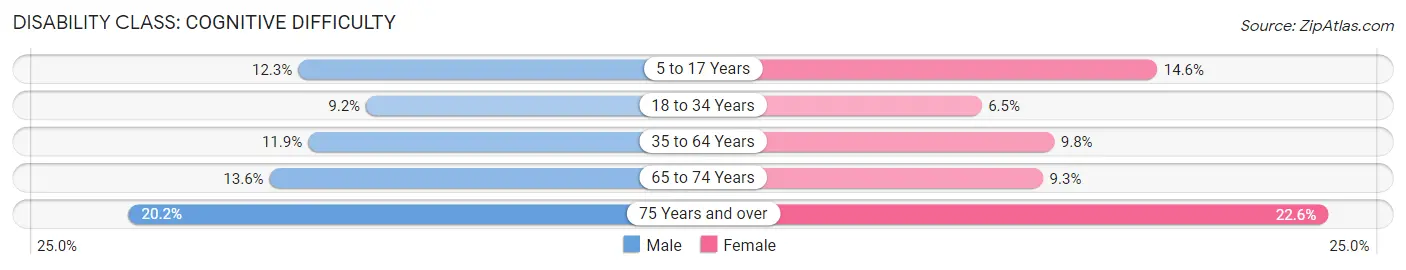
| Age Bracket | Male | Female |
| 5 to 17 Years | 552 (12.3%) | 491 (14.6%) |
| 18 to 34 Years | 550 (9.2%) | 405 (6.5%) |
| 35 to 64 Years | 928 (11.8%) | 842 (9.8%) |
| 65 to 74 Years | 240 (13.6%) | 173 (9.3%) |
| 75 Years and over | 122 (20.2%) | 280 (22.6%) |
Disability Class: Ambulatory Difficulty
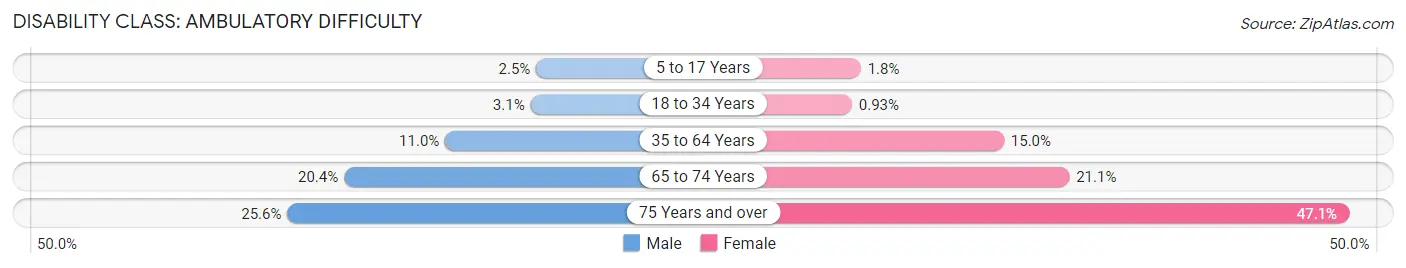
| Age Bracket | Male | Female |
| 5 to 17 Years | 113 (2.5%) | 59 (1.8%) |
| 18 to 34 Years | 183 (3.0%) | 58 (0.9%) |
| 35 to 64 Years | 859 (11.0%) | 1,286 (15.0%) |
| 65 to 74 Years | 358 (20.3%) | 392 (21.1%) |
| 75 Years and over | 155 (25.6%) | 584 (47.1%) |
Disability Class: Self-Care Difficulty
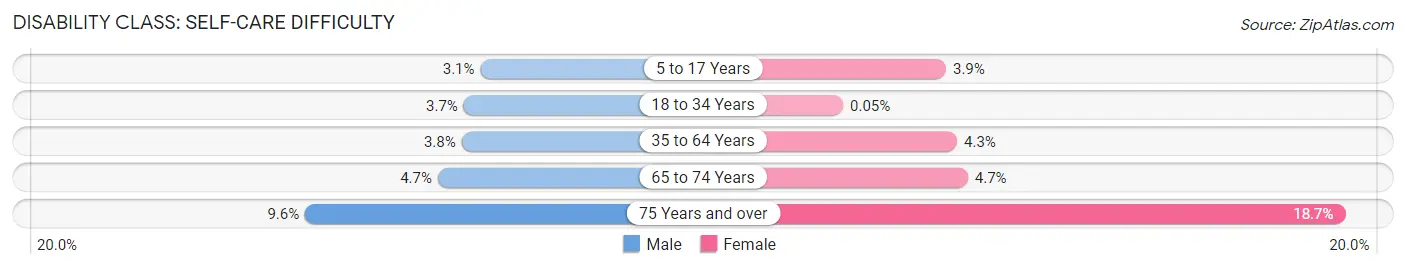
| Age Bracket | Male | Female |
| 5 to 17 Years | 138 (3.1%) | 130 (3.9%) |
| 18 to 34 Years | 222 (3.7%) | 3 (0.1%) |
| 35 to 64 Years | 296 (3.8%) | 366 (4.3%) |
| 65 to 74 Years | 82 (4.7%) | 87 (4.7%) |
| 75 Years and over | 58 (9.6%) | 232 (18.7%) |
Technology Access in York
Computing Device Access in York
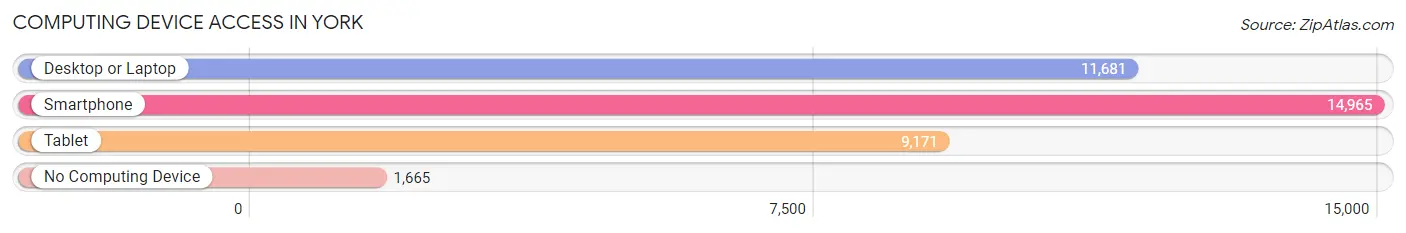
| Device Type | # Households | % Households |
| Desktop or Laptop | 11,681 | 65.8% |
| Smartphone | 14,965 | 84.3% |
| Tablet | 9,171 | 51.7% |
| No Computing Device | 1,665 | 9.4% |
| Total | 17,751 | 100.0% |
Internet Access in York
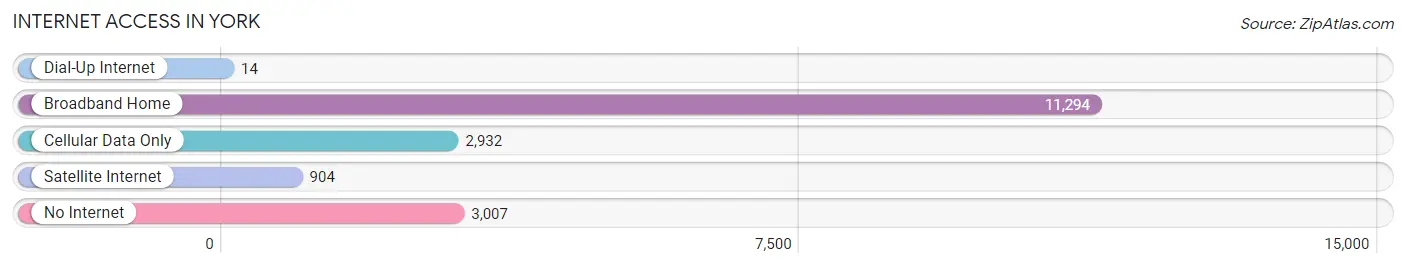
| Internet Type | # Households | % Households |
| Dial-Up Internet | 14 | 0.1% |
| Broadband Home | 11,294 | 63.6% |
| Cellular Data Only | 2,932 | 16.5% |
| Satellite Internet | 904 | 5.1% |
| No Internet | 3,007 | 16.9% |
| Total | 17,751 | 100.0% |
York Summary
York, Pennsylvania is a city located in the south-central region of the state. It is the county seat of York County and is located in the Susquehanna Valley, a region of the Appalachian Mountains. The city is situated along the Susquehanna River and is home to a population of approximately 43,000 people.
History
York was founded in 1741 by settlers from Philadelphia. The city was named after the English city of York, and was the first capital of the newly formed United States of America from 1777 to 1778. During the American Revolution, York was the site of the Continental Congress and the Articles of Confederation were drafted here.
The city was an important industrial center during the 19th century, with the York Manufacturing Company producing carriages, wagons, and other products. The city was also a major railroad hub, with the Northern Central Railway connecting York to Baltimore and Philadelphia.
Geography
York is located in south-central Pennsylvania, approximately 50 miles south of Harrisburg and 90 miles west of Philadelphia. The city is situated along the Susquehanna River and is surrounded by rolling hills and farmland. The city has a total area of 8.3 square miles, with a population density of 5,200 people per square mile.
Economy
York is a major industrial center in the region, with a variety of manufacturing and service industries. The city is home to several large employers, including York International, a manufacturer of heating and cooling equipment, and Glatfelter, a paper products manufacturer. The city is also home to a variety of small businesses, including restaurants, retail stores, and professional services.
Demographics
As of the 2010 census, the population of York was 43,718. The racial makeup of the city was 79.2% White, 13.3% African American, 0.4% Native American, 1.2% Asian, 0.1% Pacific Islander, 3.2% from other races, and 2.7% from two or more races. Hispanic or Latino of any race were 6.3% of the population.
The median income for a household in York was $37,837, and the median income for a family was $45,945. The per capita income for the city was $20,945. About 16.2% of families and 19.3% of the population were below the poverty line, including 28.2% of those under age 18 and 8.7% of those age 65 or over.
York is a diverse city, with a variety of cultures and backgrounds represented. The city is home to a large Amish population, as well as a growing Hispanic population. The city is also home to a variety of religious denominations, including Catholic, Lutheran, and Methodist.
Common Questions
What is Per Capita Income in York?
Per Capita income in York is $23,681.
What is the Median Family Income in York?
Median Family Income in York is $48,500.
What is the Median Household income in York?
Median Household Income in York is $42,351.
What is Income or Wage Gap in York?
Income or Wage Gap in York is 13.3%.
Women in York earn 86.7 cents for every dollar earned by a man.
What is Family Income Deficit in York?
Family Income Deficit in York is $12,181.
Families that are below poverty line in York earn $12,181 less on average than the poverty threshold level.
What is Inequality or Gini Index in York?
Inequality or Gini Index in York is 0.45.
What is the Total Population of York?
Total Population of York is 44,782.
What is the Total Male Population of York?
Total Male Population of York is 22,444.
What is the Total Female Population of York?
Total Female Population of York is 22,338.
What is the Ratio of Males per 100 Females in York?
There are 100.47 Males per 100 Females in York.
What is the Ratio of Females per 100 Males in York?
There are 99.53 Females per 100 Males in York.
What is the Median Population Age in York?
Median Population Age in York is 34.3 Years.
What is the Average Family Size in York
Average Family Size in York is 3.3 People.
What is the Average Household Size in York
Average Household Size in York is 2.5 People.
How Large is the Labor Force in York?
There are 22,726 People in the Labor Forcein in York.
What is the Percentage of People in the Labor Force in York?
64.5% of People are in the Labor Force in York.
What is the Unemployment Rate in York?
Unemployment Rate in York is 12.0%.