Easton, PA Map & Demographics
Easton Map
Easton Overview
$29,083
PER CAPITA INCOME
$76,563
AVG FAMILY INCOME
$62,642
AVG HOUSEHOLD INCOME
22.8%
WAGE / INCOME GAP [ % ]
77.2¢/ $1
WAGE / INCOME GAP [ $ ]
$10,997
FAMILY INCOME DEFICIT
0.43
INEQUALITY / GINI INDEX
28,883
TOTAL POPULATION
14,556
MALE POPULATION
14,327
FEMALE POPULATION
101.60
MALES / 100 FEMALES
98.43
FEMALES / 100 MALES
35.5
MEDIAN AGE
3.1
AVG FAMILY SIZE
2.4
AVG HOUSEHOLD SIZE
14,789
LABOR FORCE [ PEOPLE ]
60.5%
PERCENT IN LABOR FORCE
4.4%
UNEMPLOYMENT RATE
Income in Easton
Income Overview in Easton
Per Capita Income in Easton is $29,083, while median incomes of families and households are $76,563 and $62,642 respectively.
| Characteristic | Number | Measure |
| Per Capita Income | 28,883 | $29,083 |
| Median Family Income | 6,211 | $76,563 |
| Mean Family Income | 6,211 | $95,952 |
| Median Household Income | 10,442 | $62,642 |
| Mean Household Income | 10,442 | $78,495 |
| Income Deficit | 6,211 | $10,997 |
| Wage / Income Gap (%) | 28,883 | 22.82% |
| Wage / Income Gap ($) | 28,883 | 77.18¢ per $1 |
| Gini / Inequality Index | 28,883 | 0.43 |
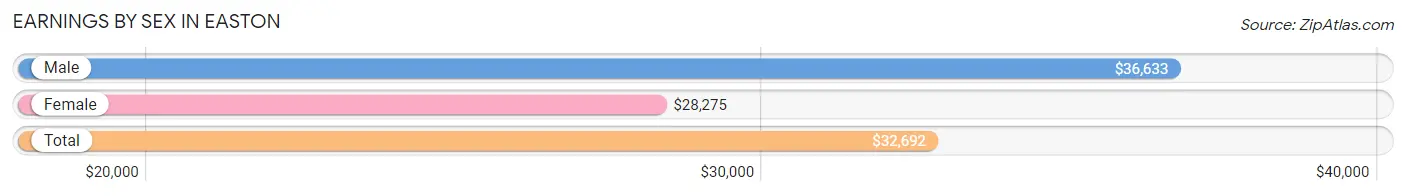
Earnings by Sex in Easton
Average Earnings in Easton are $32,692, $36,633 for men and $28,275 for women, a difference of 22.8%.
| Sex | Number | Average Earnings |
| Male | 8,506 (51.5%) | $36,633 |
| Female | 7,994 (48.4%) | $28,275 |
| Total | 16,500 (100.0%) | $32,692 |
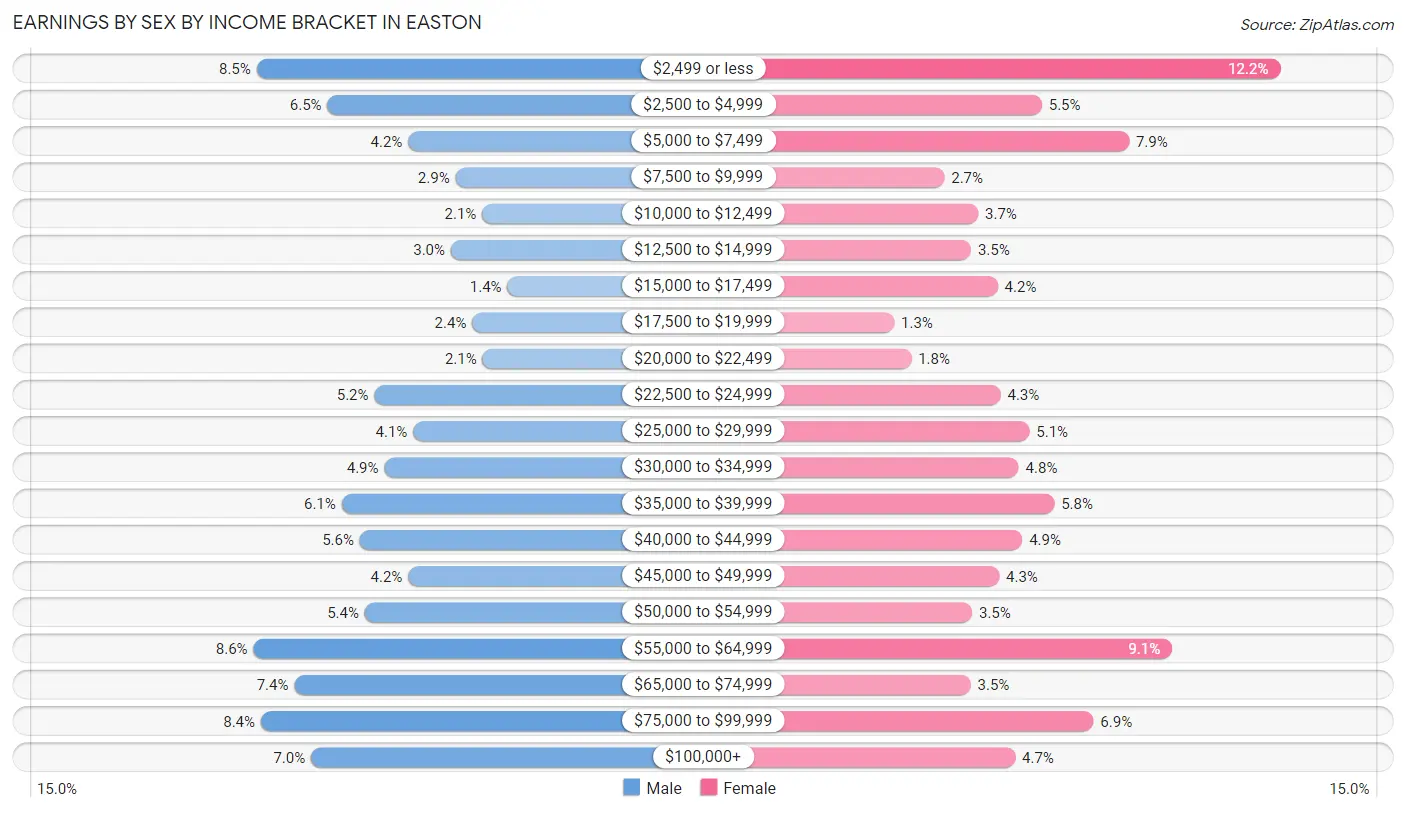
Earnings by Sex by Income Bracket in Easton
The most common earnings brackets in Easton are $55,000 to $64,999 for men (729 | 8.6%) and $2,499 or less for women (974 | 12.2%).
| Income | Male | Female |
| $2,499 or less | 721 (8.5%) | 974 (12.2%) |
| $2,500 to $4,999 | 552 (6.5%) | 438 (5.5%) |
| $5,000 to $7,499 | 359 (4.2%) | 634 (7.9%) |
| $7,500 to $9,999 | 246 (2.9%) | 219 (2.7%) |
| $10,000 to $12,499 | 182 (2.1%) | 295 (3.7%) |
| $12,500 to $14,999 | 257 (3.0%) | 279 (3.5%) |
| $15,000 to $17,499 | 122 (1.4%) | 339 (4.2%) |
| $17,500 to $19,999 | 206 (2.4%) | 106 (1.3%) |
| $20,000 to $22,499 | 181 (2.1%) | 145 (1.8%) |
| $22,500 to $24,999 | 440 (5.2%) | 345 (4.3%) |
| $25,000 to $29,999 | 347 (4.1%) | 410 (5.1%) |
| $30,000 to $34,999 | 416 (4.9%) | 386 (4.8%) |
| $35,000 to $39,999 | 518 (6.1%) | 466 (5.8%) |
| $40,000 to $44,999 | 475 (5.6%) | 394 (4.9%) |
| $45,000 to $49,999 | 359 (4.2%) | 342 (4.3%) |
| $50,000 to $54,999 | 463 (5.4%) | 281 (3.5%) |
| $55,000 to $64,999 | 729 (8.6%) | 731 (9.1%) |
| $65,000 to $74,999 | 631 (7.4%) | 278 (3.5%) |
| $75,000 to $99,999 | 711 (8.4%) | 554 (6.9%) |
| $100,000+ | 591 (7.0%) | 378 (4.7%) |
| Total | 8,506 (100.0%) | 7,994 (100.0%) |
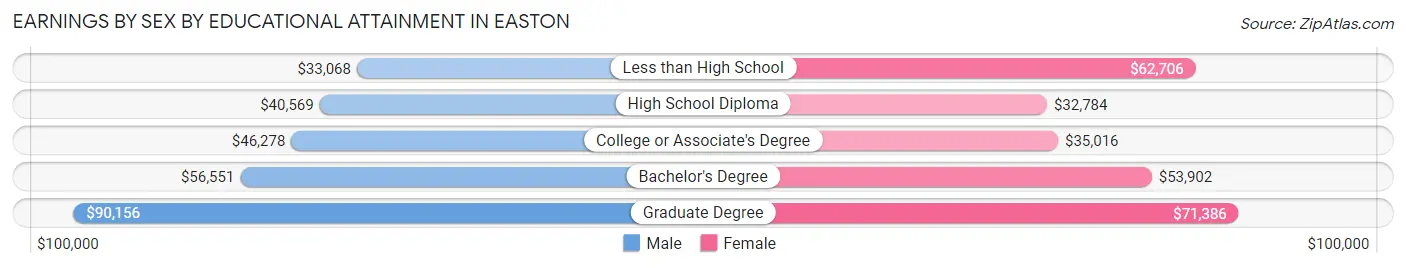
Earnings by Sex by Educational Attainment in Easton
Average earnings in Easton are $46,164 for men and $39,757 for women, a difference of 13.9%. Men with an educational attainment of graduate degree enjoy the highest average annual earnings of $90,156, while those with less than high school education earn the least with $33,068. Women with an educational attainment of graduate degree earn the most with the average annual earnings of $71,386, while those with high school diploma education have the smallest earnings of $32,784.
| Educational Attainment | Male Income | Female Income |
| Less than High School | $33,068 | $62,706 |
| High School Diploma | $40,569 | $32,784 |
| College or Associate's Degree | $46,278 | $35,016 |
| Bachelor's Degree | $56,551 | $53,902 |
| Graduate Degree | $90,156 | $71,386 |
| Total | $46,164 | $39,757 |
Family Income in Easton
Family Income Brackets in Easton
According to the Easton family income data, there are 1,043 families falling into the $50,000 to $74,999 income range, which is the most common income bracket and makes up 16.8% of all families. Conversely, the $10,000 to $14,999 income bracket is the least frequent group with only 149 families (2.4%) belonging to this category.
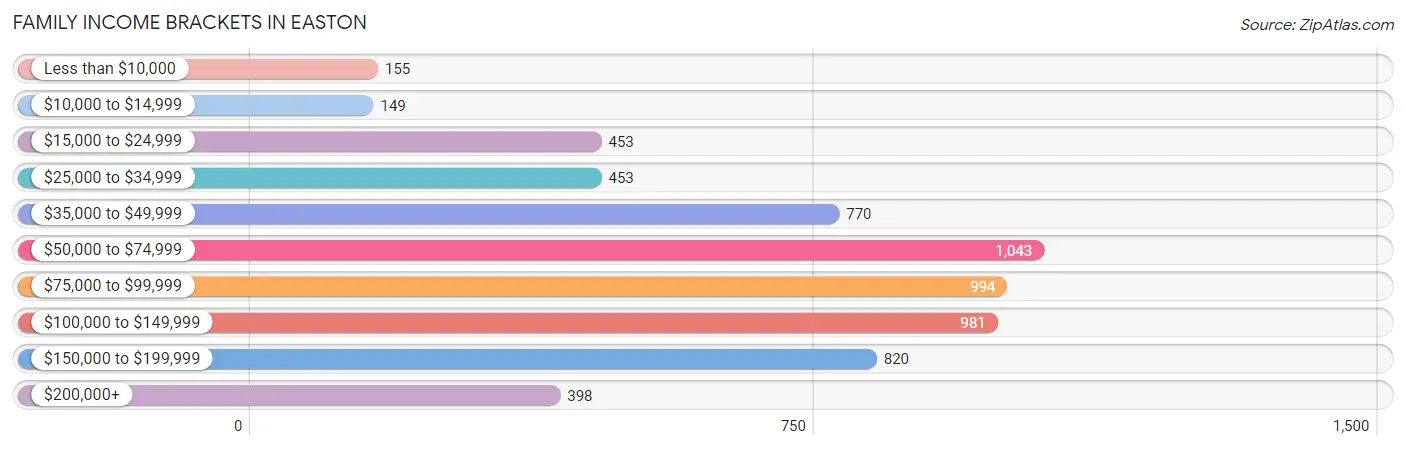
| Income Bracket | # Families | % Families |
| Less than $10,000 | 155 | 2.5% |
| $10,000 to $14,999 | 149 | 2.4% |
| $15,000 to $24,999 | 453 | 7.3% |
| $25,000 to $34,999 | 453 | 7.3% |
| $35,000 to $49,999 | 770 | 12.4% |
| $50,000 to $74,999 | 1,043 | 16.8% |
| $75,000 to $99,999 | 994 | 16.0% |
| $100,000 to $149,999 | 981 | 15.8% |
| $150,000 to $199,999 | 820 | 13.2% |
| $200,000+ | 398 | 6.4% |
Family Income by Famaliy Size in Easton
6-person families (136 | 2.2%) account for the highest median family income in Easton with $81,250 per family, while 2-person families (2,682 | 43.2%) have the highest median income of $39,172 per family member.
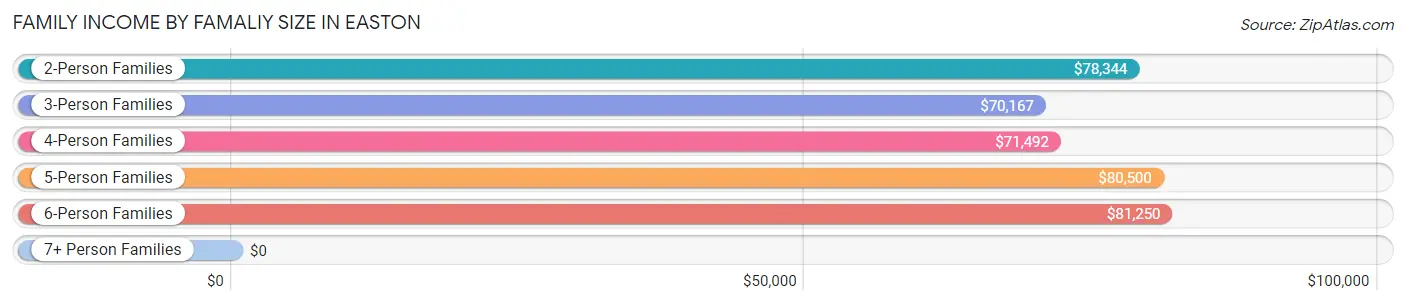
| Income Bracket | # Families | Median Income |
| 2-Person Families | 2,682 (43.2%) | $78,344 |
| 3-Person Families | 1,520 (24.5%) | $70,167 |
| 4-Person Families | 1,195 (19.2%) | $71,492 |
| 5-Person Families | 428 (6.9%) | $80,500 |
| 6-Person Families | 136 (2.2%) | $81,250 |
| 7+ Person Families | 250 (4.0%) | $0 |
| Total | 6,211 (100.0%) | $76,563 |
Family Income by Number of Earners in Easton
The median family income in Easton is $76,563, with families comprising 2 earners (2,480) having the highest median family income of $108,095, while families with no earners (677) have the lowest median family income of $36,309, accounting for 39.9% and 10.9% of families, respectively.
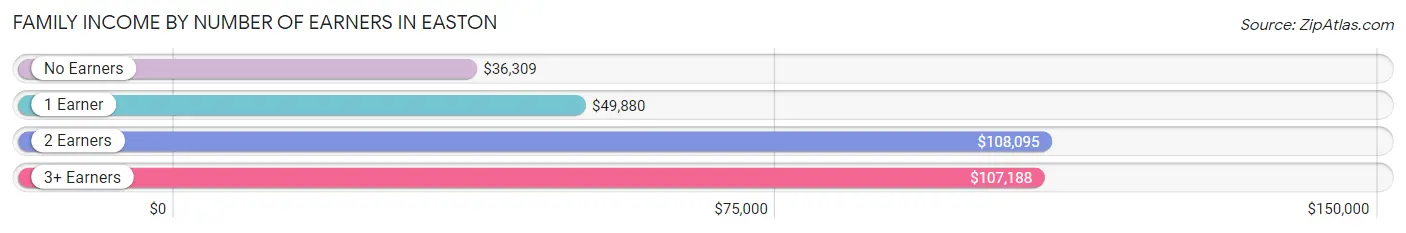
| Number of Earners | # Families | Median Income |
| No Earners | 677 (10.9%) | $36,309 |
| 1 Earner | 2,045 (32.9%) | $49,880 |
| 2 Earners | 2,480 (39.9%) | $108,095 |
| 3+ Earners | 1,009 (16.3%) | $107,188 |
| Total | 6,211 (100.0%) | $76,563 |
Household Income in Easton
Household Income Brackets in Easton
With 1,953 households falling in the category, the $50,000 to $74,999 income range is the most frequent in Easton, accounting for 18.7% of all households. In contrast, only 386 households (3.7%) fall into the $10,000 to $14,999 income bracket, making it the least populous group.
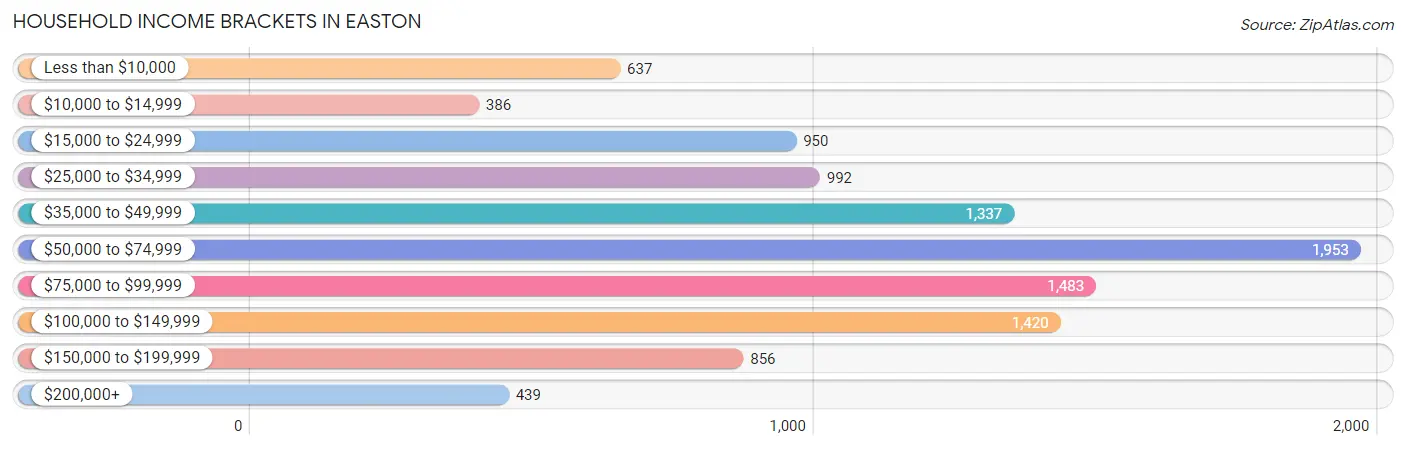
| Income Bracket | # Households | % Households |
| Less than $10,000 | 637 | 6.1% |
| $10,000 to $14,999 | 386 | 3.7% |
| $15,000 to $24,999 | 950 | 9.1% |
| $25,000 to $34,999 | 992 | 9.5% |
| $35,000 to $49,999 | 1,337 | 12.8% |
| $50,000 to $74,999 | 1,953 | 18.7% |
| $75,000 to $99,999 | 1,483 | 14.2% |
| $100,000 to $149,999 | 1,420 | 13.6% |
| $150,000 to $199,999 | 856 | 8.2% |
| $200,000+ | 439 | 4.2% |
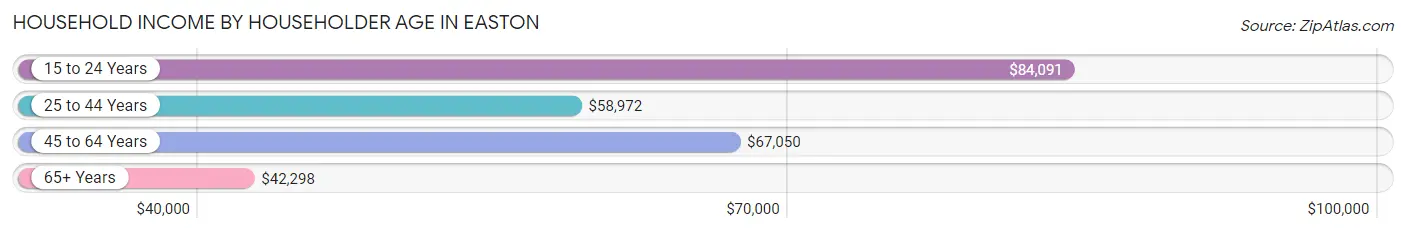
Household Income by Householder Age in Easton
The median household income in Easton is $62,642, with the highest median household income of $84,091 found in the 15 to 24 years age bracket for the primary householder. A total of 334 households (3.2%) fall into this category. Meanwhile, the 65+ years age bracket for the primary householder has the lowest median household income of $42,298, with 2,419 households (23.2%) in this group.
| Income Bracket | # Households | Median Income |
| 15 to 24 Years | 334 (3.2%) | $84,091 |
| 25 to 44 Years | 3,884 (37.2%) | $58,972 |
| 45 to 64 Years | 3,805 (36.4%) | $67,050 |
| 65+ Years | 2,419 (23.2%) | $42,298 |
| Total | 10,442 (100.0%) | $62,642 |
Poverty in Easton
Income Below Poverty by Sex and Age in Easton
With 17.6% poverty level for males and 15.5% for females among the residents of Easton, 5 year old males and 15 year old females are the most vulnerable to poverty, with 32 males (31.7%) and 84 females (50.6%) in their respective age groups living below the poverty level.
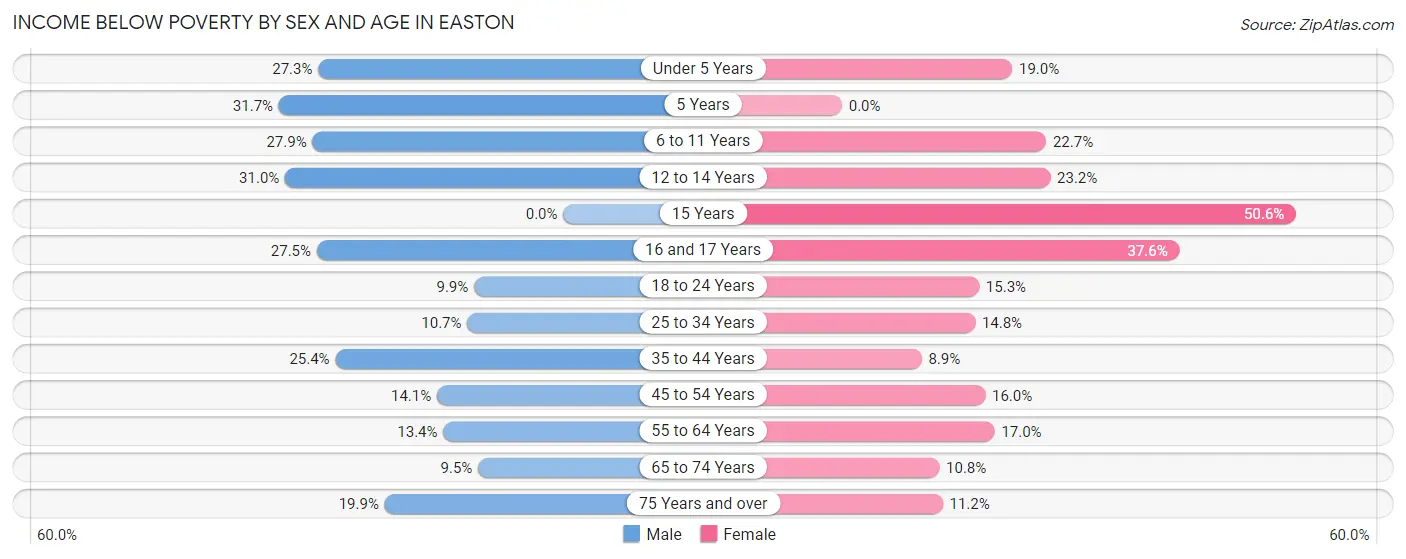
| Age Bracket | Male | Female |
| Under 5 Years | 140 (27.3%) | 98 (19.0%) |
| 5 Years | 32 (31.7%) | 0 (0.0%) |
| 6 to 11 Years | 273 (27.9%) | 206 (22.7%) |
| 12 to 14 Years | 162 (31.0%) | 74 (23.2%) |
| 15 Years | 0 (0.0%) | 84 (50.6%) |
| 16 and 17 Years | 143 (27.5%) | 132 (37.6%) |
| 18 to 24 Years | 106 (9.9%) | 200 (15.3%) |
| 25 to 34 Years | 202 (10.7%) | 226 (14.8%) |
| 35 to 44 Years | 483 (25.4%) | 184 (8.9%) |
| 45 to 54 Years | 222 (14.1%) | 250 (16.0%) |
| 55 to 64 Years | 216 (13.4%) | 254 (17.0%) |
| 65 to 74 Years | 99 (9.5%) | 147 (10.8%) |
| 75 Years and over | 107 (19.9%) | 102 (11.2%) |
| Total | 2,185 (17.6%) | 1,957 (15.5%) |
Income Above Poverty by Sex and Age in Easton
According to the poverty statistics in Easton, males aged 15 years and females aged 5 years are the age groups that are most secure financially, with 100.0% of males and 100.0% of females in these age groups living above the poverty line.
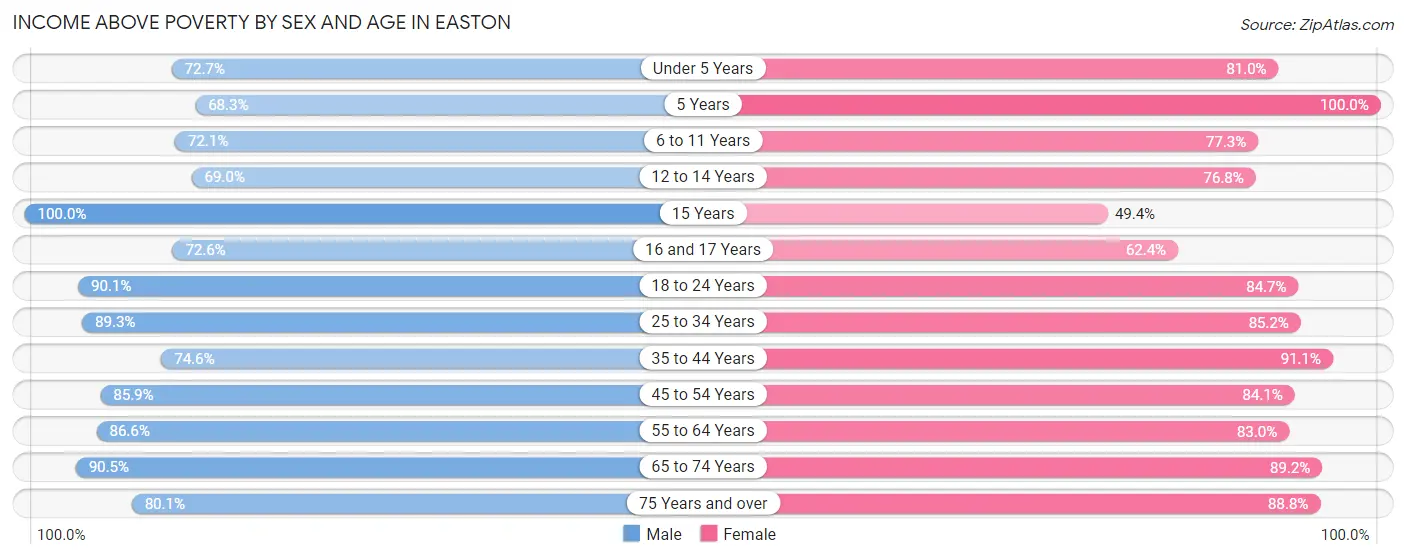
| Age Bracket | Male | Female |
| Under 5 Years | 373 (72.7%) | 419 (81.0%) |
| 5 Years | 69 (68.3%) | 143 (100.0%) |
| 6 to 11 Years | 704 (72.1%) | 700 (77.3%) |
| 12 to 14 Years | 361 (69.0%) | 245 (76.8%) |
| 15 Years | 148 (100.0%) | 82 (49.4%) |
| 16 and 17 Years | 378 (72.6%) | 219 (62.4%) |
| 18 to 24 Years | 960 (90.1%) | 1,110 (84.7%) |
| 25 to 34 Years | 1,687 (89.3%) | 1,298 (85.2%) |
| 35 to 44 Years | 1,420 (74.6%) | 1,891 (91.1%) |
| 45 to 54 Years | 1,356 (85.9%) | 1,317 (84.1%) |
| 55 to 64 Years | 1,401 (86.6%) | 1,240 (83.0%) |
| 65 to 74 Years | 944 (90.5%) | 1,209 (89.2%) |
| 75 Years and over | 431 (80.1%) | 807 (88.8%) |
| Total | 10,232 (82.4%) | 10,680 (84.5%) |
Income Below Poverty Among Married-Couple Families in Easton
The poverty statistics for married-couple families in Easton show that 7.1% or 262 of the total 3,704 families live below the poverty line. Families with 5 or more children have the highest poverty rate of 100.0%, comprising of 39 families. On the other hand, families with no children have the lowest poverty rate of 5.4%, which includes 127 families.
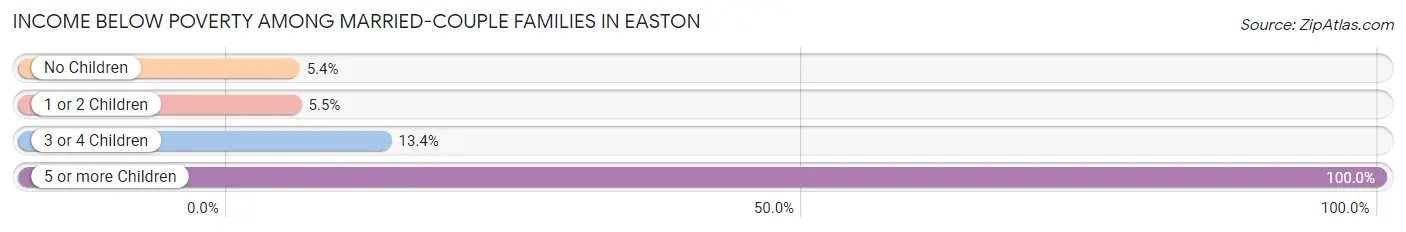
| Children | Above Poverty | Below Poverty |
| No Children | 2,237 (94.6%) | 127 (5.4%) |
| 1 or 2 Children | 939 (94.5%) | 55 (5.5%) |
| 3 or 4 Children | 266 (86.6%) | 41 (13.4%) |
| 5 or more Children | 0 (0.0%) | 39 (100.0%) |
| Total | 3,442 (92.9%) | 262 (7.1%) |
Income Below Poverty Among Single-Parent Households in Easton
According to the poverty data in Easton, 8.0% or 49 single-father households and 21.6% or 409 single-mother households are living below the poverty line. Among single-father households, those with 3 or 4 children have the highest poverty rate, with 14 households (43.8%) experiencing poverty. Likewise, among single-mother households, those with 3 or 4 children have the highest poverty rate, with 184 households (60.7%) falling below the poverty line.
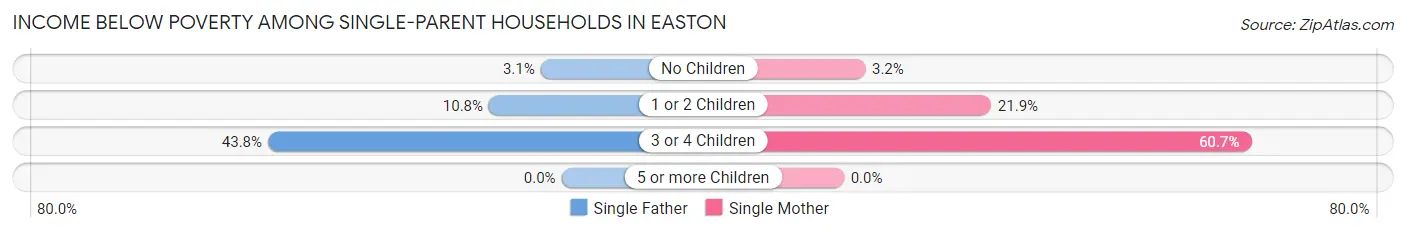
| Children | Single Father | Single Mother |
| No Children | 10 (3.1%) | 21 (3.2%) |
| 1 or 2 Children | 25 (10.8%) | 204 (21.9%) |
| 3 or 4 Children | 14 (43.8%) | 184 (60.7%) |
| 5 or more Children | 0 (0.0%) | 0 (0.0%) |
| Total | 49 (8.0%) | 409 (21.6%) |
Income Below Poverty Among Married-Couple vs Single-Parent Households in Easton
The poverty data for Easton shows that 262 of the married-couple family households (7.1%) and 458 of the single-parent households (18.3%) are living below the poverty level. Within the married-couple family households, those with 5 or more children have the highest poverty rate, with 39 households (100.0%) falling below the poverty line. Among the single-parent households, those with 3 or 4 children have the highest poverty rate, with 198 household (59.1%) living below poverty.
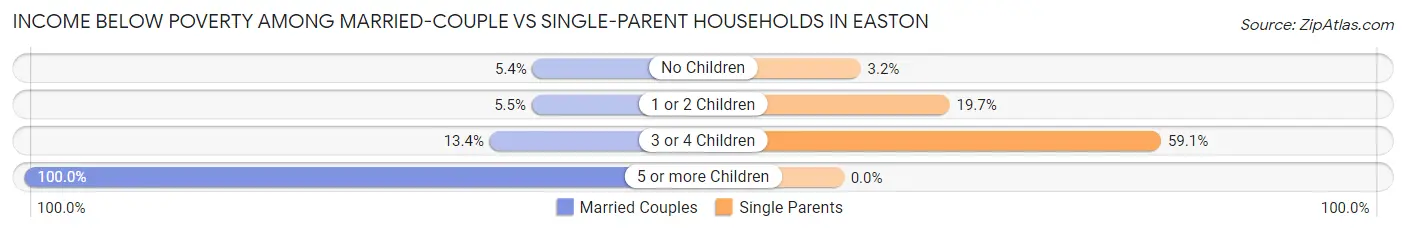
| Children | Married-Couple Families | Single-Parent Households |
| No Children | 127 (5.4%) | 31 (3.2%) |
| 1 or 2 Children | 55 (5.5%) | 229 (19.7%) |
| 3 or 4 Children | 41 (13.4%) | 198 (59.1%) |
| 5 or more Children | 39 (100.0%) | 0 (0.0%) |
| Total | 262 (7.1%) | 458 (18.3%) |
Race in Easton
The most populous races in Easton are White / Caucasian (17,332 | 60.0%), Hispanic or Latino (6,704 | 23.2%), and Black / African American (4,437 | 15.4%).
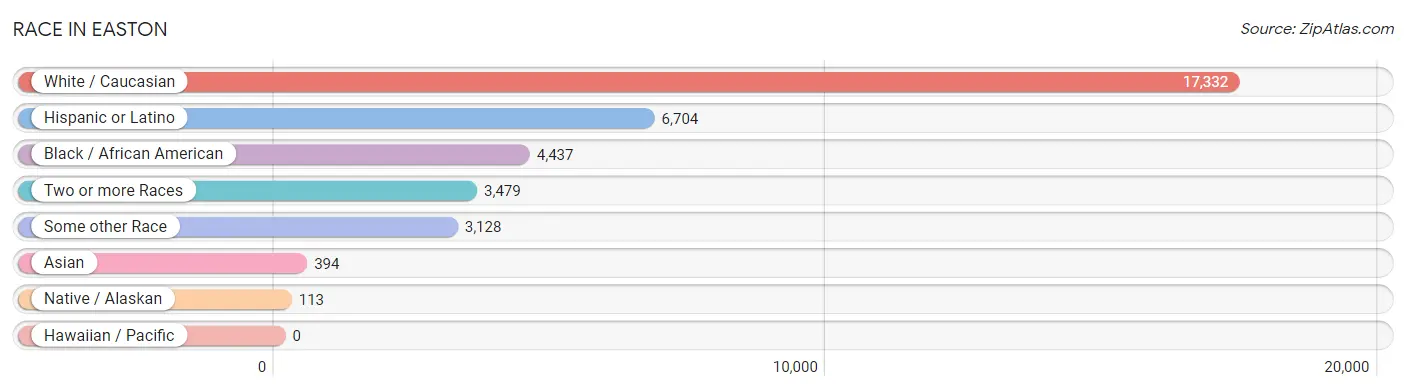
| Race | # Population | % Population |
| Asian | 394 | 1.4% |
| Black / African American | 4,437 | 15.4% |
| Hawaiian / Pacific | 0 | 0.0% |
| Hispanic or Latino | 6,704 | 23.2% |
| Native / Alaskan | 113 | 0.4% |
| White / Caucasian | 17,332 | 60.0% |
| Two or more Races | 3,479 | 12.0% |
| Some other Race | 3,128 | 10.8% |
| Total | 28,883 | 100.0% |
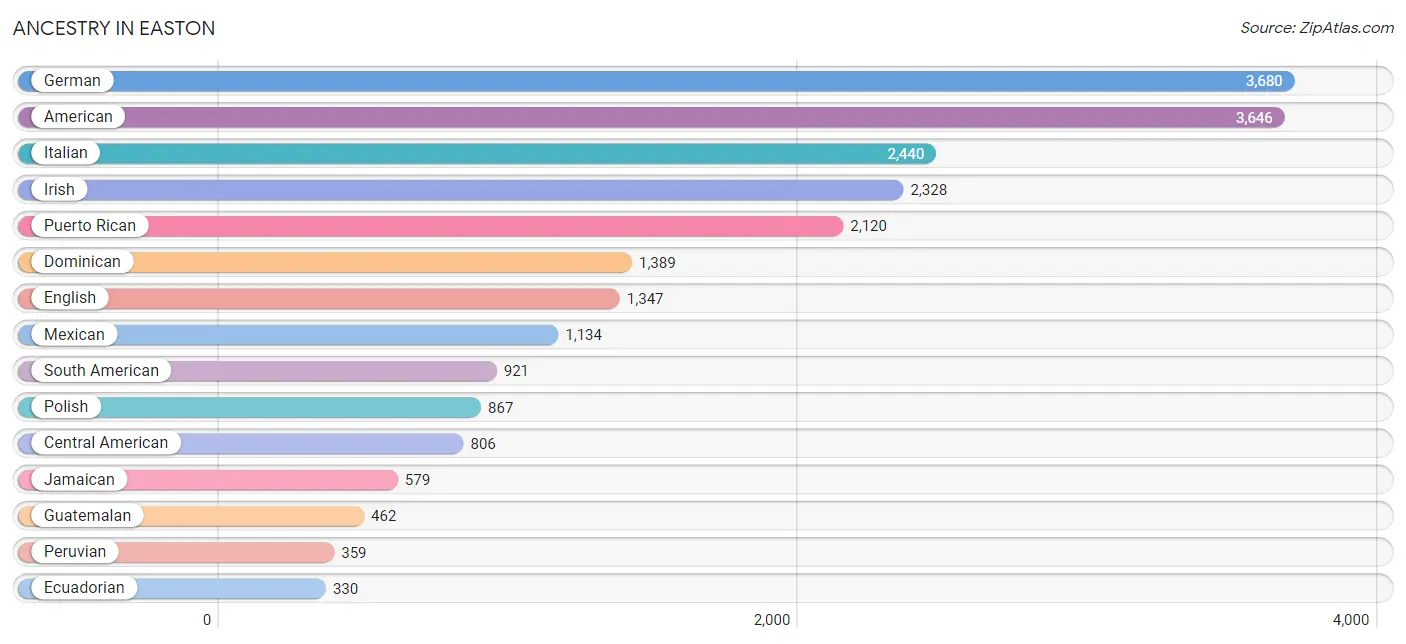
Ancestry in Easton
The most populous ancestries reported in Easton are German (3,680 | 12.7%), American (3,646 | 12.6%), Italian (2,440 | 8.5%), Irish (2,328 | 8.1%), and Puerto Rican (2,120 | 7.3%), together accounting for 49.2% of all Easton residents.
| Ancestry | # Population | % Population |
| African | 3 | 0.0% |
| Albanian | 7 | 0.0% |
| American | 3,646 | 12.6% |
| Arab | 211 | 0.7% |
| Argentinean | 47 | 0.2% |
| Armenian | 20 | 0.1% |
| Australian | 8 | 0.0% |
| Austrian | 84 | 0.3% |
| Belgian | 4 | 0.0% |
| Bhutanese | 26 | 0.1% |
| Brazilian | 5 | 0.0% |
| British | 293 | 1.0% |
| British West Indian | 216 | 0.7% |
| Burmese | 31 | 0.1% |
| Canadian | 94 | 0.3% |
| Central American | 806 | 2.8% |
| Cherokee | 2 | 0.0% |
| Chinese | 7 | 0.0% |
| Chippewa | 11 | 0.0% |
| Colombian | 101 | 0.4% |
| Costa Rican | 44 | 0.2% |
| Croatian | 3 | 0.0% |
| Cuban | 113 | 0.4% |
| Czech | 66 | 0.2% |
| Czechoslovakian | 3 | 0.0% |
| Danish | 25 | 0.1% |
| Dominican | 1,389 | 4.8% |
| Dutch | 223 | 0.8% |
| Eastern European | 77 | 0.3% |
| Ecuadorian | 330 | 1.1% |
| Egyptian | 41 | 0.1% |
| English | 1,347 | 4.7% |
| Ethiopian | 7 | 0.0% |
| European | 131 | 0.4% |
| Finnish | 27 | 0.1% |
| French | 276 | 1.0% |
| French Canadian | 25 | 0.1% |
| German | 3,680 | 12.7% |
| Greek | 22 | 0.1% |
| Guamanian / Chamorro | 7 | 0.0% |
| Guatemalan | 462 | 1.6% |
| Haitian | 36 | 0.1% |
| Honduran | 56 | 0.2% |
| Hungarian | 247 | 0.9% |
| Indian (Asian) | 124 | 0.4% |
| Irish | 2,328 | 8.1% |
| Italian | 2,440 | 8.5% |
| Jamaican | 579 | 2.0% |
| Korean | 124 | 0.4% |
| Lebanese | 128 | 0.4% |
| Liberian | 4 | 0.0% |
| Lithuanian | 167 | 0.6% |
| Malaysian | 3 | 0.0% |
| Mexican | 1,134 | 3.9% |
| Mexican American Indian | 109 | 0.4% |
| Moroccan | 10 | 0.0% |
| Native Hawaiian | 1 | 0.0% |
| Navajo | 9 | 0.0% |
| Nigerian | 17 | 0.1% |
| Northern European | 147 | 0.5% |
| Norwegian | 191 | 0.7% |
| Panamanian | 19 | 0.1% |
| Pennsylvania German | 251 | 0.9% |
| Peruvian | 359 | 1.2% |
| Polish | 867 | 3.0% |
| Portuguese | 94 | 0.3% |
| Pueblo | 7 | 0.0% |
| Puerto Rican | 2,120 | 7.3% |
| Romanian | 11 | 0.0% |
| Russian | 149 | 0.5% |
| Salvadoran | 225 | 0.8% |
| Scandinavian | 34 | 0.1% |
| Scotch-Irish | 180 | 0.6% |
| Scottish | 186 | 0.6% |
| Slavic | 9 | 0.0% |
| Slovak | 106 | 0.4% |
| Slovene | 12 | 0.0% |
| South American | 921 | 3.2% |
| Spanish | 8 | 0.0% |
| Sri Lankan | 42 | 0.2% |
| Subsaharan African | 60 | 0.2% |
| Swedish | 290 | 1.0% |
| Syrian | 2 | 0.0% |
| Thai | 97 | 0.3% |
| Trinidadian and Tobagonian | 91 | 0.3% |
| Turkish | 2 | 0.0% |
| Ukrainian | 159 | 0.5% |
| Venezuelan | 84 | 0.3% |
| Welsh | 304 | 1.1% |
| West Indian | 15 | 0.1% | View All 90 Rows |
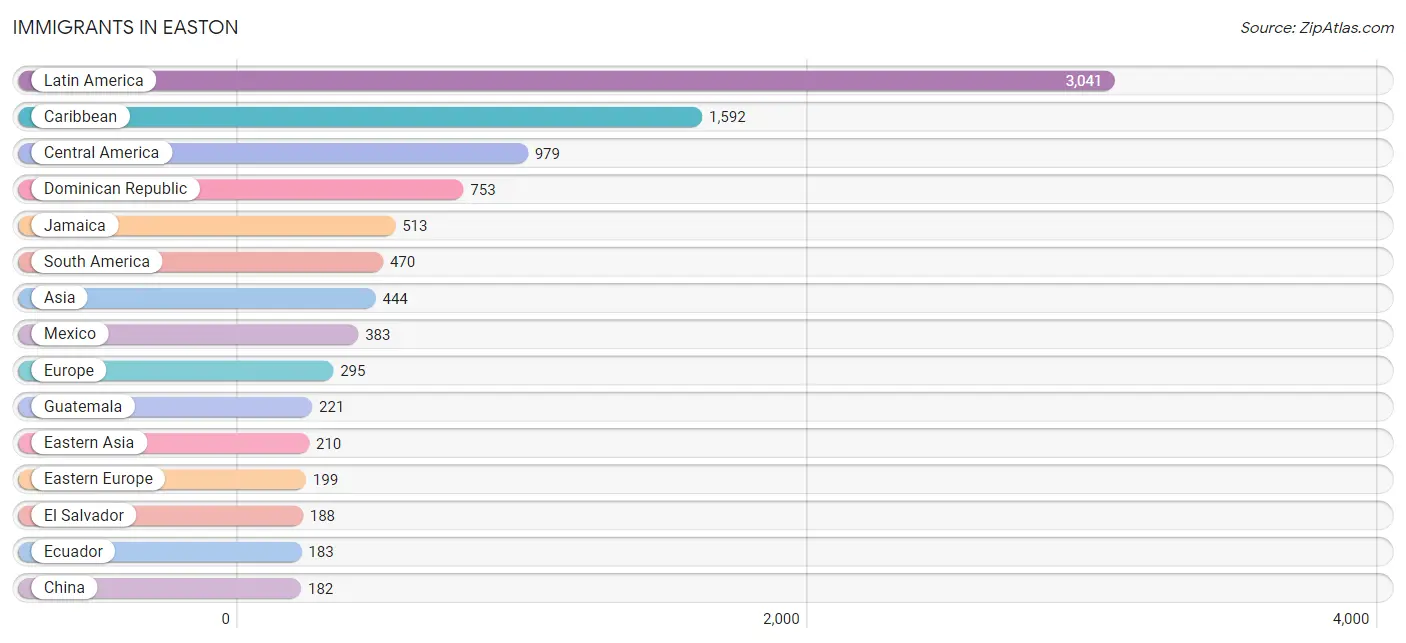
Immigrants in Easton
The most numerous immigrant groups reported in Easton came from Latin America (3,041 | 10.5%), Caribbean (1,592 | 5.5%), Central America (979 | 3.4%), Dominican Republic (753 | 2.6%), and Jamaica (513 | 1.8%), together accounting for 23.8% of all Easton residents.
| Immigration Origin | # Population | % Population |
| Africa | 51 | 0.2% |
| Asia | 444 | 1.5% |
| Australia | 17 | 0.1% |
| Brazil | 1 | 0.0% |
| Canada | 87 | 0.3% |
| Caribbean | 1,592 | 5.5% |
| Central America | 979 | 3.4% |
| China | 182 | 0.6% |
| Colombia | 92 | 0.3% |
| Costa Rica | 95 | 0.3% |
| Cuba | 28 | 0.1% |
| Dominican Republic | 753 | 2.6% |
| Eastern Africa | 7 | 0.0% |
| Eastern Asia | 210 | 0.7% |
| Eastern Europe | 199 | 0.7% |
| Ecuador | 183 | 0.6% |
| El Salvador | 188 | 0.6% |
| England | 39 | 0.1% |
| Ethiopia | 7 | 0.0% |
| Europe | 295 | 1.0% |
| France | 11 | 0.0% |
| Germany | 8 | 0.0% |
| Grenada | 149 | 0.5% |
| Guatemala | 221 | 0.8% |
| Haiti | 17 | 0.1% |
| Honduras | 37 | 0.1% |
| Hong Kong | 29 | 0.1% |
| India | 58 | 0.2% |
| Italy | 16 | 0.1% |
| Jamaica | 513 | 1.8% |
| Japan | 8 | 0.0% |
| Kazakhstan | 10 | 0.0% |
| Korea | 20 | 0.1% |
| Latin America | 3,041 | 10.5% |
| Lebanon | 37 | 0.1% |
| Liberia | 4 | 0.0% |
| Mexico | 383 | 1.3% |
| Morocco | 40 | 0.1% |
| Northern Africa | 40 | 0.1% |
| Northern Europe | 49 | 0.2% |
| Oceania | 17 | 0.1% |
| Pakistan | 57 | 0.2% |
| Panama | 55 | 0.2% |
| Peru | 127 | 0.4% |
| Philippines | 49 | 0.2% |
| Poland | 135 | 0.5% |
| Portugal | 12 | 0.0% |
| Romania | 11 | 0.0% |
| Russia | 53 | 0.2% |
| Singapore | 4 | 0.0% |
| South America | 470 | 1.6% |
| South Central Asia | 125 | 0.4% |
| South Eastern Asia | 62 | 0.2% |
| Southern Europe | 28 | 0.1% |
| Sweden | 10 | 0.0% |
| Trinidad and Tobago | 108 | 0.4% |
| Turkey | 2 | 0.0% |
| Uruguay | 5 | 0.0% |
| Venezuela | 62 | 0.2% |
| Vietnam | 9 | 0.0% |
| Western Africa | 4 | 0.0% |
| Western Asia | 47 | 0.2% |
| Western Europe | 19 | 0.1% | View All 63 Rows |
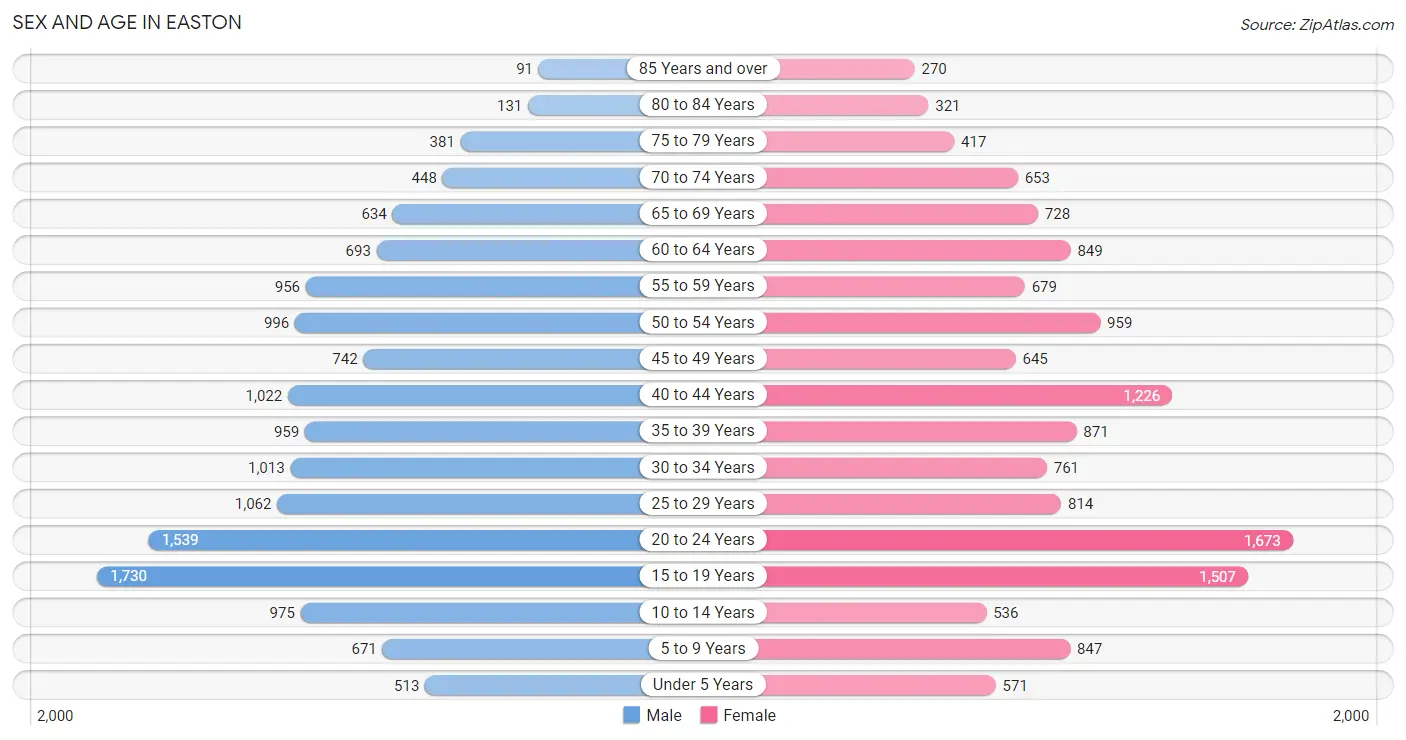
Sex and Age in Easton
Sex and Age in Easton
The most populous age groups in Easton are 15 to 19 Years (1,730 | 11.9%) for men and 20 to 24 Years (1,673 | 11.7%) for women.
| Age Bracket | Male | Female |
| Under 5 Years | 513 (3.5%) | 571 (4.0%) |
| 5 to 9 Years | 671 (4.6%) | 847 (5.9%) |
| 10 to 14 Years | 975 (6.7%) | 536 (3.7%) |
| 15 to 19 Years | 1,730 (11.9%) | 1,507 (10.5%) |
| 20 to 24 Years | 1,539 (10.6%) | 1,673 (11.7%) |
| 25 to 29 Years | 1,062 (7.3%) | 814 (5.7%) |
| 30 to 34 Years | 1,013 (7.0%) | 761 (5.3%) |
| 35 to 39 Years | 959 (6.6%) | 871 (6.1%) |
| 40 to 44 Years | 1,022 (7.0%) | 1,226 (8.6%) |
| 45 to 49 Years | 742 (5.1%) | 645 (4.5%) |
| 50 to 54 Years | 996 (6.8%) | 959 (6.7%) |
| 55 to 59 Years | 956 (6.6%) | 679 (4.7%) |
| 60 to 64 Years | 693 (4.8%) | 849 (5.9%) |
| 65 to 69 Years | 634 (4.4%) | 728 (5.1%) |
| 70 to 74 Years | 448 (3.1%) | 653 (4.6%) |
| 75 to 79 Years | 381 (2.6%) | 417 (2.9%) |
| 80 to 84 Years | 131 (0.9%) | 321 (2.2%) |
| 85 Years and over | 91 (0.6%) | 270 (1.9%) |
| Total | 14,556 (100.0%) | 14,327 (100.0%) |
Families and Households in Easton
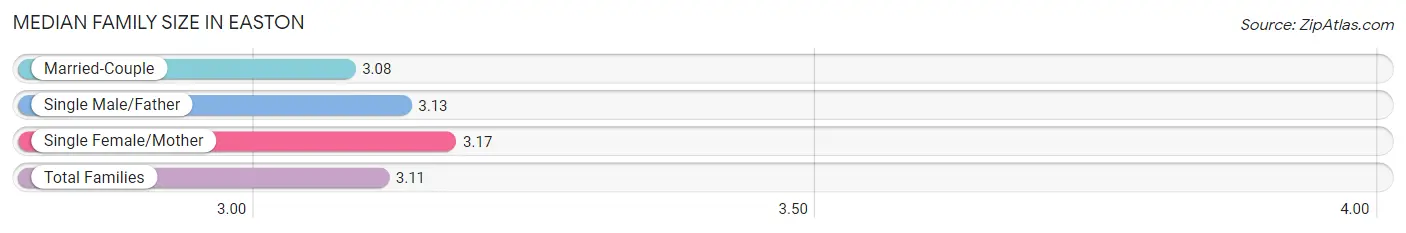
Median Family Size in Easton
The median family size in Easton is 3.11 persons per family, with single female/mother families (1,893 | 30.5%) accounting for the largest median family size of 3.17 persons per family. On the other hand, married-couple families (3,704 | 59.6%) represent the smallest median family size with 3.08 persons per family.
| Family Type | # Families | Family Size |
| Married-Couple | 3,704 (59.6%) | 3.08 |
| Single Male/Father | 614 (9.9%) | 3.13 |
| Single Female/Mother | 1,893 (30.5%) | 3.17 |
| Total Families | 6,211 (100.0%) | 3.11 |
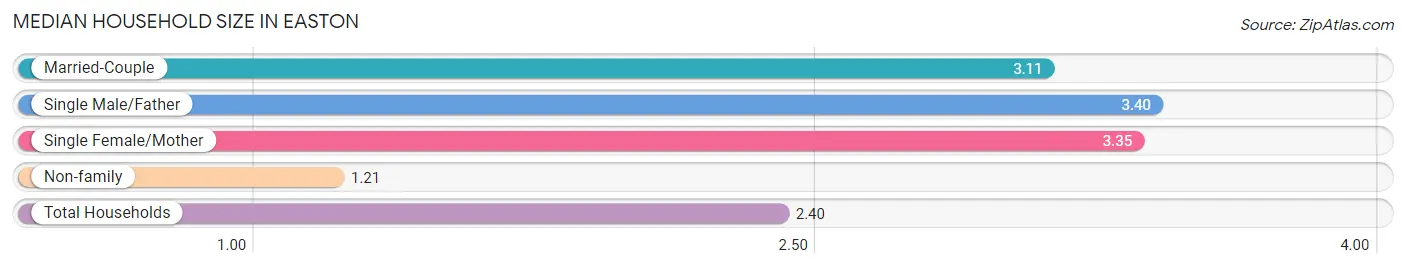
Median Household Size in Easton
The median household size in Easton is 2.40 persons per household, with single male/father households (614 | 5.9%) accounting for the largest median household size of 3.4 persons per household. non-family households (4,231 | 40.5%) represent the smallest median household size with 1.21 persons per household.
| Household Type | # Households | Household Size |
| Married-Couple | 3,704 (35.5%) | 3.11 |
| Single Male/Father | 614 (5.9%) | 3.40 |
| Single Female/Mother | 1,893 (18.1%) | 3.35 |
| Non-family | 4,231 (40.5%) | 1.21 |
| Total Households | 10,442 (100.0%) | 2.40 |
Household Size by Marriage Status in Easton
Out of a total of 10,442 households in Easton, 6,211 (59.5%) are family households, while 4,231 (40.5%) are nonfamily households. The most numerous type of family households are 2-person households, comprising 2,429, and the most common type of nonfamily households are 1-person households, comprising 3,323.
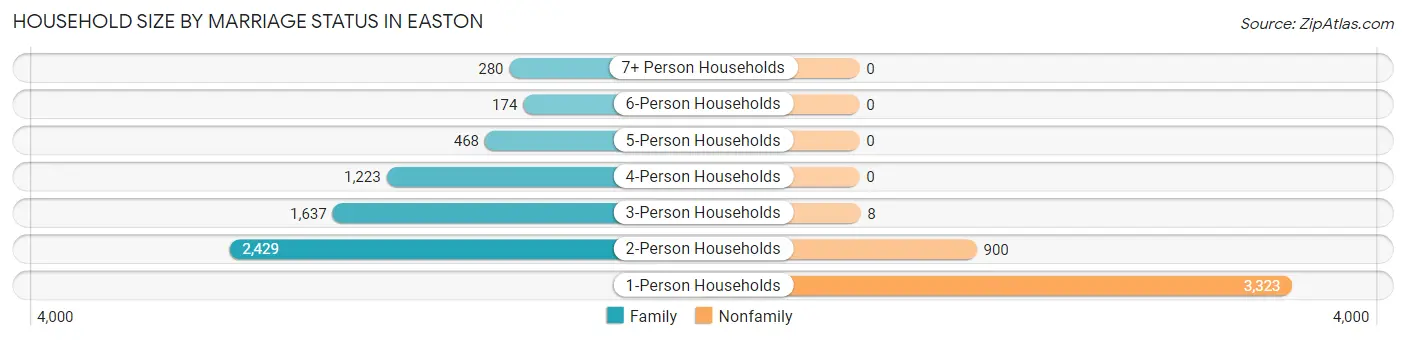
| Household Size | Family Households | Nonfamily Households |
| 1-Person Households | - | 3,323 (31.8%) |
| 2-Person Households | 2,429 (23.3%) | 900 (8.6%) |
| 3-Person Households | 1,637 (15.7%) | 8 (0.1%) |
| 4-Person Households | 1,223 (11.7%) | 0 (0.0%) |
| 5-Person Households | 468 (4.5%) | 0 (0.0%) |
| 6-Person Households | 174 (1.7%) | 0 (0.0%) |
| 7+ Person Households | 280 (2.7%) | 0 (0.0%) |
| Total | 6,211 (59.5%) | 4,231 (40.5%) |
Female Fertility in Easton
Fertility by Age in Easton
Average fertility rate in Easton is 60.0 births per 1,000 women. Women in the age bracket of 35 to 50 years have the highest fertility rate with 99.0 births per 1,000 women. Women in the age bracket of 35 to 50 years acount for 61.3% of all women with births.
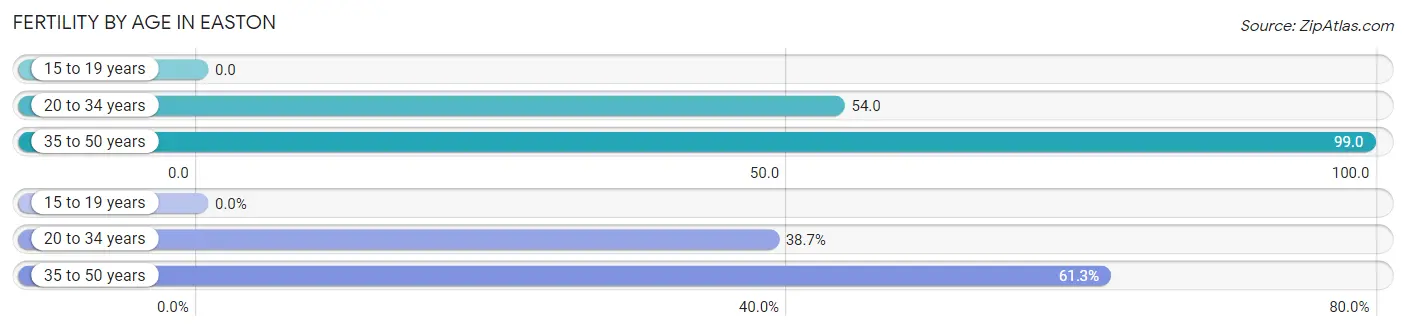
| Age Bracket | Women with Births | Births / 1,000 Women |
| 15 to 19 years | 0 (0.0%) | 0.0 |
| 20 to 34 years | 177 (38.7%) | 54.0 |
| 35 to 50 years | 280 (61.3%) | 99.0 |
| Total | 457 (100.0%) | 60.0 |
Fertility by Age by Marriage Status in Easton
55.6% of women with births (457) in Easton are married. The highest percentage of unmarried women with births falls into 35 to 50 years age bracket with 72.5% of them unmarried at the time of birth, while the lowest percentage of unmarried women with births belong to 20 to 34 years age bracket with 0.0% of them unmarried.
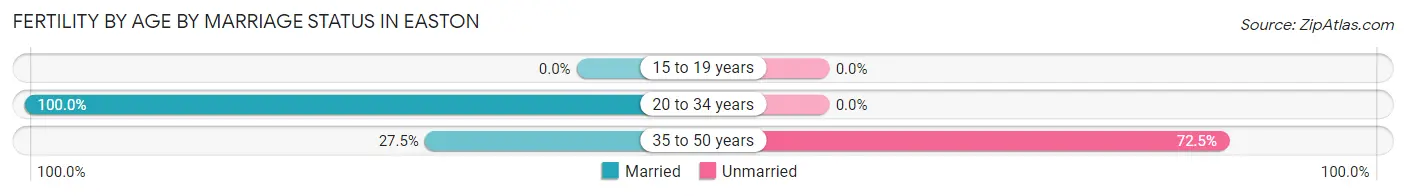
| Age Bracket | Married | Unmarried |
| 15 to 19 years | 0 (0.0%) | 0 (0.0%) |
| 20 to 34 years | 177 (100.0%) | 0 (0.0%) |
| 35 to 50 years | 77 (27.5%) | 203 (72.5%) |
| Total | 254 (55.6%) | 203 (44.4%) |
Fertility by Education in Easton
Average fertility rate in Easton is 60.0 births per 1,000 women. Women with the education attainment of high school diploma have the highest fertility rate of 115.0 births per 1,000 women, while women with the education attainment of bachelor's degree have the lowest fertility at 9.0 births per 1,000 women. Women with the education attainment of high school diploma represent 56.9% of all women with births.
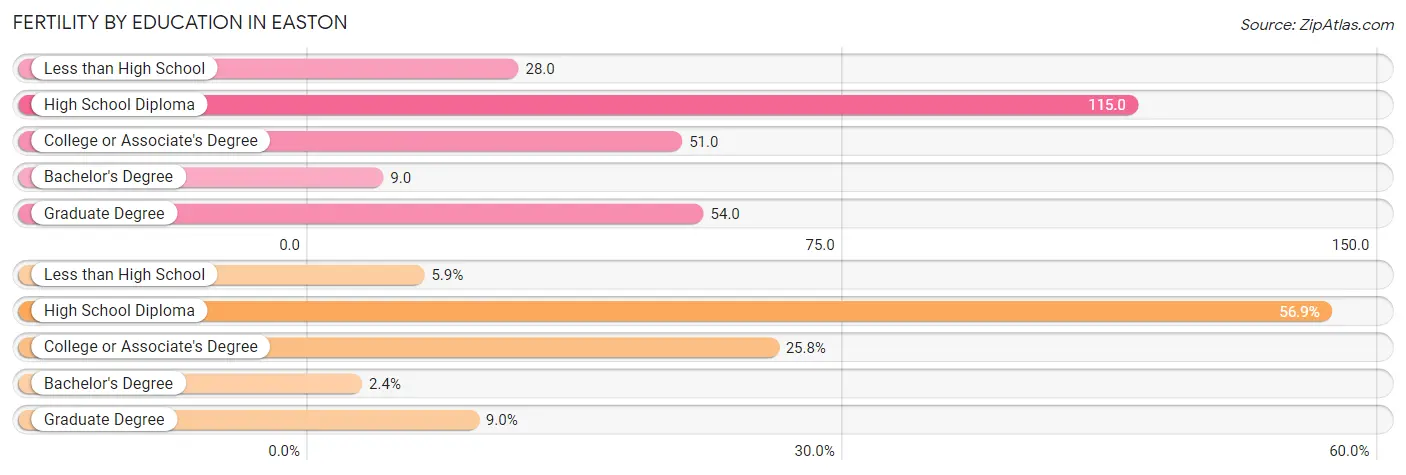
| Educational Attainment | Women with Births | Births / 1,000 Women |
| Less than High School | 27 (5.9%) | 28.0 |
| High School Diploma | 260 (56.9%) | 115.0 |
| College or Associate's Degree | 118 (25.8%) | 51.0 |
| Bachelor's Degree | 11 (2.4%) | 9.0 |
| Graduate Degree | 41 (9.0%) | 54.0 |
| Total | 457 (100.0%) | 60.0 |
Fertility by Education by Marriage Status in Easton
44.4% of women with births in Easton are unmarried. Women with the educational attainment of less than high school are most likely to be married with 100.0% of them married at childbirth, while women with the educational attainment of high school diploma are least likely to be married with 78.1% of them unmarried at childbirth.
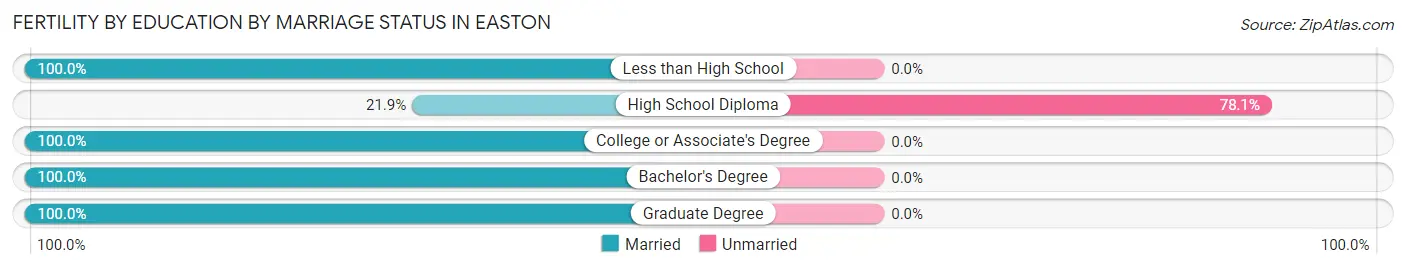
| Educational Attainment | Married | Unmarried |
| Less than High School | 27 (100.0%) | 0 (0.0%) |
| High School Diploma | 57 (21.9%) | 203 (78.1%) |
| College or Associate's Degree | 118 (100.0%) | 0 (0.0%) |
| Bachelor's Degree | 11 (100.0%) | 0 (0.0%) |
| Graduate Degree | 41 (100.0%) | 0 (0.0%) |
| Total | 254 (55.6%) | 203 (44.4%) |
Employment Characteristics in Easton
Employment by Class of Employer in Easton
Among the 13,822 employed individuals in Easton, private company employees (9,672 | 70.0%), not-for-profit organizations (2,222 | 16.1%), and self-employed (not incorporated) (533 | 3.9%) make up the most common classes of employment.
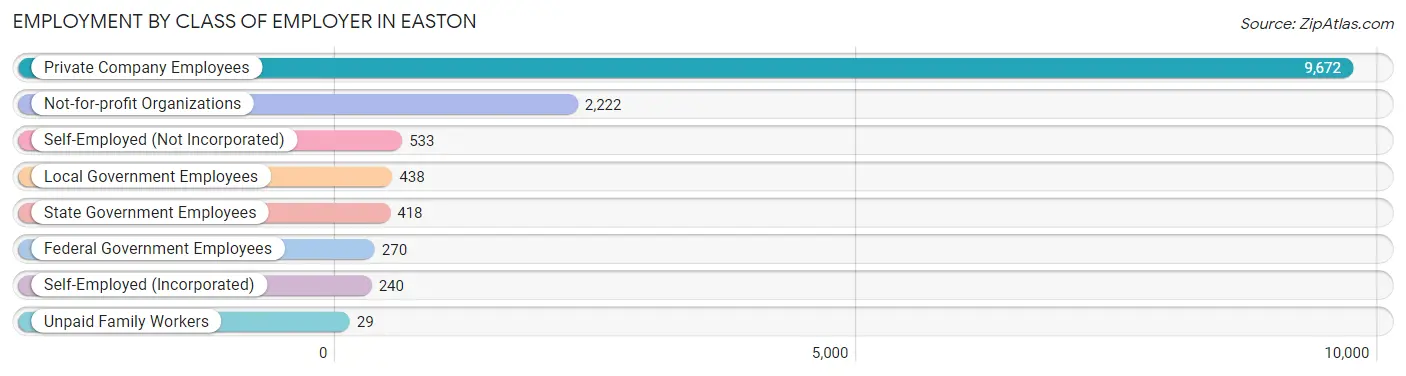
| Employer Class | # Employees | % Employees |
| Private Company Employees | 9,672 | 70.0% |
| Self-Employed (Incorporated) | 240 | 1.7% |
| Self-Employed (Not Incorporated) | 533 | 3.9% |
| Not-for-profit Organizations | 2,222 | 16.1% |
| Local Government Employees | 438 | 3.2% |
| State Government Employees | 418 | 3.0% |
| Federal Government Employees | 270 | 1.9% |
| Unpaid Family Workers | 29 | 0.2% |
| Total | 13,822 | 100.0% |
Employment Status by Age in Easton
According to the labor force statistics for Easton, out of the total population over 16 years of age (24,444), 60.5% or 14,789 individuals are in the labor force, with 4.4% or 651 of them unemployed. The age group with the highest labor force participation rate is 25 to 29 years, with 87.8% or 1,647 individuals in the labor force. Within the labor force, the 60 to 64 years age range has the highest percentage of unemployed individuals, with 20.3% or 218 of them being unemployed.
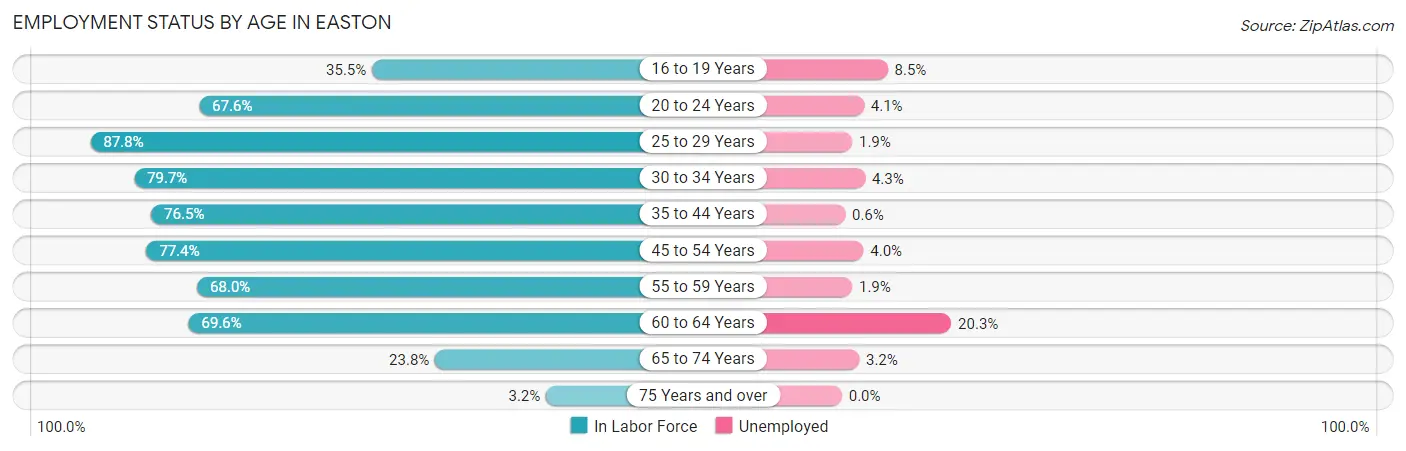
| Age Bracket | In Labor Force | Unemployed |
| 16 to 19 Years | 1,033 (35.5%) | 88 (8.5%) |
| 20 to 24 Years | 2,171 (67.6%) | 89 (4.1%) |
| 25 to 29 Years | 1,647 (87.8%) | 31 (1.9%) |
| 30 to 34 Years | 1,414 (79.7%) | 61 (4.3%) |
| 35 to 44 Years | 3,120 (76.5%) | 19 (0.6%) |
| 45 to 54 Years | 2,587 (77.4%) | 103 (4.0%) |
| 55 to 59 Years | 1,112 (68.0%) | 21 (1.9%) |
| 60 to 64 Years | 1,073 (69.6%) | 218 (20.3%) |
| 65 to 74 Years | 586 (23.8%) | 19 (3.2%) |
| 75 Years and over | 52 (3.2%) | 0 (0.0%) |
| Total | 14,789 (60.5%) | 651 (4.4%) |
Employment Status by Educational Attainment in Easton
According to labor force statistics for Easton, 76.9% of individuals (10,956) out of the total population between 25 and 64 years of age (14,247) are in the labor force, with 4.2% or 460 of them being unemployed. The group with the highest labor force participation rate are those with the educational attainment of bachelor's degree or higher, with 92.9% or 3,691 individuals in the labor force. Within the labor force, individuals with college / associate degree education have the highest percentage of unemployment, with 12.7% or 343 of them being unemployed.
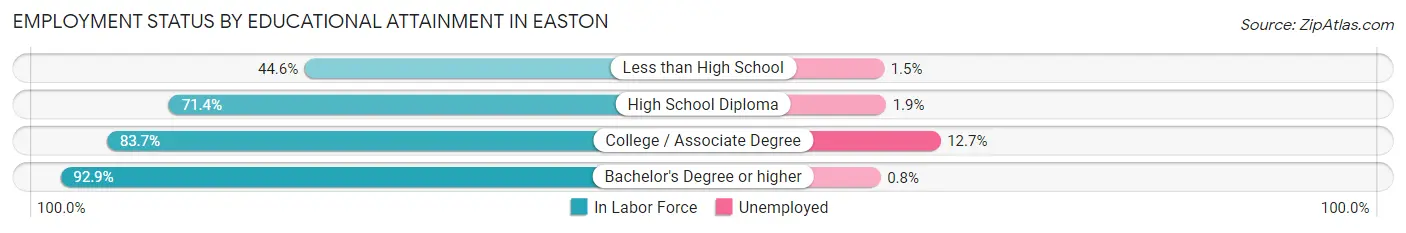
| Educational Attainment | In Labor Force | Unemployed |
| Less than High School | 791 (44.6%) | 27 (1.5%) |
| High School Diploma | 3,768 (71.4%) | 100 (1.9%) |
| College / Associate Degree | 2,698 (83.7%) | 409 (12.7%) |
| Bachelor's Degree or higher | 3,691 (92.9%) | 32 (0.8%) |
| Total | 10,956 (76.9%) | 598 (4.2%) |
Employment Occupations by Sex in Easton
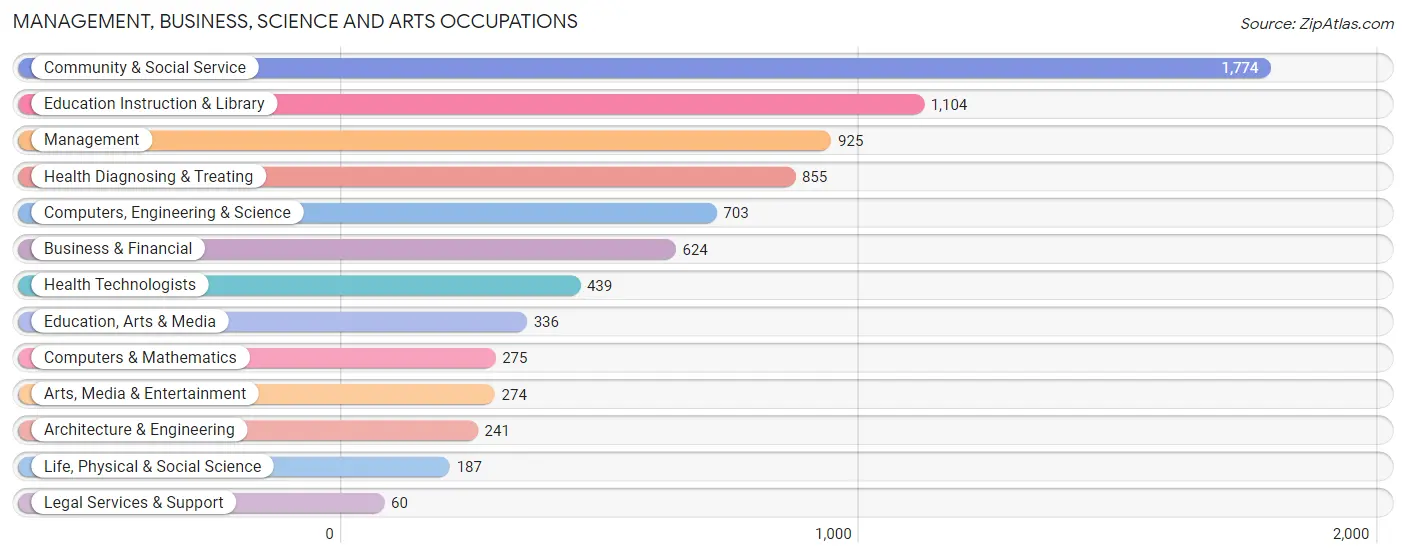
Management, Business, Science and Arts Occupations
The most common Management, Business, Science and Arts occupations in Easton are Community & Social Service (1,774 | 12.5%), Education Instruction & Library (1,104 | 7.8%), Management (925 | 6.5%), Health Diagnosing & Treating (855 | 6.0%), and Computers, Engineering & Science (703 | 5.0%).
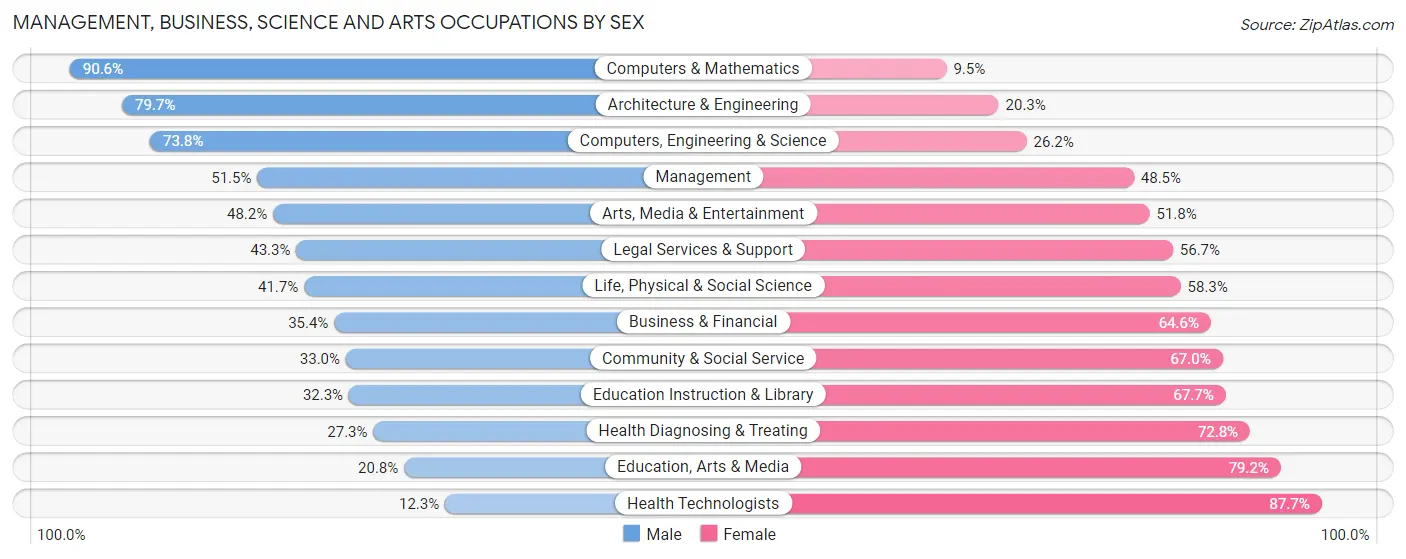
Management, Business, Science and Arts Occupations by Sex
Within the Management, Business, Science and Arts occupations in Easton, the most male-oriented occupations are Computers & Mathematics (90.5%), Architecture & Engineering (79.7%), and Computers, Engineering & Science (73.8%), while the most female-oriented occupations are Health Technologists (87.7%), Education, Arts & Media (79.2%), and Health Diagnosing & Treating (72.8%).
| Occupation | Male | Female |
| Management | 476 (51.5%) | 449 (48.5%) |
| Business & Financial | 221 (35.4%) | 403 (64.6%) |
| Computers, Engineering & Science | 519 (73.8%) | 184 (26.2%) |
| Computers & Mathematics | 249 (90.5%) | 26 (9.5%) |
| Architecture & Engineering | 192 (79.7%) | 49 (20.3%) |
| Life, Physical & Social Science | 78 (41.7%) | 109 (58.3%) |
| Community & Social Service | 585 (33.0%) | 1,189 (67.0%) |
| Education, Arts & Media | 70 (20.8%) | 266 (79.2%) |
| Legal Services & Support | 26 (43.3%) | 34 (56.7%) |
| Education Instruction & Library | 357 (32.3%) | 747 (67.7%) |
| Arts, Media & Entertainment | 132 (48.2%) | 142 (51.8%) |
| Health Diagnosing & Treating | 233 (27.3%) | 622 (72.8%) |
| Health Technologists | 54 (12.3%) | 385 (87.7%) |
| Total (Category) | 2,034 (41.7%) | 2,847 (58.3%) |
| Total (Overall) | 6,969 (49.3%) | 7,173 (50.7%) |
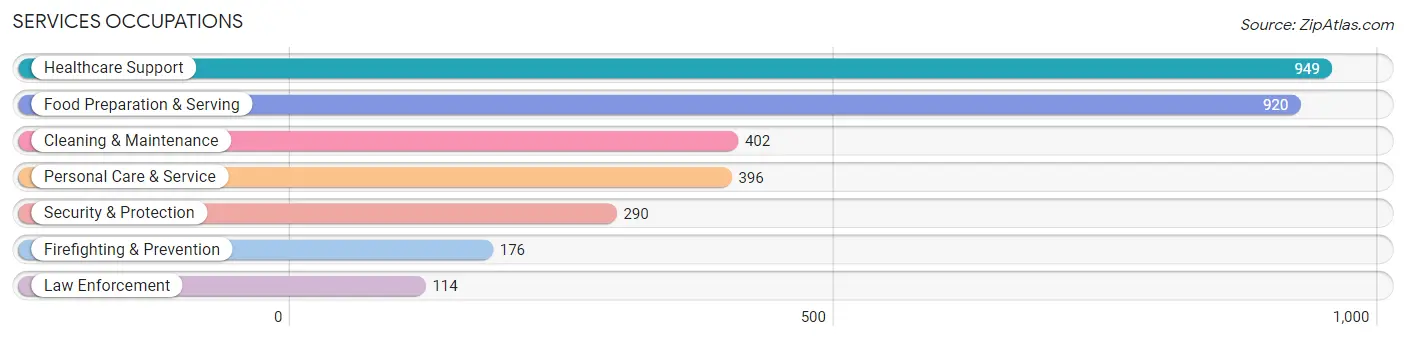
Services Occupations
The most common Services occupations in Easton are Healthcare Support (949 | 6.7%), Food Preparation & Serving (920 | 6.5%), Cleaning & Maintenance (402 | 2.8%), Personal Care & Service (396 | 2.8%), and Security & Protection (290 | 2.1%).
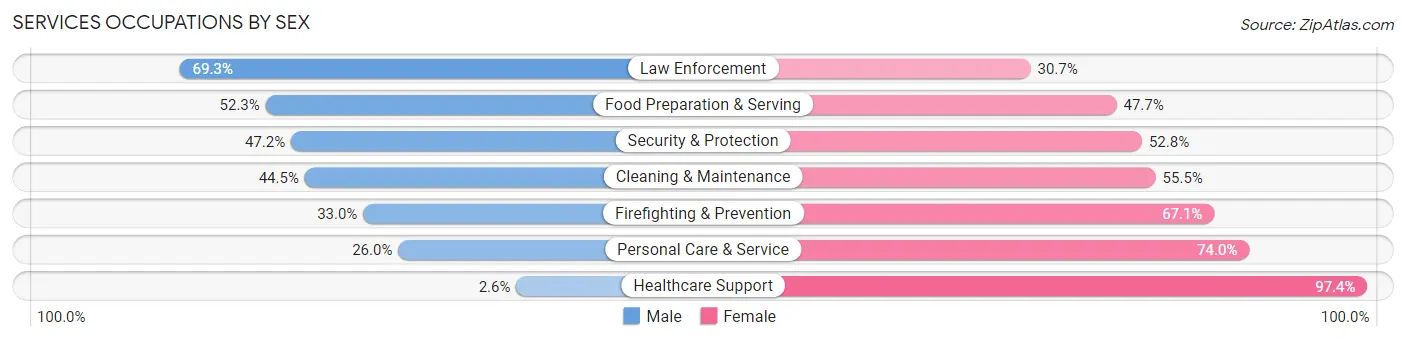
Services Occupations by Sex
Within the Services occupations in Easton, the most male-oriented occupations are Law Enforcement (69.3%), Food Preparation & Serving (52.3%), and Security & Protection (47.2%), while the most female-oriented occupations are Healthcare Support (97.4%), Personal Care & Service (74.0%), and Firefighting & Prevention (67.0%).
| Occupation | Male | Female |
| Healthcare Support | 25 (2.6%) | 924 (97.4%) |
| Security & Protection | 137 (47.2%) | 153 (52.8%) |
| Firefighting & Prevention | 58 (33.0%) | 118 (67.0%) |
| Law Enforcement | 79 (69.3%) | 35 (30.7%) |
| Food Preparation & Serving | 481 (52.3%) | 439 (47.7%) |
| Cleaning & Maintenance | 179 (44.5%) | 223 (55.5%) |
| Personal Care & Service | 103 (26.0%) | 293 (74.0%) |
| Total (Category) | 925 (31.3%) | 2,032 (68.7%) |
| Total (Overall) | 6,969 (49.3%) | 7,173 (50.7%) |
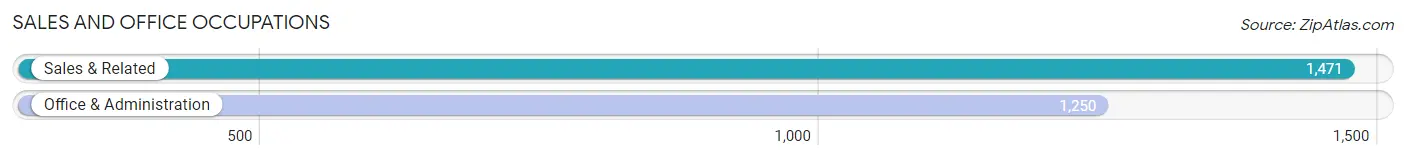
Sales and Office Occupations
The most common Sales and Office occupations in Easton are Sales & Related (1,471 | 10.4%), and Office & Administration (1,250 | 8.8%).
Sales and Office Occupations by Sex
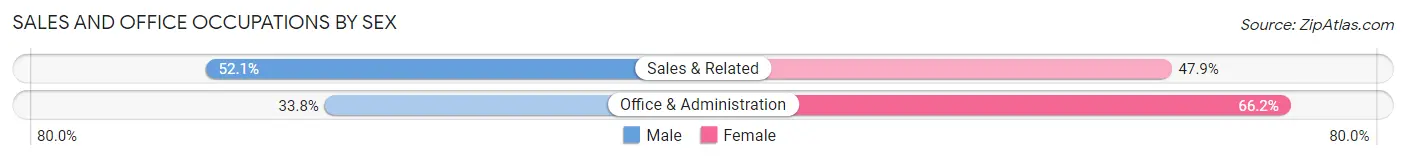
| Occupation | Male | Female |
| Sales & Related | 767 (52.1%) | 704 (47.9%) |
| Office & Administration | 423 (33.8%) | 827 (66.2%) |
| Total (Category) | 1,190 (43.7%) | 1,531 (56.3%) |
| Total (Overall) | 6,969 (49.3%) | 7,173 (50.7%) |
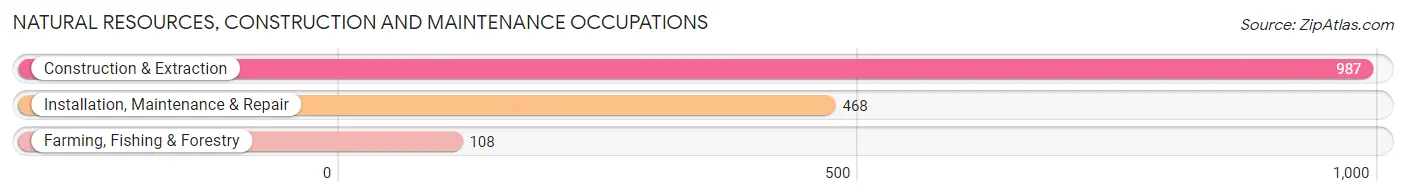
Natural Resources, Construction and Maintenance Occupations
The most common Natural Resources, Construction and Maintenance occupations in Easton are Construction & Extraction (987 | 7.0%), Installation, Maintenance & Repair (468 | 3.3%), and Farming, Fishing & Forestry (108 | 0.8%).
Natural Resources, Construction and Maintenance Occupations by Sex
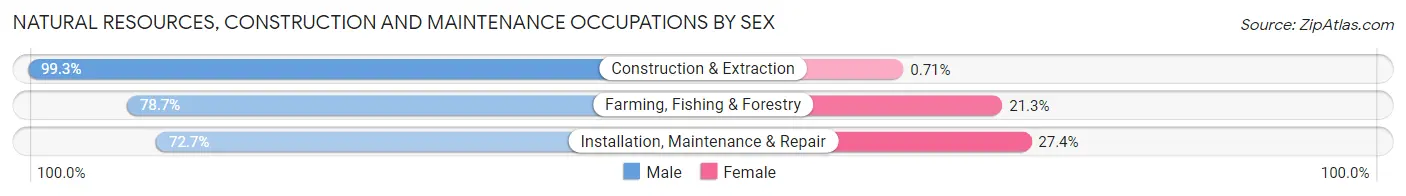
| Occupation | Male | Female |
| Farming, Fishing & Forestry | 85 (78.7%) | 23 (21.3%) |
| Construction & Extraction | 980 (99.3%) | 7 (0.7%) |
| Installation, Maintenance & Repair | 340 (72.7%) | 128 (27.4%) |
| Total (Category) | 1,405 (89.9%) | 158 (10.1%) |
| Total (Overall) | 6,969 (49.3%) | 7,173 (50.7%) |
Production, Transportation and Moving Occupations
The most common Production, Transportation and Moving occupations in Easton are Material Moving (817 | 5.8%), Production (750 | 5.3%), and Transportation (453 | 3.2%).
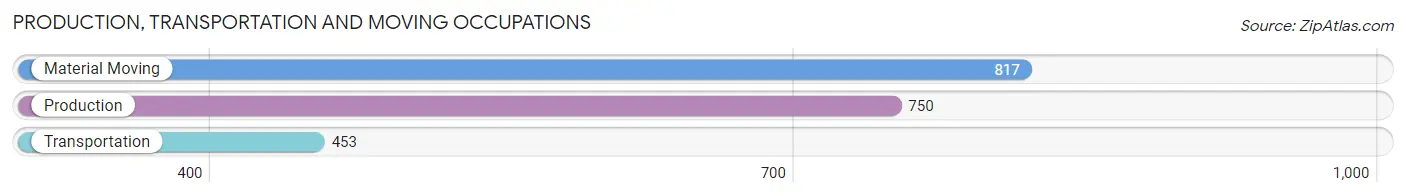
Production, Transportation and Moving Occupations by Sex
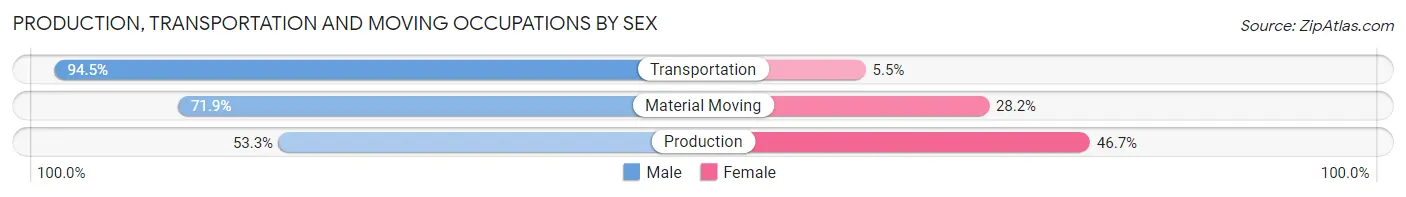
| Occupation | Male | Female |
| Production | 400 (53.3%) | 350 (46.7%) |
| Transportation | 428 (94.5%) | 25 (5.5%) |
| Material Moving | 587 (71.9%) | 230 (28.1%) |
| Total (Category) | 1,415 (70.1%) | 605 (29.9%) |
| Total (Overall) | 6,969 (49.3%) | 7,173 (50.7%) |
Employment Industries by Sex in Easton
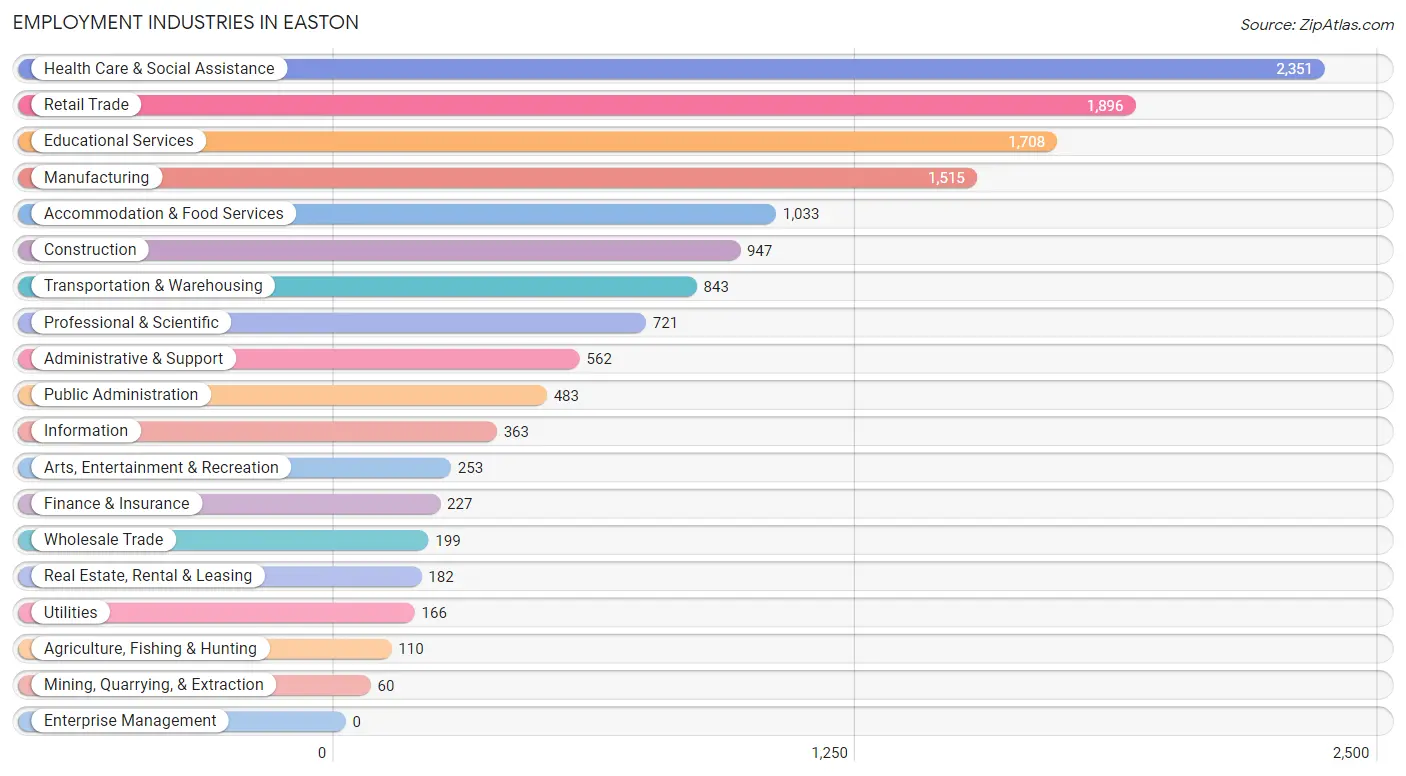
Employment Industries in Easton
The major employment industries in Easton include Health Care & Social Assistance (2,351 | 16.6%), Retail Trade (1,896 | 13.4%), Educational Services (1,708 | 12.1%), Manufacturing (1,515 | 10.7%), and Accommodation & Food Services (1,033 | 7.3%).
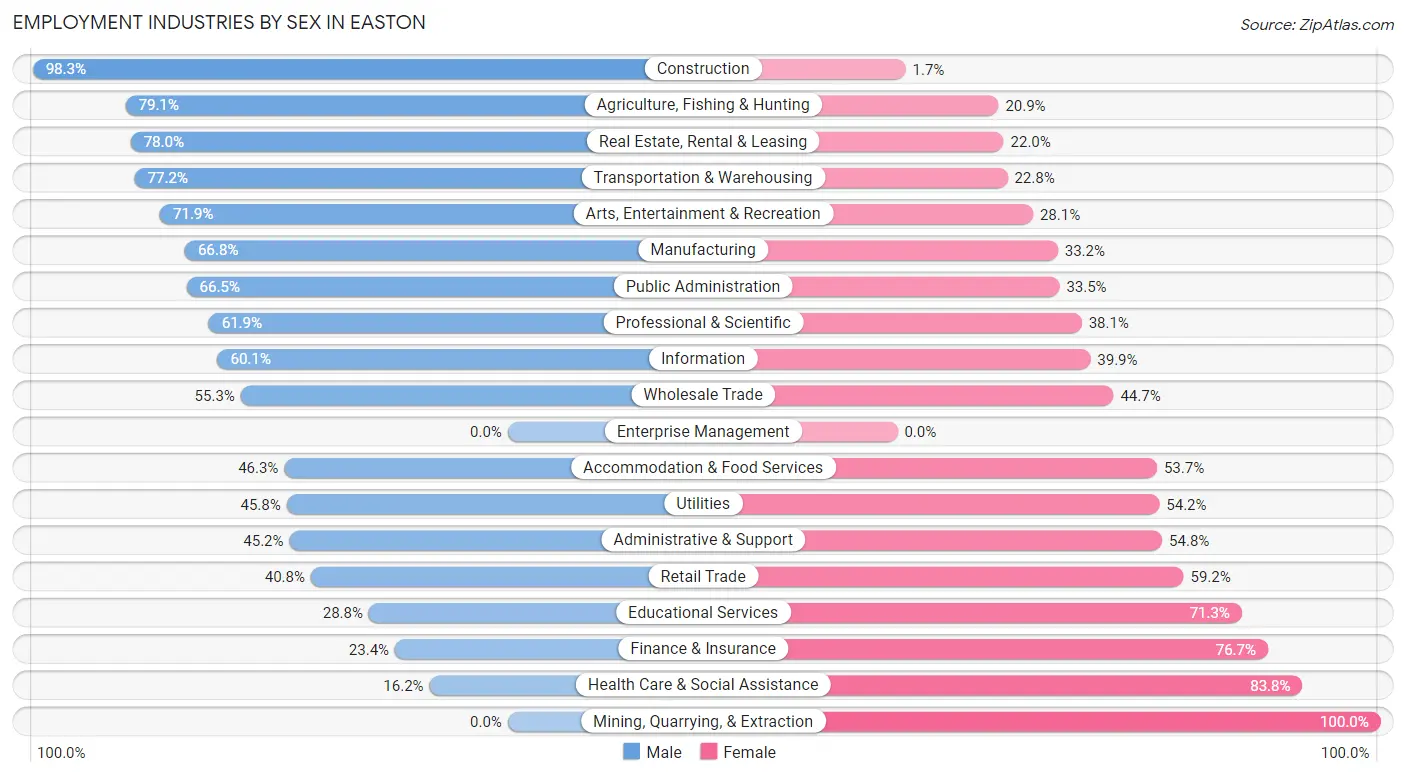
Employment Industries by Sex in Easton
The Easton industries that see more men than women are Construction (98.3%), Agriculture, Fishing & Hunting (79.1%), and Real Estate, Rental & Leasing (78.0%), whereas the industries that tend to have a higher number of women are Mining, Quarrying, & Extraction (100.0%), Health Care & Social Assistance (83.8%), and Finance & Insurance (76.6%).
| Industry | Male | Female |
| Agriculture, Fishing & Hunting | 87 (79.1%) | 23 (20.9%) |
| Mining, Quarrying, & Extraction | 0 (0.0%) | 60 (100.0%) |
| Construction | 931 (98.3%) | 16 (1.7%) |
| Manufacturing | 1,012 (66.8%) | 503 (33.2%) |
| Wholesale Trade | 110 (55.3%) | 89 (44.7%) |
| Retail Trade | 773 (40.8%) | 1,123 (59.2%) |
| Transportation & Warehousing | 651 (77.2%) | 192 (22.8%) |
| Utilities | 76 (45.8%) | 90 (54.2%) |
| Information | 218 (60.1%) | 145 (39.9%) |
| Finance & Insurance | 53 (23.4%) | 174 (76.6%) |
| Real Estate, Rental & Leasing | 142 (78.0%) | 40 (22.0%) |
| Professional & Scientific | 446 (61.9%) | 275 (38.1%) |
| Enterprise Management | 0 (0.0%) | 0 (0.0%) |
| Administrative & Support | 254 (45.2%) | 308 (54.8%) |
| Educational Services | 491 (28.7%) | 1,217 (71.3%) |
| Health Care & Social Assistance | 381 (16.2%) | 1,970 (83.8%) |
| Arts, Entertainment & Recreation | 182 (71.9%) | 71 (28.1%) |
| Accommodation & Food Services | 478 (46.3%) | 555 (53.7%) |
| Public Administration | 321 (66.5%) | 162 (33.5%) |
| Total | 6,969 (49.3%) | 7,173 (50.7%) |
Education in Easton
School Enrollment in Easton
The most common levels of schooling among the 8,416 students in Easton are college / undergraduate (3,461 | 41.1%), high school (1,597 | 19.0%), and elementary school (1,199 | 14.2%).
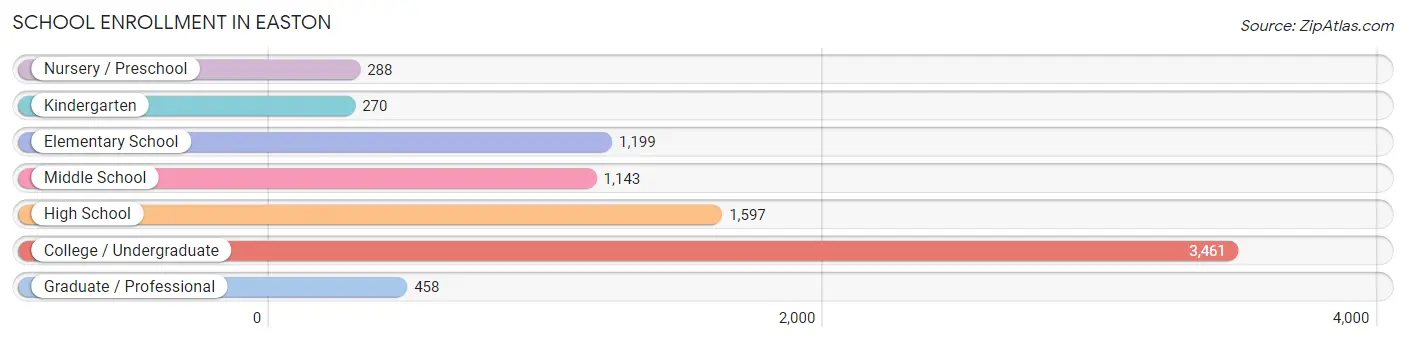
| School Level | # Students | % Students |
| Nursery / Preschool | 288 | 3.4% |
| Kindergarten | 270 | 3.2% |
| Elementary School | 1,199 | 14.2% |
| Middle School | 1,143 | 13.6% |
| High School | 1,597 | 19.0% |
| College / Undergraduate | 3,461 | 41.1% |
| Graduate / Professional | 458 | 5.4% |
| Total | 8,416 | 100.0% |
School Enrollment by Age by Funding Source in Easton
Out of a total of 8,416 students who are enrolled in schools in Easton, 3,400 (40.4%) attend a private institution, while the remaining 5,016 (59.6%) are enrolled in public schools. The age group of 20 to 24 year olds has the highest likelihood of being enrolled in private schools, with 1,407 (82.5% in the age bracket) enrolled. Conversely, the age group of 15 to 17 year olds has the lowest likelihood of being enrolled in a private school, with 1,148 (95.7% in the age bracket) attending a public institution.
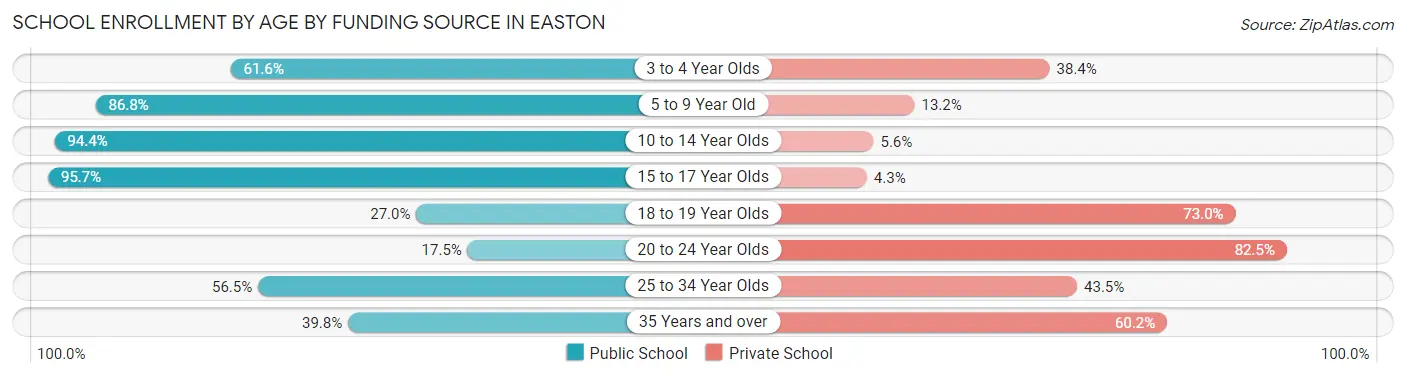
| Age Bracket | Public School | Private School |
| 3 to 4 Year Olds | 143 (61.6%) | 89 (38.4%) |
| 5 to 9 Year Old | 1,236 (86.8%) | 188 (13.2%) |
| 10 to 14 Year Olds | 1,394 (94.4%) | 82 (5.6%) |
| 15 to 17 Year Olds | 1,148 (95.7%) | 52 (4.3%) |
| 18 to 19 Year Olds | 464 (27.0%) | 1,252 (73.0%) |
| 20 to 24 Year Olds | 298 (17.5%) | 1,407 (82.5%) |
| 25 to 34 Year Olds | 234 (56.5%) | 180 (43.5%) |
| 35 Years and over | 99 (39.8%) | 150 (60.2%) |
| Total | 5,016 (59.6%) | 3,400 (40.4%) |
Educational Attainment by Field of Study in Easton
Business (921 | 17.1%), education (534 | 9.9%), science & technology (492 | 9.2%), social sciences (414 | 7.7%), and psychology (404 | 7.5%) are the most common fields of study among 5,374 individuals in Easton who have obtained a bachelor's degree or higher.
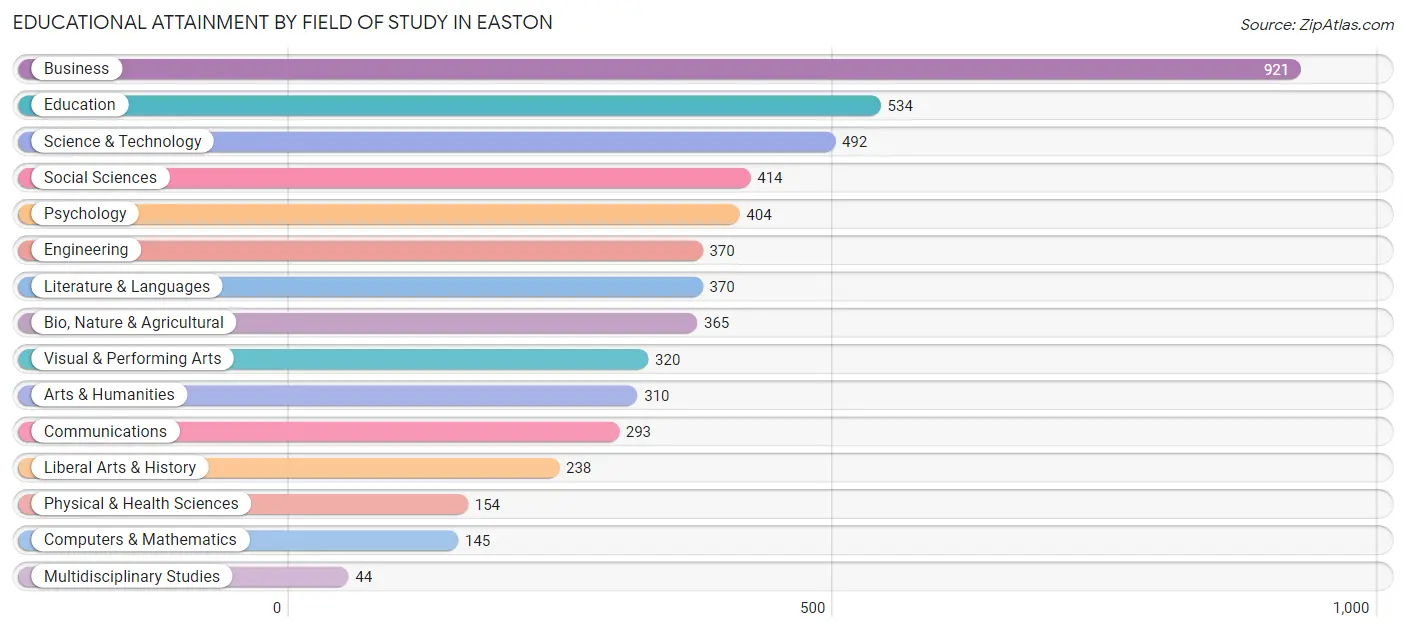
| Field of Study | # Graduates | % Graduates |
| Computers & Mathematics | 145 | 2.7% |
| Bio, Nature & Agricultural | 365 | 6.8% |
| Physical & Health Sciences | 154 | 2.9% |
| Psychology | 404 | 7.5% |
| Social Sciences | 414 | 7.7% |
| Engineering | 370 | 6.9% |
| Multidisciplinary Studies | 44 | 0.8% |
| Science & Technology | 492 | 9.2% |
| Business | 921 | 17.1% |
| Education | 534 | 9.9% |
| Literature & Languages | 370 | 6.9% |
| Liberal Arts & History | 238 | 4.4% |
| Visual & Performing Arts | 320 | 5.9% |
| Communications | 293 | 5.4% |
| Arts & Humanities | 310 | 5.8% |
| Total | 5,374 | 100.0% |
Transportation & Commute in Easton
Vehicle Availability by Sex in Easton
The most prevalent vehicle ownership categories in Easton are males with 2 vehicles (2,703, accounting for 41.7%) and females with 2 vehicles (2,797, making up 41.6%).
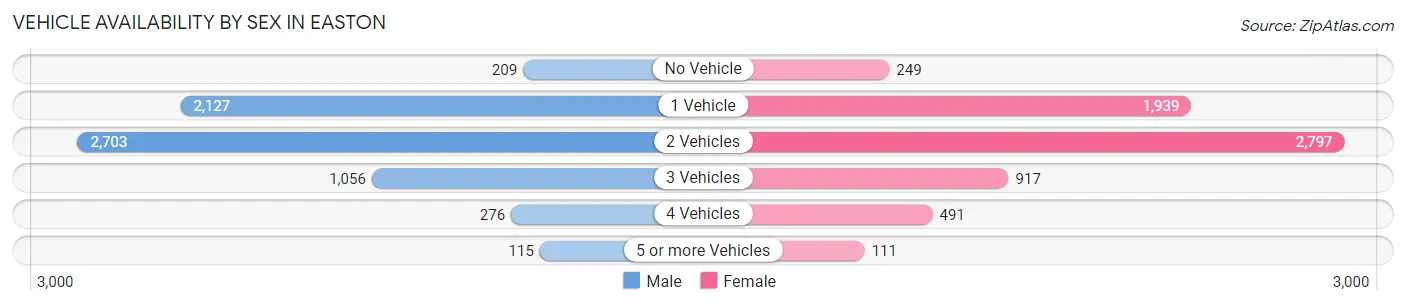
| Vehicles Available | Male | Female |
| No Vehicle | 209 (3.2%) | 249 (3.8%) |
| 1 Vehicle | 2,127 (32.8%) | 1,939 (29.8%) |
| 2 Vehicles | 2,703 (41.7%) | 2,797 (43.0%) |
| 3 Vehicles | 1,056 (16.3%) | 917 (14.1%) |
| 4 Vehicles | 276 (4.3%) | 491 (7.5%) |
| 5 or more Vehicles | 115 (1.8%) | 111 (1.7%) |
| Total | 6,486 (100.0%) | 6,504 (100.0%) |
Commute Time in Easton
The most frequently occuring commute durations in Easton are 10 to 14 minutes (2,017 commuters, 16.4%), 20 to 24 minutes (2,015 commuters, 16.4%), and 15 to 19 minutes (1,906 commuters, 15.5%).
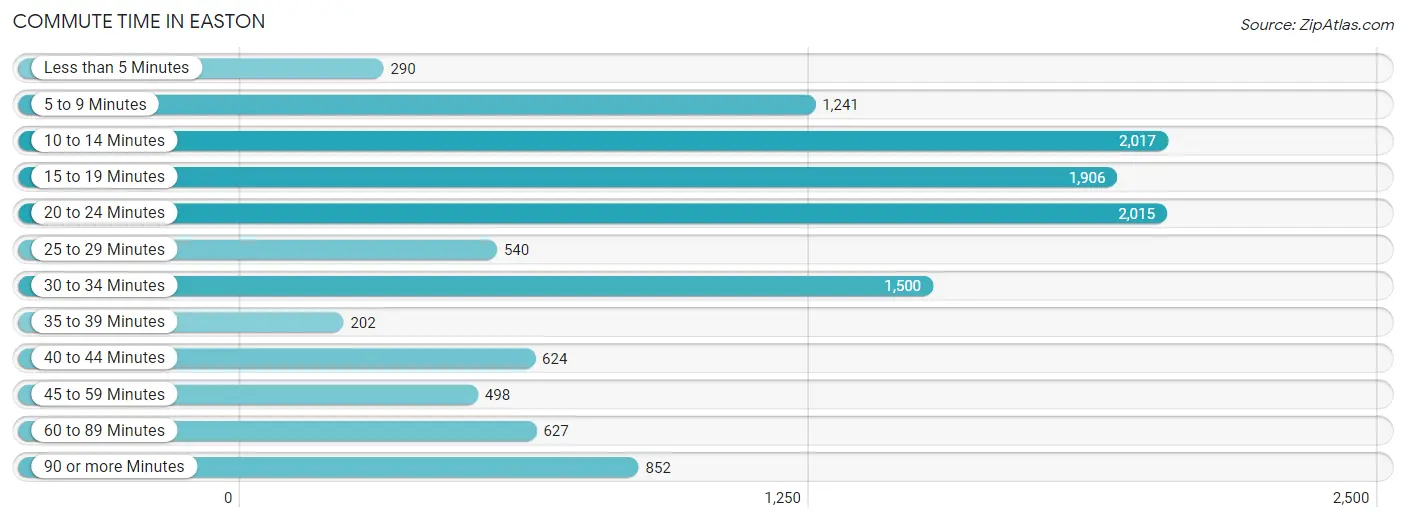
| Commute Time | # Commuters | % Commuters |
| Less than 5 Minutes | 290 | 2.4% |
| 5 to 9 Minutes | 1,241 | 10.1% |
| 10 to 14 Minutes | 2,017 | 16.4% |
| 15 to 19 Minutes | 1,906 | 15.5% |
| 20 to 24 Minutes | 2,015 | 16.4% |
| 25 to 29 Minutes | 540 | 4.4% |
| 30 to 34 Minutes | 1,500 | 12.2% |
| 35 to 39 Minutes | 202 | 1.6% |
| 40 to 44 Minutes | 624 | 5.1% |
| 45 to 59 Minutes | 498 | 4.0% |
| 60 to 89 Minutes | 627 | 5.1% |
| 90 or more Minutes | 852 | 6.9% |
Commute Time by Sex in Easton
The most common commute times in Easton are 15 to 19 minutes (953 commuters, 15.5%) for males and 10 to 14 minutes (1,365 commuters, 22.2%) for females.
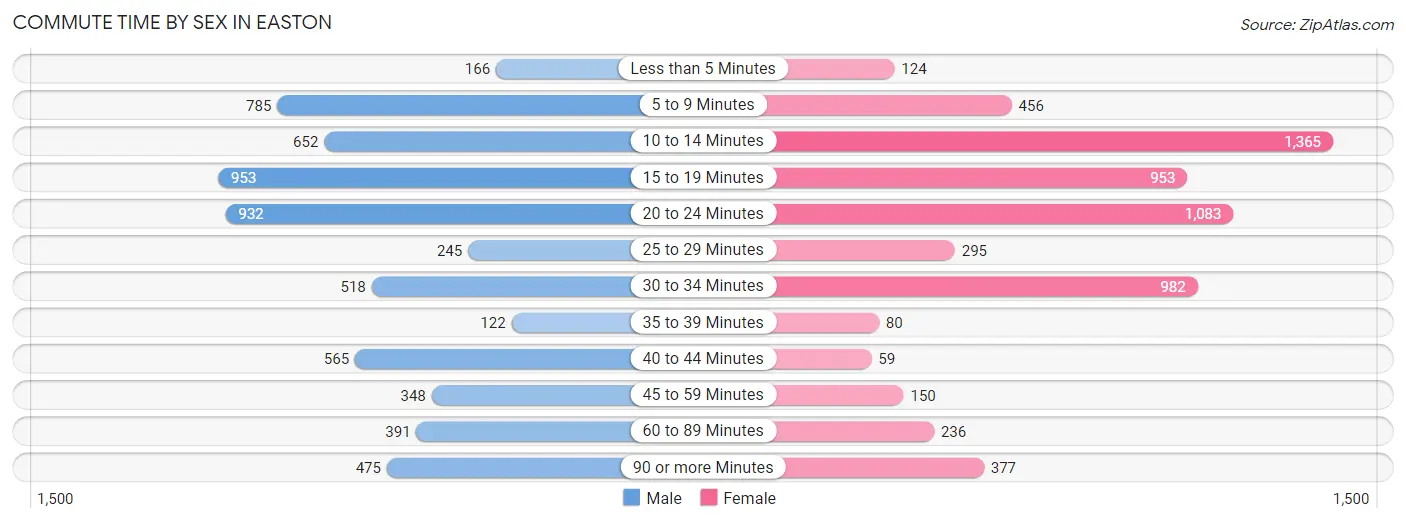
| Commute Time | Male | Female |
| Less than 5 Minutes | 166 (2.7%) | 124 (2.0%) |
| 5 to 9 Minutes | 785 (12.8%) | 456 (7.4%) |
| 10 to 14 Minutes | 652 (10.6%) | 1,365 (22.2%) |
| 15 to 19 Minutes | 953 (15.5%) | 953 (15.5%) |
| 20 to 24 Minutes | 932 (15.1%) | 1,083 (17.6%) |
| 25 to 29 Minutes | 245 (4.0%) | 295 (4.8%) |
| 30 to 34 Minutes | 518 (8.4%) | 982 (15.9%) |
| 35 to 39 Minutes | 122 (2.0%) | 80 (1.3%) |
| 40 to 44 Minutes | 565 (9.2%) | 59 (1.0%) |
| 45 to 59 Minutes | 348 (5.7%) | 150 (2.4%) |
| 60 to 89 Minutes | 391 (6.4%) | 236 (3.8%) |
| 90 or more Minutes | 475 (7.7%) | 377 (6.1%) |
Time of Departure to Work by Sex in Easton
The most frequent times of departure to work in Easton are 6:00 AM to 6:29 AM (861, 14.0%) for males and 12:00 PM to 3:59 PM (991, 16.1%) for females.
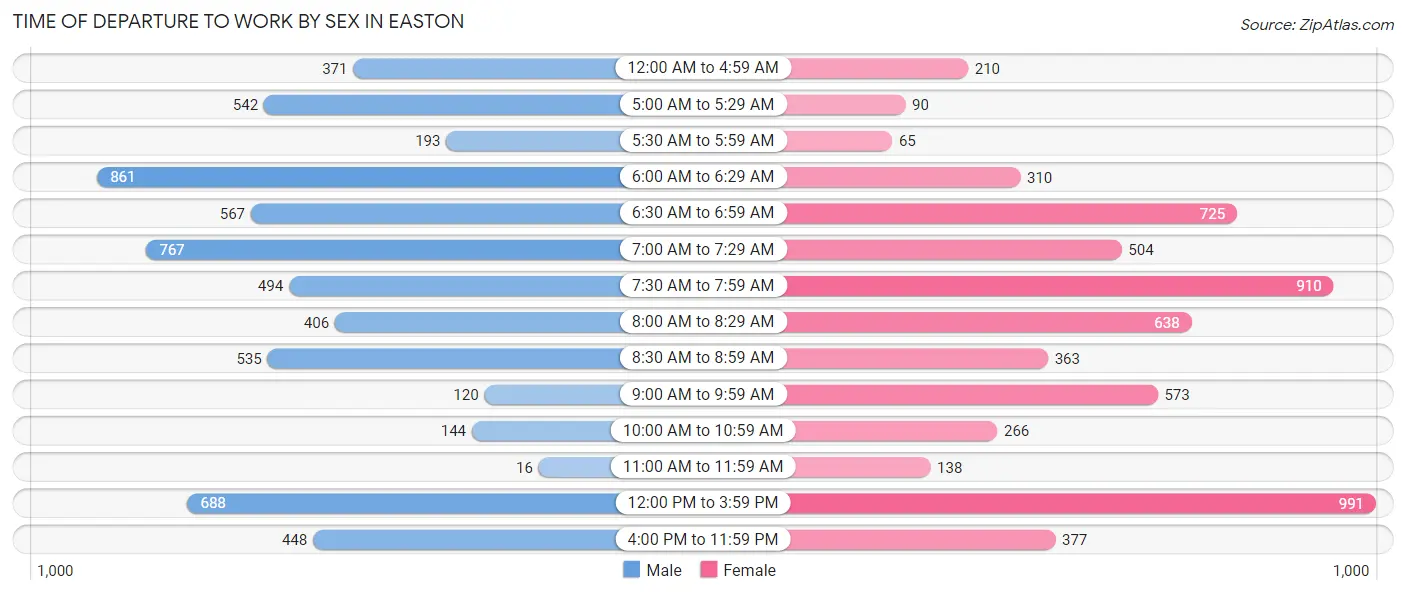
| Time of Departure | Male | Female |
| 12:00 AM to 4:59 AM | 371 (6.0%) | 210 (3.4%) |
| 5:00 AM to 5:29 AM | 542 (8.8%) | 90 (1.5%) |
| 5:30 AM to 5:59 AM | 193 (3.1%) | 65 (1.1%) |
| 6:00 AM to 6:29 AM | 861 (14.0%) | 310 (5.0%) |
| 6:30 AM to 6:59 AM | 567 (9.2%) | 725 (11.8%) |
| 7:00 AM to 7:29 AM | 767 (12.5%) | 504 (8.2%) |
| 7:30 AM to 7:59 AM | 494 (8.0%) | 910 (14.8%) |
| 8:00 AM to 8:29 AM | 406 (6.6%) | 638 (10.4%) |
| 8:30 AM to 8:59 AM | 535 (8.7%) | 363 (5.9%) |
| 9:00 AM to 9:59 AM | 120 (1.9%) | 573 (9.3%) |
| 10:00 AM to 10:59 AM | 144 (2.3%) | 266 (4.3%) |
| 11:00 AM to 11:59 AM | 16 (0.3%) | 138 (2.2%) |
| 12:00 PM to 3:59 PM | 688 (11.2%) | 991 (16.1%) |
| 4:00 PM to 11:59 PM | 448 (7.3%) | 377 (6.1%) |
| Total | 6,152 (100.0%) | 6,160 (100.0%) |
Housing Occupancy in Easton
Occupancy by Ownership in Easton
Of the total 10,442 dwellings in Easton, owner-occupied units account for 4,867 (46.6%), while renter-occupied units make up 5,575 (53.4%).
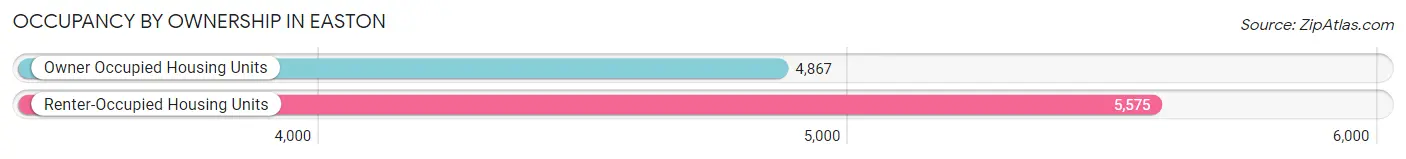
| Occupancy | # Housing Units | % Housing Units |
| Owner Occupied Housing Units | 4,867 | 46.6% |
| Renter-Occupied Housing Units | 5,575 | 53.4% |
| Total Occupied Housing Units | 10,442 | 100.0% |
Occupancy by Household Size in Easton
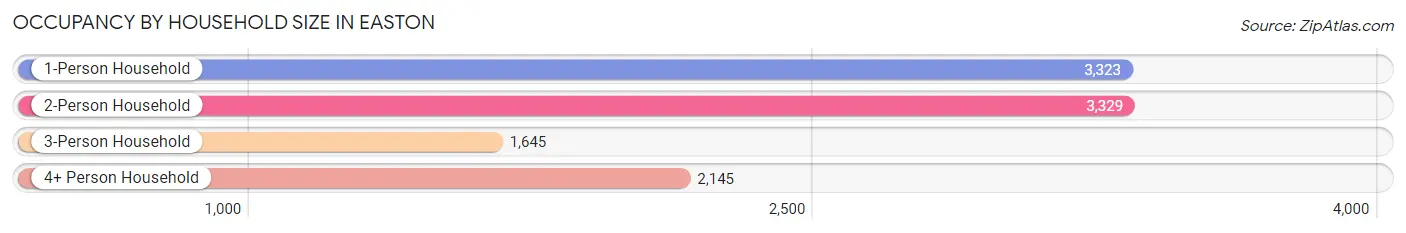
| Household Size | # Housing Units | % Housing Units |
| 1-Person Household | 3,323 | 31.8% |
| 2-Person Household | 3,329 | 31.9% |
| 3-Person Household | 1,645 | 15.8% |
| 4+ Person Household | 2,145 | 20.5% |
| Total Housing Units | 10,442 | 100.0% |
Occupancy by Ownership by Household Size in Easton
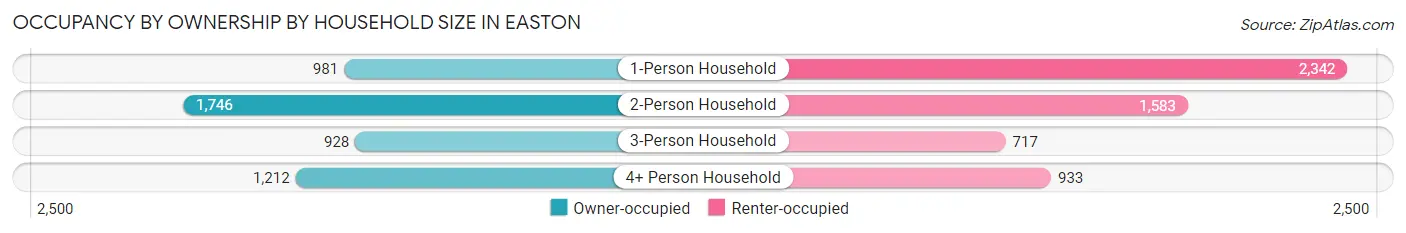
| Household Size | Owner-occupied | Renter-occupied |
| 1-Person Household | 981 (29.5%) | 2,342 (70.5%) |
| 2-Person Household | 1,746 (52.4%) | 1,583 (47.5%) |
| 3-Person Household | 928 (56.4%) | 717 (43.6%) |
| 4+ Person Household | 1,212 (56.5%) | 933 (43.5%) |
| Total Housing Units | 4,867 (46.6%) | 5,575 (53.4%) |
Occupancy by Educational Attainment in Easton
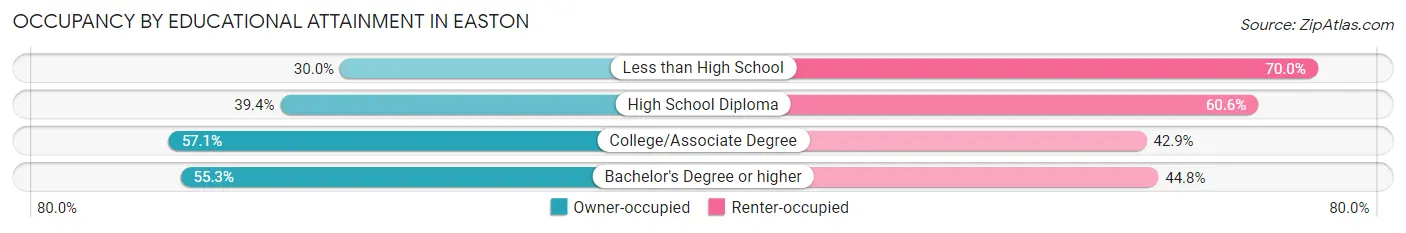
| Household Size | Owner-occupied | Renter-occupied |
| Less than High School | 457 (30.0%) | 1,067 (70.0%) |
| High School Diploma | 1,401 (39.4%) | 2,151 (60.6%) |
| College/Associate Degree | 1,342 (57.1%) | 1,007 (42.9%) |
| Bachelor's Degree or higher | 1,667 (55.2%) | 1,350 (44.8%) |
Occupancy by Age of Householder in Easton
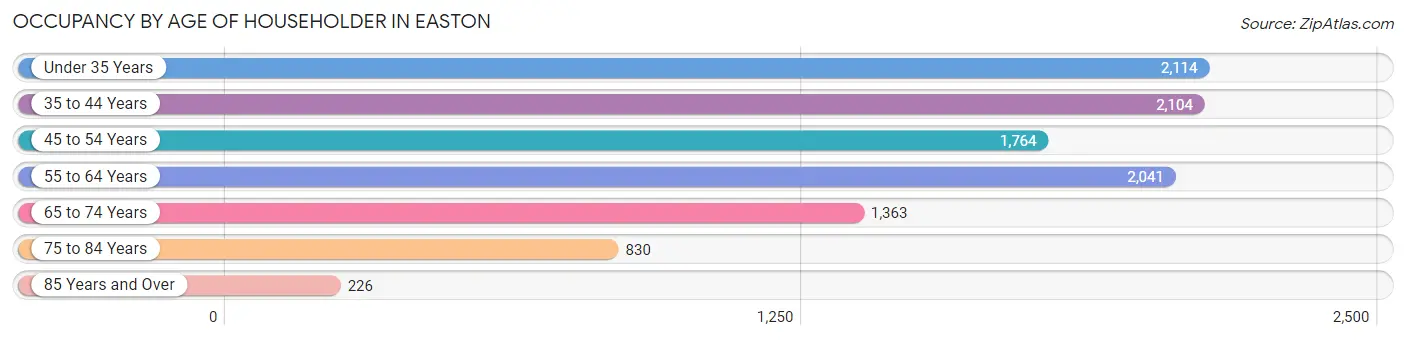
| Age Bracket | # Households | % Households |
| Under 35 Years | 2,114 | 20.3% |
| 35 to 44 Years | 2,104 | 20.2% |
| 45 to 54 Years | 1,764 | 16.9% |
| 55 to 64 Years | 2,041 | 19.6% |
| 65 to 74 Years | 1,363 | 13.1% |
| 75 to 84 Years | 830 | 8.0% |
| 85 Years and Over | 226 | 2.2% |
| Total | 10,442 | 100.0% |
Housing Finances in Easton
Median Income by Occupancy in Easton
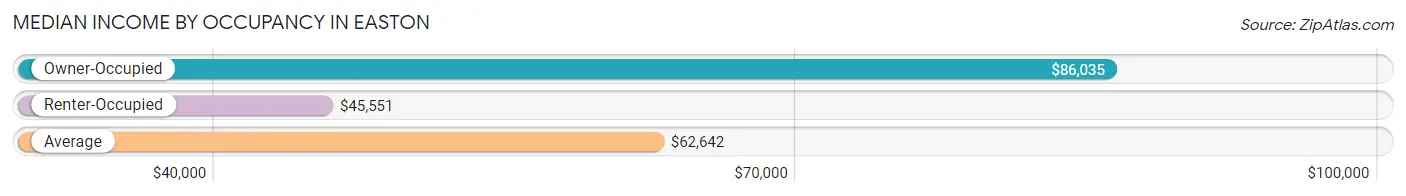
| Occupancy Type | # Households | Median Income |
| Owner-Occupied | 4,867 (46.6%) | $86,035 |
| Renter-Occupied | 5,575 (53.4%) | $45,551 |
| Average | 10,442 (100.0%) | $62,642 |
Occupancy by Householder Income Bracket in Easton
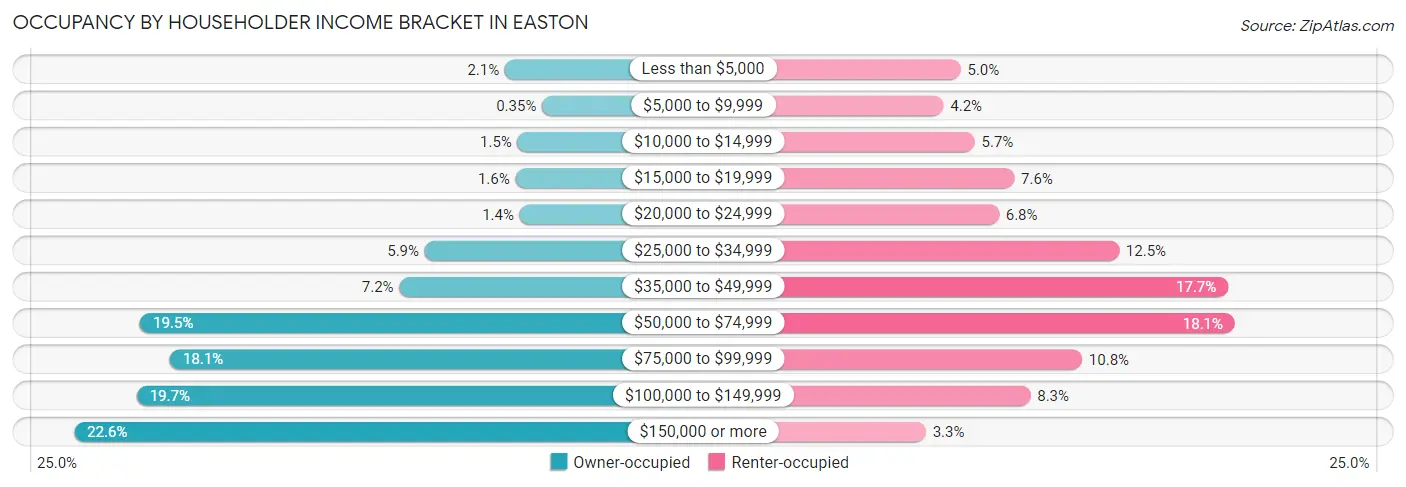
| Income Bracket | Owner-occupied | Renter-occupied |
| Less than $5,000 | 103 (2.1%) | 279 (5.0%) |
| $5,000 to $9,999 | 17 (0.4%) | 233 (4.2%) |
| $10,000 to $14,999 | 74 (1.5%) | 316 (5.7%) |
| $15,000 to $19,999 | 79 (1.6%) | 421 (7.5%) |
| $20,000 to $24,999 | 69 (1.4%) | 380 (6.8%) |
| $25,000 to $34,999 | 289 (5.9%) | 699 (12.5%) |
| $35,000 to $49,999 | 348 (7.1%) | 989 (17.7%) |
| $50,000 to $74,999 | 949 (19.5%) | 1,007 (18.1%) |
| $75,000 to $99,999 | 880 (18.1%) | 601 (10.8%) |
| $100,000 to $149,999 | 957 (19.7%) | 464 (8.3%) |
| $150,000 or more | 1,102 (22.6%) | 186 (3.3%) |
| Total | 4,867 (100.0%) | 5,575 (100.0%) |
Monthly Housing Cost Tiers in Easton
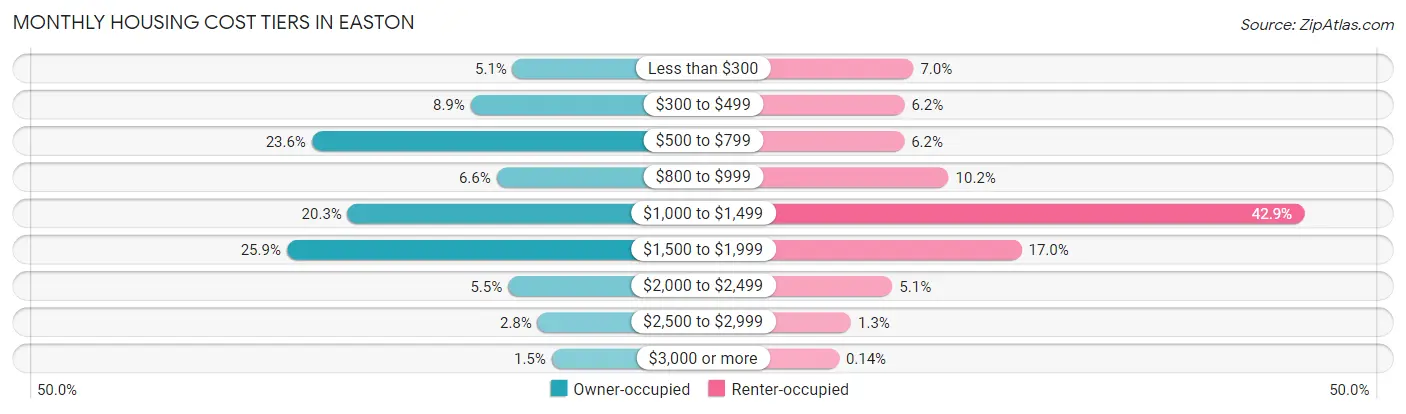
| Monthly Cost | Owner-occupied | Renter-occupied |
| Less than $300 | 247 (5.1%) | 390 (7.0%) |
| $300 to $499 | 435 (8.9%) | 344 (6.2%) |
| $500 to $799 | 1,147 (23.6%) | 343 (6.1%) |
| $800 to $999 | 319 (6.6%) | 571 (10.2%) |
| $1,000 to $1,499 | 986 (20.3%) | 2,394 (42.9%) |
| $1,500 to $1,999 | 1,259 (25.9%) | 945 (17.0%) |
| $2,000 to $2,499 | 267 (5.5%) | 282 (5.1%) |
| $2,500 to $2,999 | 135 (2.8%) | 70 (1.3%) |
| $3,000 or more | 72 (1.5%) | 8 (0.1%) |
| Total | 4,867 (100.0%) | 5,575 (100.0%) |
Physical Housing Characteristics in Easton
Housing Structures in Easton
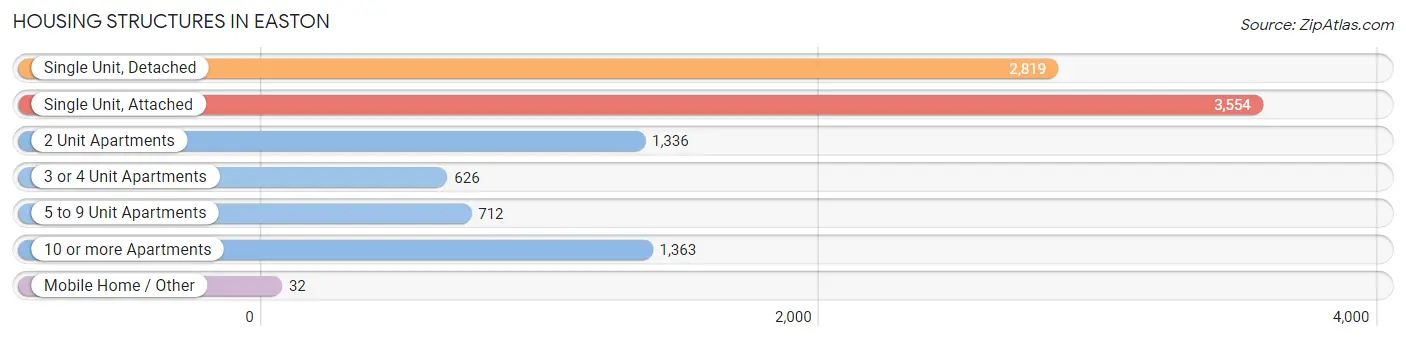
| Structure Type | # Housing Units | % Housing Units |
| Single Unit, Detached | 2,819 | 27.0% |
| Single Unit, Attached | 3,554 | 34.0% |
| 2 Unit Apartments | 1,336 | 12.8% |
| 3 or 4 Unit Apartments | 626 | 6.0% |
| 5 to 9 Unit Apartments | 712 | 6.8% |
| 10 or more Apartments | 1,363 | 13.1% |
| Mobile Home / Other | 32 | 0.3% |
| Total | 10,442 | 100.0% |
Housing Structures by Occupancy in Easton
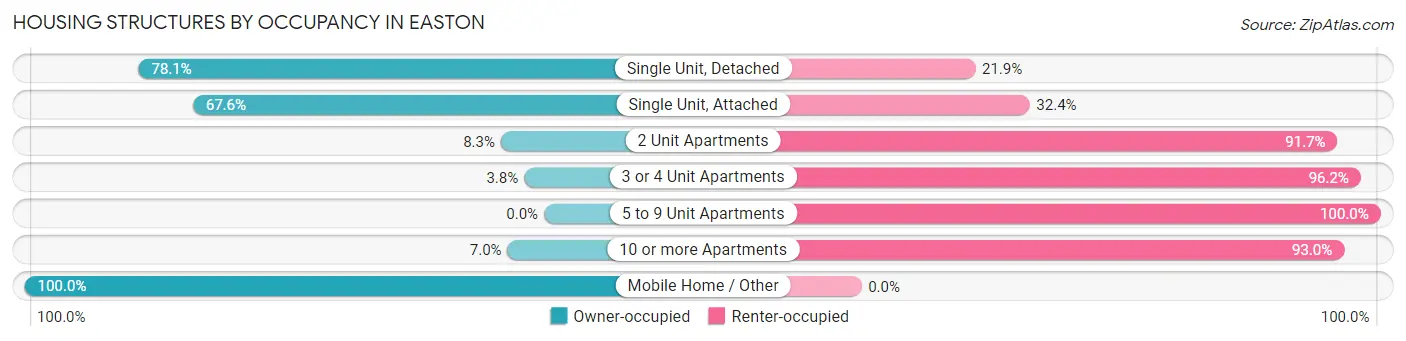
| Structure Type | Owner-occupied | Renter-occupied |
| Single Unit, Detached | 2,201 (78.1%) | 618 (21.9%) |
| Single Unit, Attached | 2,403 (67.6%) | 1,151 (32.4%) |
| 2 Unit Apartments | 111 (8.3%) | 1,225 (91.7%) |
| 3 or 4 Unit Apartments | 24 (3.8%) | 602 (96.2%) |
| 5 to 9 Unit Apartments | 0 (0.0%) | 712 (100.0%) |
| 10 or more Apartments | 96 (7.0%) | 1,267 (93.0%) |
| Mobile Home / Other | 32 (100.0%) | 0 (0.0%) |
| Total | 4,867 (46.6%) | 5,575 (53.4%) |
Housing Structures by Number of Rooms in Easton
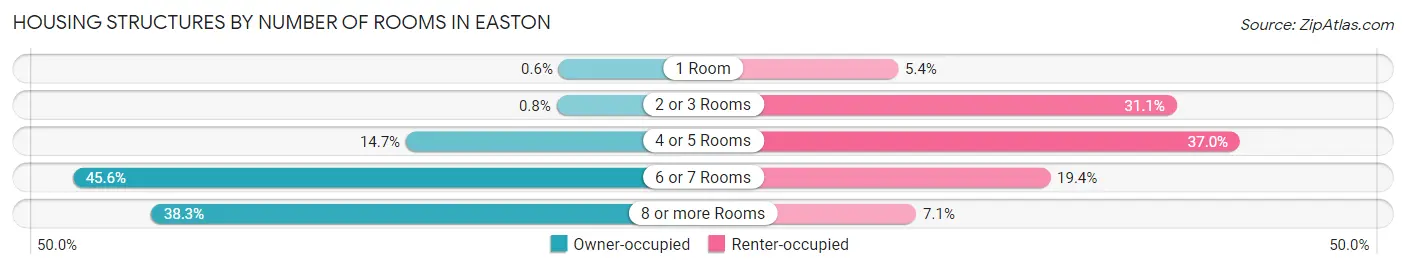
| Number of Rooms | Owner-occupied | Renter-occupied |
| 1 Room | 29 (0.6%) | 300 (5.4%) |
| 2 or 3 Rooms | 39 (0.8%) | 1,736 (31.1%) |
| 4 or 5 Rooms | 717 (14.7%) | 2,062 (37.0%) |
| 6 or 7 Rooms | 2,217 (45.6%) | 1,084 (19.4%) |
| 8 or more Rooms | 1,865 (38.3%) | 393 (7.0%) |
| Total | 4,867 (100.0%) | 5,575 (100.0%) |
Housing Structure by Heating Type in Easton
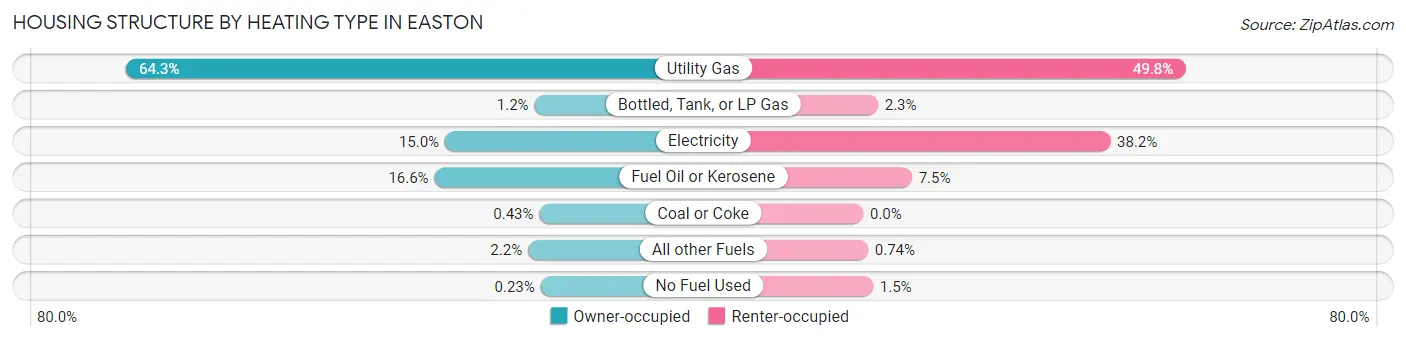
| Heating Type | Owner-occupied | Renter-occupied |
| Utility Gas | 3,130 (64.3%) | 2,775 (49.8%) |
| Bottled, Tank, or LP Gas | 58 (1.2%) | 127 (2.3%) |
| Electricity | 731 (15.0%) | 2,129 (38.2%) |
| Fuel Oil or Kerosene | 810 (16.6%) | 419 (7.5%) |
| Coal or Coke | 21 (0.4%) | 0 (0.0%) |
| All other Fuels | 106 (2.2%) | 41 (0.7%) |
| No Fuel Used | 11 (0.2%) | 84 (1.5%) |
| Total | 4,867 (100.0%) | 5,575 (100.0%) |
Household Vehicle Usage in Easton
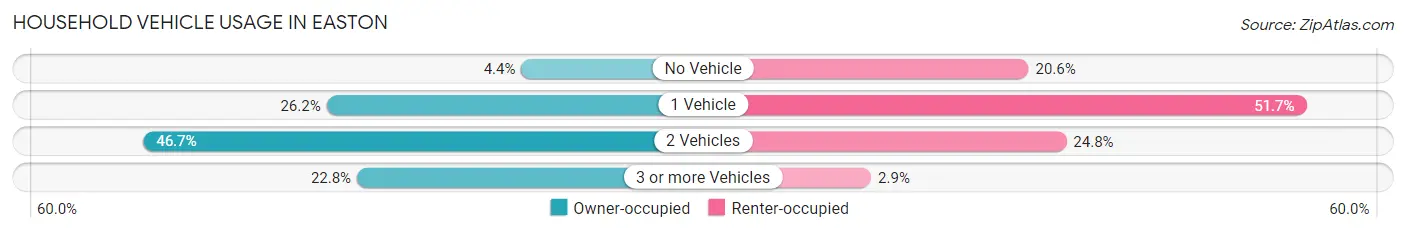
| Vehicles per Household | Owner-occupied | Renter-occupied |
| No Vehicle | 212 (4.4%) | 1,147 (20.6%) |
| 1 Vehicle | 1,274 (26.2%) | 2,881 (51.7%) |
| 2 Vehicles | 2,273 (46.7%) | 1,383 (24.8%) |
| 3 or more Vehicles | 1,108 (22.8%) | 164 (2.9%) |
| Total | 4,867 (100.0%) | 5,575 (100.0%) |
Real Estate & Mortgages in Easton
Real Estate and Mortgage Overview in Easton
| Characteristic | Without Mortgage | With Mortgage |
| Housing Units | 1,840 | 3,027 |
| Median Property Value | $141,600 | $157,700 |
| Median Household Income | $67,768 | $828 |
| Monthly Housing Costs | $598 | $72 |
| Real Estate Taxes | $3,138 | $40 |
Property Value by Mortgage Status in Easton
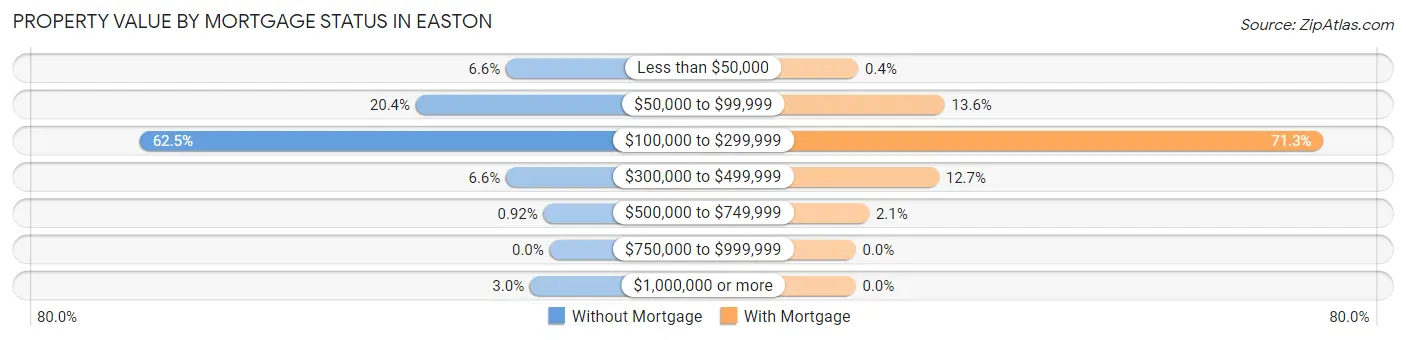
| Property Value | Without Mortgage | With Mortgage |
| Less than $50,000 | 122 (6.6%) | 12 (0.4%) |
| $50,000 to $99,999 | 375 (20.4%) | 411 (13.6%) |
| $100,000 to $299,999 | 1,149 (62.5%) | 2,158 (71.3%) |
| $300,000 to $499,999 | 122 (6.6%) | 384 (12.7%) |
| $500,000 to $749,999 | 17 (0.9%) | 62 (2.1%) |
| $750,000 to $999,999 | 0 (0.0%) | 0 (0.0%) |
| $1,000,000 or more | 55 (3.0%) | 0 (0.0%) |
| Total | 1,840 (100.0%) | 3,027 (100.0%) |
Household Income by Mortgage Status in Easton
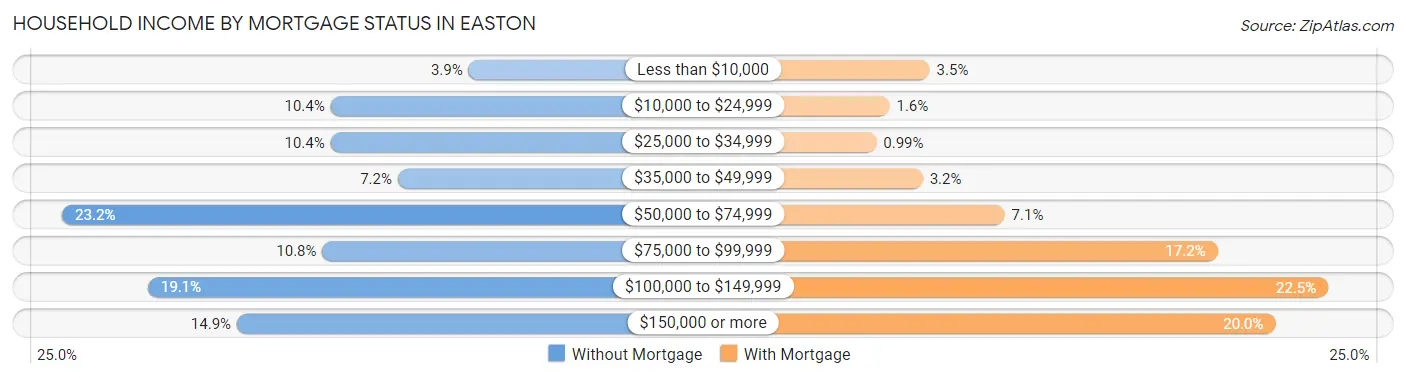
| Household Income | Without Mortgage | With Mortgage |
| Less than $10,000 | 71 (3.9%) | 107 (3.5%) |
| $10,000 to $24,999 | 192 (10.4%) | 49 (1.6%) |
| $25,000 to $34,999 | 192 (10.4%) | 30 (1.0%) |
| $35,000 to $49,999 | 133 (7.2%) | 97 (3.2%) |
| $50,000 to $74,999 | 427 (23.2%) | 215 (7.1%) |
| $75,000 to $99,999 | 199 (10.8%) | 522 (17.2%) |
| $100,000 to $149,999 | 352 (19.1%) | 681 (22.5%) |
| $150,000 or more | 274 (14.9%) | 605 (20.0%) |
| Total | 1,840 (100.0%) | 3,027 (100.0%) |
Property Value to Household Income Ratio in Easton
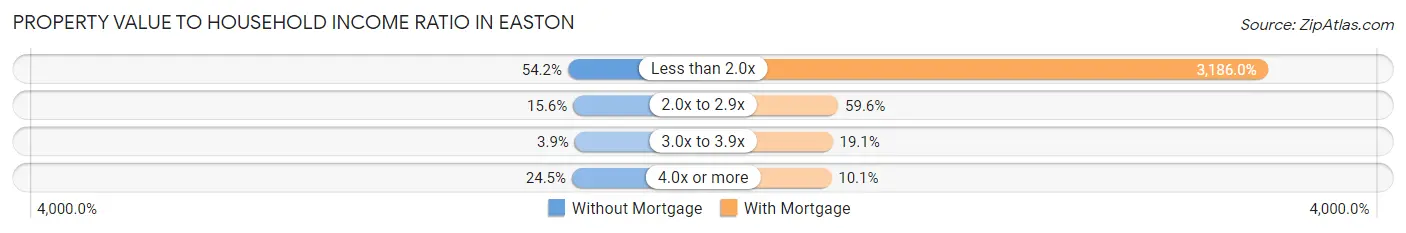
| Value-to-Income Ratio | Without Mortgage | With Mortgage |
| Less than 2.0x | 997 (54.2%) | 96,441 (3,186.0%) |
| 2.0x to 2.9x | 287 (15.6%) | 1,803 (59.6%) |
| 3.0x to 3.9x | 72 (3.9%) | 578 (19.1%) |
| 4.0x or more | 451 (24.5%) | 307 (10.1%) |
| Total | 1,840 (100.0%) | 3,027 (100.0%) |
Real Estate Taxes by Mortgage Status in Easton
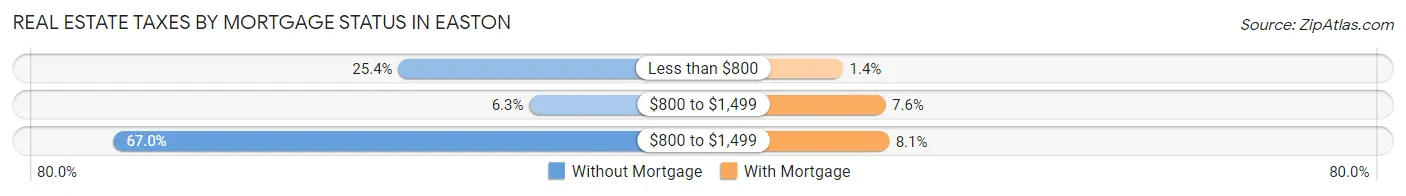
| Property Taxes | Without Mortgage | With Mortgage |
| Less than $800 | 467 (25.4%) | 42 (1.4%) |
| $800 to $1,499 | 115 (6.2%) | 230 (7.6%) |
| $800 to $1,499 | 1,233 (67.0%) | 246 (8.1%) |
| Total | 1,840 (100.0%) | 3,027 (100.0%) |
Health & Disability in Easton
Health Insurance Coverage by Age in Easton
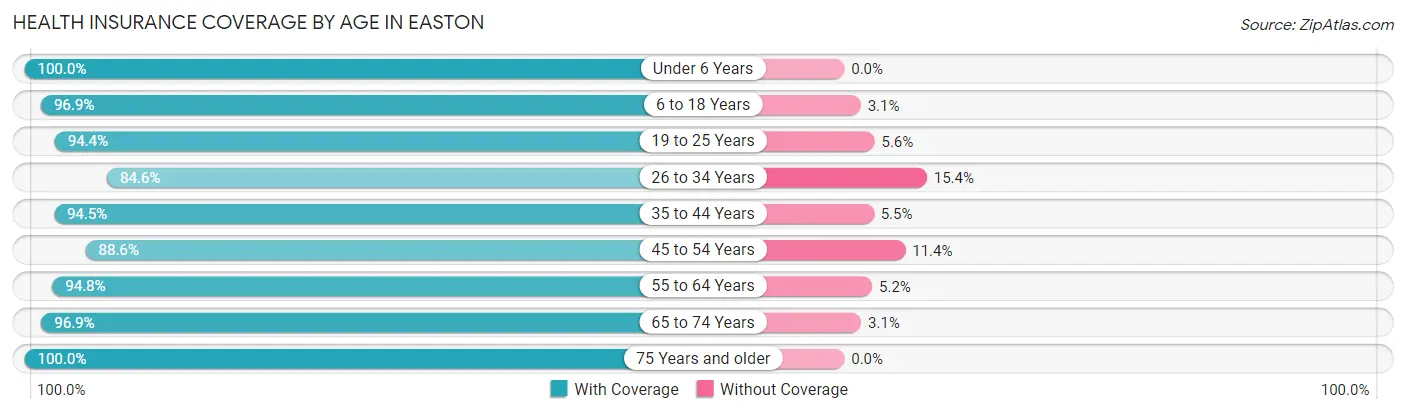
| Age Bracket | With Coverage | Without Coverage |
| Under 6 Years | 1,328 (100.0%) | 0 (0.0%) |
| 6 to 18 Years | 4,663 (96.9%) | 147 (3.1%) |
| 19 to 25 Years | 4,197 (94.4%) | 251 (5.6%) |
| 26 to 34 Years | 2,768 (84.6%) | 503 (15.4%) |
| 35 to 44 Years | 3,760 (94.5%) | 218 (5.5%) |
| 45 to 54 Years | 2,787 (88.6%) | 358 (11.4%) |
| 55 to 64 Years | 2,950 (94.8%) | 161 (5.2%) |
| 65 to 74 Years | 2,324 (96.9%) | 75 (3.1%) |
| 75 Years and older | 1,447 (100.0%) | 0 (0.0%) |
| Total | 26,224 (93.9%) | 1,713 (6.1%) |
Health Insurance Coverage by Citizenship Status in Easton
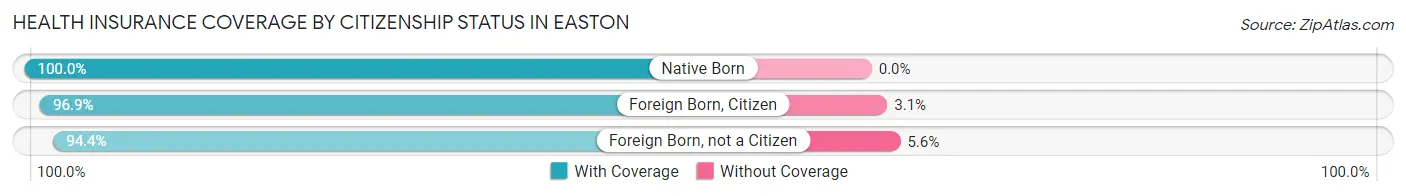
| Citizenship Status | With Coverage | Without Coverage |
| Native Born | 1,328 (100.0%) | 0 (0.0%) |
| Foreign Born, Citizen | 4,663 (96.9%) | 147 (3.1%) |
| Foreign Born, not a Citizen | 4,197 (94.4%) | 251 (5.6%) |
Health Insurance Coverage by Household Income in Easton
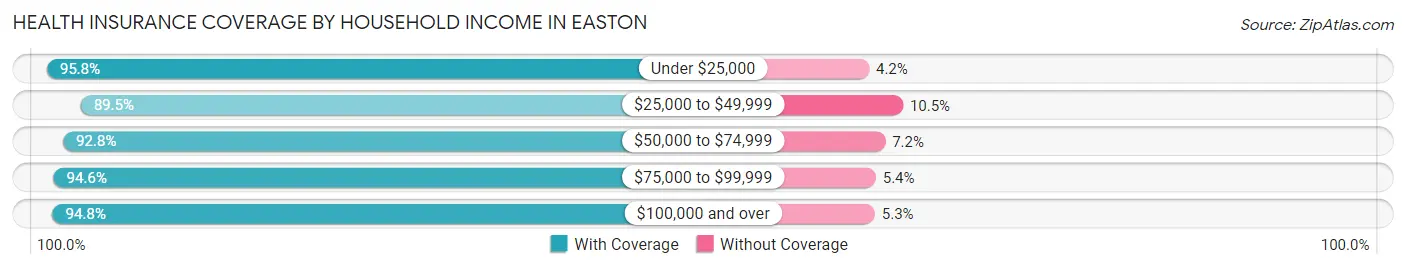
| Household Income | With Coverage | Without Coverage |
| Under $25,000 | 3,216 (95.8%) | 140 (4.2%) |
| $25,000 to $49,999 | 5,155 (89.5%) | 606 (10.5%) |
| $50,000 to $74,999 | 3,761 (92.8%) | 292 (7.2%) |
| $75,000 to $99,999 | 3,658 (94.6%) | 210 (5.4%) |
| $100,000 and over | 7,577 (94.8%) | 420 (5.2%) |
Public vs Private Health Insurance Coverage by Age in Easton
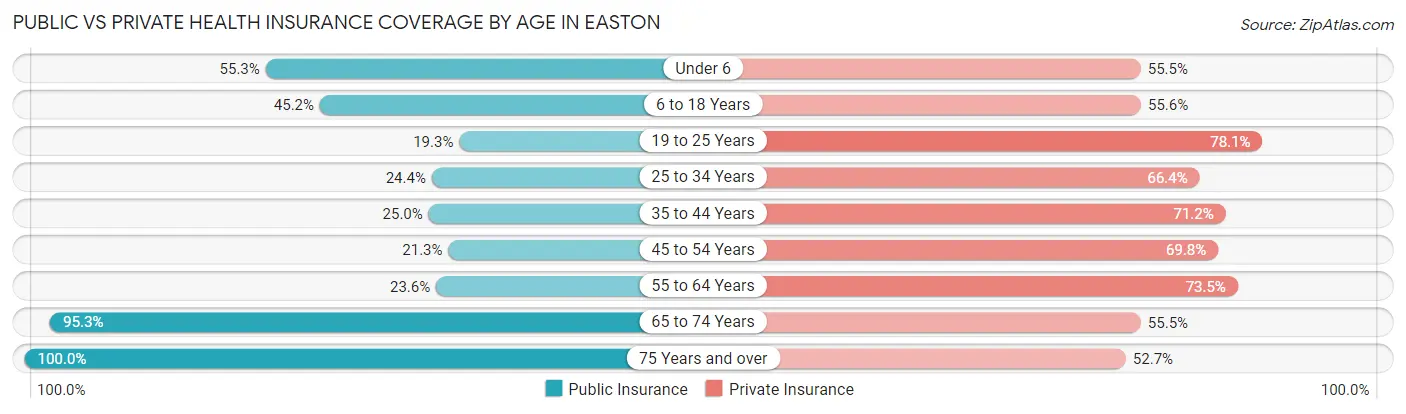
| Age Bracket | Public Insurance | Private Insurance |
| Under 6 | 734 (55.3%) | 737 (55.5%) |
| 6 to 18 Years | 2,174 (45.2%) | 2,672 (55.5%) |
| 19 to 25 Years | 860 (19.3%) | 3,472 (78.1%) |
| 25 to 34 Years | 799 (24.4%) | 2,172 (66.4%) |
| 35 to 44 Years | 995 (25.0%) | 2,833 (71.2%) |
| 45 to 54 Years | 671 (21.3%) | 2,196 (69.8%) |
| 55 to 64 Years | 735 (23.6%) | 2,286 (73.5%) |
| 65 to 74 Years | 2,285 (95.3%) | 1,332 (55.5%) |
| 75 Years and over | 1,447 (100.0%) | 763 (52.7%) |
| Total | 10,700 (38.3%) | 18,463 (66.1%) |
Disability Status by Sex by Age in Easton
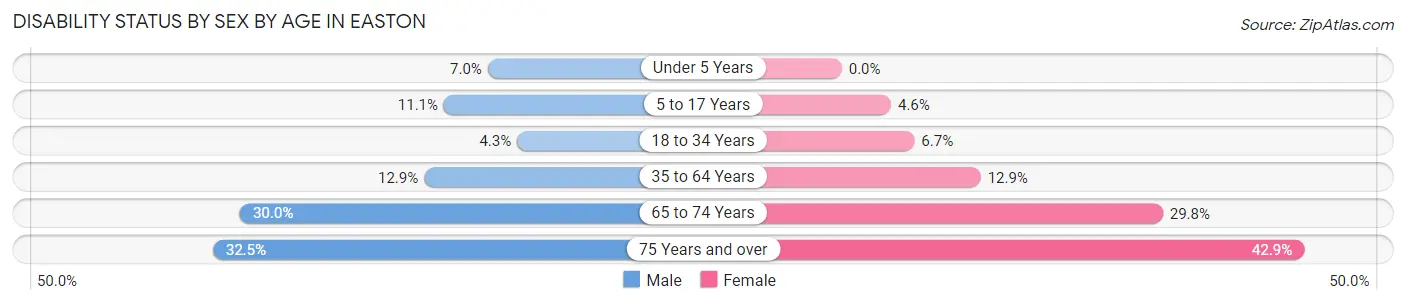
| Age Bracket | Male | Female |
| Under 5 Years | 36 (7.0%) | 0 (0.0%) |
| 5 to 17 Years | 257 (11.1%) | 87 (4.6%) |
| 18 to 34 Years | 187 (4.3%) | 283 (6.7%) |
| 35 to 64 Years | 659 (12.9%) | 662 (12.9%) |
| 65 to 74 Years | 313 (30.0%) | 404 (29.8%) |
| 75 Years and over | 175 (32.5%) | 390 (42.9%) |
Disability Class by Sex by Age in Easton
Disability Class: Hearing Difficulty
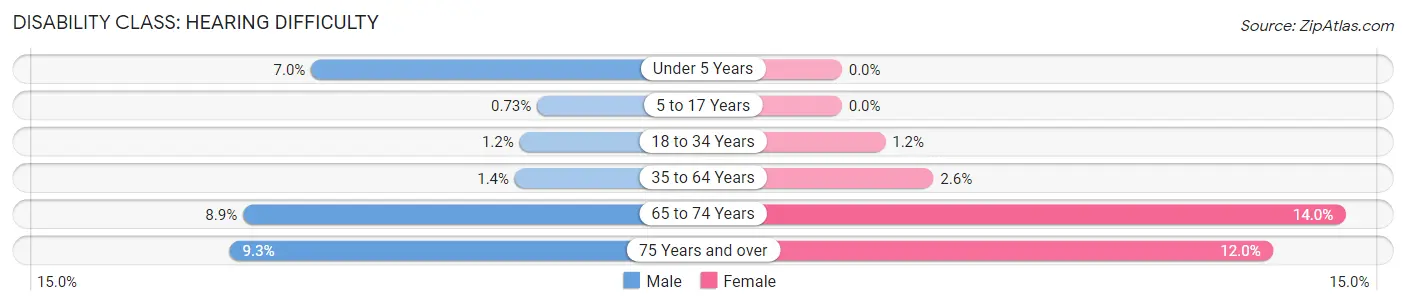
| Age Bracket | Male | Female |
| Under 5 Years | 36 (7.0%) | 0 (0.0%) |
| 5 to 17 Years | 17 (0.7%) | 0 (0.0%) |
| 18 to 34 Years | 53 (1.2%) | 51 (1.2%) |
| 35 to 64 Years | 69 (1.3%) | 131 (2.5%) |
| 65 to 74 Years | 93 (8.9%) | 190 (14.0%) |
| 75 Years and over | 50 (9.3%) | 109 (12.0%) |
Disability Class: Vision Difficulty
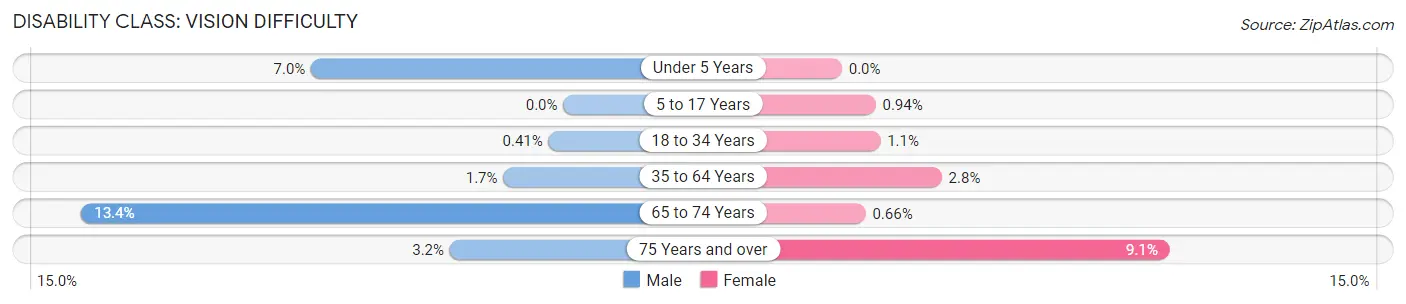
| Age Bracket | Male | Female |
| Under 5 Years | 36 (7.0%) | 0 (0.0%) |
| 5 to 17 Years | 0 (0.0%) | 18 (0.9%) |
| 18 to 34 Years | 18 (0.4%) | 45 (1.1%) |
| 35 to 64 Years | 85 (1.7%) | 143 (2.8%) |
| 65 to 74 Years | 140 (13.4%) | 9 (0.7%) |
| 75 Years and over | 17 (3.2%) | 83 (9.1%) |
Disability Class: Cognitive Difficulty
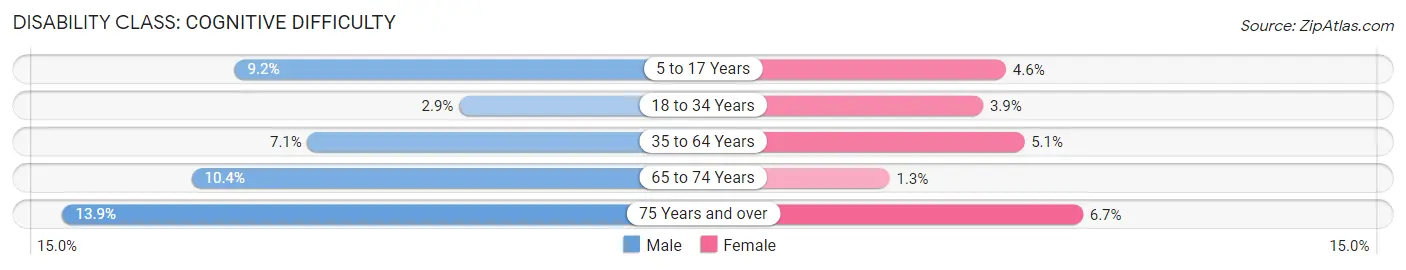
| Age Bracket | Male | Female |
| 5 to 17 Years | 212 (9.1%) | 87 (4.6%) |
| 18 to 34 Years | 126 (2.9%) | 165 (3.9%) |
| 35 to 64 Years | 363 (7.1%) | 261 (5.1%) |
| 65 to 74 Years | 108 (10.3%) | 18 (1.3%) |
| 75 Years and over | 75 (13.9%) | 61 (6.7%) |
Disability Class: Ambulatory Difficulty
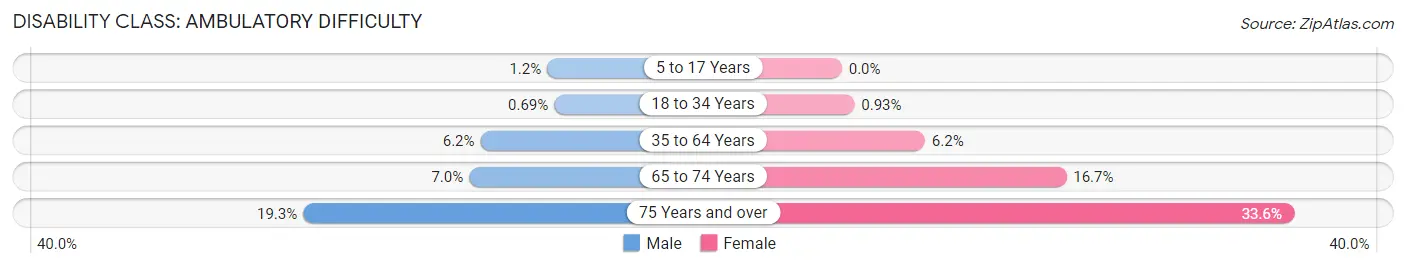
| Age Bracket | Male | Female |
| 5 to 17 Years | 28 (1.2%) | 0 (0.0%) |
| 18 to 34 Years | 30 (0.7%) | 39 (0.9%) |
| 35 to 64 Years | 314 (6.2%) | 317 (6.2%) |
| 65 to 74 Years | 73 (7.0%) | 226 (16.7%) |
| 75 Years and over | 104 (19.3%) | 305 (33.6%) |
Disability Class: Self-Care Difficulty
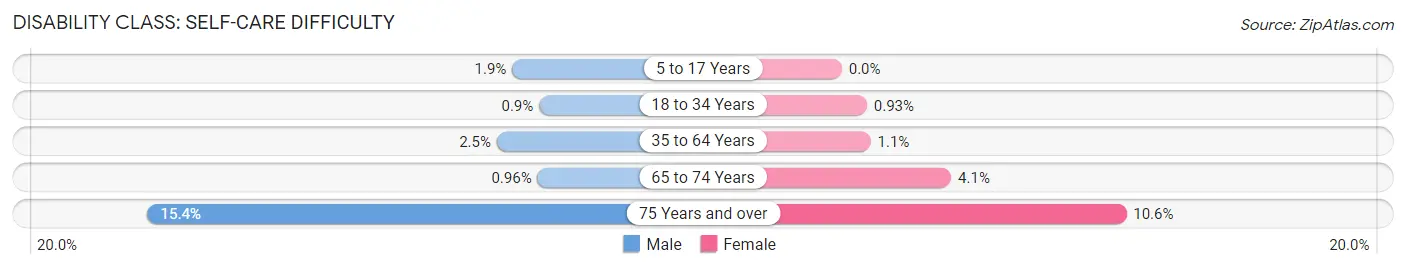
| Age Bracket | Male | Female |
| 5 to 17 Years | 44 (1.9%) | 0 (0.0%) |
| 18 to 34 Years | 39 (0.9%) | 39 (0.9%) |
| 35 to 64 Years | 126 (2.5%) | 55 (1.1%) |
| 65 to 74 Years | 10 (1.0%) | 55 (4.1%) |
| 75 Years and over | 83 (15.4%) | 96 (10.6%) |
Technology Access in Easton
Computing Device Access in Easton
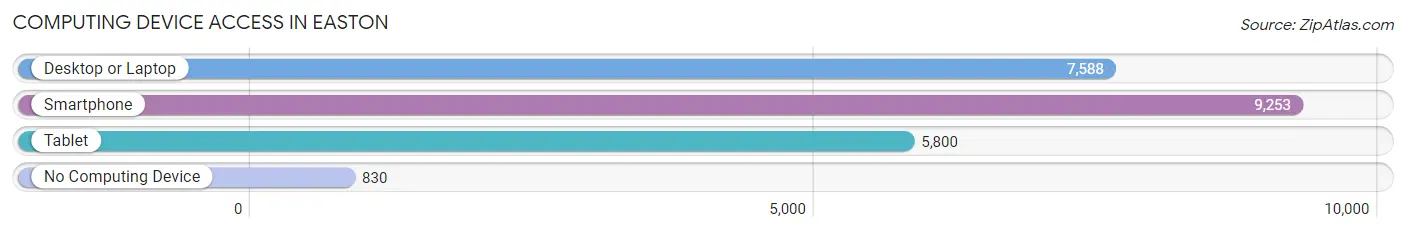
| Device Type | # Households | % Households |
| Desktop or Laptop | 7,588 | 72.7% |
| Smartphone | 9,253 | 88.6% |
| Tablet | 5,800 | 55.5% |
| No Computing Device | 830 | 8.0% |
| Total | 10,442 | 100.0% |
Internet Access in Easton
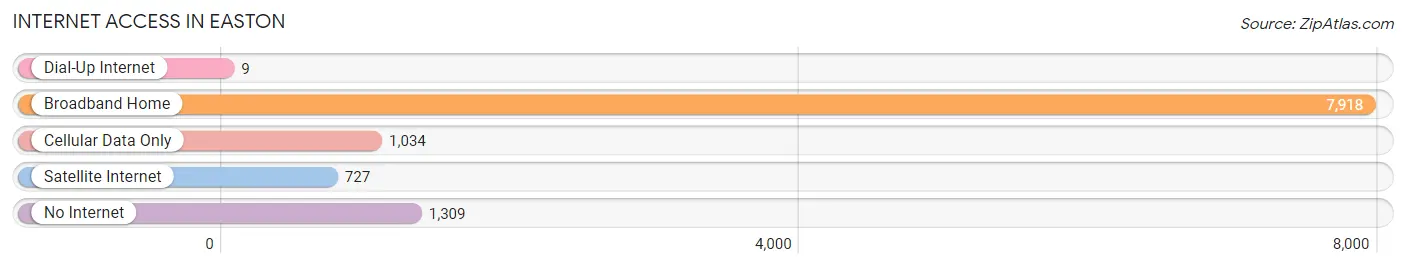
| Internet Type | # Households | % Households |
| Dial-Up Internet | 9 | 0.1% |
| Broadband Home | 7,918 | 75.8% |
| Cellular Data Only | 1,034 | 9.9% |
| Satellite Internet | 727 | 7.0% |
| No Internet | 1,309 | 12.5% |
| Total | 10,442 | 100.0% |
Easton Summary
Easton, Pennsylvania is a city located in Northampton County in the Lehigh Valley region of the state. It is situated along the Delaware River, approximately 55 miles north of Philadelphia and 90 miles west of New York City. The city has a population of approximately 26,800 people, making it the largest city in Northampton County.
History
Easton was founded in 1752 by William Penn, who named it after his son Thomas Easton. The city was originally part of Bucks County, but was later annexed to Northampton County in 1838. During the Revolutionary War, Easton was a major supply center for the Continental Army. The city was also the site of the first public reading of the Declaration of Independence in Pennsylvania.
In the 19th century, Easton became an important industrial center, with several iron and steel mills, as well as a major hub for the Lehigh Canal. The city was also home to several prominent businesses, including the Easton Iron Works, the Easton Rolling Mill, and the Easton Foundry.
Geography
Easton is located in the Lehigh Valley region of Pennsylvania, along the Delaware River. The city is situated at the confluence of the Lehigh and Delaware Rivers, and is bordered by the cities of Bethlehem and Allentown to the south, and Phillipsburg, New Jersey to the east. The city covers an area of 8.3 square miles, and has an elevation of approximately 400 feet.
Climate
Easton has a humid continental climate, with hot, humid summers and cold, snowy winters. The average annual temperature is around 48°F, with an average high of around 73°F in the summer and an average low of around 24°F in the winter. The city receives an average of 43 inches of precipitation per year, with the majority of it falling in the summer months.
Economy
Easton’s economy is largely based on manufacturing and services. The city is home to several major employers, including Crayola, Victaulic, and Easton Hospital. The city is also home to several educational institutions, including Lafayette College, Northampton Community College, and Easton Area School District.
Demographics
As of the 2010 census, Easton had a population of 26,800 people. The racial makeup of the city was 79.2% White, 11.3% African American, 0.4% Native American, 2.2% Asian, and 6.9% from other races. The median household income was $41,945, and the median family income was $50,945. The city’s poverty rate was 17.2%.
Easton is a diverse city, with a large Hispanic population. The city is also home to a large number of immigrants, with the largest groups coming from Mexico, India, and the Dominican Republic. The city is also home to a large number of religious institutions, including several churches, synagogues, and mosques.
Common Questions
What is Per Capita Income in Easton?
Per Capita income in Easton is $29,083.
What is the Median Family Income in Easton?
Median Family Income in Easton is $76,563.
What is the Median Household income in Easton?
Median Household Income in Easton is $62,642.
What is Income or Wage Gap in Easton?
Income or Wage Gap in Easton is 22.8%.
Women in Easton earn 77.2 cents for every dollar earned by a man.
What is Family Income Deficit in Easton?
Family Income Deficit in Easton is $10,997.
Families that are below poverty line in Easton earn $10,997 less on average than the poverty threshold level.
What is Inequality or Gini Index in Easton?
Inequality or Gini Index in Easton is 0.43.
What is the Total Population of Easton?
Total Population of Easton is 28,883.
What is the Total Male Population of Easton?
Total Male Population of Easton is 14,556.
What is the Total Female Population of Easton?
Total Female Population of Easton is 14,327.
What is the Ratio of Males per 100 Females in Easton?
There are 101.60 Males per 100 Females in Easton.
What is the Ratio of Females per 100 Males in Easton?
There are 98.43 Females per 100 Males in Easton.
What is the Median Population Age in Easton?
Median Population Age in Easton is 35.5 Years.
What is the Average Family Size in Easton
Average Family Size in Easton is 3.1 People.
What is the Average Household Size in Easton
Average Household Size in Easton is 2.4 People.
How Large is the Labor Force in Easton?
There are 14,789 People in the Labor Forcein in Easton.
What is the Percentage of People in the Labor Force in Easton?
60.5% of People are in the Labor Force in Easton.
What is the Unemployment Rate in Easton?
Unemployment Rate in Easton is 4.4%.