Oxford borough, PA Map & Demographics
Oxford borough Overview
$34,333
PER CAPITA INCOME
$90,938
AVG FAMILY INCOME
$59,989
AVG HOUSEHOLD INCOME
27.8%
WAGE / INCOME GAP [ % ]
72.2¢/ $1
WAGE / INCOME GAP [ $ ]
0.49
INEQUALITY / GINI INDEX
5,724
TOTAL POPULATION
2,920
MALE POPULATION
2,804
FEMALE POPULATION
104.14
MALES / 100 FEMALES
96.03
FEMALES / 100 MALES
36.6
MEDIAN AGE
3.2
AVG FAMILY SIZE
2.7
AVG HOUSEHOLD SIZE
2,431
LABOR FORCE [ PEOPLE ]
58.7%
PERCENT IN LABOR FORCE
4.8%
UNEMPLOYMENT RATE
Income in Oxford borough
Income Overview in Oxford borough
Per Capita Income in Oxford borough is $34,333, while median incomes of families and households are $90,938 and $59,989 respectively.
| Characteristic | Number | Measure |
| Per Capita Income | 5,724 | $34,333 |
| Median Family Income | 1,369 | $90,938 |
| Mean Family Income | 1,369 | $101,796 |
| Median Household Income | 2,119 | $59,989 |
| Mean Household Income | 2,119 | $91,430 |
| Income Deficit | 1,369 | $0 |
| Wage / Income Gap (%) | 5,724 | 27.79% |
| Wage / Income Gap ($) | 5,724 | 72.21¢ per $1 |
| Gini / Inequality Index | 5,724 | 0.49 |
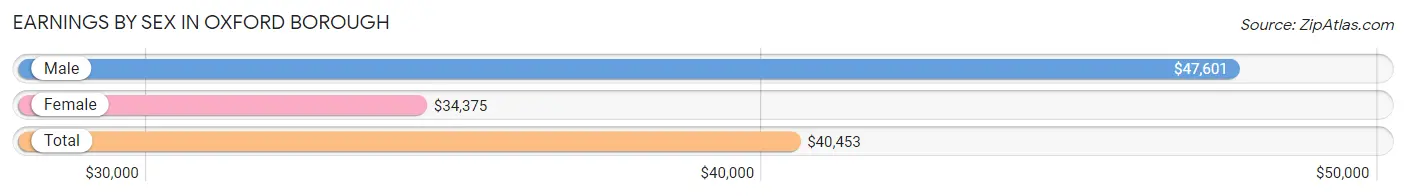
Earnings by Sex in Oxford borough
Average Earnings in Oxford borough are $40,453, $47,601 for men and $34,375 for women, a difference of 27.8%.
| Sex | Number | Average Earnings |
| Male | 1,293 (47.9%) | $47,601 |
| Female | 1,406 (52.1%) | $34,375 |
| Total | 2,699 (100.0%) | $40,453 |
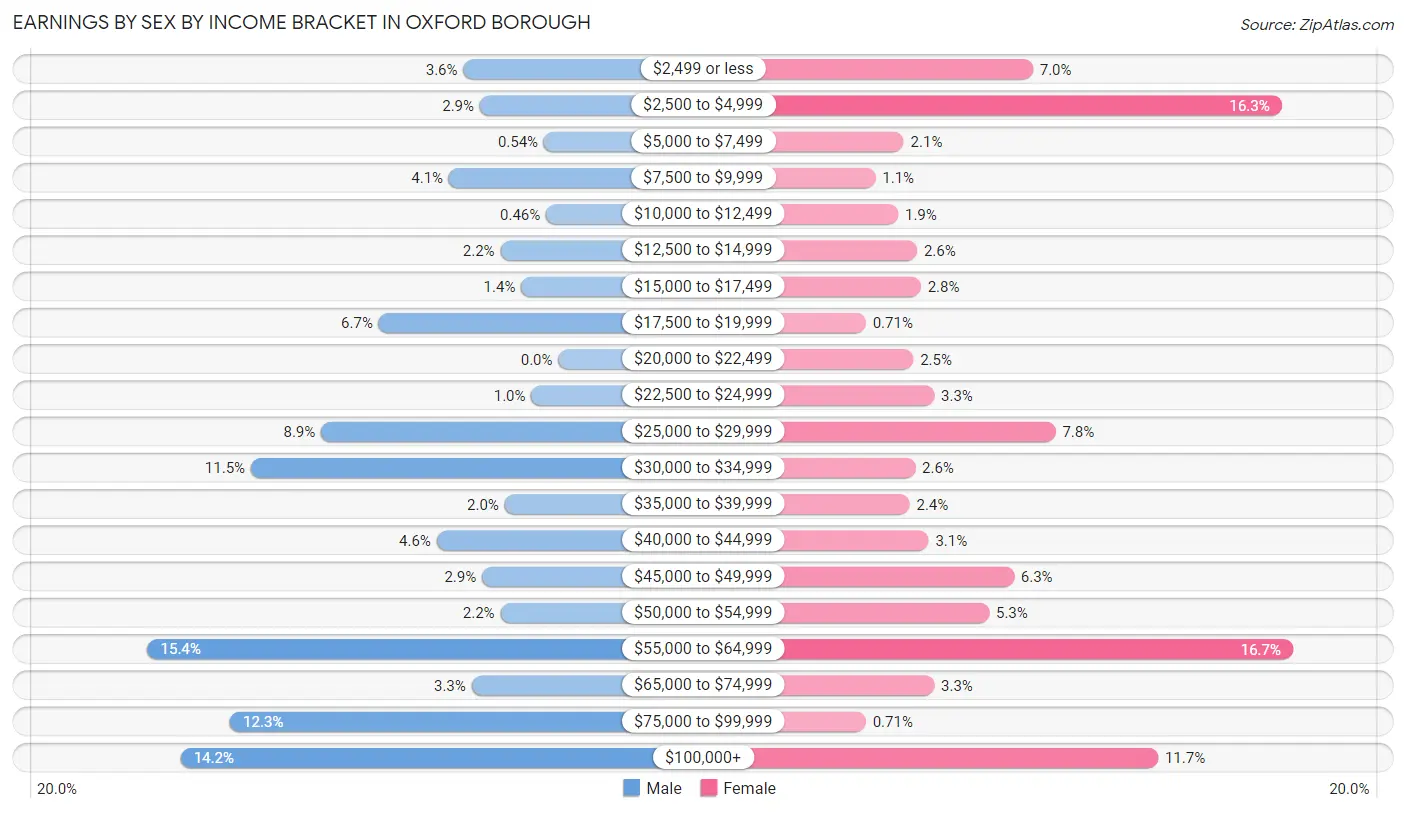
Earnings by Sex by Income Bracket in Oxford borough
The most common earnings brackets in Oxford borough are $55,000 to $64,999 for men (199 | 15.4%) and $55,000 to $64,999 for women (235 | 16.7%).
| Income | Male | Female |
| $2,499 or less | 46 (3.6%) | 98 (7.0%) |
| $2,500 to $4,999 | 38 (2.9%) | 229 (16.3%) |
| $5,000 to $7,499 | 7 (0.5%) | 30 (2.1%) |
| $7,500 to $9,999 | 53 (4.1%) | 15 (1.1%) |
| $10,000 to $12,499 | 6 (0.5%) | 27 (1.9%) |
| $12,500 to $14,999 | 28 (2.2%) | 37 (2.6%) |
| $15,000 to $17,499 | 18 (1.4%) | 39 (2.8%) |
| $17,500 to $19,999 | 87 (6.7%) | 10 (0.7%) |
| $20,000 to $22,499 | 0 (0.0%) | 35 (2.5%) |
| $22,500 to $24,999 | 13 (1.0%) | 46 (3.3%) |
| $25,000 to $29,999 | 115 (8.9%) | 110 (7.8%) |
| $30,000 to $34,999 | 149 (11.5%) | 36 (2.6%) |
| $35,000 to $39,999 | 26 (2.0%) | 33 (2.4%) |
| $40,000 to $44,999 | 59 (4.6%) | 43 (3.1%) |
| $45,000 to $49,999 | 37 (2.9%) | 88 (6.3%) |
| $50,000 to $54,999 | 28 (2.2%) | 75 (5.3%) |
| $55,000 to $64,999 | 199 (15.4%) | 235 (16.7%) |
| $65,000 to $74,999 | 42 (3.3%) | 46 (3.3%) |
| $75,000 to $99,999 | 159 (12.3%) | 10 (0.7%) |
| $100,000+ | 183 (14.1%) | 164 (11.7%) |
| Total | 1,293 (100.0%) | 1,406 (100.0%) |
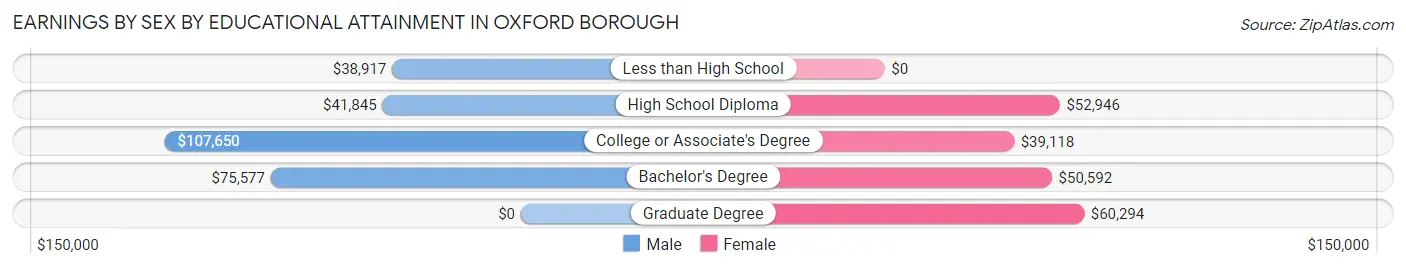
Earnings by Sex by Educational Attainment in Oxford borough
Average earnings in Oxford borough are $57,946 for men and $45,338 for women, a difference of 21.8%. Men with an educational attainment of college or associate's degree enjoy the highest average annual earnings of $107,650, while those with less than high school education earn the least with $38,917. Women with an educational attainment of graduate degree earn the most with the average annual earnings of $60,294, while those with college or associate's degree education have the smallest earnings of $39,118.
| Educational Attainment | Male Income | Female Income |
| Less than High School | $38,917 | $0 |
| High School Diploma | $41,845 | $52,946 |
| College or Associate's Degree | $107,650 | $39,118 |
| Bachelor's Degree | $75,577 | $50,592 |
| Graduate Degree | - | - |
| Total | $57,946 | $45,338 |
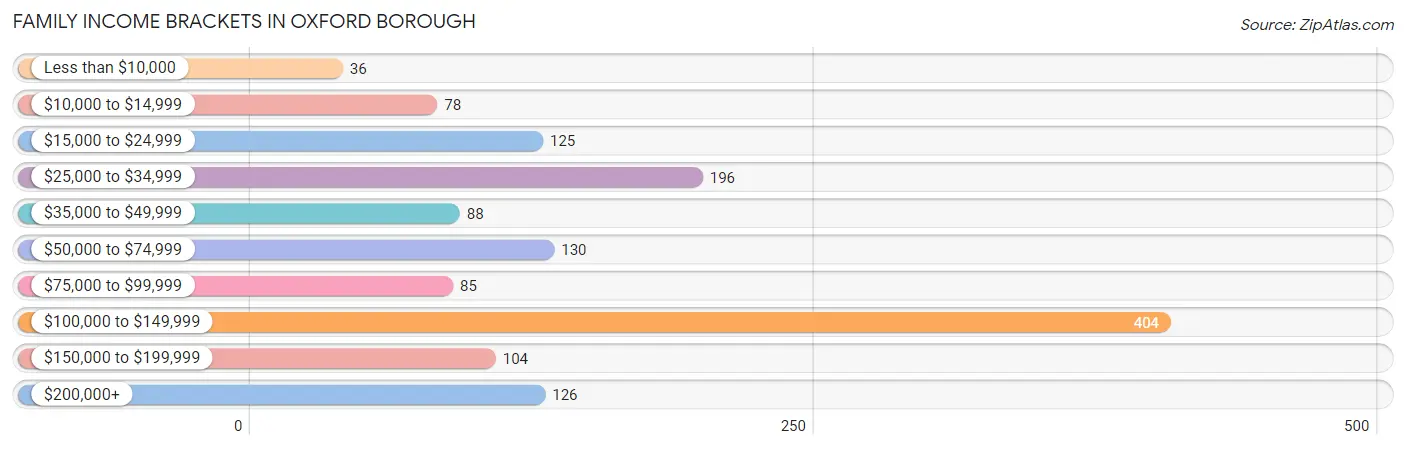
Family Income in Oxford borough
Family Income Brackets in Oxford borough
According to the Oxford borough family income data, there are 404 families falling into the $100,000 to $149,999 income range, which is the most common income bracket and makes up 29.5% of all families. Conversely, the less than $10,000 income bracket is the least frequent group with only 36 families (2.6%) belonging to this category.
| Income Bracket | # Families | % Families |
| Less than $10,000 | 36 | 2.6% |
| $10,000 to $14,999 | 78 | 5.7% |
| $15,000 to $24,999 | 125 | 9.1% |
| $25,000 to $34,999 | 196 | 14.3% |
| $35,000 to $49,999 | 88 | 6.4% |
| $50,000 to $74,999 | 130 | 9.5% |
| $75,000 to $99,999 | 85 | 6.2% |
| $100,000 to $149,999 | 404 | 29.5% |
| $150,000 to $199,999 | 104 | 7.6% |
| $200,000+ | 126 | 9.2% |
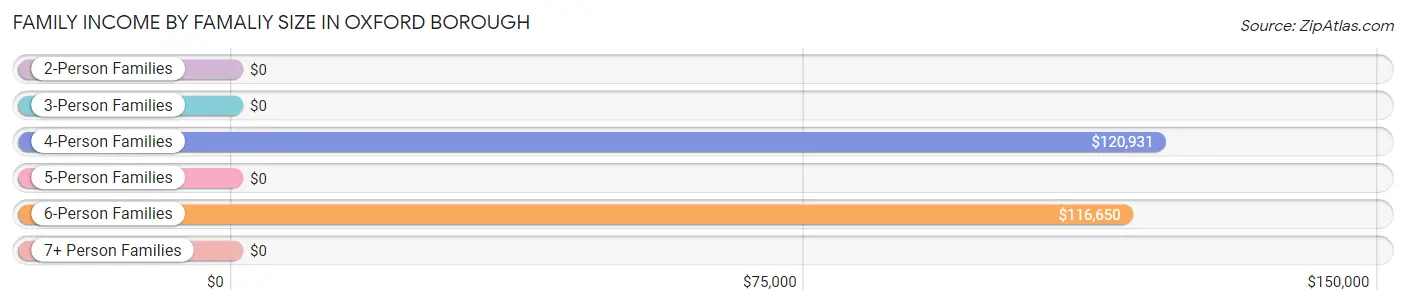
Family Income by Famaliy Size in Oxford borough
4-person families (204 | 14.9%) account for the highest median family income in Oxford borough with $120,931 per family, while 4-person families (204 | 14.9%) have the highest median income of $30,233 per family member.
| Income Bracket | # Families | Median Income |
| 2-Person Families | 559 (40.8%) | $0 |
| 3-Person Families | 300 (21.9%) | $0 |
| 4-Person Families | 204 (14.9%) | $120,931 |
| 5-Person Families | 188 (13.7%) | $0 |
| 6-Person Families | 99 (7.2%) | $116,650 |
| 7+ Person Families | 19 (1.4%) | $0 |
| Total | 1,369 (100.0%) | $90,938 |
Family Income by Number of Earners in Oxford borough
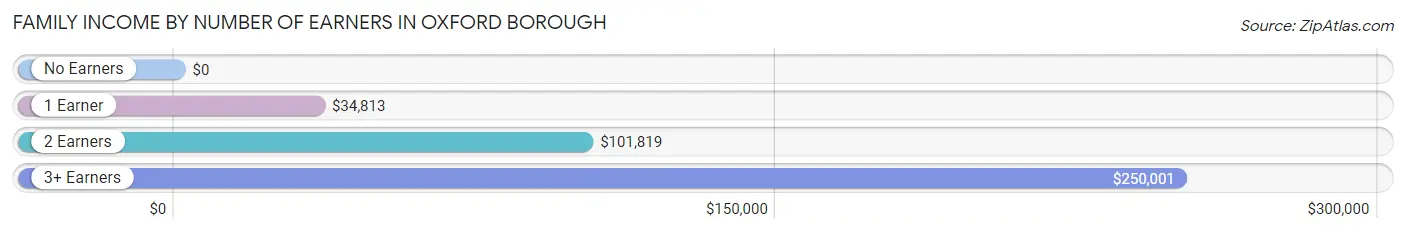
| Number of Earners | # Families | Median Income |
| No Earners | 244 (17.8%) | $0 |
| 1 Earner | 414 (30.2%) | $34,813 |
| 2 Earners | 559 (40.8%) | $101,819 |
| 3+ Earners | 152 (11.1%) | $250,001 |
| Total | 1,369 (100.0%) | $90,938 |
Household Income in Oxford borough
Household Income Brackets in Oxford borough
With 373 households falling in the category, the $100,000 to $149,999 income range is the most frequent in Oxford borough, accounting for 17.6% of all households. In contrast, only 112 households (5.3%) fall into the less than $10,000 income bracket, making it the least populous group.
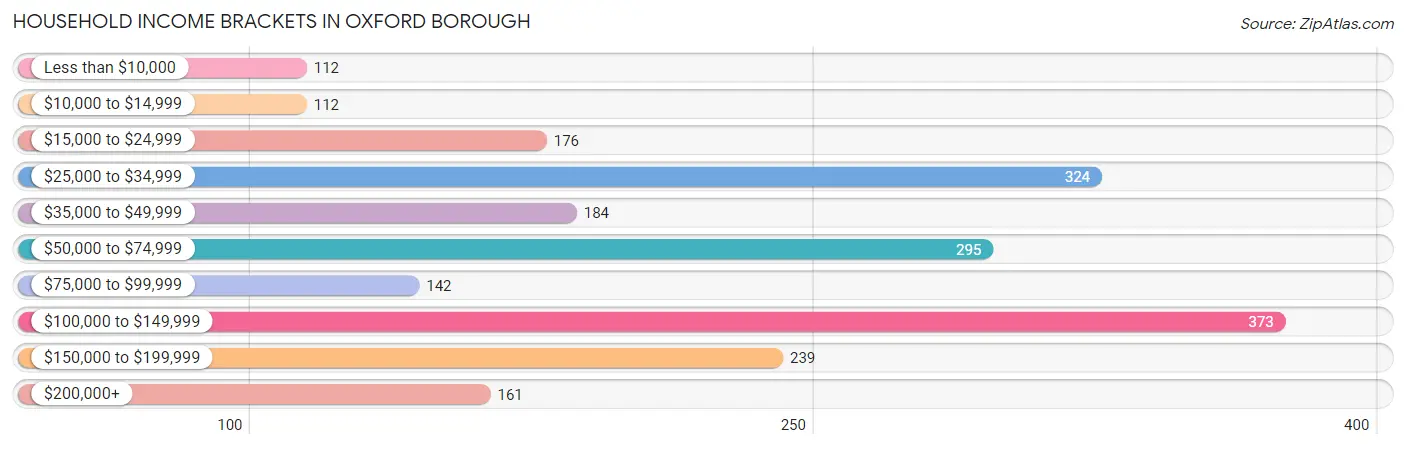
| Income Bracket | # Households | % Households |
| Less than $10,000 | 112 | 5.3% |
| $10,000 to $14,999 | 112 | 5.3% |
| $15,000 to $24,999 | 176 | 8.3% |
| $25,000 to $34,999 | 324 | 15.3% |
| $35,000 to $49,999 | 184 | 8.7% |
| $50,000 to $74,999 | 295 | 13.9% |
| $75,000 to $99,999 | 142 | 6.7% |
| $100,000 to $149,999 | 373 | 17.6% |
| $150,000 to $199,999 | 239 | 11.3% |
| $200,000+ | 161 | 7.6% |
Household Income by Householder Age in Oxford borough
The median household income in Oxford borough is $59,989, with the highest median household income of $97,857 found in the 45 to 64 years age bracket for the primary householder. A total of 638 households (30.1%) fall into this category. Meanwhile, the 15 to 24 years age bracket for the primary householder has the lowest median household income of $0, with 101 households (4.8%) in this group.
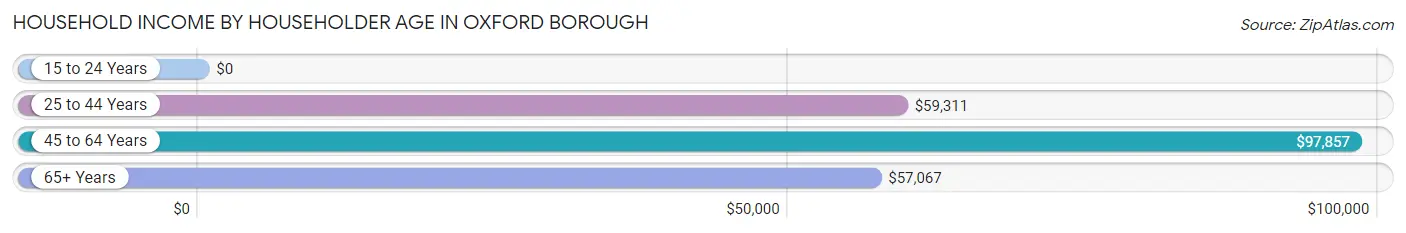
| Income Bracket | # Households | Median Income |
| 15 to 24 Years | 101 (4.8%) | $0 |
| 25 to 44 Years | 641 (30.2%) | $59,311 |
| 45 to 64 Years | 638 (30.1%) | $97,857 |
| 65+ Years | 739 (34.9%) | $57,067 |
| Total | 2,119 (100.0%) | $59,989 |
Poverty in Oxford borough
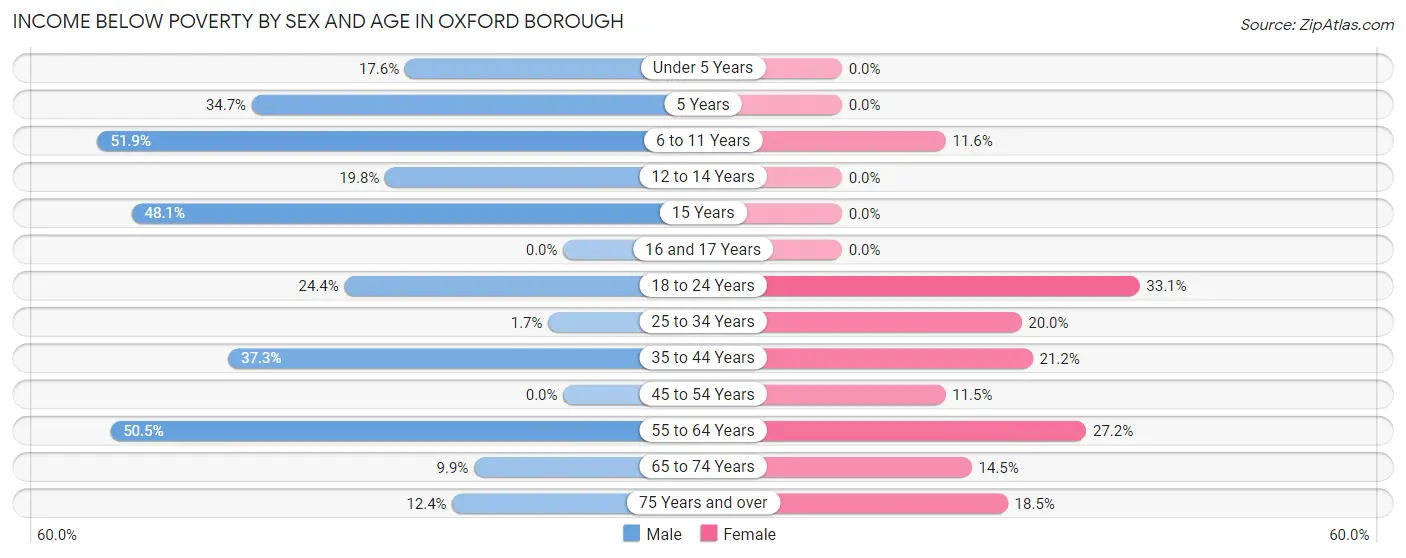
Income Below Poverty by Sex and Age in Oxford borough
With 24.7% poverty level for males and 16.4% for females among the residents of Oxford borough, 6 to 11 year old males and 18 to 24 year old females are the most vulnerable to poverty, with 139 males (51.9%) and 57 females (33.1%) in their respective age groups living below the poverty level.
| Age Bracket | Male | Female |
| Under 5 Years | 49 (17.6%) | 0 (0.0%) |
| 5 Years | 43 (34.7%) | 0 (0.0%) |
| 6 to 11 Years | 139 (51.9%) | 34 (11.6%) |
| 12 to 14 Years | 49 (19.8%) | 0 (0.0%) |
| 15 Years | 25 (48.1%) | 0 (0.0%) |
| 16 and 17 Years | 0 (0.0%) | 0 (0.0%) |
| 18 to 24 Years | 38 (24.4%) | 57 (33.1%) |
| 25 to 34 Years | 5 (1.7%) | 63 (20.0%) |
| 35 to 44 Years | 115 (37.3%) | 89 (21.2%) |
| 45 to 54 Years | 0 (0.0%) | 34 (11.5%) |
| 55 to 64 Years | 219 (50.5%) | 65 (27.2%) |
| 65 to 74 Years | 14 (9.9%) | 35 (14.5%) |
| 75 Years and over | 21 (12.3%) | 70 (18.5%) |
| Total | 717 (24.7%) | 447 (16.4%) |
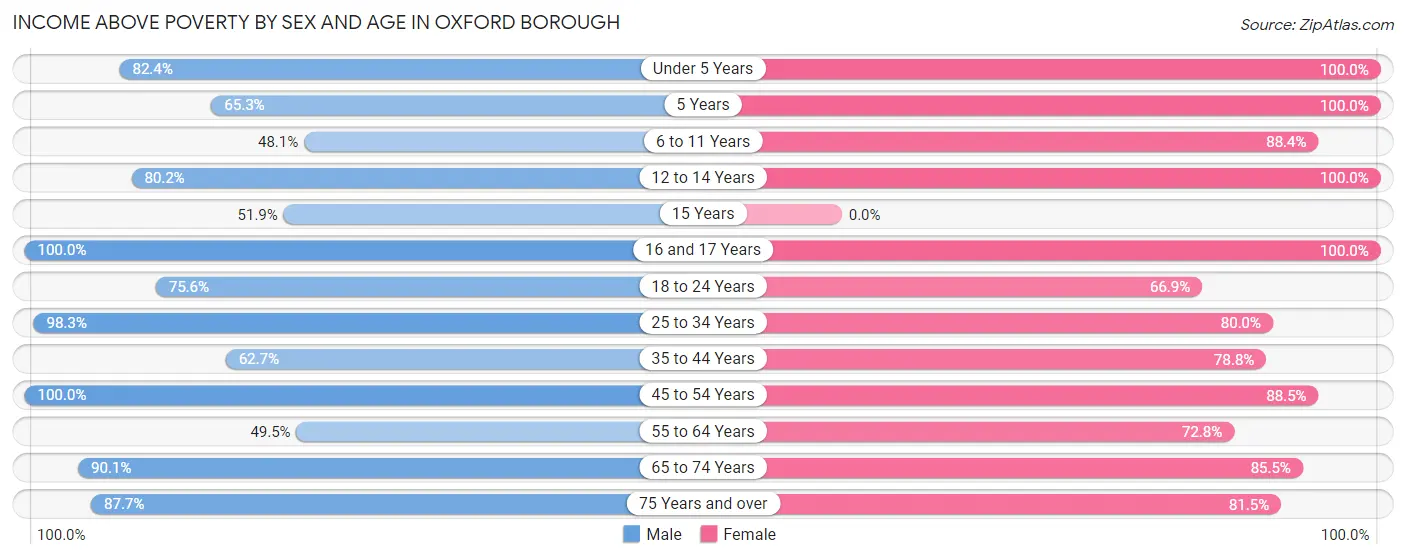
Income Above Poverty by Sex and Age in Oxford borough
According to the poverty statistics in Oxford borough, males aged 16 and 17 years and females aged under 5 years are the age groups that are most secure financially, with 100.0% of males and 100.0% of females in these age groups living above the poverty line.
| Age Bracket | Male | Female |
| Under 5 Years | 229 (82.4%) | 240 (100.0%) |
| 5 Years | 81 (65.3%) | 16 (100.0%) |
| 6 to 11 Years | 129 (48.1%) | 260 (88.4%) |
| 12 to 14 Years | 198 (80.2%) | 63 (100.0%) |
| 15 Years | 27 (51.9%) | 0 (0.0%) |
| 16 and 17 Years | 105 (100.0%) | 46 (100.0%) |
| 18 to 24 Years | 118 (75.6%) | 115 (66.9%) |
| 25 to 34 Years | 295 (98.3%) | 252 (80.0%) |
| 35 to 44 Years | 193 (62.7%) | 330 (78.8%) |
| 45 to 54 Years | 324 (100.0%) | 261 (88.5%) |
| 55 to 64 Years | 215 (49.5%) | 174 (72.8%) |
| 65 to 74 Years | 127 (90.1%) | 207 (85.5%) |
| 75 Years and over | 149 (87.6%) | 309 (81.5%) |
| Total | 2,190 (75.3%) | 2,273 (83.6%) |
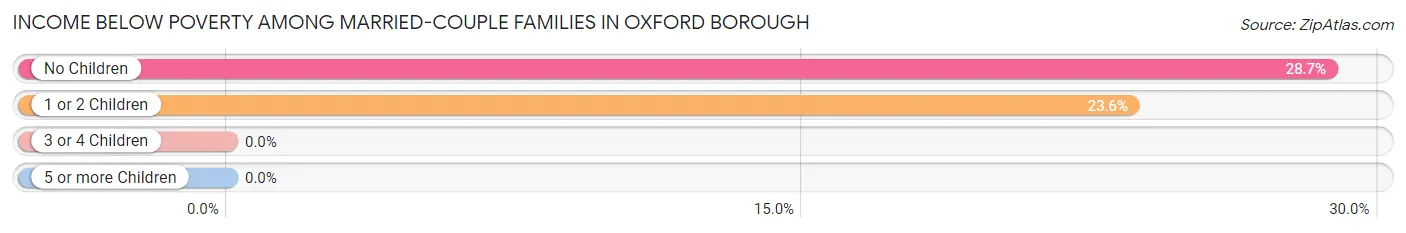
Income Below Poverty Among Married-Couple Families in Oxford borough
The poverty statistics for married-couple families in Oxford borough show that 21.5% or 138 of the total 643 families live below the poverty line. Families with no children have the highest poverty rate of 28.7%, comprising of 81 families. On the other hand, families with 3 or 4 children have the lowest poverty rate of 0.0%, which includes 0 families.
| Children | Above Poverty | Below Poverty |
| No Children | 201 (71.3%) | 81 (28.7%) |
| 1 or 2 Children | 185 (76.4%) | 57 (23.5%) |
| 3 or 4 Children | 106 (100.0%) | 0 (0.0%) |
| 5 or more Children | 13 (100.0%) | 0 (0.0%) |
| Total | 505 (78.5%) | 138 (21.5%) |
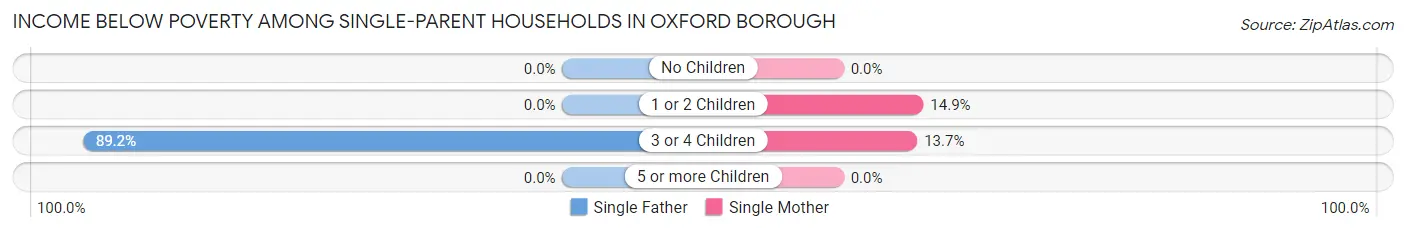
Income Below Poverty Among Single-Parent Households in Oxford borough
According to the poverty data in Oxford borough, 38.6% or 115 single-father households and 10.3% or 44 single-mother households are living below the poverty line. Among single-father households, those with 3 or 4 children have the highest poverty rate, with 115 households (89.1%) experiencing poverty. Likewise, among single-mother households, those with 1 or 2 children have the highest poverty rate, with 34 households (14.8%) falling below the poverty line.
| Children | Single Father | Single Mother |
| No Children | 0 (0.0%) | 0 (0.0%) |
| 1 or 2 Children | 0 (0.0%) | 34 (14.8%) |
| 3 or 4 Children | 115 (89.1%) | 10 (13.7%) |
| 5 or more Children | 0 (0.0%) | 0 (0.0%) |
| Total | 115 (38.6%) | 44 (10.3%) |
Income Below Poverty Among Married-Couple vs Single-Parent Households in Oxford borough
The poverty data for Oxford borough shows that 138 of the married-couple family households (21.5%) and 159 of the single-parent households (21.9%) are living below the poverty level. Within the married-couple family households, those with no children have the highest poverty rate, with 81 households (28.7%) falling below the poverty line. Among the single-parent households, those with 3 or 4 children have the highest poverty rate, with 125 household (61.9%) living below poverty.
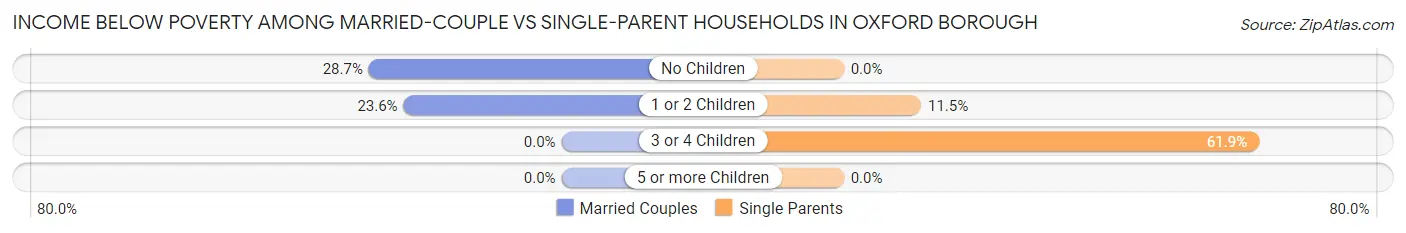
| Children | Married-Couple Families | Single-Parent Households |
| No Children | 81 (28.7%) | 0 (0.0%) |
| 1 or 2 Children | 57 (23.5%) | 34 (11.5%) |
| 3 or 4 Children | 0 (0.0%) | 125 (61.9%) |
| 5 or more Children | 0 (0.0%) | 0 (0.0%) |
| Total | 138 (21.5%) | 159 (21.9%) |
Race in Oxford borough
The most populous races in Oxford borough are White / Caucasian (3,998 | 69.9%), Hispanic or Latino (2,179 | 38.1%), and Two or more Races (1,162 | 20.3%).
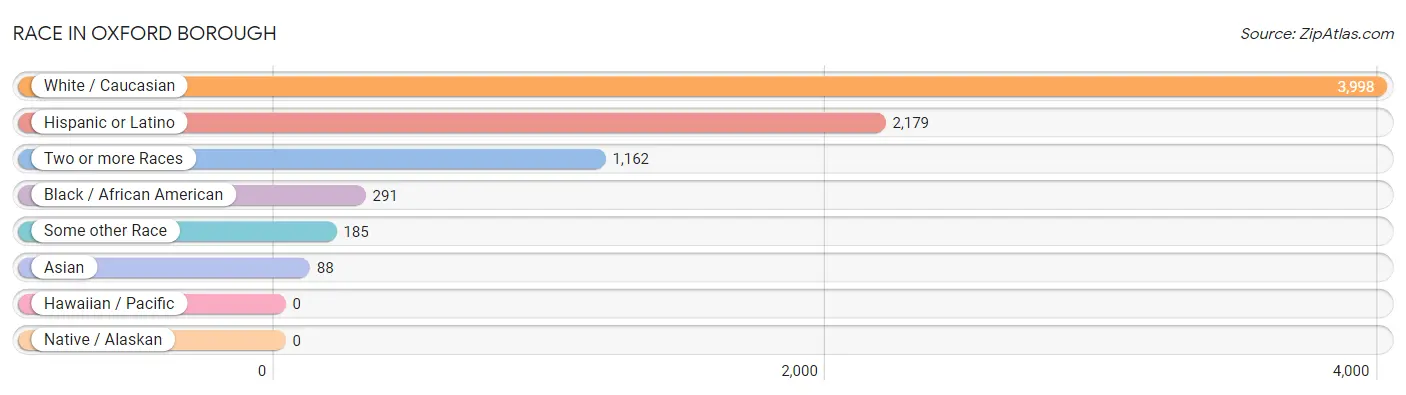
| Race | # Population | % Population |
| Asian | 88 | 1.5% |
| Black / African American | 291 | 5.1% |
| Hawaiian / Pacific | 0 | 0.0% |
| Hispanic or Latino | 2,179 | 38.1% |
| Native / Alaskan | 0 | 0.0% |
| White / Caucasian | 3,998 | 69.9% |
| Two or more Races | 1,162 | 20.3% |
| Some other Race | 185 | 3.2% |
| Total | 5,724 | 100.0% |
Ancestry in Oxford borough
The most populous ancestries reported in Oxford borough are Mexican (1,093 | 19.1%), Puerto Rican (1,017 | 17.8%), German (785 | 13.7%), Irish (527 | 9.2%), and English (466 | 8.1%), together accounting for 67.9% of all Oxford borough residents.
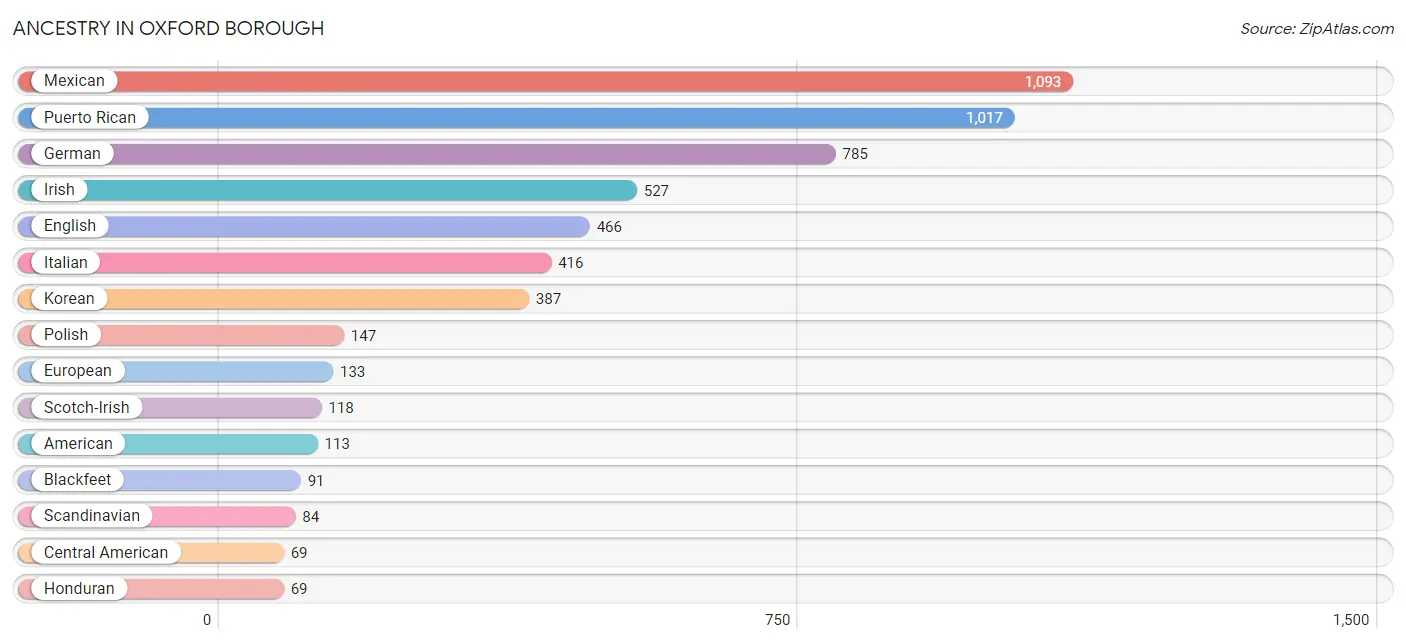
| Ancestry | # Population | % Population |
| American | 113 | 2.0% |
| Blackfeet | 91 | 1.6% |
| Central American | 69 | 1.2% |
| Danish | 4 | 0.1% |
| Dutch | 25 | 0.4% |
| Eastern European | 12 | 0.2% |
| English | 466 | 8.1% |
| European | 133 | 2.3% |
| French | 31 | 0.5% |
| German | 785 | 13.7% |
| Greek | 39 | 0.7% |
| Honduran | 69 | 1.2% |
| Irish | 527 | 9.2% |
| Italian | 416 | 7.3% |
| Korean | 387 | 6.8% |
| Mexican | 1,093 | 19.1% |
| Northern European | 27 | 0.5% |
| Norwegian | 6 | 0.1% |
| Polish | 147 | 2.6% |
| Puerto Rican | 1,017 | 17.8% |
| Romanian | 2 | 0.0% |
| Russian | 30 | 0.5% |
| Scandinavian | 84 | 1.5% |
| Scotch-Irish | 118 | 2.1% |
| Scottish | 59 | 1.0% |
| Swedish | 24 | 0.4% |
| Welsh | 57 | 1.0% | View All 27 Rows |
Immigrants in Oxford borough
The most numerous immigrant groups reported in Oxford borough came from Central America (779 | 13.6%), Latin America (779 | 13.6%), Mexico (710 | 12.4%), Honduras (69 | 1.2%), and Europe (28 | 0.5%), together accounting for 41.3% of all Oxford borough residents.
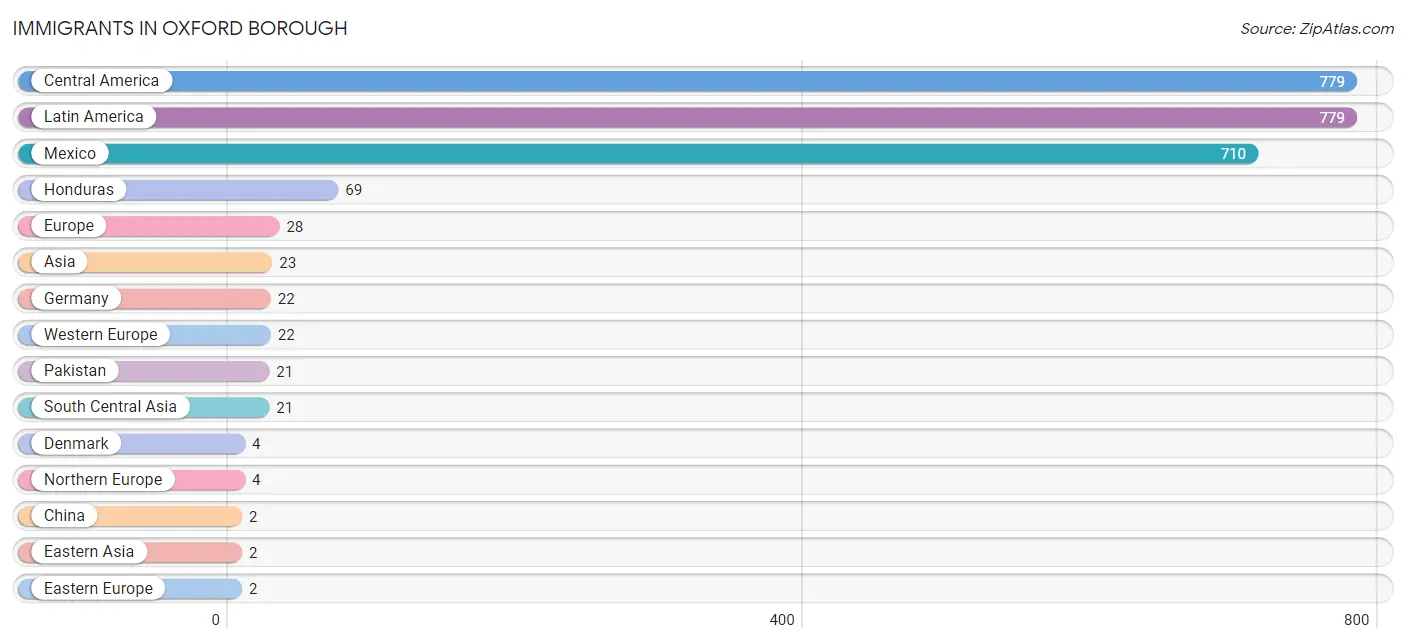
| Immigration Origin | # Population | % Population |
| Asia | 23 | 0.4% |
| Central America | 779 | 13.6% |
| China | 2 | 0.0% |
| Denmark | 4 | 0.1% |
| Eastern Asia | 2 | 0.0% |
| Eastern Europe | 2 | 0.0% |
| Europe | 28 | 0.5% |
| Germany | 22 | 0.4% |
| Honduras | 69 | 1.2% |
| Latin America | 779 | 13.6% |
| Mexico | 710 | 12.4% |
| Northern Europe | 4 | 0.1% |
| Pakistan | 21 | 0.4% |
| Romania | 2 | 0.0% |
| South Central Asia | 21 | 0.4% |
| Western Europe | 22 | 0.4% | View All 16 Rows |
Sex and Age in Oxford borough
Sex and Age in Oxford borough
The most populous age groups in Oxford borough are 10 to 14 Years (384 | 13.2%) for men and 5 to 9 Years (249 | 8.9%) for women.
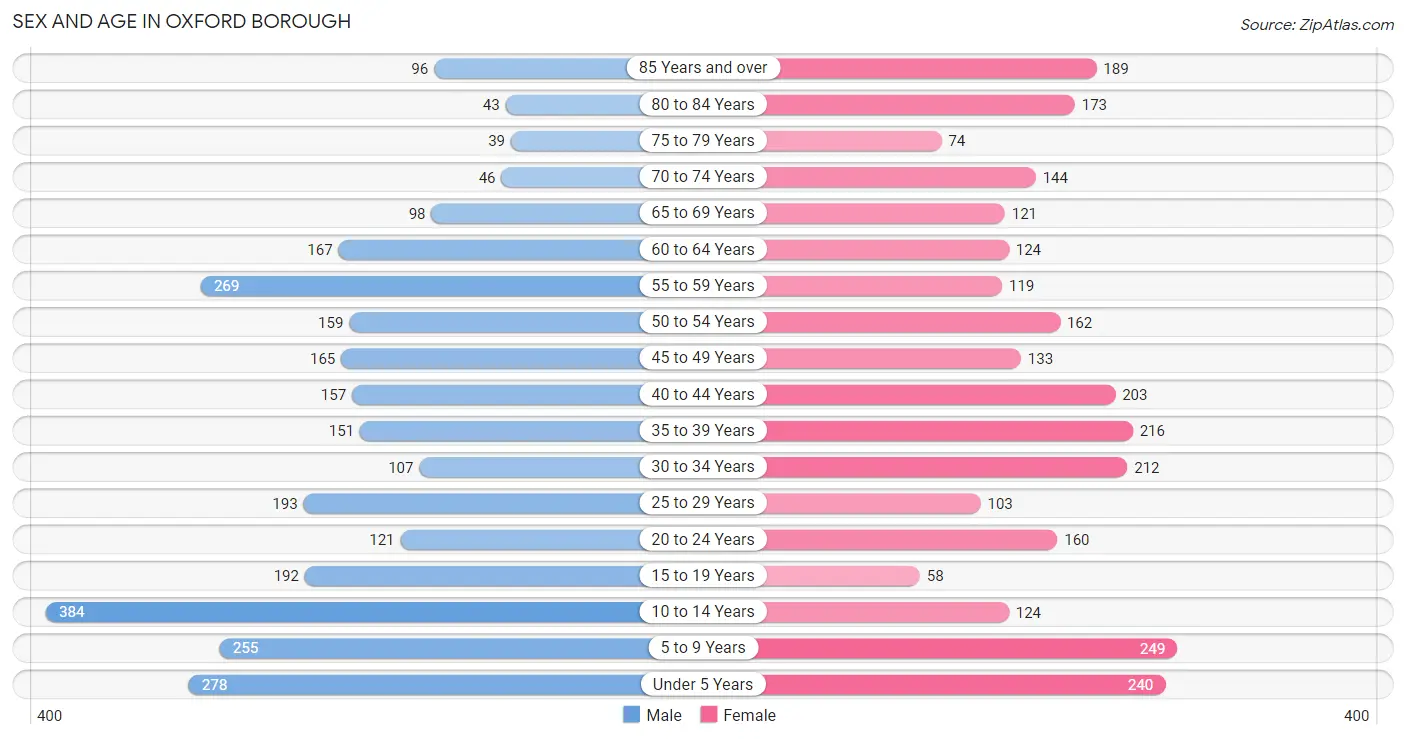
| Age Bracket | Male | Female |
| Under 5 Years | 278 (9.5%) | 240 (8.6%) |
| 5 to 9 Years | 255 (8.7%) | 249 (8.9%) |
| 10 to 14 Years | 384 (13.2%) | 124 (4.4%) |
| 15 to 19 Years | 192 (6.6%) | 58 (2.1%) |
| 20 to 24 Years | 121 (4.1%) | 160 (5.7%) |
| 25 to 29 Years | 193 (6.6%) | 103 (3.7%) |
| 30 to 34 Years | 107 (3.7%) | 212 (7.6%) |
| 35 to 39 Years | 151 (5.2%) | 216 (7.7%) |
| 40 to 44 Years | 157 (5.4%) | 203 (7.2%) |
| 45 to 49 Years | 165 (5.7%) | 133 (4.7%) |
| 50 to 54 Years | 159 (5.4%) | 162 (5.8%) |
| 55 to 59 Years | 269 (9.2%) | 119 (4.2%) |
| 60 to 64 Years | 167 (5.7%) | 124 (4.4%) |
| 65 to 69 Years | 98 (3.4%) | 121 (4.3%) |
| 70 to 74 Years | 46 (1.6%) | 144 (5.1%) |
| 75 to 79 Years | 39 (1.3%) | 74 (2.6%) |
| 80 to 84 Years | 43 (1.5%) | 173 (6.2%) |
| 85 Years and over | 96 (3.3%) | 189 (6.7%) |
| Total | 2,920 (100.0%) | 2,804 (100.0%) |
Families and Households in Oxford borough
Median Family Size in Oxford borough
The median family size in Oxford borough is 3.18 persons per family, with married-couple families (643 | 47.0%) accounting for the largest median family size of 3.73 persons per family. On the other hand, single male/father families (298 | 21.8%) represent the smallest median family size with 2.51 persons per family.
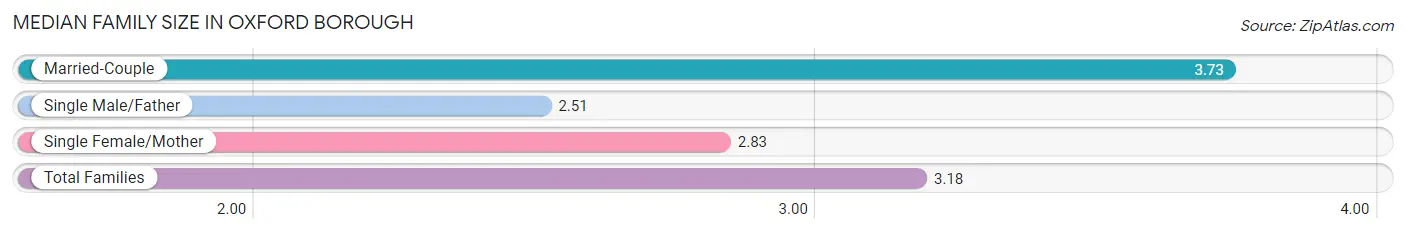
| Family Type | # Families | Family Size |
| Married-Couple | 643 (47.0%) | 3.73 |
| Single Male/Father | 298 (21.8%) | 2.51 |
| Single Female/Mother | 428 (31.3%) | 2.83 |
| Total Families | 1,369 (100.0%) | 3.18 |
Median Household Size in Oxford borough
The median household size in Oxford borough is 2.66 persons per household, with married-couple households (643 | 30.3%) accounting for the largest median household size of 3.89 persons per household. non-family households (750 | 35.4%) represent the smallest median household size with 1.25 persons per household.
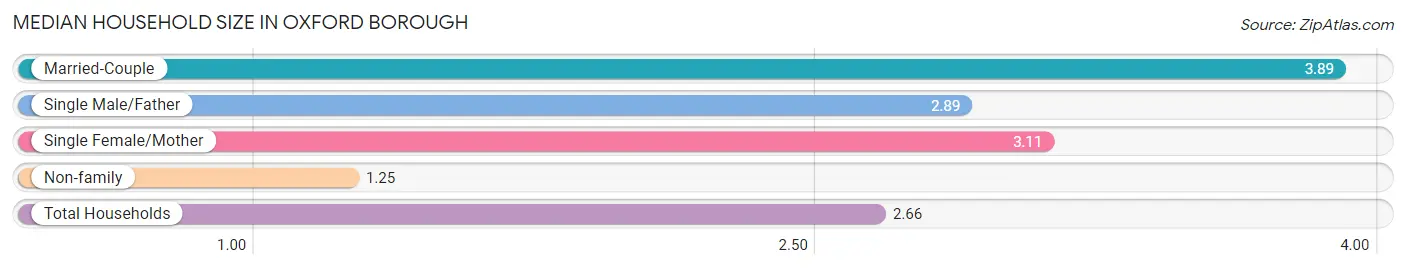
| Household Type | # Households | Household Size |
| Married-Couple | 643 (30.3%) | 3.89 |
| Single Male/Father | 298 (14.1%) | 2.89 |
| Single Female/Mother | 428 (20.2%) | 3.11 |
| Non-family | 750 (35.4%) | 1.25 |
| Total Households | 2,119 (100.0%) | 2.66 |
Household Size by Marriage Status in Oxford borough
Out of a total of 2,119 households in Oxford borough, 1,369 (64.6%) are family households, while 750 (35.4%) are nonfamily households. The most numerous type of family households are 2-person households, comprising 504, and the most common type of nonfamily households are 1-person households, comprising 611.
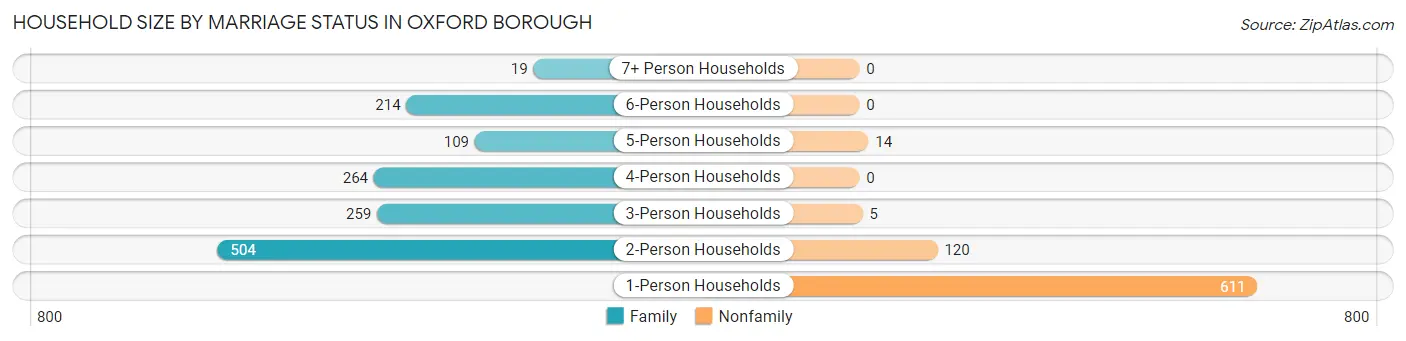
| Household Size | Family Households | Nonfamily Households |
| 1-Person Households | - | 611 (28.8%) |
| 2-Person Households | 504 (23.8%) | 120 (5.7%) |
| 3-Person Households | 259 (12.2%) | 5 (0.2%) |
| 4-Person Households | 264 (12.5%) | 0 (0.0%) |
| 5-Person Households | 109 (5.1%) | 14 (0.7%) |
| 6-Person Households | 214 (10.1%) | 0 (0.0%) |
| 7+ Person Households | 19 (0.9%) | 0 (0.0%) |
| Total | 1,369 (64.6%) | 750 (35.4%) |
Female Fertility in Oxford borough
Fertility by Age in Oxford borough
Average fertility rate in Oxford borough is 120.0 births per 1,000 women. Women in the age bracket of 20 to 34 years have the highest fertility rate with 244.0 births per 1,000 women. Women in the age bracket of 20 to 34 years acount for 82.9% of all women with births.
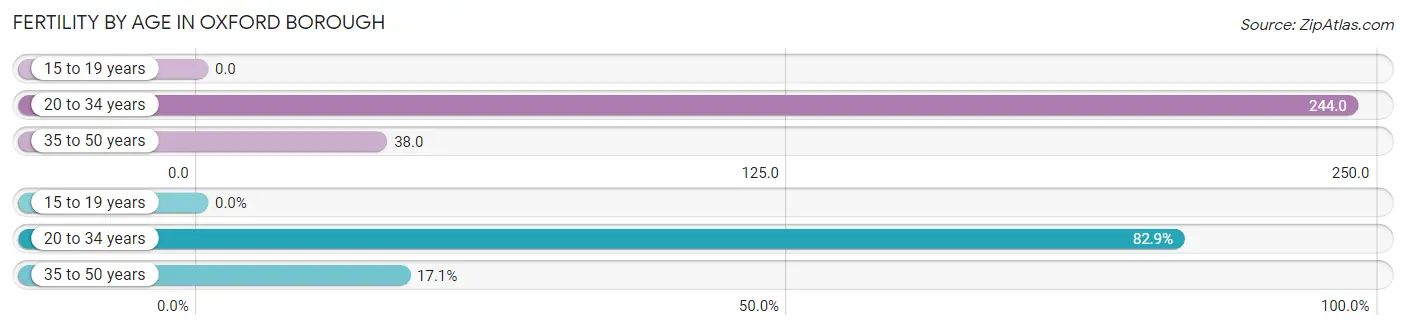
| Age Bracket | Women with Births | Births / 1,000 Women |
| 15 to 19 years | 0 (0.0%) | 0.0 |
| 20 to 34 years | 116 (82.9%) | 244.0 |
| 35 to 50 years | 24 (17.1%) | 38.0 |
| Total | 140 (100.0%) | 120.0 |
Fertility by Age by Marriage Status in Oxford borough
82.9% of women with births (140) in Oxford borough are married. The highest percentage of unmarried women with births falls into 35 to 50 years age bracket with 100.0% of them unmarried at the time of birth, while the lowest percentage of unmarried women with births belong to 20 to 34 years age bracket with 0.0% of them unmarried.
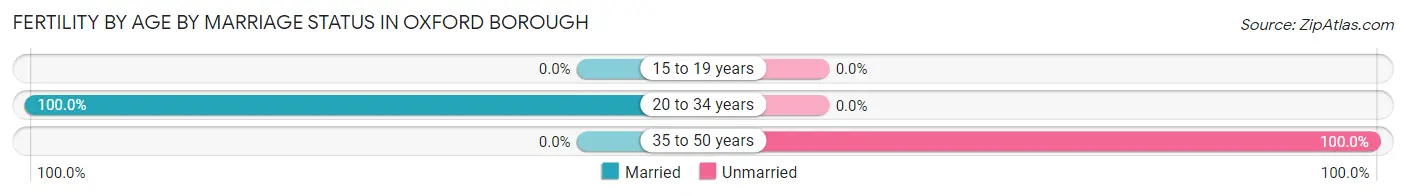
| Age Bracket | Married | Unmarried |
| 15 to 19 years | 0 (0.0%) | 0 (0.0%) |
| 20 to 34 years | 116 (100.0%) | 0 (0.0%) |
| 35 to 50 years | 0 (0.0%) | 24 (100.0%) |
| Total | 116 (82.9%) | 24 (17.1%) |
Fertility by Education in Oxford borough
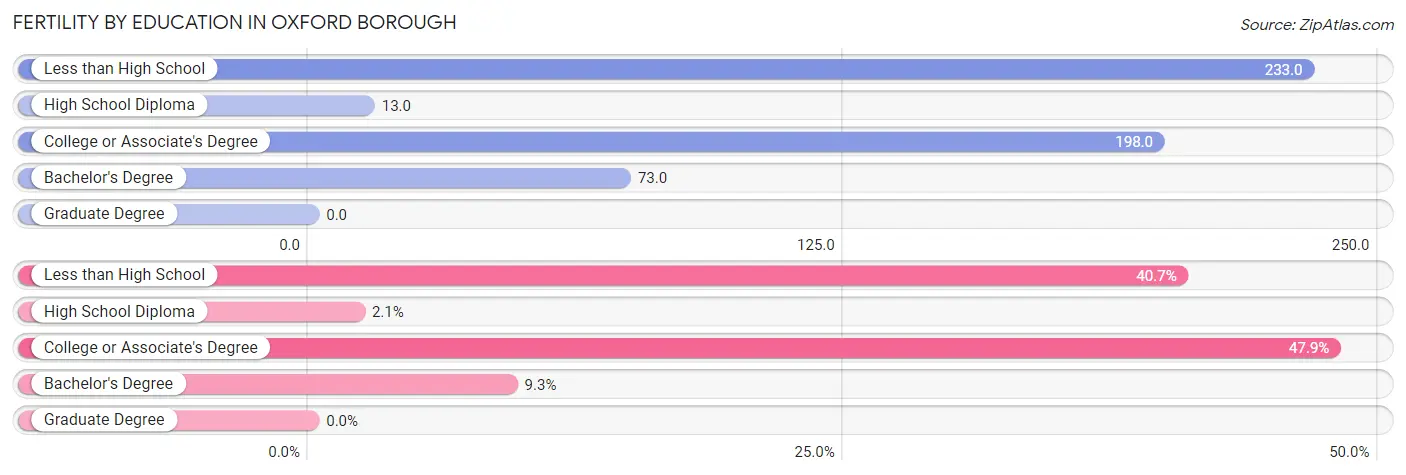
| Educational Attainment | Women with Births | Births / 1,000 Women |
| Less than High School | 57 (40.7%) | 233.0 |
| High School Diploma | 3 (2.1%) | 13.0 |
| College or Associate's Degree | 67 (47.9%) | 198.0 |
| Bachelor's Degree | 13 (9.3%) | 73.0 |
| Graduate Degree | 0 (0.0%) | 0.0 |
| Total | 140 (100.0%) | 120.0 |
Fertility by Education by Marriage Status in Oxford borough
17.1% of women with births in Oxford borough are unmarried. Women with the educational attainment of less than high school are most likely to be married with 100.0% of them married at childbirth, while women with the educational attainment of college or associate's degree are least likely to be married with 35.8% of them unmarried at childbirth.
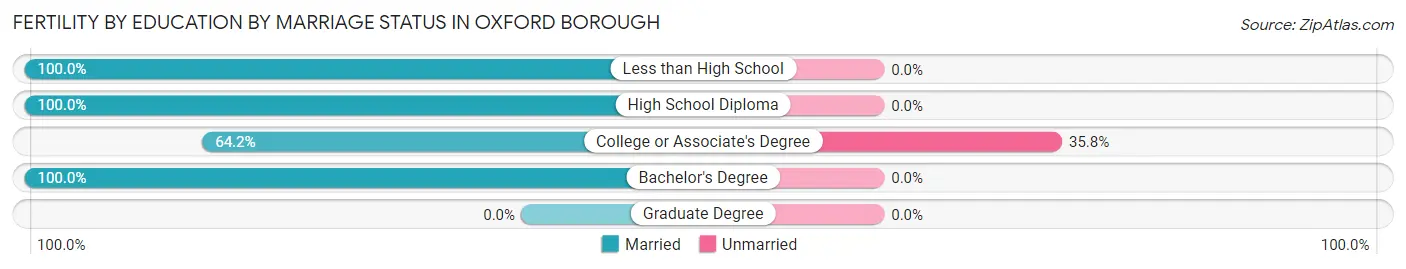
| Educational Attainment | Married | Unmarried |
| Less than High School | 57 (100.0%) | 0 (0.0%) |
| High School Diploma | 3 (100.0%) | 0 (0.0%) |
| College or Associate's Degree | 43 (64.2%) | 24 (35.8%) |
| Bachelor's Degree | 13 (100.0%) | 0 (0.0%) |
| Graduate Degree | 0 (0.0%) | 0 (0.0%) |
| Total | 116 (82.9%) | 24 (17.1%) |
Employment Characteristics in Oxford borough
Employment by Class of Employer in Oxford borough
Among the 2,252 employed individuals in Oxford borough, private company employees (1,478 | 65.6%), self-employed (not incorporated) (270 | 12.0%), and local government employees (223 | 9.9%) make up the most common classes of employment.
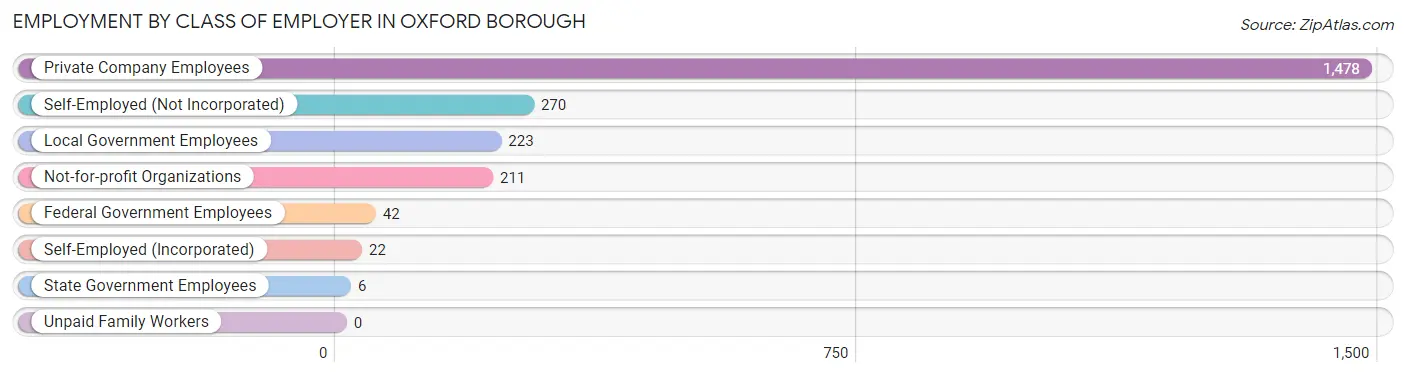
| Employer Class | # Employees | % Employees |
| Private Company Employees | 1,478 | 65.6% |
| Self-Employed (Incorporated) | 22 | 1.0% |
| Self-Employed (Not Incorporated) | 270 | 12.0% |
| Not-for-profit Organizations | 211 | 9.4% |
| Local Government Employees | 223 | 9.9% |
| State Government Employees | 6 | 0.3% |
| Federal Government Employees | 42 | 1.9% |
| Unpaid Family Workers | 0 | 0.0% |
| Total | 2,252 | 100.0% |
Employment Status by Age in Oxford borough
According to the labor force statistics for Oxford borough, out of the total population over 16 years of age (4,142), 58.7% or 2,431 individuals are in the labor force, with 4.8% or 117 of them unemployed. The age group with the highest labor force participation rate is 20 to 24 years, with 100.0% or 281 individuals in the labor force. Within the labor force, the 55 to 59 years age range has the highest percentage of unemployed individuals, with 31.6% or 97 of them being unemployed.
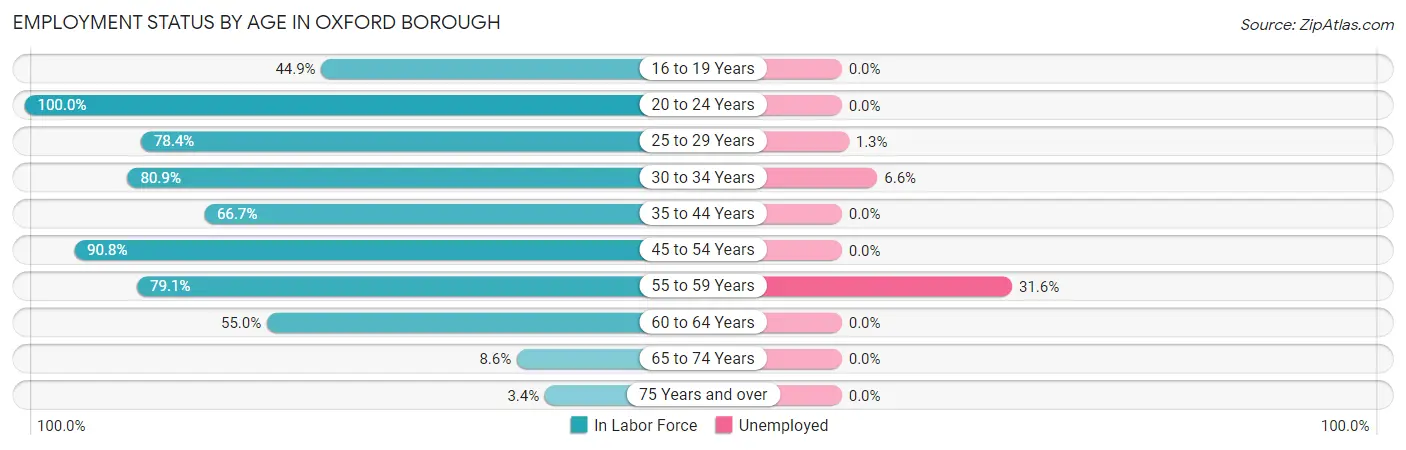
| Age Bracket | In Labor Force | Unemployed |
| 16 to 19 Years | 89 (44.9%) | 0 (0.0%) |
| 20 to 24 Years | 281 (100.0%) | 0 (0.0%) |
| 25 to 29 Years | 232 (78.4%) | 3 (1.3%) |
| 30 to 34 Years | 258 (80.9%) | 17 (6.6%) |
| 35 to 44 Years | 485 (66.7%) | 0 (0.0%) |
| 45 to 54 Years | 562 (90.8%) | 0 (0.0%) |
| 55 to 59 Years | 307 (79.1%) | 97 (31.6%) |
| 60 to 64 Years | 160 (55.0%) | 0 (0.0%) |
| 65 to 74 Years | 35 (8.6%) | 0 (0.0%) |
| 75 Years and over | 21 (3.4%) | 0 (0.0%) |
| Total | 2,431 (58.7%) | 117 (4.8%) |
Employment Status by Educational Attainment in Oxford borough
According to labor force statistics for Oxford borough, 75.9% of individuals (2,004) out of the total population between 25 and 64 years of age (2,640) are in the labor force, with 5.8% or 116 of them being unemployed. The group with the highest labor force participation rate are those with the educational attainment of bachelor's degree or higher, with 95.6% or 633 individuals in the labor force. Within the labor force, individuals with less than high school education have the highest percentage of unemployment, with 40.9% or 97 of them being unemployed.
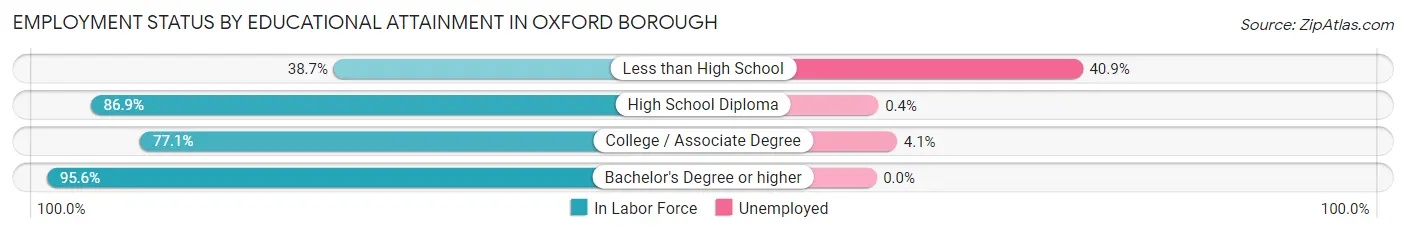
| Educational Attainment | In Labor Force | Unemployed |
| Less than High School | 237 (38.7%) | 251 (40.9%) |
| High School Diploma | 719 (86.9%) | 3 (0.4%) |
| College / Associate Degree | 415 (77.1%) | 22 (4.1%) |
| Bachelor's Degree or higher | 633 (95.6%) | 0 (0.0%) |
| Total | 2,004 (75.9%) | 153 (5.8%) |
Employment Occupations by Sex in Oxford borough
Management, Business, Science and Arts Occupations
The most common Management, Business, Science and Arts occupations in Oxford borough are Management (438 | 18.9%), Community & Social Service (341 | 14.7%), Education Instruction & Library (253 | 10.9%), Health Diagnosing & Treating (117 | 5.1%), and Business & Financial (112 | 4.8%).
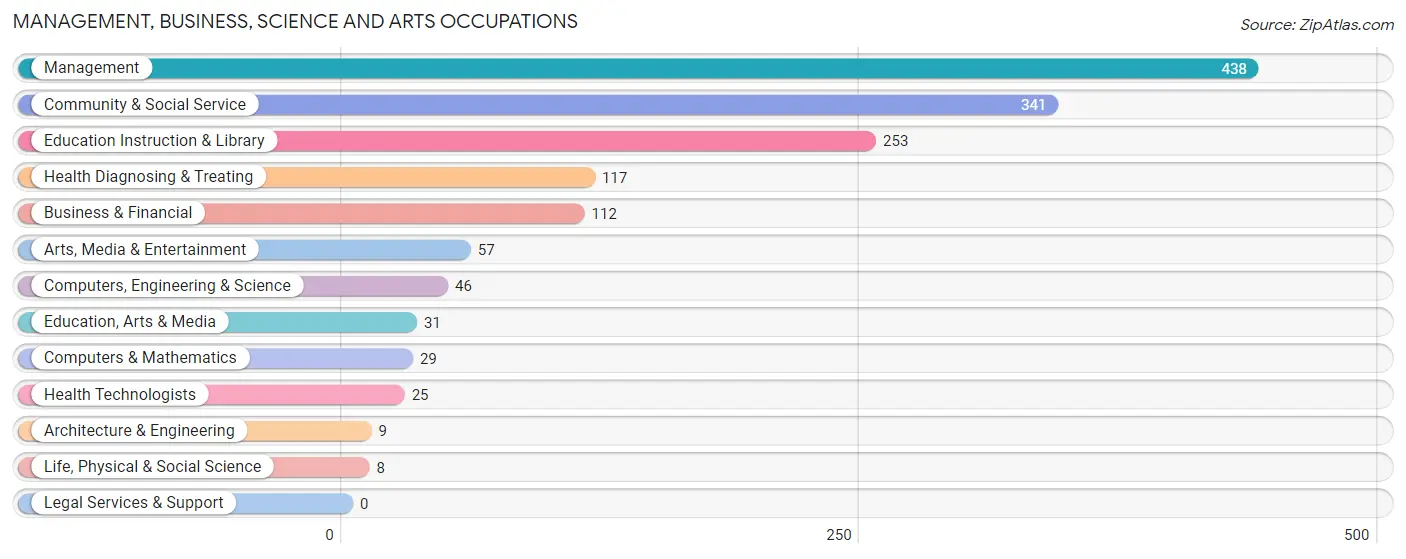
Management, Business, Science and Arts Occupations by Sex
Within the Management, Business, Science and Arts occupations in Oxford borough, the most male-oriented occupations are Architecture & Engineering (100.0%), Life, Physical & Social Science (100.0%), and Computers, Engineering & Science (89.1%), while the most female-oriented occupations are Education, Arts & Media (100.0%), Health Technologists (100.0%), and Health Diagnosing & Treating (90.6%).
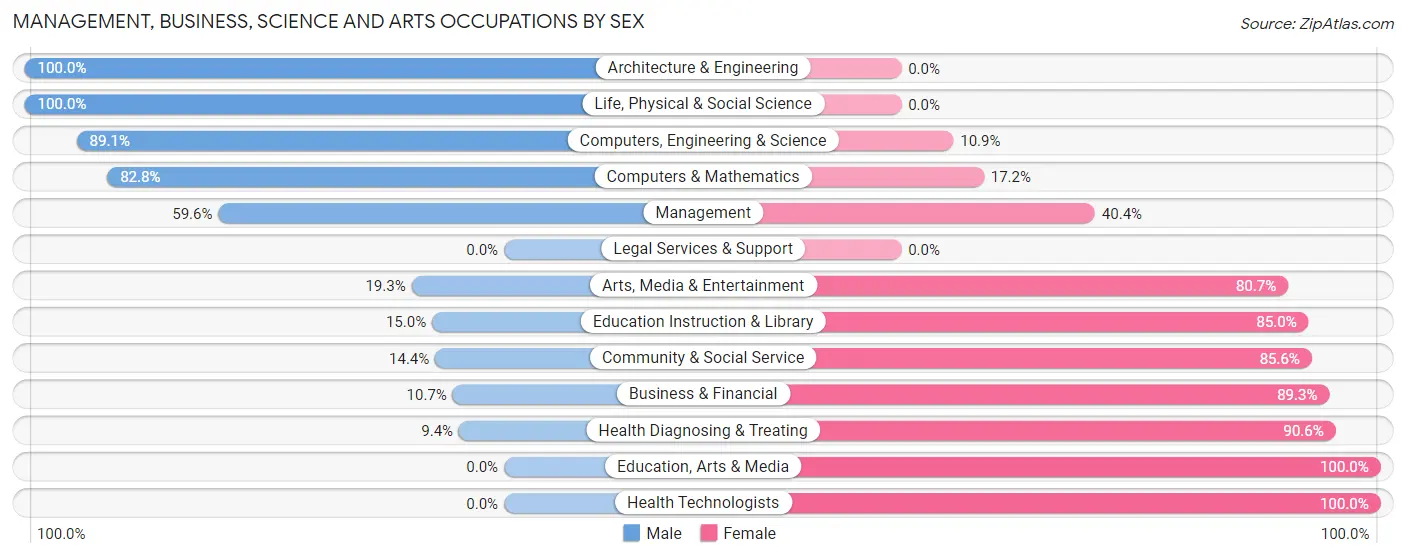
| Occupation | Male | Female |
| Management | 261 (59.6%) | 177 (40.4%) |
| Business & Financial | 12 (10.7%) | 100 (89.3%) |
| Computers, Engineering & Science | 41 (89.1%) | 5 (10.9%) |
| Computers & Mathematics | 24 (82.8%) | 5 (17.2%) |
| Architecture & Engineering | 9 (100.0%) | 0 (0.0%) |
| Life, Physical & Social Science | 8 (100.0%) | 0 (0.0%) |
| Community & Social Service | 49 (14.4%) | 292 (85.6%) |
| Education, Arts & Media | 0 (0.0%) | 31 (100.0%) |
| Legal Services & Support | 0 (0.0%) | 0 (0.0%) |
| Education Instruction & Library | 38 (15.0%) | 215 (85.0%) |
| Arts, Media & Entertainment | 11 (19.3%) | 46 (80.7%) |
| Health Diagnosing & Treating | 11 (9.4%) | 106 (90.6%) |
| Health Technologists | 0 (0.0%) | 25 (100.0%) |
| Total (Category) | 374 (35.5%) | 680 (64.5%) |
| Total (Overall) | 1,126 (48.7%) | 1,187 (51.3%) |
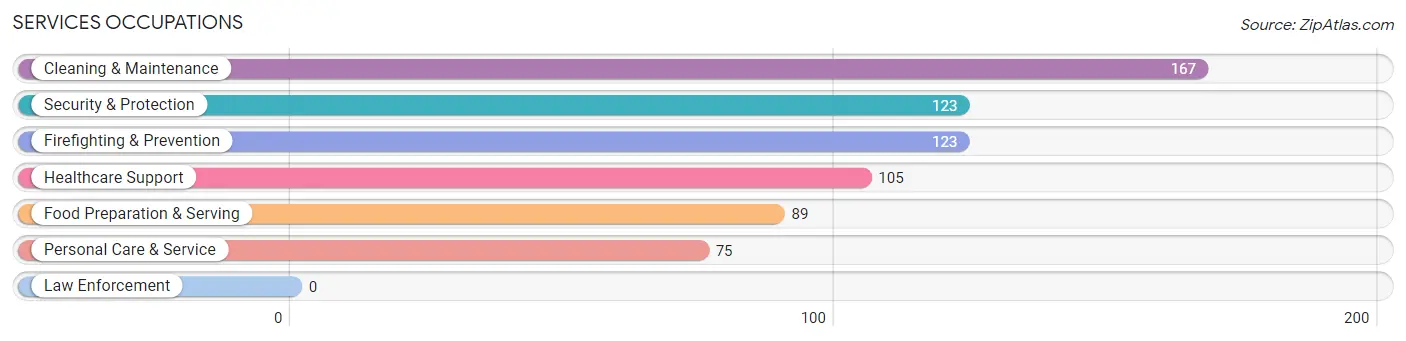
Services Occupations
The most common Services occupations in Oxford borough are Cleaning & Maintenance (167 | 7.2%), Security & Protection (123 | 5.3%), Firefighting & Prevention (123 | 5.3%), Healthcare Support (105 | 4.5%), and Food Preparation & Serving (89 | 3.8%).
Services Occupations by Sex
Within the Services occupations in Oxford borough, the most male-oriented occupations are Cleaning & Maintenance (76.0%), Food Preparation & Serving (65.2%), and Security & Protection (39.0%), while the most female-oriented occupations are Healthcare Support (100.0%), Personal Care & Service (100.0%), and Security & Protection (61.0%).
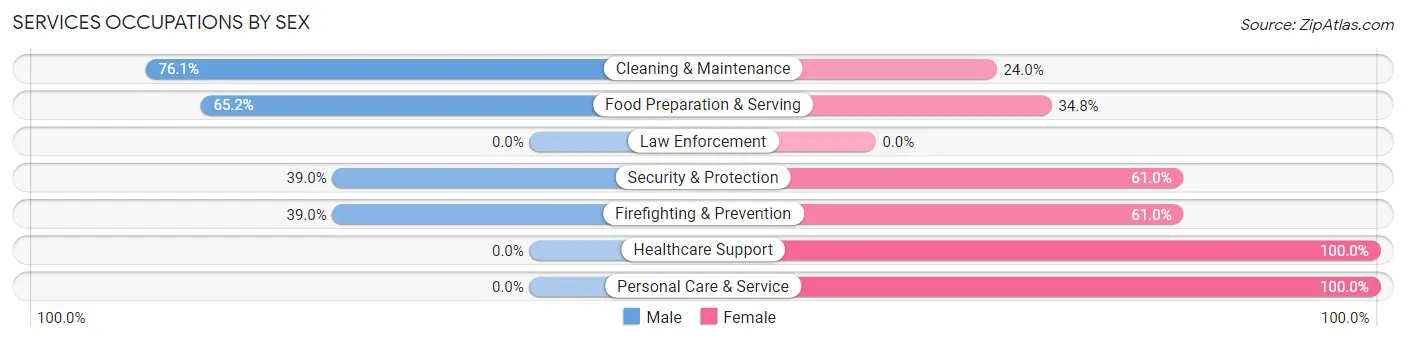
| Occupation | Male | Female |
| Healthcare Support | 0 (0.0%) | 105 (100.0%) |
| Security & Protection | 48 (39.0%) | 75 (61.0%) |
| Firefighting & Prevention | 48 (39.0%) | 75 (61.0%) |
| Law Enforcement | 0 (0.0%) | 0 (0.0%) |
| Food Preparation & Serving | 58 (65.2%) | 31 (34.8%) |
| Cleaning & Maintenance | 127 (76.0%) | 40 (23.9%) |
| Personal Care & Service | 0 (0.0%) | 75 (100.0%) |
| Total (Category) | 233 (41.7%) | 326 (58.3%) |
| Total (Overall) | 1,126 (48.7%) | 1,187 (51.3%) |
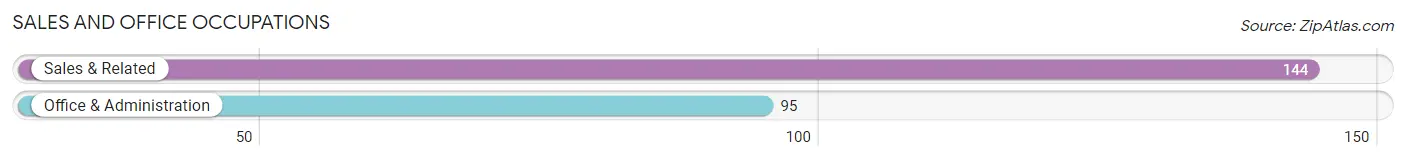
Sales and Office Occupations
The most common Sales and Office occupations in Oxford borough are Sales & Related (144 | 6.2%), and Office & Administration (95 | 4.1%).
Sales and Office Occupations by Sex
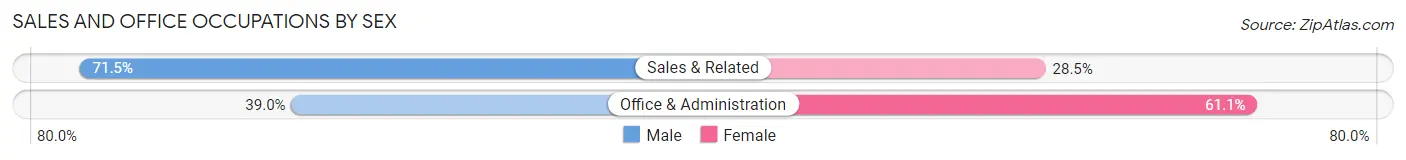
| Occupation | Male | Female |
| Sales & Related | 103 (71.5%) | 41 (28.5%) |
| Office & Administration | 37 (39.0%) | 58 (61.1%) |
| Total (Category) | 140 (58.6%) | 99 (41.4%) |
| Total (Overall) | 1,126 (48.7%) | 1,187 (51.3%) |
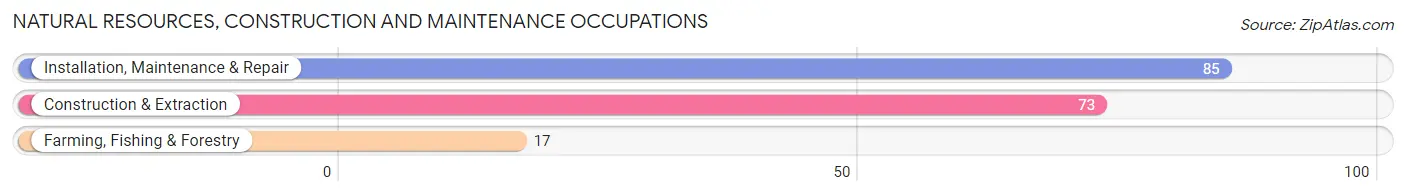
Natural Resources, Construction and Maintenance Occupations
The most common Natural Resources, Construction and Maintenance occupations in Oxford borough are Installation, Maintenance & Repair (85 | 3.7%), Construction & Extraction (73 | 3.2%), and Farming, Fishing & Forestry (17 | 0.7%).
Natural Resources, Construction and Maintenance Occupations by Sex
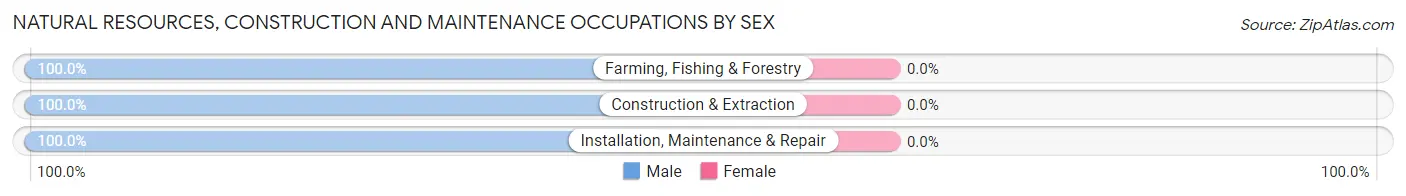
| Occupation | Male | Female |
| Farming, Fishing & Forestry | 17 (100.0%) | 0 (0.0%) |
| Construction & Extraction | 73 (100.0%) | 0 (0.0%) |
| Installation, Maintenance & Repair | 85 (100.0%) | 0 (0.0%) |
| Total (Category) | 175 (100.0%) | 0 (0.0%) |
| Total (Overall) | 1,126 (48.7%) | 1,187 (51.3%) |
Production, Transportation and Moving Occupations
The most common Production, Transportation and Moving occupations in Oxford borough are Production (120 | 5.2%), Transportation (103 | 4.4%), and Material Moving (63 | 2.7%).
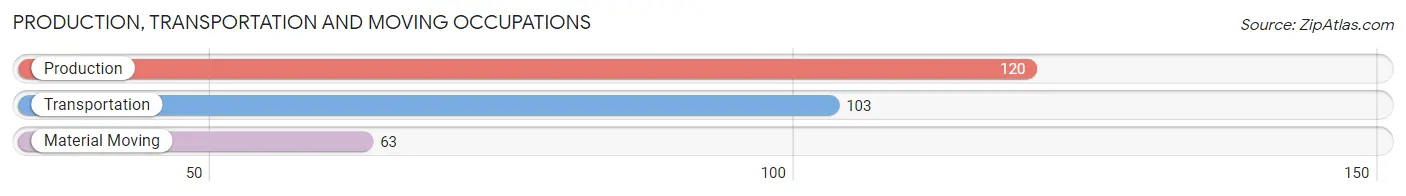
Production, Transportation and Moving Occupations by Sex
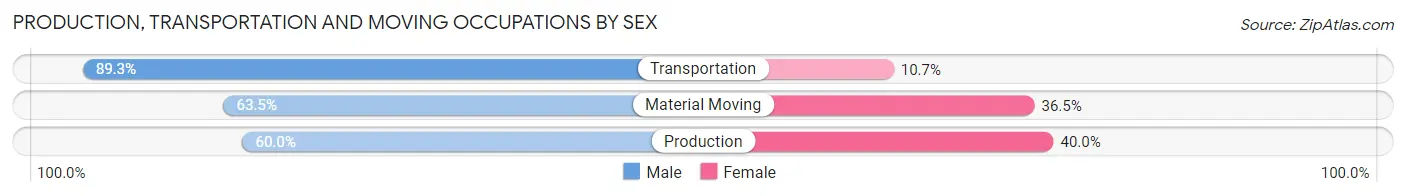
| Occupation | Male | Female |
| Production | 72 (60.0%) | 48 (40.0%) |
| Transportation | 92 (89.3%) | 11 (10.7%) |
| Material Moving | 40 (63.5%) | 23 (36.5%) |
| Total (Category) | 204 (71.3%) | 82 (28.7%) |
| Total (Overall) | 1,126 (48.7%) | 1,187 (51.3%) |
Employment Industries by Sex in Oxford borough
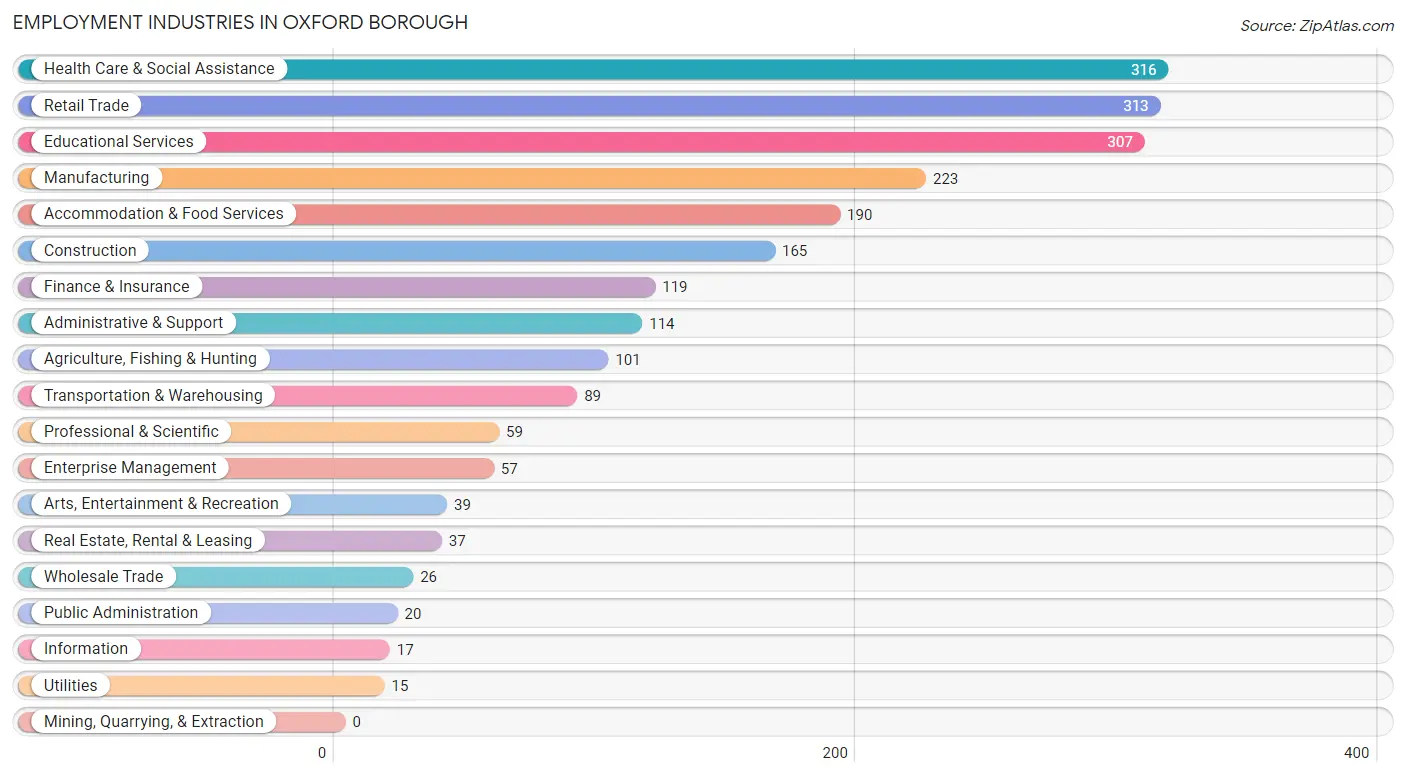
Employment Industries in Oxford borough
The major employment industries in Oxford borough include Health Care & Social Assistance (316 | 13.7%), Retail Trade (313 | 13.5%), Educational Services (307 | 13.3%), Manufacturing (223 | 9.6%), and Accommodation & Food Services (190 | 8.2%).
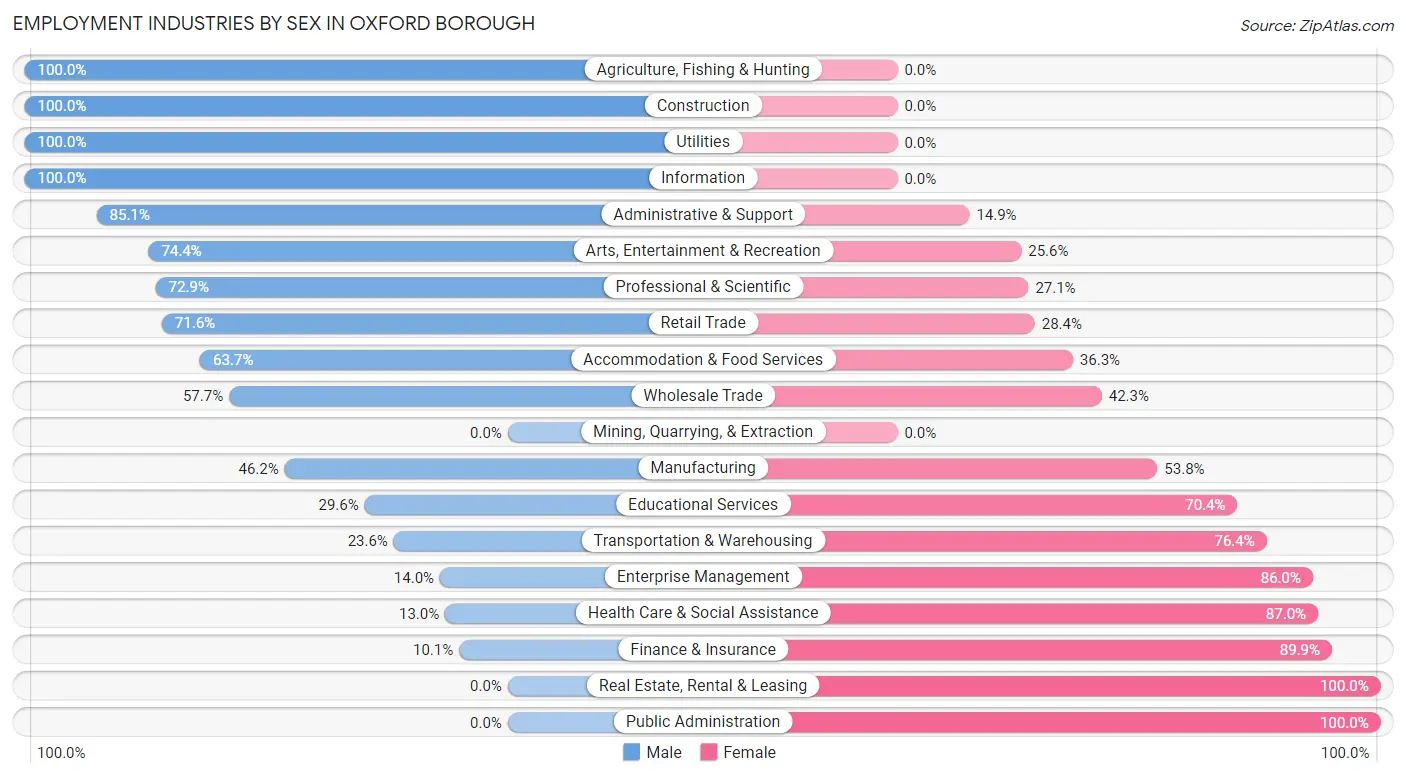
Employment Industries by Sex in Oxford borough
The Oxford borough industries that see more men than women are Agriculture, Fishing & Hunting (100.0%), Construction (100.0%), and Utilities (100.0%), whereas the industries that tend to have a higher number of women are Real Estate, Rental & Leasing (100.0%), Public Administration (100.0%), and Finance & Insurance (89.9%).
| Industry | Male | Female |
| Agriculture, Fishing & Hunting | 101 (100.0%) | 0 (0.0%) |
| Mining, Quarrying, & Extraction | 0 (0.0%) | 0 (0.0%) |
| Construction | 165 (100.0%) | 0 (0.0%) |
| Manufacturing | 103 (46.2%) | 120 (53.8%) |
| Wholesale Trade | 15 (57.7%) | 11 (42.3%) |
| Retail Trade | 224 (71.6%) | 89 (28.4%) |
| Transportation & Warehousing | 21 (23.6%) | 68 (76.4%) |
| Utilities | 15 (100.0%) | 0 (0.0%) |
| Information | 17 (100.0%) | 0 (0.0%) |
| Finance & Insurance | 12 (10.1%) | 107 (89.9%) |
| Real Estate, Rental & Leasing | 0 (0.0%) | 37 (100.0%) |
| Professional & Scientific | 43 (72.9%) | 16 (27.1%) |
| Enterprise Management | 8 (14.0%) | 49 (86.0%) |
| Administrative & Support | 97 (85.1%) | 17 (14.9%) |
| Educational Services | 91 (29.6%) | 216 (70.4%) |
| Health Care & Social Assistance | 41 (13.0%) | 275 (87.0%) |
| Arts, Entertainment & Recreation | 29 (74.4%) | 10 (25.6%) |
| Accommodation & Food Services | 121 (63.7%) | 69 (36.3%) |
| Public Administration | 0 (0.0%) | 20 (100.0%) |
| Total | 1,126 (48.7%) | 1,187 (51.3%) |
Education in Oxford borough
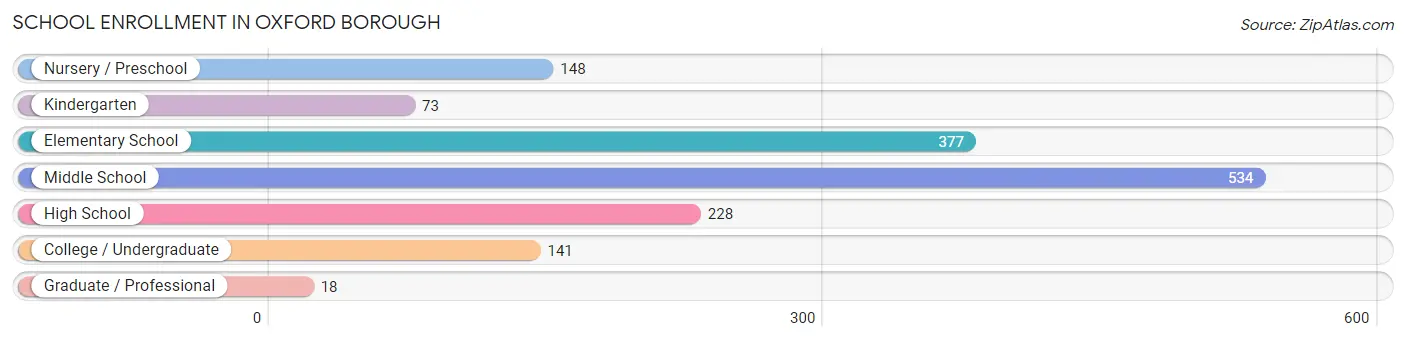
School Enrollment in Oxford borough
The most common levels of schooling among the 1,519 students in Oxford borough are middle school (534 | 35.1%), elementary school (377 | 24.8%), and high school (228 | 15.0%).
| School Level | # Students | % Students |
| Nursery / Preschool | 148 | 9.7% |
| Kindergarten | 73 | 4.8% |
| Elementary School | 377 | 24.8% |
| Middle School | 534 | 35.1% |
| High School | 228 | 15.0% |
| College / Undergraduate | 141 | 9.3% |
| Graduate / Professional | 18 | 1.2% |
| Total | 1,519 | 100.0% |
School Enrollment by Age by Funding Source in Oxford borough
Out of a total of 1,519 students who are enrolled in schools in Oxford borough, 254 (16.7%) attend a private institution, while the remaining 1,265 (83.3%) are enrolled in public schools. The age group of 25 to 34 year olds has the highest likelihood of being enrolled in private schools, with 17 (73.9% in the age bracket) enrolled. Conversely, the age group of 15 to 17 year olds has the lowest likelihood of being enrolled in a private school, with 203 (100.0% in the age bracket) attending a public institution.
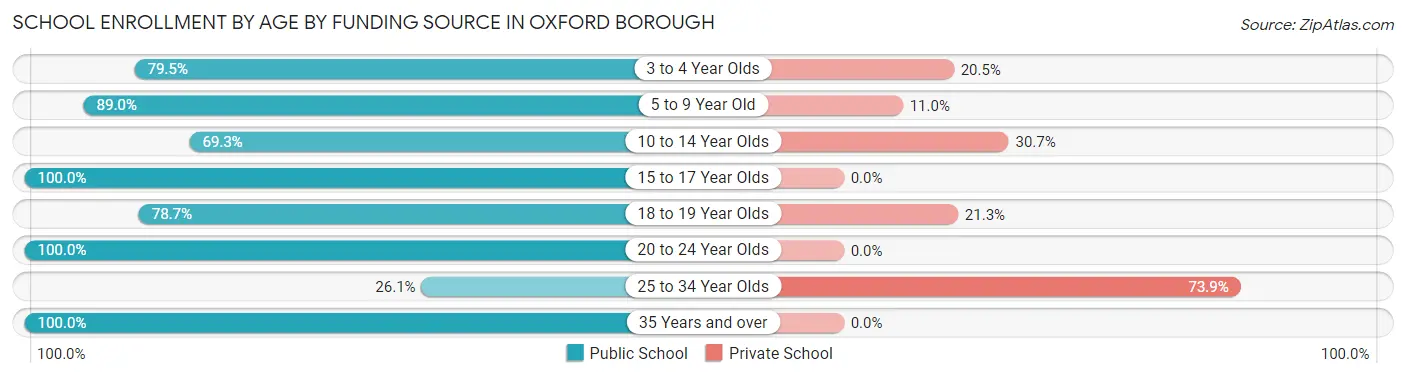
| Age Bracket | Public School | Private School |
| 3 to 4 Year Olds | 97 (79.5%) | 25 (20.5%) |
| 5 to 9 Year Old | 372 (89.0%) | 46 (11.0%) |
| 10 to 14 Year Olds | 352 (69.3%) | 156 (30.7%) |
| 15 to 17 Year Olds | 203 (100.0%) | 0 (0.0%) |
| 18 to 19 Year Olds | 37 (78.7%) | 10 (21.3%) |
| 20 to 24 Year Olds | 54 (100.0%) | 0 (0.0%) |
| 25 to 34 Year Olds | 6 (26.1%) | 17 (73.9%) |
| 35 Years and over | 144 (100.0%) | 0 (0.0%) |
| Total | 1,265 (83.3%) | 254 (16.7%) |
Educational Attainment by Field of Study in Oxford borough
Education (261 | 23.0%), science & technology (173 | 15.2%), business (147 | 12.9%), liberal arts & history (75 | 6.6%), and arts & humanities (74 | 6.5%) are the most common fields of study among 1,136 individuals in Oxford borough who have obtained a bachelor's degree or higher.
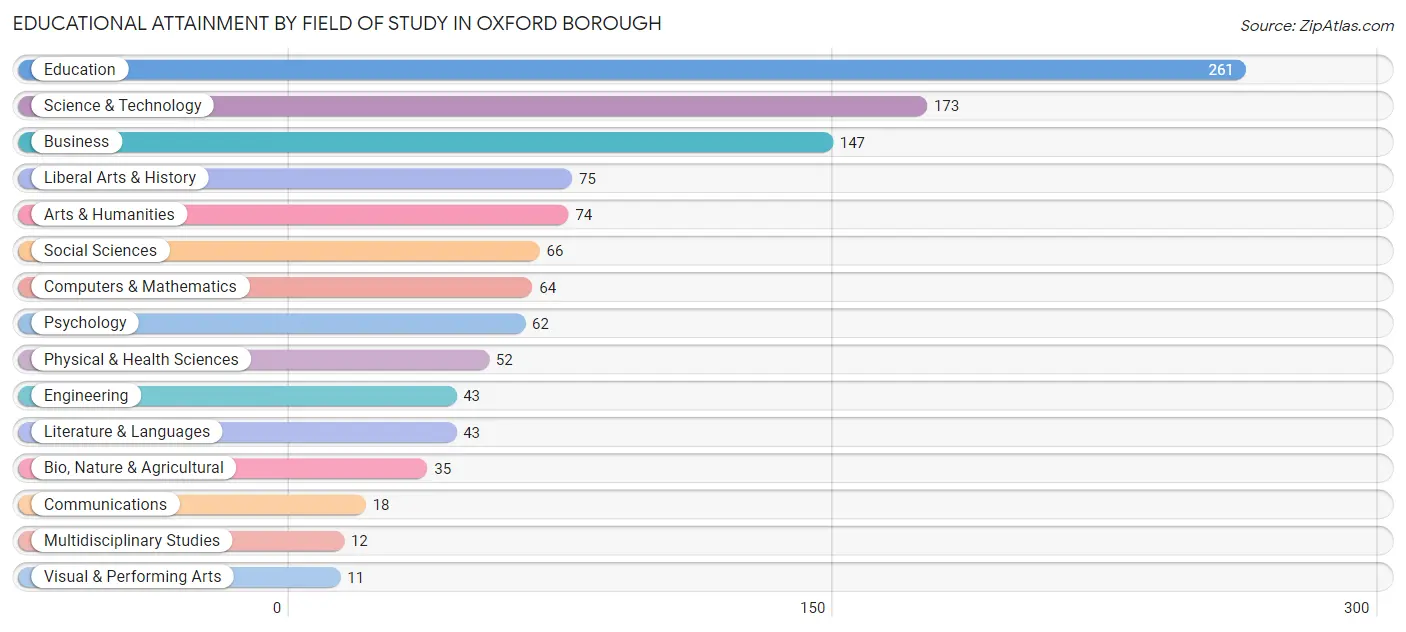
| Field of Study | # Graduates | % Graduates |
| Computers & Mathematics | 64 | 5.6% |
| Bio, Nature & Agricultural | 35 | 3.1% |
| Physical & Health Sciences | 52 | 4.6% |
| Psychology | 62 | 5.5% |
| Social Sciences | 66 | 5.8% |
| Engineering | 43 | 3.8% |
| Multidisciplinary Studies | 12 | 1.1% |
| Science & Technology | 173 | 15.2% |
| Business | 147 | 12.9% |
| Education | 261 | 23.0% |
| Literature & Languages | 43 | 3.8% |
| Liberal Arts & History | 75 | 6.6% |
| Visual & Performing Arts | 11 | 1.0% |
| Communications | 18 | 1.6% |
| Arts & Humanities | 74 | 6.5% |
| Total | 1,136 | 100.0% |
Transportation & Commute in Oxford borough
Vehicle Availability by Sex in Oxford borough
The most prevalent vehicle ownership categories in Oxford borough are males with 2 vehicles (578, accounting for 52.0%) and females with 2 vehicles (467, making up 50.7%).
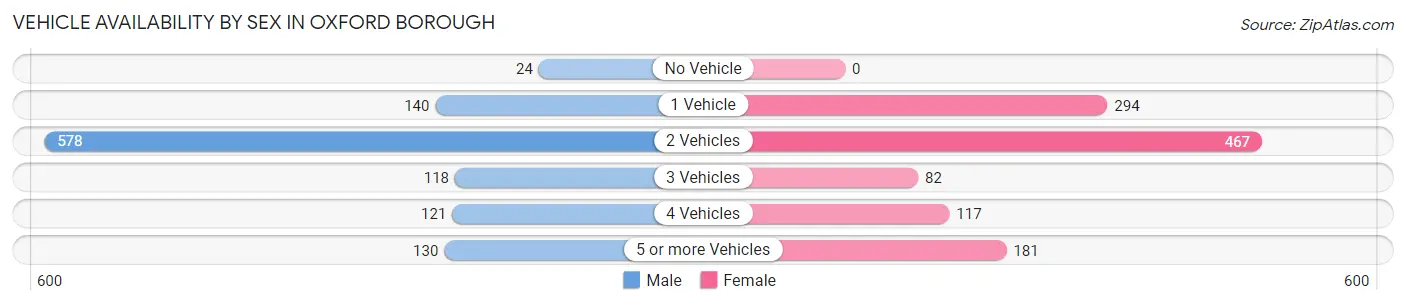
| Vehicles Available | Male | Female |
| No Vehicle | 24 (2.2%) | 0 (0.0%) |
| 1 Vehicle | 140 (12.6%) | 294 (25.8%) |
| 2 Vehicles | 578 (52.0%) | 467 (40.9%) |
| 3 Vehicles | 118 (10.6%) | 82 (7.2%) |
| 4 Vehicles | 121 (10.9%) | 117 (10.2%) |
| 5 or more Vehicles | 130 (11.7%) | 181 (15.9%) |
| Total | 1,111 (100.0%) | 1,141 (100.0%) |
Commute Time in Oxford borough
The most frequently occuring commute durations in Oxford borough are 60 to 89 minutes (303 commuters, 15.1%), 5 to 9 minutes (261 commuters, 13.1%), and 45 to 59 minutes (259 commuters, 13.0%).
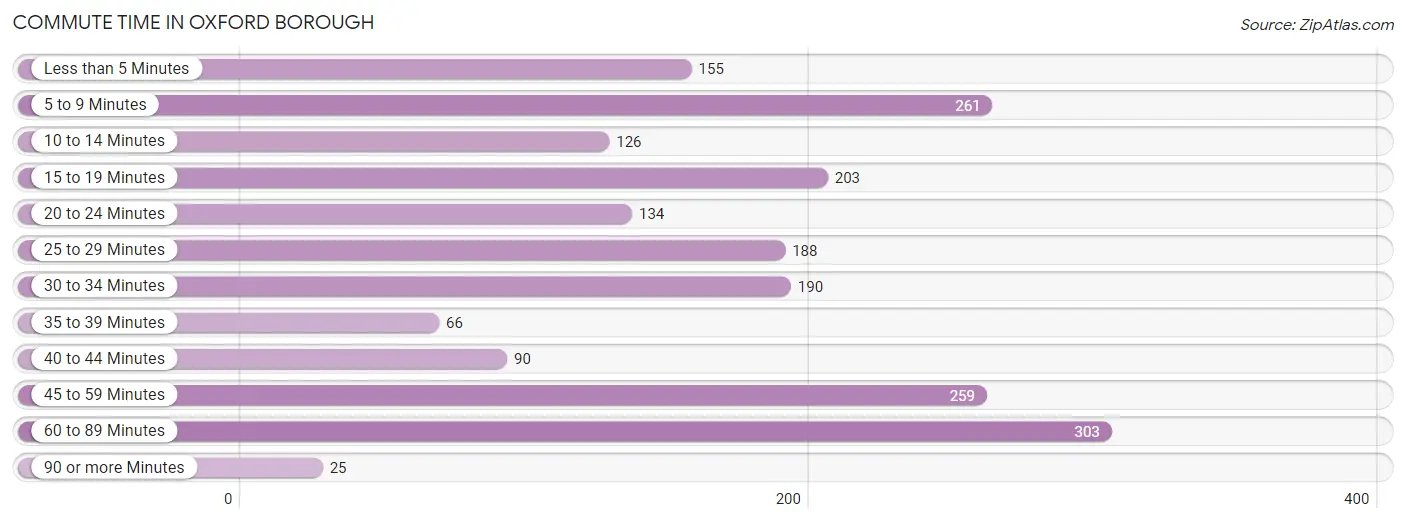
| Commute Time | # Commuters | % Commuters |
| Less than 5 Minutes | 155 | 7.7% |
| 5 to 9 Minutes | 261 | 13.1% |
| 10 to 14 Minutes | 126 | 6.3% |
| 15 to 19 Minutes | 203 | 10.2% |
| 20 to 24 Minutes | 134 | 6.7% |
| 25 to 29 Minutes | 188 | 9.4% |
| 30 to 34 Minutes | 190 | 9.5% |
| 35 to 39 Minutes | 66 | 3.3% |
| 40 to 44 Minutes | 90 | 4.5% |
| 45 to 59 Minutes | 259 | 13.0% |
| 60 to 89 Minutes | 303 | 15.1% |
| 90 or more Minutes | 25 | 1.3% |
Commute Time by Sex in Oxford borough
The most common commute times in Oxford borough are 60 to 89 minutes (210 commuters, 19.4%) for males and 30 to 34 minutes (170 commuters, 18.5%) for females.
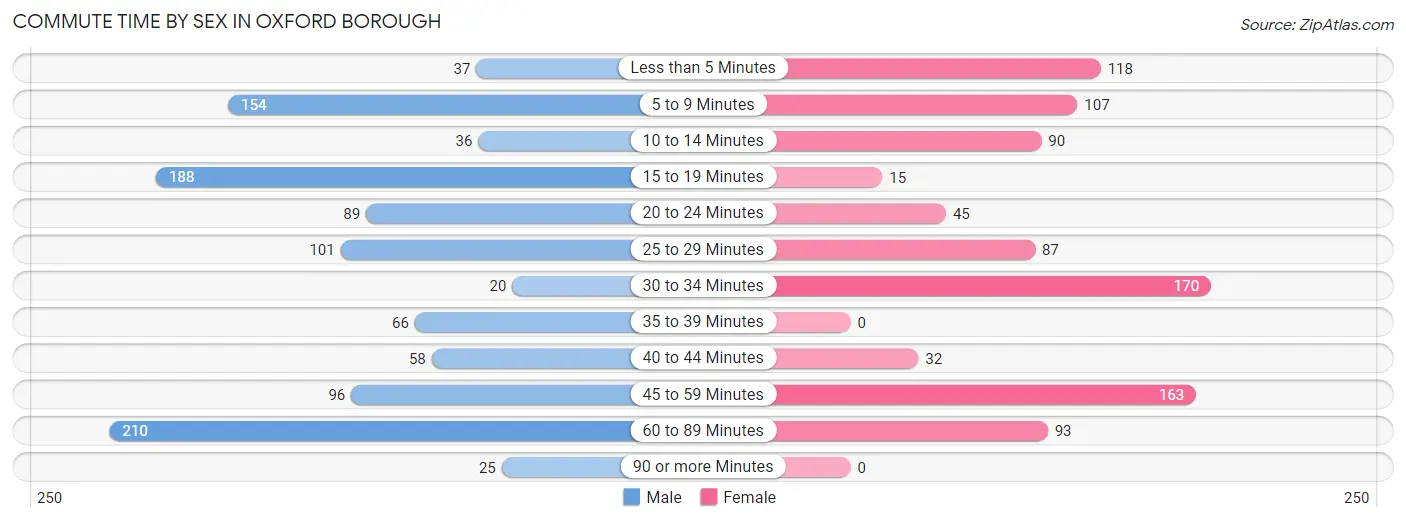
| Commute Time | Male | Female |
| Less than 5 Minutes | 37 (3.4%) | 118 (12.8%) |
| 5 to 9 Minutes | 154 (14.3%) | 107 (11.6%) |
| 10 to 14 Minutes | 36 (3.3%) | 90 (9.8%) |
| 15 to 19 Minutes | 188 (17.4%) | 15 (1.6%) |
| 20 to 24 Minutes | 89 (8.2%) | 45 (4.9%) |
| 25 to 29 Minutes | 101 (9.3%) | 87 (9.5%) |
| 30 to 34 Minutes | 20 (1.8%) | 170 (18.5%) |
| 35 to 39 Minutes | 66 (6.1%) | 0 (0.0%) |
| 40 to 44 Minutes | 58 (5.4%) | 32 (3.5%) |
| 45 to 59 Minutes | 96 (8.9%) | 163 (17.7%) |
| 60 to 89 Minutes | 210 (19.4%) | 93 (10.1%) |
| 90 or more Minutes | 25 (2.3%) | 0 (0.0%) |
Time of Departure to Work by Sex in Oxford borough
The most frequent times of departure to work in Oxford borough are 7:00 AM to 7:29 AM (219, 20.3%) for males and 7:00 AM to 7:29 AM (205, 22.3%) for females.
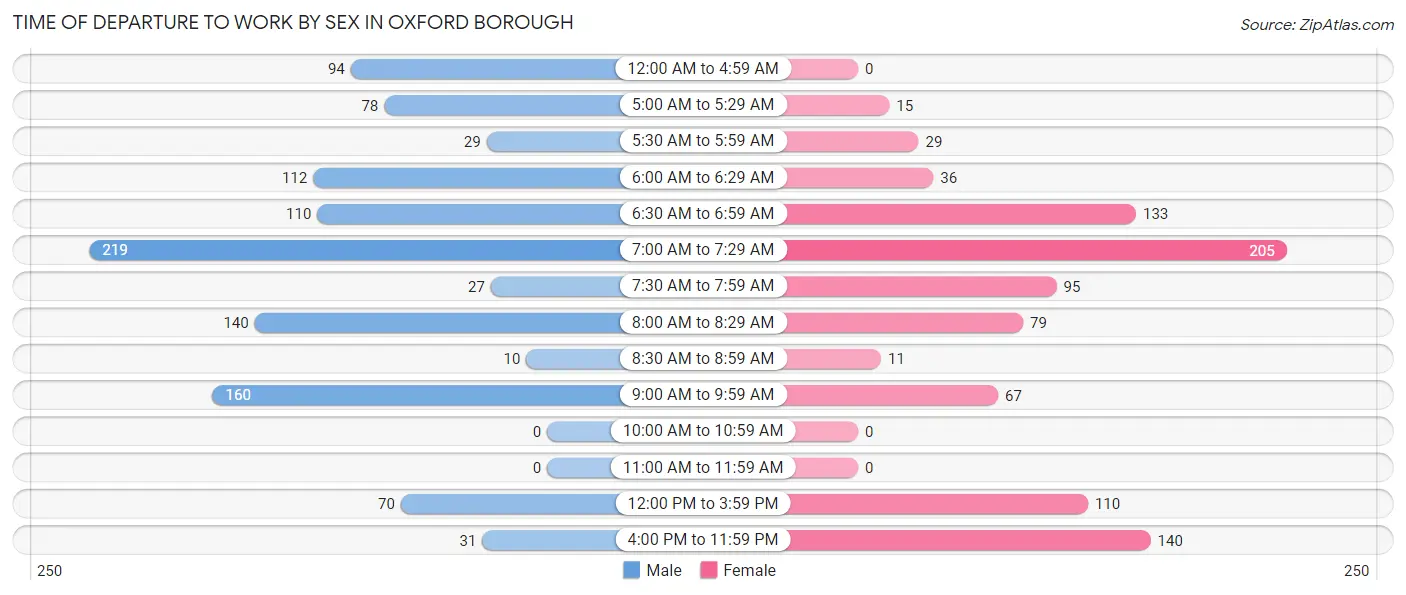
| Time of Departure | Male | Female |
| 12:00 AM to 4:59 AM | 94 (8.7%) | 0 (0.0%) |
| 5:00 AM to 5:29 AM | 78 (7.2%) | 15 (1.6%) |
| 5:30 AM to 5:59 AM | 29 (2.7%) | 29 (3.2%) |
| 6:00 AM to 6:29 AM | 112 (10.4%) | 36 (3.9%) |
| 6:30 AM to 6:59 AM | 110 (10.2%) | 133 (14.5%) |
| 7:00 AM to 7:29 AM | 219 (20.3%) | 205 (22.3%) |
| 7:30 AM to 7:59 AM | 27 (2.5%) | 95 (10.3%) |
| 8:00 AM to 8:29 AM | 140 (13.0%) | 79 (8.6%) |
| 8:30 AM to 8:59 AM | 10 (0.9%) | 11 (1.2%) |
| 9:00 AM to 9:59 AM | 160 (14.8%) | 67 (7.3%) |
| 10:00 AM to 10:59 AM | 0 (0.0%) | 0 (0.0%) |
| 11:00 AM to 11:59 AM | 0 (0.0%) | 0 (0.0%) |
| 12:00 PM to 3:59 PM | 70 (6.5%) | 110 (12.0%) |
| 4:00 PM to 11:59 PM | 31 (2.9%) | 140 (15.2%) |
| Total | 1,080 (100.0%) | 920 (100.0%) |
Housing Occupancy in Oxford borough
Occupancy by Ownership in Oxford borough
Of the total 2,119 dwellings in Oxford borough, owner-occupied units account for 814 (38.4%), while renter-occupied units make up 1,305 (61.6%).
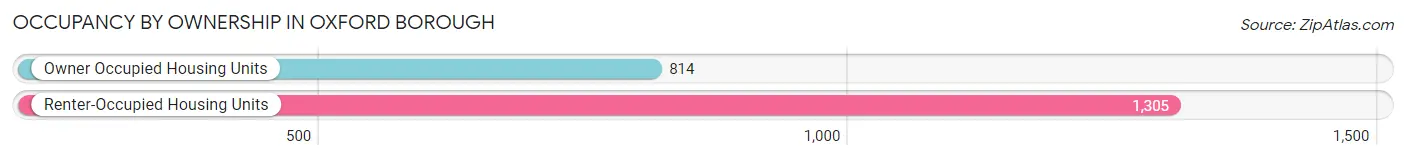
| Occupancy | # Housing Units | % Housing Units |
| Owner Occupied Housing Units | 814 | 38.4% |
| Renter-Occupied Housing Units | 1,305 | 61.6% |
| Total Occupied Housing Units | 2,119 | 100.0% |
Occupancy by Household Size in Oxford borough
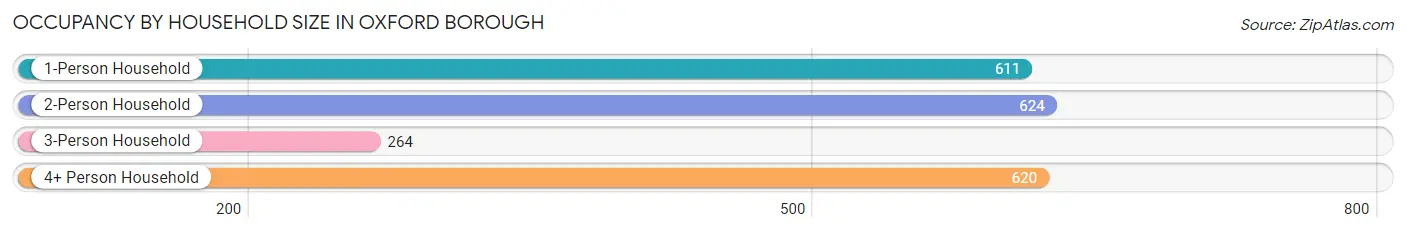
| Household Size | # Housing Units | % Housing Units |
| 1-Person Household | 611 | 28.8% |
| 2-Person Household | 624 | 29.4% |
| 3-Person Household | 264 | 12.5% |
| 4+ Person Household | 620 | 29.3% |
| Total Housing Units | 2,119 | 100.0% |
Occupancy by Ownership by Household Size in Oxford borough
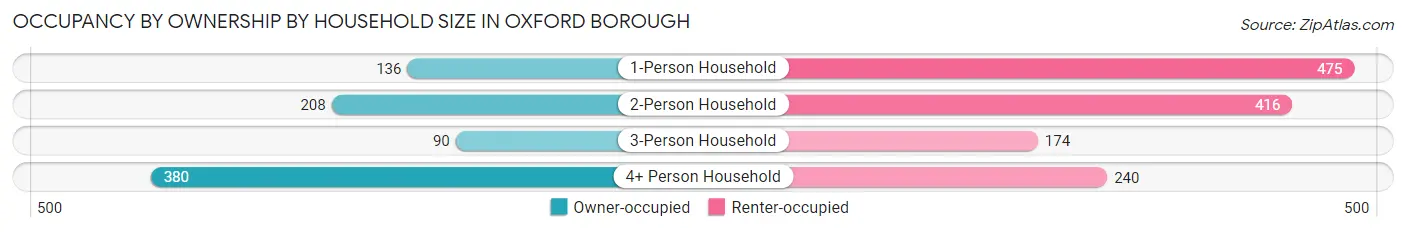
| Household Size | Owner-occupied | Renter-occupied |
| 1-Person Household | 136 (22.3%) | 475 (77.7%) |
| 2-Person Household | 208 (33.3%) | 416 (66.7%) |
| 3-Person Household | 90 (34.1%) | 174 (65.9%) |
| 4+ Person Household | 380 (61.3%) | 240 (38.7%) |
| Total Housing Units | 814 (38.4%) | 1,305 (61.6%) |
Occupancy by Educational Attainment in Oxford borough
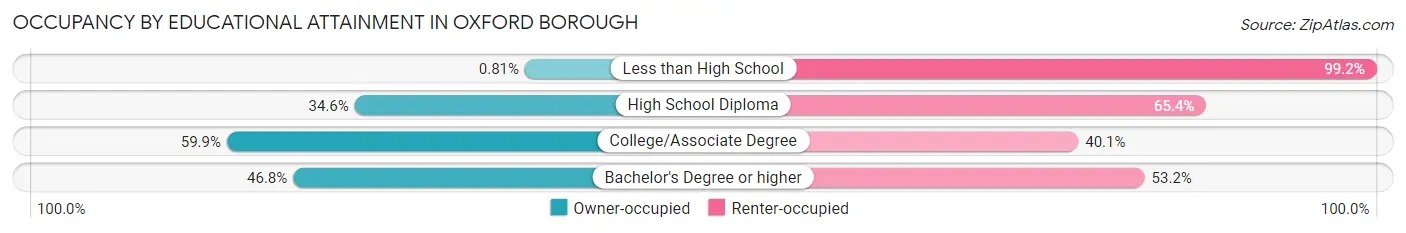
| Household Size | Owner-occupied | Renter-occupied |
| Less than High School | 3 (0.8%) | 367 (99.2%) |
| High School Diploma | 204 (34.6%) | 386 (65.4%) |
| College/Associate Degree | 296 (59.9%) | 198 (40.1%) |
| Bachelor's Degree or higher | 311 (46.8%) | 354 (53.2%) |
Occupancy by Age of Householder in Oxford borough
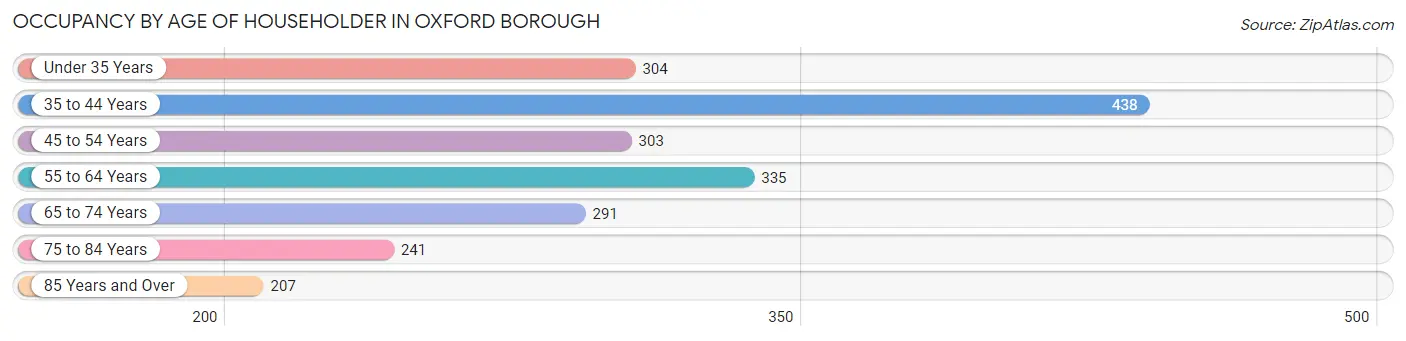
| Age Bracket | # Households | % Households |
| Under 35 Years | 304 | 14.3% |
| 35 to 44 Years | 438 | 20.7% |
| 45 to 54 Years | 303 | 14.3% |
| 55 to 64 Years | 335 | 15.8% |
| 65 to 74 Years | 291 | 13.7% |
| 75 to 84 Years | 241 | 11.4% |
| 85 Years and Over | 207 | 9.8% |
| Total | 2,119 | 100.0% |
Housing Finances in Oxford borough
Median Income by Occupancy in Oxford borough
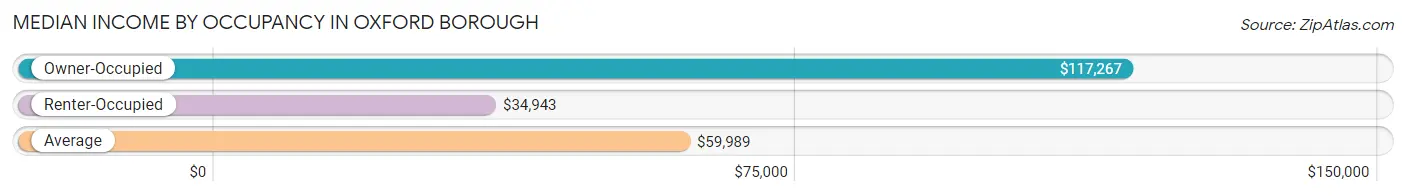
| Occupancy Type | # Households | Median Income |
| Owner-Occupied | 814 (38.4%) | $117,267 |
| Renter-Occupied | 1,305 (61.6%) | $34,943 |
| Average | 2,119 (100.0%) | $59,989 |
Occupancy by Householder Income Bracket in Oxford borough
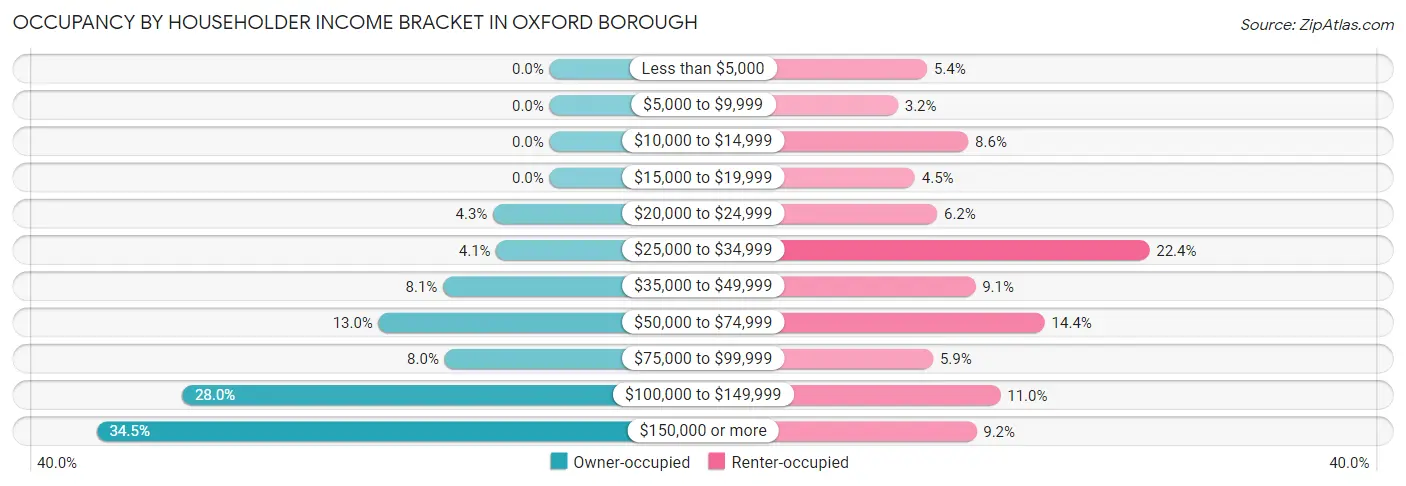
| Income Bracket | Owner-occupied | Renter-occupied |
| Less than $5,000 | 0 (0.0%) | 71 (5.4%) |
| $5,000 to $9,999 | 0 (0.0%) | 42 (3.2%) |
| $10,000 to $14,999 | 0 (0.0%) | 112 (8.6%) |
| $15,000 to $19,999 | 0 (0.0%) | 59 (4.5%) |
| $20,000 to $24,999 | 35 (4.3%) | 81 (6.2%) |
| $25,000 to $34,999 | 33 (4.1%) | 292 (22.4%) |
| $35,000 to $49,999 | 66 (8.1%) | 119 (9.1%) |
| $50,000 to $74,999 | 106 (13.0%) | 188 (14.4%) |
| $75,000 to $99,999 | 65 (8.0%) | 77 (5.9%) |
| $100,000 to $149,999 | 228 (28.0%) | 144 (11.0%) |
| $150,000 or more | 281 (34.5%) | 120 (9.2%) |
| Total | 814 (100.0%) | 1,305 (100.0%) |
Monthly Housing Cost Tiers in Oxford borough
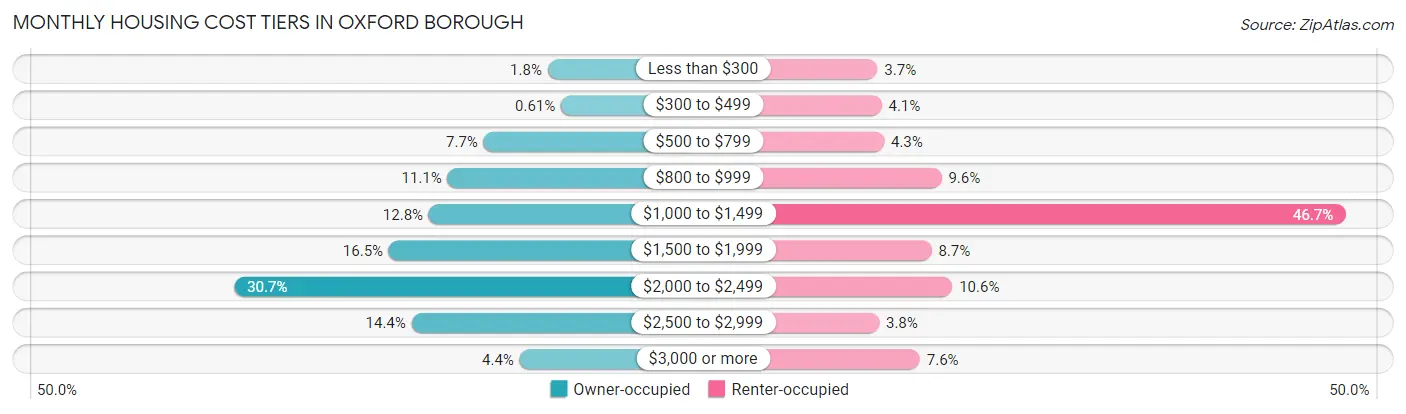
| Monthly Cost | Owner-occupied | Renter-occupied |
| Less than $300 | 15 (1.8%) | 48 (3.7%) |
| $300 to $499 | 5 (0.6%) | 53 (4.1%) |
| $500 to $799 | 63 (7.7%) | 56 (4.3%) |
| $800 to $999 | 90 (11.1%) | 125 (9.6%) |
| $1,000 to $1,499 | 104 (12.8%) | 610 (46.7%) |
| $1,500 to $1,999 | 134 (16.5%) | 113 (8.7%) |
| $2,000 to $2,499 | 250 (30.7%) | 138 (10.6%) |
| $2,500 to $2,999 | 117 (14.4%) | 50 (3.8%) |
| $3,000 or more | 36 (4.4%) | 99 (7.6%) |
| Total | 814 (100.0%) | 1,305 (100.0%) |
Physical Housing Characteristics in Oxford borough
Housing Structures in Oxford borough
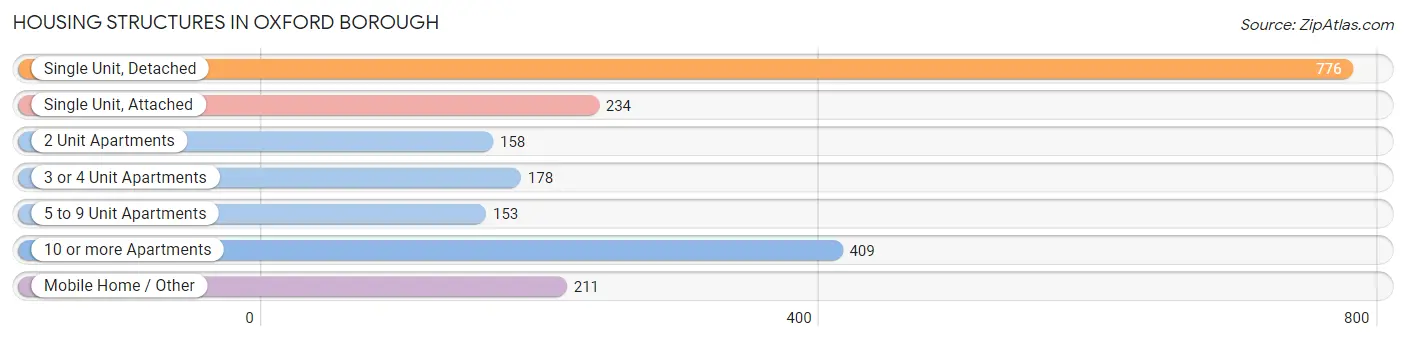
| Structure Type | # Housing Units | % Housing Units |
| Single Unit, Detached | 776 | 36.6% |
| Single Unit, Attached | 234 | 11.0% |
| 2 Unit Apartments | 158 | 7.5% |
| 3 or 4 Unit Apartments | 178 | 8.4% |
| 5 to 9 Unit Apartments | 153 | 7.2% |
| 10 or more Apartments | 409 | 19.3% |
| Mobile Home / Other | 211 | 10.0% |
| Total | 2,119 | 100.0% |
Housing Structures by Occupancy in Oxford borough
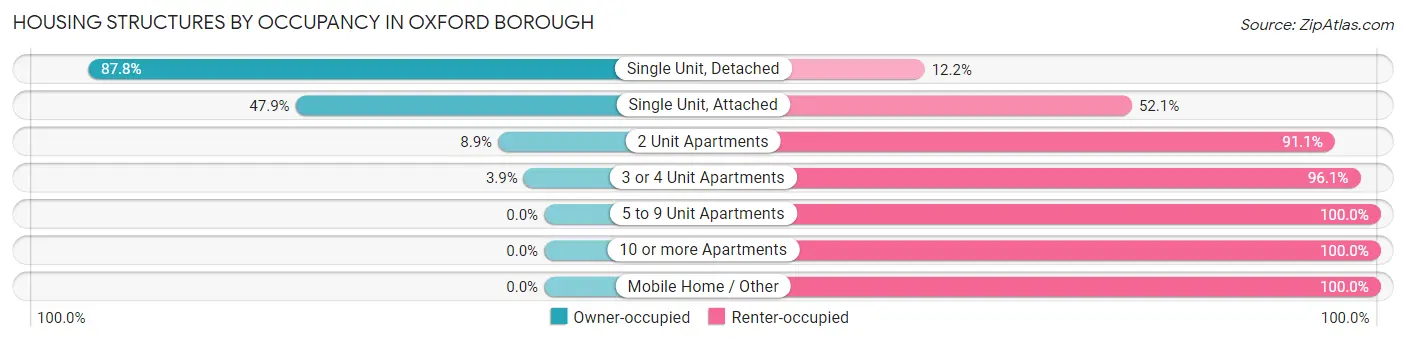
| Structure Type | Owner-occupied | Renter-occupied |
| Single Unit, Detached | 681 (87.8%) | 95 (12.2%) |
| Single Unit, Attached | 112 (47.9%) | 122 (52.1%) |
| 2 Unit Apartments | 14 (8.9%) | 144 (91.1%) |
| 3 or 4 Unit Apartments | 7 (3.9%) | 171 (96.1%) |
| 5 to 9 Unit Apartments | 0 (0.0%) | 153 (100.0%) |
| 10 or more Apartments | 0 (0.0%) | 409 (100.0%) |
| Mobile Home / Other | 0 (0.0%) | 211 (100.0%) |
| Total | 814 (38.4%) | 1,305 (61.6%) |
Housing Structures by Number of Rooms in Oxford borough
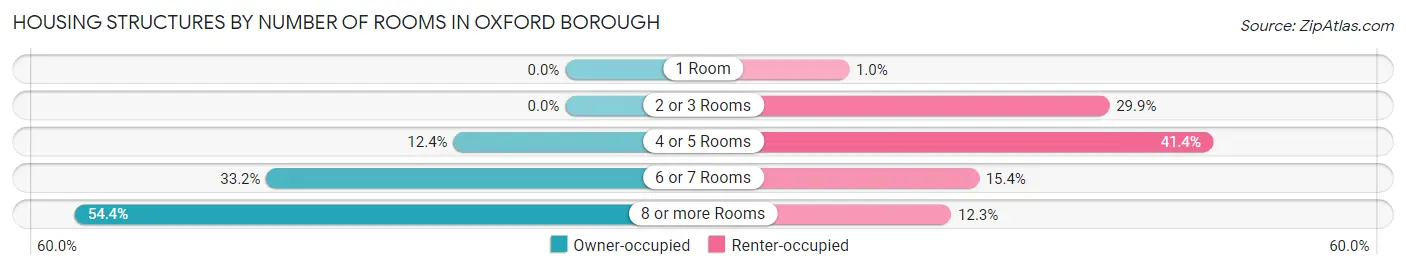
| Number of Rooms | Owner-occupied | Renter-occupied |
| 1 Room | 0 (0.0%) | 13 (1.0%) |
| 2 or 3 Rooms | 0 (0.0%) | 390 (29.9%) |
| 4 or 5 Rooms | 101 (12.4%) | 540 (41.4%) |
| 6 or 7 Rooms | 270 (33.2%) | 201 (15.4%) |
| 8 or more Rooms | 443 (54.4%) | 161 (12.3%) |
| Total | 814 (100.0%) | 1,305 (100.0%) |
Housing Structure by Heating Type in Oxford borough
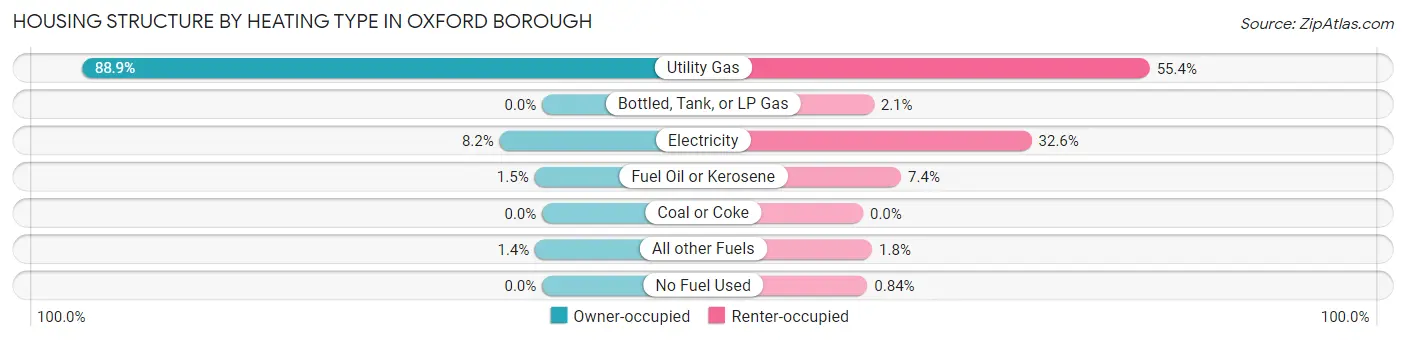
| Heating Type | Owner-occupied | Renter-occupied |
| Utility Gas | 724 (88.9%) | 723 (55.4%) |
| Bottled, Tank, or LP Gas | 0 (0.0%) | 27 (2.1%) |
| Electricity | 67 (8.2%) | 425 (32.6%) |
| Fuel Oil or Kerosene | 12 (1.5%) | 96 (7.4%) |
| Coal or Coke | 0 (0.0%) | 0 (0.0%) |
| All other Fuels | 11 (1.3%) | 23 (1.8%) |
| No Fuel Used | 0 (0.0%) | 11 (0.8%) |
| Total | 814 (100.0%) | 1,305 (100.0%) |
Household Vehicle Usage in Oxford borough
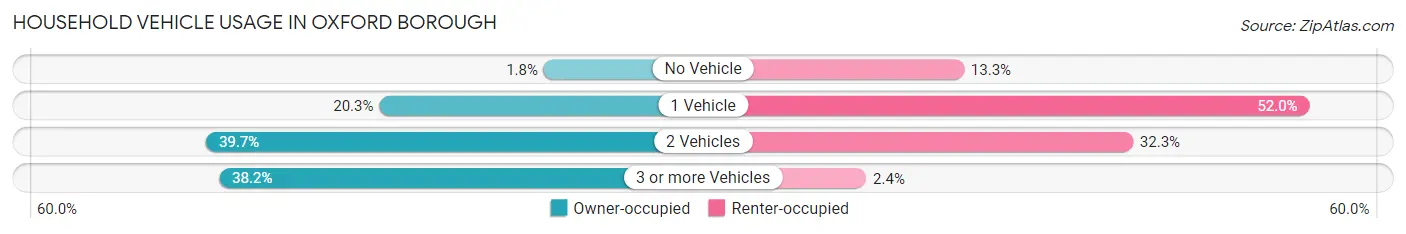
| Vehicles per Household | Owner-occupied | Renter-occupied |
| No Vehicle | 15 (1.8%) | 174 (13.3%) |
| 1 Vehicle | 165 (20.3%) | 679 (52.0%) |
| 2 Vehicles | 323 (39.7%) | 421 (32.3%) |
| 3 or more Vehicles | 311 (38.2%) | 31 (2.4%) |
| Total | 814 (100.0%) | 1,305 (100.0%) |
Real Estate & Mortgages in Oxford borough
Real Estate and Mortgage Overview in Oxford borough
| Characteristic | Without Mortgage | With Mortgage |
| Housing Units | 166 | 648 |
| Median Property Value | $246,400 | $312,300 |
| Median Household Income | - | - |
| Monthly Housing Costs | $800 | $36 |
| Real Estate Taxes | $4,696 | $0 |
Property Value by Mortgage Status in Oxford borough
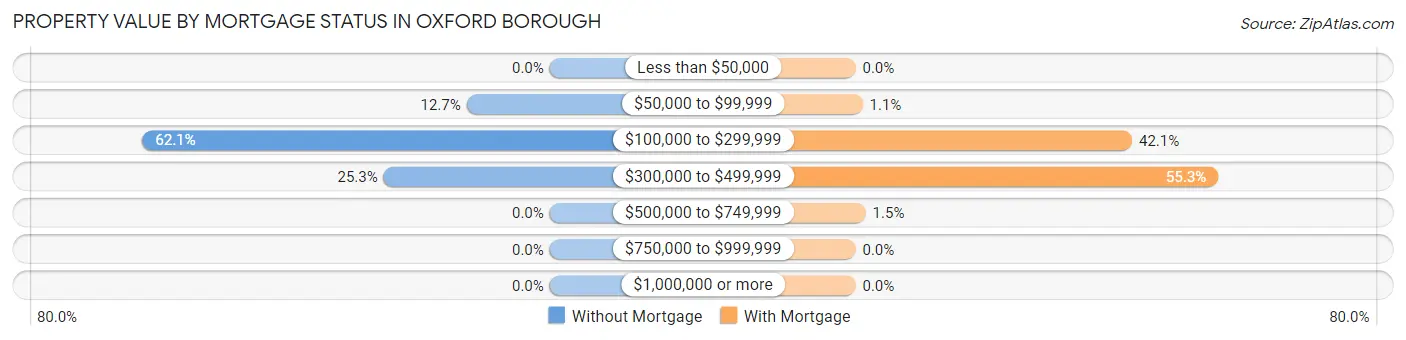
| Property Value | Without Mortgage | With Mortgage |
| Less than $50,000 | 0 (0.0%) | 0 (0.0%) |
| $50,000 to $99,999 | 21 (12.7%) | 7 (1.1%) |
| $100,000 to $299,999 | 103 (62.1%) | 273 (42.1%) |
| $300,000 to $499,999 | 42 (25.3%) | 358 (55.2%) |
| $500,000 to $749,999 | 0 (0.0%) | 10 (1.5%) |
| $750,000 to $999,999 | 0 (0.0%) | 0 (0.0%) |
| $1,000,000 or more | 0 (0.0%) | 0 (0.0%) |
| Total | 166 (100.0%) | 648 (100.0%) |
Household Income by Mortgage Status in Oxford borough
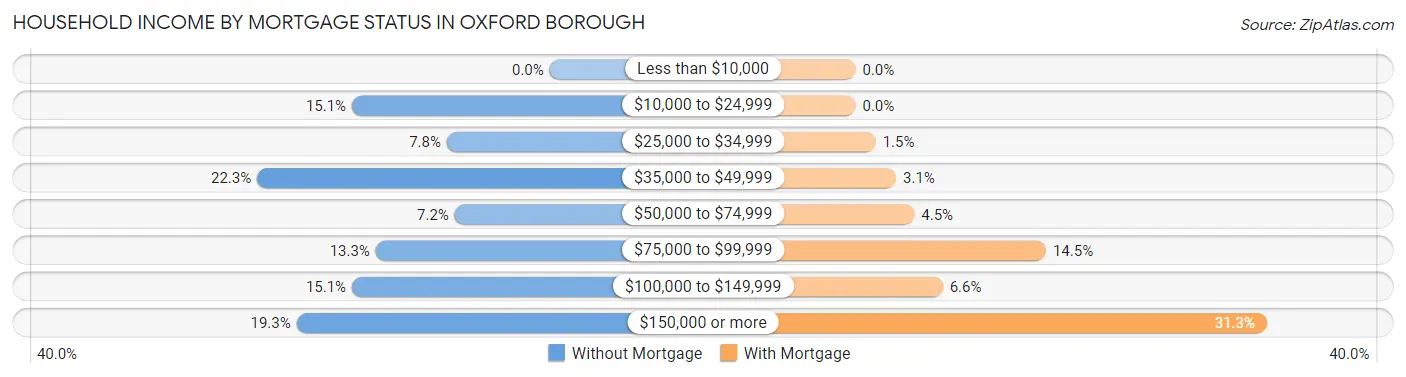
| Household Income | Without Mortgage | With Mortgage |
| Less than $10,000 | 0 (0.0%) | 0 (0.0%) |
| $10,000 to $24,999 | 25 (15.1%) | 0 (0.0%) |
| $25,000 to $34,999 | 13 (7.8%) | 10 (1.5%) |
| $35,000 to $49,999 | 37 (22.3%) | 20 (3.1%) |
| $50,000 to $74,999 | 12 (7.2%) | 29 (4.5%) |
| $75,000 to $99,999 | 22 (13.3%) | 94 (14.5%) |
| $100,000 to $149,999 | 25 (15.1%) | 43 (6.6%) |
| $150,000 or more | 32 (19.3%) | 203 (31.3%) |
| Total | 166 (100.0%) | 648 (100.0%) |
Property Value to Household Income Ratio in Oxford borough
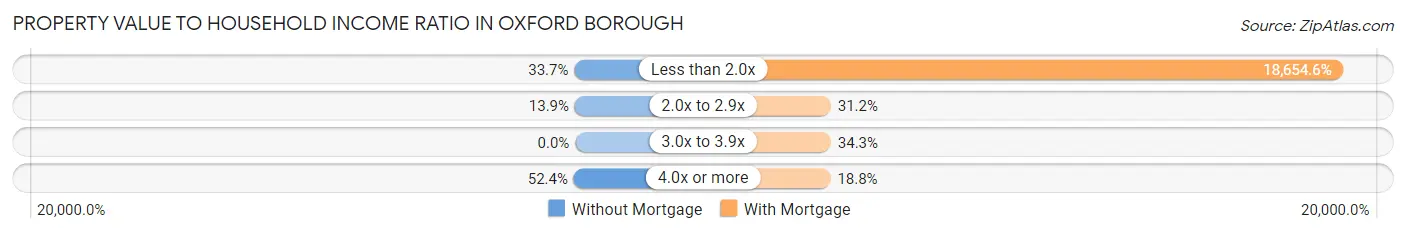
| Value-to-Income Ratio | Without Mortgage | With Mortgage |
| Less than 2.0x | 56 (33.7%) | 120,882 (18,654.6%) |
| 2.0x to 2.9x | 23 (13.9%) | 202 (31.2%) |
| 3.0x to 3.9x | 0 (0.0%) | 222 (34.3%) |
| 4.0x or more | 87 (52.4%) | 122 (18.8%) |
| Total | 166 (100.0%) | 648 (100.0%) |
Real Estate Taxes by Mortgage Status in Oxford borough
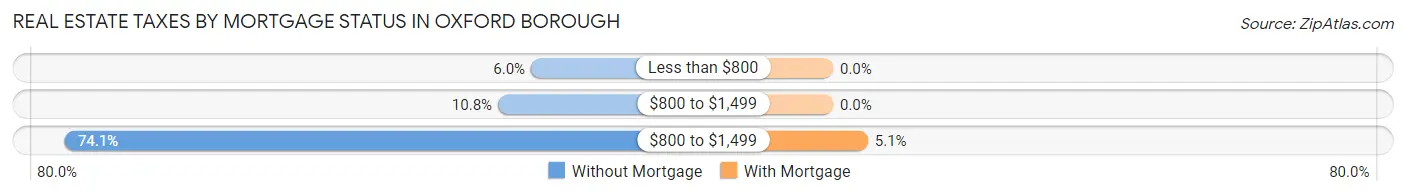
| Property Taxes | Without Mortgage | With Mortgage |
| Less than $800 | 10 (6.0%) | 0 (0.0%) |
| $800 to $1,499 | 18 (10.8%) | 0 (0.0%) |
| $800 to $1,499 | 123 (74.1%) | 33 (5.1%) |
| Total | 166 (100.0%) | 648 (100.0%) |
Health & Disability in Oxford borough
Health Insurance Coverage by Age in Oxford borough
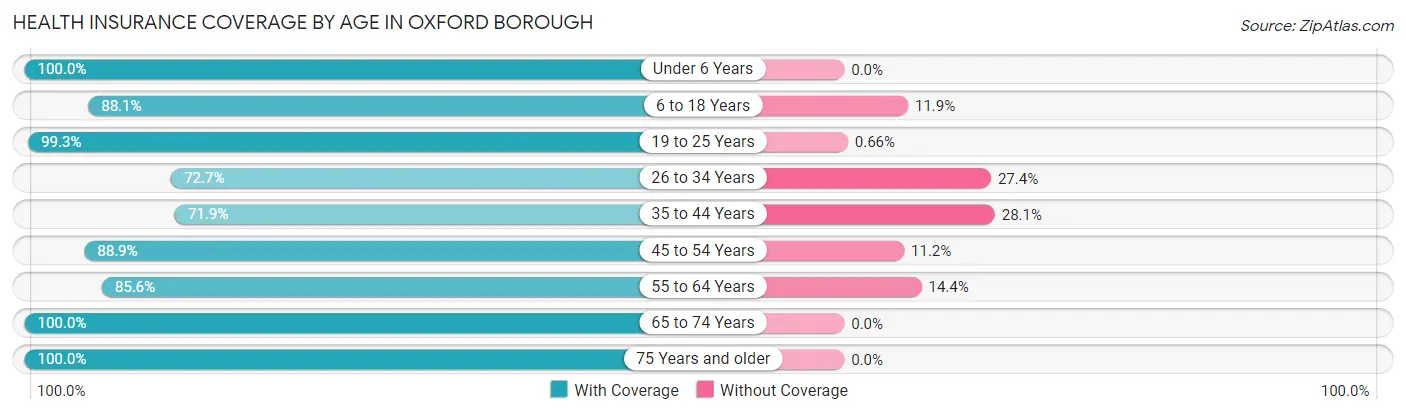
| Age Bracket | With Coverage | Without Coverage |
| Under 6 Years | 658 (100.0%) | 0 (0.0%) |
| 6 to 18 Years | 978 (88.1%) | 132 (11.9%) |
| 19 to 25 Years | 299 (99.3%) | 2 (0.7%) |
| 26 to 34 Years | 441 (72.7%) | 166 (27.4%) |
| 35 to 44 Years | 523 (71.9%) | 204 (28.1%) |
| 45 to 54 Years | 550 (88.8%) | 69 (11.2%) |
| 55 to 64 Years | 576 (85.6%) | 97 (14.4%) |
| 65 to 74 Years | 383 (100.0%) | 0 (0.0%) |
| 75 Years and older | 549 (100.0%) | 0 (0.0%) |
| Total | 4,957 (88.1%) | 670 (11.9%) |
Health Insurance Coverage by Citizenship Status in Oxford borough
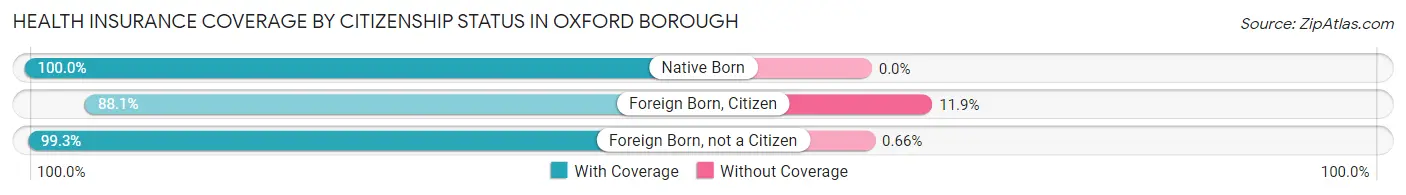
| Citizenship Status | With Coverage | Without Coverage |
| Native Born | 658 (100.0%) | 0 (0.0%) |
| Foreign Born, Citizen | 978 (88.1%) | 132 (11.9%) |
| Foreign Born, not a Citizen | 299 (99.3%) | 2 (0.7%) |
Health Insurance Coverage by Household Income in Oxford borough
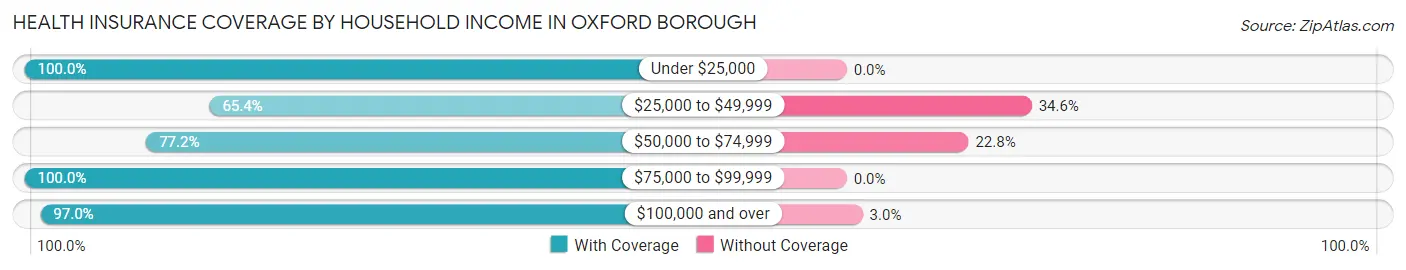
| Household Income | With Coverage | Without Coverage |
| Under $25,000 | 749 (100.0%) | 0 (0.0%) |
| $25,000 to $49,999 | 768 (65.4%) | 407 (34.6%) |
| $50,000 to $74,999 | 640 (77.2%) | 189 (22.8%) |
| $75,000 to $99,999 | 379 (100.0%) | 0 (0.0%) |
| $100,000 and over | 2,421 (97.0%) | 74 (3.0%) |
Public vs Private Health Insurance Coverage by Age in Oxford borough
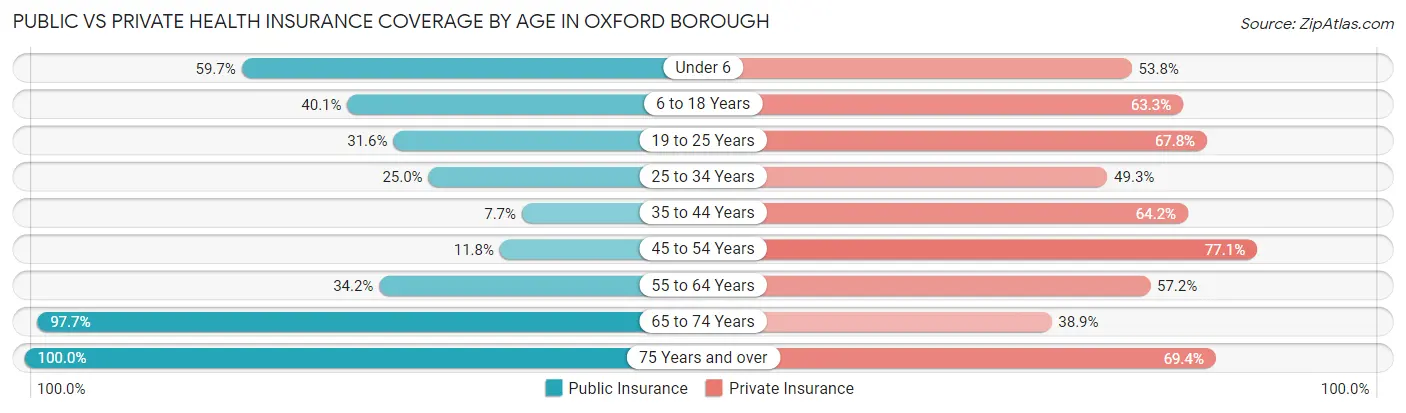
| Age Bracket | Public Insurance | Private Insurance |
| Under 6 | 393 (59.7%) | 354 (53.8%) |
| 6 to 18 Years | 445 (40.1%) | 703 (63.3%) |
| 19 to 25 Years | 95 (31.6%) | 204 (67.8%) |
| 25 to 34 Years | 152 (25.0%) | 299 (49.3%) |
| 35 to 44 Years | 56 (7.7%) | 467 (64.2%) |
| 45 to 54 Years | 73 (11.8%) | 477 (77.1%) |
| 55 to 64 Years | 230 (34.2%) | 385 (57.2%) |
| 65 to 74 Years | 374 (97.7%) | 149 (38.9%) |
| 75 Years and over | 549 (100.0%) | 381 (69.4%) |
| Total | 2,367 (42.1%) | 3,419 (60.8%) |
Disability Status by Sex by Age in Oxford borough
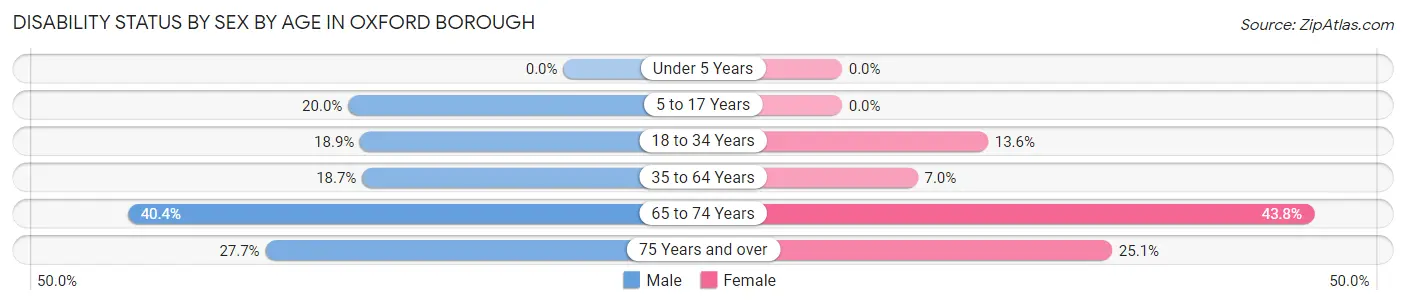
| Age Bracket | Male | Female |
| Under 5 Years | 0 (0.0%) | 0 (0.0%) |
| 5 to 17 Years | 159 (20.0%) | 0 (0.0%) |
| 18 to 34 Years | 86 (18.9%) | 66 (13.6%) |
| 35 to 64 Years | 199 (18.7%) | 67 (7.0%) |
| 65 to 74 Years | 57 (40.4%) | 106 (43.8%) |
| 75 Years and over | 47 (27.7%) | 95 (25.1%) |
Disability Class by Sex by Age in Oxford borough
Disability Class: Hearing Difficulty
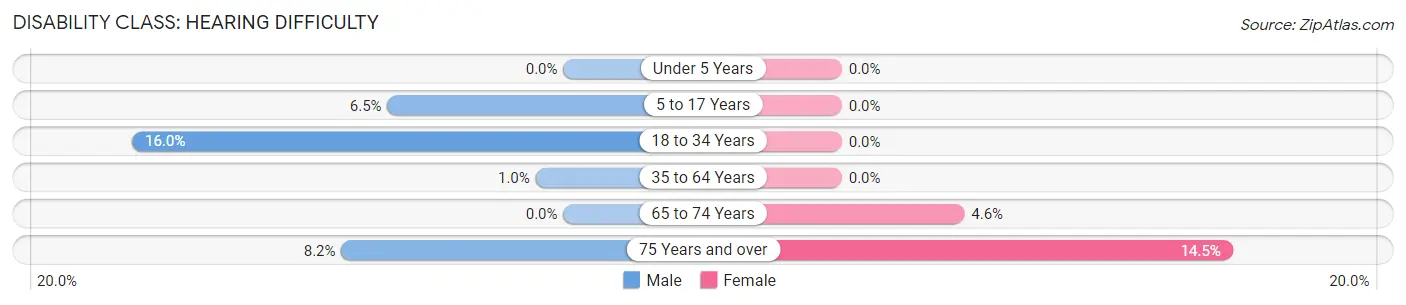
| Age Bracket | Male | Female |
| Under 5 Years | 0 (0.0%) | 0 (0.0%) |
| 5 to 17 Years | 52 (6.5%) | 0 (0.0%) |
| 18 to 34 Years | 73 (16.0%) | 0 (0.0%) |
| 35 to 64 Years | 11 (1.0%) | 0 (0.0%) |
| 65 to 74 Years | 0 (0.0%) | 11 (4.5%) |
| 75 Years and over | 14 (8.2%) | 55 (14.5%) |
Disability Class: Vision Difficulty
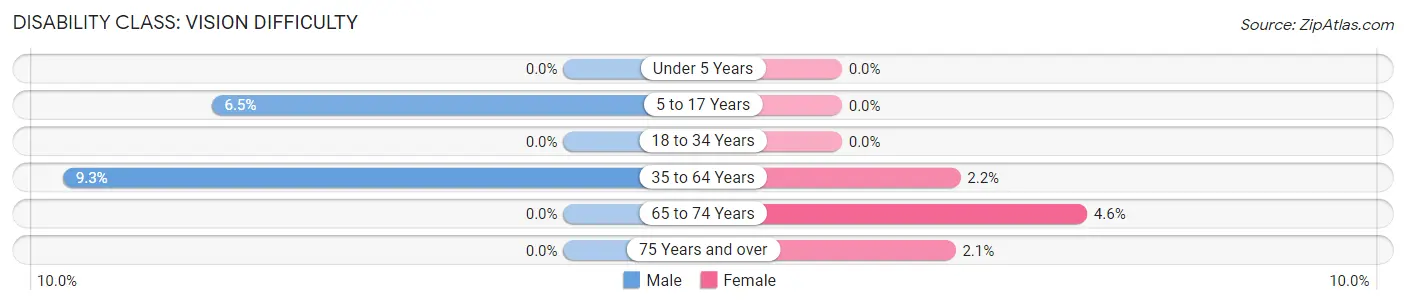
| Age Bracket | Male | Female |
| Under 5 Years | 0 (0.0%) | 0 (0.0%) |
| 5 to 17 Years | 52 (6.5%) | 0 (0.0%) |
| 18 to 34 Years | 0 (0.0%) | 0 (0.0%) |
| 35 to 64 Years | 99 (9.3%) | 21 (2.2%) |
| 65 to 74 Years | 0 (0.0%) | 11 (4.5%) |
| 75 Years and over | 0 (0.0%) | 8 (2.1%) |
Disability Class: Cognitive Difficulty
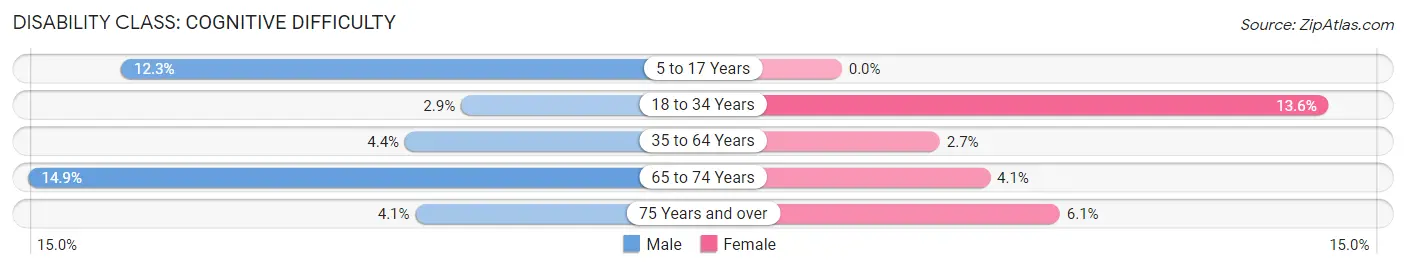
| Age Bracket | Male | Female |
| 5 to 17 Years | 98 (12.3%) | 0 (0.0%) |
| 18 to 34 Years | 13 (2.9%) | 66 (13.6%) |
| 35 to 64 Years | 47 (4.4%) | 26 (2.7%) |
| 65 to 74 Years | 21 (14.9%) | 10 (4.1%) |
| 75 Years and over | 7 (4.1%) | 23 (6.1%) |
Disability Class: Ambulatory Difficulty
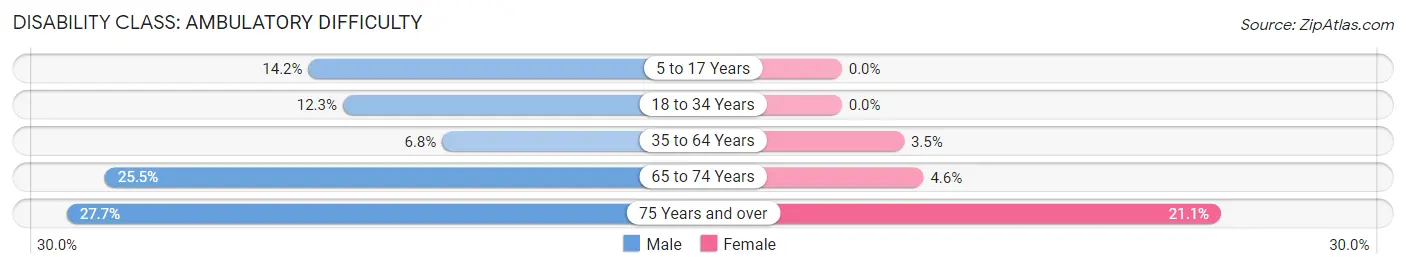
| Age Bracket | Male | Female |
| 5 to 17 Years | 113 (14.2%) | 0 (0.0%) |
| 18 to 34 Years | 56 (12.3%) | 0 (0.0%) |
| 35 to 64 Years | 72 (6.8%) | 33 (3.5%) |
| 65 to 74 Years | 36 (25.5%) | 11 (4.5%) |
| 75 Years and over | 47 (27.7%) | 80 (21.1%) |
Disability Class: Self-Care Difficulty
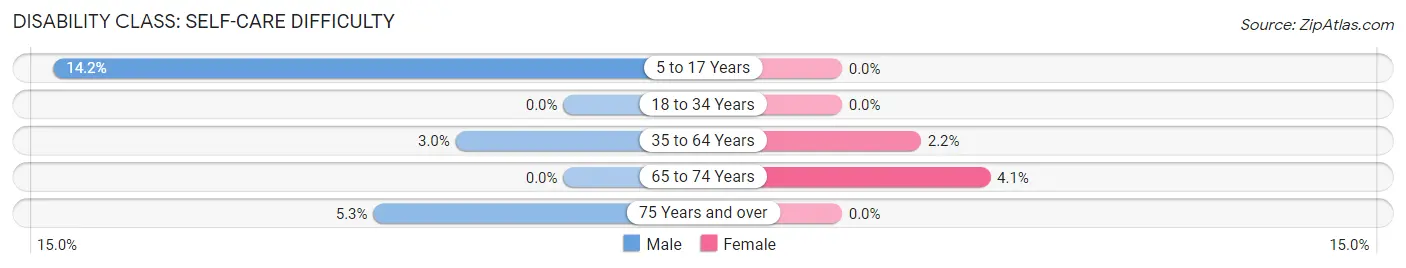
| Age Bracket | Male | Female |
| 5 to 17 Years | 113 (14.2%) | 0 (0.0%) |
| 18 to 34 Years | 0 (0.0%) | 0 (0.0%) |
| 35 to 64 Years | 32 (3.0%) | 21 (2.2%) |
| 65 to 74 Years | 0 (0.0%) | 10 (4.1%) |
| 75 Years and over | 9 (5.3%) | 0 (0.0%) |
Technology Access in Oxford borough
Computing Device Access in Oxford borough
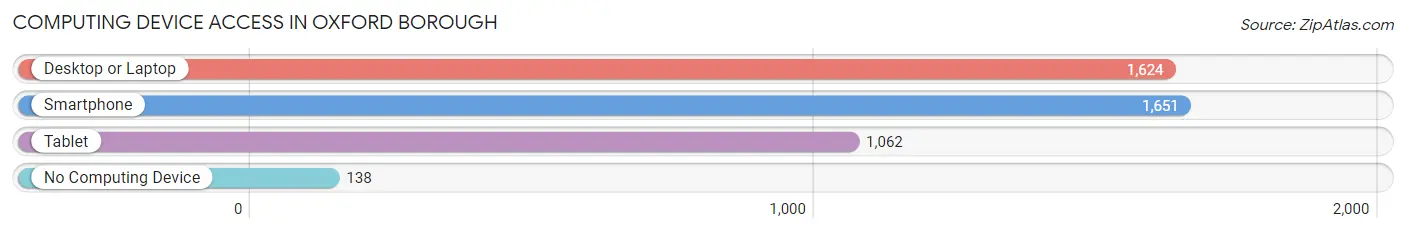
| Device Type | # Households | % Households |
| Desktop or Laptop | 1,624 | 76.6% |
| Smartphone | 1,651 | 77.9% |
| Tablet | 1,062 | 50.1% |
| No Computing Device | 138 | 6.5% |
| Total | 2,119 | 100.0% |
Internet Access in Oxford borough
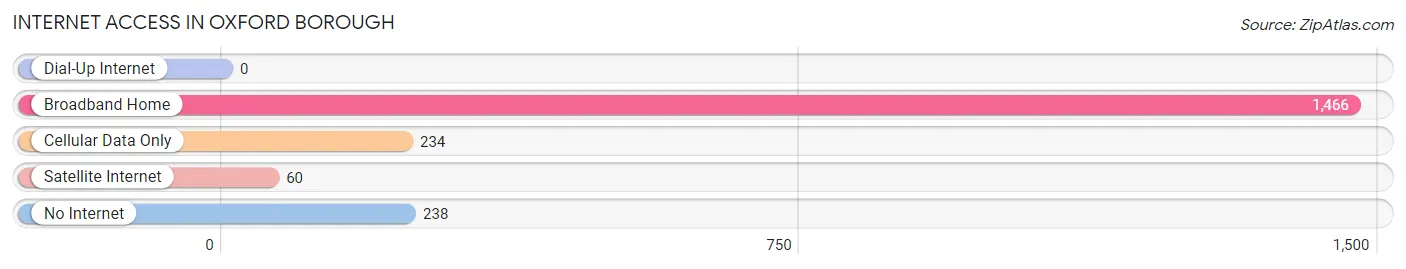
| Internet Type | # Households | % Households |
| Dial-Up Internet | 0 | 0.0% |
| Broadband Home | 1,466 | 69.2% |
| Cellular Data Only | 234 | 11.0% |
| Satellite Internet | 60 | 2.8% |
| No Internet | 238 | 11.2% |
| Total | 2,119 | 100.0% |
Oxford borough Summary
Oxford Borough is a small borough located in the southeastern corner of Chester County, Pennsylvania. It is situated along the banks of the East Branch of the Brandywine Creek and is part of the greater Philadelphia metropolitan area. The borough has a population of approximately 5,000 people and covers an area of 1.2 square miles.
History
Oxford Borough was founded in 1754 by a group of Quakers from Oxford, England. The town was originally known as Oxford Township and was part of Chester County. In 1833, the town was incorporated as a borough. The town was named after its English counterpart, and the name was chosen to honor the Quaker settlers who had come from England.
The town was an important stop on the Underground Railroad, and many escaped slaves found refuge in Oxford. The town was also home to a number of prominent abolitionists, including William Still, who wrote the book The Underground Railroad.
Geography
Oxford Borough is located in southeastern Chester County, Pennsylvania. It is situated along the banks of the East Branch of the Brandywine Creek. The borough covers an area of 1.2 square miles and is bordered by East Nottingham Township to the north, West Nottingham Township to the east, and Lower Oxford Township to the south and west.
The borough is located in the Piedmont region of Pennsylvania, and the terrain is mostly flat. The climate is humid continental, with hot summers and cold winters.
Economy
Oxford Borough has a diverse economy, with a mix of manufacturing, retail, and service industries. The borough is home to a number of small businesses, including restaurants, shops, and professional services. The borough is also home to a number of larger employers, including a manufacturing plant and a distribution center.
The borough is also home to a number of educational institutions, including Oxford Area High School, Oxford Middle School, and Oxford Elementary School.
Demographics
As of the 2010 census, the population of Oxford Borough was 5,077. The racial makeup of the borough was 90.2% White, 4.3% African American, 0.3% Native American, 1.2% Asian, 0.1% Pacific Islander, 1.7% from other races, and 2.4% from two or more races. Hispanic or Latino of any race were 4.2% of the population.
The median household income in Oxford Borough was $50,945, and the median family income was $60,917. The per capita income was $25,945. About 8.2% of families and 10.2% of the population were below the poverty line, including 14.2% of those under age 18 and 5.2% of those age 65 or over.
Common Questions
What is Per Capita Income in Oxford borough?
Per Capita income in Oxford borough is $34,333.
What is the Median Family Income in Oxford borough?
Median Family Income in Oxford borough is $90,938.
What is the Median Household income in Oxford borough?
Median Household Income in Oxford borough is $59,989.
What is Income or Wage Gap in Oxford borough?
Income or Wage Gap in Oxford borough is 27.8%.
Women in Oxford borough earn 72.2 cents for every dollar earned by a man.
What is Inequality or Gini Index in Oxford borough?
Inequality or Gini Index in Oxford borough is 0.49.
What is the Total Population of Oxford borough?
Total Population of Oxford borough is 5,724.
What is the Total Male Population of Oxford borough?
Total Male Population of Oxford borough is 2,920.
What is the Total Female Population of Oxford borough?
Total Female Population of Oxford borough is 2,804.
What is the Ratio of Males per 100 Females in Oxford borough?
There are 104.14 Males per 100 Females in Oxford borough.
What is the Ratio of Females per 100 Males in Oxford borough?
There are 96.03 Females per 100 Males in Oxford borough.
What is the Median Population Age in Oxford borough?
Median Population Age in Oxford borough is 36.6 Years.
What is the Average Family Size in Oxford borough
Average Family Size in Oxford borough is 3.2 People.
What is the Average Household Size in Oxford borough
Average Household Size in Oxford borough is 2.7 People.
How Large is the Labor Force in Oxford borough?
There are 2,431 People in the Labor Forcein in Oxford borough.
What is the Percentage of People in the Labor Force in Oxford borough?
58.7% of People are in the Labor Force in Oxford borough.
What is the Unemployment Rate in Oxford borough?
Unemployment Rate in Oxford borough is 4.8%.