Penbrook borough, PA Map & Demographics
Penbrook borough Overview
$27,027
PER CAPITA INCOME
$61,165
AVG FAMILY INCOME
$61,250
AVG HOUSEHOLD INCOME
13.4%
WAGE / INCOME GAP [ % ]
86.6¢/ $1
WAGE / INCOME GAP [ $ ]
0.40
INEQUALITY / GINI INDEX
3,255
TOTAL POPULATION
1,554
MALE POPULATION
1,701
FEMALE POPULATION
91.36
MALES / 100 FEMALES
109.46
FEMALES / 100 MALES
30.0
MEDIAN AGE
2.8
AVG FAMILY SIZE
2.3
AVG HOUSEHOLD SIZE
1,805
LABOR FORCE [ PEOPLE ]
72.5%
PERCENT IN LABOR FORCE
8.1%
UNEMPLOYMENT RATE
Income in Penbrook borough
Income Overview in Penbrook borough
Per Capita Income in Penbrook borough is $27,027, while median incomes of families and households are $61,165 and $61,250 respectively.
| Characteristic | Number | Measure |
| Per Capita Income | 3,255 | $27,027 |
| Median Family Income | 861 | $61,165 |
| Mean Family Income | 861 | $77,142 |
| Median Household Income | 1,401 | $61,250 |
| Mean Household Income | 1,401 | $66,758 |
| Income Deficit | 861 | $0 |
| Wage / Income Gap (%) | 3,255 | 13.42% |
| Wage / Income Gap ($) | 3,255 | 86.58¢ per $1 |
| Gini / Inequality Index | 3,255 | 0.40 |
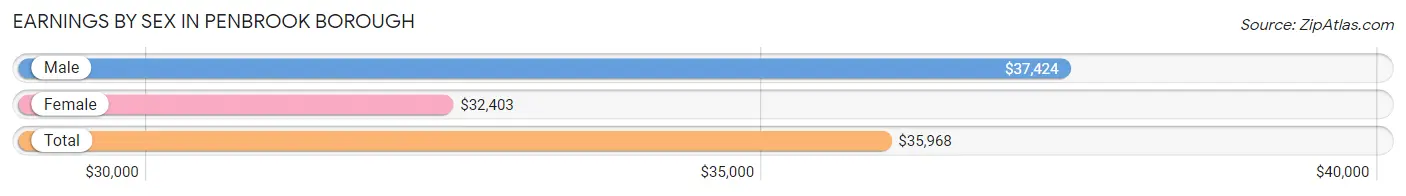
Earnings by Sex in Penbrook borough
Average Earnings in Penbrook borough are $35,968, $37,424 for men and $32,403 for women, a difference of 13.4%.
| Sex | Number | Average Earnings |
| Male | 896 (48.8%) | $37,424 |
| Female | 938 (51.1%) | $32,403 |
| Total | 1,834 (100.0%) | $35,968 |
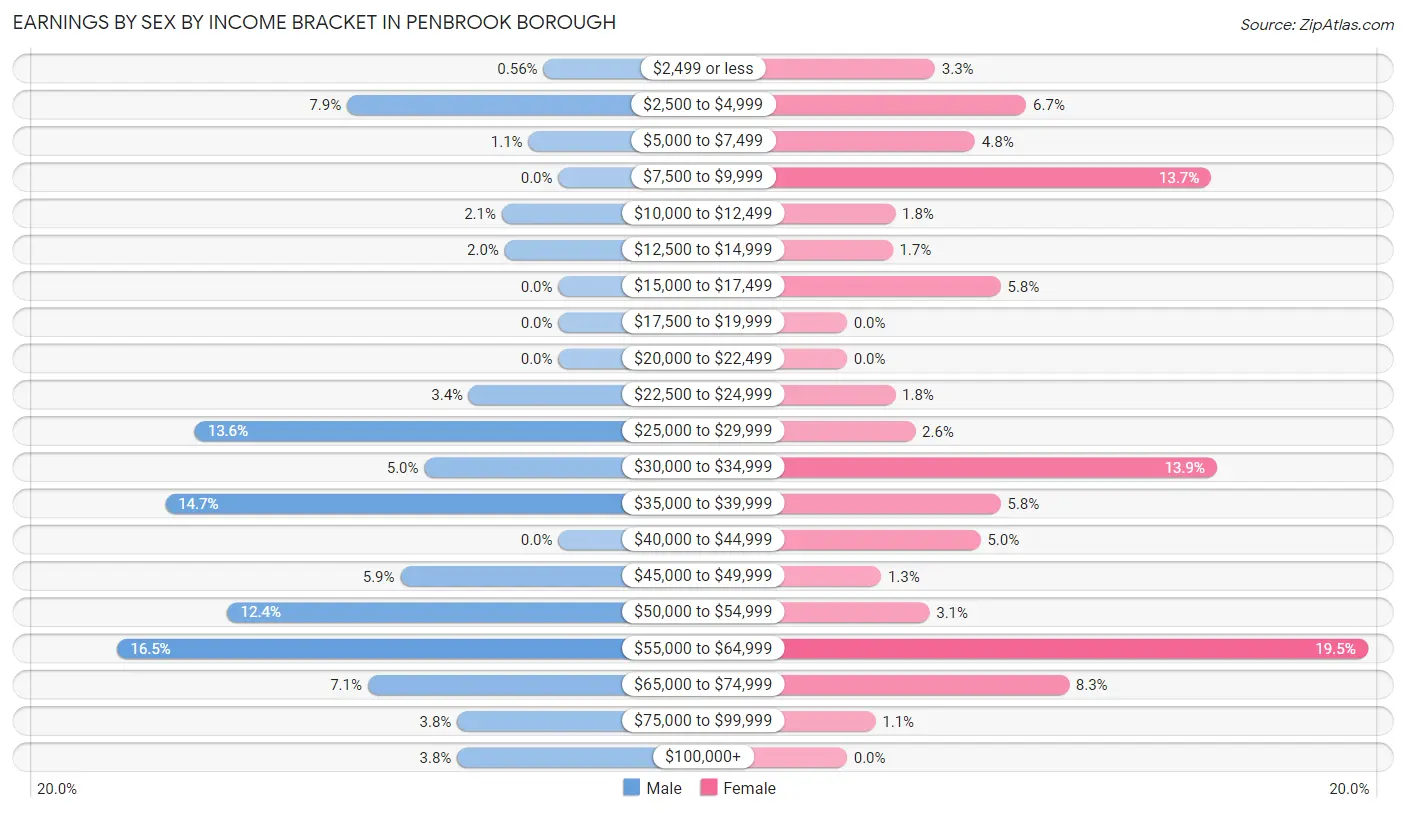
Earnings by Sex by Income Bracket in Penbrook borough
The most common earnings brackets in Penbrook borough are $55,000 to $64,999 for men (148 | 16.5%) and $55,000 to $64,999 for women (183 | 19.5%).
| Income | Male | Female |
| $2,499 or less | 5 (0.6%) | 31 (3.3%) |
| $2,500 to $4,999 | 71 (7.9%) | 63 (6.7%) |
| $5,000 to $7,499 | 10 (1.1%) | 45 (4.8%) |
| $7,500 to $9,999 | 0 (0.0%) | 128 (13.7%) |
| $10,000 to $12,499 | 19 (2.1%) | 17 (1.8%) |
| $12,500 to $14,999 | 18 (2.0%) | 16 (1.7%) |
| $15,000 to $17,499 | 0 (0.0%) | 54 (5.8%) |
| $17,500 to $19,999 | 0 (0.0%) | 0 (0.0%) |
| $20,000 to $22,499 | 0 (0.0%) | 0 (0.0%) |
| $22,500 to $24,999 | 30 (3.4%) | 17 (1.8%) |
| $25,000 to $29,999 | 122 (13.6%) | 24 (2.6%) |
| $30,000 to $34,999 | 45 (5.0%) | 130 (13.9%) |
| $35,000 to $39,999 | 132 (14.7%) | 54 (5.8%) |
| $40,000 to $44,999 | 0 (0.0%) | 47 (5.0%) |
| $45,000 to $49,999 | 53 (5.9%) | 12 (1.3%) |
| $50,000 to $54,999 | 111 (12.4%) | 29 (3.1%) |
| $55,000 to $64,999 | 148 (16.5%) | 183 (19.5%) |
| $65,000 to $74,999 | 64 (7.1%) | 78 (8.3%) |
| $75,000 to $99,999 | 34 (3.8%) | 10 (1.1%) |
| $100,000+ | 34 (3.8%) | 0 (0.0%) |
| Total | 896 (100.0%) | 938 (100.0%) |
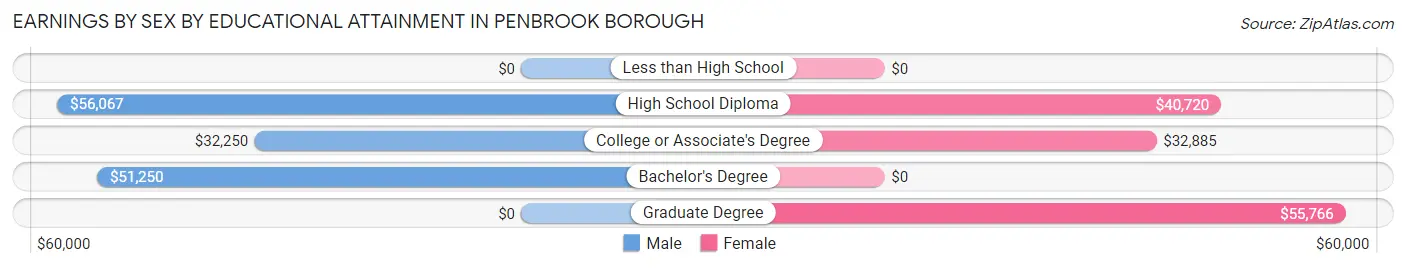
Earnings by Sex by Educational Attainment in Penbrook borough
Average earnings in Penbrook borough are $48,980 for men and $37,048 for women, a difference of 24.4%. Men with an educational attainment of high school diploma enjoy the highest average annual earnings of $56,067, while those with college or associate's degree education earn the least with $32,250. Women with an educational attainment of graduate degree earn the most with the average annual earnings of $55,766, while those with college or associate's degree education have the smallest earnings of $32,885.
| Educational Attainment | Male Income | Female Income |
| Less than High School | - | - |
| High School Diploma | $56,067 | $40,720 |
| College or Associate's Degree | $32,250 | $32,885 |
| Bachelor's Degree | $51,250 | $0 |
| Graduate Degree | - | - |
| Total | $48,980 | $37,048 |
Family Income in Penbrook borough
Family Income Brackets in Penbrook borough
According to the Penbrook borough family income data, there are 289 families falling into the $50,000 to $74,999 income range, which is the most common income bracket and makes up 33.6% of all families.

| Income Bracket | # Families | % Families |
| Less than $10,000 | 75 | 8.7% |
| $10,000 to $14,999 | 0 | 0.0% |
| $15,000 to $24,999 | 29 | 3.4% |
| $25,000 to $34,999 | 77 | 8.9% |
| $35,000 to $49,999 | 44 | 5.1% |
| $50,000 to $74,999 | 289 | 33.6% |
| $75,000 to $99,999 | 54 | 6.3% |
| $100,000 to $149,999 | 256 | 29.7% |
| $150,000 to $199,999 | 8 | 0.9% |
| $200,000+ | 29 | 3.4% |
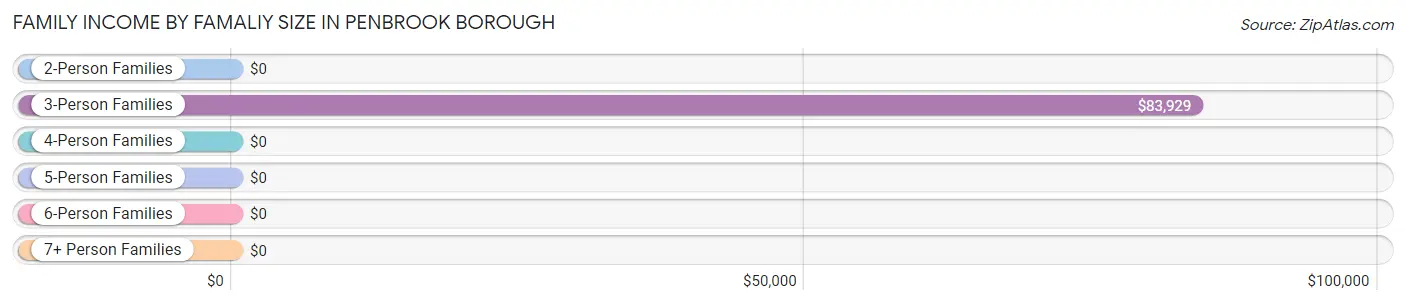
Family Income by Famaliy Size in Penbrook borough
3-person families (420 | 48.8%) account for the highest median family income in Penbrook borough with $83,929 per family, while 3-person families (420 | 48.8%) have the highest median income of $27,976 per family member.
| Income Bracket | # Families | Median Income |
| 2-Person Families | 302 (35.1%) | $0 |
| 3-Person Families | 420 (48.8%) | $83,929 |
| 4-Person Families | 115 (13.4%) | $0 |
| 5-Person Families | 0 (0.0%) | $0 |
| 6-Person Families | 18 (2.1%) | $0 |
| 7+ Person Families | 6 (0.7%) | $0 |
| Total | 861 (100.0%) | $61,165 |
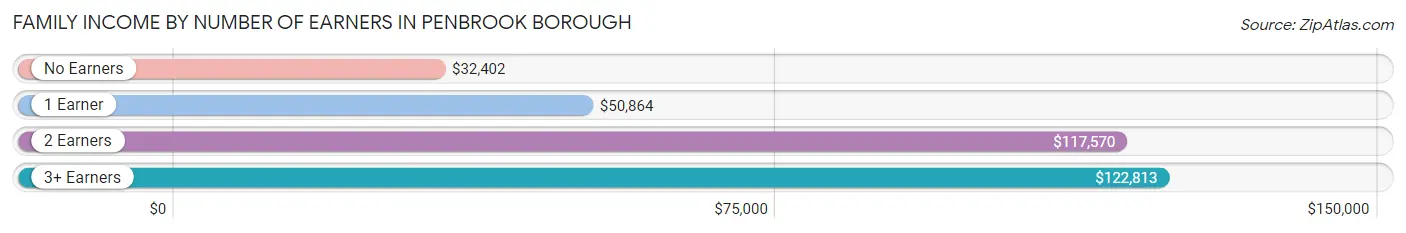
Family Income by Number of Earners in Penbrook borough
The median family income in Penbrook borough is $61,165, with families comprising 3+ earners (121) having the highest median family income of $122,813, while families with no earners (120) have the lowest median family income of $32,402, accounting for 14.1% and 13.9% of families, respectively.
| Number of Earners | # Families | Median Income |
| No Earners | 120 (13.9%) | $32,402 |
| 1 Earner | 314 (36.5%) | $50,864 |
| 2 Earners | 306 (35.5%) | $117,570 |
| 3+ Earners | 121 (14.1%) | $122,813 |
| Total | 861 (100.0%) | $61,165 |
Household Income in Penbrook borough
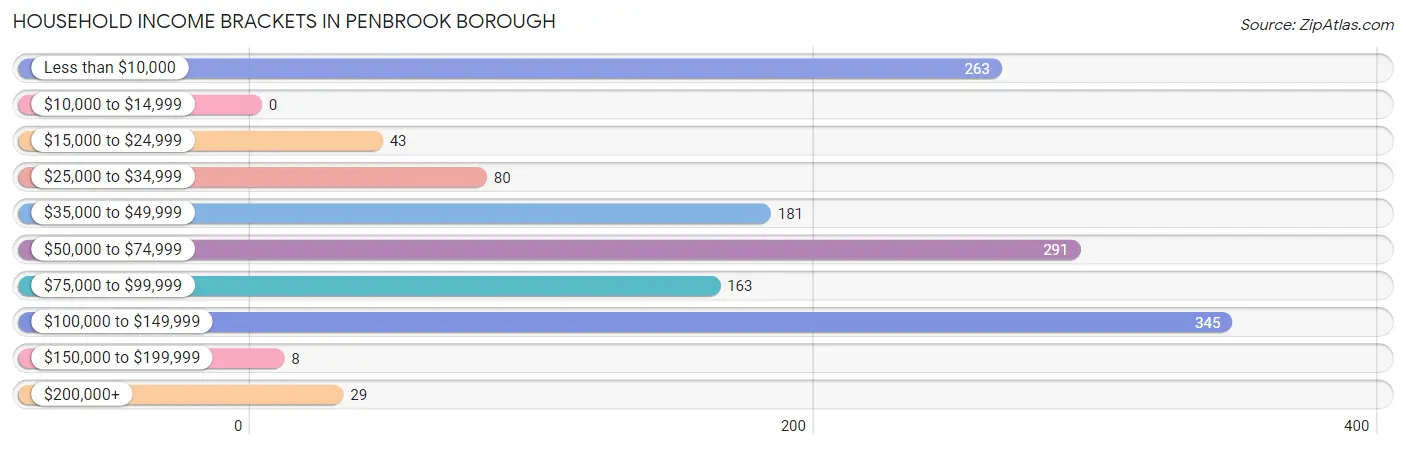
Household Income Brackets in Penbrook borough
With 345 households falling in the category, the $100,000 to $149,999 income range is the most frequent in Penbrook borough, accounting for 24.6% of all households.
| Income Bracket | # Households | % Households |
| Less than $10,000 | 263 | 18.8% |
| $10,000 to $14,999 | 0 | 0.0% |
| $15,000 to $24,999 | 43 | 3.1% |
| $25,000 to $34,999 | 80 | 5.7% |
| $35,000 to $49,999 | 181 | 12.9% |
| $50,000 to $74,999 | 291 | 20.8% |
| $75,000 to $99,999 | 163 | 11.6% |
| $100,000 to $149,999 | 345 | 24.6% |
| $150,000 to $199,999 | 8 | 0.6% |
| $200,000+ | 29 | 2.1% |
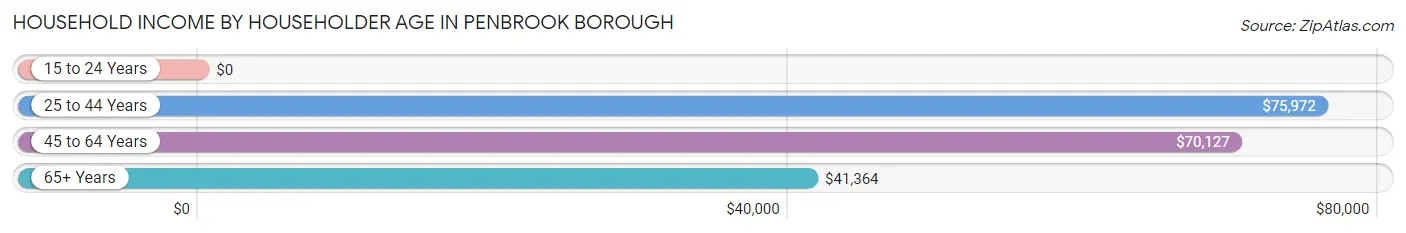
Household Income by Householder Age in Penbrook borough
The median household income in Penbrook borough is $61,250, with the highest median household income of $75,972 found in the 25 to 44 years age bracket for the primary householder. A total of 584 households (41.7%) fall into this category. Meanwhile, the 15 to 24 years age bracket for the primary householder has the lowest median household income of $0, with 75 households (5.3%) in this group.
| Income Bracket | # Households | Median Income |
| 15 to 24 Years | 75 (5.3%) | $0 |
| 25 to 44 Years | 584 (41.7%) | $75,972 |
| 45 to 64 Years | 546 (39.0%) | $70,127 |
| 65+ Years | 196 (14.0%) | $41,364 |
| Total | 1,401 (100.0%) | $61,250 |
Poverty in Penbrook borough
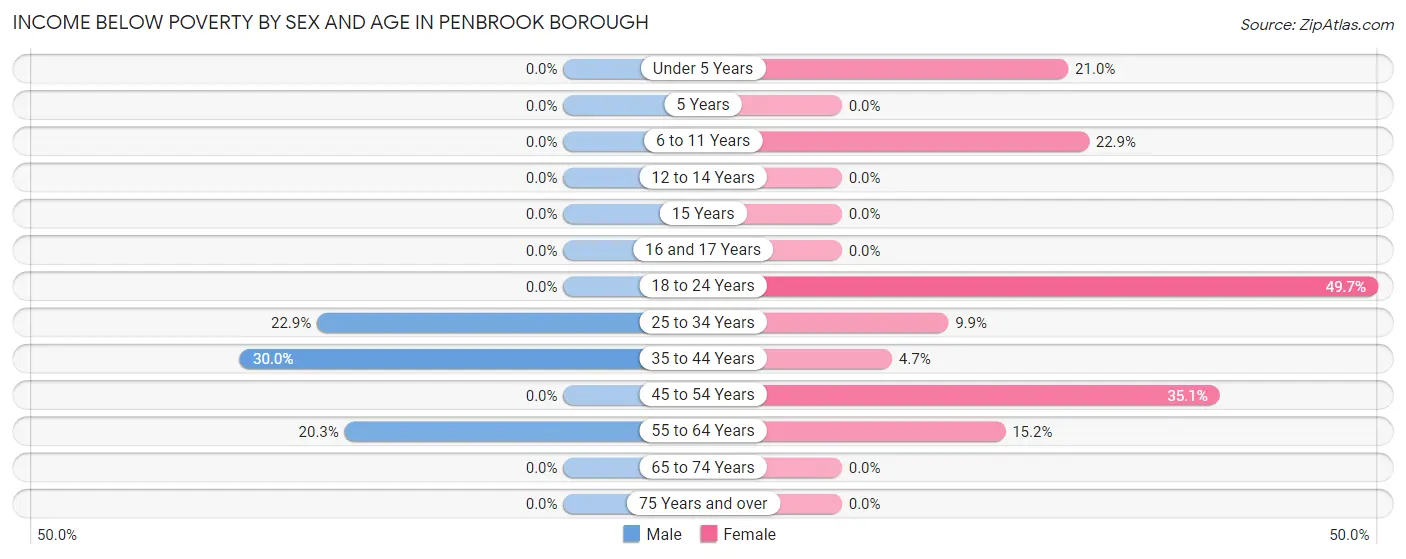
Income Below Poverty by Sex and Age in Penbrook borough
With 11.1% poverty level for males and 19.3% for females among the residents of Penbrook borough, 35 to 44 year old males and 18 to 24 year old females are the most vulnerable to poverty, with 27 males (30.0%) and 96 females (49.7%) in their respective age groups living below the poverty level.
| Age Bracket | Male | Female |
| Under 5 Years | 0 (0.0%) | 25 (21.0%) |
| 5 Years | 0 (0.0%) | 0 (0.0%) |
| 6 to 11 Years | 0 (0.0%) | 58 (22.9%) |
| 12 to 14 Years | 0 (0.0%) | 0 (0.0%) |
| 15 Years | 0 (0.0%) | 0 (0.0%) |
| 16 and 17 Years | 0 (0.0%) | 0 (0.0%) |
| 18 to 24 Years | 0 (0.0%) | 96 (49.7%) |
| 25 to 34 Years | 104 (22.9%) | 41 (9.9%) |
| 35 to 44 Years | 27 (30.0%) | 6 (4.6%) |
| 45 to 54 Years | 0 (0.0%) | 75 (35.0%) |
| 55 to 64 Years | 41 (20.3%) | 27 (15.2%) |
| 65 to 74 Years | 0 (0.0%) | 0 (0.0%) |
| 75 Years and over | 0 (0.0%) | 0 (0.0%) |
| Total | 172 (11.1%) | 328 (19.3%) |
Income Above Poverty by Sex and Age in Penbrook borough
According to the poverty statistics in Penbrook borough, males aged under 5 years and females aged 12 to 14 years are the age groups that are most secure financially, with 100.0% of males and 100.0% of females in these age groups living above the poverty line.
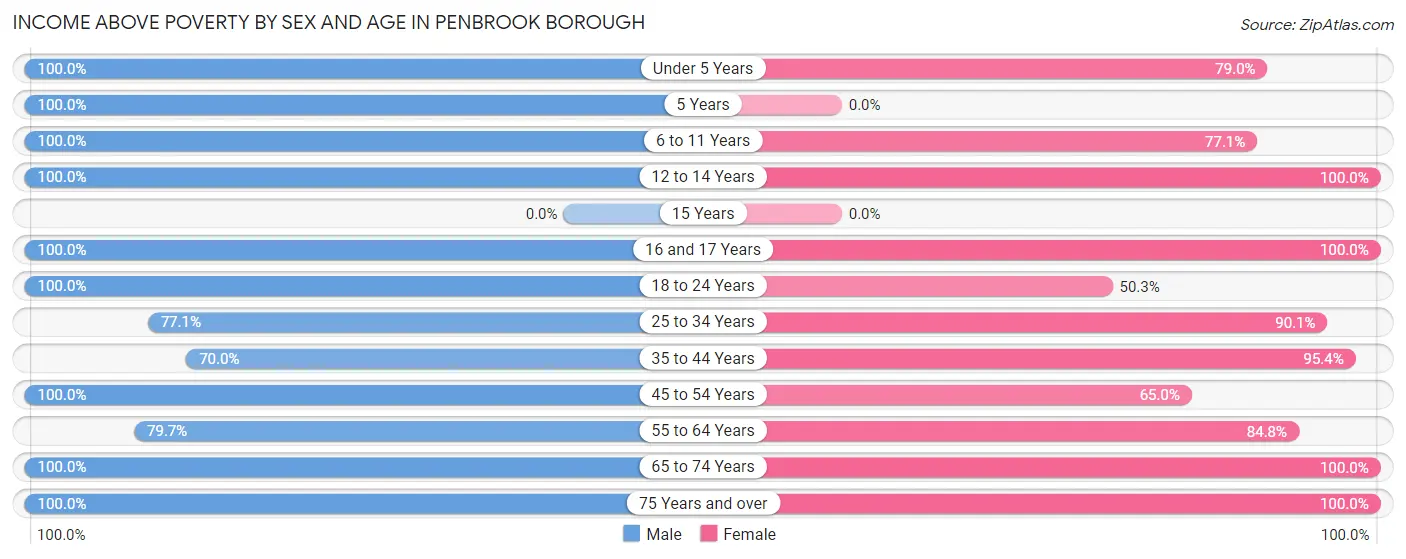
| Age Bracket | Male | Female |
| Under 5 Years | 225 (100.0%) | 94 (79.0%) |
| 5 Years | 62 (100.0%) | 0 (0.0%) |
| 6 to 11 Years | 88 (100.0%) | 195 (77.1%) |
| 12 to 14 Years | 13 (100.0%) | 4 (100.0%) |
| 15 Years | 0 (0.0%) | 0 (0.0%) |
| 16 and 17 Years | 5 (100.0%) | 42 (100.0%) |
| 18 to 24 Years | 114 (100.0%) | 97 (50.3%) |
| 25 to 34 Years | 351 (77.1%) | 374 (90.1%) |
| 35 to 44 Years | 63 (70.0%) | 123 (95.4%) |
| 45 to 54 Years | 134 (100.0%) | 139 (64.9%) |
| 55 to 64 Years | 161 (79.7%) | 151 (84.8%) |
| 65 to 74 Years | 156 (100.0%) | 106 (100.0%) |
| 75 Years and over | 10 (100.0%) | 47 (100.0%) |
| Total | 1,382 (88.9%) | 1,372 (80.7%) |
Income Below Poverty Among Married-Couple Families in Penbrook borough
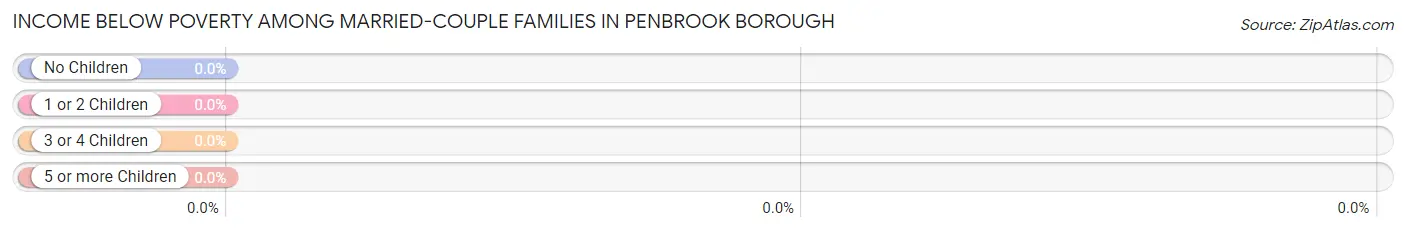
| Children | Above Poverty | Below Poverty |
| No Children | 218 (100.0%) | 0 (0.0%) |
| 1 or 2 Children | 257 (100.0%) | 0 (0.0%) |
| 3 or 4 Children | 6 (100.0%) | 0 (0.0%) |
| 5 or more Children | 0 (0.0%) | 0 (0.0%) |
| Total | 481 (100.0%) | 0 (0.0%) |
Income Below Poverty Among Single-Parent Households in Penbrook borough
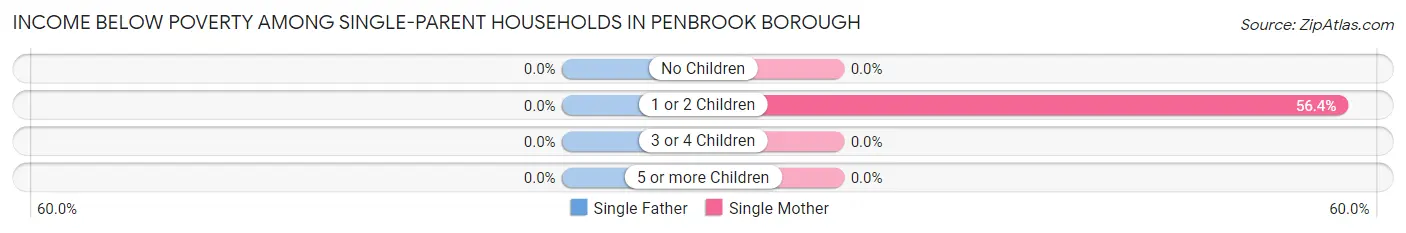
| Children | Single Father | Single Mother |
| No Children | 0 (0.0%) | 0 (0.0%) |
| 1 or 2 Children | 0 (0.0%) | 93 (56.4%) |
| 3 or 4 Children | 0 (0.0%) | 0 (0.0%) |
| 5 or more Children | 0 (0.0%) | 0 (0.0%) |
| Total | 0 (0.0%) | 93 (36.2%) |
Income Below Poverty Among Married-Couple vs Single-Parent Households in Penbrook borough
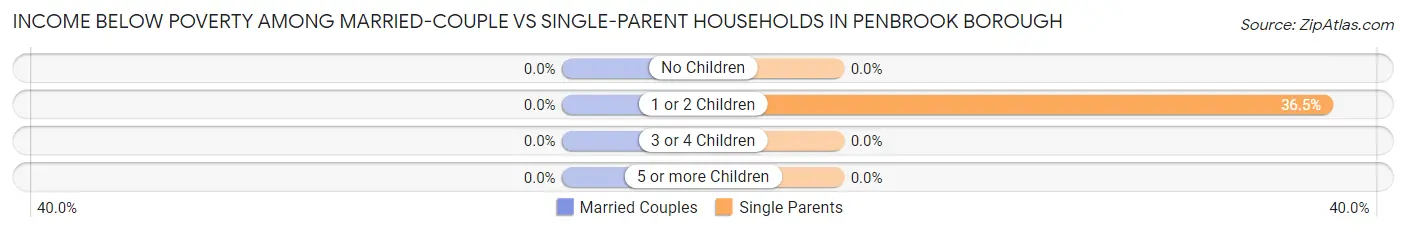
| Children | Married-Couple Families | Single-Parent Households |
| No Children | 0 (0.0%) | 0 (0.0%) |
| 1 or 2 Children | 0 (0.0%) | 93 (36.5%) |
| 3 or 4 Children | 0 (0.0%) | 0 (0.0%) |
| 5 or more Children | 0 (0.0%) | 0 (0.0%) |
| Total | 0 (0.0%) | 93 (24.5%) |
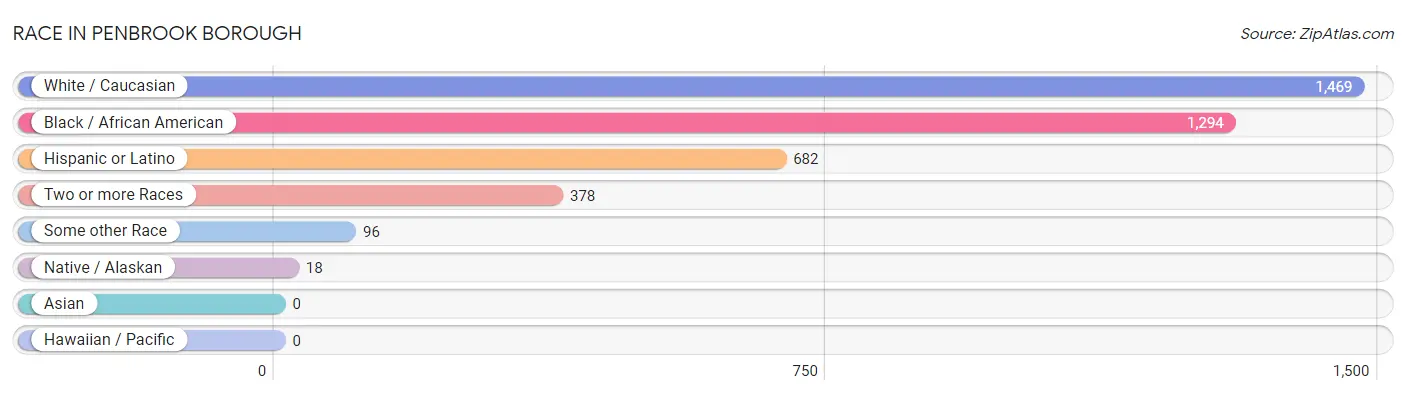
Race in Penbrook borough
The most populous races in Penbrook borough are White / Caucasian (1,469 | 45.1%), Black / African American (1,294 | 39.8%), and Hispanic or Latino (682 | 20.9%).
| Race | # Population | % Population |
| Asian | 0 | 0.0% |
| Black / African American | 1,294 | 39.8% |
| Hawaiian / Pacific | 0 | 0.0% |
| Hispanic or Latino | 682 | 20.9% |
| Native / Alaskan | 18 | 0.5% |
| White / Caucasian | 1,469 | 45.1% |
| Two or more Races | 378 | 11.6% |
| Some other Race | 96 | 2.9% |
| Total | 3,255 | 100.0% |
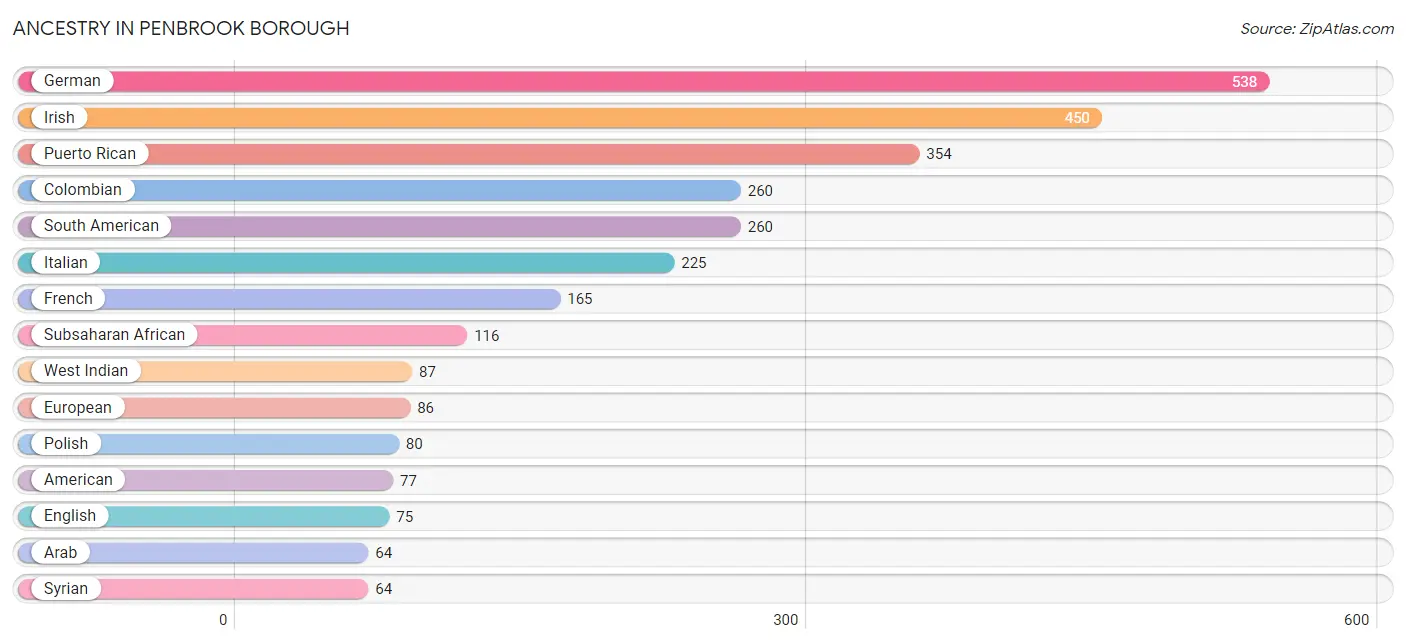
Ancestry in Penbrook borough
The most populous ancestries reported in Penbrook borough are German (538 | 16.5%), Irish (450 | 13.8%), Puerto Rican (354 | 10.9%), Colombian (260 | 8.0%), and South American (260 | 8.0%), together accounting for 57.2% of all Penbrook borough residents.
| Ancestry | # Population | % Population |
| African | 43 | 1.3% |
| American | 77 | 2.4% |
| Arab | 64 | 2.0% |
| Bhutanese | 16 | 0.5% |
| British | 35 | 1.1% |
| Celtic | 45 | 1.4% |
| Colombian | 260 | 8.0% |
| Croatian | 11 | 0.3% |
| Dominican | 30 | 0.9% |
| Dutch | 24 | 0.7% |
| English | 75 | 2.3% |
| European | 86 | 2.6% |
| French | 165 | 5.1% |
| German | 538 | 16.5% |
| Hungarian | 5 | 0.2% |
| Irish | 450 | 13.8% |
| Israeli | 63 | 1.9% |
| Italian | 225 | 6.9% |
| Korean | 16 | 0.5% |
| Mexican | 22 | 0.7% |
| Nigerian | 32 | 1.0% |
| Norwegian | 16 | 0.5% |
| Pennsylvania German | 13 | 0.4% |
| Polish | 80 | 2.5% |
| Puerto Rican | 354 | 10.9% |
| Scottish | 33 | 1.0% |
| Serbian | 23 | 0.7% |
| South American | 260 | 8.0% |
| Spanish | 16 | 0.5% |
| Subsaharan African | 116 | 3.6% |
| Swedish | 38 | 1.2% |
| Swiss | 16 | 0.5% |
| Syrian | 64 | 2.0% |
| West Indian | 87 | 2.7% | View All 34 Rows |
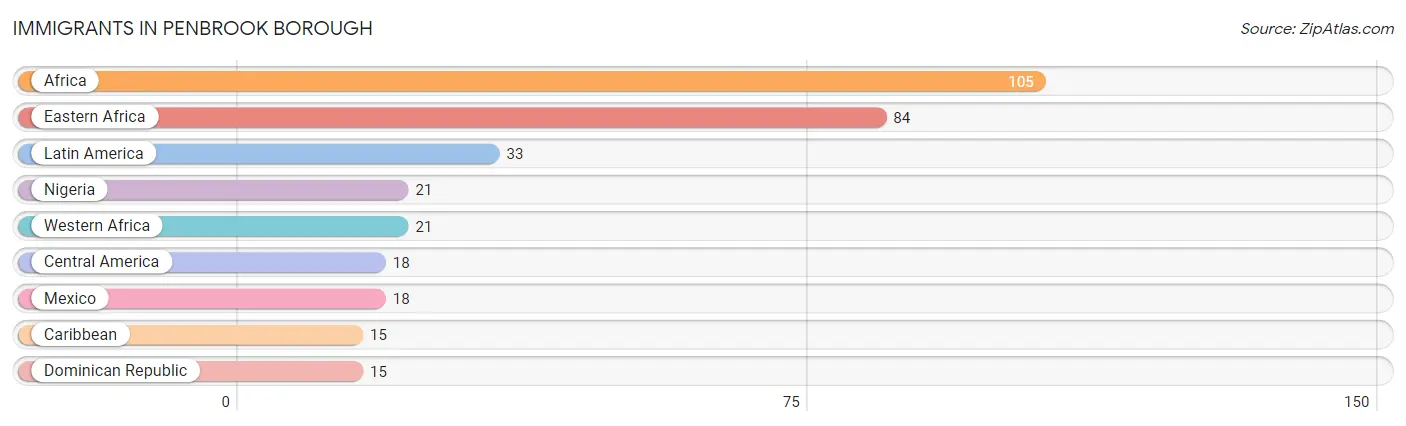
Immigrants in Penbrook borough
The most numerous immigrant groups reported in Penbrook borough came from Africa (105 | 3.2%), Eastern Africa (84 | 2.6%), Latin America (33 | 1.0%), Nigeria (21 | 0.6%), and Western Africa (21 | 0.6%), together accounting for 8.1% of all Penbrook borough residents.
| Immigration Origin | # Population | % Population |
| Africa | 105 | 3.2% |
| Caribbean | 15 | 0.5% |
| Central America | 18 | 0.5% |
| Dominican Republic | 15 | 0.5% |
| Eastern Africa | 84 | 2.6% |
| Latin America | 33 | 1.0% |
| Mexico | 18 | 0.5% |
| Nigeria | 21 | 0.6% |
| Western Africa | 21 | 0.6% | View All 9 Rows |
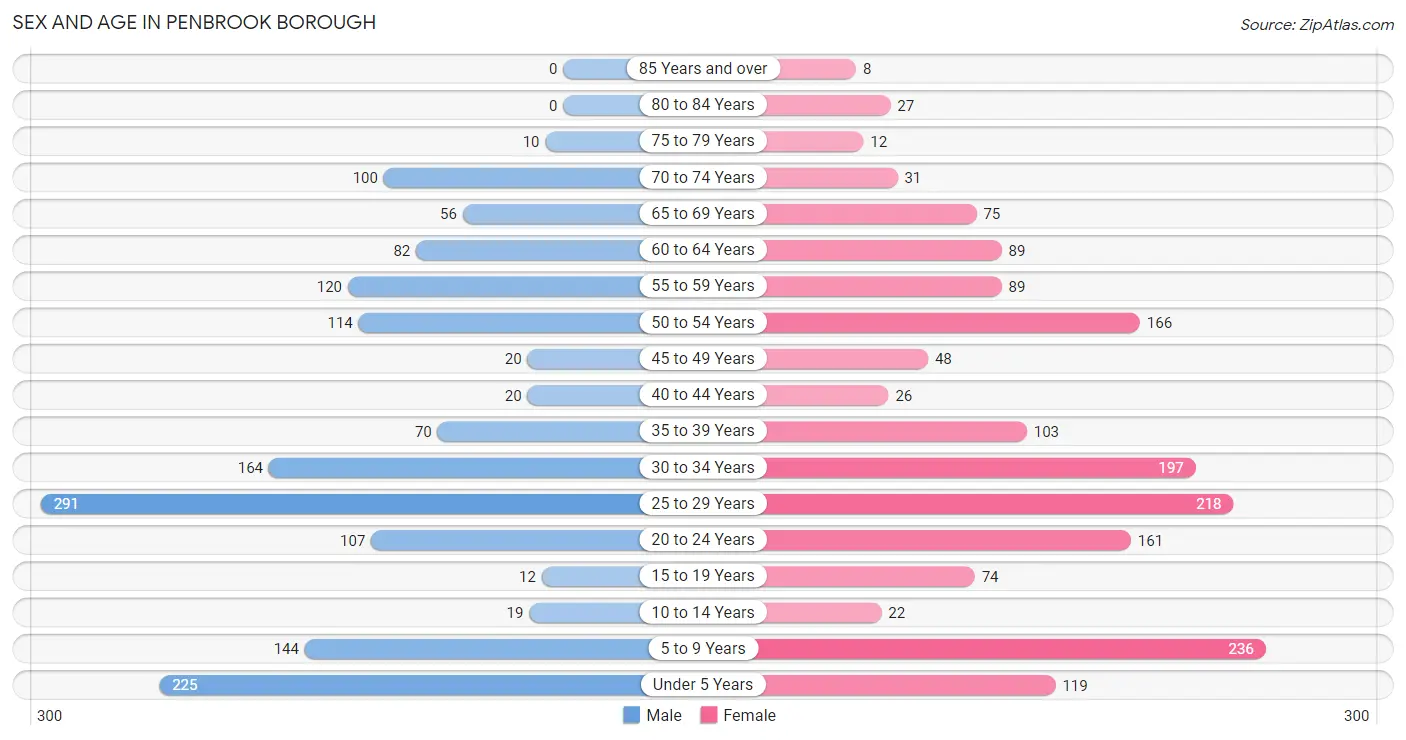
Sex and Age in Penbrook borough
Sex and Age in Penbrook borough
The most populous age groups in Penbrook borough are 25 to 29 Years (291 | 18.7%) for men and 5 to 9 Years (236 | 13.9%) for women.
| Age Bracket | Male | Female |
| Under 5 Years | 225 (14.5%) | 119 (7.0%) |
| 5 to 9 Years | 144 (9.3%) | 236 (13.9%) |
| 10 to 14 Years | 19 (1.2%) | 22 (1.3%) |
| 15 to 19 Years | 12 (0.8%) | 74 (4.3%) |
| 20 to 24 Years | 107 (6.9%) | 161 (9.5%) |
| 25 to 29 Years | 291 (18.7%) | 218 (12.8%) |
| 30 to 34 Years | 164 (10.5%) | 197 (11.6%) |
| 35 to 39 Years | 70 (4.5%) | 103 (6.1%) |
| 40 to 44 Years | 20 (1.3%) | 26 (1.5%) |
| 45 to 49 Years | 20 (1.3%) | 48 (2.8%) |
| 50 to 54 Years | 114 (7.3%) | 166 (9.8%) |
| 55 to 59 Years | 120 (7.7%) | 89 (5.2%) |
| 60 to 64 Years | 82 (5.3%) | 89 (5.2%) |
| 65 to 69 Years | 56 (3.6%) | 75 (4.4%) |
| 70 to 74 Years | 100 (6.4%) | 31 (1.8%) |
| 75 to 79 Years | 10 (0.6%) | 12 (0.7%) |
| 80 to 84 Years | 0 (0.0%) | 27 (1.6%) |
| 85 Years and over | 0 (0.0%) | 8 (0.5%) |
| Total | 1,554 (100.0%) | 1,701 (100.0%) |
Families and Households in Penbrook borough
Median Family Size in Penbrook borough
The median family size in Penbrook borough is 2.83 persons per family, with single female/mother families (257 | 29.8%) accounting for the largest median family size of 3.38 persons per family. On the other hand, single male/father families (123 | 14.3%) represent the smallest median family size with 2.39 persons per family.
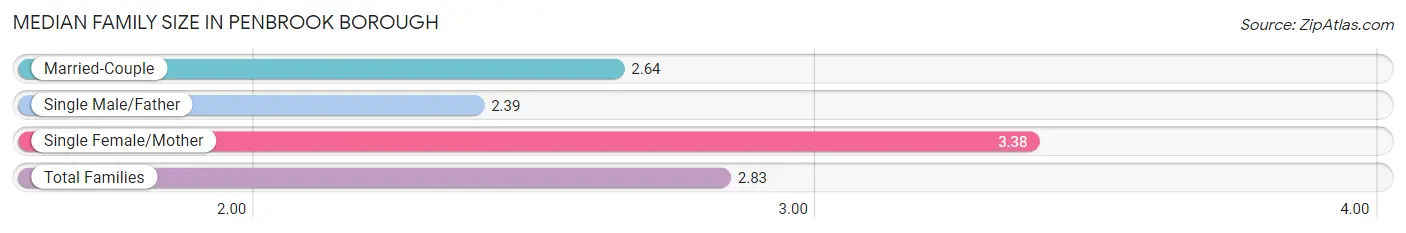
| Family Type | # Families | Family Size |
| Married-Couple | 481 (55.9%) | 2.64 |
| Single Male/Father | 123 (14.3%) | 2.39 |
| Single Female/Mother | 257 (29.8%) | 3.38 |
| Total Families | 861 (100.0%) | 2.83 |
Median Household Size in Penbrook borough
The median household size in Penbrook borough is 2.32 persons per household, with single female/mother households (257 | 18.3%) accounting for the largest median household size of 3.56 persons per household. non-family households (540 | 38.5%) represent the smallest median household size with 1.29 persons per household.
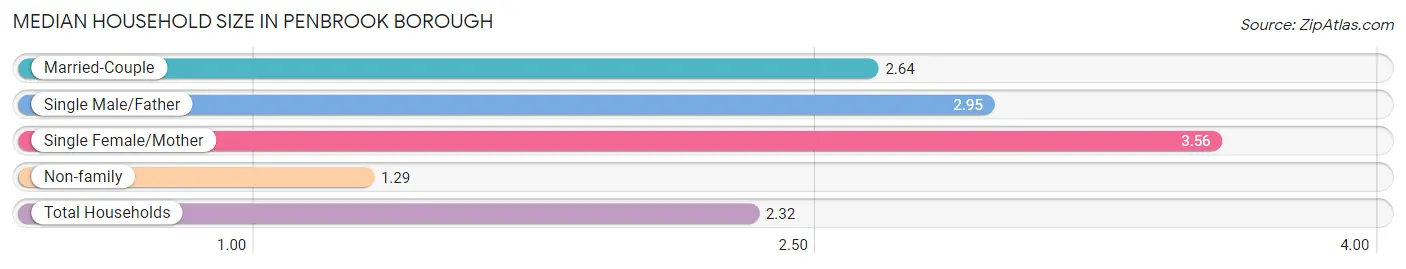
| Household Type | # Households | Household Size |
| Married-Couple | 481 (34.3%) | 2.64 |
| Single Male/Father | 123 (8.8%) | 2.95 |
| Single Female/Mother | 257 (18.3%) | 3.56 |
| Non-family | 540 (38.5%) | 1.29 |
| Total Households | 1,401 (100.0%) | 2.32 |
Household Size by Marriage Status in Penbrook borough
Out of a total of 1,401 households in Penbrook borough, 861 (61.5%) are family households, while 540 (38.5%) are nonfamily households. The most numerous type of family households are 3-person households, comprising 353, and the most common type of nonfamily households are 1-person households, comprising 448.
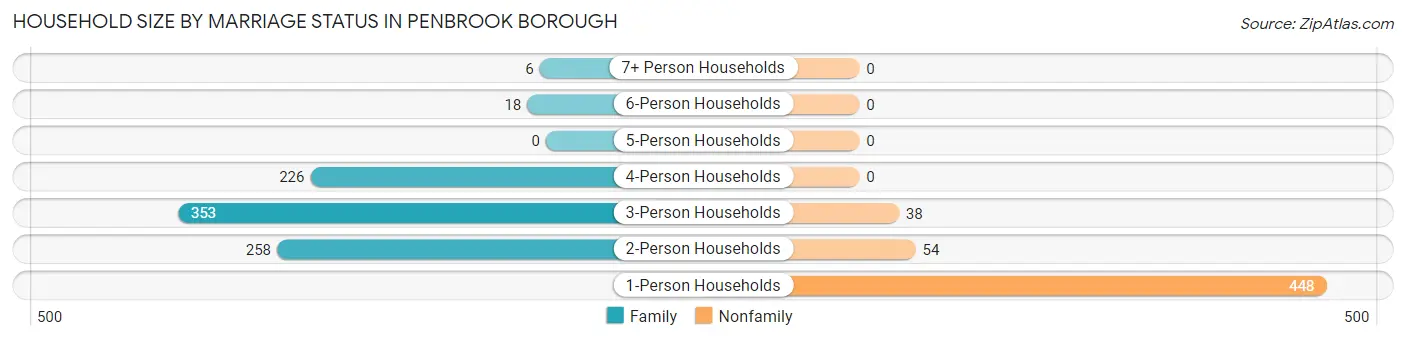
| Household Size | Family Households | Nonfamily Households |
| 1-Person Households | - | 448 (32.0%) |
| 2-Person Households | 258 (18.4%) | 54 (3.8%) |
| 3-Person Households | 353 (25.2%) | 38 (2.7%) |
| 4-Person Households | 226 (16.1%) | 0 (0.0%) |
| 5-Person Households | 0 (0.0%) | 0 (0.0%) |
| 6-Person Households | 18 (1.3%) | 0 (0.0%) |
| 7+ Person Households | 6 (0.4%) | 0 (0.0%) |
| Total | 861 (61.5%) | 540 (38.5%) |
Female Fertility in Penbrook borough
Fertility by Age in Penbrook borough
Average fertility rate in Penbrook borough is 128.0 births per 1,000 women. Women in the age bracket of 20 to 34 years have the highest fertility rate with 188.0 births per 1,000 women. Women in the age bracket of 20 to 34 years acount for 100.0% of all women with births.
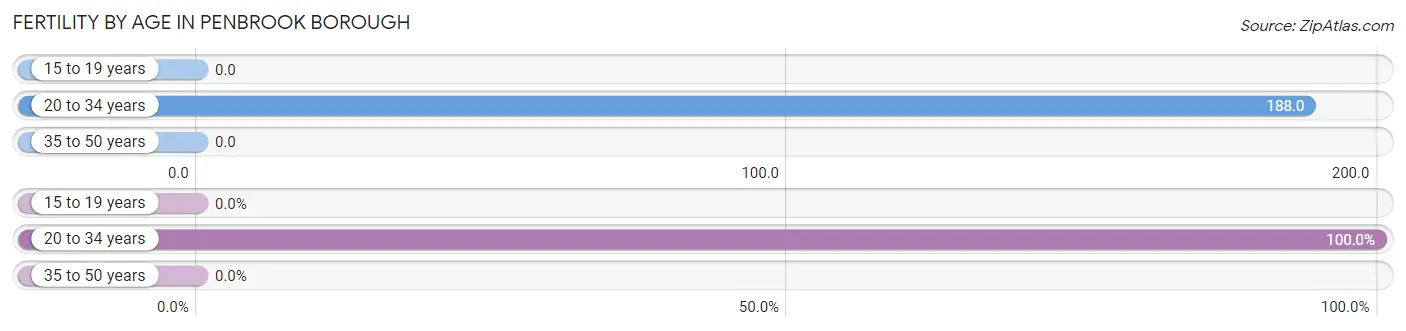
| Age Bracket | Women with Births | Births / 1,000 Women |
| 15 to 19 years | 0 (0.0%) | 0.0 |
| 20 to 34 years | 108 (100.0%) | 188.0 |
| 35 to 50 years | 0 (0.0%) | 0.0 |
| Total | 108 (100.0%) | 128.0 |
Fertility by Age by Marriage Status in Penbrook borough
83.3% of women with births (108) in Penbrook borough are married. The highest percentage of unmarried women with births falls into 20 to 34 years age bracket with 16.7% of them unmarried at the time of birth, while the lowest percentage of unmarried women with births belong to 20 to 34 years age bracket with 16.7% of them unmarried.
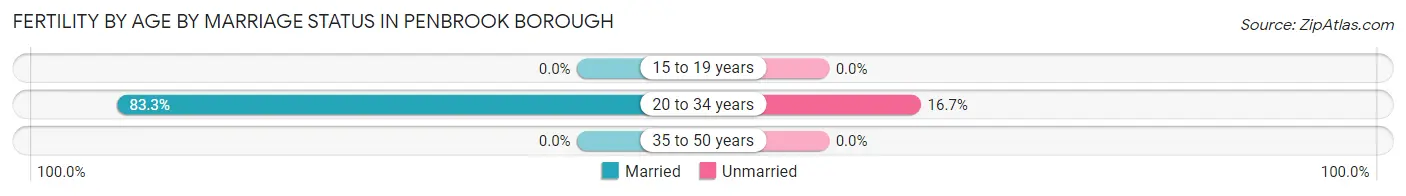
| Age Bracket | Married | Unmarried |
| 15 to 19 years | 0 (0.0%) | 0 (0.0%) |
| 20 to 34 years | 90 (83.3%) | 18 (16.7%) |
| 35 to 50 years | 0 (0.0%) | 0 (0.0%) |
| Total | 90 (83.3%) | 18 (16.7%) |
Fertility by Education in Penbrook borough
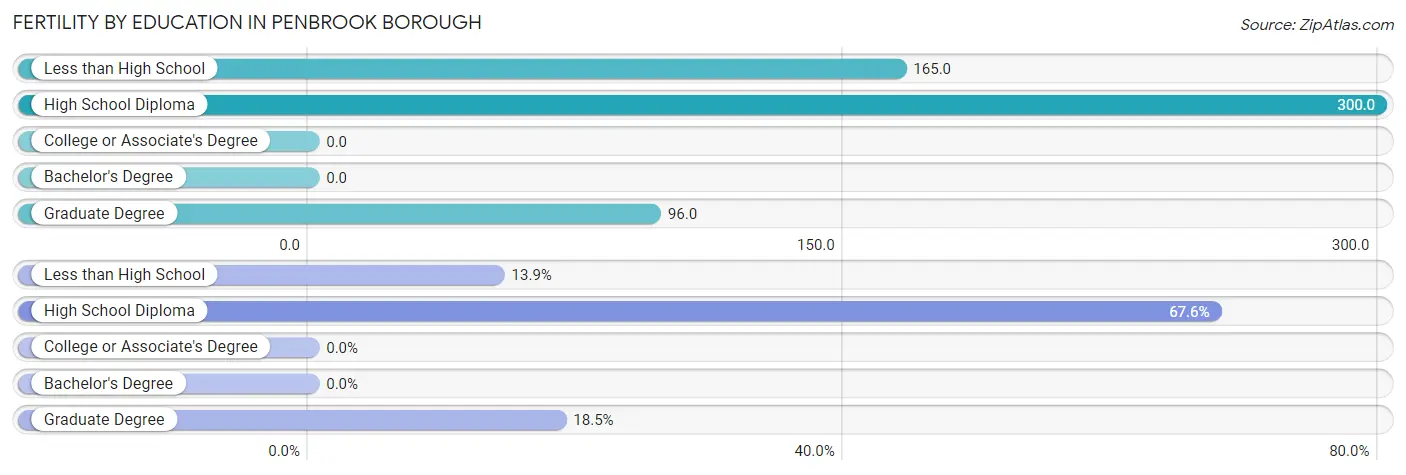
| Educational Attainment | Women with Births | Births / 1,000 Women |
| Less than High School | 15 (13.9%) | 165.0 |
| High School Diploma | 73 (67.6%) | 300.0 |
| College or Associate's Degree | 0 (0.0%) | 0.0 |
| Bachelor's Degree | 0 (0.0%) | 0.0 |
| Graduate Degree | 20 (18.5%) | 96.0 |
| Total | 108 (100.0%) | 128.0 |
Fertility by Education by Marriage Status in Penbrook borough
16.7% of women with births in Penbrook borough are unmarried. Women with the educational attainment of less than high school are most likely to be married with 100.0% of them married at childbirth, while women with the educational attainment of high school diploma are least likely to be married with 24.7% of them unmarried at childbirth.
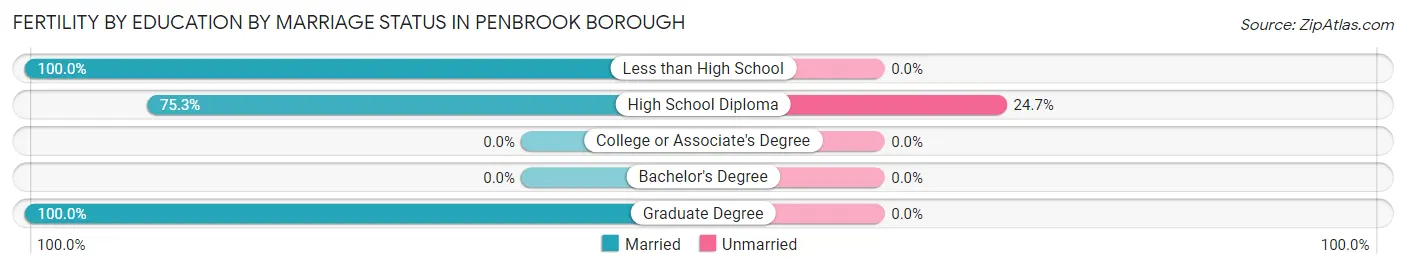
| Educational Attainment | Married | Unmarried |
| Less than High School | 15 (100.0%) | 0 (0.0%) |
| High School Diploma | 55 (75.3%) | 18 (24.7%) |
| College or Associate's Degree | 0 (0.0%) | 0 (0.0%) |
| Bachelor's Degree | 0 (0.0%) | 0 (0.0%) |
| Graduate Degree | 20 (100.0%) | 0 (0.0%) |
| Total | 90 (83.3%) | 18 (16.7%) |
Employment Characteristics in Penbrook borough
Employment by Class of Employer in Penbrook borough
Among the 1,635 employed individuals in Penbrook borough, private company employees (915 | 56.0%), not-for-profit organizations (288 | 17.6%), and local government employees (231 | 14.1%) make up the most common classes of employment.
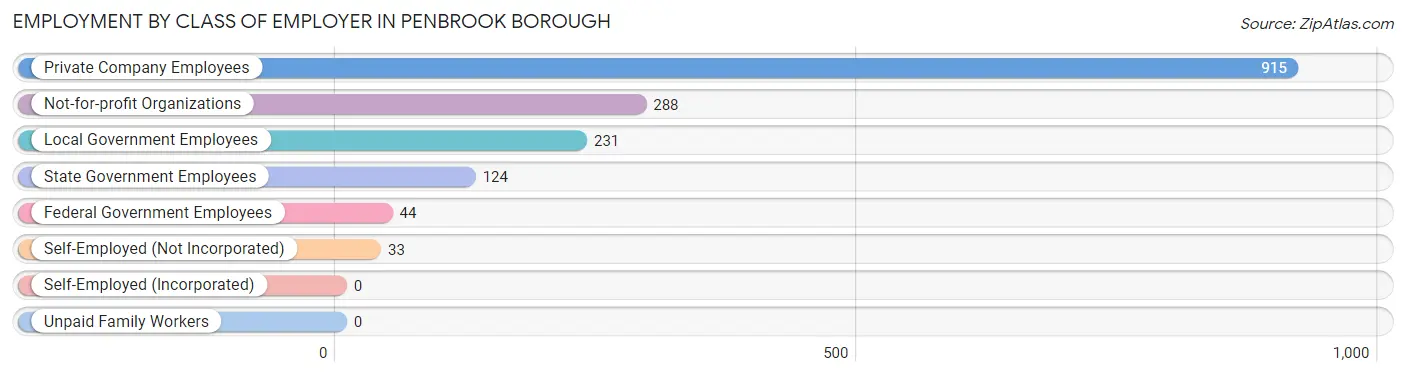
| Employer Class | # Employees | % Employees |
| Private Company Employees | 915 | 56.0% |
| Self-Employed (Incorporated) | 0 | 0.0% |
| Self-Employed (Not Incorporated) | 33 | 2.0% |
| Not-for-profit Organizations | 288 | 17.6% |
| Local Government Employees | 231 | 14.1% |
| State Government Employees | 124 | 7.6% |
| Federal Government Employees | 44 | 2.7% |
| Unpaid Family Workers | 0 | 0.0% |
| Total | 1,635 | 100.0% |
Employment Status by Age in Penbrook borough
According to the labor force statistics for Penbrook borough, out of the total population over 16 years of age (2,490), 72.5% or 1,805 individuals are in the labor force, with 8.1% or 146 of them unemployed. The age group with the highest labor force participation rate is 20 to 24 years, with 100.0% or 268 individuals in the labor force. Within the labor force, the 65 to 74 years age range has the highest percentage of unemployed individuals, with 23.1% or 12 of them being unemployed.
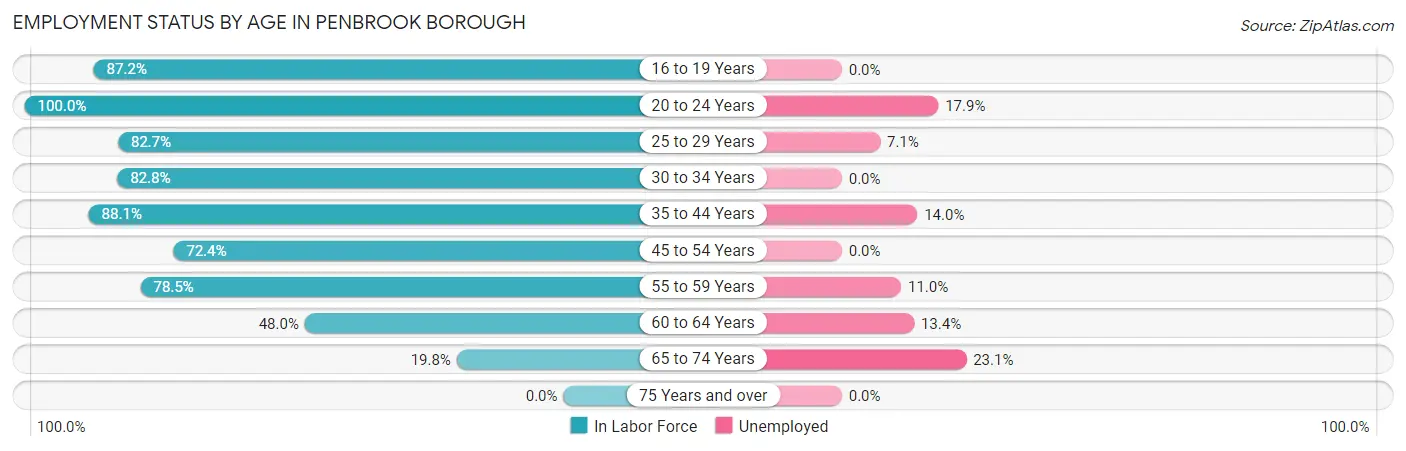
| Age Bracket | In Labor Force | Unemployed |
| 16 to 19 Years | 75 (87.2%) | 0 (0.0%) |
| 20 to 24 Years | 268 (100.0%) | 48 (17.9%) |
| 25 to 29 Years | 421 (82.7%) | 30 (7.1%) |
| 30 to 34 Years | 299 (82.8%) | 0 (0.0%) |
| 35 to 44 Years | 193 (88.1%) | 27 (14.0%) |
| 45 to 54 Years | 252 (72.4%) | 0 (0.0%) |
| 55 to 59 Years | 164 (78.5%) | 18 (11.0%) |
| 60 to 64 Years | 82 (48.0%) | 11 (13.4%) |
| 65 to 74 Years | 52 (19.8%) | 12 (23.1%) |
| 75 Years and over | 0 (0.0%) | 0 (0.0%) |
| Total | 1,805 (72.5%) | 146 (8.1%) |
Employment Status by Educational Attainment in Penbrook borough
According to labor force statistics for Penbrook borough, 77.7% of individuals (1,412) out of the total population between 25 and 64 years of age (1,817) are in the labor force, with 6.1% or 86 of them being unemployed. The group with the highest labor force participation rate are those with the educational attainment of bachelor's degree or higher, with 83.9% or 698 individuals in the labor force. Within the labor force, individuals with less than high school education have the highest percentage of unemployment, with 17.6% or 18 of them being unemployed.
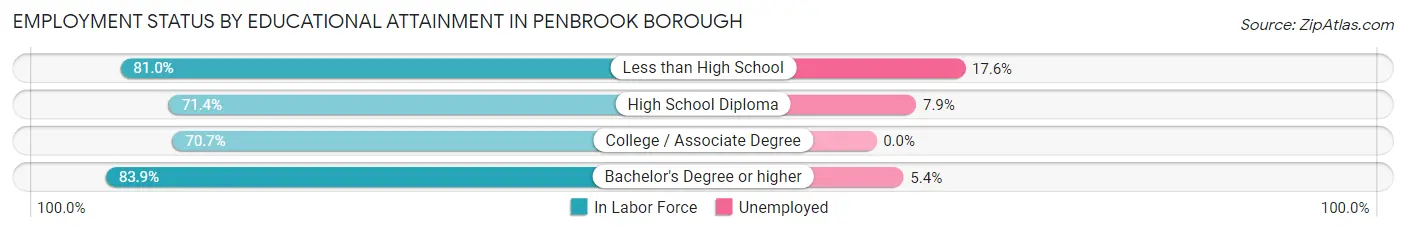
| Educational Attainment | In Labor Force | Unemployed |
| Less than High School | 102 (81.0%) | 22 (17.6%) |
| High School Diploma | 382 (71.4%) | 42 (7.9%) |
| College / Associate Degree | 229 (70.7%) | 0 (0.0%) |
| Bachelor's Degree or higher | 698 (83.9%) | 45 (5.4%) |
| Total | 1,412 (77.7%) | 111 (6.1%) |
Employment Occupations by Sex in Penbrook borough
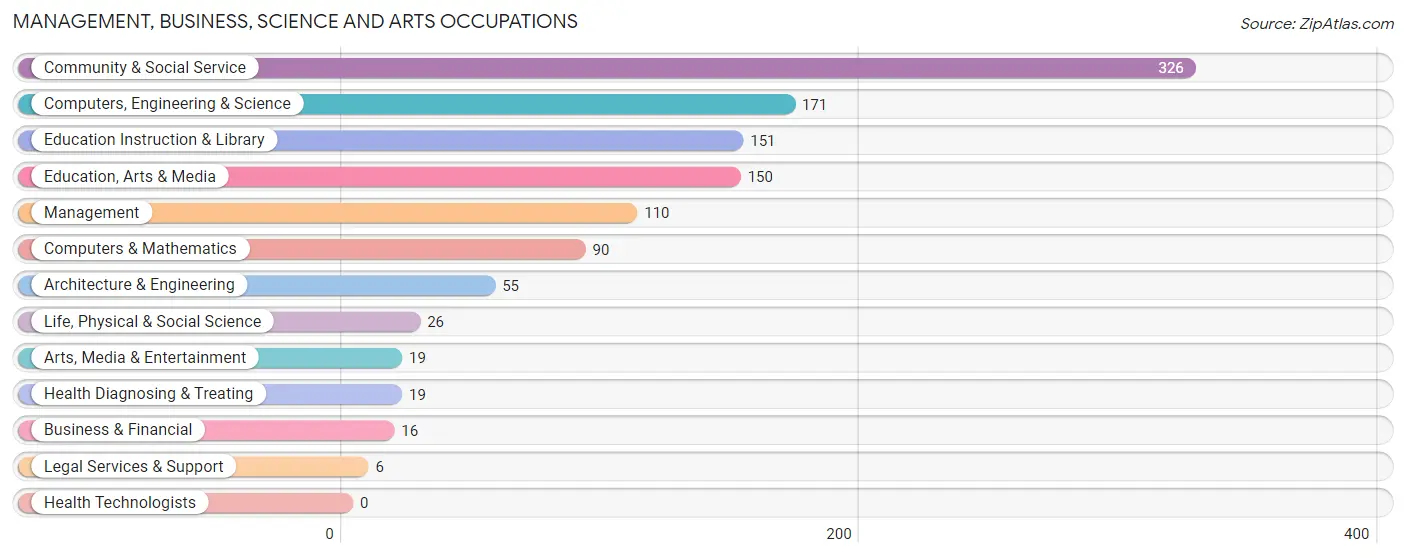
Management, Business, Science and Arts Occupations
The most common Management, Business, Science and Arts occupations in Penbrook borough are Community & Social Service (326 | 19.6%), Computers, Engineering & Science (171 | 10.3%), Education Instruction & Library (151 | 9.1%), Education, Arts & Media (150 | 9.0%), and Management (110 | 6.6%).
Management, Business, Science and Arts Occupations by Sex
Within the Management, Business, Science and Arts occupations in Penbrook borough, the most male-oriented occupations are Computers, Engineering & Science (100.0%), Computers & Mathematics (100.0%), and Architecture & Engineering (100.0%), while the most female-oriented occupations are Management (100.0%), Business & Financial (100.0%), and Legal Services & Support (100.0%).
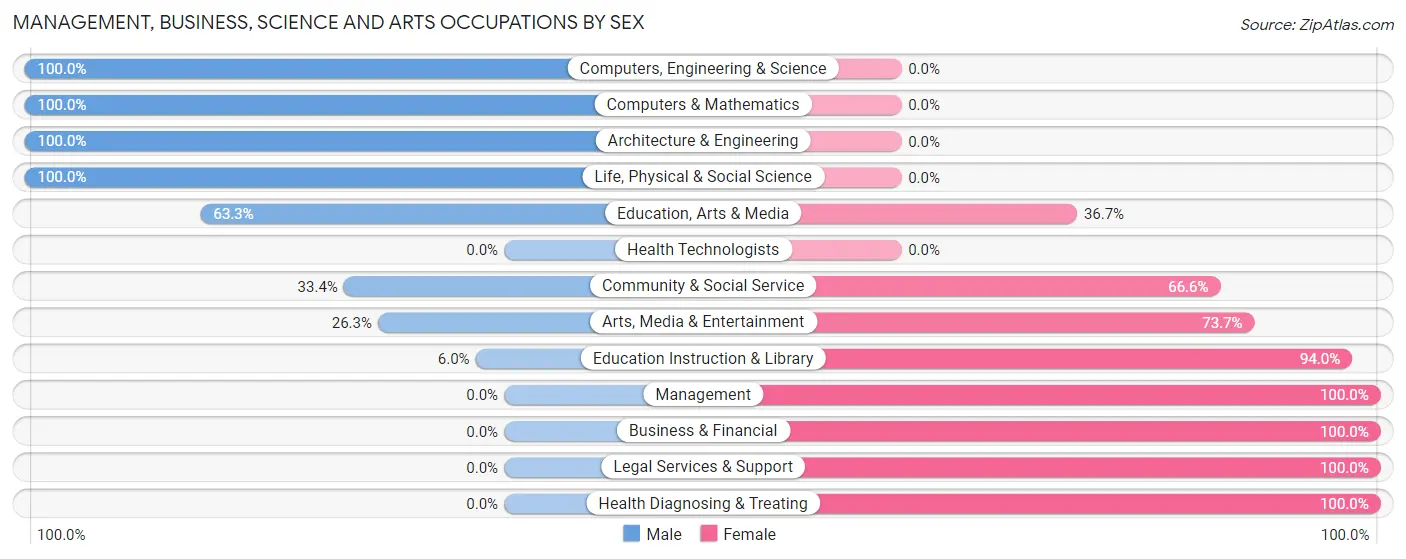
| Occupation | Male | Female |
| Management | 0 (0.0%) | 110 (100.0%) |
| Business & Financial | 0 (0.0%) | 16 (100.0%) |
| Computers, Engineering & Science | 171 (100.0%) | 0 (0.0%) |
| Computers & Mathematics | 90 (100.0%) | 0 (0.0%) |
| Architecture & Engineering | 55 (100.0%) | 0 (0.0%) |
| Life, Physical & Social Science | 26 (100.0%) | 0 (0.0%) |
| Community & Social Service | 109 (33.4%) | 217 (66.6%) |
| Education, Arts & Media | 95 (63.3%) | 55 (36.7%) |
| Legal Services & Support | 0 (0.0%) | 6 (100.0%) |
| Education Instruction & Library | 9 (6.0%) | 142 (94.0%) |
| Arts, Media & Entertainment | 5 (26.3%) | 14 (73.7%) |
| Health Diagnosing & Treating | 0 (0.0%) | 19 (100.0%) |
| Health Technologists | 0 (0.0%) | 0 (0.0%) |
| Total (Category) | 280 (43.6%) | 362 (56.4%) |
| Total (Overall) | 813 (49.0%) | 847 (51.0%) |
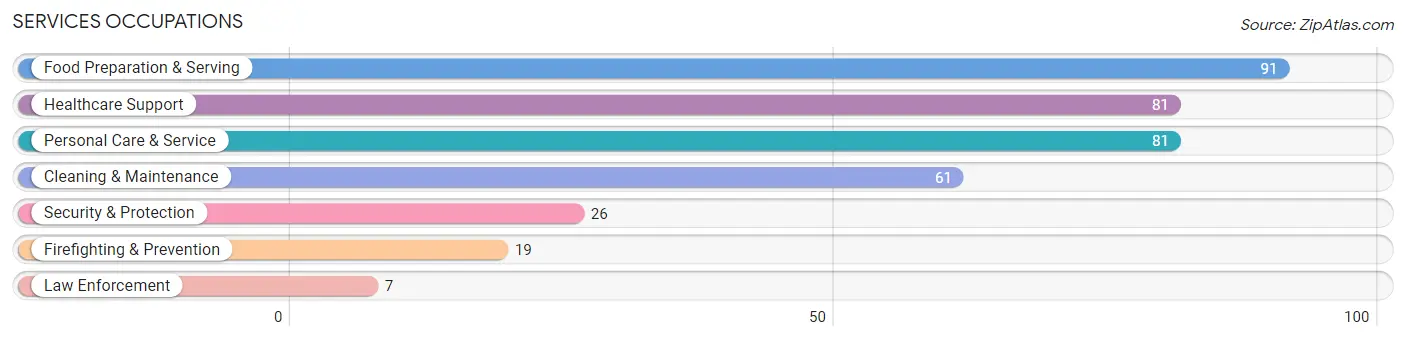
Services Occupations
The most common Services occupations in Penbrook borough are Food Preparation & Serving (91 | 5.5%), Healthcare Support (81 | 4.9%), Personal Care & Service (81 | 4.9%), Cleaning & Maintenance (61 | 3.7%), and Security & Protection (26 | 1.6%).
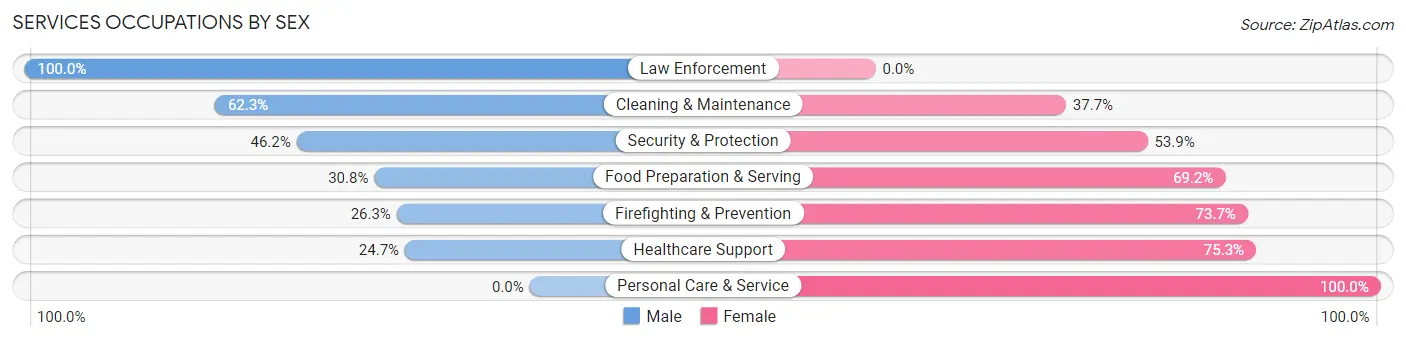
Services Occupations by Sex
Within the Services occupations in Penbrook borough, the most male-oriented occupations are Law Enforcement (100.0%), Cleaning & Maintenance (62.3%), and Security & Protection (46.2%), while the most female-oriented occupations are Personal Care & Service (100.0%), Healthcare Support (75.3%), and Firefighting & Prevention (73.7%).
| Occupation | Male | Female |
| Healthcare Support | 20 (24.7%) | 61 (75.3%) |
| Security & Protection | 12 (46.2%) | 14 (53.8%) |
| Firefighting & Prevention | 5 (26.3%) | 14 (73.7%) |
| Law Enforcement | 7 (100.0%) | 0 (0.0%) |
| Food Preparation & Serving | 28 (30.8%) | 63 (69.2%) |
| Cleaning & Maintenance | 38 (62.3%) | 23 (37.7%) |
| Personal Care & Service | 0 (0.0%) | 81 (100.0%) |
| Total (Category) | 98 (28.8%) | 242 (71.2%) |
| Total (Overall) | 813 (49.0%) | 847 (51.0%) |
Sales and Office Occupations
The most common Sales and Office occupations in Penbrook borough are Office & Administration (181 | 10.9%), and Sales & Related (113 | 6.8%).

Sales and Office Occupations by Sex

| Occupation | Male | Female |
| Sales & Related | 25 (22.1%) | 88 (77.9%) |
| Office & Administration | 26 (14.4%) | 155 (85.6%) |
| Total (Category) | 51 (17.3%) | 243 (82.7%) |
| Total (Overall) | 813 (49.0%) | 847 (51.0%) |
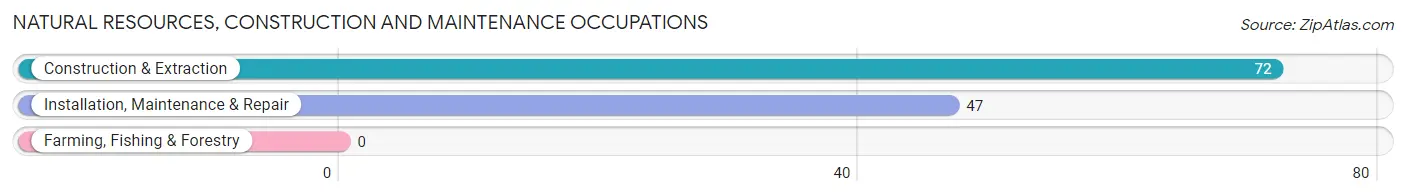
Natural Resources, Construction and Maintenance Occupations
The most common Natural Resources, Construction and Maintenance occupations in Penbrook borough are Construction & Extraction (72 | 4.3%), and Installation, Maintenance & Repair (47 | 2.8%).
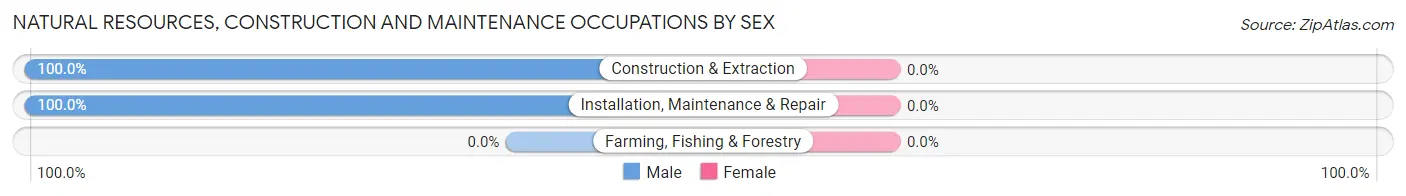
Natural Resources, Construction and Maintenance Occupations by Sex
| Occupation | Male | Female |
| Farming, Fishing & Forestry | 0 (0.0%) | 0 (0.0%) |
| Construction & Extraction | 72 (100.0%) | 0 (0.0%) |
| Installation, Maintenance & Repair | 47 (100.0%) | 0 (0.0%) |
| Total (Category) | 119 (100.0%) | 0 (0.0%) |
| Total (Overall) | 813 (49.0%) | 847 (51.0%) |
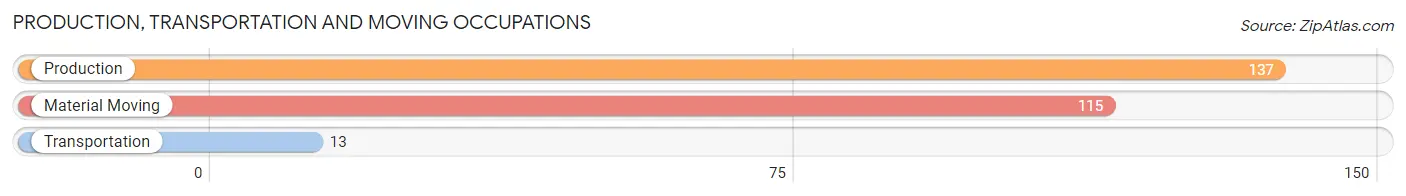
Production, Transportation and Moving Occupations
The most common Production, Transportation and Moving occupations in Penbrook borough are Production (137 | 8.3%), Material Moving (115 | 6.9%), and Transportation (13 | 0.8%).
Production, Transportation and Moving Occupations by Sex
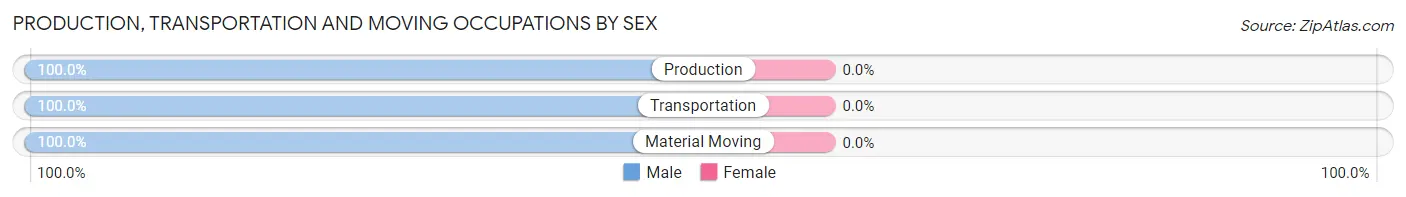
| Occupation | Male | Female |
| Production | 137 (100.0%) | 0 (0.0%) |
| Transportation | 13 (100.0%) | 0 (0.0%) |
| Material Moving | 115 (100.0%) | 0 (0.0%) |
| Total (Category) | 265 (100.0%) | 0 (0.0%) |
| Total (Overall) | 813 (49.0%) | 847 (51.0%) |
Employment Industries by Sex in Penbrook borough
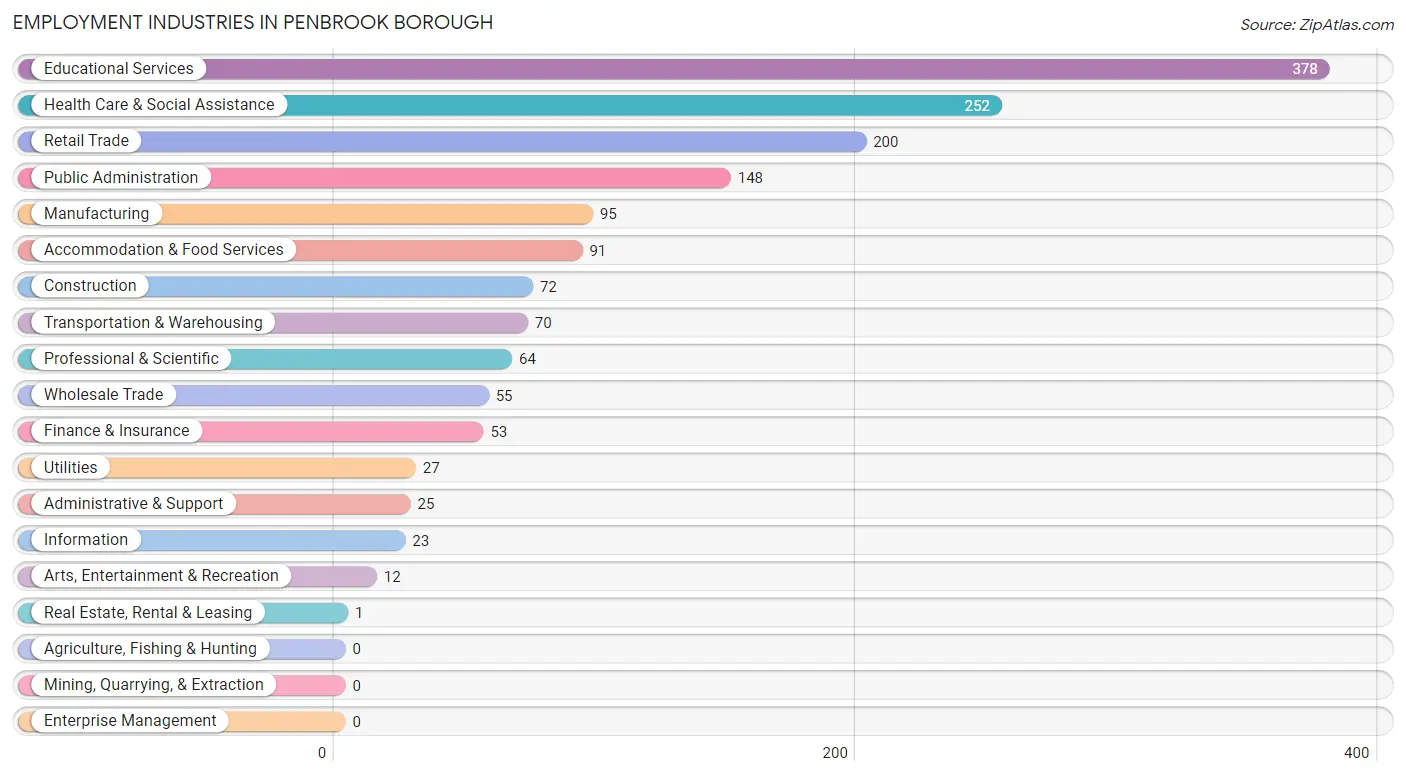
Employment Industries in Penbrook borough
The major employment industries in Penbrook borough include Educational Services (378 | 22.8%), Health Care & Social Assistance (252 | 15.2%), Retail Trade (200 | 12.0%), Public Administration (148 | 8.9%), and Manufacturing (95 | 5.7%).
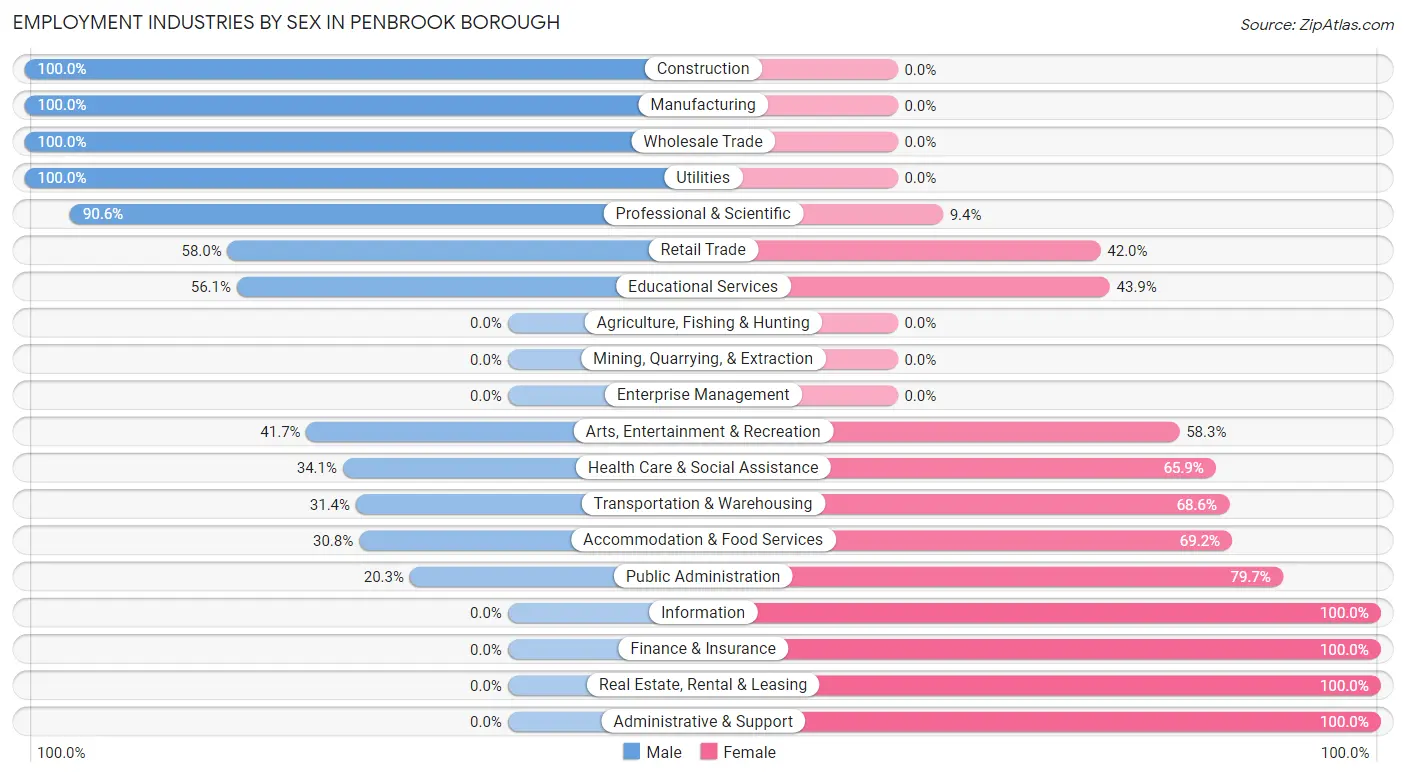
Employment Industries by Sex in Penbrook borough
The Penbrook borough industries that see more men than women are Construction (100.0%), Manufacturing (100.0%), and Wholesale Trade (100.0%), whereas the industries that tend to have a higher number of women are Information (100.0%), Finance & Insurance (100.0%), and Real Estate, Rental & Leasing (100.0%).
| Industry | Male | Female |
| Agriculture, Fishing & Hunting | 0 (0.0%) | 0 (0.0%) |
| Mining, Quarrying, & Extraction | 0 (0.0%) | 0 (0.0%) |
| Construction | 72 (100.0%) | 0 (0.0%) |
| Manufacturing | 95 (100.0%) | 0 (0.0%) |
| Wholesale Trade | 55 (100.0%) | 0 (0.0%) |
| Retail Trade | 116 (58.0%) | 84 (42.0%) |
| Transportation & Warehousing | 22 (31.4%) | 48 (68.6%) |
| Utilities | 27 (100.0%) | 0 (0.0%) |
| Information | 0 (0.0%) | 23 (100.0%) |
| Finance & Insurance | 0 (0.0%) | 53 (100.0%) |
| Real Estate, Rental & Leasing | 0 (0.0%) | 1 (100.0%) |
| Professional & Scientific | 58 (90.6%) | 6 (9.4%) |
| Enterprise Management | 0 (0.0%) | 0 (0.0%) |
| Administrative & Support | 0 (0.0%) | 25 (100.0%) |
| Educational Services | 212 (56.1%) | 166 (43.9%) |
| Health Care & Social Assistance | 86 (34.1%) | 166 (65.9%) |
| Arts, Entertainment & Recreation | 5 (41.7%) | 7 (58.3%) |
| Accommodation & Food Services | 28 (30.8%) | 63 (69.2%) |
| Public Administration | 30 (20.3%) | 118 (79.7%) |
| Total | 813 (49.0%) | 847 (51.0%) |
Education in Penbrook borough
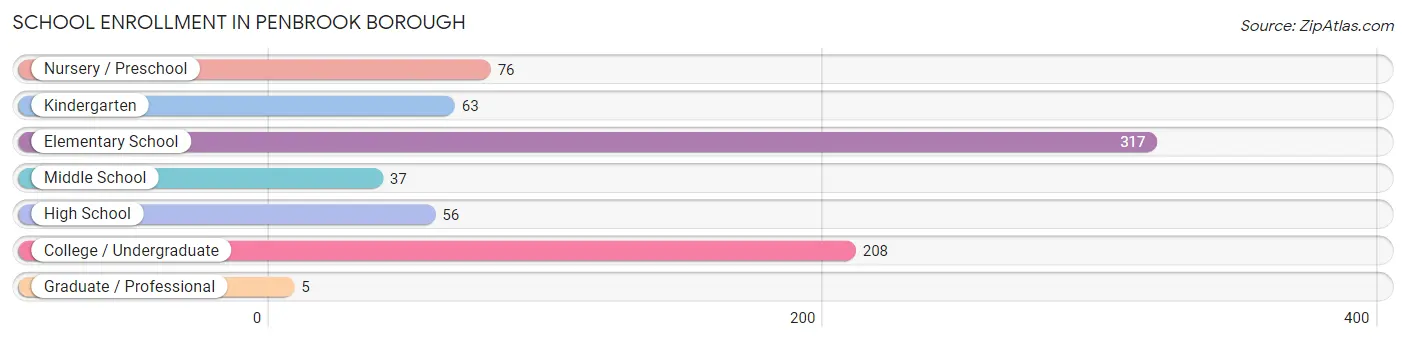
School Enrollment in Penbrook borough
The most common levels of schooling among the 762 students in Penbrook borough are elementary school (317 | 41.6%), college / undergraduate (208 | 27.3%), and nursery / preschool (76 | 10.0%).
| School Level | # Students | % Students |
| Nursery / Preschool | 76 | 10.0% |
| Kindergarten | 63 | 8.3% |
| Elementary School | 317 | 41.6% |
| Middle School | 37 | 4.9% |
| High School | 56 | 7.3% |
| College / Undergraduate | 208 | 27.3% |
| Graduate / Professional | 5 | 0.7% |
| Total | 762 | 100.0% |
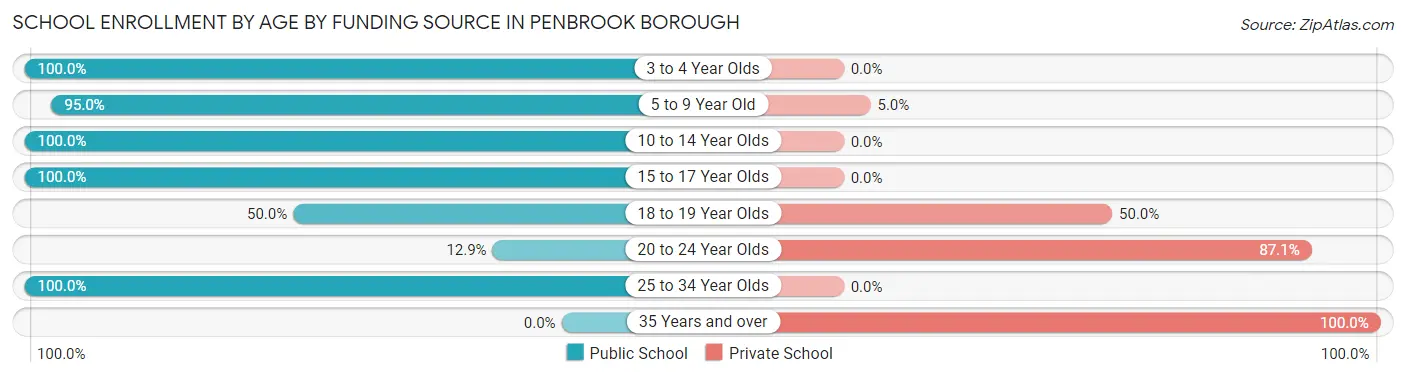
School Enrollment by Age by Funding Source in Penbrook borough
Out of a total of 762 students who are enrolled in schools in Penbrook borough, 106 (13.9%) attend a private institution, while the remaining 656 (86.1%) are enrolled in public schools. The age group of 35 years and over has the highest likelihood of being enrolled in private schools, with 10 (100.0% in the age bracket) enrolled. Conversely, the age group of 3 to 4 year olds has the lowest likelihood of being enrolled in a private school, with 76 (100.0% in the age bracket) attending a public institution.
| Age Bracket | Public School | Private School |
| 3 to 4 Year Olds | 76 (100.0%) | 0 (0.0%) |
| 5 to 9 Year Old | 361 (95.0%) | 19 (5.0%) |
| 10 to 14 Year Olds | 41 (100.0%) | 0 (0.0%) |
| 15 to 17 Year Olds | 47 (100.0%) | 0 (0.0%) |
| 18 to 19 Year Olds | 16 (50.0%) | 16 (50.0%) |
| 20 to 24 Year Olds | 9 (12.9%) | 61 (87.1%) |
| 25 to 34 Year Olds | 106 (100.0%) | 0 (0.0%) |
| 35 Years and over | 0 (0.0%) | 10 (100.0%) |
| Total | 656 (86.1%) | 106 (13.9%) |
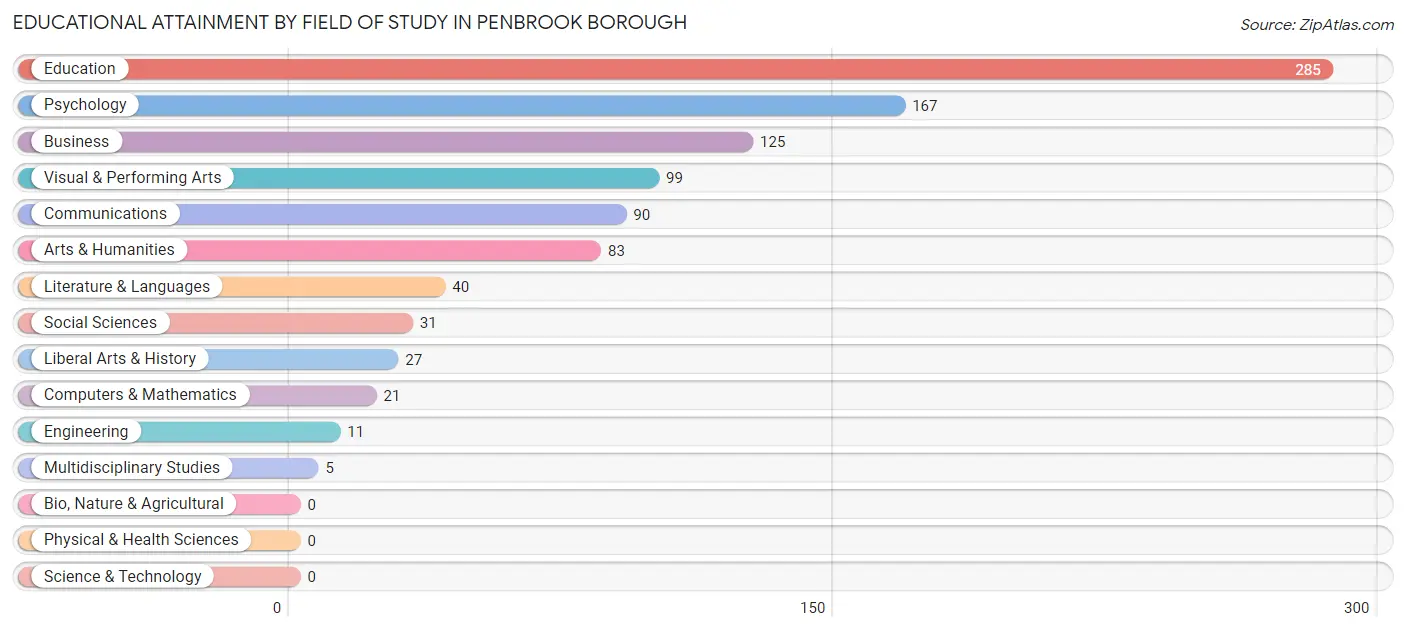
Educational Attainment by Field of Study in Penbrook borough
Education (285 | 29.0%), psychology (167 | 17.0%), business (125 | 12.7%), visual & performing arts (99 | 10.1%), and communications (90 | 9.1%) are the most common fields of study among 984 individuals in Penbrook borough who have obtained a bachelor's degree or higher.
| Field of Study | # Graduates | % Graduates |
| Computers & Mathematics | 21 | 2.1% |
| Bio, Nature & Agricultural | 0 | 0.0% |
| Physical & Health Sciences | 0 | 0.0% |
| Psychology | 167 | 17.0% |
| Social Sciences | 31 | 3.2% |
| Engineering | 11 | 1.1% |
| Multidisciplinary Studies | 5 | 0.5% |
| Science & Technology | 0 | 0.0% |
| Business | 125 | 12.7% |
| Education | 285 | 29.0% |
| Literature & Languages | 40 | 4.1% |
| Liberal Arts & History | 27 | 2.7% |
| Visual & Performing Arts | 99 | 10.1% |
| Communications | 90 | 9.1% |
| Arts & Humanities | 83 | 8.4% |
| Total | 984 | 100.0% |
Transportation & Commute in Penbrook borough
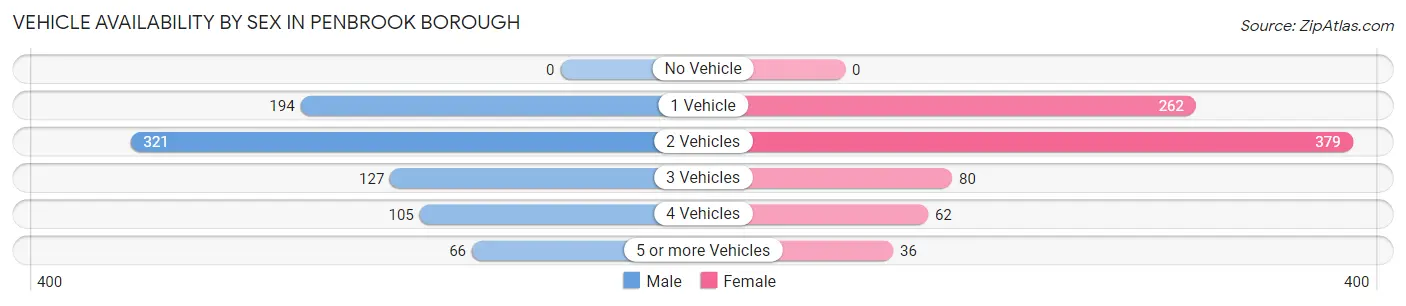
Vehicle Availability by Sex in Penbrook borough
The most prevalent vehicle ownership categories in Penbrook borough are males with 2 vehicles (321, accounting for 39.5%) and females with 2 vehicles (379, making up 39.2%).
| Vehicles Available | Male | Female |
| No Vehicle | 0 (0.0%) | 0 (0.0%) |
| 1 Vehicle | 194 (23.9%) | 262 (32.0%) |
| 2 Vehicles | 321 (39.5%) | 379 (46.3%) |
| 3 Vehicles | 127 (15.6%) | 80 (9.8%) |
| 4 Vehicles | 105 (12.9%) | 62 (7.6%) |
| 5 or more Vehicles | 66 (8.1%) | 36 (4.4%) |
| Total | 813 (100.0%) | 819 (100.0%) |
Commute Time in Penbrook borough
The most frequently occuring commute durations in Penbrook borough are 10 to 14 minutes (433 commuters, 27.5%), 20 to 24 minutes (364 commuters, 23.1%), and 15 to 19 minutes (265 commuters, 16.8%).
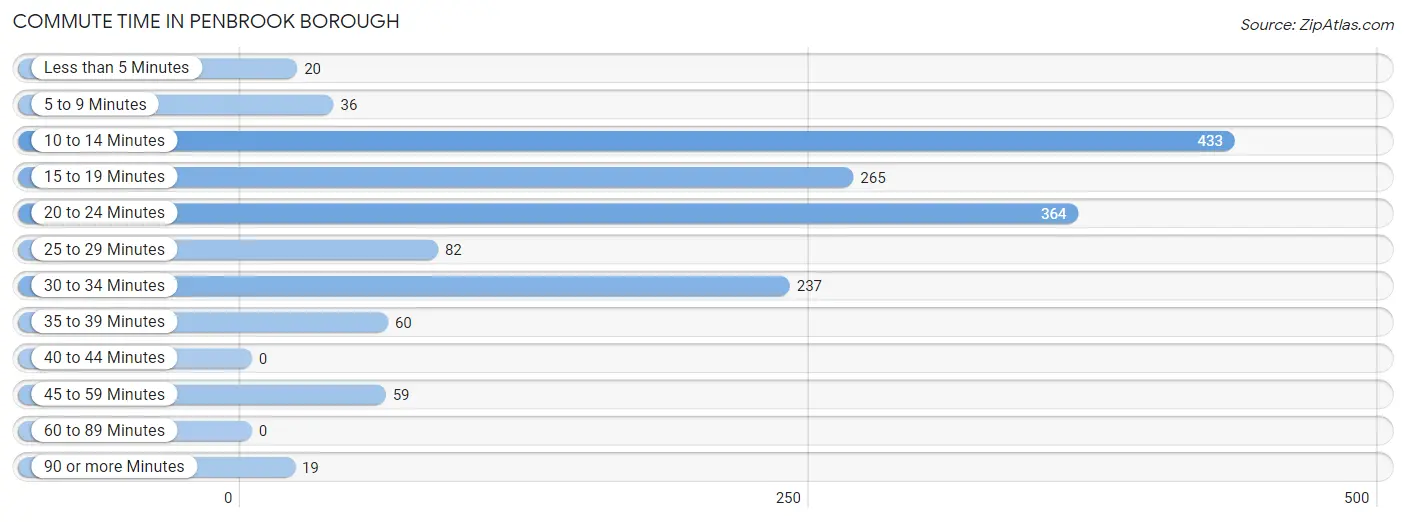
| Commute Time | # Commuters | % Commuters |
| Less than 5 Minutes | 20 | 1.3% |
| 5 to 9 Minutes | 36 | 2.3% |
| 10 to 14 Minutes | 433 | 27.5% |
| 15 to 19 Minutes | 265 | 16.8% |
| 20 to 24 Minutes | 364 | 23.1% |
| 25 to 29 Minutes | 82 | 5.2% |
| 30 to 34 Minutes | 237 | 15.0% |
| 35 to 39 Minutes | 60 | 3.8% |
| 40 to 44 Minutes | 0 | 0.0% |
| 45 to 59 Minutes | 59 | 3.7% |
| 60 to 89 Minutes | 0 | 0.0% |
| 90 or more Minutes | 19 | 1.2% |
Commute Time by Sex in Penbrook borough
The most common commute times in Penbrook borough are 10 to 14 minutes (244 commuters, 30.3%) for males and 15 to 19 minutes (208 commuters, 27.0%) for females.
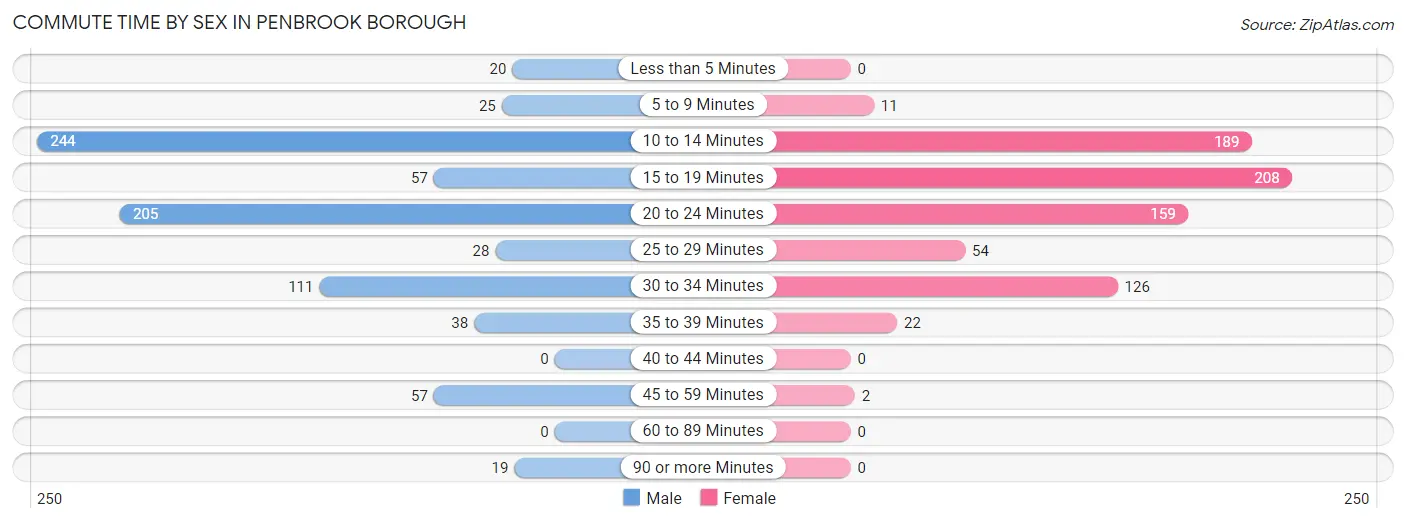
| Commute Time | Male | Female |
| Less than 5 Minutes | 20 (2.5%) | 0 (0.0%) |
| 5 to 9 Minutes | 25 (3.1%) | 11 (1.4%) |
| 10 to 14 Minutes | 244 (30.3%) | 189 (24.5%) |
| 15 to 19 Minutes | 57 (7.1%) | 208 (27.0%) |
| 20 to 24 Minutes | 205 (25.5%) | 159 (20.6%) |
| 25 to 29 Minutes | 28 (3.5%) | 54 (7.0%) |
| 30 to 34 Minutes | 111 (13.8%) | 126 (16.3%) |
| 35 to 39 Minutes | 38 (4.7%) | 22 (2.9%) |
| 40 to 44 Minutes | 0 (0.0%) | 0 (0.0%) |
| 45 to 59 Minutes | 57 (7.1%) | 2 (0.3%) |
| 60 to 89 Minutes | 0 (0.0%) | 0 (0.0%) |
| 90 or more Minutes | 19 (2.4%) | 0 (0.0%) |
Time of Departure to Work by Sex in Penbrook borough
The most frequent times of departure to work in Penbrook borough are 4:00 PM to 11:59 PM (154, 19.2%) for males and 7:30 AM to 7:59 AM (193, 25.0%) for females.
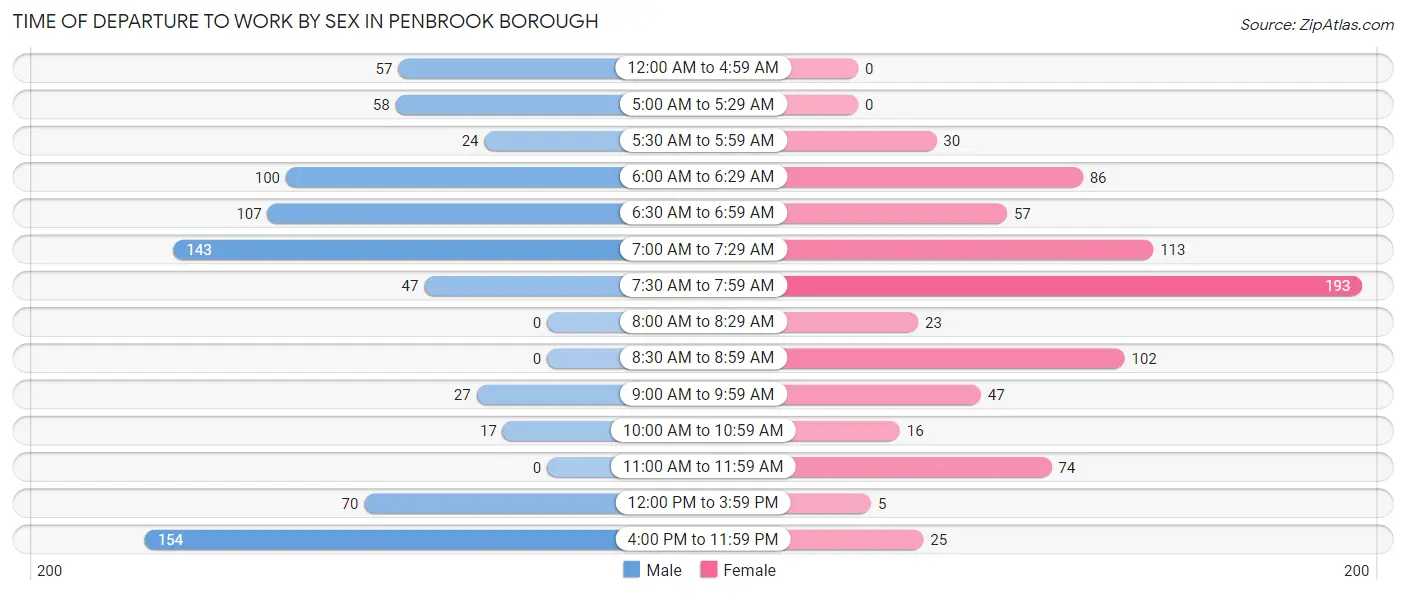
| Time of Departure | Male | Female |
| 12:00 AM to 4:59 AM | 57 (7.1%) | 0 (0.0%) |
| 5:00 AM to 5:29 AM | 58 (7.2%) | 0 (0.0%) |
| 5:30 AM to 5:59 AM | 24 (3.0%) | 30 (3.9%) |
| 6:00 AM to 6:29 AM | 100 (12.4%) | 86 (11.2%) |
| 6:30 AM to 6:59 AM | 107 (13.3%) | 57 (7.4%) |
| 7:00 AM to 7:29 AM | 143 (17.8%) | 113 (14.7%) |
| 7:30 AM to 7:59 AM | 47 (5.9%) | 193 (25.0%) |
| 8:00 AM to 8:29 AM | 0 (0.0%) | 23 (3.0%) |
| 8:30 AM to 8:59 AM | 0 (0.0%) | 102 (13.2%) |
| 9:00 AM to 9:59 AM | 27 (3.4%) | 47 (6.1%) |
| 10:00 AM to 10:59 AM | 17 (2.1%) | 16 (2.1%) |
| 11:00 AM to 11:59 AM | 0 (0.0%) | 74 (9.6%) |
| 12:00 PM to 3:59 PM | 70 (8.7%) | 5 (0.6%) |
| 4:00 PM to 11:59 PM | 154 (19.2%) | 25 (3.2%) |
| Total | 804 (100.0%) | 771 (100.0%) |
Housing Occupancy in Penbrook borough
Occupancy by Ownership in Penbrook borough
Of the total 1,401 dwellings in Penbrook borough, owner-occupied units account for 809 (57.7%), while renter-occupied units make up 592 (42.3%).
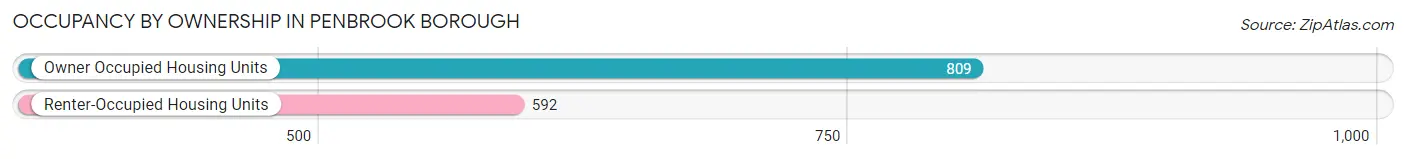
| Occupancy | # Housing Units | % Housing Units |
| Owner Occupied Housing Units | 809 | 57.7% |
| Renter-Occupied Housing Units | 592 | 42.3% |
| Total Occupied Housing Units | 1,401 | 100.0% |
Occupancy by Household Size in Penbrook borough
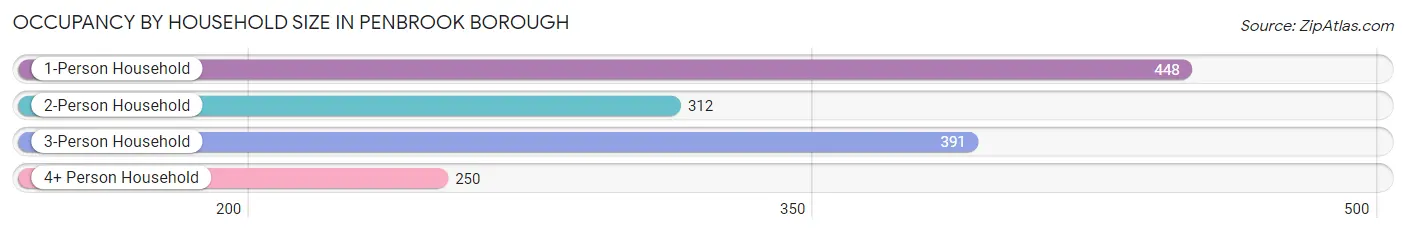
| Household Size | # Housing Units | % Housing Units |
| 1-Person Household | 448 | 32.0% |
| 2-Person Household | 312 | 22.3% |
| 3-Person Household | 391 | 27.9% |
| 4+ Person Household | 250 | 17.8% |
| Total Housing Units | 1,401 | 100.0% |
Occupancy by Ownership by Household Size in Penbrook borough
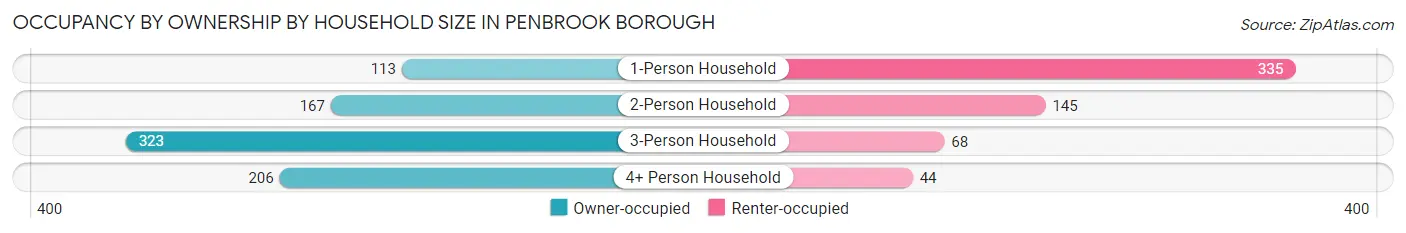
| Household Size | Owner-occupied | Renter-occupied |
| 1-Person Household | 113 (25.2%) | 335 (74.8%) |
| 2-Person Household | 167 (53.5%) | 145 (46.5%) |
| 3-Person Household | 323 (82.6%) | 68 (17.4%) |
| 4+ Person Household | 206 (82.4%) | 44 (17.6%) |
| Total Housing Units | 809 (57.7%) | 592 (42.3%) |
Occupancy by Educational Attainment in Penbrook borough
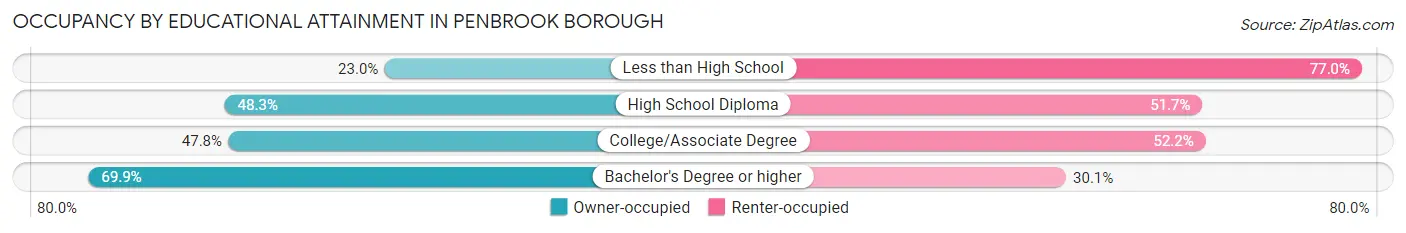
| Household Size | Owner-occupied | Renter-occupied |
| Less than High School | 17 (23.0%) | 57 (77.0%) |
| High School Diploma | 181 (48.3%) | 194 (51.7%) |
| College/Associate Degree | 117 (47.8%) | 128 (52.2%) |
| Bachelor's Degree or higher | 494 (69.9%) | 213 (30.1%) |
Occupancy by Age of Householder in Penbrook borough
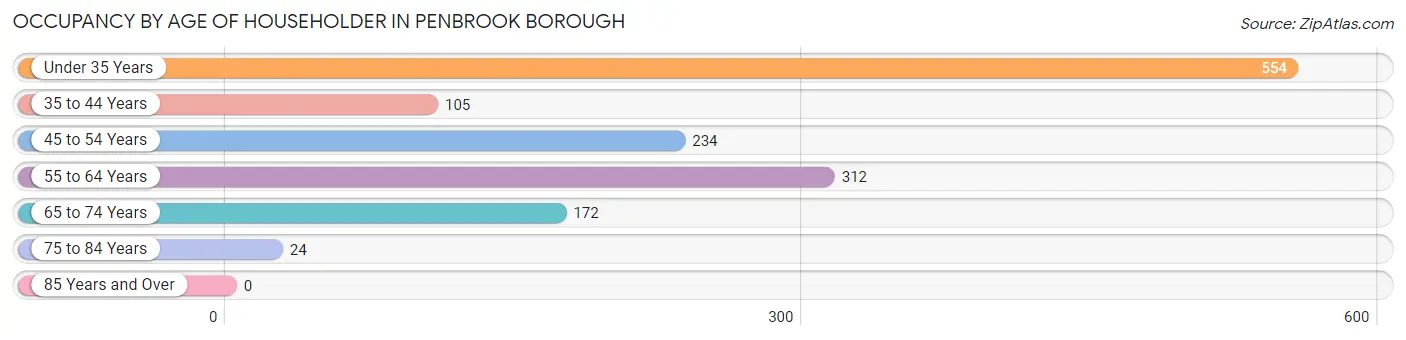
| Age Bracket | # Households | % Households |
| Under 35 Years | 554 | 39.5% |
| 35 to 44 Years | 105 | 7.5% |
| 45 to 54 Years | 234 | 16.7% |
| 55 to 64 Years | 312 | 22.3% |
| 65 to 74 Years | 172 | 12.3% |
| 75 to 84 Years | 24 | 1.7% |
| 85 Years and Over | 0 | 0.0% |
| Total | 1,401 | 100.0% |
Housing Finances in Penbrook borough
Median Income by Occupancy in Penbrook borough
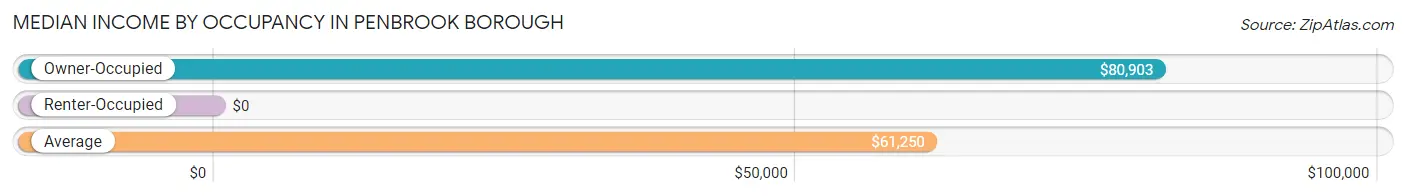
| Occupancy Type | # Households | Median Income |
| Owner-Occupied | 809 (57.7%) | $80,903 |
| Renter-Occupied | 592 (42.3%) | $0 |
| Average | 1,401 (100.0%) | $61,250 |
Occupancy by Householder Income Bracket in Penbrook borough
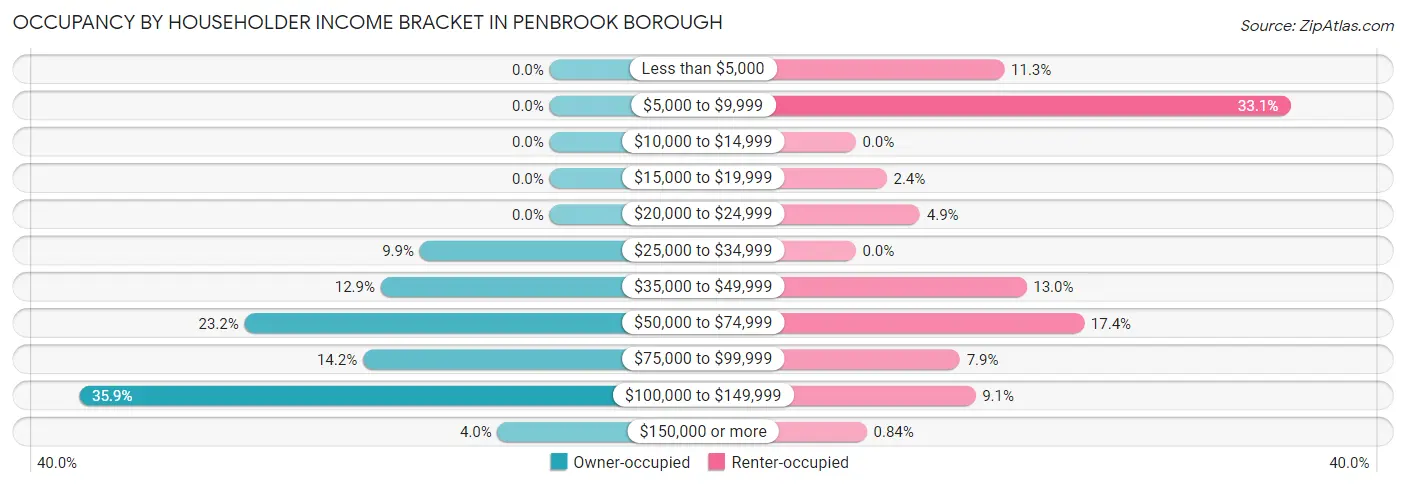
| Income Bracket | Owner-occupied | Renter-occupied |
| Less than $5,000 | 0 (0.0%) | 67 (11.3%) |
| $5,000 to $9,999 | 0 (0.0%) | 196 (33.1%) |
| $10,000 to $14,999 | 0 (0.0%) | 0 (0.0%) |
| $15,000 to $19,999 | 0 (0.0%) | 14 (2.4%) |
| $20,000 to $24,999 | 0 (0.0%) | 29 (4.9%) |
| $25,000 to $34,999 | 80 (9.9%) | 0 (0.0%) |
| $35,000 to $49,999 | 104 (12.9%) | 77 (13.0%) |
| $50,000 to $74,999 | 188 (23.2%) | 103 (17.4%) |
| $75,000 to $99,999 | 115 (14.2%) | 47 (7.9%) |
| $100,000 to $149,999 | 290 (35.8%) | 54 (9.1%) |
| $150,000 or more | 32 (4.0%) | 5 (0.8%) |
| Total | 809 (100.0%) | 592 (100.0%) |
Monthly Housing Cost Tiers in Penbrook borough
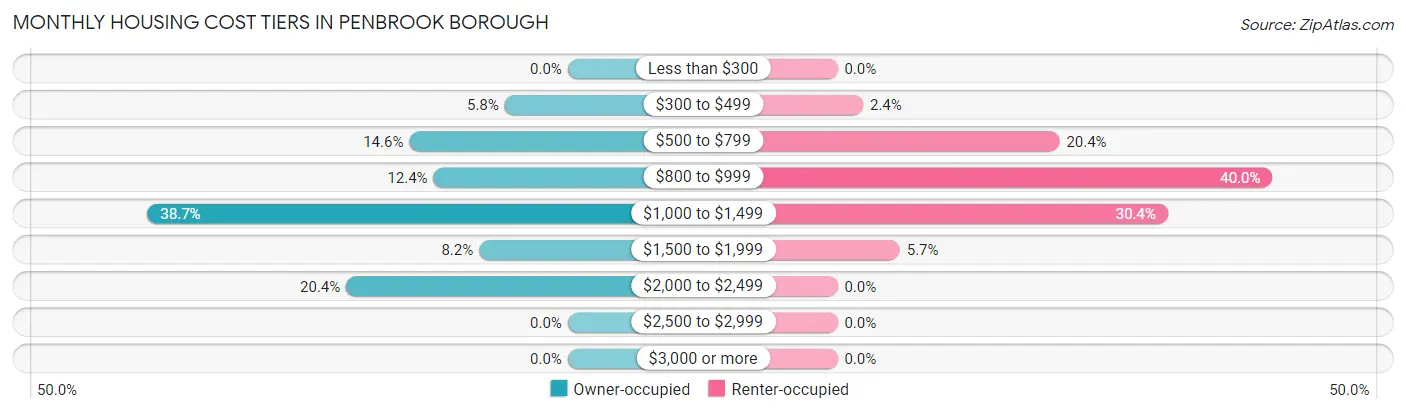
| Monthly Cost | Owner-occupied | Renter-occupied |
| Less than $300 | 0 (0.0%) | 0 (0.0%) |
| $300 to $499 | 47 (5.8%) | 14 (2.4%) |
| $500 to $799 | 118 (14.6%) | 121 (20.4%) |
| $800 to $999 | 100 (12.4%) | 237 (40.0%) |
| $1,000 to $1,499 | 313 (38.7%) | 180 (30.4%) |
| $1,500 to $1,999 | 66 (8.2%) | 34 (5.7%) |
| $2,000 to $2,499 | 165 (20.4%) | 0 (0.0%) |
| $2,500 to $2,999 | 0 (0.0%) | 0 (0.0%) |
| $3,000 or more | 0 (0.0%) | 0 (0.0%) |
| Total | 809 (100.0%) | 592 (100.0%) |
Physical Housing Characteristics in Penbrook borough
Housing Structures in Penbrook borough
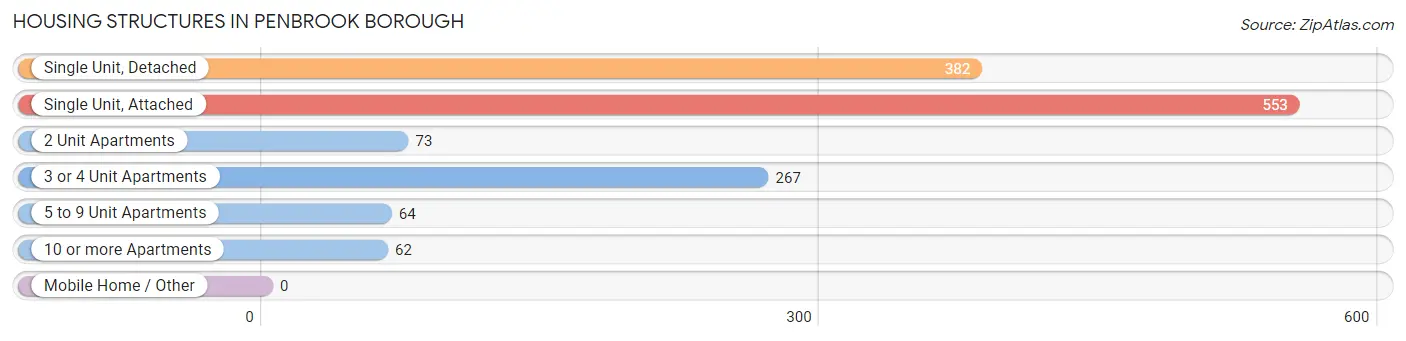
| Structure Type | # Housing Units | % Housing Units |
| Single Unit, Detached | 382 | 27.3% |
| Single Unit, Attached | 553 | 39.5% |
| 2 Unit Apartments | 73 | 5.2% |
| 3 or 4 Unit Apartments | 267 | 19.1% |
| 5 to 9 Unit Apartments | 64 | 4.6% |
| 10 or more Apartments | 62 | 4.4% |
| Mobile Home / Other | 0 | 0.0% |
| Total | 1,401 | 100.0% |
Housing Structures by Occupancy in Penbrook borough
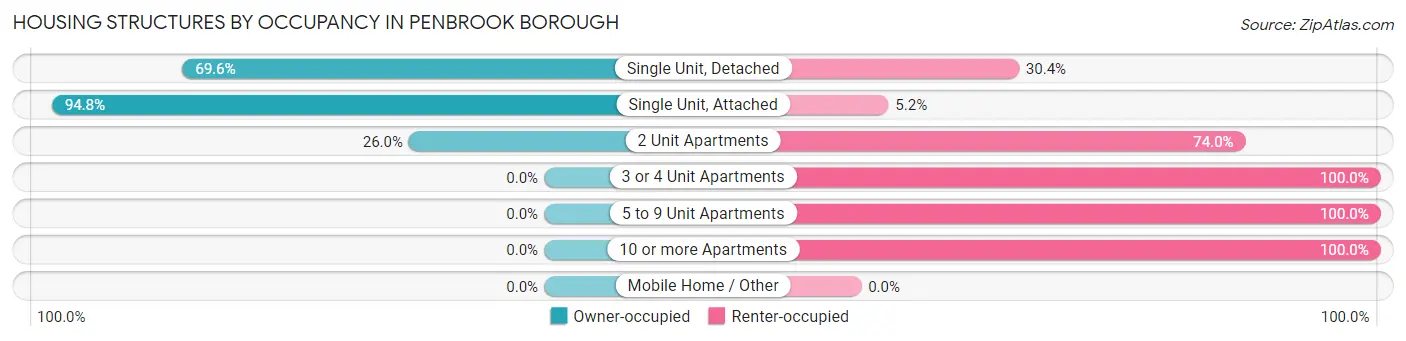
| Structure Type | Owner-occupied | Renter-occupied |
| Single Unit, Detached | 266 (69.6%) | 116 (30.4%) |
| Single Unit, Attached | 524 (94.8%) | 29 (5.2%) |
| 2 Unit Apartments | 19 (26.0%) | 54 (74.0%) |
| 3 or 4 Unit Apartments | 0 (0.0%) | 267 (100.0%) |
| 5 to 9 Unit Apartments | 0 (0.0%) | 64 (100.0%) |
| 10 or more Apartments | 0 (0.0%) | 62 (100.0%) |
| Mobile Home / Other | 0 (0.0%) | 0 (0.0%) |
| Total | 809 (57.7%) | 592 (42.3%) |
Housing Structures by Number of Rooms in Penbrook borough
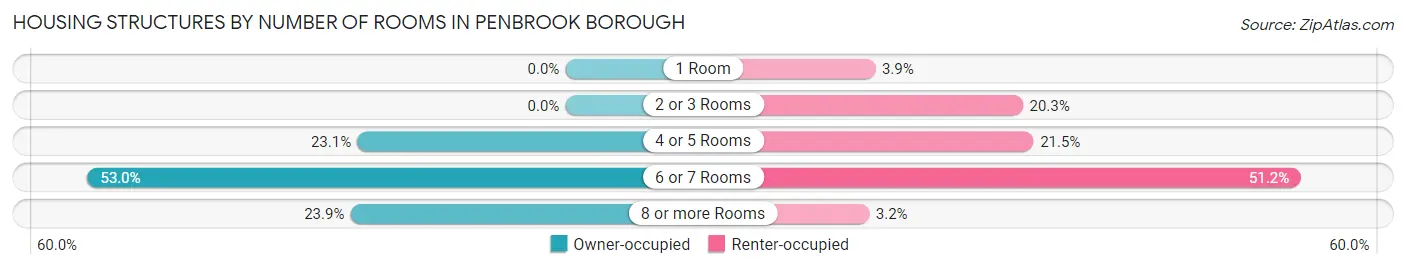
| Number of Rooms | Owner-occupied | Renter-occupied |
| 1 Room | 0 (0.0%) | 23 (3.9%) |
| 2 or 3 Rooms | 0 (0.0%) | 120 (20.3%) |
| 4 or 5 Rooms | 187 (23.1%) | 127 (21.4%) |
| 6 or 7 Rooms | 429 (53.0%) | 303 (51.2%) |
| 8 or more Rooms | 193 (23.9%) | 19 (3.2%) |
| Total | 809 (100.0%) | 592 (100.0%) |
Housing Structure by Heating Type in Penbrook borough
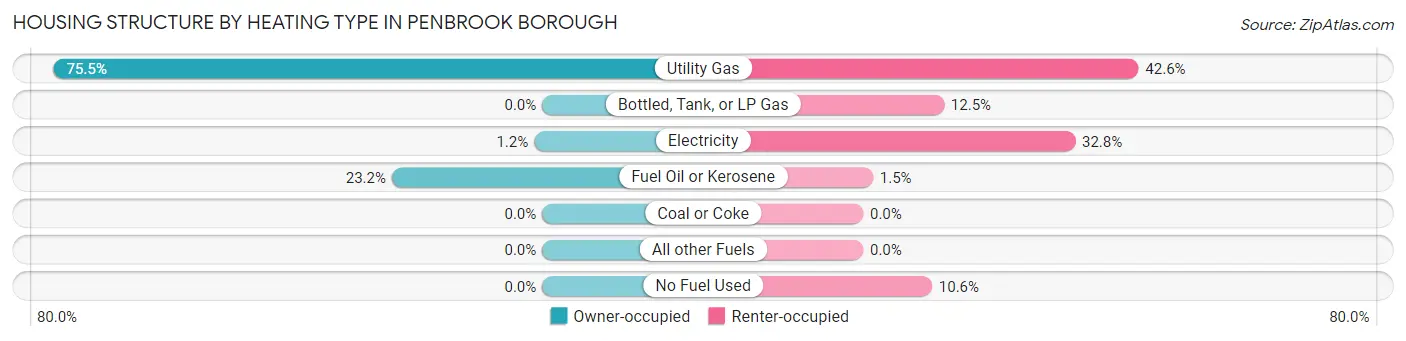
| Heating Type | Owner-occupied | Renter-occupied |
| Utility Gas | 611 (75.5%) | 252 (42.6%) |
| Bottled, Tank, or LP Gas | 0 (0.0%) | 74 (12.5%) |
| Electricity | 10 (1.2%) | 194 (32.8%) |
| Fuel Oil or Kerosene | 188 (23.2%) | 9 (1.5%) |
| Coal or Coke | 0 (0.0%) | 0 (0.0%) |
| All other Fuels | 0 (0.0%) | 0 (0.0%) |
| No Fuel Used | 0 (0.0%) | 63 (10.6%) |
| Total | 809 (100.0%) | 592 (100.0%) |
Household Vehicle Usage in Penbrook borough
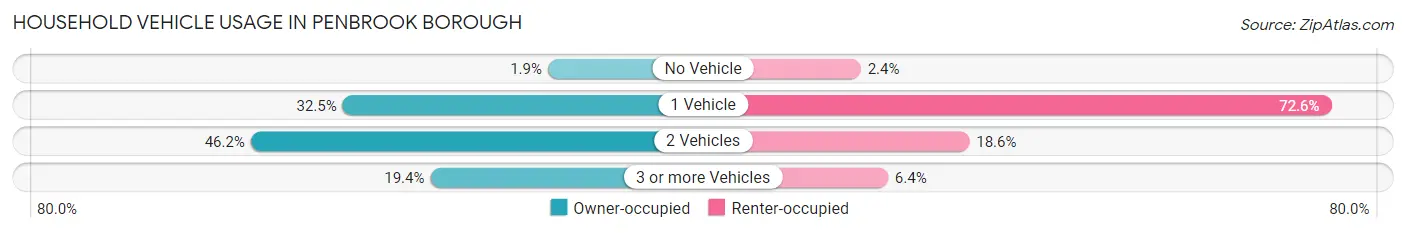
| Vehicles per Household | Owner-occupied | Renter-occupied |
| No Vehicle | 15 (1.8%) | 14 (2.4%) |
| 1 Vehicle | 263 (32.5%) | 430 (72.6%) |
| 2 Vehicles | 374 (46.2%) | 110 (18.6%) |
| 3 or more Vehicles | 157 (19.4%) | 38 (6.4%) |
| Total | 809 (100.0%) | 592 (100.0%) |
Real Estate & Mortgages in Penbrook borough
Real Estate and Mortgage Overview in Penbrook borough
| Characteristic | Without Mortgage | With Mortgage |
| Housing Units | 171 | 638 |
| Median Property Value | $140,600 | $122,600 |
| Median Household Income | $72,969 | $24 |
| Monthly Housing Costs | $546 | $0 |
| Real Estate Taxes | $2,603 | $0 |
Property Value by Mortgage Status in Penbrook borough
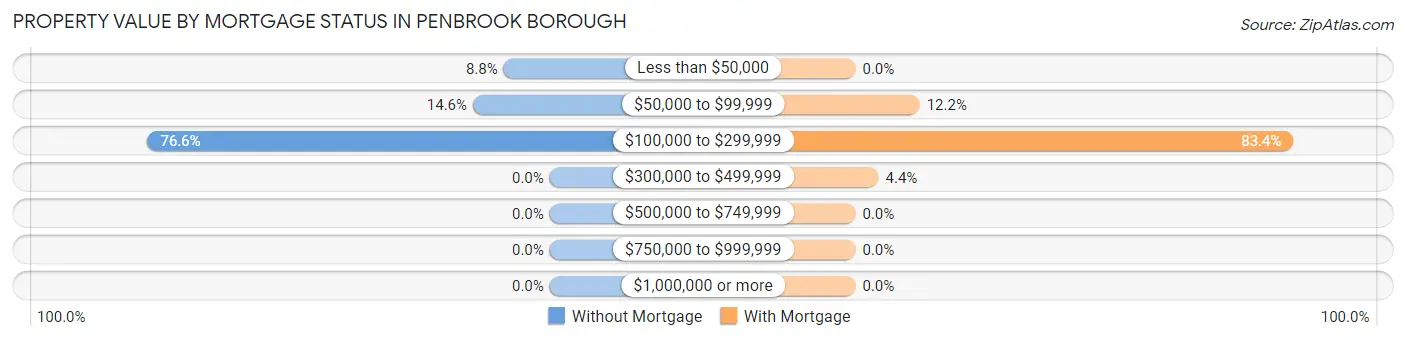
| Property Value | Without Mortgage | With Mortgage |
| Less than $50,000 | 15 (8.8%) | 0 (0.0%) |
| $50,000 to $99,999 | 25 (14.6%) | 78 (12.2%) |
| $100,000 to $299,999 | 131 (76.6%) | 532 (83.4%) |
| $300,000 to $499,999 | 0 (0.0%) | 28 (4.4%) |
| $500,000 to $749,999 | 0 (0.0%) | 0 (0.0%) |
| $750,000 to $999,999 | 0 (0.0%) | 0 (0.0%) |
| $1,000,000 or more | 0 (0.0%) | 0 (0.0%) |
| Total | 171 (100.0%) | 638 (100.0%) |
Household Income by Mortgage Status in Penbrook borough
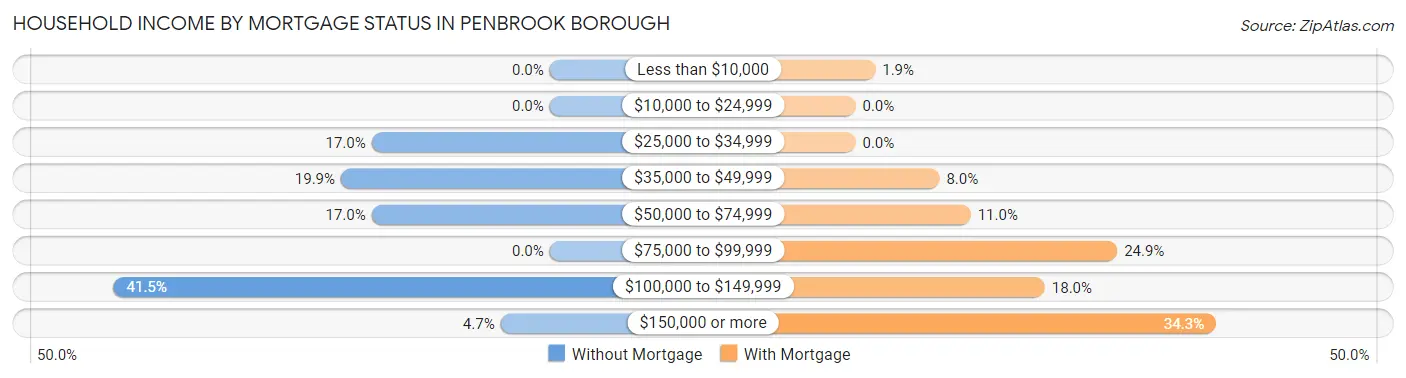
| Household Income | Without Mortgage | With Mortgage |
| Less than $10,000 | 0 (0.0%) | 12 (1.9%) |
| $10,000 to $24,999 | 0 (0.0%) | 0 (0.0%) |
| $25,000 to $34,999 | 29 (17.0%) | 0 (0.0%) |
| $35,000 to $49,999 | 34 (19.9%) | 51 (8.0%) |
| $50,000 to $74,999 | 29 (17.0%) | 70 (11.0%) |
| $75,000 to $99,999 | 0 (0.0%) | 159 (24.9%) |
| $100,000 to $149,999 | 71 (41.5%) | 115 (18.0%) |
| $150,000 or more | 8 (4.7%) | 219 (34.3%) |
| Total | 171 (100.0%) | 638 (100.0%) |
Property Value to Household Income Ratio in Penbrook borough
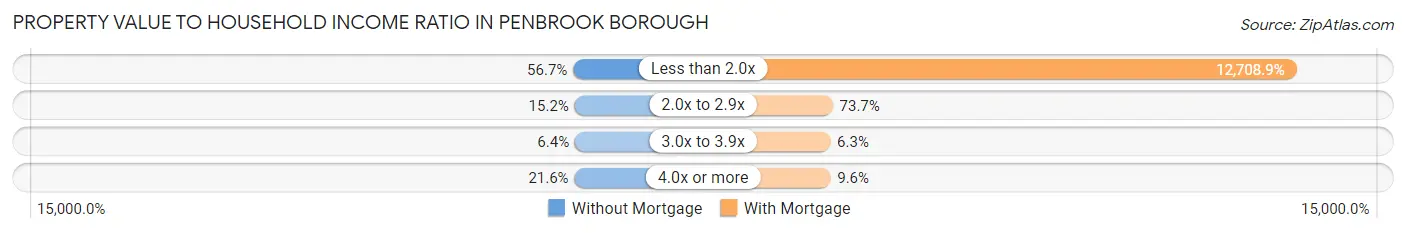
| Value-to-Income Ratio | Without Mortgage | With Mortgage |
| Less than 2.0x | 97 (56.7%) | 81,083 (12,708.9%) |
| 2.0x to 2.9x | 26 (15.2%) | 470 (73.7%) |
| 3.0x to 3.9x | 11 (6.4%) | 40 (6.3%) |
| 4.0x or more | 37 (21.6%) | 61 (9.6%) |
| Total | 171 (100.0%) | 638 (100.0%) |
Real Estate Taxes by Mortgage Status in Penbrook borough

| Property Taxes | Without Mortgage | With Mortgage |
| Less than $800 | 0 (0.0%) | 0 (0.0%) |
| $800 to $1,499 | 19 (11.1%) | 10 (1.6%) |
| $800 to $1,499 | 152 (88.9%) | 67 (10.5%) |
| Total | 171 (100.0%) | 638 (100.0%) |
Health & Disability in Penbrook borough
Health Insurance Coverage by Age in Penbrook borough
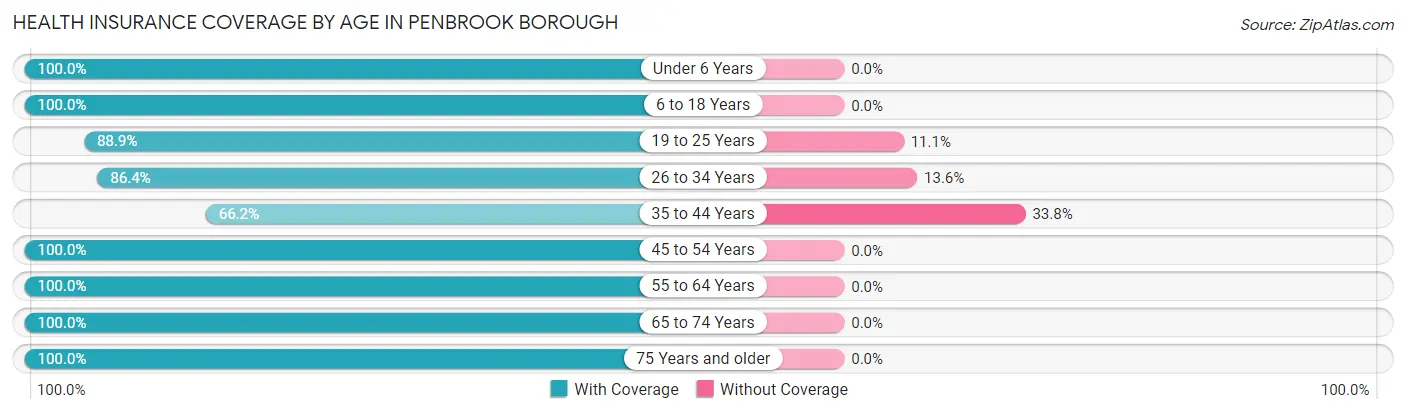
| Age Bracket | With Coverage | Without Coverage |
| Under 6 Years | 407 (100.0%) | 0 (0.0%) |
| 6 to 18 Years | 421 (100.0%) | 0 (0.0%) |
| 19 to 25 Years | 345 (88.9%) | 43 (11.1%) |
| 26 to 34 Years | 668 (86.4%) | 105 (13.6%) |
| 35 to 44 Years | 145 (66.2%) | 74 (33.8%) |
| 45 to 54 Years | 348 (100.0%) | 0 (0.0%) |
| 55 to 64 Years | 380 (100.0%) | 0 (0.0%) |
| 65 to 74 Years | 262 (100.0%) | 0 (0.0%) |
| 75 Years and older | 57 (100.0%) | 0 (0.0%) |
| Total | 3,033 (93.2%) | 222 (6.8%) |
Health Insurance Coverage by Citizenship Status in Penbrook borough
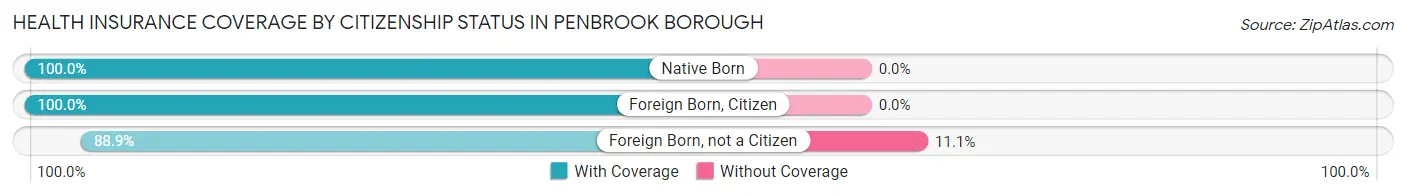
| Citizenship Status | With Coverage | Without Coverage |
| Native Born | 407 (100.0%) | 0 (0.0%) |
| Foreign Born, Citizen | 421 (100.0%) | 0 (0.0%) |
| Foreign Born, not a Citizen | 345 (88.9%) | 43 (11.1%) |
Health Insurance Coverage by Household Income in Penbrook borough
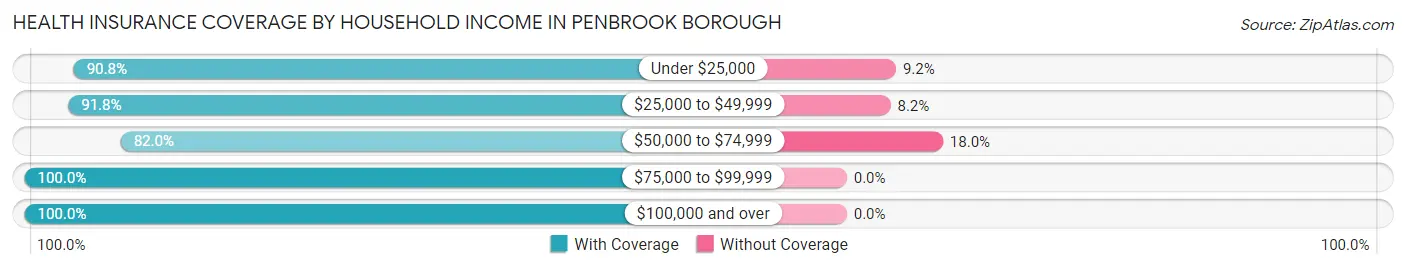
| Household Income | With Coverage | Without Coverage |
| Under $25,000 | 434 (90.8%) | 44 (9.2%) |
| $25,000 to $49,999 | 594 (91.8%) | 53 (8.2%) |
| $50,000 to $74,999 | 569 (82.0%) | 125 (18.0%) |
| $75,000 to $99,999 | 489 (100.0%) | 0 (0.0%) |
| $100,000 and over | 942 (100.0%) | 0 (0.0%) |
Public vs Private Health Insurance Coverage by Age in Penbrook borough
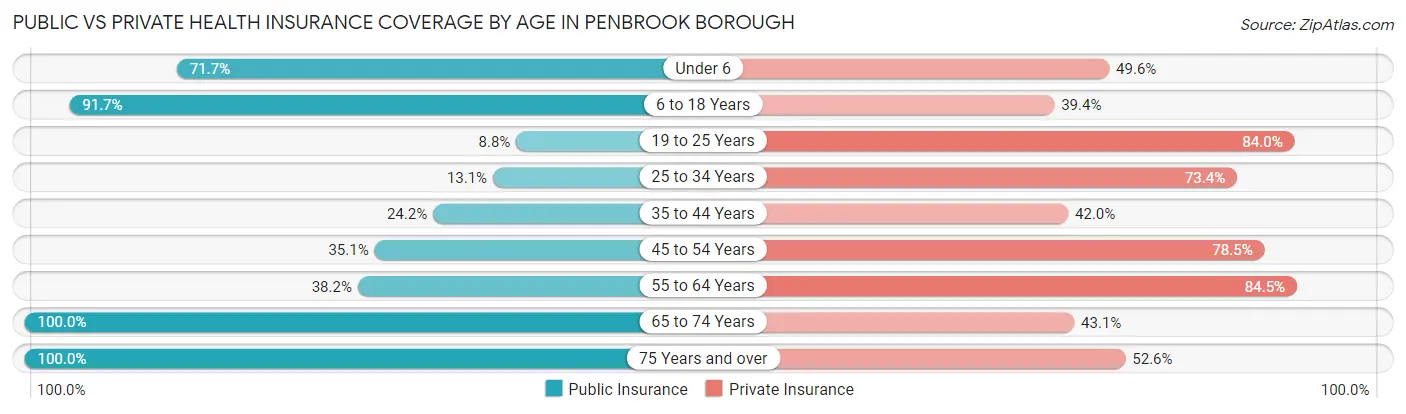
| Age Bracket | Public Insurance | Private Insurance |
| Under 6 | 292 (71.7%) | 202 (49.6%) |
| 6 to 18 Years | 386 (91.7%) | 166 (39.4%) |
| 19 to 25 Years | 34 (8.8%) | 326 (84.0%) |
| 25 to 34 Years | 101 (13.1%) | 567 (73.4%) |
| 35 to 44 Years | 53 (24.2%) | 92 (42.0%) |
| 45 to 54 Years | 122 (35.1%) | 273 (78.4%) |
| 55 to 64 Years | 145 (38.2%) | 321 (84.5%) |
| 65 to 74 Years | 262 (100.0%) | 113 (43.1%) |
| 75 Years and over | 57 (100.0%) | 30 (52.6%) |
| Total | 1,452 (44.6%) | 2,090 (64.2%) |
Disability Status by Sex by Age in Penbrook borough
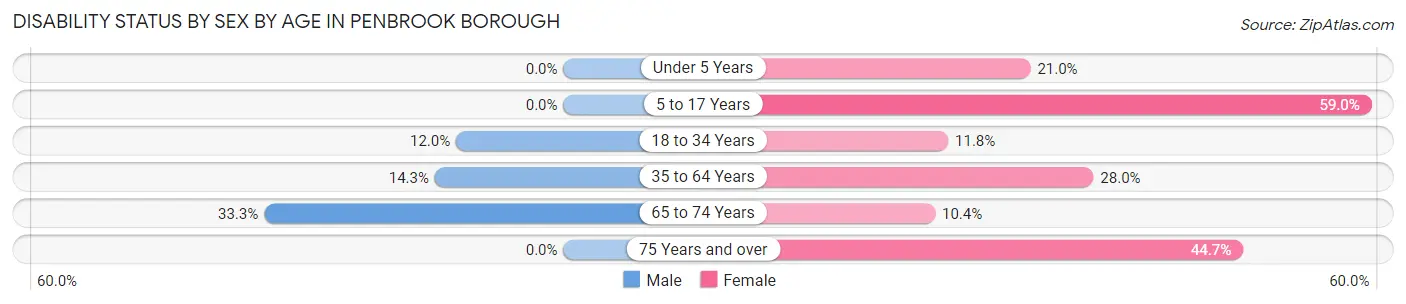
| Age Bracket | Male | Female |
| Under 5 Years | 0 (0.0%) | 25 (21.0%) |
| 5 to 17 Years | 0 (0.0%) | 177 (59.0%) |
| 18 to 34 Years | 68 (11.9%) | 72 (11.8%) |
| 35 to 64 Years | 61 (14.3%) | 146 (28.0%) |
| 65 to 74 Years | 52 (33.3%) | 11 (10.4%) |
| 75 Years and over | 0 (0.0%) | 21 (44.7%) |
Disability Class by Sex by Age in Penbrook borough
Disability Class: Hearing Difficulty
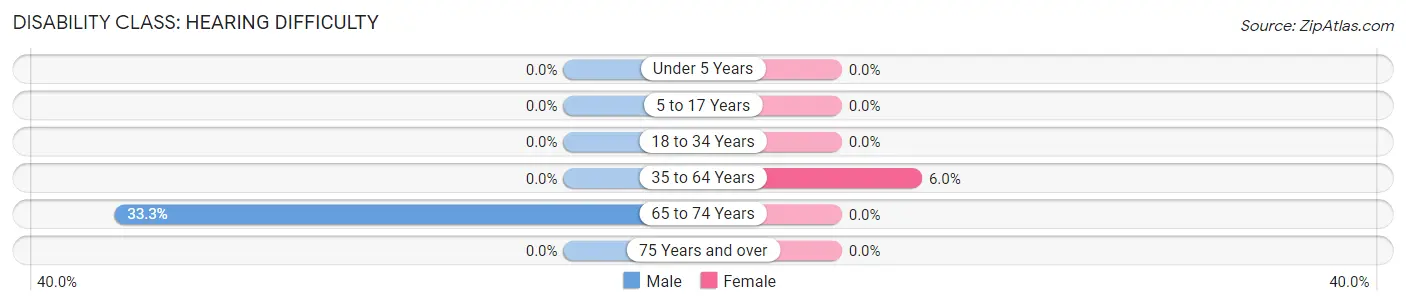
| Age Bracket | Male | Female |
| Under 5 Years | 0 (0.0%) | 0 (0.0%) |
| 5 to 17 Years | 0 (0.0%) | 0 (0.0%) |
| 18 to 34 Years | 0 (0.0%) | 0 (0.0%) |
| 35 to 64 Years | 0 (0.0%) | 31 (5.9%) |
| 65 to 74 Years | 52 (33.3%) | 0 (0.0%) |
| 75 Years and over | 0 (0.0%) | 0 (0.0%) |
Disability Class: Vision Difficulty
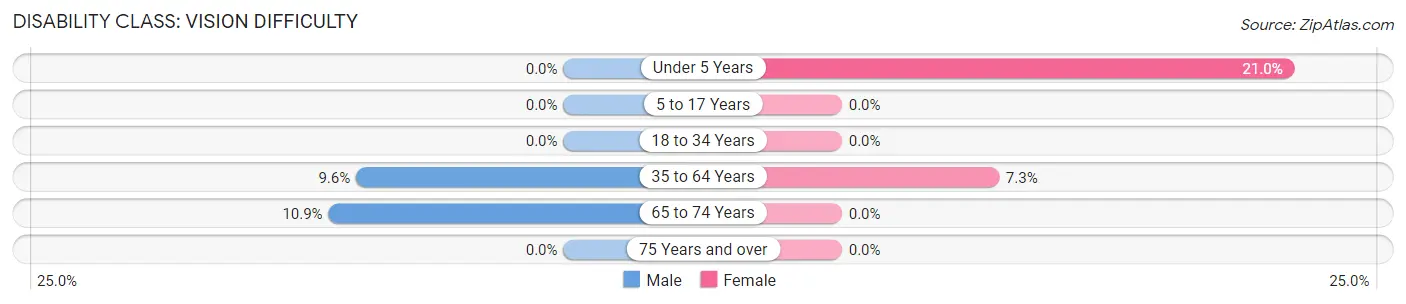
| Age Bracket | Male | Female |
| Under 5 Years | 0 (0.0%) | 25 (21.0%) |
| 5 to 17 Years | 0 (0.0%) | 0 (0.0%) |
| 18 to 34 Years | 0 (0.0%) | 0 (0.0%) |
| 35 to 64 Years | 41 (9.6%) | 38 (7.3%) |
| 65 to 74 Years | 17 (10.9%) | 0 (0.0%) |
| 75 Years and over | 0 (0.0%) | 0 (0.0%) |
Disability Class: Cognitive Difficulty
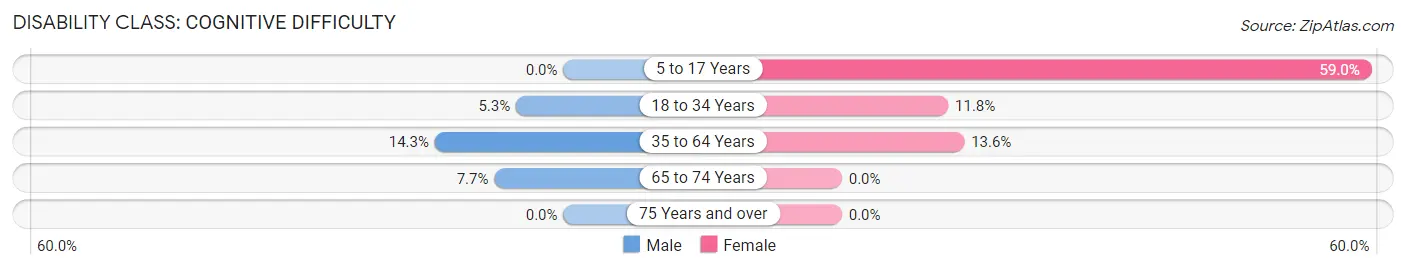
| Age Bracket | Male | Female |
| 5 to 17 Years | 0 (0.0%) | 177 (59.0%) |
| 18 to 34 Years | 30 (5.3%) | 72 (11.8%) |
| 35 to 64 Years | 61 (14.3%) | 71 (13.6%) |
| 65 to 74 Years | 12 (7.7%) | 0 (0.0%) |
| 75 Years and over | 0 (0.0%) | 0 (0.0%) |
Disability Class: Ambulatory Difficulty
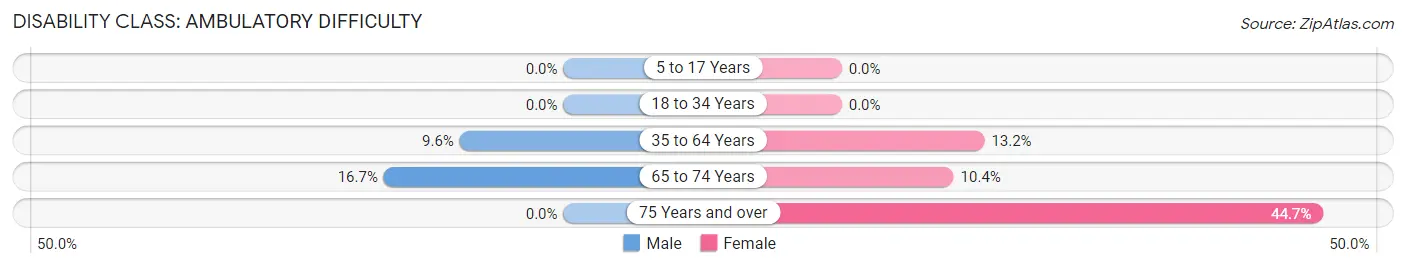
| Age Bracket | Male | Female |
| 5 to 17 Years | 0 (0.0%) | 0 (0.0%) |
| 18 to 34 Years | 0 (0.0%) | 0 (0.0%) |
| 35 to 64 Years | 41 (9.6%) | 69 (13.2%) |
| 65 to 74 Years | 26 (16.7%) | 11 (10.4%) |
| 75 Years and over | 0 (0.0%) | 21 (44.7%) |
Disability Class: Self-Care Difficulty
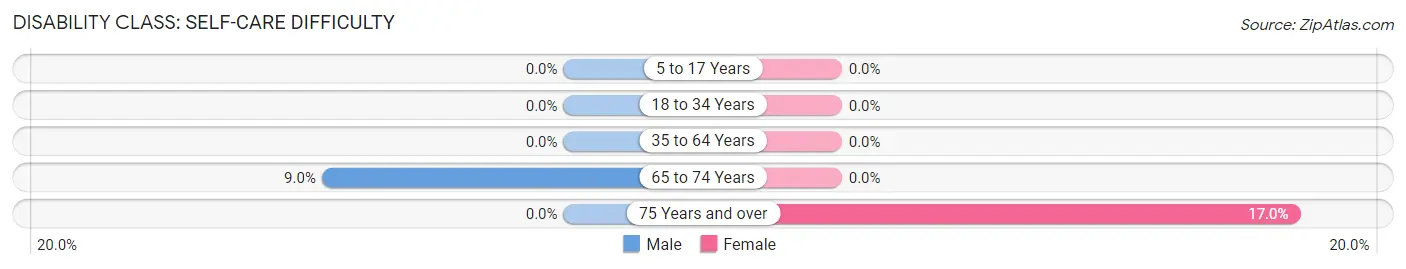
| Age Bracket | Male | Female |
| 5 to 17 Years | 0 (0.0%) | 0 (0.0%) |
| 18 to 34 Years | 0 (0.0%) | 0 (0.0%) |
| 35 to 64 Years | 0 (0.0%) | 0 (0.0%) |
| 65 to 74 Years | 14 (9.0%) | 0 (0.0%) |
| 75 Years and over | 0 (0.0%) | 8 (17.0%) |
Technology Access in Penbrook borough
Computing Device Access in Penbrook borough
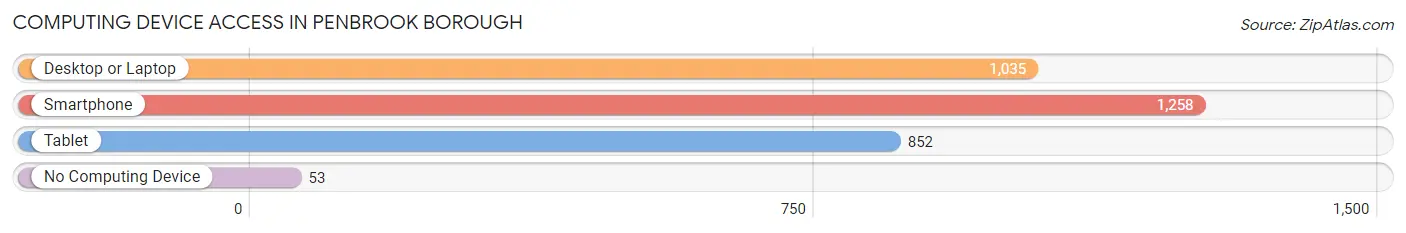
| Device Type | # Households | % Households |
| Desktop or Laptop | 1,035 | 73.9% |
| Smartphone | 1,258 | 89.8% |
| Tablet | 852 | 60.8% |
| No Computing Device | 53 | 3.8% |
| Total | 1,401 | 100.0% |
Internet Access in Penbrook borough
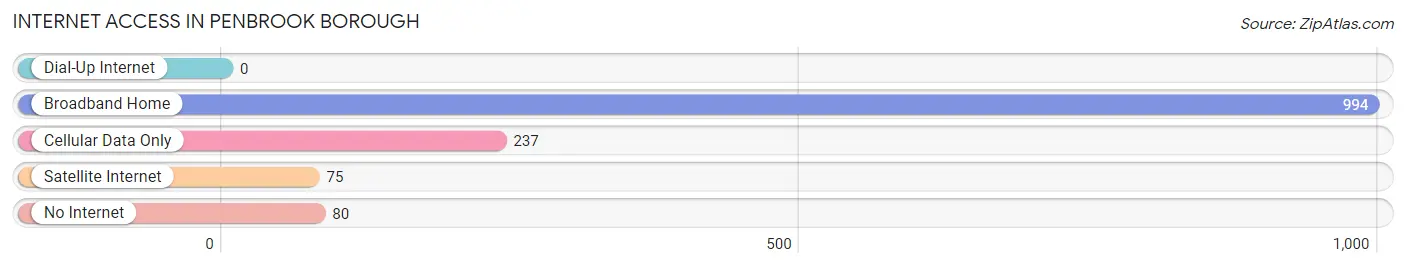
| Internet Type | # Households | % Households |
| Dial-Up Internet | 0 | 0.0% |
| Broadband Home | 994 | 71.0% |
| Cellular Data Only | 237 | 16.9% |
| Satellite Internet | 75 | 5.3% |
| No Internet | 80 | 5.7% |
| Total | 1,401 | 100.0% |
Penbrook borough Summary
Introduction
Penbrook Borough is a small borough located in Dauphin County, Pennsylvania. It is situated in the Susquehanna Valley, approximately five miles northwest of the state capital, Harrisburg. The borough is home to a population of approximately 2,500 people and covers an area of 0.7 square miles. Penbrook Borough is a vibrant community with a rich history, diverse geography, and a strong economy. This paper will explore the history, geography, economy, and demographics of Penbrook Borough in 2000 words.
History
Penbrook Borough was founded in 1891 and was originally known as Penbrook Station. The borough was named after the Penbrook family, who were early settlers in the area. The Penbrook family owned a large tract of land in the area and operated a sawmill and gristmill. The borough was incorporated in 1895 and was officially named Penbrook Borough.
The borough was originally a rural farming community, but in the early 20th century, the population began to grow as more people moved to the area. The borough was home to a variety of businesses, including a hotel, a general store, a blacksmith shop, and a post office.
In the 1950s, the borough began to experience a period of growth and development. The population increased and new businesses opened, including a grocery store, a hardware store, and a bank. The borough also saw the construction of a new school and a new library.
Geography
Penbrook Borough is located in the Susquehanna Valley, approximately five miles northwest of the state capital, Harrisburg. The borough is situated on the east bank of the Susquehanna River and is bordered by the boroughs of Steelton and Paxtang. The borough is located in a hilly region and is surrounded by wooded areas.
The borough covers an area of 0.7 square miles and is home to a population of approximately 2,500 people. The borough is served by two major highways, Interstate 83 and U.S. Route 22. The borough is also served by the Penbrook Station of the Harrisburg Area Rapid Transit (HART) system.
Economy
Penbrook Borough has a strong economy that is driven by a variety of industries. The borough is home to a number of businesses, including retail stores, restaurants, and professional services. The borough is also home to a number of manufacturing companies, including a paper mill and a printing company.
The borough is also home to a number of government offices, including the Penbrook Borough Hall and the Penbrook Police Department. The borough is also home to a number of educational institutions, including the Penbrook School District and the Harrisburg Area Community College.
Demographics
As of the 2010 census, the population of Penbrook Borough was 2,521. The population is predominantly white (90.2%), with a small percentage of African Americans (4.2%), Hispanics (2.3%), and Asians (1.3%). The median household income in the borough is $41,945, and the median age is 39.7 years.
Conclusion
Penbrook Borough is a small borough located in Dauphin County, Pennsylvania. It is situated in the Susquehanna Valley, approximately five miles northwest of the state capital, Harrisburg. The borough is home to a population of approximately 2,500 people and covers an area of 0.7 square miles. Penbrook Borough has a rich history, diverse geography, and a strong economy. The borough is predominantly white, with a small percentage of African Americans, Hispanics, and Asians. The median household income in the borough is $41,945, and the median age is 39.7 years.
Common Questions
What is Per Capita Income in Penbrook borough?
Per Capita income in Penbrook borough is $27,027.
What is the Median Family Income in Penbrook borough?
Median Family Income in Penbrook borough is $61,165.
What is the Median Household income in Penbrook borough?
Median Household Income in Penbrook borough is $61,250.
What is Income or Wage Gap in Penbrook borough?
Income or Wage Gap in Penbrook borough is 13.4%.
Women in Penbrook borough earn 86.6 cents for every dollar earned by a man.
What is Inequality or Gini Index in Penbrook borough?
Inequality or Gini Index in Penbrook borough is 0.40.
What is the Total Population of Penbrook borough?
Total Population of Penbrook borough is 3,255.
What is the Total Male Population of Penbrook borough?
Total Male Population of Penbrook borough is 1,554.
What is the Total Female Population of Penbrook borough?
Total Female Population of Penbrook borough is 1,701.
What is the Ratio of Males per 100 Females in Penbrook borough?
There are 91.36 Males per 100 Females in Penbrook borough.
What is the Ratio of Females per 100 Males in Penbrook borough?
There are 109.46 Females per 100 Males in Penbrook borough.
What is the Median Population Age in Penbrook borough?
Median Population Age in Penbrook borough is 30.0 Years.
What is the Average Family Size in Penbrook borough
Average Family Size in Penbrook borough is 2.8 People.
What is the Average Household Size in Penbrook borough
Average Household Size in Penbrook borough is 2.3 People.
How Large is the Labor Force in Penbrook borough?
There are 1,805 People in the Labor Forcein in Penbrook borough.
What is the Percentage of People in the Labor Force in Penbrook borough?
72.5% of People are in the Labor Force in Penbrook borough.
What is the Unemployment Rate in Penbrook borough?
Unemployment Rate in Penbrook borough is 8.1%.