Toughkenamon, PA Map & Demographics
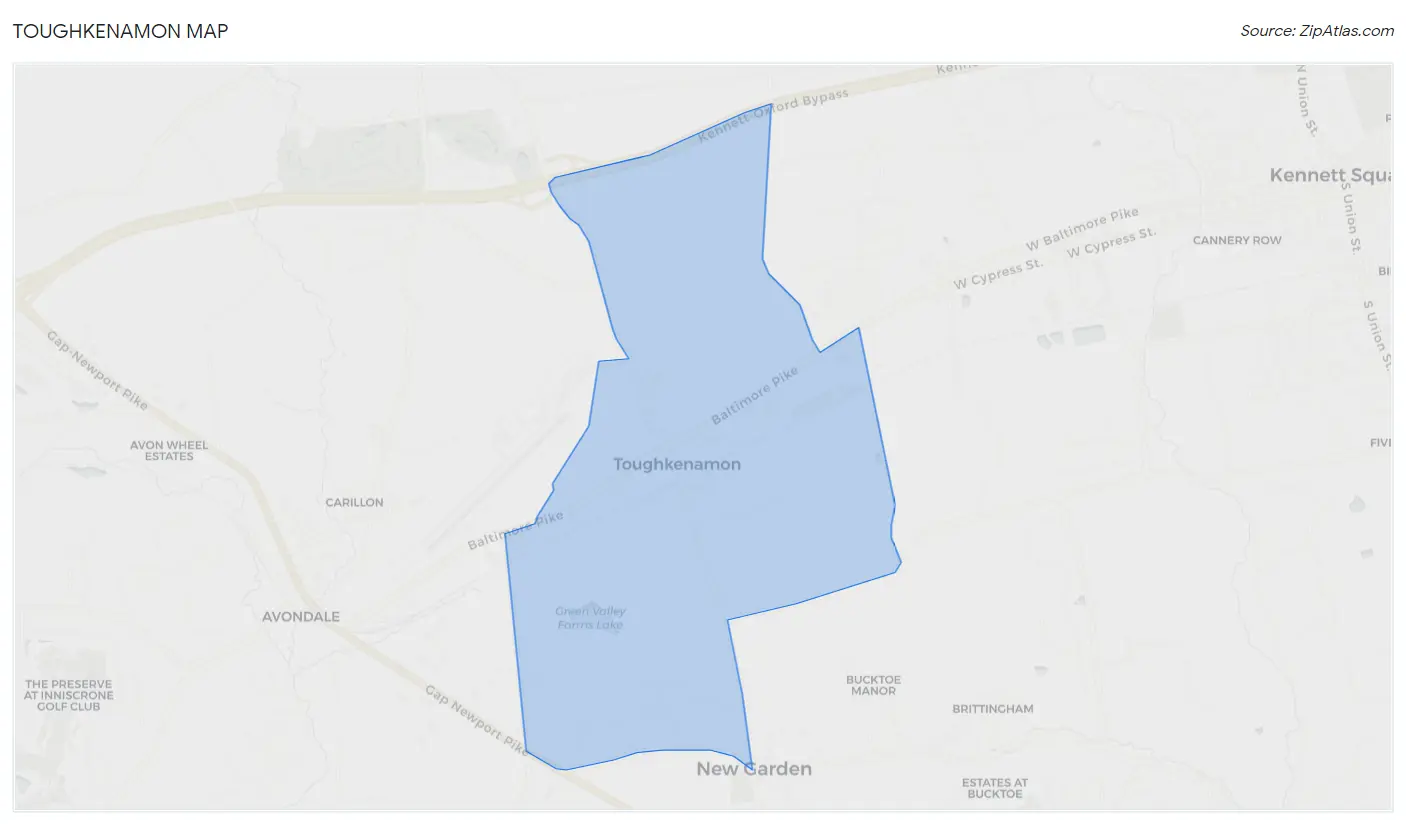
Toughkenamon Map
Toughkenamon Overview
$37,982
PER CAPITA INCOME
$94,412
AVG FAMILY INCOME
$94,559
AVG HOUSEHOLD INCOME
66.6%
WAGE / INCOME GAP [ % ]
33.4¢/ $1
WAGE / INCOME GAP [ $ ]
0.36
INEQUALITY / GINI INDEX
939
TOTAL POPULATION
443
MALE POPULATION
496
FEMALE POPULATION
89.31
MALES / 100 FEMALES
111.96
FEMALES / 100 MALES
44.3
MEDIAN AGE
3.3
AVG FAMILY SIZE
3.0
AVG HOUSEHOLD SIZE
501
LABOR FORCE [ PEOPLE ]
62.0%
PERCENT IN LABOR FORCE
1.0%
UNEMPLOYMENT RATE
Toughkenamon Zip Codes
Income in Toughkenamon
Income Overview in Toughkenamon
Per Capita Income in Toughkenamon is $37,982, while median incomes of families and households are $94,412 and $94,559 respectively.
| Characteristic | Number | Measure |
| Per Capita Income | 939 | $37,982 |
| Median Family Income | 268 | $94,412 |
| Mean Family Income | 268 | $108,232 |
| Median Household Income | 316 | $94,559 |
| Mean Household Income | 316 | $107,913 |
| Income Deficit | 268 | $0 |
| Wage / Income Gap (%) | 939 | 66.63% |
| Wage / Income Gap ($) | 939 | 33.37¢ per $1 |
| Gini / Inequality Index | 939 | 0.36 |
Earnings by Sex in Toughkenamon
Average Earnings in Toughkenamon are $30,588, $67,896 for men and $22,656 for women, a difference of 66.6%.
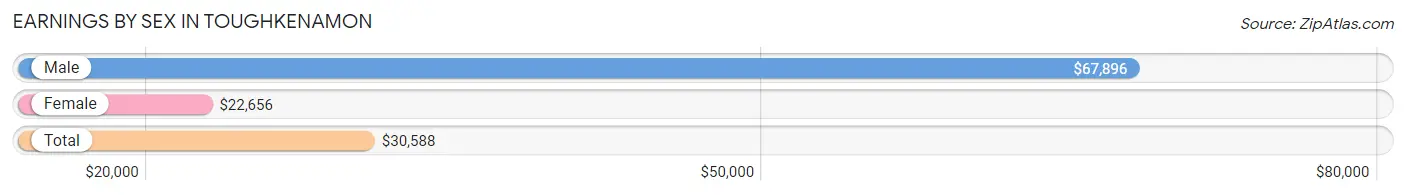
| Sex | Number | Average Earnings |
| Male | 263 (46.0%) | $67,896 |
| Female | 309 (54.0%) | $22,656 |
| Total | 572 (100.0%) | $30,588 |
Earnings by Sex by Income Bracket in Toughkenamon
The most common earnings brackets in Toughkenamon are $65,000 to $74,999 for men (67 | 25.5%) and $22,500 to $24,999 for women (56 | 18.1%).
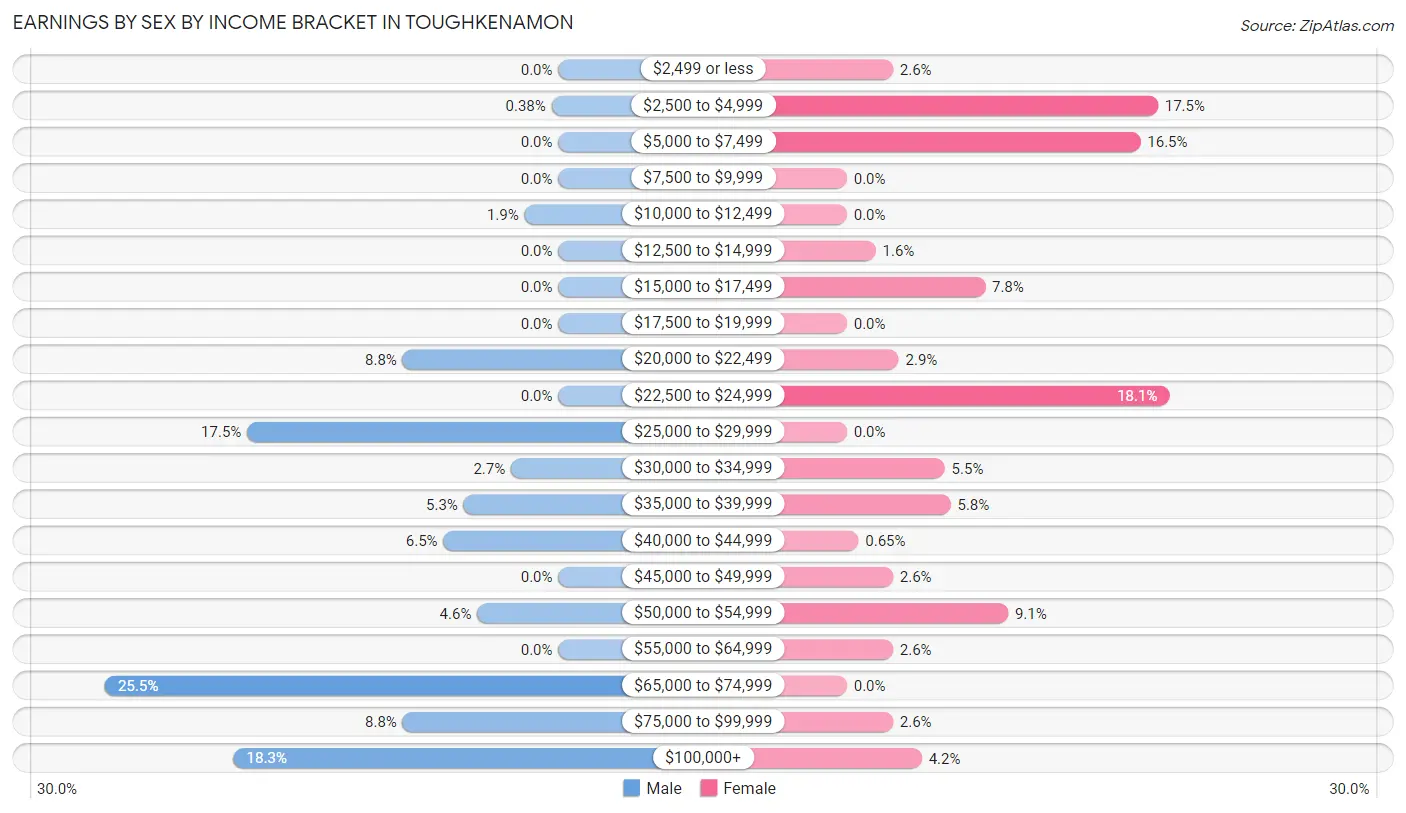
| Income | Male | Female |
| $2,499 or less | 0 (0.0%) | 8 (2.6%) |
| $2,500 to $4,999 | 1 (0.4%) | 54 (17.5%) |
| $5,000 to $7,499 | 0 (0.0%) | 51 (16.5%) |
| $7,500 to $9,999 | 0 (0.0%) | 0 (0.0%) |
| $10,000 to $12,499 | 5 (1.9%) | 0 (0.0%) |
| $12,500 to $14,999 | 0 (0.0%) | 5 (1.6%) |
| $15,000 to $17,499 | 0 (0.0%) | 24 (7.8%) |
| $17,500 to $19,999 | 0 (0.0%) | 0 (0.0%) |
| $20,000 to $22,499 | 23 (8.7%) | 9 (2.9%) |
| $22,500 to $24,999 | 0 (0.0%) | 56 (18.1%) |
| $25,000 to $29,999 | 46 (17.5%) | 0 (0.0%) |
| $30,000 to $34,999 | 7 (2.7%) | 17 (5.5%) |
| $35,000 to $39,999 | 14 (5.3%) | 18 (5.8%) |
| $40,000 to $44,999 | 17 (6.5%) | 2 (0.6%) |
| $45,000 to $49,999 | 0 (0.0%) | 8 (2.6%) |
| $50,000 to $54,999 | 12 (4.6%) | 28 (9.1%) |
| $55,000 to $64,999 | 0 (0.0%) | 8 (2.6%) |
| $65,000 to $74,999 | 67 (25.5%) | 0 (0.0%) |
| $75,000 to $99,999 | 23 (8.7%) | 8 (2.6%) |
| $100,000+ | 48 (18.2%) | 13 (4.2%) |
| Total | 263 (100.0%) | 309 (100.0%) |
Earnings by Sex by Educational Attainment in Toughkenamon
Average earnings in Toughkenamon are $68,902 for men and $24,643 for women, a difference of 64.2%. Men with an educational attainment of high school diploma enjoy the highest average annual earnings of $105,385, while those with high school diploma education earn the least with $105,385. Women with an educational attainment of high school diploma earn the most with the average annual earnings of $51,131, while those with high school diploma education have the smallest earnings of $51,131.
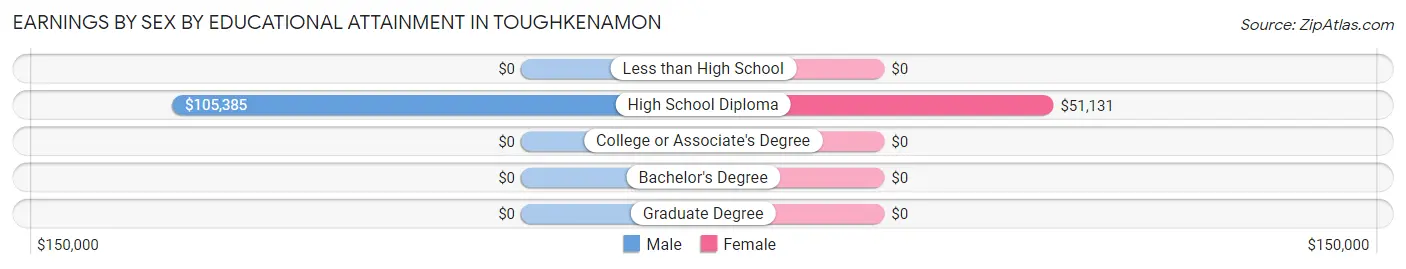
| Educational Attainment | Male Income | Female Income |
| Less than High School | - | - |
| High School Diploma | $105,385 | $51,131 |
| College or Associate's Degree | - | - |
| Bachelor's Degree | - | - |
| Graduate Degree | - | - |
| Total | $68,902 | $24,643 |
Family Income in Toughkenamon
Family Income Brackets in Toughkenamon
According to the Toughkenamon family income data, there are 72 families falling into the $75,000 to $99,999 income range, which is the most common income bracket and makes up 26.9% of all families.
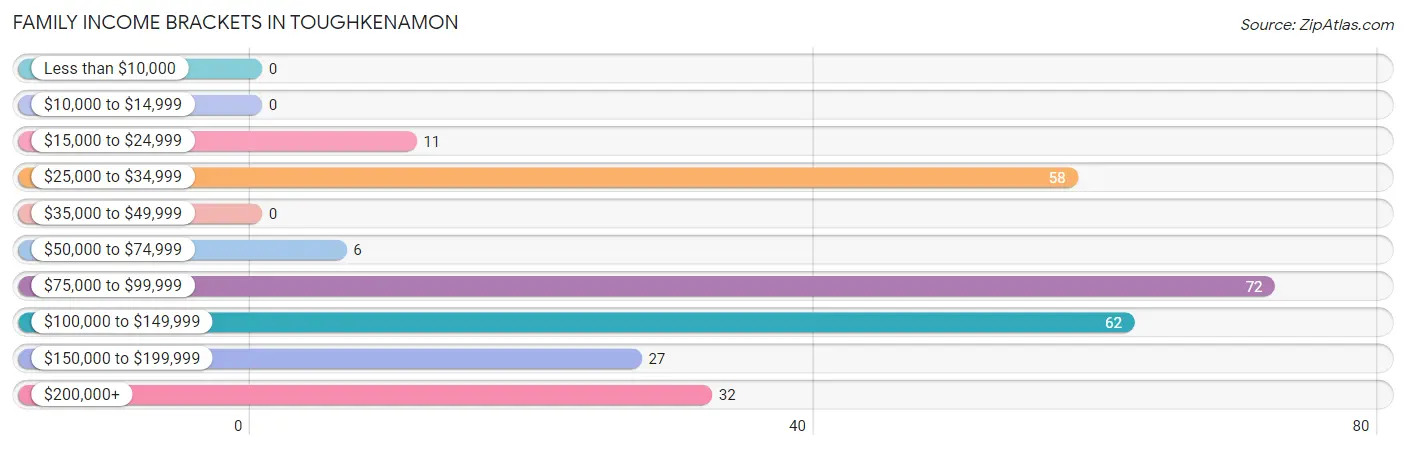
| Income Bracket | # Families | % Families |
| Less than $10,000 | 0 | 0.0% |
| $10,000 to $14,999 | 0 | 0.0% |
| $15,000 to $24,999 | 11 | 4.1% |
| $25,000 to $34,999 | 58 | 21.6% |
| $35,000 to $49,999 | 0 | 0.0% |
| $50,000 to $74,999 | 6 | 2.2% |
| $75,000 to $99,999 | 72 | 26.9% |
| $100,000 to $149,999 | 62 | 23.1% |
| $150,000 to $199,999 | 27 | 10.1% |
| $200,000+ | 32 | 11.9% |
Family Income by Famaliy Size in Toughkenamon
3-person families (48 | 17.9%) account for the highest median family income in Toughkenamon with $118,750 per family, while 3-person families (48 | 17.9%) have the highest median income of $39,583 per family member.
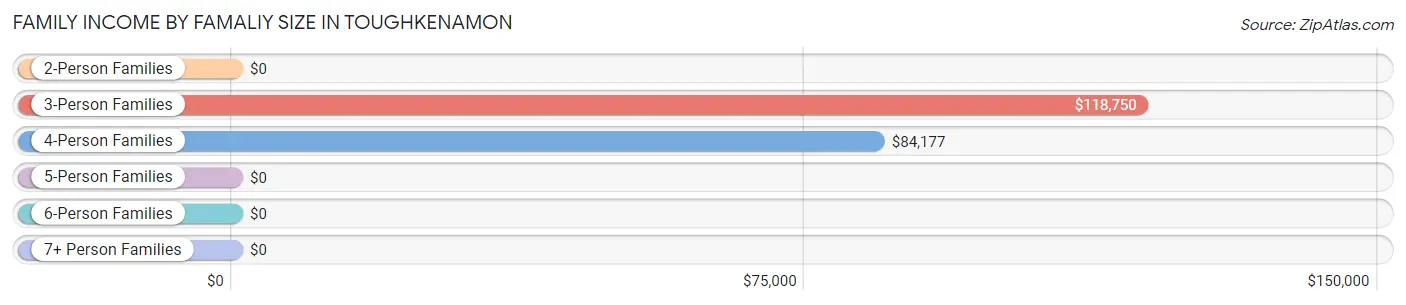
| Income Bracket | # Families | Median Income |
| 2-Person Families | 116 (43.3%) | $0 |
| 3-Person Families | 48 (17.9%) | $118,750 |
| 4-Person Families | 55 (20.5%) | $84,177 |
| 5-Person Families | 33 (12.3%) | $0 |
| 6-Person Families | 14 (5.2%) | $0 |
| 7+ Person Families | 2 (0.7%) | $0 |
| Total | 268 (100.0%) | $94,412 |
Family Income by Number of Earners in Toughkenamon
The median family income in Toughkenamon is $94,412, with families comprising 2 earners (46) having the highest median family income of $154,375, while families with no earners (73) have the lowest median family income of $31,417, accounting for 17.2% and 27.2% of families, respectively.
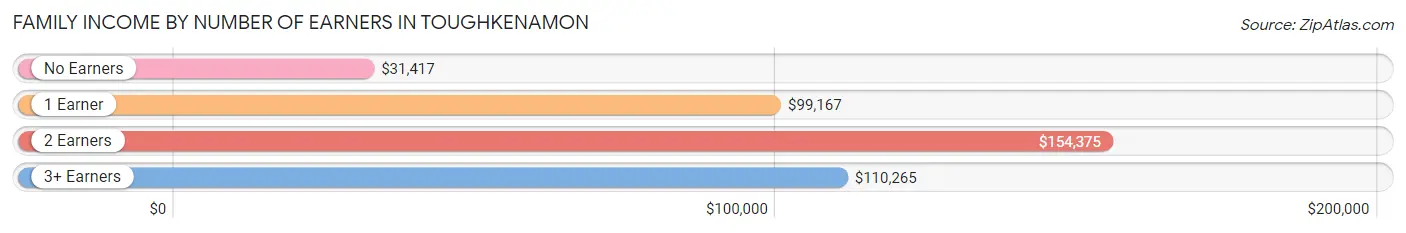
| Number of Earners | # Families | Median Income |
| No Earners | 73 (27.2%) | $31,417 |
| 1 Earner | 26 (9.7%) | $99,167 |
| 2 Earners | 46 (17.2%) | $154,375 |
| 3+ Earners | 123 (45.9%) | $110,265 |
| Total | 268 (100.0%) | $94,412 |
Household Income in Toughkenamon
Household Income Brackets in Toughkenamon
With 75 households falling in the category, the $100,000 to $149,999 income range is the most frequent in Toughkenamon, accounting for 23.7% of all households.
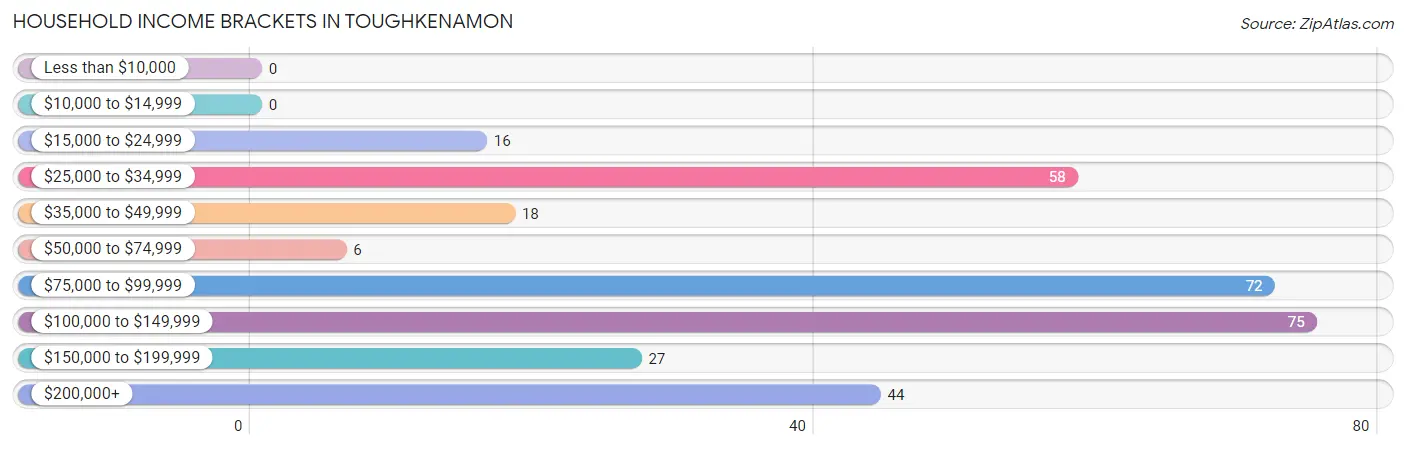
| Income Bracket | # Households | % Households |
| Less than $10,000 | 0 | 0.0% |
| $10,000 to $14,999 | 0 | 0.0% |
| $15,000 to $24,999 | 16 | 5.1% |
| $25,000 to $34,999 | 58 | 18.4% |
| $35,000 to $49,999 | 18 | 5.7% |
| $50,000 to $74,999 | 6 | 1.9% |
| $75,000 to $99,999 | 72 | 22.8% |
| $100,000 to $149,999 | 75 | 23.7% |
| $150,000 to $199,999 | 27 | 8.5% |
| $200,000+ | 44 | 13.9% |
Household Income by Householder Age in Toughkenamon
The median household income in Toughkenamon is $94,559, with the highest median household income of $143,750 found in the 45 to 64 years age bracket for the primary householder. A total of 109 households (34.5%) fall into this category. Meanwhile, the 15 to 24 years age bracket for the primary householder has the lowest median household income of $0, with 17 households (5.4%) in this group.
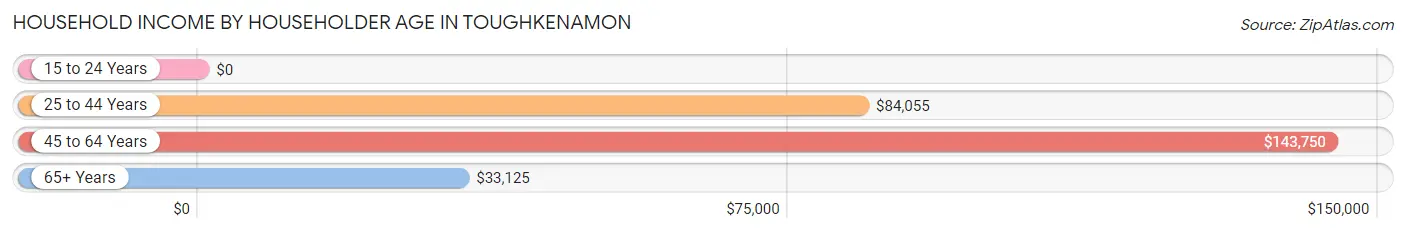
| Income Bracket | # Households | Median Income |
| 15 to 24 Years | 17 (5.4%) | $0 |
| 25 to 44 Years | 65 (20.6%) | $84,055 |
| 45 to 64 Years | 109 (34.5%) | $143,750 |
| 65+ Years | 125 (39.6%) | $33,125 |
| Total | 316 (100.0%) | $94,559 |
Poverty in Toughkenamon
Income Below Poverty by Sex and Age in Toughkenamon
| Age Bracket | Male | Female |
| Under 5 Years | 0 (0.0%) | 0 (0.0%) |
| 5 Years | 0 (0.0%) | 0 (0.0%) |
| 6 to 11 Years | 0 (0.0%) | 0 (0.0%) |
| 12 to 14 Years | 0 (0.0%) | 0 (0.0%) |
| 15 Years | 0 (0.0%) | 0 (0.0%) |
| 16 and 17 Years | 0 (0.0%) | 0 (0.0%) |
| 18 to 24 Years | 0 (0.0%) | 0 (0.0%) |
| 25 to 34 Years | 0 (0.0%) | 0 (0.0%) |
| 35 to 44 Years | 0 (0.0%) | 0 (0.0%) |
| 45 to 54 Years | 0 (0.0%) | 0 (0.0%) |
| 55 to 64 Years | 0 (0.0%) | 0 (0.0%) |
| 65 to 74 Years | 0 (0.0%) | 0 (0.0%) |
| 75 Years and over | 0 (0.0%) | 0 (0.0%) |
| Total | 0 (0.0%) | 0 (0.0%) |
Income Above Poverty by Sex and Age in Toughkenamon
According to the poverty statistics in Toughkenamon, males aged 5 years and females aged under 5 years are the age groups that are most secure financially, with 100.0% of males and 100.0% of females in these age groups living above the poverty line.
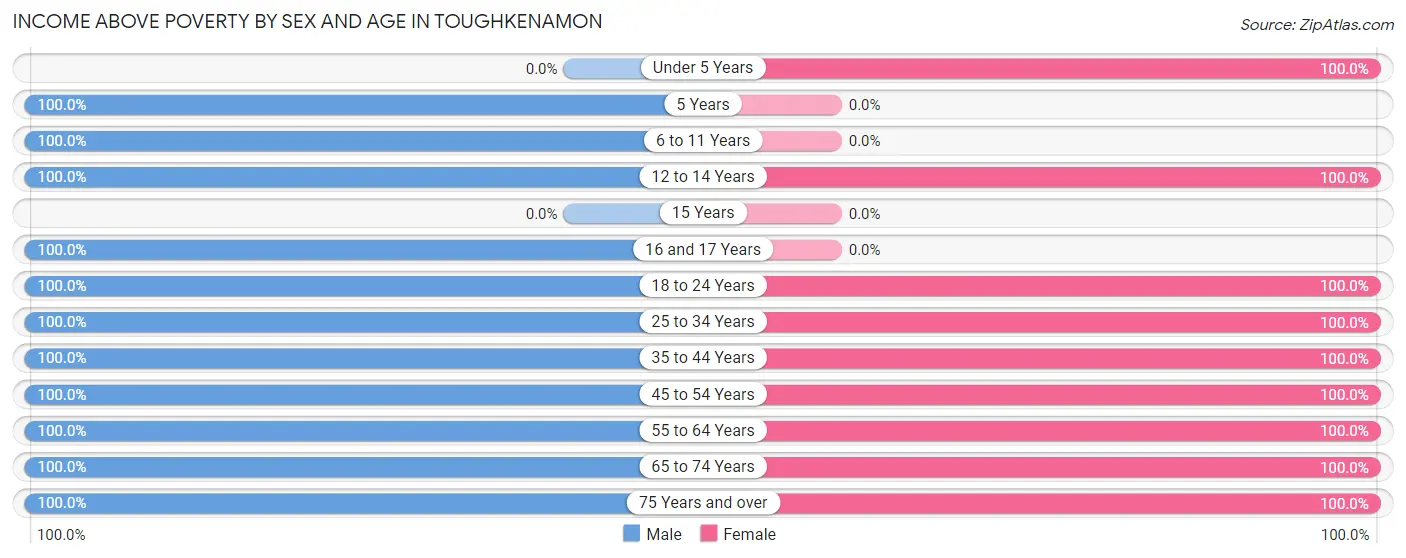
| Age Bracket | Male | Female |
| Under 5 Years | 0 (0.0%) | 36 (100.0%) |
| 5 Years | 16 (100.0%) | 0 (0.0%) |
| 6 to 11 Years | 10 (100.0%) | 0 (0.0%) |
| 12 to 14 Years | 45 (100.0%) | 24 (100.0%) |
| 15 Years | 0 (0.0%) | 0 (0.0%) |
| 16 and 17 Years | 23 (100.0%) | 0 (0.0%) |
| 18 to 24 Years | 41 (100.0%) | 98 (100.0%) |
| 25 to 34 Years | 10 (100.0%) | 49 (100.0%) |
| 35 to 44 Years | 86 (100.0%) | 64 (100.0%) |
| 45 to 54 Years | 55 (100.0%) | 67 (100.0%) |
| 55 to 64 Years | 67 (100.0%) | 47 (100.0%) |
| 65 to 74 Years | 29 (100.0%) | 89 (100.0%) |
| 75 Years and over | 61 (100.0%) | 22 (100.0%) |
| Total | 443 (100.0%) | 496 (100.0%) |
Income Below Poverty Among Married-Couple Families in Toughkenamon
| Children | Above Poverty | Below Poverty |
| No Children | 133 (100.0%) | 0 (0.0%) |
| 1 or 2 Children | 103 (100.0%) | 0 (0.0%) |
| 3 or 4 Children | 2 (100.0%) | 0 (0.0%) |
| 5 or more Children | 0 (0.0%) | 0 (0.0%) |
| Total | 238 (100.0%) | 0 (0.0%) |
Income Below Poverty Among Single-Parent Households in Toughkenamon
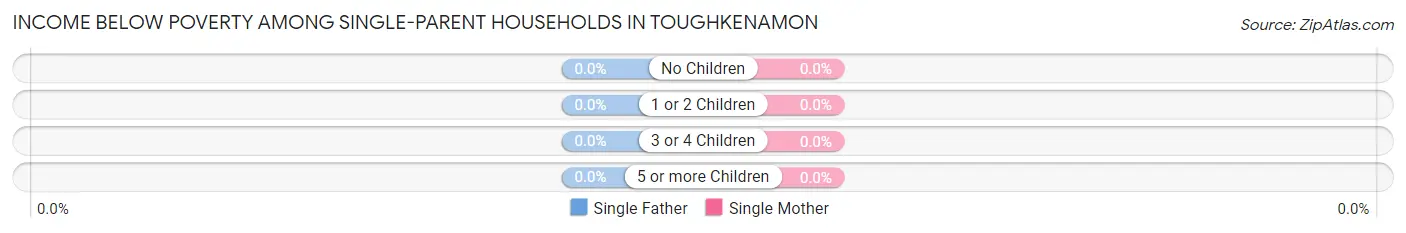
| Children | Single Father | Single Mother |
| No Children | 0 (0.0%) | 0 (0.0%) |
| 1 or 2 Children | 0 (0.0%) | 0 (0.0%) |
| 3 or 4 Children | 0 (0.0%) | 0 (0.0%) |
| 5 or more Children | 0 (0.0%) | 0 (0.0%) |
| Total | 0 (0.0%) | 0 (0.0%) |
Income Below Poverty Among Married-Couple vs Single-Parent Households in Toughkenamon
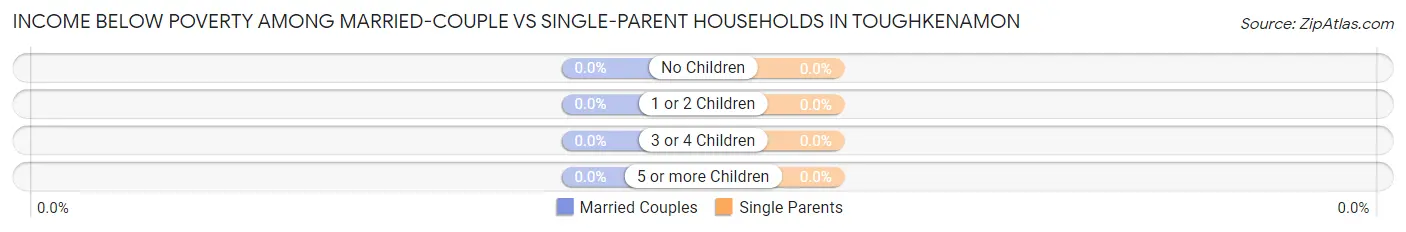
| Children | Married-Couple Families | Single-Parent Households |
| No Children | 0 (0.0%) | 0 (0.0%) |
| 1 or 2 Children | 0 (0.0%) | 0 (0.0%) |
| 3 or 4 Children | 0 (0.0%) | 0 (0.0%) |
| 5 or more Children | 0 (0.0%) | 0 (0.0%) |
| Total | 0 (0.0%) | 0 (0.0%) |
Race in Toughkenamon
The most populous races in Toughkenamon are White / Caucasian (784 | 83.5%), Hispanic or Latino (597 | 63.6%), and Some other Race (100 | 10.6%).
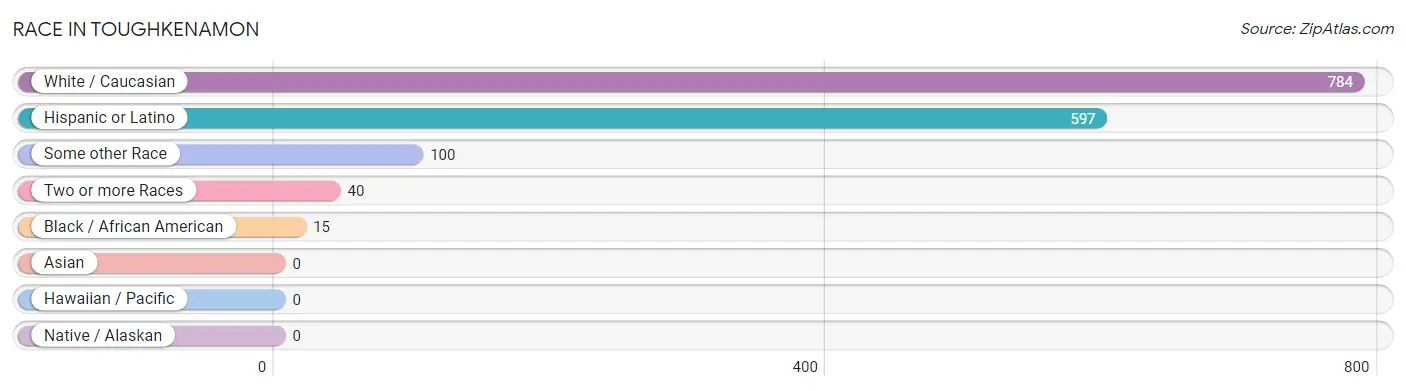
| Race | # Population | % Population |
| Asian | 0 | 0.0% |
| Black / African American | 15 | 1.6% |
| Hawaiian / Pacific | 0 | 0.0% |
| Hispanic or Latino | 597 | 63.6% |
| Native / Alaskan | 0 | 0.0% |
| White / Caucasian | 784 | 83.5% |
| Two or more Races | 40 | 4.3% |
| Some other Race | 100 | 10.6% |
| Total | 939 | 100.0% |
Ancestry in Toughkenamon
The most populous ancestries reported in Toughkenamon are Mexican (571 | 60.8%), Italian (106 | 11.3%), American (45 | 4.8%), German (37 | 3.9%), and English (35 | 3.7%), together accounting for 84.6% of all Toughkenamon residents.
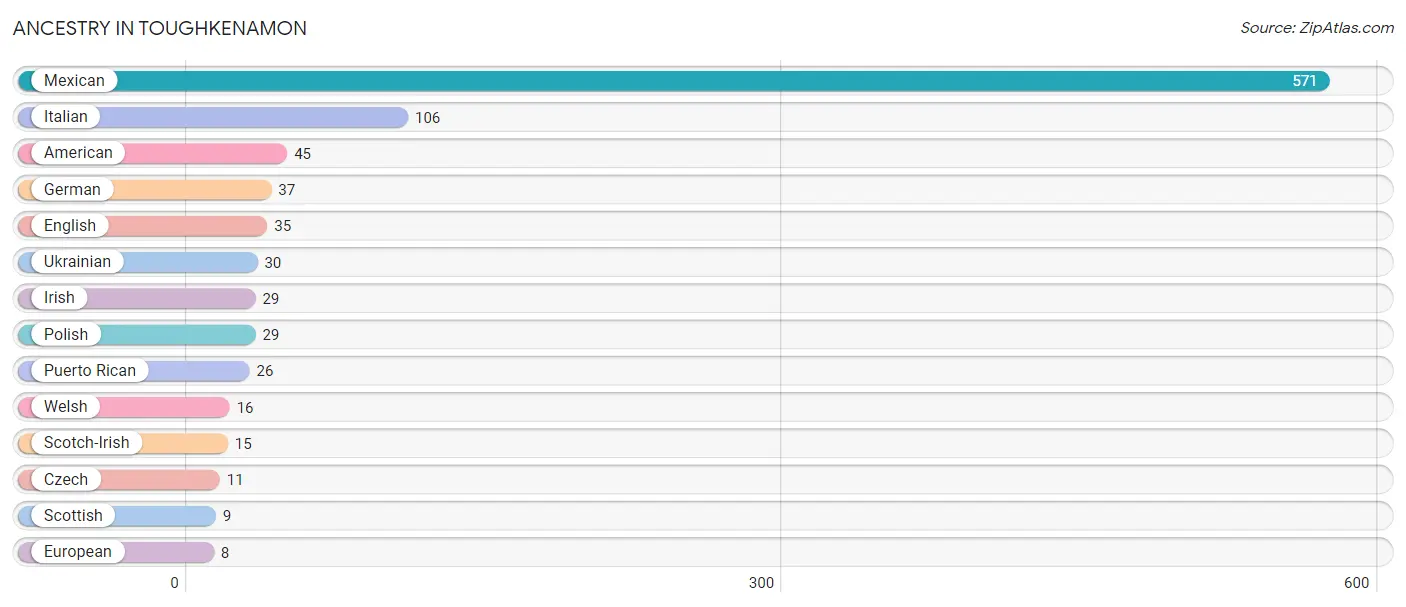
| Ancestry | # Population | % Population |
| American | 45 | 4.8% |
| Czech | 11 | 1.2% |
| English | 35 | 3.7% |
| European | 8 | 0.9% |
| German | 37 | 3.9% |
| Irish | 29 | 3.1% |
| Italian | 106 | 11.3% |
| Mexican | 571 | 60.8% |
| Polish | 29 | 3.1% |
| Puerto Rican | 26 | 2.8% |
| Scotch-Irish | 15 | 1.6% |
| Scottish | 9 | 1.0% |
| Ukrainian | 30 | 3.2% |
| Welsh | 16 | 1.7% | View All 14 Rows |
Immigrants in Toughkenamon
The most numerous immigrant groups reported in Toughkenamon came from Central America (433 | 46.1%), Latin America (433 | 46.1%), and Mexico (433 | 46.1%), together accounting for 138.3% of all Toughkenamon residents.
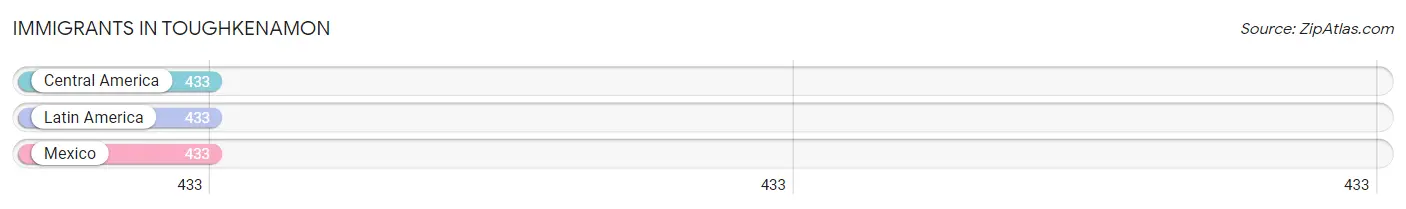
| Immigration Origin | # Population | % Population |
| Central America | 433 | 46.1% |
| Latin America | 433 | 46.1% |
| Mexico | 433 | 46.1% | View All 3 Rows |
Sex and Age in Toughkenamon
Sex and Age in Toughkenamon
The most populous age groups in Toughkenamon are 75 to 79 Years (50 | 11.3%) for men and 70 to 74 Years (76 | 15.3%) for women.
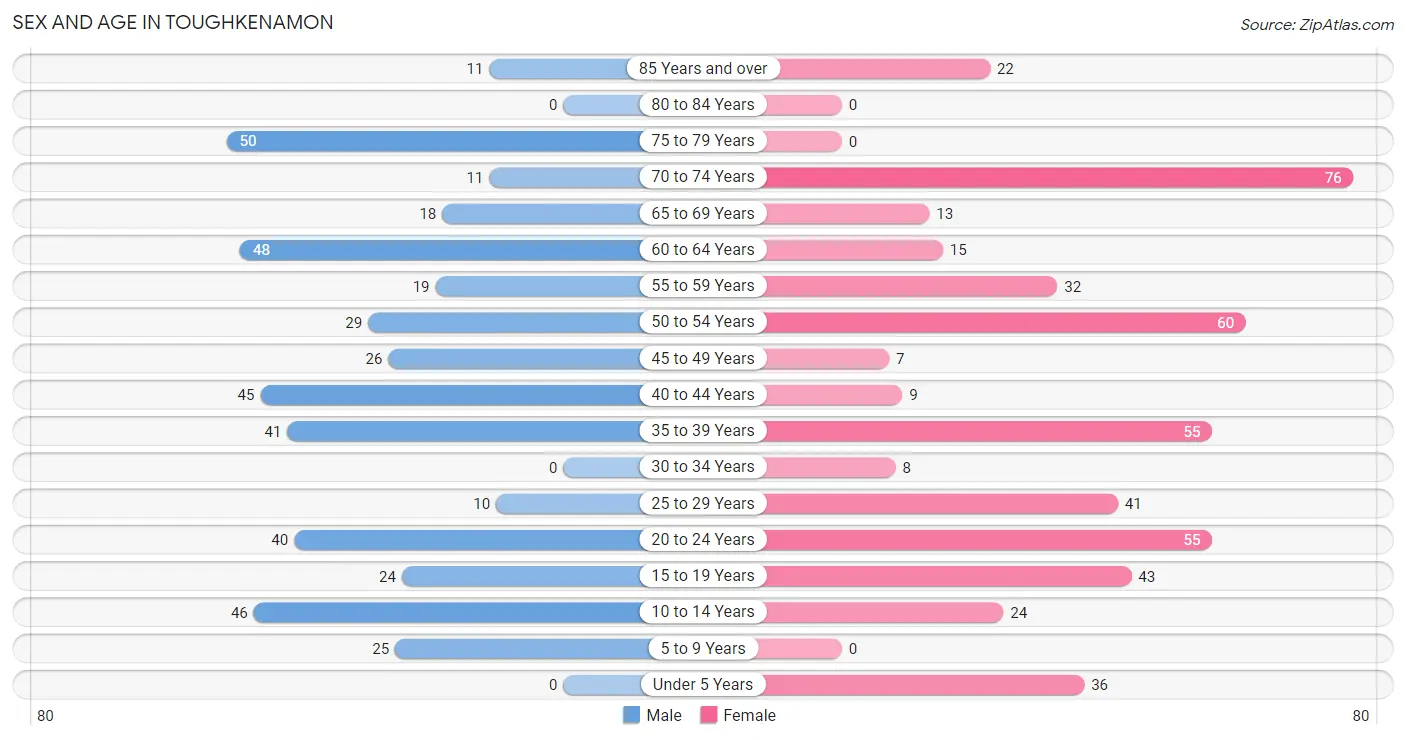
| Age Bracket | Male | Female |
| Under 5 Years | 0 (0.0%) | 36 (7.3%) |
| 5 to 9 Years | 25 (5.6%) | 0 (0.0%) |
| 10 to 14 Years | 46 (10.4%) | 24 (4.8%) |
| 15 to 19 Years | 24 (5.4%) | 43 (8.7%) |
| 20 to 24 Years | 40 (9.0%) | 55 (11.1%) |
| 25 to 29 Years | 10 (2.3%) | 41 (8.3%) |
| 30 to 34 Years | 0 (0.0%) | 8 (1.6%) |
| 35 to 39 Years | 41 (9.3%) | 55 (11.1%) |
| 40 to 44 Years | 45 (10.2%) | 9 (1.8%) |
| 45 to 49 Years | 26 (5.9%) | 7 (1.4%) |
| 50 to 54 Years | 29 (6.6%) | 60 (12.1%) |
| 55 to 59 Years | 19 (4.3%) | 32 (6.5%) |
| 60 to 64 Years | 48 (10.8%) | 15 (3.0%) |
| 65 to 69 Years | 18 (4.1%) | 13 (2.6%) |
| 70 to 74 Years | 11 (2.5%) | 76 (15.3%) |
| 75 to 79 Years | 50 (11.3%) | 0 (0.0%) |
| 80 to 84 Years | 0 (0.0%) | 0 (0.0%) |
| 85 Years and over | 11 (2.5%) | 22 (4.4%) |
| Total | 443 (100.0%) | 496 (100.0%) |
Families and Households in Toughkenamon
Median Family Size in Toughkenamon
The median family size in Toughkenamon is 3.32 persons per family, with single female/mother families (7 | 2.6%) accounting for the largest median family size of 4.71 persons per family. On the other hand, married-couple families (238 | 88.8%) represent the smallest median family size with 3.24 persons per family.
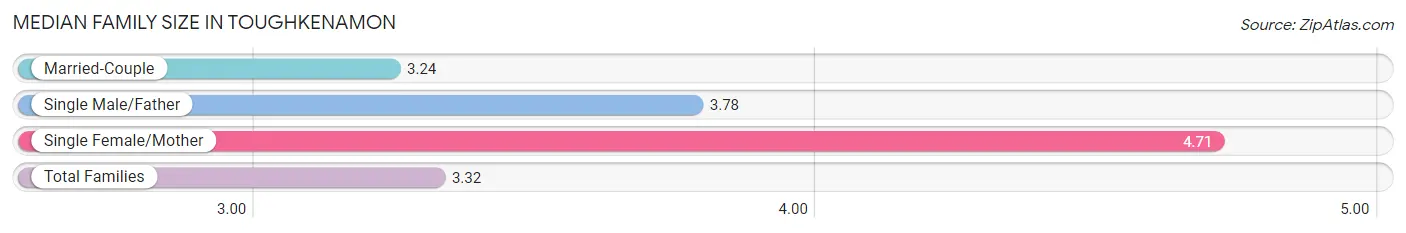
| Family Type | # Families | Family Size |
| Married-Couple | 238 (88.8%) | 3.24 |
| Single Male/Father | 23 (8.6%) | 3.78 |
| Single Female/Mother | 7 (2.6%) | 4.71 |
| Total Families | 268 (100.0%) | 3.32 |
Median Household Size in Toughkenamon
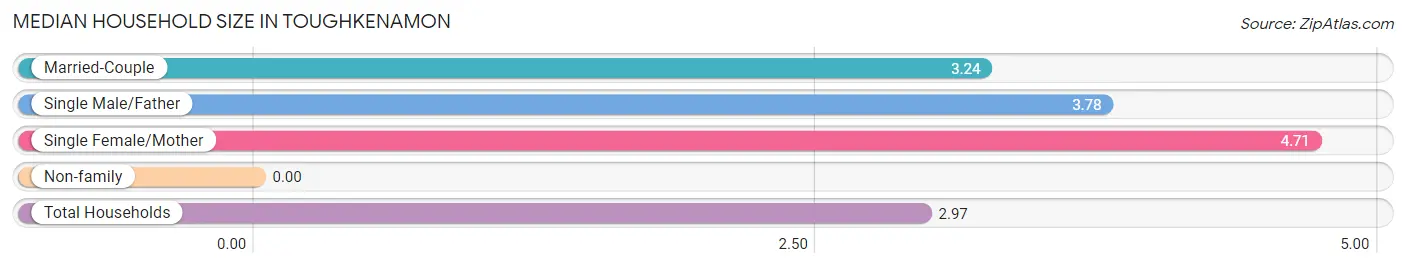
| Household Type | # Households | Household Size |
| Married-Couple | 238 (75.3%) | 3.24 |
| Single Male/Father | 23 (7.3%) | 3.78 |
| Single Female/Mother | 7 (2.2%) | 4.71 |
| Non-family | 48 (15.2%) | - |
| Total Households | 316 (100.0%) | 2.97 |
Household Size by Marriage Status in Toughkenamon
Out of a total of 316 households in Toughkenamon, 268 (84.8%) are family households, while 48 (15.2%) are nonfamily households. The most numerous type of family households are 2-person households, comprising 116, and the most common type of nonfamily households are 1-person households, comprising 48.
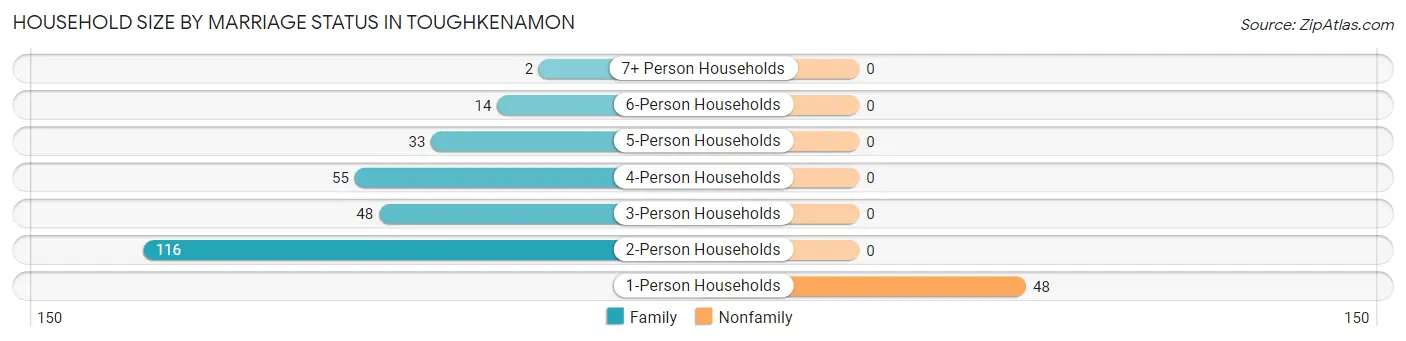
| Household Size | Family Households | Nonfamily Households |
| 1-Person Households | - | 48 (15.2%) |
| 2-Person Households | 116 (36.7%) | 0 (0.0%) |
| 3-Person Households | 48 (15.2%) | 0 (0.0%) |
| 4-Person Households | 55 (17.4%) | 0 (0.0%) |
| 5-Person Households | 33 (10.4%) | 0 (0.0%) |
| 6-Person Households | 14 (4.4%) | 0 (0.0%) |
| 7+ Person Households | 2 (0.6%) | 0 (0.0%) |
| Total | 268 (84.8%) | 48 (15.2%) |
Female Fertility in Toughkenamon
Fertility by Age in Toughkenamon
| Age Bracket | Women with Births | Births / 1,000 Women |
| 15 to 19 years | 0 (0.0%) | 0.0 |
| 20 to 34 years | 0 (0.0%) | 0.0 |
| 35 to 50 years | 0 (0.0%) | 0.0 |
| Total | 0 (0.0%) | 0.0 |
Fertility by Age by Marriage Status in Toughkenamon
| Age Bracket | Married | Unmarried |
| 15 to 19 years | 0 (0.0%) | 0 (0.0%) |
| 20 to 34 years | 0 (0.0%) | 0 (0.0%) |
| 35 to 50 years | 0 (0.0%) | 0 (0.0%) |
| Total | 0 (0.0%) | 0 (0.0%) |
Fertility by Education in Toughkenamon
| Educational Attainment | Women with Births | Births / 1,000 Women |
| Less than High School | 0 (0.0%) | 0.0 |
| High School Diploma | 0 (0.0%) | 0.0 |
| College or Associate's Degree | 0 (0.0%) | 0.0 |
| Bachelor's Degree | 0 (0.0%) | 0.0 |
| Graduate Degree | 0 (0.0%) | 0.0 |
| Total | 0 (0.0%) | 0.0 |
Fertility by Education by Marriage Status in Toughkenamon
| Educational Attainment | Married | Unmarried |
| Less than High School | 0 (0.0%) | 0 (0.0%) |
| High School Diploma | 0 (0.0%) | 0 (0.0%) |
| College or Associate's Degree | 0 (0.0%) | 0 (0.0%) |
| Bachelor's Degree | 0 (0.0%) | 0 (0.0%) |
| Graduate Degree | 0 (0.0%) | 0 (0.0%) |
| Total | 0 (0.0%) | 0 (0.0%) |
Employment Characteristics in Toughkenamon
Employment by Class of Employer in Toughkenamon
Among the 496 employed individuals in Toughkenamon, private company employees (329 | 66.3%), self-employed (incorporated) (80 | 16.1%), and not-for-profit organizations (70 | 14.1%) make up the most common classes of employment.
| Employer Class | # Employees | % Employees |
| Private Company Employees | 329 | 66.3% |
| Self-Employed (Incorporated) | 80 | 16.1% |
| Self-Employed (Not Incorporated) | 17 | 3.4% |
| Not-for-profit Organizations | 70 | 14.1% |
| Local Government Employees | 0 | 0.0% |
| State Government Employees | 0 | 0.0% |
| Federal Government Employees | 0 | 0.0% |
| Unpaid Family Workers | 0 | 0.0% |
| Total | 496 | 100.0% |
Employment Status by Age in Toughkenamon
According to the labor force statistics for Toughkenamon, out of the total population over 16 years of age (808), 62.0% or 501 individuals are in the labor force, with 1.0% or 5 of them unemployed. The age group with the highest labor force participation rate is 25 to 29 years, with 100.0% or 51 individuals in the labor force. Within the labor force, the 75 years and over age range has the highest percentage of unemployed individuals, with 100.0% or 5 of them being unemployed.
| Age Bracket | In Labor Force | Unemployed |
| 16 to 19 Years | 1 (1.5%) | 0 (0.0%) |
| 20 to 24 Years | 67 (70.5%) | 0 (0.0%) |
| 25 to 29 Years | 51 (100.0%) | 0 (0.0%) |
| 30 to 34 Years | 8 (100.0%) | 0 (0.0%) |
| 35 to 44 Years | 141 (94.0%) | 0 (0.0%) |
| 45 to 54 Years | 122 (100.0%) | 0 (0.0%) |
| 55 to 59 Years | 36 (70.6%) | 0 (0.0%) |
| 60 to 64 Years | 53 (84.1%) | 0 (0.0%) |
| 65 to 74 Years | 17 (14.4%) | 0 (0.0%) |
| 75 Years and over | 5 (6.0%) | 5 (100.0%) |
| Total | 501 (62.0%) | 5 (1.0%) |
Employment Status by Educational Attainment in Toughkenamon
| Educational Attainment | In Labor Force | Unemployed |
| Less than High School | 240 (100.0%) | 0 (0.0%) |
| High School Diploma | 74 (82.2%) | 0 (0.0%) |
| College / Associate Degree | 44 (100.0%) | 0 (0.0%) |
| Bachelor's Degree or higher | 53 (74.6%) | 0 (0.0%) |
| Total | 411 (92.4%) | 0 (0.0%) |
Employment Occupations by Sex in Toughkenamon
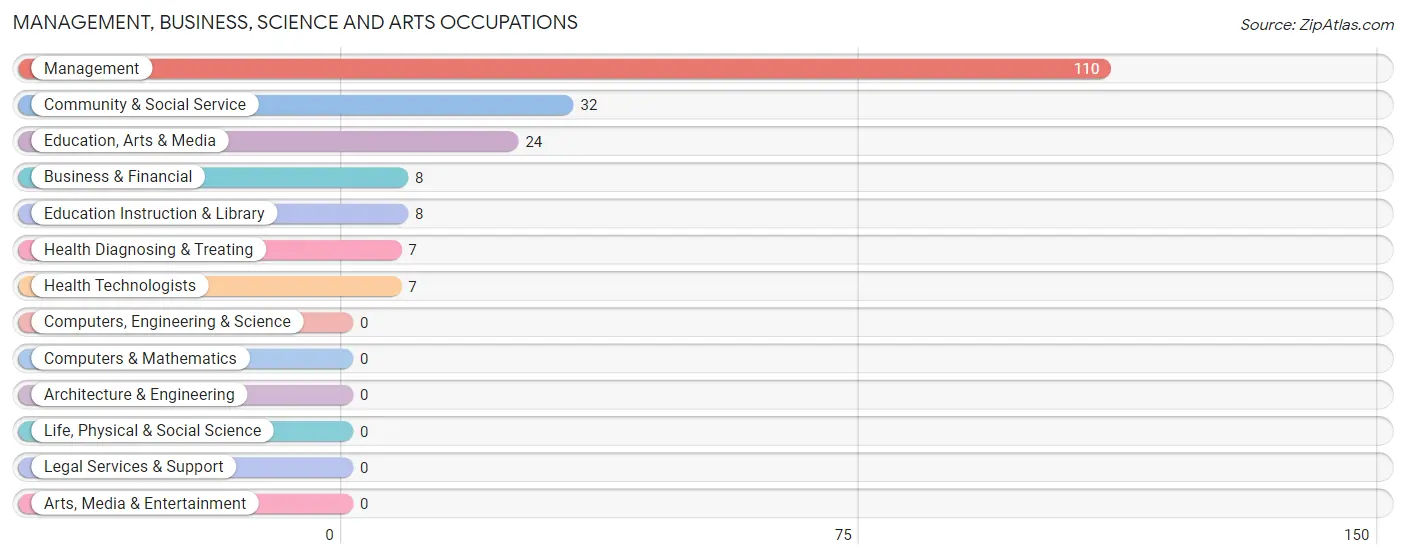
Management, Business, Science and Arts Occupations
The most common Management, Business, Science and Arts occupations in Toughkenamon are Management (110 | 22.2%), Community & Social Service (32 | 6.5%), Education, Arts & Media (24 | 4.8%), Business & Financial (8 | 1.6%), and Education Instruction & Library (8 | 1.6%).
Management, Business, Science and Arts Occupations by Sex
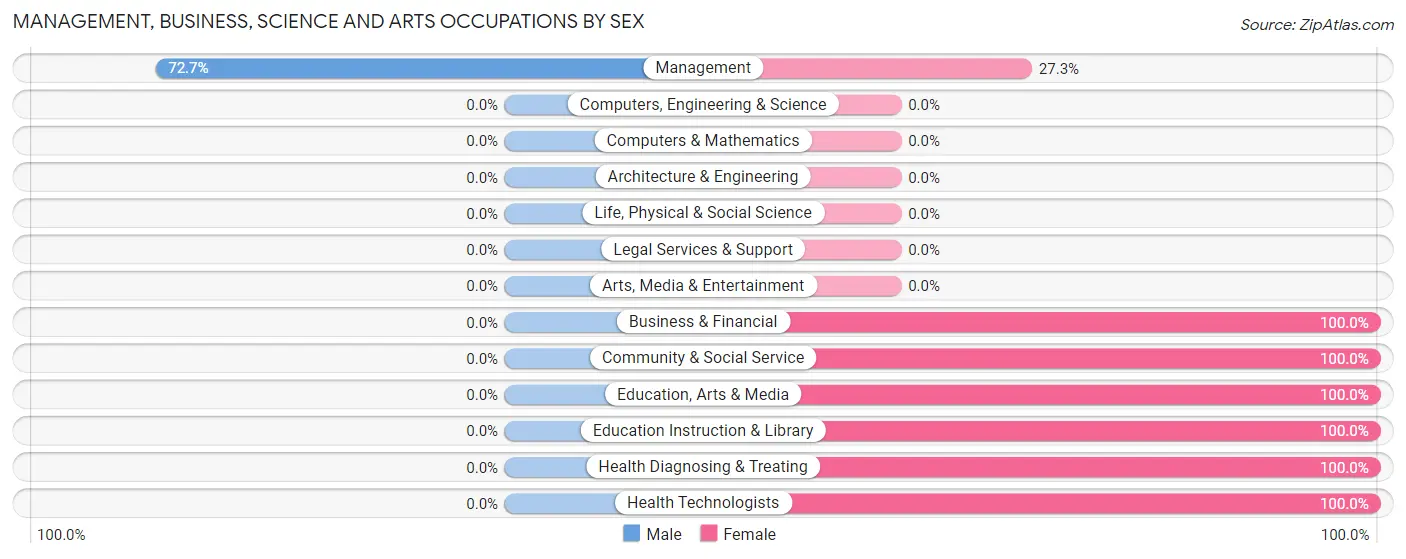
| Occupation | Male | Female |
| Management | 80 (72.7%) | 30 (27.3%) |
| Business & Financial | 0 (0.0%) | 8 (100.0%) |
| Computers, Engineering & Science | 0 (0.0%) | 0 (0.0%) |
| Computers & Mathematics | 0 (0.0%) | 0 (0.0%) |
| Architecture & Engineering | 0 (0.0%) | 0 (0.0%) |
| Life, Physical & Social Science | 0 (0.0%) | 0 (0.0%) |
| Community & Social Service | 0 (0.0%) | 32 (100.0%) |
| Education, Arts & Media | 0 (0.0%) | 24 (100.0%) |
| Legal Services & Support | 0 (0.0%) | 0 (0.0%) |
| Education Instruction & Library | 0 (0.0%) | 8 (100.0%) |
| Arts, Media & Entertainment | 0 (0.0%) | 0 (0.0%) |
| Health Diagnosing & Treating | 0 (0.0%) | 7 (100.0%) |
| Health Technologists | 0 (0.0%) | 7 (100.0%) |
| Total (Category) | 80 (51.0%) | 77 (49.0%) |
| Total (Overall) | 258 (52.0%) | 238 (48.0%) |
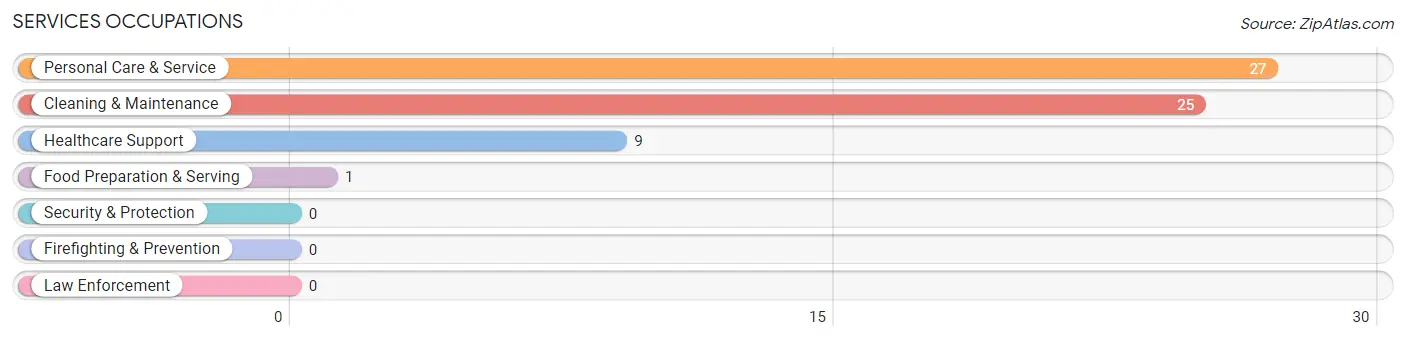
Services Occupations
The most common Services occupations in Toughkenamon are Personal Care & Service (27 | 5.4%), Cleaning & Maintenance (25 | 5.0%), Healthcare Support (9 | 1.8%), and Food Preparation & Serving (1 | 0.2%).
Services Occupations by Sex
Within the Services occupations in Toughkenamon, the most male-oriented occupations are Food Preparation & Serving (100.0%), and Cleaning & Maintenance (100.0%), while the most female-oriented occupations are Healthcare Support (100.0%), and Personal Care & Service (100.0%).
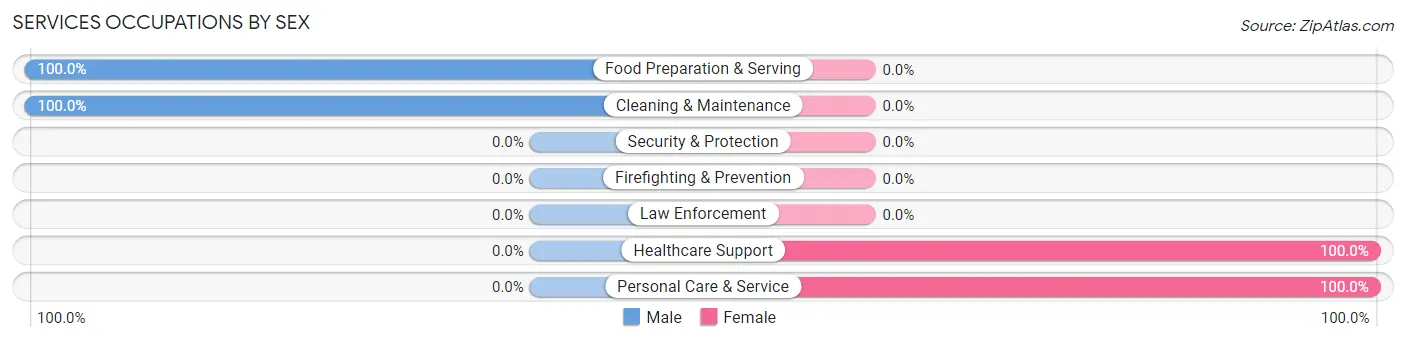
| Occupation | Male | Female |
| Healthcare Support | 0 (0.0%) | 9 (100.0%) |
| Security & Protection | 0 (0.0%) | 0 (0.0%) |
| Firefighting & Prevention | 0 (0.0%) | 0 (0.0%) |
| Law Enforcement | 0 (0.0%) | 0 (0.0%) |
| Food Preparation & Serving | 1 (100.0%) | 0 (0.0%) |
| Cleaning & Maintenance | 25 (100.0%) | 0 (0.0%) |
| Personal Care & Service | 0 (0.0%) | 27 (100.0%) |
| Total (Category) | 26 (41.9%) | 36 (58.1%) |
| Total (Overall) | 258 (52.0%) | 238 (48.0%) |
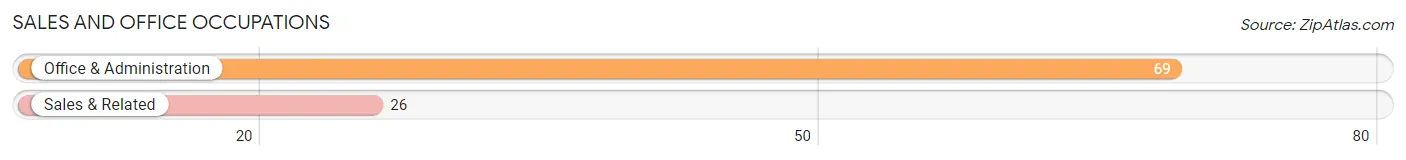
Sales and Office Occupations
The most common Sales and Office occupations in Toughkenamon are Office & Administration (69 | 13.9%), and Sales & Related (26 | 5.2%).
Sales and Office Occupations by Sex
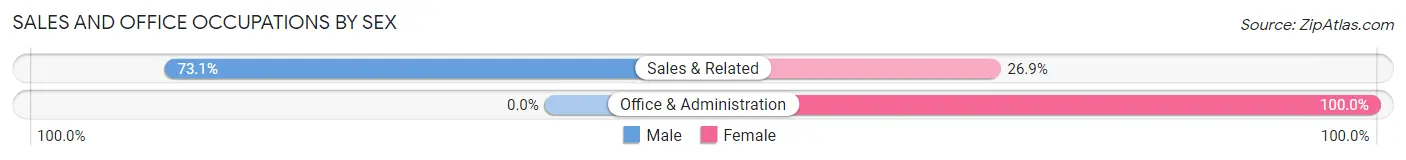
| Occupation | Male | Female |
| Sales & Related | 19 (73.1%) | 7 (26.9%) |
| Office & Administration | 0 (0.0%) | 69 (100.0%) |
| Total (Category) | 19 (20.0%) | 76 (80.0%) |
| Total (Overall) | 258 (52.0%) | 238 (48.0%) |
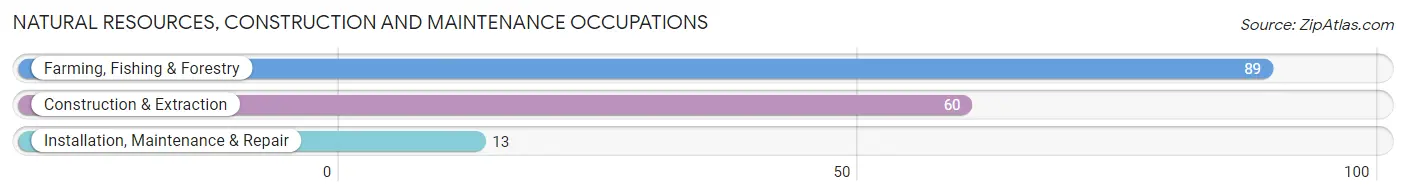
Natural Resources, Construction and Maintenance Occupations
The most common Natural Resources, Construction and Maintenance occupations in Toughkenamon are Farming, Fishing & Forestry (89 | 17.9%), Construction & Extraction (60 | 12.1%), and Installation, Maintenance & Repair (13 | 2.6%).
Natural Resources, Construction and Maintenance Occupations by Sex
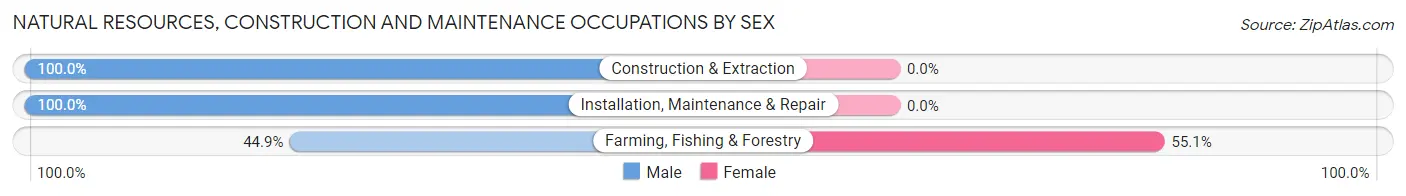
| Occupation | Male | Female |
| Farming, Fishing & Forestry | 40 (44.9%) | 49 (55.1%) |
| Construction & Extraction | 60 (100.0%) | 0 (0.0%) |
| Installation, Maintenance & Repair | 13 (100.0%) | 0 (0.0%) |
| Total (Category) | 113 (69.8%) | 49 (30.2%) |
| Total (Overall) | 258 (52.0%) | 238 (48.0%) |
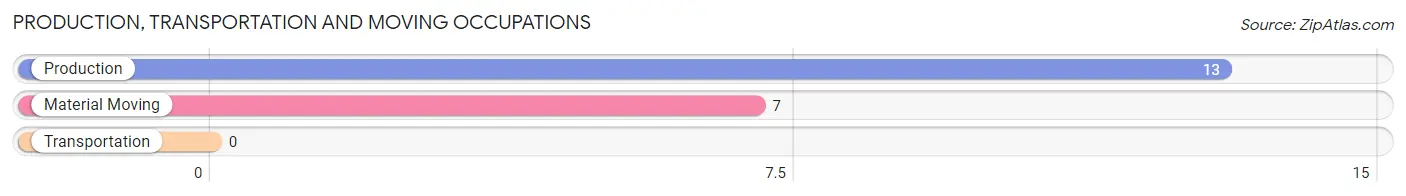
Production, Transportation and Moving Occupations
The most common Production, Transportation and Moving occupations in Toughkenamon are Production (13 | 2.6%), and Material Moving (7 | 1.4%).
Production, Transportation and Moving Occupations by Sex
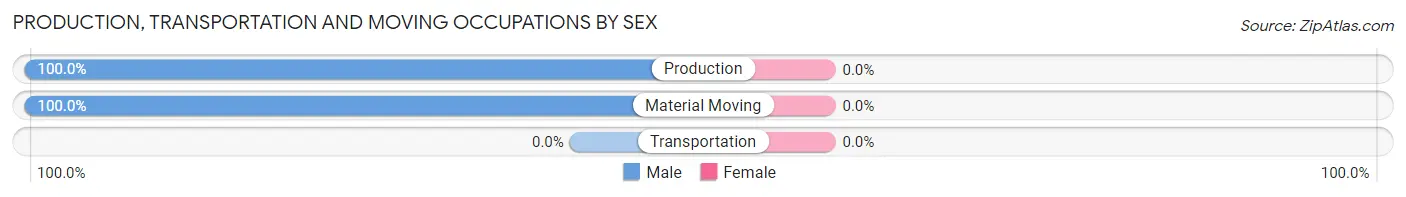
| Occupation | Male | Female |
| Production | 13 (100.0%) | 0 (0.0%) |
| Transportation | 0 (0.0%) | 0 (0.0%) |
| Material Moving | 7 (100.0%) | 0 (0.0%) |
| Total (Category) | 20 (100.0%) | 0 (0.0%) |
| Total (Overall) | 258 (52.0%) | 238 (48.0%) |
Employment Industries by Sex in Toughkenamon
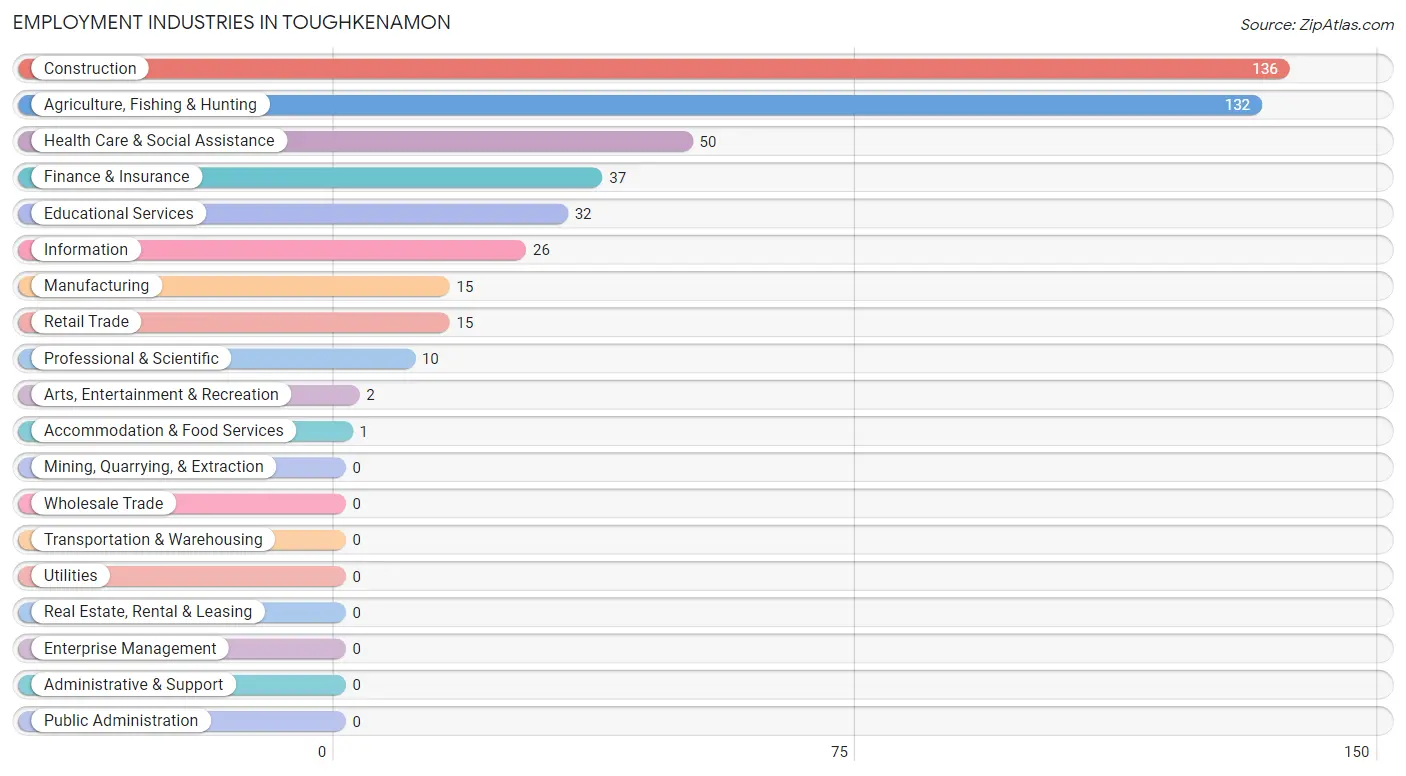
Employment Industries in Toughkenamon
The major employment industries in Toughkenamon include Construction (136 | 27.4%), Agriculture, Fishing & Hunting (132 | 26.6%), Health Care & Social Assistance (50 | 10.1%), Finance & Insurance (37 | 7.5%), and Educational Services (32 | 6.5%).
Employment Industries by Sex in Toughkenamon
The Toughkenamon industries that see more men than women are Manufacturing (100.0%), Professional & Scientific (100.0%), and Accommodation & Food Services (100.0%), whereas the industries that tend to have a higher number of women are Educational Services (100.0%), Health Care & Social Assistance (100.0%), and Arts, Entertainment & Recreation (100.0%).
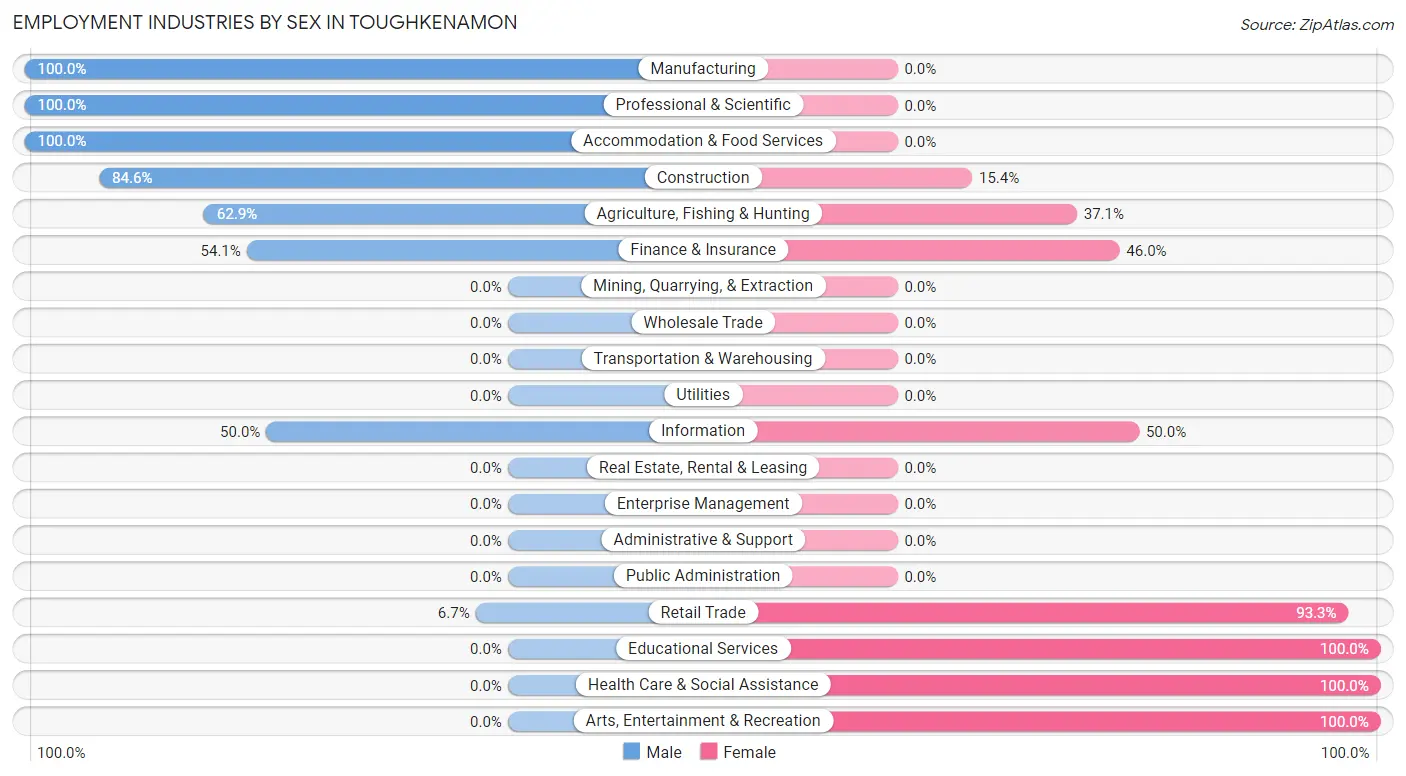
| Industry | Male | Female |
| Agriculture, Fishing & Hunting | 83 (62.9%) | 49 (37.1%) |
| Mining, Quarrying, & Extraction | 0 (0.0%) | 0 (0.0%) |
| Construction | 115 (84.6%) | 21 (15.4%) |
| Manufacturing | 15 (100.0%) | 0 (0.0%) |
| Wholesale Trade | 0 (0.0%) | 0 (0.0%) |
| Retail Trade | 1 (6.7%) | 14 (93.3%) |
| Transportation & Warehousing | 0 (0.0%) | 0 (0.0%) |
| Utilities | 0 (0.0%) | 0 (0.0%) |
| Information | 13 (50.0%) | 13 (50.0%) |
| Finance & Insurance | 20 (54.0%) | 17 (46.0%) |
| Real Estate, Rental & Leasing | 0 (0.0%) | 0 (0.0%) |
| Professional & Scientific | 10 (100.0%) | 0 (0.0%) |
| Enterprise Management | 0 (0.0%) | 0 (0.0%) |
| Administrative & Support | 0 (0.0%) | 0 (0.0%) |
| Educational Services | 0 (0.0%) | 32 (100.0%) |
| Health Care & Social Assistance | 0 (0.0%) | 50 (100.0%) |
| Arts, Entertainment & Recreation | 0 (0.0%) | 2 (100.0%) |
| Accommodation & Food Services | 1 (100.0%) | 0 (0.0%) |
| Public Administration | 0 (0.0%) | 0 (0.0%) |
| Total | 258 (52.0%) | 238 (48.0%) |
Education in Toughkenamon
School Enrollment in Toughkenamon
The most common levels of schooling among the 191 students in Toughkenamon are middle school (69 | 36.1%), college / undergraduate (65 | 34.0%), and high school (25 | 13.1%).
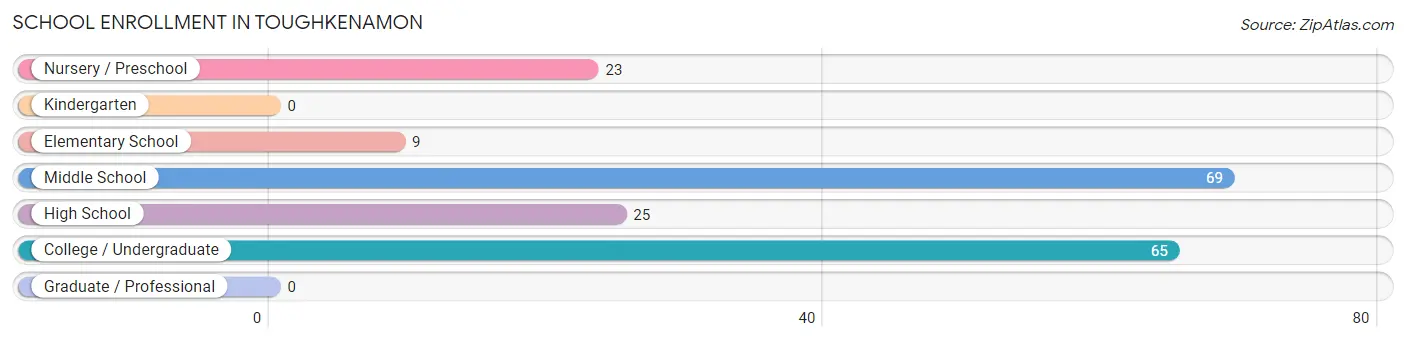
| School Level | # Students | % Students |
| Nursery / Preschool | 23 | 12.0% |
| Kindergarten | 0 | 0.0% |
| Elementary School | 9 | 4.7% |
| Middle School | 69 | 36.1% |
| High School | 25 | 13.1% |
| College / Undergraduate | 65 | 34.0% |
| Graduate / Professional | 0 | 0.0% |
| Total | 191 | 100.0% |
School Enrollment by Age by Funding Source in Toughkenamon
Out of a total of 191 students who are enrolled in schools in Toughkenamon, 25 (13.1%) attend a private institution, while the remaining 166 (86.9%) are enrolled in public schools. The age group of 25 to 34 year olds has the highest likelihood of being enrolled in private schools, with 9 (100.0% in the age bracket) enrolled. Conversely, the age group of 15 to 17 year olds has the lowest likelihood of being enrolled in a private school, with 23 (100.0% in the age bracket) attending a public institution.
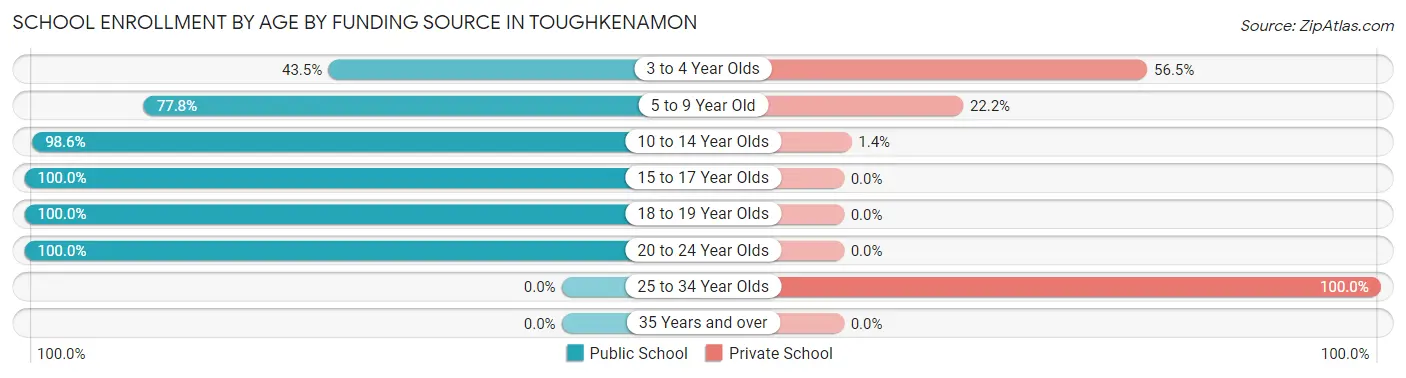
| Age Bracket | Public School | Private School |
| 3 to 4 Year Olds | 10 (43.5%) | 13 (56.5%) |
| 5 to 9 Year Old | 7 (77.8%) | 2 (22.2%) |
| 10 to 14 Year Olds | 69 (98.6%) | 1 (1.4%) |
| 15 to 17 Year Olds | 23 (100.0%) | 0 (0.0%) |
| 18 to 19 Year Olds | 44 (100.0%) | 0 (0.0%) |
| 20 to 24 Year Olds | 13 (100.0%) | 0 (0.0%) |
| 25 to 34 Year Olds | 0 (0.0%) | 9 (100.0%) |
| 35 Years and over | 0 (0.0%) | 0 (0.0%) |
| Total | 166 (86.9%) | 25 (13.1%) |
Educational Attainment by Field of Study in Toughkenamon
Science & technology (51 | 35.9%), business (20 | 14.1%), computers & mathematics (19 | 13.4%), psychology (16 | 11.3%), and education (12 | 8.5%) are the most common fields of study among 142 individuals in Toughkenamon who have obtained a bachelor's degree or higher.
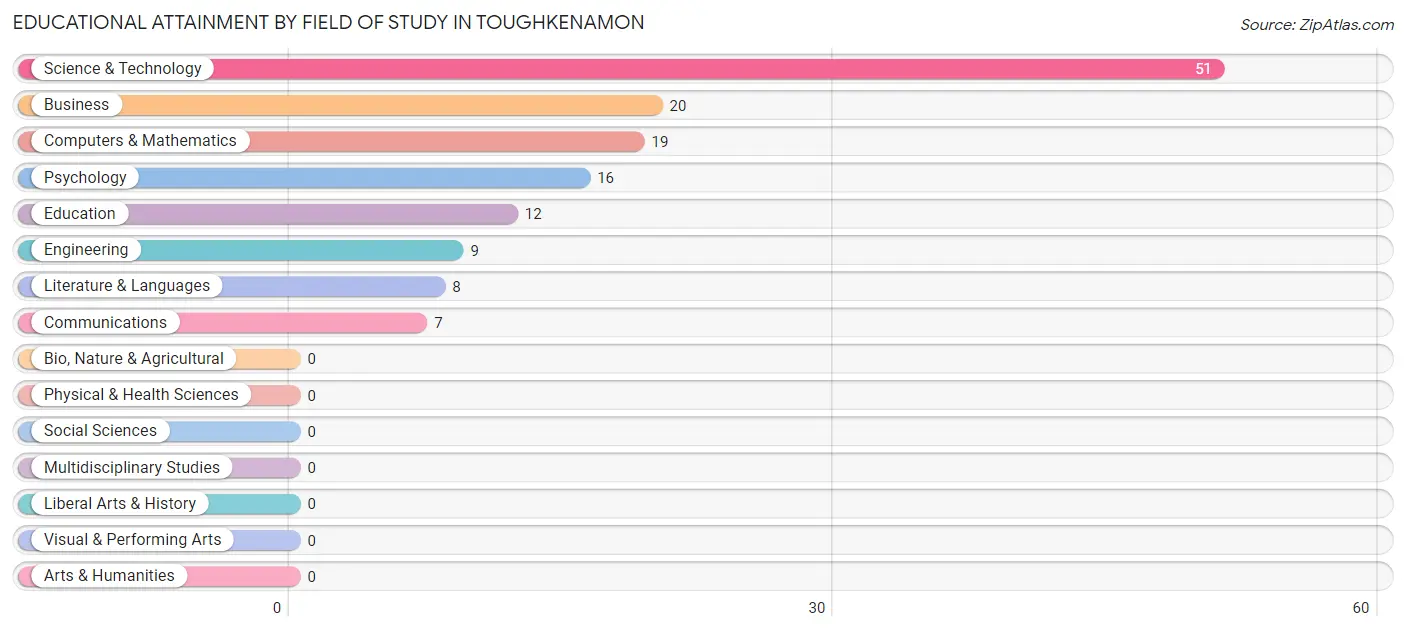
| Field of Study | # Graduates | % Graduates |
| Computers & Mathematics | 19 | 13.4% |
| Bio, Nature & Agricultural | 0 | 0.0% |
| Physical & Health Sciences | 0 | 0.0% |
| Psychology | 16 | 11.3% |
| Social Sciences | 0 | 0.0% |
| Engineering | 9 | 6.3% |
| Multidisciplinary Studies | 0 | 0.0% |
| Science & Technology | 51 | 35.9% |
| Business | 20 | 14.1% |
| Education | 12 | 8.5% |
| Literature & Languages | 8 | 5.6% |
| Liberal Arts & History | 0 | 0.0% |
| Visual & Performing Arts | 0 | 0.0% |
| Communications | 7 | 4.9% |
| Arts & Humanities | 0 | 0.0% |
| Total | 142 | 100.0% |
Transportation & Commute in Toughkenamon
Vehicle Availability by Sex in Toughkenamon
The most prevalent vehicle ownership categories in Toughkenamon are males with 2 vehicles (116, accounting for 45.0%) and females with 2 vehicles (89, making up 48.7%).
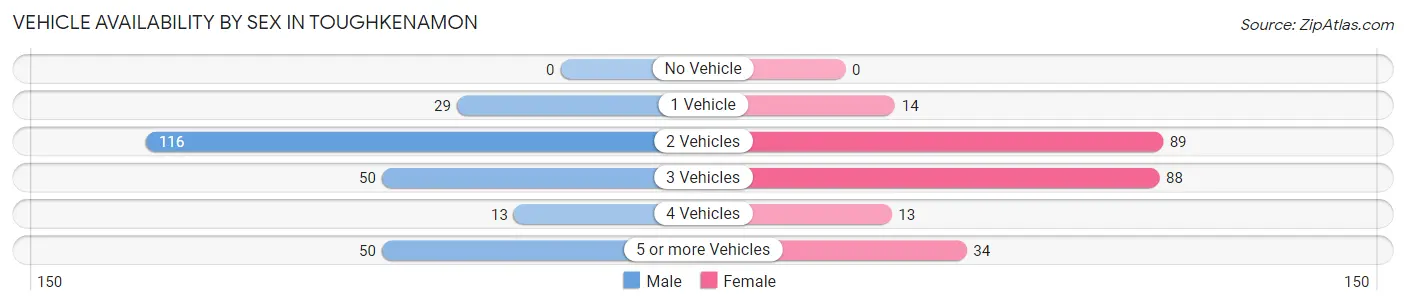
| Vehicles Available | Male | Female |
| No Vehicle | 0 (0.0%) | 0 (0.0%) |
| 1 Vehicle | 29 (11.2%) | 14 (5.9%) |
| 2 Vehicles | 116 (45.0%) | 89 (37.4%) |
| 3 Vehicles | 50 (19.4%) | 88 (37.0%) |
| 4 Vehicles | 13 (5.0%) | 13 (5.5%) |
| 5 or more Vehicles | 50 (19.4%) | 34 (14.3%) |
| Total | 258 (100.0%) | 238 (100.0%) |
Commute Time in Toughkenamon
The most frequently occuring commute durations in Toughkenamon are 5 to 9 minutes (119 commuters, 27.6%), 10 to 14 minutes (113 commuters, 26.2%), and less than 5 minutes (54 commuters, 12.5%).
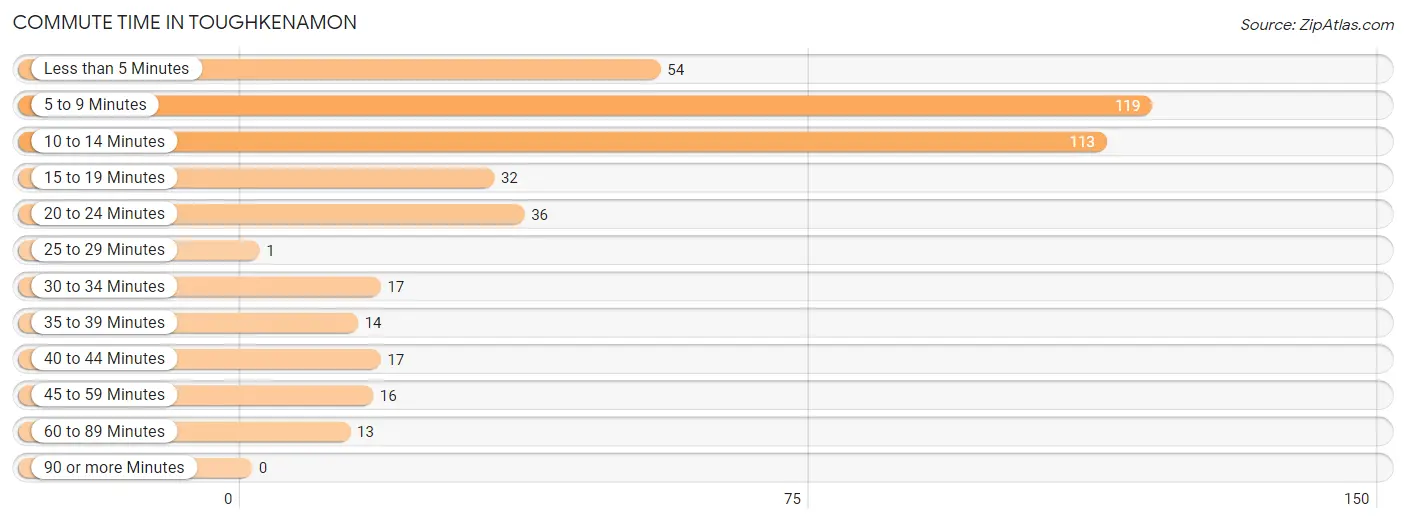
| Commute Time | # Commuters | % Commuters |
| Less than 5 Minutes | 54 | 12.5% |
| 5 to 9 Minutes | 119 | 27.6% |
| 10 to 14 Minutes | 113 | 26.2% |
| 15 to 19 Minutes | 32 | 7.4% |
| 20 to 24 Minutes | 36 | 8.3% |
| 25 to 29 Minutes | 1 | 0.2% |
| 30 to 34 Minutes | 17 | 3.9% |
| 35 to 39 Minutes | 14 | 3.2% |
| 40 to 44 Minutes | 17 | 3.9% |
| 45 to 59 Minutes | 16 | 3.7% |
| 60 to 89 Minutes | 13 | 3.0% |
| 90 or more Minutes | 0 | 0.0% |
Commute Time by Sex in Toughkenamon
The most common commute times in Toughkenamon are 5 to 9 minutes (82 commuters, 32.8%) for males and 10 to 14 minutes (51 commuters, 28.0%) for females.
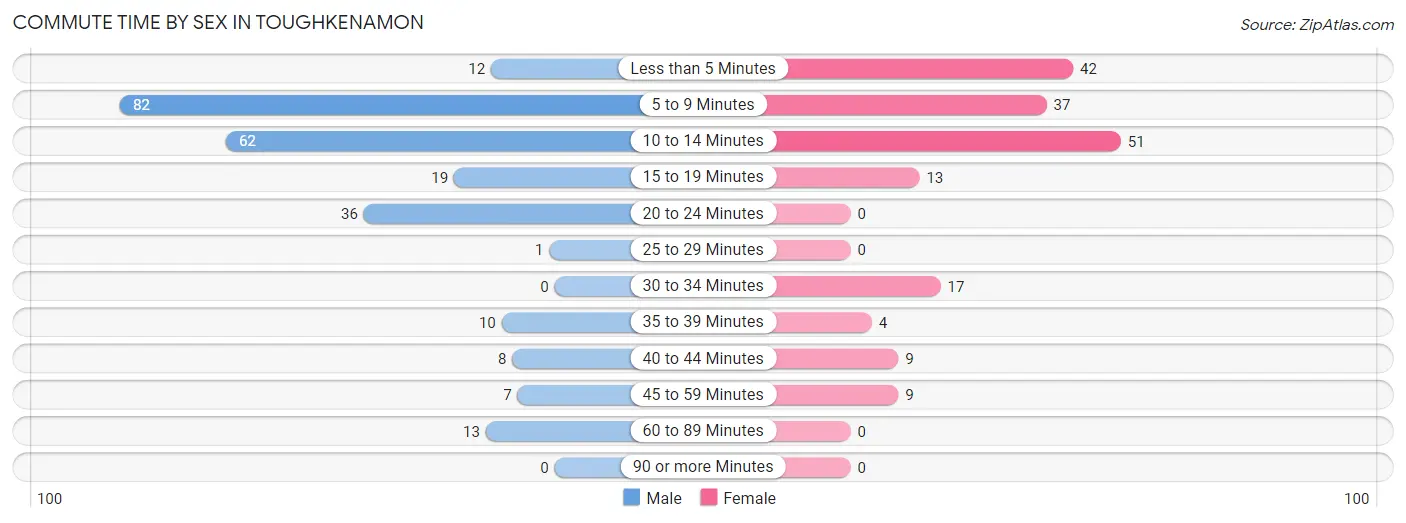
| Commute Time | Male | Female |
| Less than 5 Minutes | 12 (4.8%) | 42 (23.1%) |
| 5 to 9 Minutes | 82 (32.8%) | 37 (20.3%) |
| 10 to 14 Minutes | 62 (24.8%) | 51 (28.0%) |
| 15 to 19 Minutes | 19 (7.6%) | 13 (7.1%) |
| 20 to 24 Minutes | 36 (14.4%) | 0 (0.0%) |
| 25 to 29 Minutes | 1 (0.4%) | 0 (0.0%) |
| 30 to 34 Minutes | 0 (0.0%) | 17 (9.3%) |
| 35 to 39 Minutes | 10 (4.0%) | 4 (2.2%) |
| 40 to 44 Minutes | 8 (3.2%) | 9 (5.0%) |
| 45 to 59 Minutes | 7 (2.8%) | 9 (5.0%) |
| 60 to 89 Minutes | 13 (5.2%) | 0 (0.0%) |
| 90 or more Minutes | 0 (0.0%) | 0 (0.0%) |
Time of Departure to Work by Sex in Toughkenamon
The most frequent times of departure to work in Toughkenamon are 6:00 AM to 6:29 AM (107, 42.8%) for males and 7:00 AM to 7:29 AM (51, 28.0%) for females.
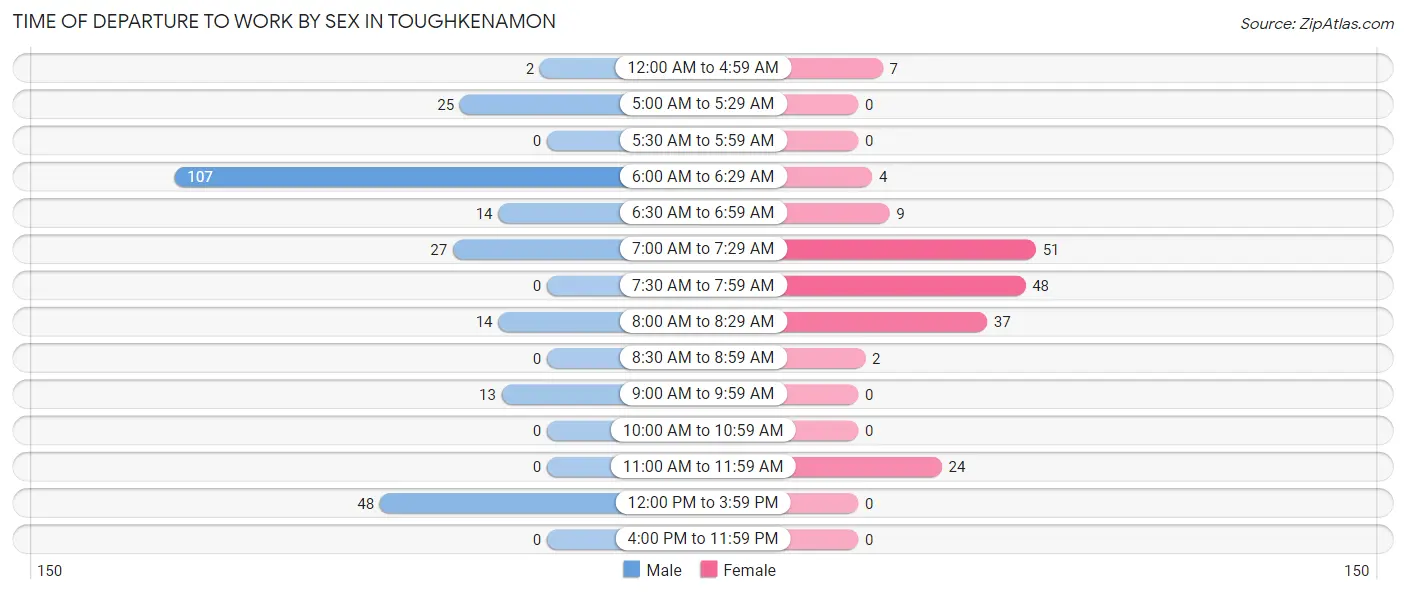
| Time of Departure | Male | Female |
| 12:00 AM to 4:59 AM | 2 (0.8%) | 7 (3.8%) |
| 5:00 AM to 5:29 AM | 25 (10.0%) | 0 (0.0%) |
| 5:30 AM to 5:59 AM | 0 (0.0%) | 0 (0.0%) |
| 6:00 AM to 6:29 AM | 107 (42.8%) | 4 (2.2%) |
| 6:30 AM to 6:59 AM | 14 (5.6%) | 9 (5.0%) |
| 7:00 AM to 7:29 AM | 27 (10.8%) | 51 (28.0%) |
| 7:30 AM to 7:59 AM | 0 (0.0%) | 48 (26.4%) |
| 8:00 AM to 8:29 AM | 14 (5.6%) | 37 (20.3%) |
| 8:30 AM to 8:59 AM | 0 (0.0%) | 2 (1.1%) |
| 9:00 AM to 9:59 AM | 13 (5.2%) | 0 (0.0%) |
| 10:00 AM to 10:59 AM | 0 (0.0%) | 0 (0.0%) |
| 11:00 AM to 11:59 AM | 0 (0.0%) | 24 (13.2%) |
| 12:00 PM to 3:59 PM | 48 (19.2%) | 0 (0.0%) |
| 4:00 PM to 11:59 PM | 0 (0.0%) | 0 (0.0%) |
| Total | 250 (100.0%) | 182 (100.0%) |
Housing Occupancy in Toughkenamon
Occupancy by Ownership in Toughkenamon
Of the total 316 dwellings in Toughkenamon, owner-occupied units account for 279 (88.3%), while renter-occupied units make up 37 (11.7%).
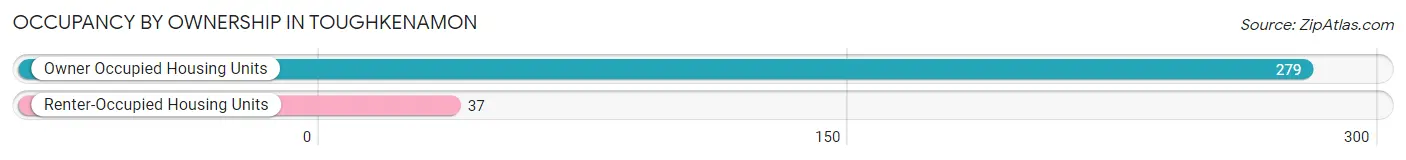
| Occupancy | # Housing Units | % Housing Units |
| Owner Occupied Housing Units | 279 | 88.3% |
| Renter-Occupied Housing Units | 37 | 11.7% |
| Total Occupied Housing Units | 316 | 100.0% |
Occupancy by Household Size in Toughkenamon
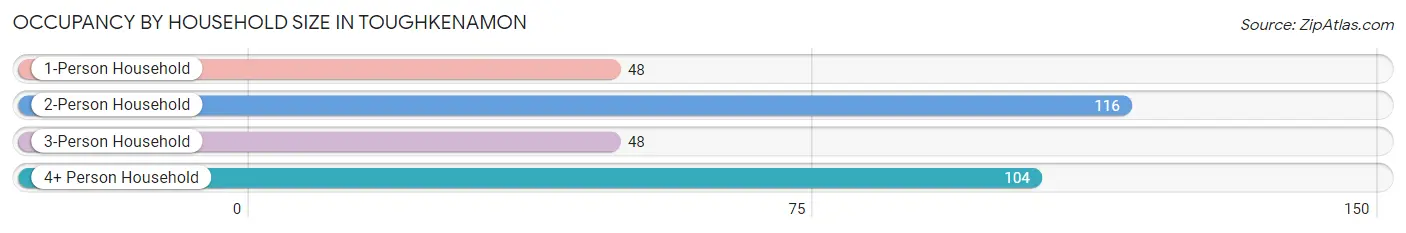
| Household Size | # Housing Units | % Housing Units |
| 1-Person Household | 48 | 15.2% |
| 2-Person Household | 116 | 36.7% |
| 3-Person Household | 48 | 15.2% |
| 4+ Person Household | 104 | 32.9% |
| Total Housing Units | 316 | 100.0% |
Occupancy by Ownership by Household Size in Toughkenamon
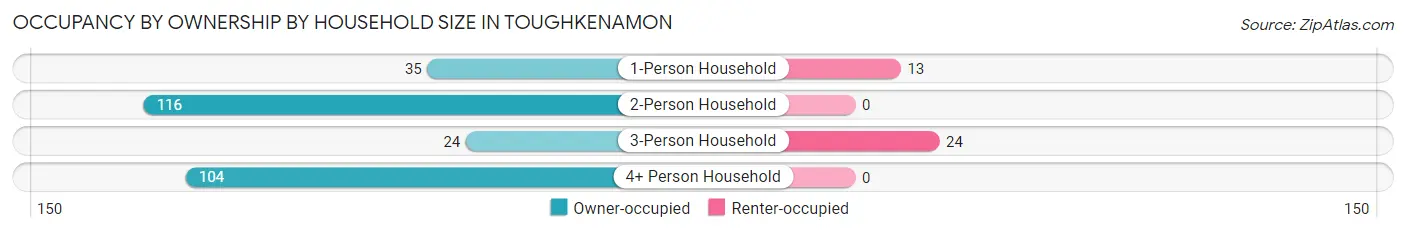
| Household Size | Owner-occupied | Renter-occupied |
| 1-Person Household | 35 (72.9%) | 13 (27.1%) |
| 2-Person Household | 116 (100.0%) | 0 (0.0%) |
| 3-Person Household | 24 (50.0%) | 24 (50.0%) |
| 4+ Person Household | 104 (100.0%) | 0 (0.0%) |
| Total Housing Units | 279 (88.3%) | 37 (11.7%) |
Occupancy by Educational Attainment in Toughkenamon
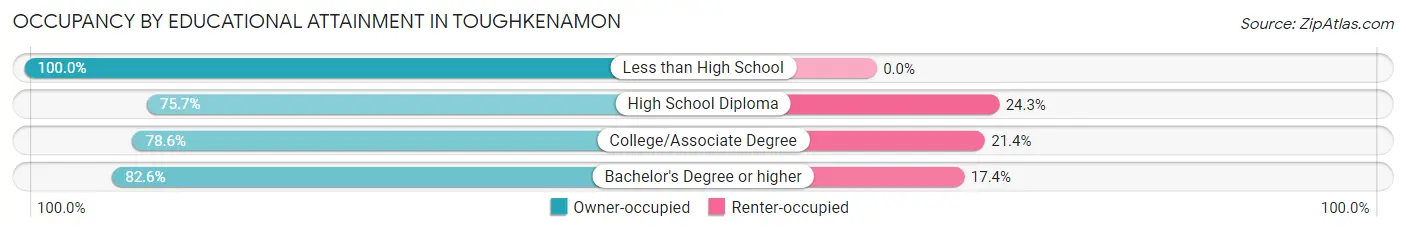
| Household Size | Owner-occupied | Renter-occupied |
| Less than High School | 144 (100.0%) | 0 (0.0%) |
| High School Diploma | 53 (75.7%) | 17 (24.3%) |
| College/Associate Degree | 44 (78.6%) | 12 (21.4%) |
| Bachelor's Degree or higher | 38 (82.6%) | 8 (17.4%) |
Occupancy by Age of Householder in Toughkenamon
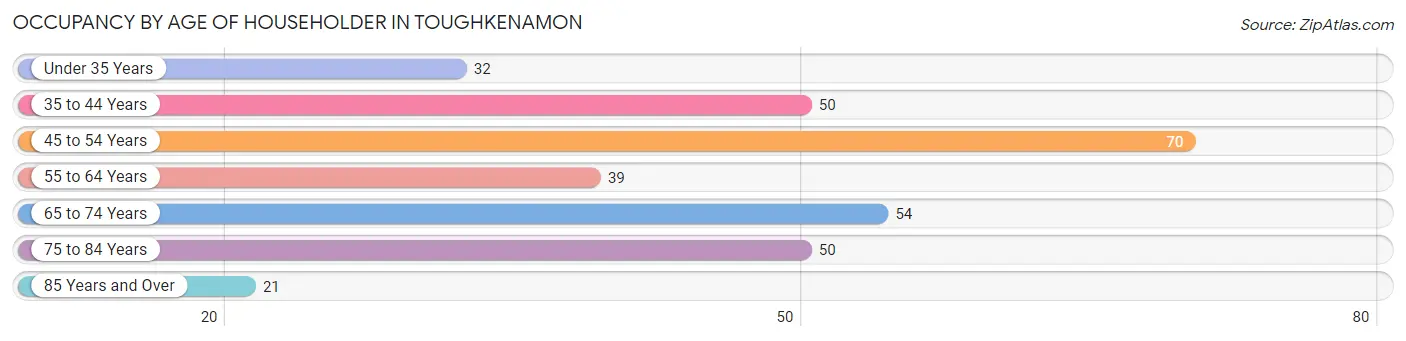
| Age Bracket | # Households | % Households |
| Under 35 Years | 32 | 10.1% |
| 35 to 44 Years | 50 | 15.8% |
| 45 to 54 Years | 70 | 22.2% |
| 55 to 64 Years | 39 | 12.3% |
| 65 to 74 Years | 54 | 17.1% |
| 75 to 84 Years | 50 | 15.8% |
| 85 Years and Over | 21 | 6.7% |
| Total | 316 | 100.0% |
Housing Finances in Toughkenamon
Median Income by Occupancy in Toughkenamon
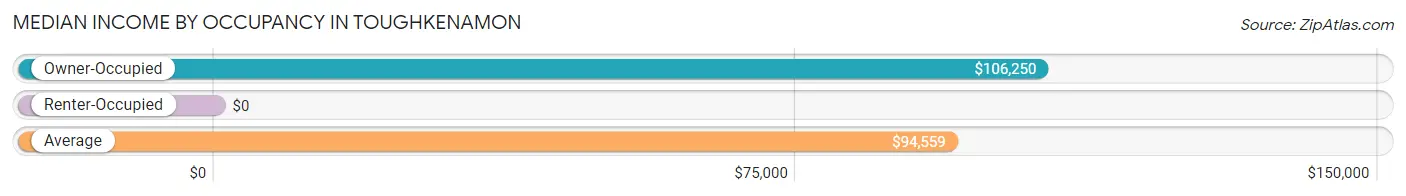
| Occupancy Type | # Households | Median Income |
| Owner-Occupied | 279 (88.3%) | $106,250 |
| Renter-Occupied | 37 (11.7%) | $0 |
| Average | 316 (100.0%) | $94,559 |
Occupancy by Householder Income Bracket in Toughkenamon
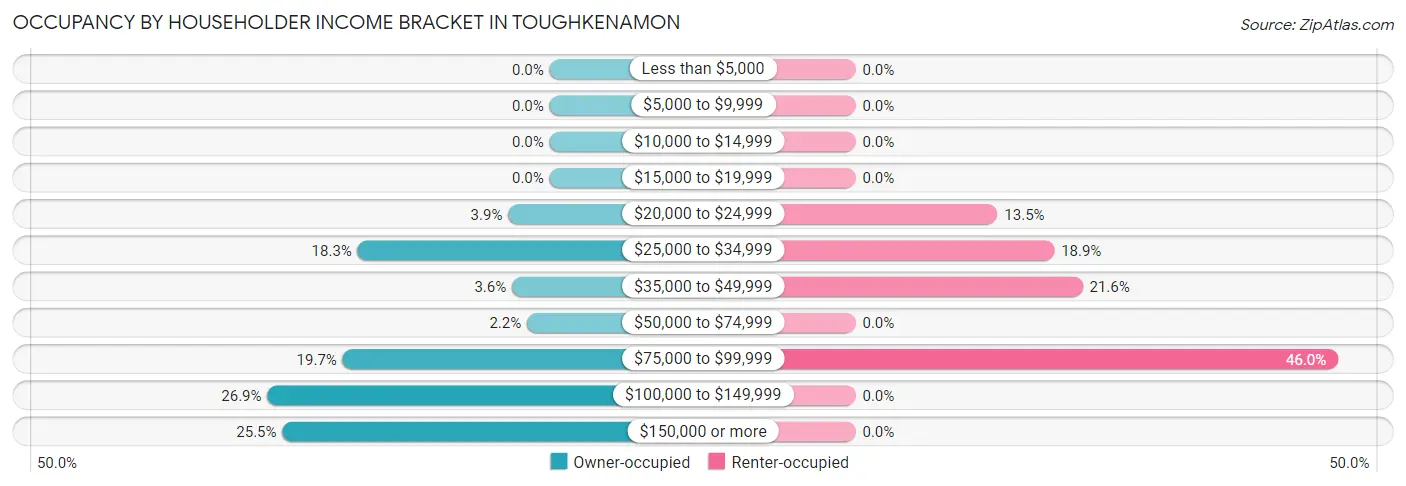
| Income Bracket | Owner-occupied | Renter-occupied |
| Less than $5,000 | 0 (0.0%) | 0 (0.0%) |
| $5,000 to $9,999 | 0 (0.0%) | 0 (0.0%) |
| $10,000 to $14,999 | 0 (0.0%) | 0 (0.0%) |
| $15,000 to $19,999 | 0 (0.0%) | 0 (0.0%) |
| $20,000 to $24,999 | 11 (3.9%) | 5 (13.5%) |
| $25,000 to $34,999 | 51 (18.3%) | 7 (18.9%) |
| $35,000 to $49,999 | 10 (3.6%) | 8 (21.6%) |
| $50,000 to $74,999 | 6 (2.1%) | 0 (0.0%) |
| $75,000 to $99,999 | 55 (19.7%) | 17 (46.0%) |
| $100,000 to $149,999 | 75 (26.9%) | 0 (0.0%) |
| $150,000 or more | 71 (25.5%) | 0 (0.0%) |
| Total | 279 (100.0%) | 37 (100.0%) |
Monthly Housing Cost Tiers in Toughkenamon
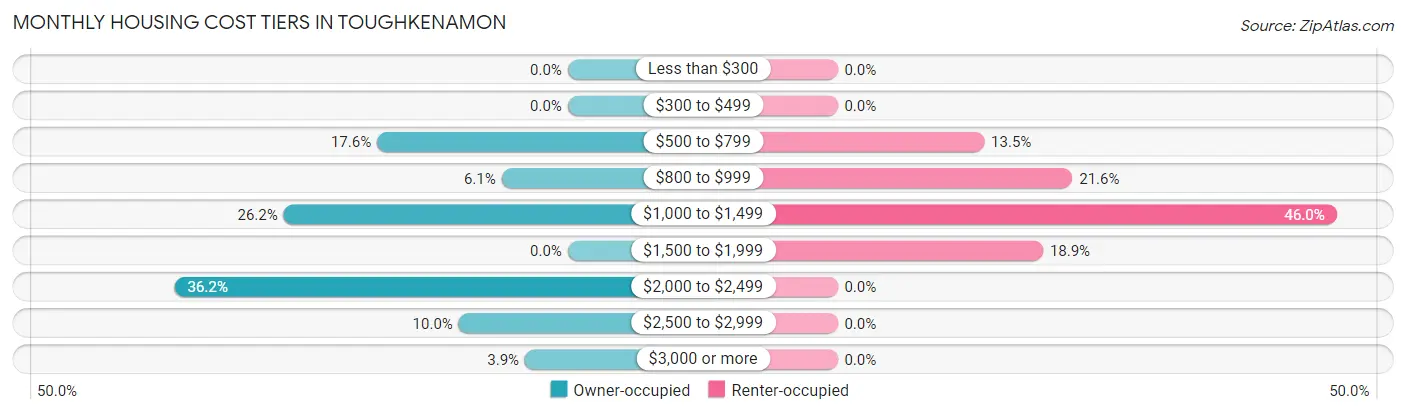
| Monthly Cost | Owner-occupied | Renter-occupied |
| Less than $300 | 0 (0.0%) | 0 (0.0%) |
| $300 to $499 | 0 (0.0%) | 0 (0.0%) |
| $500 to $799 | 49 (17.6%) | 5 (13.5%) |
| $800 to $999 | 17 (6.1%) | 8 (21.6%) |
| $1,000 to $1,499 | 73 (26.2%) | 17 (46.0%) |
| $1,500 to $1,999 | 0 (0.0%) | 7 (18.9%) |
| $2,000 to $2,499 | 101 (36.2%) | 0 (0.0%) |
| $2,500 to $2,999 | 28 (10.0%) | 0 (0.0%) |
| $3,000 or more | 11 (3.9%) | 0 (0.0%) |
| Total | 279 (100.0%) | 37 (100.0%) |
Physical Housing Characteristics in Toughkenamon
Housing Structures in Toughkenamon
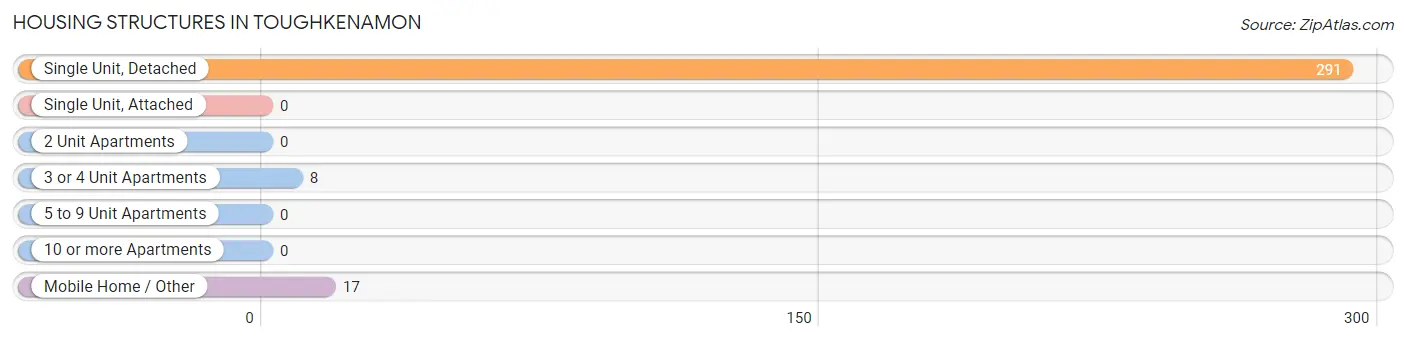
| Structure Type | # Housing Units | % Housing Units |
| Single Unit, Detached | 291 | 92.1% |
| Single Unit, Attached | 0 | 0.0% |
| 2 Unit Apartments | 0 | 0.0% |
| 3 or 4 Unit Apartments | 8 | 2.5% |
| 5 to 9 Unit Apartments | 0 | 0.0% |
| 10 or more Apartments | 0 | 0.0% |
| Mobile Home / Other | 17 | 5.4% |
| Total | 316 | 100.0% |
Housing Structures by Occupancy in Toughkenamon
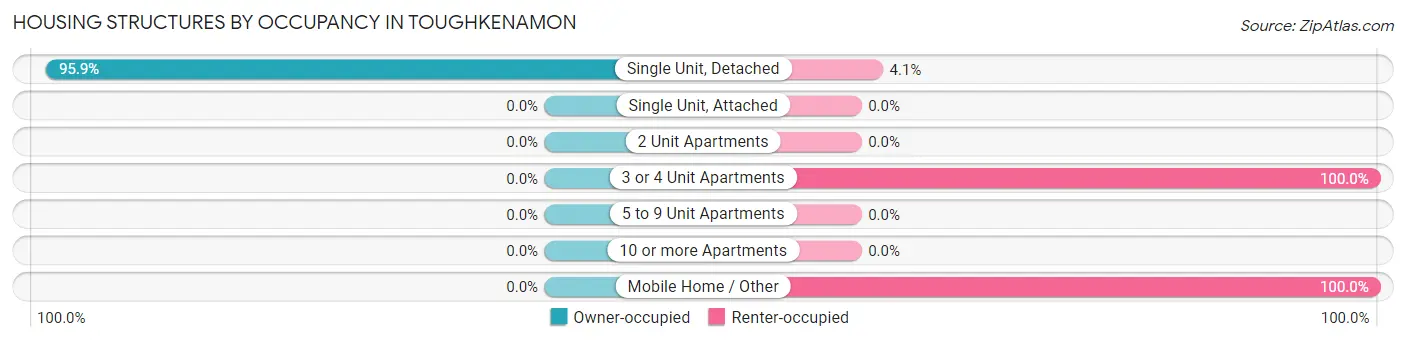
| Structure Type | Owner-occupied | Renter-occupied |
| Single Unit, Detached | 279 (95.9%) | 12 (4.1%) |
| Single Unit, Attached | 0 (0.0%) | 0 (0.0%) |
| 2 Unit Apartments | 0 (0.0%) | 0 (0.0%) |
| 3 or 4 Unit Apartments | 0 (0.0%) | 8 (100.0%) |
| 5 to 9 Unit Apartments | 0 (0.0%) | 0 (0.0%) |
| 10 or more Apartments | 0 (0.0%) | 0 (0.0%) |
| Mobile Home / Other | 0 (0.0%) | 17 (100.0%) |
| Total | 279 (88.3%) | 37 (11.7%) |
Housing Structures by Number of Rooms in Toughkenamon
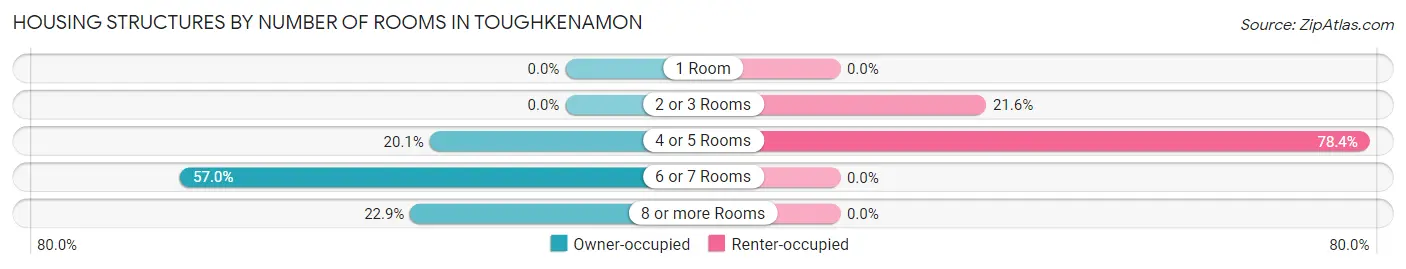
| Number of Rooms | Owner-occupied | Renter-occupied |
| 1 Room | 0 (0.0%) | 0 (0.0%) |
| 2 or 3 Rooms | 0 (0.0%) | 8 (21.6%) |
| 4 or 5 Rooms | 56 (20.1%) | 29 (78.4%) |
| 6 or 7 Rooms | 159 (57.0%) | 0 (0.0%) |
| 8 or more Rooms | 64 (22.9%) | 0 (0.0%) |
| Total | 279 (100.0%) | 37 (100.0%) |
Housing Structure by Heating Type in Toughkenamon
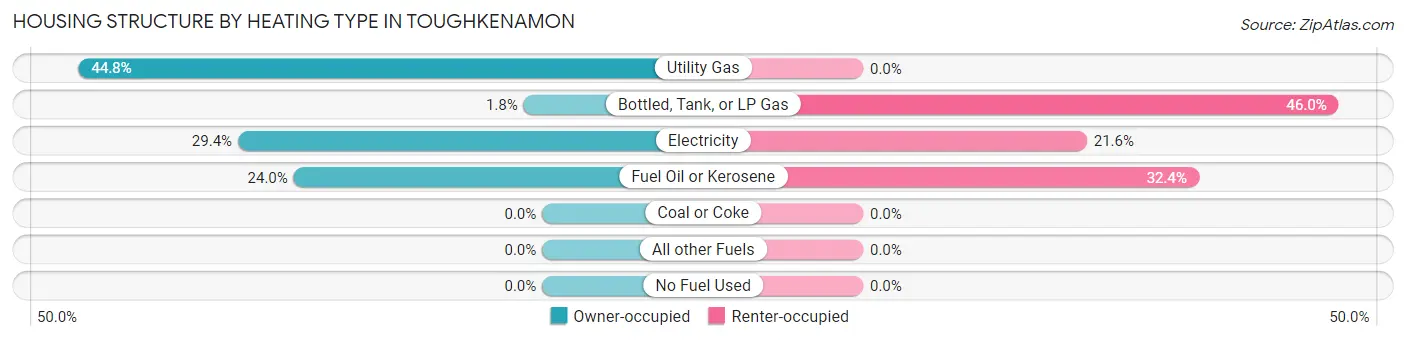
| Heating Type | Owner-occupied | Renter-occupied |
| Utility Gas | 125 (44.8%) | 0 (0.0%) |
| Bottled, Tank, or LP Gas | 5 (1.8%) | 17 (46.0%) |
| Electricity | 82 (29.4%) | 8 (21.6%) |
| Fuel Oil or Kerosene | 67 (24.0%) | 12 (32.4%) |
| Coal or Coke | 0 (0.0%) | 0 (0.0%) |
| All other Fuels | 0 (0.0%) | 0 (0.0%) |
| No Fuel Used | 0 (0.0%) | 0 (0.0%) |
| Total | 279 (100.0%) | 37 (100.0%) |
Household Vehicle Usage in Toughkenamon
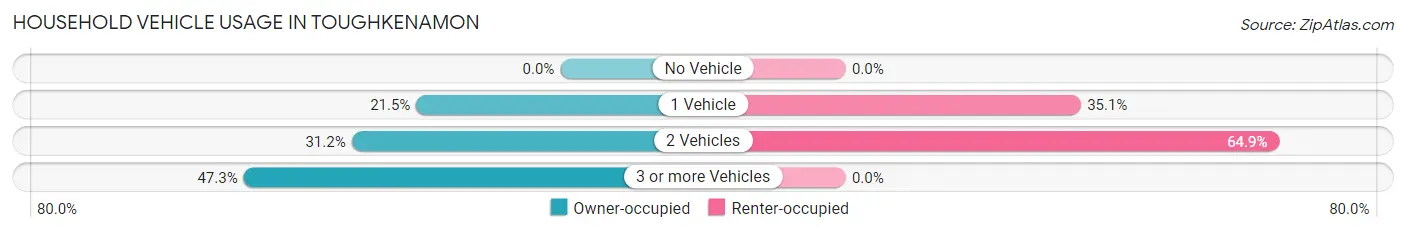
| Vehicles per Household | Owner-occupied | Renter-occupied |
| No Vehicle | 0 (0.0%) | 0 (0.0%) |
| 1 Vehicle | 60 (21.5%) | 13 (35.1%) |
| 2 Vehicles | 87 (31.2%) | 24 (64.9%) |
| 3 or more Vehicles | 132 (47.3%) | 0 (0.0%) |
| Total | 279 (100.0%) | 37 (100.0%) |
Real Estate & Mortgages in Toughkenamon
Real Estate and Mortgage Overview in Toughkenamon
| Characteristic | Without Mortgage | With Mortgage |
| Housing Units | 140 | 139 |
| Median Property Value | $352,900 | $303,800 |
| Median Household Income | - | - |
| Monthly Housing Costs | $1,208 | $11 |
| Real Estate Taxes | $6,083 | $0 |
Property Value by Mortgage Status in Toughkenamon
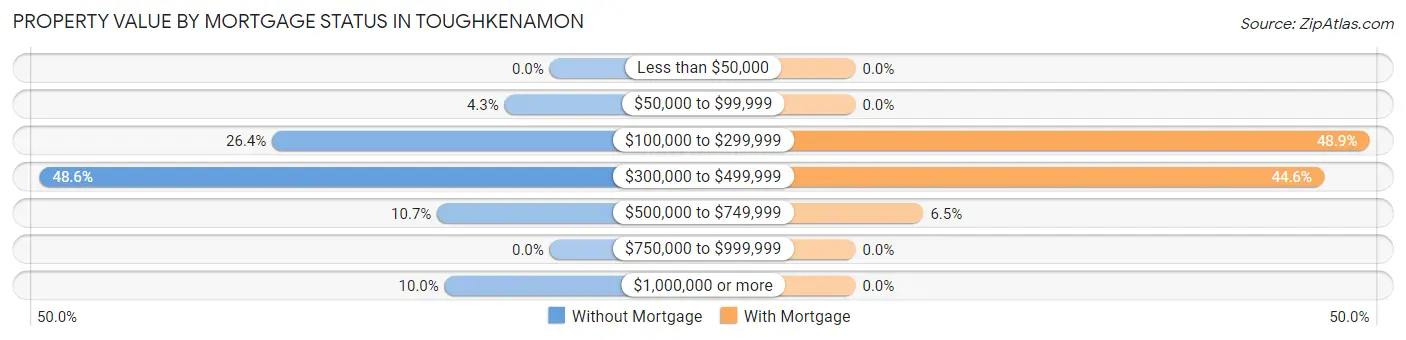
| Property Value | Without Mortgage | With Mortgage |
| Less than $50,000 | 0 (0.0%) | 0 (0.0%) |
| $50,000 to $99,999 | 6 (4.3%) | 0 (0.0%) |
| $100,000 to $299,999 | 37 (26.4%) | 68 (48.9%) |
| $300,000 to $499,999 | 68 (48.6%) | 62 (44.6%) |
| $500,000 to $749,999 | 15 (10.7%) | 9 (6.5%) |
| $750,000 to $999,999 | 0 (0.0%) | 0 (0.0%) |
| $1,000,000 or more | 14 (10.0%) | 0 (0.0%) |
| Total | 140 (100.0%) | 139 (100.0%) |
Household Income by Mortgage Status in Toughkenamon
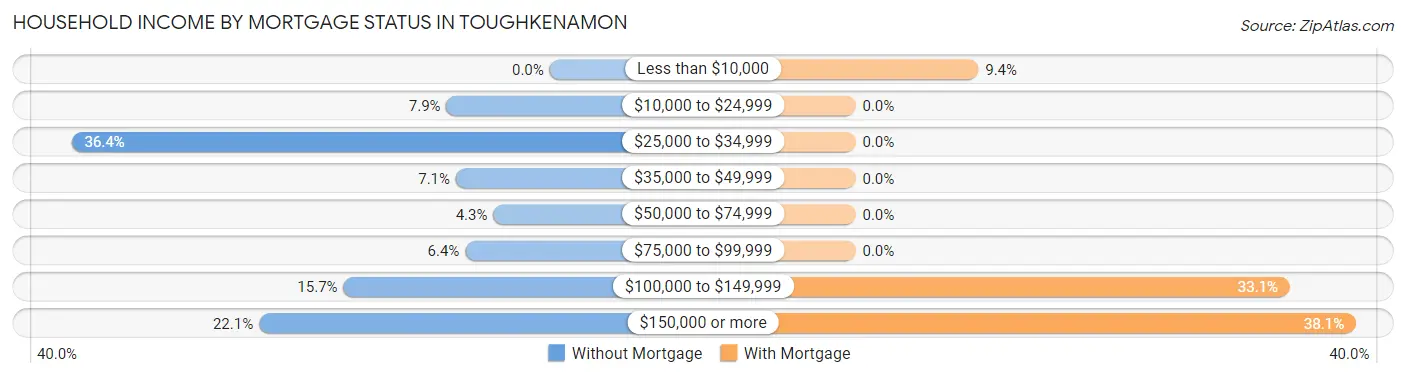
| Household Income | Without Mortgage | With Mortgage |
| Less than $10,000 | 0 (0.0%) | 13 (9.3%) |
| $10,000 to $24,999 | 11 (7.9%) | 0 (0.0%) |
| $25,000 to $34,999 | 51 (36.4%) | 0 (0.0%) |
| $35,000 to $49,999 | 10 (7.1%) | 0 (0.0%) |
| $50,000 to $74,999 | 6 (4.3%) | 0 (0.0%) |
| $75,000 to $99,999 | 9 (6.4%) | 0 (0.0%) |
| $100,000 to $149,999 | 22 (15.7%) | 46 (33.1%) |
| $150,000 or more | 31 (22.1%) | 53 (38.1%) |
| Total | 140 (100.0%) | 139 (100.0%) |
Property Value to Household Income Ratio in Toughkenamon
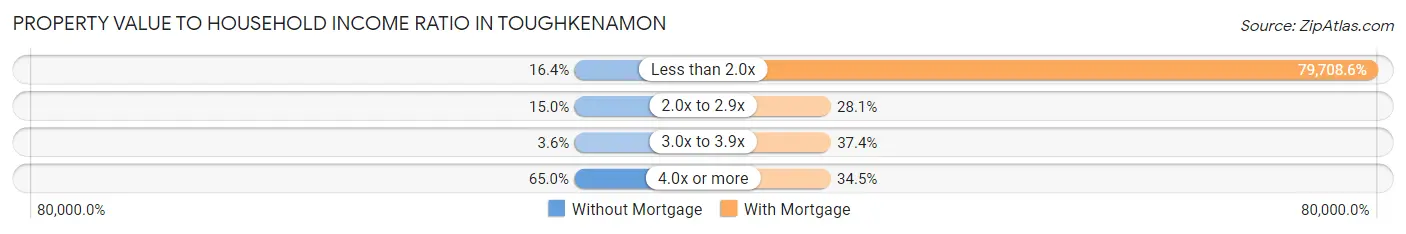
| Value-to-Income Ratio | Without Mortgage | With Mortgage |
| Less than 2.0x | 23 (16.4%) | 110,795 (79,708.6%) |
| 2.0x to 2.9x | 21 (15.0%) | 39 (28.1%) |
| 3.0x to 3.9x | 5 (3.6%) | 52 (37.4%) |
| 4.0x or more | 91 (65.0%) | 48 (34.5%) |
| Total | 140 (100.0%) | 139 (100.0%) |
Real Estate Taxes by Mortgage Status in Toughkenamon
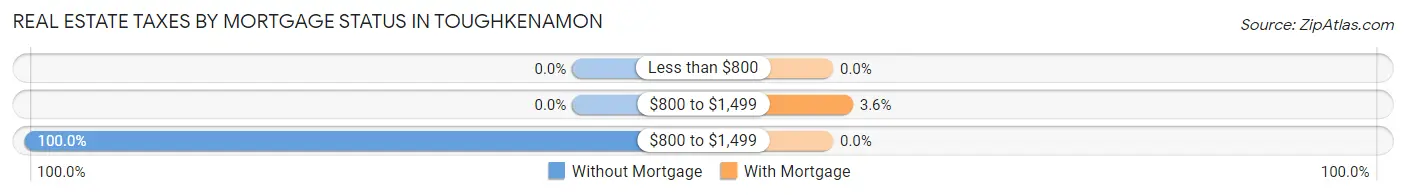
| Property Taxes | Without Mortgage | With Mortgage |
| Less than $800 | 0 (0.0%) | 0 (0.0%) |
| $800 to $1,499 | 0 (0.0%) | 5 (3.6%) |
| $800 to $1,499 | 140 (100.0%) | 0 (0.0%) |
| Total | 140 (100.0%) | 139 (100.0%) |
Health & Disability in Toughkenamon
Health Insurance Coverage by Age in Toughkenamon
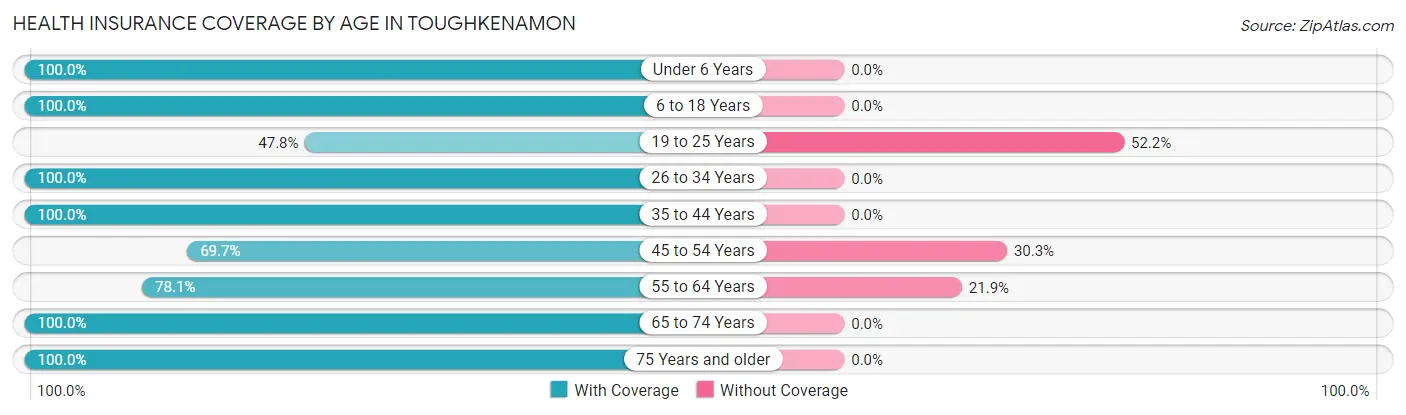
| Age Bracket | With Coverage | Without Coverage |
| Under 6 Years | 52 (100.0%) | 0 (0.0%) |
| 6 to 18 Years | 103 (100.0%) | 0 (0.0%) |
| 19 to 25 Years | 66 (47.8%) | 72 (52.2%) |
| 26 to 34 Years | 59 (100.0%) | 0 (0.0%) |
| 35 to 44 Years | 150 (100.0%) | 0 (0.0%) |
| 45 to 54 Years | 85 (69.7%) | 37 (30.3%) |
| 55 to 64 Years | 89 (78.1%) | 25 (21.9%) |
| 65 to 74 Years | 118 (100.0%) | 0 (0.0%) |
| 75 Years and older | 83 (100.0%) | 0 (0.0%) |
| Total | 805 (85.7%) | 134 (14.3%) |
Health Insurance Coverage by Citizenship Status in Toughkenamon
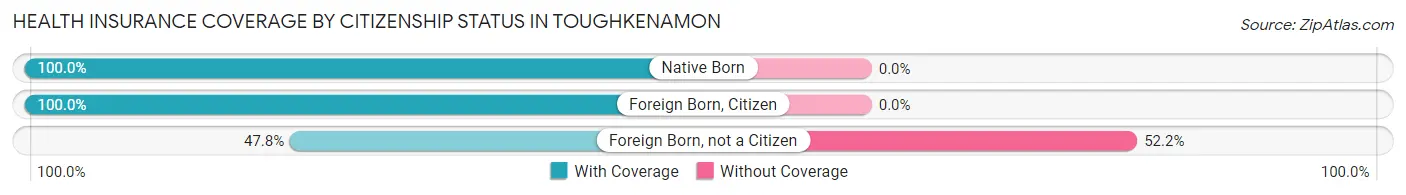
| Citizenship Status | With Coverage | Without Coverage |
| Native Born | 52 (100.0%) | 0 (0.0%) |
| Foreign Born, Citizen | 103 (100.0%) | 0 (0.0%) |
| Foreign Born, not a Citizen | 66 (47.8%) | 72 (52.2%) |
Health Insurance Coverage by Household Income in Toughkenamon
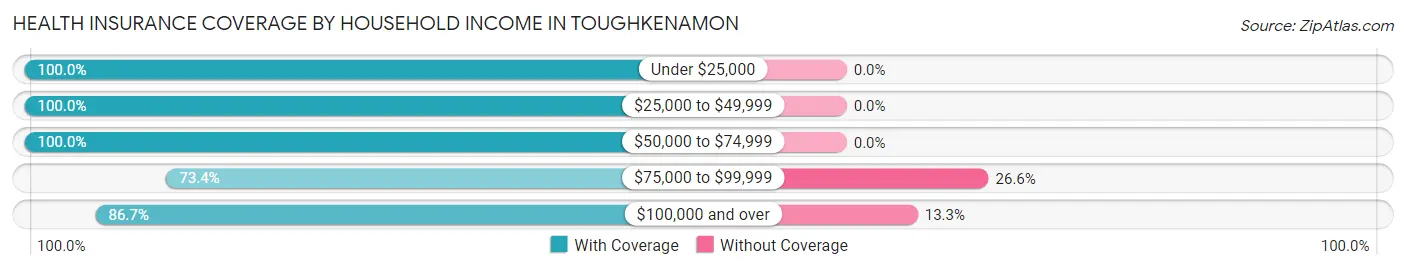
| Household Income | With Coverage | Without Coverage |
| Under $25,000 | 28 (100.0%) | 0 (0.0%) |
| $25,000 to $49,999 | 162 (100.0%) | 0 (0.0%) |
| $50,000 to $74,999 | 12 (100.0%) | 0 (0.0%) |
| $75,000 to $99,999 | 199 (73.4%) | 72 (26.6%) |
| $100,000 and over | 404 (86.7%) | 62 (13.3%) |
Public vs Private Health Insurance Coverage by Age in Toughkenamon
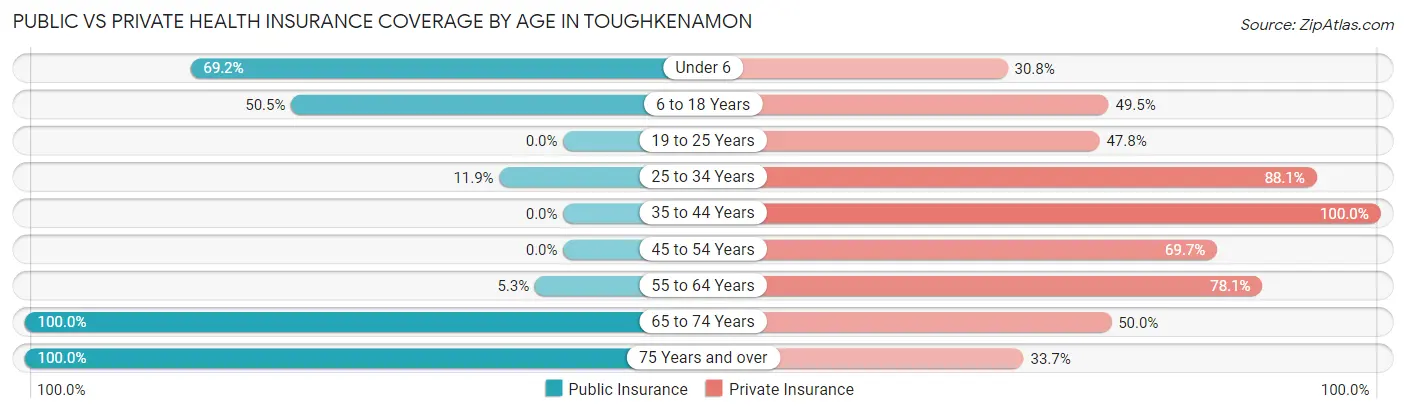
| Age Bracket | Public Insurance | Private Insurance |
| Under 6 | 36 (69.2%) | 16 (30.8%) |
| 6 to 18 Years | 52 (50.5%) | 51 (49.5%) |
| 19 to 25 Years | 0 (0.0%) | 66 (47.8%) |
| 25 to 34 Years | 7 (11.9%) | 52 (88.1%) |
| 35 to 44 Years | 0 (0.0%) | 150 (100.0%) |
| 45 to 54 Years | 0 (0.0%) | 85 (69.7%) |
| 55 to 64 Years | 6 (5.3%) | 89 (78.1%) |
| 65 to 74 Years | 118 (100.0%) | 59 (50.0%) |
| 75 Years and over | 83 (100.0%) | 28 (33.7%) |
| Total | 302 (32.2%) | 596 (63.5%) |
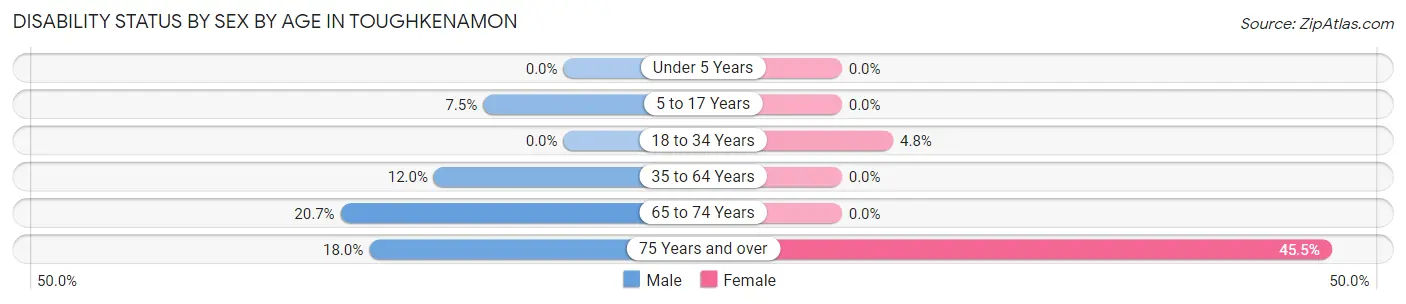
Disability Status by Sex by Age in Toughkenamon
| Age Bracket | Male | Female |
| Under 5 Years | 0 (0.0%) | 0 (0.0%) |
| 5 to 17 Years | 7 (7.4%) | 0 (0.0%) |
| 18 to 34 Years | 0 (0.0%) | 7 (4.8%) |
| 35 to 64 Years | 25 (12.0%) | 0 (0.0%) |
| 65 to 74 Years | 6 (20.7%) | 0 (0.0%) |
| 75 Years and over | 11 (18.0%) | 10 (45.5%) |
Disability Class by Sex by Age in Toughkenamon
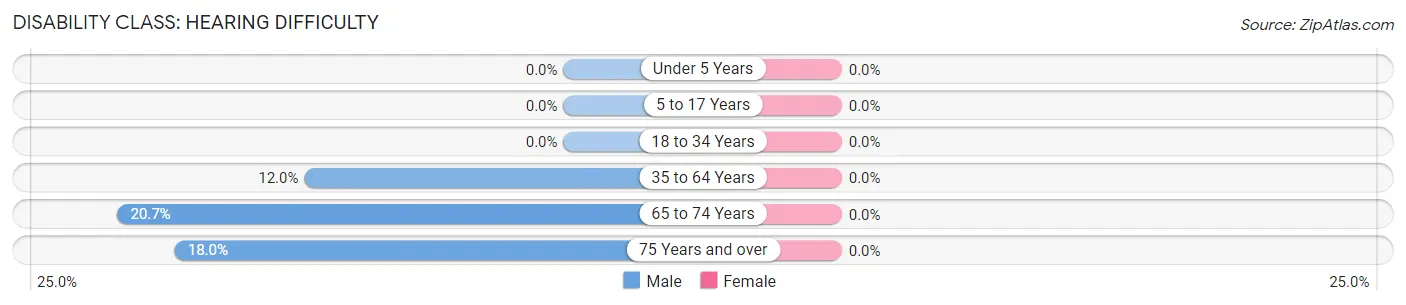
Disability Class: Hearing Difficulty
| Age Bracket | Male | Female |
| Under 5 Years | 0 (0.0%) | 0 (0.0%) |
| 5 to 17 Years | 0 (0.0%) | 0 (0.0%) |
| 18 to 34 Years | 0 (0.0%) | 0 (0.0%) |
| 35 to 64 Years | 25 (12.0%) | 0 (0.0%) |
| 65 to 74 Years | 6 (20.7%) | 0 (0.0%) |
| 75 Years and over | 11 (18.0%) | 0 (0.0%) |
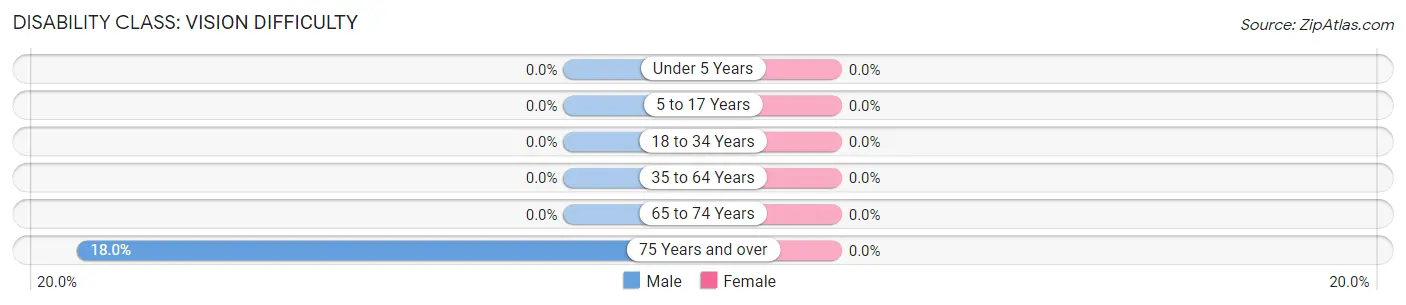
Disability Class: Vision Difficulty
| Age Bracket | Male | Female |
| Under 5 Years | 0 (0.0%) | 0 (0.0%) |
| 5 to 17 Years | 0 (0.0%) | 0 (0.0%) |
| 18 to 34 Years | 0 (0.0%) | 0 (0.0%) |
| 35 to 64 Years | 0 (0.0%) | 0 (0.0%) |
| 65 to 74 Years | 0 (0.0%) | 0 (0.0%) |
| 75 Years and over | 11 (18.0%) | 0 (0.0%) |
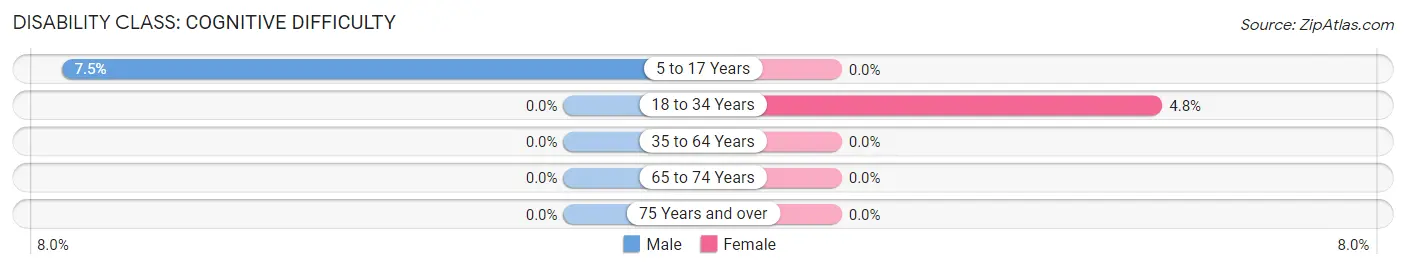
Disability Class: Cognitive Difficulty
| Age Bracket | Male | Female |
| 5 to 17 Years | 7 (7.4%) | 0 (0.0%) |
| 18 to 34 Years | 0 (0.0%) | 7 (4.8%) |
| 35 to 64 Years | 0 (0.0%) | 0 (0.0%) |
| 65 to 74 Years | 0 (0.0%) | 0 (0.0%) |
| 75 Years and over | 0 (0.0%) | 0 (0.0%) |
Disability Class: Ambulatory Difficulty
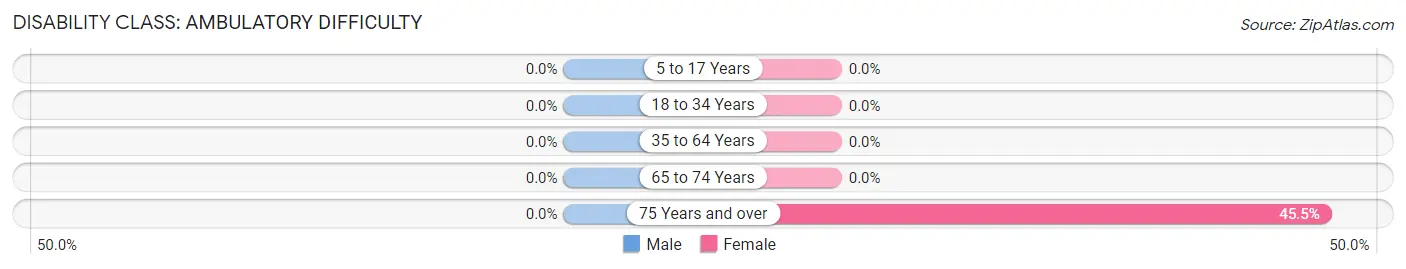
| Age Bracket | Male | Female |
| 5 to 17 Years | 0 (0.0%) | 0 (0.0%) |
| 18 to 34 Years | 0 (0.0%) | 0 (0.0%) |
| 35 to 64 Years | 0 (0.0%) | 0 (0.0%) |
| 65 to 74 Years | 0 (0.0%) | 0 (0.0%) |
| 75 Years and over | 0 (0.0%) | 10 (45.5%) |
Disability Class: Self-Care Difficulty
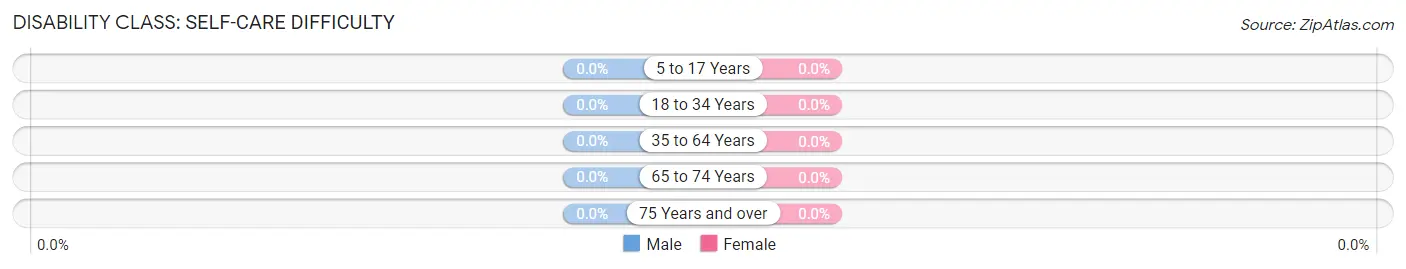
| Age Bracket | Male | Female |
| 5 to 17 Years | 0 (0.0%) | 0 (0.0%) |
| 18 to 34 Years | 0 (0.0%) | 0 (0.0%) |
| 35 to 64 Years | 0 (0.0%) | 0 (0.0%) |
| 65 to 74 Years | 0 (0.0%) | 0 (0.0%) |
| 75 Years and over | 0 (0.0%) | 0 (0.0%) |
Technology Access in Toughkenamon
Computing Device Access in Toughkenamon
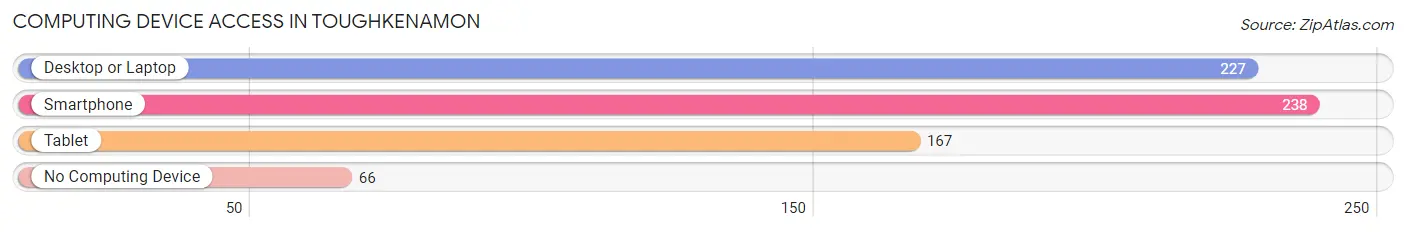
| Device Type | # Households | % Households |
| Desktop or Laptop | 227 | 71.8% |
| Smartphone | 238 | 75.3% |
| Tablet | 167 | 52.8% |
| No Computing Device | 66 | 20.9% |
| Total | 316 | 100.0% |
Internet Access in Toughkenamon
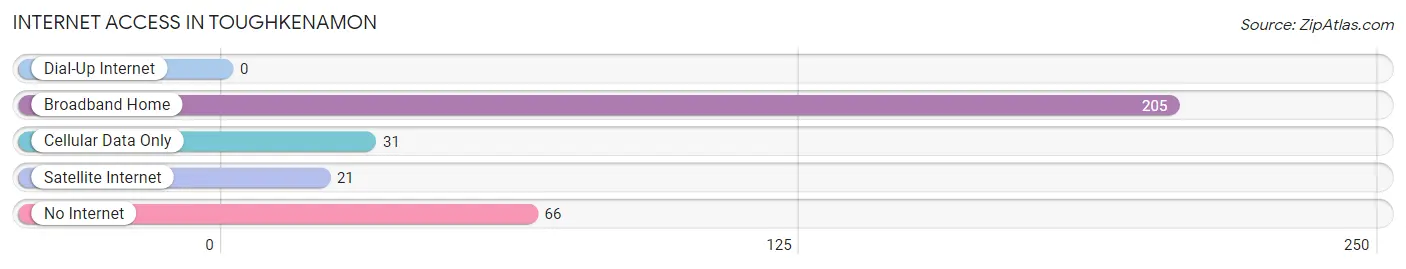
| Internet Type | # Households | % Households |
| Dial-Up Internet | 0 | 0.0% |
| Broadband Home | 205 | 64.9% |
| Cellular Data Only | 31 | 9.8% |
| Satellite Internet | 21 | 6.7% |
| No Internet | 66 | 20.9% |
| Total | 316 | 100.0% |
Toughkenamon Summary
Toughkenamon is an unincorporated community located in the southern part of Chester County, Pennsylvania. It is situated in the southeastern corner of the county, near the border with Delaware and Maryland. The community is located along the banks of the Brandywine Creek, and is home to a variety of businesses, including a winery, a brewery, and a number of small shops.
History
The area that is now known as Toughkenamon was first settled in the late 17th century by English and Welsh immigrants. The community was originally known as "Toughkenamon," a name derived from the Native American word for "meeting place." The area was a popular meeting place for Native Americans, and was also used as a trading post.
In the early 19th century, the area was home to a number of small farms and businesses. The community was also home to a number of mills, including a grist mill, a saw mill, and a paper mill. The paper mill was the largest employer in the area, and was responsible for the production of paper products for the local market.
In the late 19th century, the area began to experience a period of growth and development. The paper mill was replaced by a silk mill, and the community began to attract a number of new businesses. The area also became a popular destination for tourists, who were drawn to the area's natural beauty and its proximity to Philadelphia.
Geography
Toughkenamon is located in the southeastern corner of Chester County, Pennsylvania. It is situated along the banks of the Brandywine Creek, and is bordered by the towns of West Grove, Avondale, and Chadds Ford. The community is located approximately 25 miles west of Philadelphia, and is accessible via Interstate 95 and U.S. Route 1.
The area is characterized by rolling hills and lush forests. The climate is generally mild, with temperatures ranging from the mid-30s in the winter to the mid-80s in the summer. The area receives an average of 40 inches of precipitation per year.
Economy
Toughkenamon is home to a variety of businesses, including a winery, a brewery, and a number of small shops. The area is also home to a number of farms, which produce a variety of fruits and vegetables. The community is also home to a number of manufacturing and industrial businesses, including a paper mill, a silk mill, and a number of other businesses.
The area is also home to a number of educational institutions, including a community college and a number of private schools. The area is also home to a number of parks and recreational facilities, including a golf course and a number of hiking trails.
Demographics
As of the 2010 census, the population of Toughkenamon was 1,845. The population is predominantly white (94.3%), with a small percentage of African Americans (2.3%) and Hispanics (2.2%). The median household income is $63,917, and the median home value is $220,000. The area is served by the Avon Grove School District.
Common Questions
What is Per Capita Income in Toughkenamon?
Per Capita income in Toughkenamon is $37,982.
What is the Median Family Income in Toughkenamon?
Median Family Income in Toughkenamon is $94,412.
What is the Median Household income in Toughkenamon?
Median Household Income in Toughkenamon is $94,559.
What is Income or Wage Gap in Toughkenamon?
Income or Wage Gap in Toughkenamon is 66.6%.
Women in Toughkenamon earn 33.4 cents for every dollar earned by a man.
What is Inequality or Gini Index in Toughkenamon?
Inequality or Gini Index in Toughkenamon is 0.36.
What is the Total Population of Toughkenamon?
Total Population of Toughkenamon is 939.
What is the Total Male Population of Toughkenamon?
Total Male Population of Toughkenamon is 443.
What is the Total Female Population of Toughkenamon?
Total Female Population of Toughkenamon is 496.
What is the Ratio of Males per 100 Females in Toughkenamon?
There are 89.31 Males per 100 Females in Toughkenamon.
What is the Ratio of Females per 100 Males in Toughkenamon?
There are 111.96 Females per 100 Males in Toughkenamon.
What is the Median Population Age in Toughkenamon?
Median Population Age in Toughkenamon is 44.3 Years.
What is the Average Family Size in Toughkenamon
Average Family Size in Toughkenamon is 3.3 People.
What is the Average Household Size in Toughkenamon
Average Household Size in Toughkenamon is 3.0 People.
How Large is the Labor Force in Toughkenamon?
There are 501 People in the Labor Forcein in Toughkenamon.
What is the Percentage of People in the Labor Force in Toughkenamon?
62.0% of People are in the Labor Force in Toughkenamon.
What is the Unemployment Rate in Toughkenamon?
Unemployment Rate in Toughkenamon is 1.0%.