Cities with the Highest Percentage of French Canadian Population in Illinois
RELATED REPORTS & OPTIONS
French Canadian
Illinois
Compare Cities
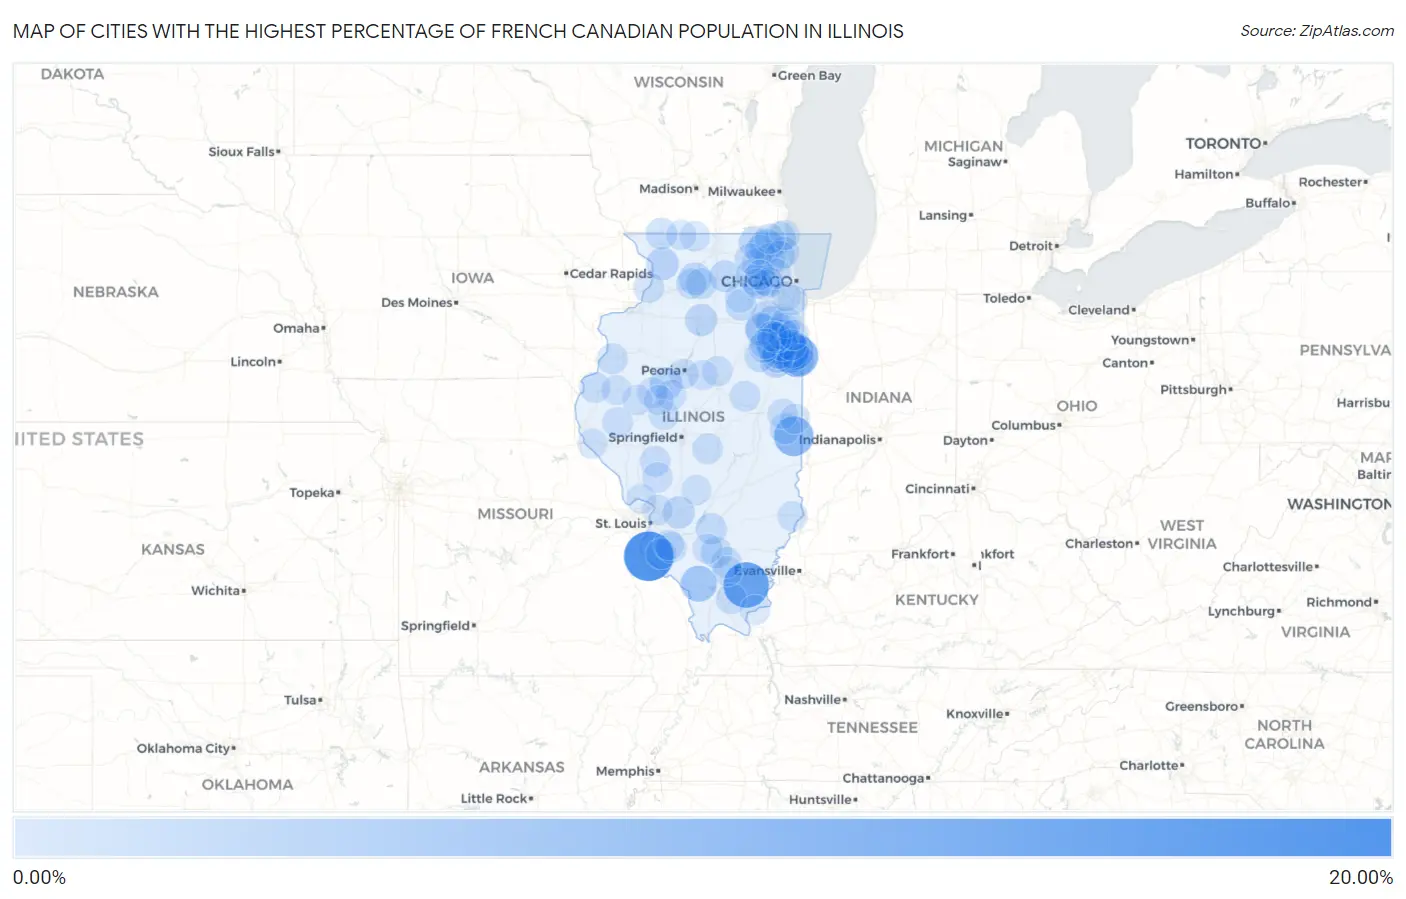
Map of Cities with the Highest Percentage of French Canadian Population in Illinois
0.00%
20.00%
Cities with the Highest Percentage of French Canadian Population in Illinois
| City | French Canadian | vs State | vs National | |
| 1. | Fults | 16.67% | 0.23%(+16.4)#1 | 0.54%(+16.1)#95 |
| 2. | Muddy | 13.33% | 0.23%(+13.1)#2 | 0.54%(+12.8)#141 |
| 3. | Donovan | 9.87% | 0.23%(+9.63)#3 | 0.54%(+9.32)#264 |
| 4. | Irwin | 8.51% | 0.23%(+8.28)#4 | 0.54%(+7.97)#346 |
| 5. | Chrisman | 8.44% | 0.23%(+8.21)#5 | 0.54%(+7.90)#350 |
| 6. | Martinton | 7.14% | 0.23%(+6.91)#6 | 0.54%(+6.60)#457 |
| 7. | Burtons Bridge | 6.64% | 0.23%(+6.40)#7 | 0.54%(+6.09)#508 |
| 8. | Beaverville | 6.36% | 0.23%(+6.12)#8 | 0.54%(+5.81)#536 |
| 9. | Papineau | 5.74% | 0.23%(+5.50)#9 | 0.54%(+5.19)#621 |
| 10. | Harrison | 5.44% | 0.23%(+5.21)#10 | 0.54%(+4.90)#667 |
| 11. | Volo | 3.77% | 0.23%(+3.54)#11 | 0.54%(+3.22)#1,049 |
| 12. | Wilton Center | 3.16% | 0.23%(+2.93)#12 | 0.54%(+2.62)#1,246 |
| 13. | Danforth | 2.92% | 0.23%(+2.69)#13 | 0.54%(+2.38)#1,347 |
| 14. | Ashkum | 2.90% | 0.23%(+2.66)#14 | 0.54%(+2.35)#1,353 |
| 15. | Clifton | 2.78% | 0.23%(+2.55)#15 | 0.54%(+2.24)#1,415 |
| 16. | Mount Carroll | 2.76% | 0.23%(+2.52)#16 | 0.54%(+2.21)#1,435 |
| 17. | Symerton | 2.74% | 0.23%(+2.51)#17 | 0.54%(+2.20)#1,446 |
| 18. | Grand Detour | 2.65% | 0.23%(+2.42)#18 | 0.54%(+2.10)#1,494 |
| 19. | Banner | 2.63% | 0.23%(+2.40)#19 | 0.54%(+2.09)#1,509 |
| 20. | Highland | 2.50% | 0.23%(+2.26)#20 | 0.54%(+1.95)#1,609 |
| 21. | Braceville | 2.46% | 0.23%(+2.22)#21 | 0.54%(+1.91)#1,632 |
| 22. | Hollowayville | 2.44% | 0.23%(+2.21)#22 | 0.54%(+1.89)#1,646 |
| 23. | Wonder Lake | 2.35% | 0.23%(+2.11)#23 | 0.54%(+1.80)#1,710 |
| 24. | Godley | 2.18% | 0.23%(+1.94)#24 | 0.54%(+1.63)#1,858 |
| 25. | Sammons Point | 2.17% | 0.23%(+1.94)#25 | 0.54%(+1.63)#1,860 |
| 26. | Malta | 2.15% | 0.23%(+1.92)#26 | 0.54%(+1.61)#1,884 |
| 27. | Bourbonnais | 2.06% | 0.23%(+1.82)#27 | 0.54%(+1.51)#1,954 |
| 28. | Iroquois | 2.05% | 0.23%(+1.82)#28 | 0.54%(+1.50)#1,966 |
| 29. | Manteno | 2.04% | 0.23%(+1.81)#29 | 0.54%(+1.49)#1,974 |
| 30. | Elwood | 1.99% | 0.23%(+1.75)#30 | 0.54%(+1.44)#2,017 |
| 31. | Wadsworth | 1.91% | 0.23%(+1.68)#31 | 0.54%(+1.37)#2,095 |
| 32. | Waltonville | 1.89% | 0.23%(+1.65)#32 | 0.54%(+1.34)#2,117 |
| 33. | Warren | 1.87% | 0.23%(+1.64)#33 | 0.54%(+1.33)#2,140 |
| 34. | Cullom | 1.82% | 0.23%(+1.58)#34 | 0.54%(+1.27)#2,196 |
| 35. | Millington | 1.80% | 0.23%(+1.57)#35 | 0.54%(+1.26)#2,220 |
| 36. | Central City | 1.73% | 0.23%(+1.50)#36 | 0.54%(+1.19)#2,306 |
| 37. | Lake Forest | 1.59% | 0.23%(+1.36)#37 | 0.54%(+1.05)#2,488 |
| 38. | Bradley | 1.55% | 0.23%(+1.31)#38 | 0.54%(+1.00)#2,564 |
| 39. | Ewing | 1.52% | 0.23%(+1.28)#39 | 0.54%(+0.971)#2,610 |
| 40. | Peotone | 1.49% | 0.23%(+1.26)#40 | 0.54%(+0.950)#2,642 |
| 41. | Franklin Grove | 1.45% | 0.23%(+1.22)#41 | 0.54%(+0.907)#2,701 |
| 42. | Deer Park | 1.43% | 0.23%(+1.20)#42 | 0.54%(+0.890)#2,729 |
| 43. | Sidell | 1.43% | 0.23%(+1.19)#43 | 0.54%(+0.884)#2,742 |
| 44. | St Anne | 1.36% | 0.23%(+1.13)#44 | 0.54%(+0.815)#2,858 |
| 45. | Limestone | 1.35% | 0.23%(+1.12)#45 | 0.54%(+0.808)#2,872 |
| 46. | Lenzburg | 1.35% | 0.23%(+1.11)#46 | 0.54%(+0.804)#2,877 |
| 47. | Winfield | 1.34% | 0.23%(+1.10)#47 | 0.54%(+0.793)#2,895 |
| 48. | Bellflower | 1.32% | 0.23%(+1.09)#48 | 0.54%(+0.775)#2,933 |
| 49. | Albany | 1.30% | 0.23%(+1.07)#49 | 0.54%(+0.758)#2,976 |
| 50. | Biggsville | 1.29% | 0.23%(+1.05)#50 | 0.54%(+0.742)#3,009 |
| 51. | Ferris | 1.26% | 0.23%(+1.02)#51 | 0.54%(+0.713)#3,083 |
| 52. | Campton Hills | 1.25% | 0.23%(+1.02)#52 | 0.54%(+0.706)#3,097 |
| 53. | Geneva | 1.24% | 0.23%(+1.01)#53 | 0.54%(+0.699)#3,113 |
| 54. | Cabery | 1.24% | 0.23%(+1.01)#54 | 0.54%(+0.695)#3,120 |
| 55. | West Dundee | 1.24% | 0.23%(+1.00)#55 | 0.54%(+0.692)#3,128 |
| 56. | Stonington | 1.24% | 0.23%(+1.00)#56 | 0.54%(+0.692)#3,129 |
| 57. | New Burnside | 1.23% | 0.23%(+1.00)#57 | 0.54%(+0.690)#3,131 |
| 58. | Scottville | 1.23% | 0.23%(+1.00)#58 | 0.54%(+0.690)#3,132 |
| 59. | Huntley | 1.20% | 0.23%(+0.970)#59 | 0.54%(+0.660)#3,203 |
| 60. | Red Bud | 1.18% | 0.23%(+0.951)#60 | 0.54%(+0.640)#3,248 |
| 61. | Dixon | 1.18% | 0.23%(+0.948)#61 | 0.54%(+0.637)#3,256 |
| 62. | Mount Sterling | 1.10% | 0.23%(+0.869)#62 | 0.54%(+0.558)#3,457 |
| 63. | Bonfield | 1.04% | 0.23%(+0.808)#63 | 0.54%(+0.497)#3,626 |
| 64. | Momence | 1.02% | 0.23%(+0.788)#64 | 0.54%(+0.478)#3,679 |
| 65. | Kappa | 1.01% | 0.23%(+0.776)#65 | 0.54%(+0.466)#3,717 |
| 66. | Chesterfield | 0.99% | 0.23%(+0.756)#66 | 0.54%(+0.446)#3,776 |
| 67. | Forest City | 0.98% | 0.23%(+0.747)#67 | 0.54%(+0.436)#3,814 |
| 68. | Warrenville | 0.97% | 0.23%(+0.734)#68 | 0.54%(+0.424)#3,855 |
| 69. | Posen | 0.96% | 0.23%(+0.722)#69 | 0.54%(+0.411)#3,888 |
| 70. | Lewistown | 0.93% | 0.23%(+0.695)#70 | 0.54%(+0.384)#3,973 |
| 71. | Vermont | 0.93% | 0.23%(+0.695)#71 | 0.54%(+0.384)#3,974 |
| 72. | Lawrenceville | 0.93% | 0.23%(+0.693)#72 | 0.54%(+0.382)#3,983 |
| 73. | Lincolnshire | 0.92% | 0.23%(+0.689)#73 | 0.54%(+0.379)#3,993 |
| 74. | Fithian | 0.91% | 0.23%(+0.674)#74 | 0.54%(+0.363)#4,042 |
| 75. | Oakford | 0.90% | 0.23%(+0.663)#75 | 0.54%(+0.352)#4,082 |
| 76. | South Roxana | 0.90% | 0.23%(+0.662)#76 | 0.54%(+0.351)#4,086 |
| 77. | Goodfield | 0.88% | 0.23%(+0.649)#77 | 0.54%(+0.339)#4,138 |
| 78. | Hull | 0.87% | 0.23%(+0.636)#78 | 0.54%(+0.325)#4,200 |
| 79. | Wheaton | 0.86% | 0.23%(+0.631)#79 | 0.54%(+0.320)#4,227 |
| 80. | Hanaford | 0.85% | 0.23%(+0.621)#80 | 0.54%(+0.310)#4,260 |
| 81. | Winthrop Harbor | 0.85% | 0.23%(+0.618)#81 | 0.54%(+0.307)#4,276 |
| 82. | Buckingham | 0.85% | 0.23%(+0.617)#82 | 0.54%(+0.307)#4,277 |
| 83. | Wood Dale | 0.84% | 0.23%(+0.608)#83 | 0.54%(+0.297)#4,306 |
| 84. | Rosiclare | 0.82% | 0.23%(+0.587)#84 | 0.54%(+0.276)#4,412 |
| 85. | New Athens | 0.82% | 0.23%(+0.586)#85 | 0.54%(+0.276)#4,414 |
| 86. | Coffeen | 0.82% | 0.23%(+0.586)#86 | 0.54%(+0.275)#4,419 |
| 87. | Prairie Grove | 0.81% | 0.23%(+0.580)#87 | 0.54%(+0.269)#4,451 |
| 88. | Sandwich | 0.81% | 0.23%(+0.579)#88 | 0.54%(+0.268)#4,453 |
| 89. | Creve Coeur | 0.81% | 0.23%(+0.576)#89 | 0.54%(+0.265)#4,463 |
| 90. | Lake Summerset | 0.80% | 0.23%(+0.570)#90 | 0.54%(+0.259)#4,487 |
| 91. | Colchester | 0.80% | 0.23%(+0.570)#91 | 0.54%(+0.259)#4,488 |
| 92. | Elsah | 0.79% | 0.23%(+0.561)#92 | 0.54%(+0.250)#4,528 |
| 93. | Westville | 0.78% | 0.23%(+0.544)#93 | 0.54%(+0.234)#4,589 |
| 94. | Havana | 0.77% | 0.23%(+0.537)#94 | 0.54%(+0.227)#4,613 |
| 95. | Batavia | 0.77% | 0.23%(+0.536)#95 | 0.54%(+0.226)#4,616 |
| 96. | Lake Villa | 0.77% | 0.23%(+0.536)#96 | 0.54%(+0.226)#4,617 |
| 97. | Radom | 0.77% | 0.23%(+0.535)#97 | 0.54%(+0.225)#4,627 |
| 98. | Palos Heights | 0.77% | 0.23%(+0.535)#98 | 0.54%(+0.224)#4,628 |
| 99. | Wayne | 0.76% | 0.23%(+0.530)#99 | 0.54%(+0.220)#4,645 |
| 100. | Orangeville | 0.76% | 0.23%(+0.530)#100 | 0.54%(+0.219)#4,650 |
Common Questions
What are the Top 10 Cities with the Highest Percentage of French Canadian Population in Illinois?
Top 10 Cities with the Highest Percentage of French Canadian Population in Illinois are:
What city has the Highest Percentage of French Canadian Population in Illinois?
Fults has the Highest Percentage of French Canadian Population in Illinois with 16.67%.
What is the Percentage of French Canadian Population in the State of Illinois?
Percentage of French Canadian Population in Illinois is 0.23%.
What is the Percentage of French Canadian Population in the United States?
Percentage of French Canadian Population in the United States is 0.54%.