Zip Codes with the Highest Percentage of Population Employed in Food Preparation & Serving in Downers Grove, IL
RELATED REPORTS & OPTIONS
Food Preparation & Serving
Downers Grove
Compare Zip Codes
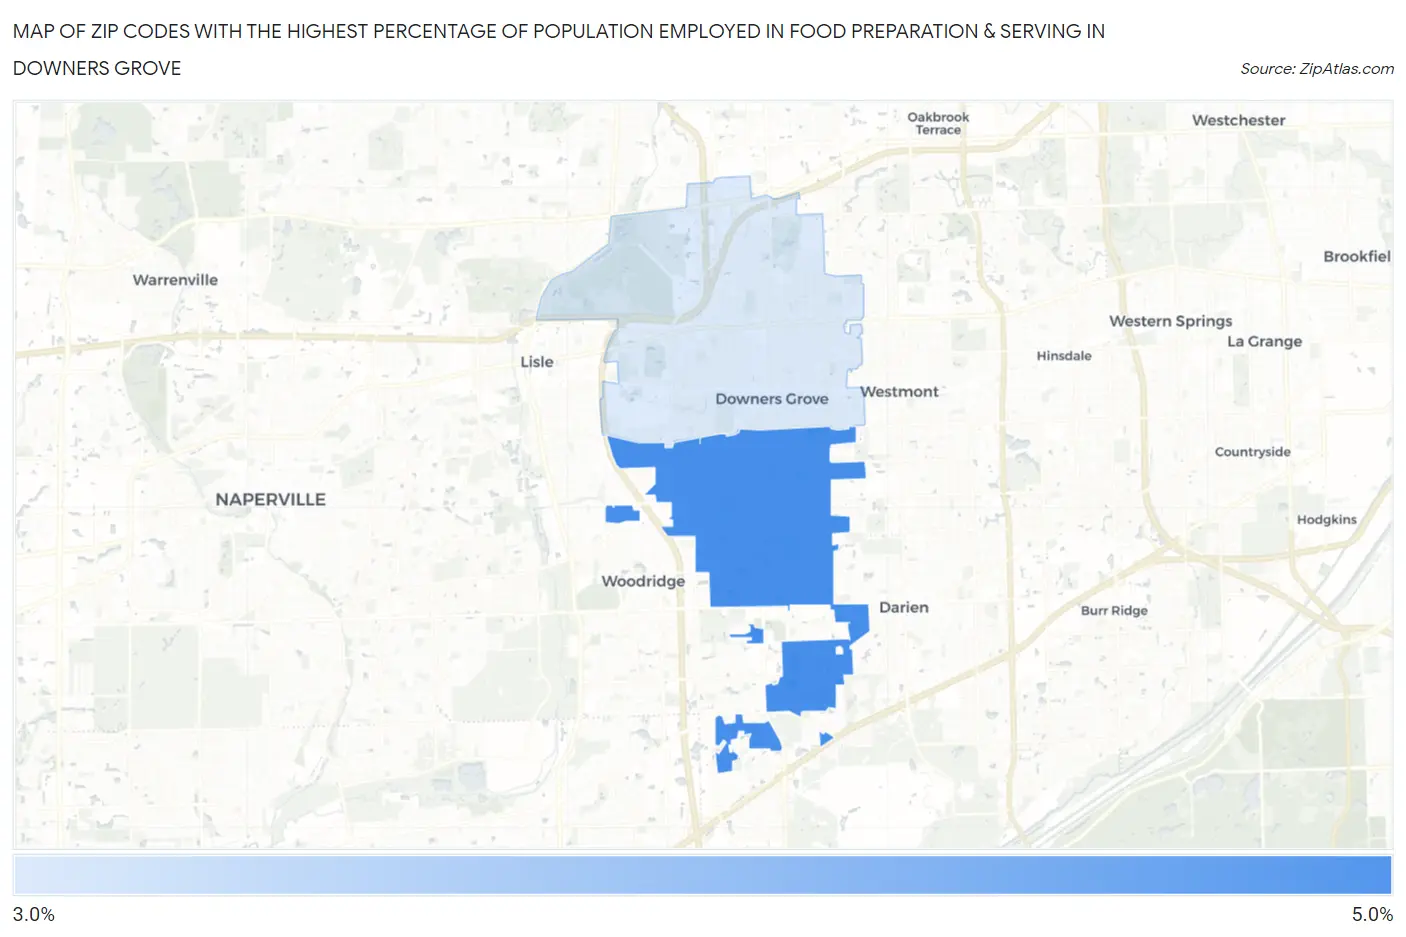
Map of Zip Codes with the Highest Percentage of Population Employed in Food Preparation & Serving in Downers Grove
3.5%
4.1%
Zip Codes with the Highest Percentage of Population Employed in Food Preparation & Serving in Downers Grove, IL
| Zip Code | % Employed | vs State | vs National | |
| 1. | 60516 | 4.1% | 5.0%(-0.981)#723 | 5.3%(-1.23)#16,920 |
| 2. | 60515 | 3.5% | 5.0%(-1.54)#827 | 5.3%(-1.79)#19,209 |
1
Common Questions
What are the Top Zip Codes with the Highest Percentage of Population Employed in Food Preparation & Serving in Downers Grove, IL?
Top Zip Codes with the Highest Percentage of Population Employed in Food Preparation & Serving in Downers Grove, IL are:
What zip code has the Highest Percentage of Population Employed in Food Preparation & Serving in Downers Grove, IL?
60516 has the Highest Percentage of Population Employed in Food Preparation & Serving in Downers Grove, IL with 4.1%.
What is the Percentage of Population Employed in Food Preparation & Serving in Downers Grove, IL?
Percentage of Population Employed in Food Preparation & Serving in Downers Grove is 3.8%.
What is the Percentage of Population Employed in Food Preparation & Serving in Illinois?
Percentage of Population Employed in Food Preparation & Serving in Illinois is 5.0%.
What is the Percentage of Population Employed in Food Preparation & Serving in the United States?
Percentage of Population Employed in Food Preparation & Serving in the United States is 5.3%.