Zip Codes with the Highest Percentage of Population Employed in Food Preparation & Serving in Palatine, IL
RELATED REPORTS & OPTIONS
Food Preparation & Serving
Palatine
Compare Zip Codes
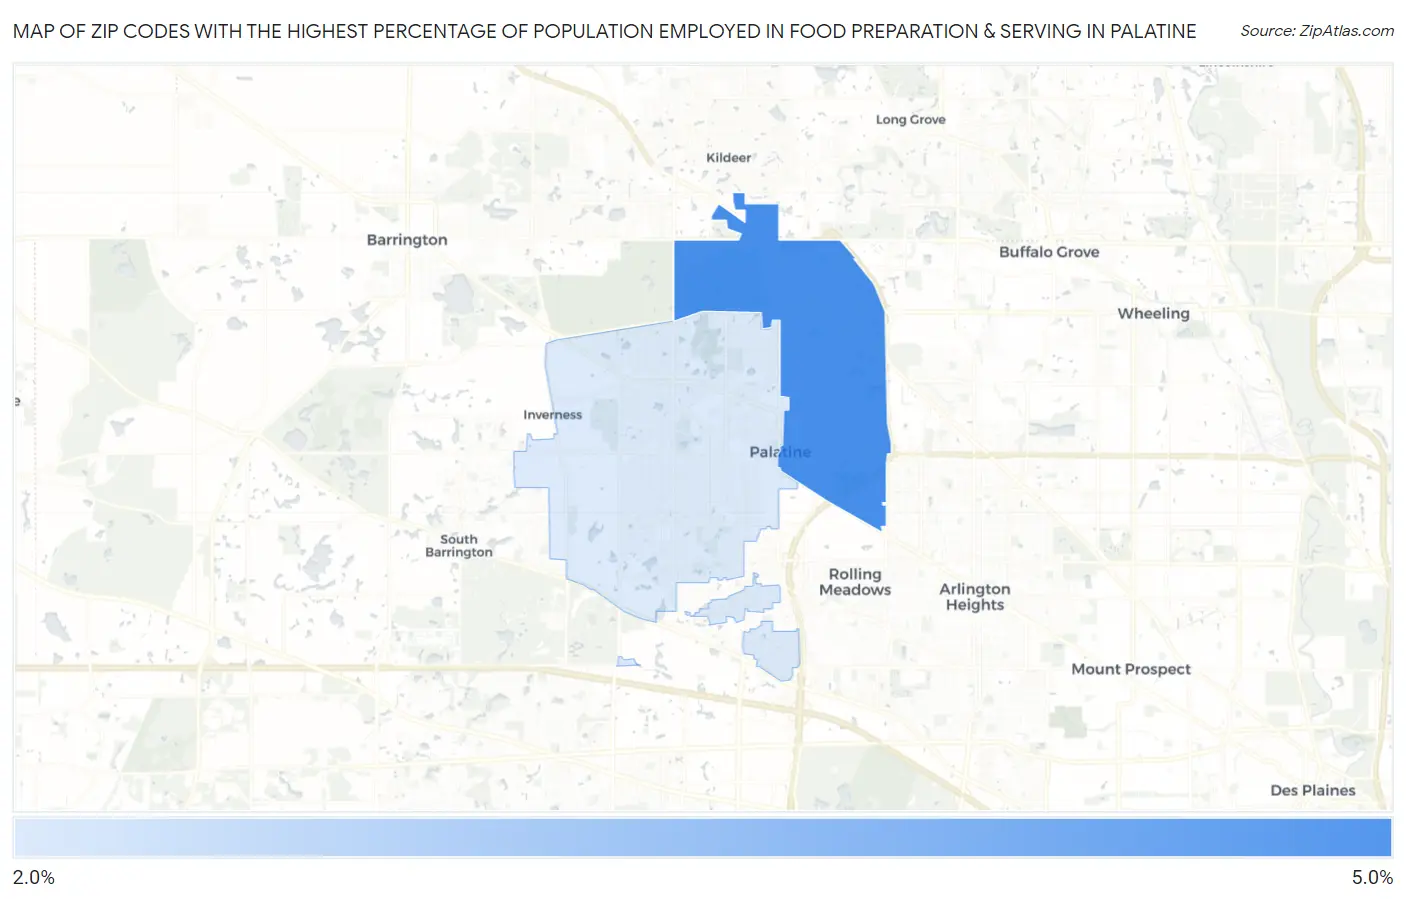
Map of Zip Codes with the Highest Percentage of Population Employed in Food Preparation & Serving in Palatine
2.7%
5.0%
Zip Codes with the Highest Percentage of Population Employed in Food Preparation & Serving in Palatine, IL
| Zip Code | % Employed | vs State | vs National | |
| 1. | 60074 | 5.0% | 5.0%(-0.082)#570 | 5.3%(-0.333)#13,136 |
| 2. | 60067 | 2.7% | 5.0%(-2.33)#987 | 5.3%(-2.58)#22,412 |
1
Common Questions
What are the Top Zip Codes with the Highest Percentage of Population Employed in Food Preparation & Serving in Palatine, IL?
Top Zip Codes with the Highest Percentage of Population Employed in Food Preparation & Serving in Palatine, IL are:
What zip code has the Highest Percentage of Population Employed in Food Preparation & Serving in Palatine, IL?
60074 has the Highest Percentage of Population Employed in Food Preparation & Serving in Palatine, IL with 5.0%.
What is the Percentage of Population Employed in Food Preparation & Serving in Palatine, IL?
Percentage of Population Employed in Food Preparation & Serving in Palatine is 3.8%.
What is the Percentage of Population Employed in Food Preparation & Serving in Illinois?
Percentage of Population Employed in Food Preparation & Serving in Illinois is 5.0%.
What is the Percentage of Population Employed in Food Preparation & Serving in the United States?
Percentage of Population Employed in Food Preparation & Serving in the United States is 5.3%.