Cities with the Highest Percentage of Serbian Population in Illinois
RELATED REPORTS & OPTIONS
Serbian
Illinois
Compare Cities
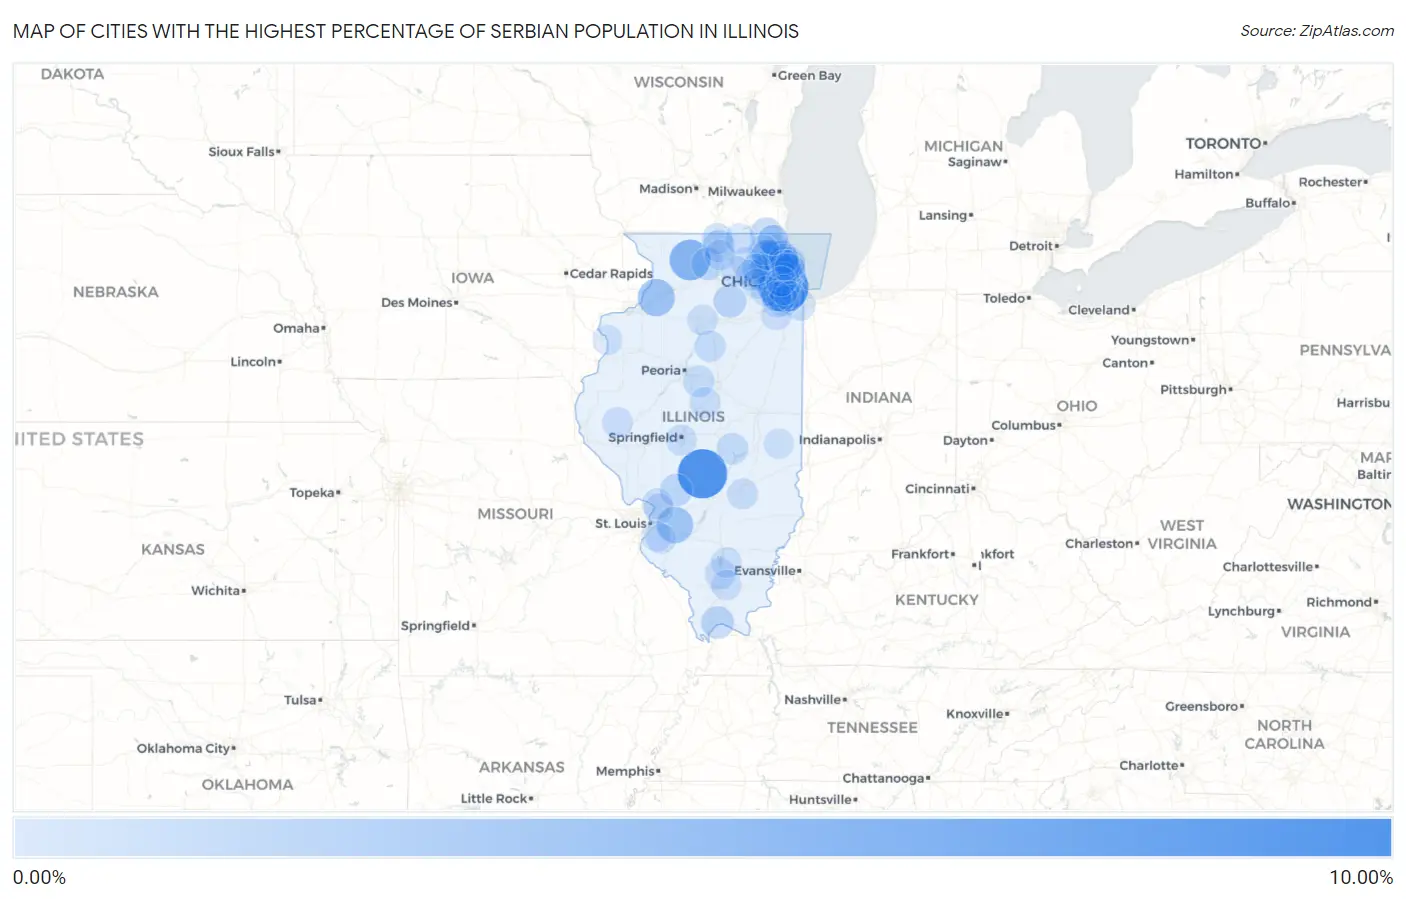
Map of Cities with the Highest Percentage of Serbian Population in Illinois
0.00%
10.00%
Cities with the Highest Percentage of Serbian Population in Illinois
| City | Serbian | vs State | vs National | |
| 1. | Mccook | 8.70% | 0.20%(+8.50)#1 | 0.059%(+8.64)#15 |
| 2. | Nokomis | 8.58% | 0.20%(+8.38)#2 | 0.059%(+8.52)#16 |
| 3. | Lockport Heights | 7.02% | 0.20%(+6.82)#3 | 0.059%(+6.96)#21 |
| 4. | Adeline | 4.82% | 0.20%(+4.62)#4 | 0.059%(+4.76)#33 |
| 5. | Indian Head Park | 4.77% | 0.20%(+4.57)#5 | 0.059%(+4.71)#34 |
| 6. | Erie | 3.23% | 0.20%(+3.03)#6 | 0.059%(+3.17)#57 |
| 7. | Summerfield | 2.94% | 0.20%(+2.74)#7 | 0.059%(+2.88)#71 |
| 8. | Lyons | 2.82% | 0.20%(+2.62)#8 | 0.059%(+2.76)#73 |
| 9. | Brookfield | 2.48% | 0.20%(+2.28)#9 | 0.059%(+2.42)#83 |
| 10. | Plum Valley | 2.22% | 0.20%(+2.02)#10 | 0.059%(+2.16)#89 |
| 11. | Countryside | 2.10% | 0.20%(+1.90)#11 | 0.059%(+2.05)#95 |
| 12. | Rosemont | 1.99% | 0.20%(+1.79)#12 | 0.059%(+1.93)#109 |
| 13. | Harwood Heights | 1.89% | 0.20%(+1.69)#13 | 0.059%(+1.83)#121 |
| 14. | Burr Ridge | 1.84% | 0.20%(+1.64)#14 | 0.059%(+1.78)#126 |
| 15. | La Grange | 1.77% | 0.20%(+1.57)#15 | 0.059%(+1.71)#132 |
| 16. | Prospect Heights | 1.70% | 0.20%(+1.50)#16 | 0.059%(+1.64)#141 |
| 17. | Norridge | 1.67% | 0.20%(+1.48)#17 | 0.059%(+1.62)#144 |
| 18. | New Grand Chain | 1.43% | 0.20%(+1.23)#18 | 0.059%(+1.37)#185 |
| 19. | Riverwoods | 1.42% | 0.20%(+1.22)#19 | 0.059%(+1.36)#190 |
| 20. | North Riverside | 1.42% | 0.20%(+1.22)#20 | 0.059%(+1.36)#191 |
| 21. | Wood Dale | 1.42% | 0.20%(+1.22)#21 | 0.059%(+1.36)#193 |
| 22. | Leland | 1.38% | 0.20%(+1.18)#22 | 0.059%(+1.33)#200 |
| 23. | Itasca | 1.38% | 0.20%(+1.18)#23 | 0.059%(+1.32)#201 |
| 24. | Mount Olive | 1.26% | 0.20%(+1.06)#24 | 0.059%(+1.20)#220 |
| 25. | Channel Lake | 1.23% | 0.20%(+1.03)#25 | 0.059%(+1.17)#221 |
| 26. | Park Ridge | 1.23% | 0.20%(+1.03)#26 | 0.059%(+1.17)#225 |
| 27. | Stillman Valley | 1.19% | 0.20%(+0.990)#27 | 0.059%(+1.13)#234 |
| 28. | Carol Stream | 1.19% | 0.20%(+0.989)#28 | 0.059%(+1.13)#235 |
| 29. | Kildeer | 1.19% | 0.20%(+0.986)#29 | 0.059%(+1.13)#236 |
| 30. | Bensenville | 1.16% | 0.20%(+0.958)#30 | 0.059%(+1.10)#244 |
| 31. | Addison | 1.15% | 0.20%(+0.950)#31 | 0.059%(+1.09)#248 |
| 32. | Lincolnwood | 1.15% | 0.20%(+0.946)#32 | 0.059%(+1.09)#252 |
| 33. | Downers Grove | 1.13% | 0.20%(+0.927)#33 | 0.059%(+1.07)#256 |
| 34. | Darien | 1.12% | 0.20%(+0.921)#34 | 0.059%(+1.06)#259 |
| 35. | Loves Park | 1.09% | 0.20%(+0.891)#35 | 0.059%(+1.03)#267 |
| 36. | Westchester | 0.95% | 0.20%(+0.753)#36 | 0.059%(+0.894)#314 |
| 37. | Bannockburn | 0.94% | 0.20%(+0.740)#37 | 0.059%(+0.880)#320 |
| 38. | Elk Grove Village | 0.91% | 0.20%(+0.715)#38 | 0.059%(+0.855)#327 |
| 39. | Bethany | 0.90% | 0.20%(+0.697)#39 | 0.059%(+0.838)#336 |
| 40. | Niles | 0.89% | 0.20%(+0.695)#40 | 0.059%(+0.836)#337 |
| 41. | Hoffman Estates | 0.89% | 0.20%(+0.694)#41 | 0.059%(+0.834)#340 |
| 42. | Heritage Lake | 0.88% | 0.20%(+0.679)#42 | 0.059%(+0.819)#345 |
| 43. | Winnetka | 0.87% | 0.20%(+0.673)#43 | 0.059%(+0.814)#349 |
| 44. | Fox River Grove | 0.87% | 0.20%(+0.670)#44 | 0.059%(+0.811)#351 |
| 45. | Western Springs | 0.80% | 0.20%(+0.605)#45 | 0.059%(+0.745)#376 |
| 46. | Toluca | 0.80% | 0.20%(+0.603)#46 | 0.059%(+0.744)#378 |
| 47. | Riverside | 0.78% | 0.20%(+0.581)#47 | 0.059%(+0.722)#393 |
| 48. | Long Grove | 0.77% | 0.20%(+0.574)#48 | 0.059%(+0.714)#397 |
| 49. | Lansing | 0.72% | 0.20%(+0.525)#49 | 0.059%(+0.666)#430 |
| 50. | Wayne | 0.72% | 0.20%(+0.520)#50 | 0.059%(+0.660)#433 |
| 51. | Lake Barrington | 0.71% | 0.20%(+0.508)#51 | 0.059%(+0.648)#439 |
| 52. | Roscoe | 0.68% | 0.20%(+0.483)#52 | 0.059%(+0.624)#455 |
| 53. | Atlanta | 0.65% | 0.20%(+0.452)#53 | 0.059%(+0.593)#482 |
| 54. | Des Plaines | 0.65% | 0.20%(+0.448)#54 | 0.059%(+0.589)#487 |
| 55. | Orient | 0.64% | 0.20%(+0.444)#55 | 0.059%(+0.584)#490 |
| 56. | Watson | 0.63% | 0.20%(+0.435)#56 | 0.059%(+0.575)#498 |
| 57. | Libertyville | 0.63% | 0.20%(+0.428)#57 | 0.059%(+0.569)#507 |
| 58. | Hampshire | 0.62% | 0.20%(+0.417)#58 | 0.059%(+0.558)#515 |
| 59. | Streamwood | 0.59% | 0.20%(+0.392)#59 | 0.059%(+0.533)#530 |
| 60. | Campton Hills | 0.58% | 0.20%(+0.379)#60 | 0.059%(+0.519)#542 |
| 61. | Southern View | 0.56% | 0.20%(+0.361)#61 | 0.059%(+0.502)#556 |
| 62. | Palos Hills | 0.55% | 0.20%(+0.348)#62 | 0.059%(+0.488)#565 |
| 63. | Mount Prospect | 0.54% | 0.20%(+0.338)#63 | 0.059%(+0.479)#575 |
| 64. | Rosewood Heights | 0.54% | 0.20%(+0.337)#64 | 0.059%(+0.477)#576 |
| 65. | Evergreen Park | 0.53% | 0.20%(+0.333)#65 | 0.059%(+0.473)#581 |
| 66. | Morton Grove | 0.52% | 0.20%(+0.319)#66 | 0.059%(+0.459)#593 |
| 67. | Roxana | 0.51% | 0.20%(+0.310)#67 | 0.059%(+0.451)#605 |
| 68. | Mount Sterling | 0.51% | 0.20%(+0.306)#68 | 0.059%(+0.447)#608 |
| 69. | Ewing | 0.51% | 0.20%(+0.306)#69 | 0.059%(+0.446)#609 |
| 70. | Hinsdale | 0.48% | 0.20%(+0.284)#70 | 0.059%(+0.425)#636 |
| 71. | Cherry Valley | 0.47% | 0.20%(+0.275)#71 | 0.059%(+0.416)#640 |
| 72. | Pittsburg | 0.47% | 0.20%(+0.274)#72 | 0.059%(+0.414)#643 |
| 73. | Orland Park | 0.47% | 0.20%(+0.269)#73 | 0.059%(+0.409)#648 |
| 74. | River Grove | 0.47% | 0.20%(+0.266)#74 | 0.059%(+0.407)#651 |
| 75. | Seatonville | 0.46% | 0.20%(+0.264)#75 | 0.059%(+0.404)#657 |
| 76. | Manhattan | 0.45% | 0.20%(+0.249)#76 | 0.059%(+0.390)#670 |
| 77. | Homer Glen | 0.43% | 0.20%(+0.233)#77 | 0.059%(+0.374)#698 |
| 78. | Northbrook | 0.42% | 0.20%(+0.221)#78 | 0.059%(+0.362)#713 |
| 79. | Naperville | 0.42% | 0.20%(+0.221)#79 | 0.059%(+0.361)#716 |
| 80. | North Barrington | 0.42% | 0.20%(+0.218)#80 | 0.059%(+0.358)#721 |
| 81. | Lindenhurst | 0.42% | 0.20%(+0.217)#81 | 0.059%(+0.358)#723 |
| 82. | Wilmette | 0.41% | 0.20%(+0.215)#82 | 0.059%(+0.355)#726 |
| 83. | Sycamore | 0.41% | 0.20%(+0.214)#83 | 0.059%(+0.354)#728 |
| 84. | Palos Park | 0.39% | 0.20%(+0.194)#84 | 0.059%(+0.334)#752 |
| 85. | Justice | 0.38% | 0.20%(+0.184)#85 | 0.059%(+0.324)#768 |
| 86. | Millstadt | 0.37% | 0.20%(+0.173)#86 | 0.059%(+0.313)#781 |
| 87. | Skokie | 0.37% | 0.20%(+0.169)#87 | 0.059%(+0.309)#789 |
| 88. | Batavia | 0.36% | 0.20%(+0.165)#88 | 0.059%(+0.306)#799 |
| 89. | Smithton | 0.36% | 0.20%(+0.159)#89 | 0.059%(+0.299)#809 |
| 90. | Brocton | 0.36% | 0.20%(+0.158)#90 | 0.059%(+0.298)#812 |
| 91. | Keithsburg | 0.35% | 0.20%(+0.152)#91 | 0.059%(+0.292)#819 |
| 92. | Alsip | 0.35% | 0.20%(+0.151)#92 | 0.059%(+0.291)#821 |
| 93. | Lemont | 0.35% | 0.20%(+0.148)#93 | 0.059%(+0.289)#824 |
| 94. | Deerfield | 0.34% | 0.20%(+0.145)#94 | 0.059%(+0.285)#833 |
| 95. | Glenview | 0.33% | 0.20%(+0.135)#95 | 0.059%(+0.275)#854 |
| 96. | Venetian Village | 0.33% | 0.20%(+0.131)#96 | 0.059%(+0.272)#862 |
| 97. | Hillside | 0.33% | 0.20%(+0.130)#97 | 0.059%(+0.270)#868 |
| 98. | Island Lake | 0.32% | 0.20%(+0.124)#98 | 0.059%(+0.265)#882 |
| 99. | Elgin | 0.32% | 0.20%(+0.120)#99 | 0.059%(+0.261)#889 |
| 100. | Harvard | 0.32% | 0.20%(+0.120)#100 | 0.059%(+0.261)#891 |
Common Questions
What are the Top 10 Cities with the Highest Percentage of Serbian Population in Illinois?
Top 10 Cities with the Highest Percentage of Serbian Population in Illinois are:
#1
8.70%
#2
8.58%
#3
4.82%
#4
4.77%
#5
3.23%
#6
2.94%
#7
2.82%
#8
2.48%
#9
2.10%
#10
1.99%
What city has the Highest Percentage of Serbian Population in Illinois?
McCook has the Highest Percentage of Serbian Population in Illinois with 8.70%.
What is the Percentage of Serbian Population in the State of Illinois?
Percentage of Serbian Population in Illinois is 0.20%.
What is the Percentage of Serbian Population in the United States?
Percentage of Serbian Population in the United States is 0.059%.