Zip Codes with the Highest Percentage of Population Employed in Food Preparation & Serving in Danville, IL
RELATED REPORTS & OPTIONS
Food Preparation & Serving
Danville
Compare Zip Codes
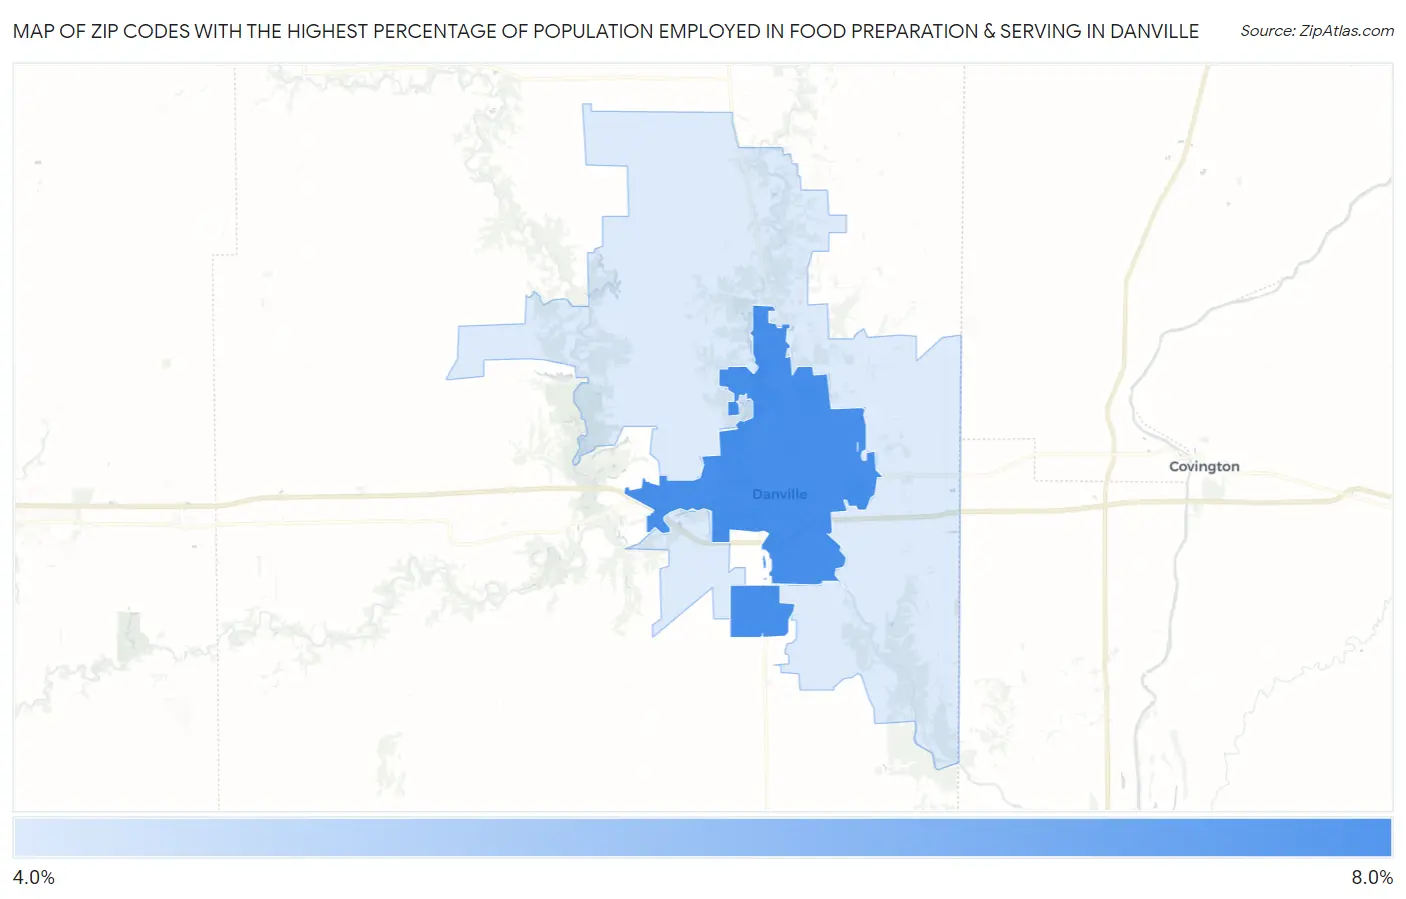
Map of Zip Codes with the Highest Percentage of Population Employed in Food Preparation & Serving in Danville
4.2%
6.1%
Zip Codes with the Highest Percentage of Population Employed in Food Preparation & Serving in Danville, IL
| Zip Code | % Employed | vs State | vs National | |
| 1. | 61832 | 6.1% | 5.0%(+1.04)#381 | 5.3%(+0.791)#9,101 |
| 2. | 61834 | 4.2% | 5.0%(-0.874)#701 | 5.3%(-1.13)#16,467 |
1
Common Questions
What are the Top Zip Codes with the Highest Percentage of Population Employed in Food Preparation & Serving in Danville, IL?
Top Zip Codes with the Highest Percentage of Population Employed in Food Preparation & Serving in Danville, IL are:
What zip code has the Highest Percentage of Population Employed in Food Preparation & Serving in Danville, IL?
61832 has the Highest Percentage of Population Employed in Food Preparation & Serving in Danville, IL with 6.1%.
What is the Percentage of Population Employed in Food Preparation & Serving in Danville, IL?
Percentage of Population Employed in Food Preparation & Serving in Danville is 5.8%.
What is the Percentage of Population Employed in Food Preparation & Serving in Illinois?
Percentage of Population Employed in Food Preparation & Serving in Illinois is 5.0%.
What is the Percentage of Population Employed in Food Preparation & Serving in the United States?
Percentage of Population Employed in Food Preparation & Serving in the United States is 5.3%.