Cities with the Highest Percentage of Sri Lankan Population in Illinois
RELATED REPORTS & OPTIONS
Sri Lankan
Illinois
Compare Cities
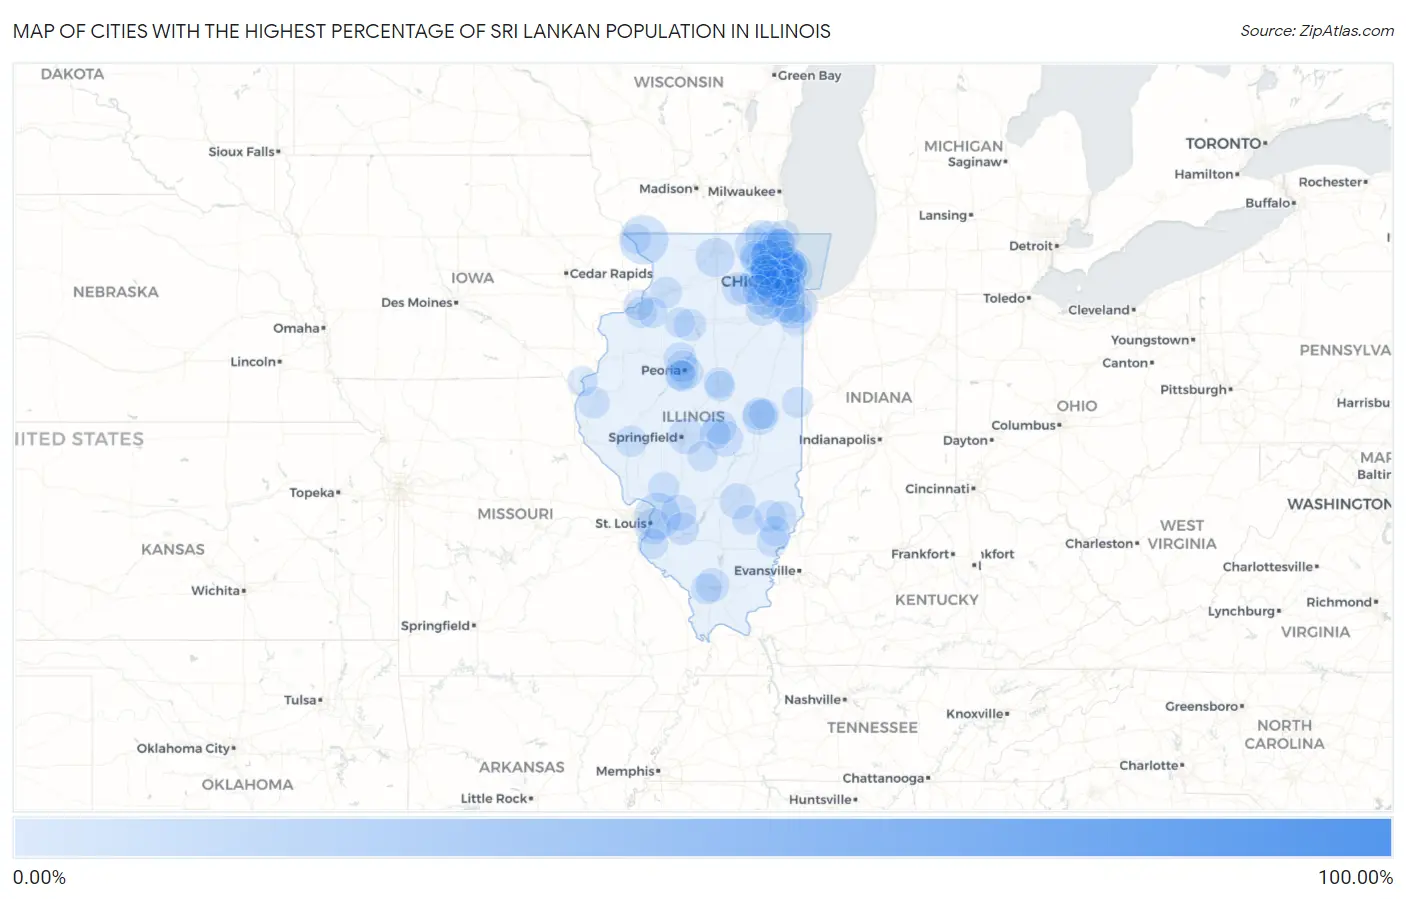
Map of Cities with the Highest Percentage of Sri Lankan Population in Illinois
0.00%
100.00%
Cities with the Highest Percentage of Sri Lankan Population in Illinois
| City | Sri Lankan | vs State | vs National | |
| 1. | Eagle Lake | 81.03% | 0.29%(+80.7)#1 | 0.68%(+80.4)#1 |
| 2. | Arbury Hills | 6.76% | 0.29%(+6.46)#2 | 0.68%(+6.08)#90 |
| 3. | The Galena Territory | 5.23% | 0.29%(+4.94)#3 | 0.68%(+4.55)#148 |
| 4. | Pontoon Beach | 4.60% | 0.29%(+4.31)#4 | 0.68%(+3.92)#190 |
| 5. | Lincolnwood | 4.10% | 0.29%(+3.81)#5 | 0.68%(+3.42)#227 |
| 6. | Harwood Heights | 3.42% | 0.29%(+3.13)#6 | 0.68%(+2.74)#311 |
| 7. | Glendale Heights | 3.05% | 0.29%(+2.75)#7 | 0.68%(+2.37)#376 |
| 8. | Olympia Fields | 2.68% | 0.29%(+2.39)#8 | 0.68%(+2.00)#461 |
| 9. | New Milford | 2.67% | 0.29%(+2.38)#9 | 0.68%(+1.99)#462 |
| 10. | Carol Stream | 2.39% | 0.29%(+2.09)#10 | 0.68%(+1.71)#535 |
| 11. | Bull Valley | 2.32% | 0.29%(+2.03)#11 | 0.68%(+1.65)#561 |
| 12. | Mccook | 2.01% | 0.29%(+1.71)#12 | 0.68%(+1.33)#668 |
| 13. | Clear Lake | 1.90% | 0.29%(+1.60)#13 | 0.68%(+1.22)#727 |
| 14. | Mount Zion | 1.87% | 0.29%(+1.58)#14 | 0.68%(+1.19)#746 |
| 15. | Edgewood | 1.86% | 0.29%(+1.57)#15 | 0.68%(+1.19)#749 |
| 16. | Sauget | 1.85% | 0.29%(+1.56)#16 | 0.68%(+1.17)#756 |
| 17. | Lansing | 1.83% | 0.29%(+1.53)#17 | 0.68%(+1.15)#770 |
| 18. | Morton Grove | 1.79% | 0.29%(+1.50)#18 | 0.68%(+1.12)#789 |
| 19. | Highland | 1.78% | 0.29%(+1.49)#19 | 0.68%(+1.10)#795 |
| 20. | Barrington Hills | 1.77% | 0.29%(+1.48)#20 | 0.68%(+1.10)#798 |
| 21. | Lake Villa | 1.75% | 0.29%(+1.45)#21 | 0.68%(+1.07)#817 |
| 22. | Savoy | 1.67% | 0.29%(+1.38)#22 | 0.68%(+0.992)#867 |
| 23. | Skokie | 1.56% | 0.29%(+1.27)#23 | 0.68%(+0.882)#962 |
| 24. | Broadview | 1.48% | 0.29%(+1.19)#24 | 0.68%(+0.804)#1,021 |
| 25. | Shorewood | 1.35% | 0.29%(+1.05)#25 | 0.68%(+0.669)#1,143 |
| 26. | Carterville | 1.25% | 0.29%(+0.956)#26 | 0.68%(+0.572)#1,254 |
| 27. | North Barrington | 1.25% | 0.29%(+0.956)#27 | 0.68%(+0.572)#1,256 |
| 28. | Forsyth | 1.24% | 0.29%(+0.950)#28 | 0.68%(+0.566)#1,267 |
| 29. | Niles | 1.23% | 0.29%(+0.936)#29 | 0.68%(+0.552)#1,280 |
| 30. | Hinckley | 1.21% | 0.29%(+0.912)#30 | 0.68%(+0.529)#1,306 |
| 31. | Indian Creek | 1.20% | 0.29%(+0.910)#31 | 0.68%(+0.526)#1,309 |
| 32. | Northlake | 1.15% | 0.29%(+0.856)#32 | 0.68%(+0.473)#1,367 |
| 33. | Albers | 1.10% | 0.29%(+0.810)#33 | 0.68%(+0.426)#1,423 |
| 34. | Dunlap | 1.06% | 0.29%(+0.764)#34 | 0.68%(+0.380)#1,486 |
| 35. | Spring Grove | 1.02% | 0.29%(+0.724)#35 | 0.68%(+0.340)#1,544 |
| 36. | Grayslake | 1.01% | 0.29%(+0.715)#36 | 0.68%(+0.331)#1,550 |
| 37. | Beecher | 0.94% | 0.29%(+0.648)#37 | 0.68%(+0.264)#1,652 |
| 38. | East Peoria | 0.94% | 0.29%(+0.645)#38 | 0.68%(+0.262)#1,660 |
| 39. | South Barrington | 0.94% | 0.29%(+0.645)#39 | 0.68%(+0.261)#1,662 |
| 40. | Champaign | 0.94% | 0.29%(+0.644)#40 | 0.68%(+0.260)#1,665 |
| 41. | Tiskilwa | 0.94% | 0.29%(+0.644)#41 | 0.68%(+0.260)#1,666 |
| 42. | Burbank | 0.94% | 0.29%(+0.643)#42 | 0.68%(+0.259)#1,668 |
| 43. | Mount Prospect | 0.92% | 0.29%(+0.629)#43 | 0.68%(+0.245)#1,698 |
| 44. | Peoria | 0.85% | 0.29%(+0.555)#44 | 0.68%(+0.171)#1,822 |
| 45. | Zion | 0.85% | 0.29%(+0.552)#45 | 0.68%(+0.168)#1,827 |
| 46. | West Point | 0.84% | 0.29%(+0.542)#46 | 0.68%(+0.158)#1,850 |
| 47. | Hanover Park | 0.80% | 0.29%(+0.503)#47 | 0.68%(+0.119)#1,927 |
| 48. | Burr Ridge | 0.78% | 0.29%(+0.487)#48 | 0.68%(+0.103)#1,964 |
| 49. | Albion | 0.75% | 0.29%(+0.454)#49 | 0.68%(+0.071)#2,037 |
| 50. | Algonquin | 0.75% | 0.29%(+0.451)#50 | 0.68%(+0.068)#2,042 |
| 51. | Gurnee | 0.73% | 0.29%(+0.440)#51 | 0.68%(+0.056)#2,068 |
| 52. | Olney | 0.73% | 0.29%(+0.439)#52 | 0.68%(+0.055)#2,074 |
| 53. | Royal Lakes | 0.73% | 0.29%(+0.438)#53 | 0.68%(+0.054)#2,079 |
| 54. | Warrenville | 0.72% | 0.29%(+0.430)#54 | 0.68%(+0.046)#2,092 |
| 55. | Lyndon | 0.71% | 0.29%(+0.418)#55 | 0.68%(+0.035)#2,112 |
| 56. | Bluffs | 0.71% | 0.29%(+0.416)#56 | 0.68%(+0.032)#2,121 |
| 57. | Lake In The Hills | 0.70% | 0.29%(+0.406)#57 | 0.68%(+0.023)#2,159 |
| 58. | Bismarck | 0.68% | 0.29%(+0.382)#58 | 0.68%(-0.002)#2,229 |
| 59. | Arlington Heights | 0.67% | 0.29%(+0.377)#59 | 0.68%(-0.007)#2,245 |
| 60. | Harristown | 0.67% | 0.29%(+0.375)#60 | 0.68%(-0.009)#2,250 |
| 61. | Carbondale | 0.65% | 0.29%(+0.354)#61 | 0.68%(-0.030)#2,299 |
| 62. | Colona | 0.63% | 0.29%(+0.335)#62 | 0.68%(-0.049)#2,362 |
| 63. | Hoffman Estates | 0.63% | 0.29%(+0.332)#63 | 0.68%(-0.052)#2,366 |
| 64. | Evanston | 0.62% | 0.29%(+0.330)#64 | 0.68%(-0.054)#2,369 |
| 65. | North Pekin | 0.62% | 0.29%(+0.322)#65 | 0.68%(-0.062)#2,394 |
| 66. | Bannockburn | 0.56% | 0.29%(+0.269)#66 | 0.68%(-0.115)#2,540 |
| 67. | Geneva | 0.56% | 0.29%(+0.262)#67 | 0.68%(-0.122)#2,563 |
| 68. | Mokena | 0.55% | 0.29%(+0.253)#68 | 0.68%(-0.130)#2,590 |
| 69. | Matteson | 0.54% | 0.29%(+0.245)#69 | 0.68%(-0.139)#2,611 |
| 70. | Bartonville | 0.54% | 0.29%(+0.243)#70 | 0.68%(-0.141)#2,618 |
| 71. | Crest Hill | 0.53% | 0.29%(+0.238)#71 | 0.68%(-0.145)#2,628 |
| 72. | Plainfield | 0.53% | 0.29%(+0.235)#72 | 0.68%(-0.149)#2,644 |
| 73. | Geneseo | 0.53% | 0.29%(+0.235)#73 | 0.68%(-0.149)#2,645 |
| 74. | Waterloo | 0.52% | 0.29%(+0.223)#74 | 0.68%(-0.161)#2,687 |
| 75. | Forest Park | 0.52% | 0.29%(+0.221)#75 | 0.68%(-0.163)#2,694 |
| 76. | Berkeley | 0.51% | 0.29%(+0.216)#76 | 0.68%(-0.167)#2,712 |
| 77. | Bensenville | 0.49% | 0.29%(+0.198)#77 | 0.68%(-0.186)#2,779 |
| 78. | Winnetka | 0.49% | 0.29%(+0.197)#78 | 0.68%(-0.187)#2,782 |
| 79. | Big Rock | 0.49% | 0.29%(+0.197)#79 | 0.68%(-0.187)#2,787 |
| 80. | Hickory Hills | 0.49% | 0.29%(+0.195)#80 | 0.68%(-0.189)#2,795 |
| 81. | Urbana | 0.47% | 0.29%(+0.180)#81 | 0.68%(-0.204)#2,850 |
| 82. | Bloomingdale | 0.47% | 0.29%(+0.173)#82 | 0.68%(-0.210)#2,872 |
| 83. | Nauvoo | 0.46% | 0.29%(+0.170)#83 | 0.68%(-0.214)#2,884 |
| 84. | Winfield | 0.46% | 0.29%(+0.168)#84 | 0.68%(-0.216)#2,891 |
| 85. | Sumner | 0.46% | 0.29%(+0.162)#85 | 0.68%(-0.222)#2,909 |
| 86. | Chicago | 0.45% | 0.29%(+0.157)#86 | 0.68%(-0.227)#2,931 |
| 87. | Lake Barrington | 0.45% | 0.29%(+0.152)#87 | 0.68%(-0.232)#2,949 |
| 88. | Wheaton | 0.44% | 0.29%(+0.145)#88 | 0.68%(-0.239)#2,972 |
| 89. | Normal | 0.44% | 0.29%(+0.144)#89 | 0.68%(-0.240)#2,979 |
| 90. | Hampton | 0.44% | 0.29%(+0.142)#90 | 0.68%(-0.242)#2,987 |
| 91. | Taylorville | 0.42% | 0.29%(+0.129)#91 | 0.68%(-0.254)#3,043 |
| 92. | Bloomington | 0.42% | 0.29%(+0.122)#92 | 0.68%(-0.262)#3,075 |
| 93. | Streamwood | 0.41% | 0.29%(+0.115)#93 | 0.68%(-0.269)#3,108 |
| 94. | Aurora | 0.41% | 0.29%(+0.113)#94 | 0.68%(-0.271)#3,115 |
| 95. | Flora | 0.40% | 0.29%(+0.110)#95 | 0.68%(-0.274)#3,132 |
| 96. | Park City | 0.40% | 0.29%(+0.108)#96 | 0.68%(-0.276)#3,140 |
| 97. | Galena | 0.40% | 0.29%(+0.106)#97 | 0.68%(-0.277)#3,147 |
| 98. | Woodridge | 0.40% | 0.29%(+0.105)#98 | 0.68%(-0.279)#3,159 |
| 99. | West Salem | 0.39% | 0.29%(+0.095)#99 | 0.68%(-0.288)#3,207 |
| 100. | Buda | 0.38% | 0.29%(+0.083)#100 | 0.68%(-0.300)#3,264 |
Common Questions
What are the Top 10 Cities with the Highest Percentage of Sri Lankan Population in Illinois?
Top 10 Cities with the Highest Percentage of Sri Lankan Population in Illinois are:
#1
5.23%
#2
4.60%
#3
4.10%
#4
3.42%
#5
3.05%
#6
2.68%
#7
2.67%
#8
2.39%
#9
2.32%
#10
2.01%
What city has the Highest Percentage of Sri Lankan Population in Illinois?
The Galena Territory has the Highest Percentage of Sri Lankan Population in Illinois with 5.23%.
What is the Percentage of Sri Lankan Population in the State of Illinois?
Percentage of Sri Lankan Population in Illinois is 0.29%.
What is the Percentage of Sri Lankan Population in the United States?
Percentage of Sri Lankan Population in the United States is 0.68%.