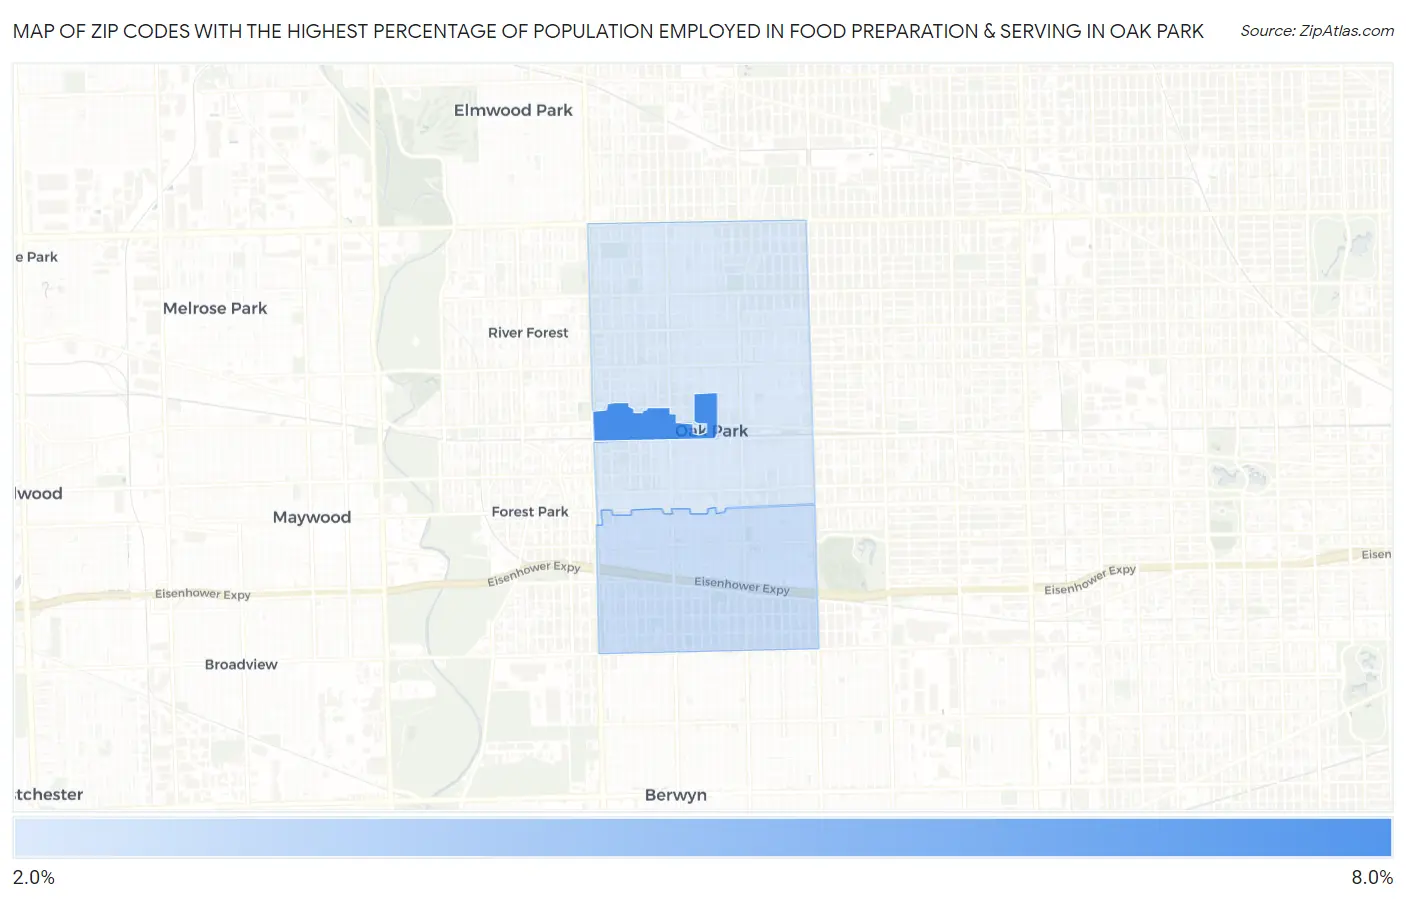
Zip Codes with the Highest Percentage of Population Employed in Food Preparation & Serving in Oak Park, IL
RELATED REPORTS & OPTIONS
Food Preparation & Serving
Oak Park
Compare Zip Codes
Map of Zip Codes with the Highest Percentage of Population Employed in Food Preparation & Serving in Oak Park
2.2%
6.5%
Zip Codes with the Highest Percentage of Population Employed in Food Preparation & Serving in Oak Park, IL
| Zip Code | % Employed | vs State | vs National | |
| 1. | 60301 | 6.5% | 5.0%(+1.47)#329 | 5.3%(+1.22)#7,854 |
| 2. | 60304 | 2.7% | 5.0%(-2.34)#988 | 5.3%(-2.59)#22,439 |
| 3. | 60302 | 2.2% | 5.0%(-2.83)#1,066 | 5.3%(-3.08)#24,062 |
1
Common Questions
What are the Top Zip Codes with the Highest Percentage of Population Employed in Food Preparation & Serving in Oak Park, IL?
Top Zip Codes with the Highest Percentage of Population Employed in Food Preparation & Serving in Oak Park, IL are:
What zip code has the Highest Percentage of Population Employed in Food Preparation & Serving in Oak Park, IL?
60301 has the Highest Percentage of Population Employed in Food Preparation & Serving in Oak Park, IL with 6.5%.
What is the Percentage of Population Employed in Food Preparation & Serving in Oak Park, IL?
Percentage of Population Employed in Food Preparation & Serving in Oak Park is 2.7%.
What is the Percentage of Population Employed in Food Preparation & Serving in Illinois?
Percentage of Population Employed in Food Preparation & Serving in Illinois is 5.0%.
What is the Percentage of Population Employed in Food Preparation & Serving in the United States?
Percentage of Population Employed in Food Preparation & Serving in the United States is 5.3%.