Zip Codes with the Highest Percentage of Population Employed in Food Preparation & Serving in Quincy, IL
RELATED REPORTS & OPTIONS
Food Preparation & Serving
Quincy
Compare Zip Codes
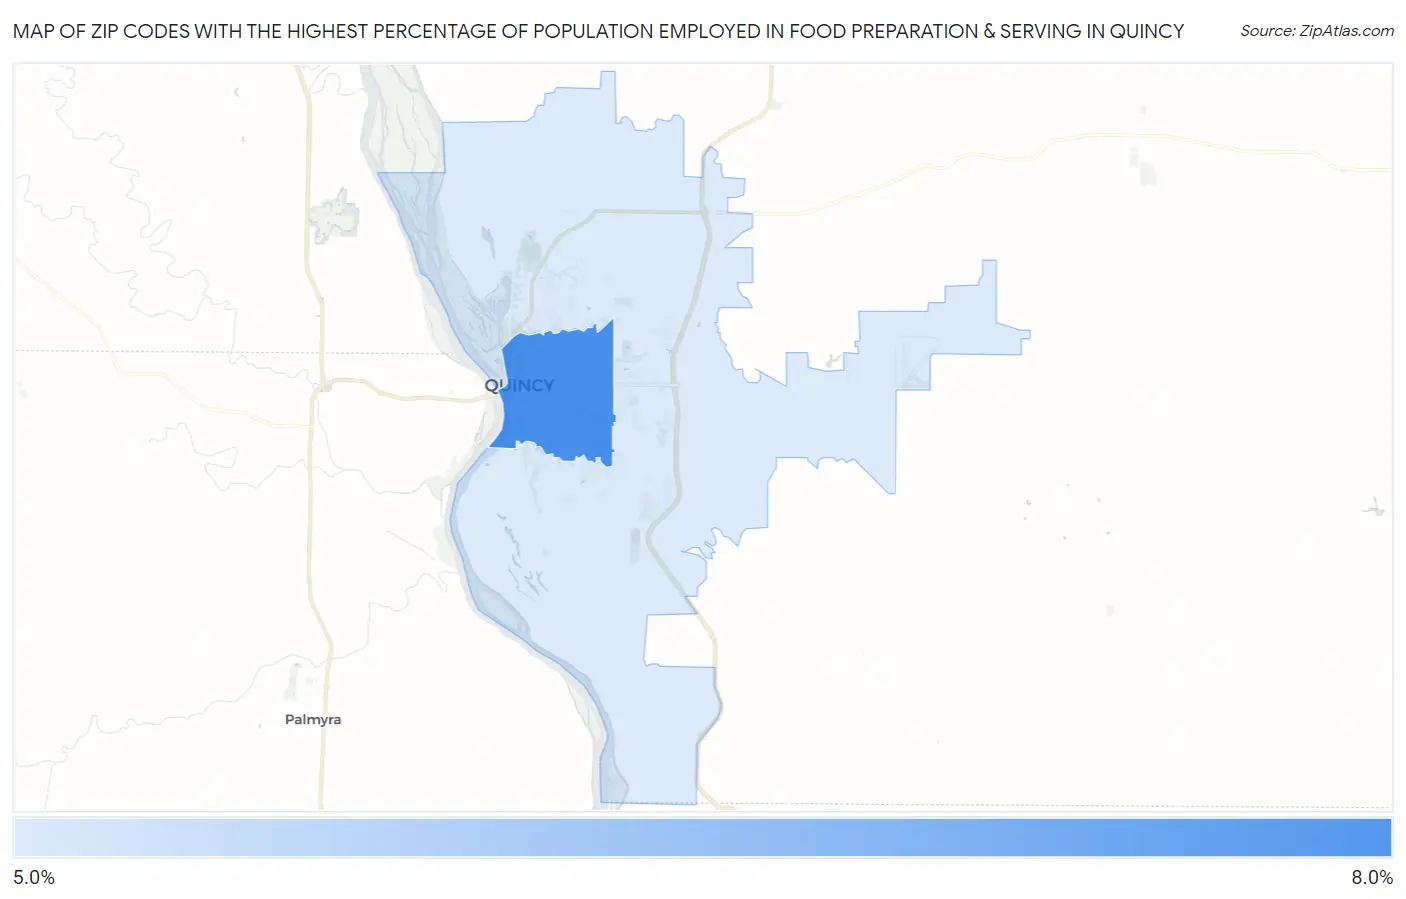
Map of Zip Codes with the Highest Percentage of Population Employed in Food Preparation & Serving in Quincy
5.3%
6.0%
Zip Codes with the Highest Percentage of Population Employed in Food Preparation & Serving in Quincy, IL
| Zip Code | % Employed | vs State | vs National | |
| 1. | 62301 | 6.0% | 5.0%(+1.00)#384 | 5.3%(+0.751)#9,219 |
| 2. | 62305 | 5.3% | 5.0%(+0.245)#504 | 5.3%(-0.006)#11,840 |
1
Common Questions
What are the Top Zip Codes with the Highest Percentage of Population Employed in Food Preparation & Serving in Quincy, IL?
Top Zip Codes with the Highest Percentage of Population Employed in Food Preparation & Serving in Quincy, IL are:
What zip code has the Highest Percentage of Population Employed in Food Preparation & Serving in Quincy, IL?
62301 has the Highest Percentage of Population Employed in Food Preparation & Serving in Quincy, IL with 6.0%.
What is the Percentage of Population Employed in Food Preparation & Serving in Quincy, IL?
Percentage of Population Employed in Food Preparation & Serving in Quincy is 6.1%.
What is the Percentage of Population Employed in Food Preparation & Serving in Illinois?
Percentage of Population Employed in Food Preparation & Serving in Illinois is 5.0%.
What is the Percentage of Population Employed in Food Preparation & Serving in the United States?
Percentage of Population Employed in Food Preparation & Serving in the United States is 5.3%.