Zip Codes with the Highest Percentage of Population Employed in Food Preparation & Serving in Melrose Park, IL
RELATED REPORTS & OPTIONS
Food Preparation & Serving
Melrose Park
Compare Zip Codes
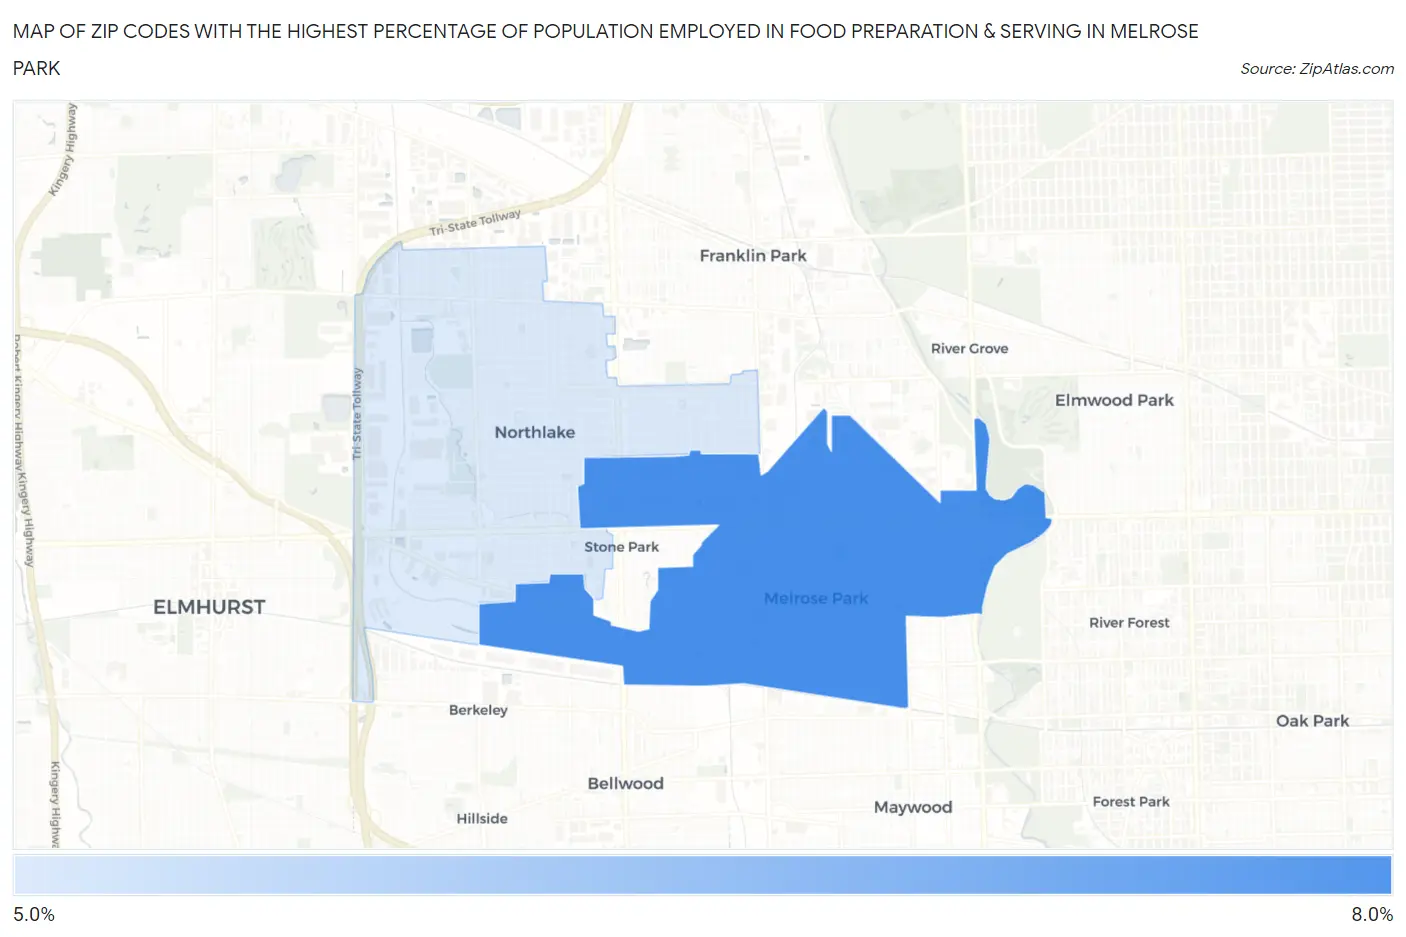
Map of Zip Codes with the Highest Percentage of Population Employed in Food Preparation & Serving in Melrose Park
5.0%
6.3%
Zip Codes with the Highest Percentage of Population Employed in Food Preparation & Serving in Melrose Park, IL
| Zip Code | % Employed | vs State | vs National | |
| 1. | 60160 | 6.3% | 5.0%(+1.29)#349 | 5.3%(+1.04)#8,364 |
| 2. | 60164 | 5.0% | 5.0%(-0.023)#555 | 5.3%(-0.274)#12,902 |
1
Common Questions
What are the Top Zip Codes with the Highest Percentage of Population Employed in Food Preparation & Serving in Melrose Park, IL?
Top Zip Codes with the Highest Percentage of Population Employed in Food Preparation & Serving in Melrose Park, IL are:
What zip code has the Highest Percentage of Population Employed in Food Preparation & Serving in Melrose Park, IL?
60160 has the Highest Percentage of Population Employed in Food Preparation & Serving in Melrose Park, IL with 6.3%.
What is the Percentage of Population Employed in Food Preparation & Serving in Melrose Park, IL?
Percentage of Population Employed in Food Preparation & Serving in Melrose Park is 6.3%.
What is the Percentage of Population Employed in Food Preparation & Serving in Illinois?
Percentage of Population Employed in Food Preparation & Serving in Illinois is 5.0%.
What is the Percentage of Population Employed in Food Preparation & Serving in the United States?
Percentage of Population Employed in Food Preparation & Serving in the United States is 5.3%.