Cities with the Highest Percentage of Population Enrolled in University in Illinois
RELATED REPORTS & OPTIONS
University
Illinois
Compare Cities
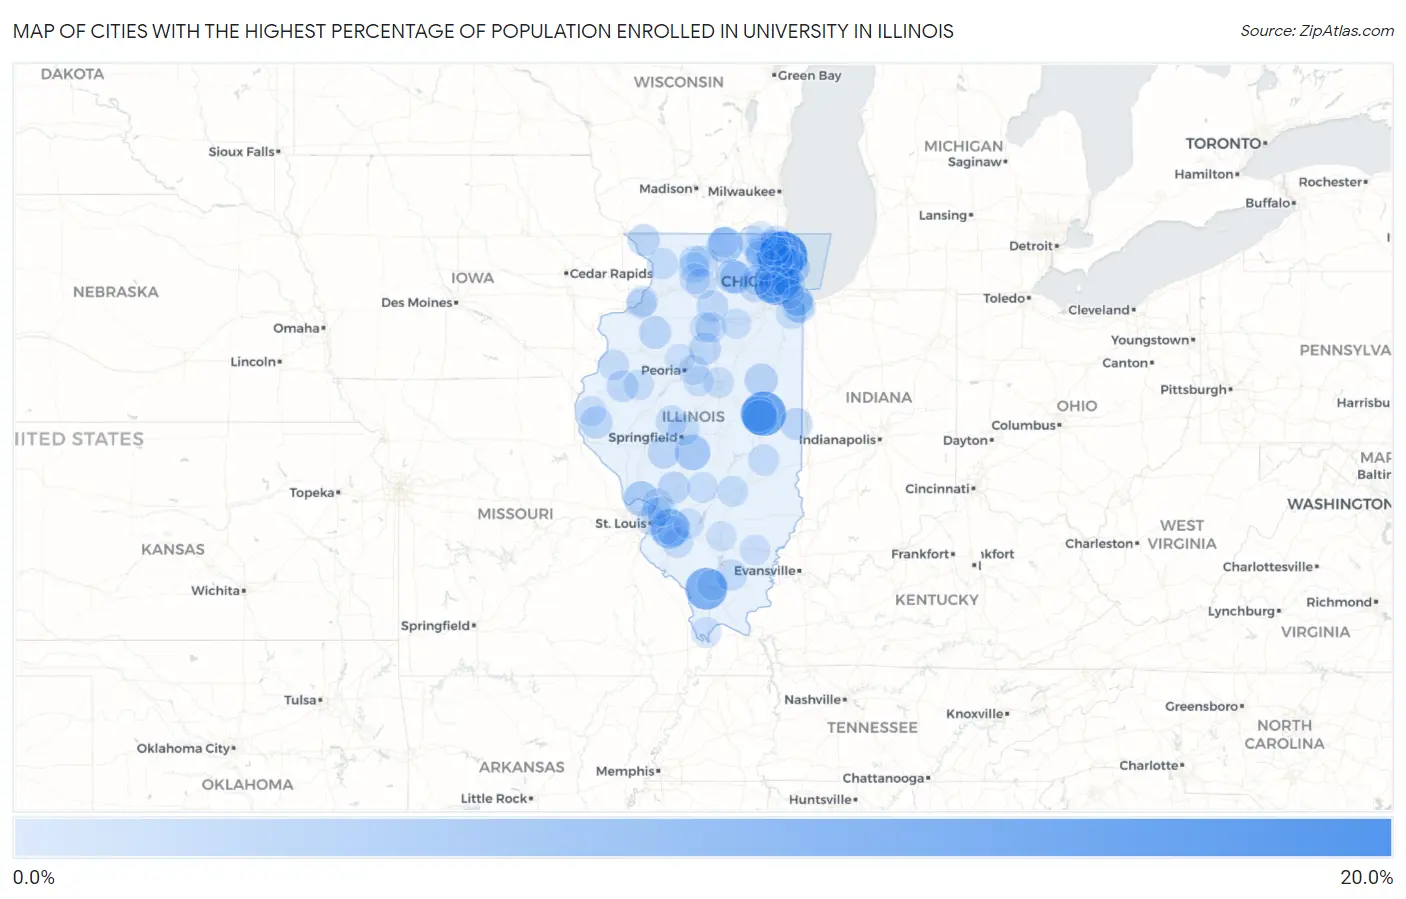
Map of Cities with the Highest Percentage of Population Enrolled in University in Illinois
0.0%
20.0%
Cities with the Highest Percentage of Population Enrolled in University in Illinois
| City | % in University | vs State | vs National | |
| 1. | Bannockburn | 17.5% | 1.6%(+15.9)#1 | 1.4%(+16.1)#53 |
| 2. | Trivoli | 14.6% | 1.6%(+12.9)#2 | 1.4%(+13.2)#71 |
| 3. | Oakbrook Terrace | 13.7% | 1.6%(+12.1)#3 | 1.4%(+12.3)#77 |
| 4. | Urbana | 13.4% | 1.6%(+11.8)#4 | 1.4%(+12.0)#83 |
| 5. | Carbondale | 11.2% | 1.6%(+9.55)#5 | 1.4%(+9.77)#125 |
| 6. | Scott Afb | 9.3% | 1.6%(+7.72)#6 | 1.4%(+7.94)#175 |
| 7. | Lawrence | 8.0% | 1.6%(+6.33)#7 | 1.4%(+6.55)#235 |
| 8. | Champaign | 6.9% | 1.6%(+5.23)#8 | 1.4%(+5.45)#314 |
| 9. | Timberlane | 6.8% | 1.6%(+5.15)#9 | 1.4%(+5.37)#316 |
| 10. | Tovey | 6.3% | 1.6%(+4.65)#10 | 1.4%(+4.87)#357 |
| 11. | Savoy | 6.0% | 1.6%(+4.38)#11 | 1.4%(+4.60)#387 |
| 12. | Elsah | 5.9% | 1.6%(+4.25)#12 | 1.4%(+4.47)#403 |
| 13. | Evanston | 5.4% | 1.6%(+3.78)#13 | 1.4%(+4.00)#471 |
| 14. | Dekalb | 5.0% | 1.6%(+3.39)#14 | 1.4%(+3.61)#535 |
| 15. | Argyle | 4.9% | 1.6%(+3.23)#15 | 1.4%(+3.45)#565 |
| 16. | Plum Valley | 4.6% | 1.6%(+2.97)#16 | 1.4%(+3.20)#649 |
| 17. | Melvin | 4.5% | 1.6%(+2.83)#17 | 1.4%(+3.05)#693 |
| 18. | North Chicago | 4.1% | 1.6%(+2.45)#18 | 1.4%(+2.67)#808 |
| 19. | Cortland | 4.1% | 1.6%(+2.45)#19 | 1.4%(+2.67)#809 |
| 20. | Bishop Hill | 4.0% | 1.6%(+2.34)#20 | 1.4%(+2.57)#842 |
| 21. | Columbus | 3.9% | 1.6%(+2.29)#21 | 1.4%(+2.51)#862 |
| 22. | La Rose | 3.7% | 1.6%(+2.11)#22 | 1.4%(+2.33)#947 |
| 23. | The Galena Territory | 3.7% | 1.6%(+2.06)#23 | 1.4%(+2.28)#976 |
| 24. | Waverly | 3.7% | 1.6%(+2.05)#24 | 1.4%(+2.27)#980 |
| 25. | Eagarville | 3.6% | 1.6%(+2.00)#25 | 1.4%(+2.22)#1,018 |
| 26. | Georgetown | 3.6% | 1.6%(+1.93)#26 | 1.4%(+2.15)#1,073 |
| 27. | Northfield | 3.5% | 1.6%(+1.88)#27 | 1.4%(+2.10)#1,101 |
| 28. | Mendota | 3.3% | 1.6%(+1.69)#28 | 1.4%(+1.92)#1,212 |
| 29. | North Aurora | 3.3% | 1.6%(+1.67)#29 | 1.4%(+1.89)#1,230 |
| 30. | Macomb | 3.3% | 1.6%(+1.66)#30 | 1.4%(+1.88)#1,243 |
| 31. | Glenwood | 3.2% | 1.6%(+1.59)#31 | 1.4%(+1.81)#1,298 |
| 32. | Forest Park | 3.2% | 1.6%(+1.58)#32 | 1.4%(+1.80)#1,301 |
| 33. | Forest Lake | 3.2% | 1.6%(+1.57)#33 | 1.4%(+1.79)#1,311 |
| 34. | Byron | 3.2% | 1.6%(+1.53)#34 | 1.4%(+1.76)#1,343 |
| 35. | Prairie Grove | 3.2% | 1.6%(+1.53)#35 | 1.4%(+1.75)#1,346 |
| 36. | Thompsonville | 3.1% | 1.6%(+1.50)#36 | 1.4%(+1.72)#1,372 |
| 37. | Leaf River | 3.1% | 1.6%(+1.49)#37 | 1.4%(+1.71)#1,379 |
| 38. | Sherman | 3.1% | 1.6%(+1.48)#38 | 1.4%(+1.71)#1,381 |
| 39. | Mettawa | 3.1% | 1.6%(+1.43)#39 | 1.4%(+1.65)#1,425 |
| 40. | Mount Carroll | 3.0% | 1.6%(+1.38)#40 | 1.4%(+1.60)#1,477 |
| 41. | Petersburg | 3.0% | 1.6%(+1.37)#41 | 1.4%(+1.59)#1,481 |
| 42. | Charleston | 3.0% | 1.6%(+1.37)#42 | 1.4%(+1.59)#1,484 |
| 43. | North Riverside | 3.0% | 1.6%(+1.32)#43 | 1.4%(+1.54)#1,530 |
| 44. | Lynwood | 2.9% | 1.6%(+1.30)#44 | 1.4%(+1.53)#1,545 |
| 45. | Dolton | 2.9% | 1.6%(+1.30)#45 | 1.4%(+1.52)#1,554 |
| 46. | Edgington | 2.9% | 1.6%(+1.26)#46 | 1.4%(+1.48)#1,589 |
| 47. | Lincolnshire | 2.9% | 1.6%(+1.26)#47 | 1.4%(+1.48)#1,591 |
| 48. | Oak Park | 2.9% | 1.6%(+1.26)#48 | 1.4%(+1.48)#1,594 |
| 49. | Mount Morris | 2.9% | 1.6%(+1.25)#49 | 1.4%(+1.48)#1,603 |
| 50. | Altamont | 2.9% | 1.6%(+1.23)#50 | 1.4%(+1.46)#1,618 |
| 51. | Lisle | 2.8% | 1.6%(+1.22)#51 | 1.4%(+1.44)#1,631 |
| 52. | Northbrook | 2.8% | 1.6%(+1.22)#52 | 1.4%(+1.44)#1,632 |
| 53. | Berkeley | 2.8% | 1.6%(+1.19)#53 | 1.4%(+1.41)#1,656 |
| 54. | Port Byron | 2.8% | 1.6%(+1.13)#54 | 1.4%(+1.35)#1,747 |
| 55. | St Libory | 2.8% | 1.6%(+1.13)#55 | 1.4%(+1.35)#1,750 |
| 56. | Carterville | 2.8% | 1.6%(+1.12)#56 | 1.4%(+1.34)#1,755 |
| 57. | Rosewood Heights | 2.8% | 1.6%(+1.12)#57 | 1.4%(+1.34)#1,762 |
| 58. | Greenwood | 2.8% | 1.6%(+1.12)#58 | 1.4%(+1.34)#1,763 |
| 59. | Hainesville | 2.7% | 1.6%(+1.11)#59 | 1.4%(+1.33)#1,782 |
| 60. | University Park | 2.7% | 1.6%(+1.10)#60 | 1.4%(+1.32)#1,789 |
| 61. | Media | 2.7% | 1.6%(+1.10)#61 | 1.4%(+1.32)#1,797 |
| 62. | Oakwood Hills | 2.7% | 1.6%(+1.08)#62 | 1.4%(+1.30)#1,813 |
| 63. | Franklin Grove | 2.7% | 1.6%(+1.05)#63 | 1.4%(+1.27)#1,858 |
| 64. | Grand Detour | 2.6% | 1.6%(+1.02)#64 | 1.4%(+1.24)#1,889 |
| 65. | South Holland | 2.6% | 1.6%(+0.986)#65 | 1.4%(+1.21)#1,952 |
| 66. | Grandwood Park | 2.6% | 1.6%(+0.979)#66 | 1.4%(+1.20)#1,960 |
| 67. | Fillmore | 2.6% | 1.6%(+0.963)#67 | 1.4%(+1.18)#1,982 |
| 68. | Cedar Point | 2.6% | 1.6%(+0.935)#68 | 1.4%(+1.16)#2,023 |
| 69. | Marietta | 2.6% | 1.6%(+0.935)#69 | 1.4%(+1.16)#2,025 |
| 70. | Normal | 2.6% | 1.6%(+0.934)#70 | 1.4%(+1.16)#2,028 |
| 71. | Chicago | 2.6% | 1.6%(+0.921)#71 | 1.4%(+1.14)#2,050 |
| 72. | Granville | 2.5% | 1.6%(+0.879)#72 | 1.4%(+1.10)#2,119 |
| 73. | Mounds | 2.5% | 1.6%(+0.874)#73 | 1.4%(+1.10)#2,128 |
| 74. | Lake Forest | 2.5% | 1.6%(+0.865)#74 | 1.4%(+1.09)#2,139 |
| 75. | Mill Shoals | 2.5% | 1.6%(+0.855)#75 | 1.4%(+1.08)#2,155 |
| 76. | Lombard | 2.5% | 1.6%(+0.852)#76 | 1.4%(+1.07)#2,159 |
| 77. | Shiloh | 2.5% | 1.6%(+0.831)#77 | 1.4%(+1.05)#2,192 |
| 78. | Glencoe | 2.4% | 1.6%(+0.817)#78 | 1.4%(+1.04)#2,213 |
| 79. | Mascoutah | 2.4% | 1.6%(+0.772)#79 | 1.4%(+0.994)#2,299 |
| 80. | Venice | 2.4% | 1.6%(+0.764)#80 | 1.4%(+0.986)#2,310 |
| 81. | Heritage Lake | 2.4% | 1.6%(+0.758)#81 | 1.4%(+0.979)#2,320 |
| 82. | Buffalo Grove | 2.4% | 1.6%(+0.753)#82 | 1.4%(+0.974)#2,332 |
| 83. | Downers Grove | 2.4% | 1.6%(+0.737)#83 | 1.4%(+0.958)#2,355 |
| 84. | Marseilles | 2.4% | 1.6%(+0.729)#84 | 1.4%(+0.951)#2,365 |
| 85. | South Barrington | 2.3% | 1.6%(+0.719)#85 | 1.4%(+0.941)#2,388 |
| 86. | Loraine | 2.3% | 1.6%(+0.716)#86 | 1.4%(+0.938)#2,395 |
| 87. | Breese | 2.3% | 1.6%(+0.698)#87 | 1.4%(+0.920)#2,434 |
| 88. | Trout Valley | 2.3% | 1.6%(+0.684)#88 | 1.4%(+0.905)#2,461 |
| 89. | Geneva | 2.3% | 1.6%(+0.673)#89 | 1.4%(+0.894)#2,476 |
| 90. | Rapids City | 2.3% | 1.6%(+0.650)#90 | 1.4%(+0.872)#2,528 |
| 91. | Washington | 2.3% | 1.6%(+0.633)#91 | 1.4%(+0.854)#2,563 |
| 92. | Edwardsville | 2.3% | 1.6%(+0.627)#92 | 1.4%(+0.849)#2,575 |
| 93. | Grayslake | 2.2% | 1.6%(+0.618)#93 | 1.4%(+0.839)#2,602 |
| 94. | Dunlap | 2.2% | 1.6%(+0.615)#94 | 1.4%(+0.837)#2,609 |
| 95. | Dix | 2.2% | 1.6%(+0.597)#95 | 1.4%(+0.818)#2,644 |
| 96. | Caledonia | 2.2% | 1.6%(+0.593)#96 | 1.4%(+0.814)#2,652 |
| 97. | Spring Grove | 2.2% | 1.6%(+0.540)#97 | 1.4%(+0.761)#2,776 |
| 98. | Mitchell | 2.2% | 1.6%(+0.528)#98 | 1.4%(+0.750)#2,789 |
| 99. | Oak Lawn | 2.1% | 1.6%(+0.510)#99 | 1.4%(+0.731)#2,823 |
| 100. | Mundelein | 2.1% | 1.6%(+0.501)#100 | 1.4%(+0.722)#2,839 |
Common Questions
What are the Top 10 Cities with the Highest Percentage of Population Enrolled in University in Illinois?
Top 10 Cities with the Highest Percentage of Population Enrolled in University in Illinois are:
#1
17.5%
#2
13.7%
#3
13.4%
#4
11.2%
#5
9.3%
#6
6.9%
#7
6.8%
#8
6.3%
#9
6.0%
#10
5.9%
What city has the Highest Percentage of Population Enrolled in University in Illinois?
Bannockburn has the Highest Percentage of Population Enrolled in University in Illinois with 17.5%.
What is the Percentage of Population Enrolled in University in the State of Illinois?
Percentage of Population Enrolled in University in Illinois is 1.6%.
What is the Percentage of Population Enrolled in University in the United States?
Percentage of Population Enrolled in University in the United States is 1.4%.