Cities with the Highest Percentage of Immigrants from Syria in Illinois
RELATED REPORTS & OPTIONS
Syria
Illinois
Compare Cities
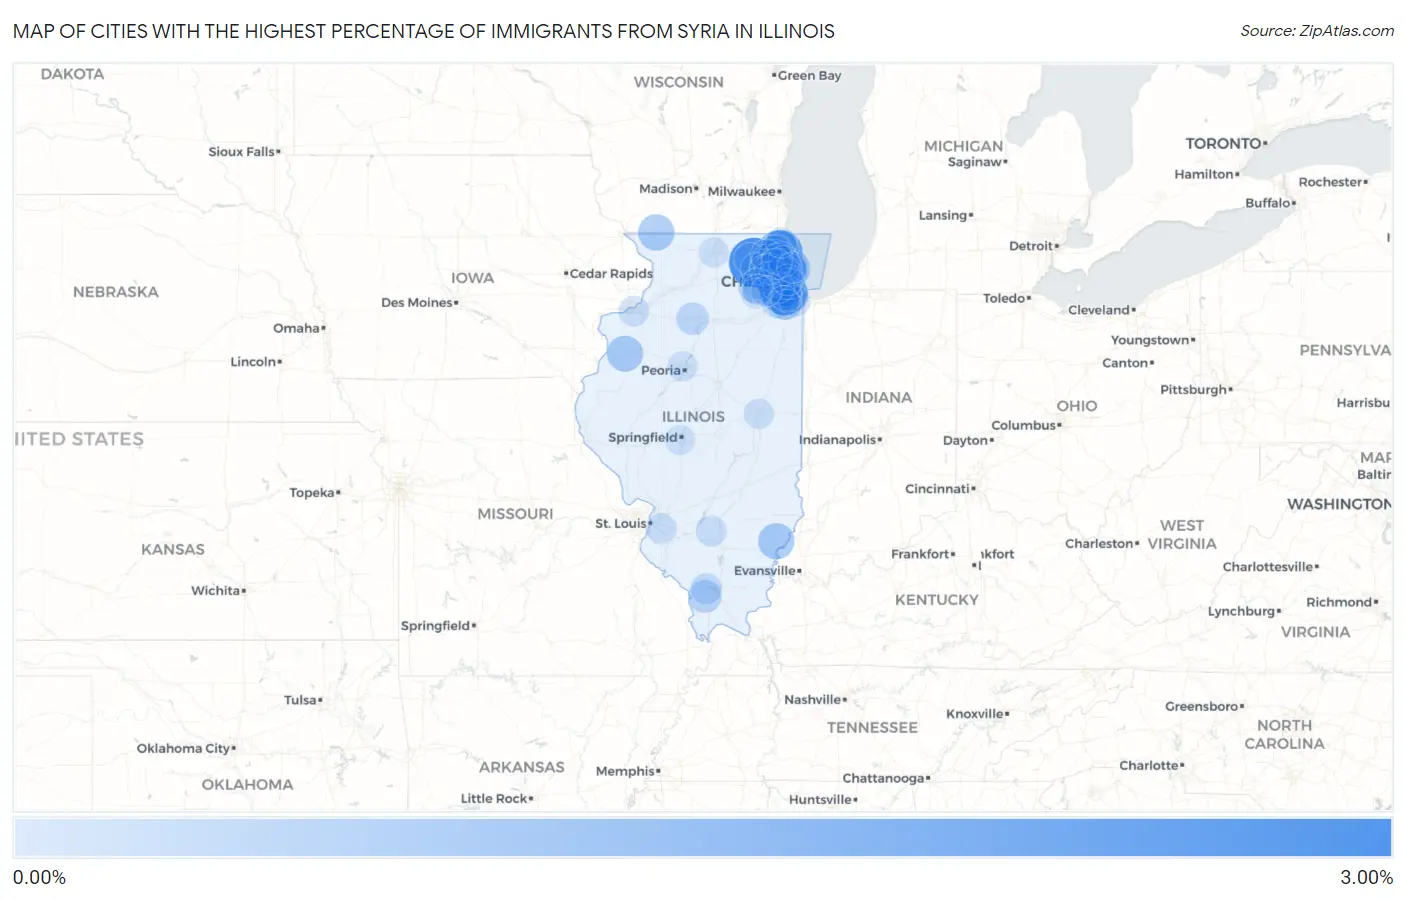
Map of Cities with the Highest Percentage of Immigrants from Syria in Illinois
0.00%
3.00%
Cities with the Highest Percentage of Immigrants from Syria in Illinois
| City | Syria | vs State | vs National | |
| 1. | Gilberts | 2.80% | 0.053%(+2.75)#-1 | 0.033%(+2.77)#0 |
| 2. | Mettawa | 2.16% | 0.053%(+2.11)#0 | 0.033%(+2.13)#1 |
| 3. | Hickory Hills | 2.15% | 0.053%(+2.09)#20 | 0.033%(+2.11)#212 |
| 4. | Burr Ridge | 1.76% | 0.053%(+1.71)#21 | 0.033%(+1.73)#213 |
| 5. | Oak Brook | 1.39% | 0.053%(+1.34)#22 | 0.033%(+1.36)#214 |
| 6. | Skokie | 1.36% | 0.053%(+1.31)#23 | 0.033%(+1.33)#215 |
| 7. | Niles | 1.25% | 0.053%(+1.20)#24 | 0.033%(+1.22)#244 |
| 8. | Norridge | 1.09% | 0.053%(+1.03)#25 | 0.033%(+1.05)#245 |
| 9. | Roselle | 1.06% | 0.053%(+1.01)#26 | 0.033%(+1.03)#246 |
| 10. | Green Oaks | 0.90% | 0.053%(+0.850)#27 | 0.033%(+0.871)#247 |
| 11. | Apple River | 0.86% | 0.053%(+0.804)#28 | 0.033%(+0.824)#248 |
| 12. | Browns | 0.85% | 0.053%(+0.798)#29 | 0.033%(+0.818)#249 |
| 13. | Monmouth | 0.81% | 0.053%(+0.757)#30 | 0.033%(+0.777)#250 |
| 14. | Lincolnwood | 0.60% | 0.053%(+0.542)#31 | 0.033%(+0.563)#251 |
| 15. | Orland Hills | 0.53% | 0.053%(+0.473)#32 | 0.033%(+0.493)#252 |
| 16. | Westmont | 0.50% | 0.053%(+0.445)#33 | 0.033%(+0.466)#253 |
| 17. | North Aurora | 0.46% | 0.053%(+0.403)#34 | 0.033%(+0.424)#254 |
| 18. | Hoffman Estates | 0.40% | 0.053%(+0.351)#35 | 0.033%(+0.371)#255 |
| 19. | Makanda | 0.40% | 0.053%(+0.347)#36 | 0.033%(+0.367)#256 |
| 20. | Long Grove | 0.40% | 0.053%(+0.345)#37 | 0.033%(+0.366)#257 |
| 21. | Darien | 0.38% | 0.053%(+0.325)#38 | 0.033%(+0.345)#258 |
| 22. | Oak Lawn | 0.35% | 0.053%(+0.292)#39 | 0.033%(+0.312)#259 |
| 23. | Princeton | 0.32% | 0.053%(+0.269)#40 | 0.033%(+0.290)#260 |
| 24. | Merrionette Park | 0.30% | 0.053%(+0.245)#41 | 0.033%(+0.265)#261 |
| 25. | Des Plaines | 0.24% | 0.053%(+0.188)#42 | 0.033%(+0.209)#262 |
| 26. | Justice | 0.23% | 0.053%(+0.178)#43 | 0.033%(+0.199)#263 |
| 27. | Morton Grove | 0.23% | 0.053%(+0.176)#44 | 0.033%(+0.196)#264 |
| 28. | Glenview | 0.23% | 0.053%(+0.174)#45 | 0.033%(+0.195)#265 |
| 29. | Worth | 0.20% | 0.053%(+0.149)#46 | 0.033%(+0.170)#266 |
| 30. | Libertyville | 0.20% | 0.053%(+0.146)#47 | 0.033%(+0.167)#544 |
| 31. | Homer Glen | 0.18% | 0.053%(+0.130)#48 | 0.033%(+0.151)#545 |
| 32. | Carbondale | 0.18% | 0.053%(+0.124)#49 | 0.033%(+0.144)#546 |
| 33. | Palos Hills | 0.17% | 0.053%(+0.116)#50 | 0.033%(+0.137)#547 |
| 34. | Huntley | 0.16% | 0.053%(+0.110)#51 | 0.033%(+0.130)#548 |
| 35. | South Barrington | 0.16% | 0.053%(+0.107)#52 | 0.033%(+0.127)#549 |
| 36. | Mount Prospect | 0.15% | 0.053%(+0.098)#53 | 0.033%(+0.119)#550 |
| 37. | Bridgeview | 0.14% | 0.053%(+0.083)#54 | 0.033%(+0.103)#551 |
| 38. | Mundelein | 0.13% | 0.053%(+0.077)#55 | 0.033%(+0.097)#552 |
| 39. | Glen Ellyn | 0.11% | 0.053%(+0.060)#56 | 0.033%(+0.080)#553 |
| 40. | Elgin | 0.11% | 0.053%(+0.059)#57 | 0.033%(+0.079)#554 |
| 41. | Harwood Heights | 0.11% | 0.053%(+0.059)#58 | 0.033%(+0.079)#555 |
| 42. | Riverside | 0.11% | 0.053%(+0.055)#59 | 0.033%(+0.076)#556 |
| 43. | Rolling Meadows | 0.11% | 0.053%(+0.055)#60 | 0.033%(+0.075)#557 |
| 44. | Riverwoods | 0.100% | 0.053%(+0.047)#61 | 0.033%(+0.067)#558 |
| 45. | Barrington | 0.098% | 0.053%(+0.045)#62 | 0.033%(+0.065)#559 |
| 46. | Swansea | 0.094% | 0.053%(+0.041)#63 | 0.033%(+0.061)#560 |
| 47. | Lake Barrington | 0.093% | 0.053%(+0.040)#64 | 0.033%(+0.060)#561 |
| 48. | Palos Heights | 0.084% | 0.053%(+0.030)#65 | 0.033%(+0.051)#562 |
| 49. | Harvey | 0.080% | 0.053%(+0.027)#66 | 0.033%(+0.047)#563 |
| 50. | Centralia | 0.074% | 0.053%(+0.021)#67 | 0.033%(+0.042)#564 |
| 51. | Streamwood | 0.073% | 0.053%(+0.020)#68 | 0.033%(+0.041)#565 |
| 52. | Moline | 0.071% | 0.053%(+0.018)#69 | 0.033%(+0.038)#566 |
| 53. | Carol Stream | 0.066% | 0.053%(+0.012)#70 | 0.033%(+0.033)#567 |
| 54. | Batavia | 0.065% | 0.053%(+0.011)#71 | 0.033%(+0.032)#568 |
| 55. | Addison | 0.056% | 0.053%(+0.003)#72 | 0.033%(+0.023)#569 |
| 56. | Chicago | 0.047% | 0.053%(-0.006)#73 | 0.033%(+0.014)#633 |
| 57. | Hinsdale | 0.047% | 0.053%(-0.007)#74 | 0.033%(+0.014)#634 |
| 58. | Park Ridge | 0.046% | 0.053%(-0.007)#75 | 0.033%(+0.013)#635 |
| 59. | Schaumburg | 0.036% | 0.053%(-0.017)#76 | 0.033%(+0.003)#636 |
| 60. | Boulder Hill | 0.031% | 0.053%(-0.022)#77 | 0.033%(-0.001)#637 |
| 61. | Aurora | 0.028% | 0.053%(-0.026)#78 | 0.033%(-0.005)#638 |
| 62. | Champaign | 0.026% | 0.053%(-0.027)#79 | 0.033%(-0.007)#639 |
| 63. | Northbrook | 0.026% | 0.053%(-0.027)#80 | 0.033%(-0.007)#640 |
| 64. | Tinley Park | 0.022% | 0.053%(-0.032)#81 | 0.033%(-0.011)#641 |
| 65. | Rockford | 0.020% | 0.053%(-0.034)#82 | 0.033%(-0.013)#642 |
| 66. | Buffalo Grove | 0.019% | 0.053%(-0.035)#83 | 0.033%(-0.014)#643 |
| 67. | Oak Park | 0.019% | 0.053%(-0.035)#84 | 0.033%(-0.014)#644 |
| 68. | Orland Park | 0.017% | 0.053%(-0.036)#85 | 0.033%(-0.016)#645 |
| 69. | Arlington Heights | 0.017% | 0.053%(-0.036)#86 | 0.033%(-0.016)#646 |
| 70. | Naperville | 0.014% | 0.053%(-0.039)#87 | 0.033%(-0.019)#647 |
| 71. | Waukegan | 0.013% | 0.053%(-0.040)#88 | 0.033%(-0.019)#648 |
| 72. | Evanston | 0.013% | 0.053%(-0.040)#89 | 0.033%(-0.020)#649 |
| 73. | Peoria | 0.011% | 0.053%(-0.042)#90 | 0.033%(-0.021)#650 |
| 74. | Springfield | 0.0070% | 0.053%(-0.046)#91 | 0.033%(-0.026)#686 |
Common Questions
What are the Top 10 Cities with the Highest Percentage of Immigrants from Syria in Illinois?
Top 10 Cities with the Highest Percentage of Immigrants from Syria in Illinois are:
#1
2.80%
#2
2.16%
#3
2.15%
#4
1.76%
#5
1.39%
#6
1.36%
#7
1.25%
#8
1.09%
#9
1.06%
#10
0.90%
What city has the Highest Percentage of Immigrants from Syria in Illinois?
Gilberts has the Highest Percentage of Immigrants from Syria in Illinois with 2.80%.
What is the Percentage of Immigrants from Syria in the State of Illinois?
Percentage of Immigrants from Syria in Illinois is 0.053%.
What is the Percentage of Immigrants from Syria in the United States?
Percentage of Immigrants from Syria in the United States is 0.033%.